Embed Size (px)
Citation preview
Teratogenic radiation effects
Perinatal mortality and congenital malformations
following Chernobyl
Alfred Körblein Nuremberg, Germany
Teratogenic radiation effects: Adverse health effects to the fetus after exposure to ionizing radiation:
Congenital malformations, perinatal deaths
(i.e. stillbirths and early neonatal deaths), cognitive impairment
UNSCEAR on teratogenic effects:
• UNSCEAR 2008 (Chernobyl consequences):
A search in the document finds no hit for
“teratogenic” OR “perinatal” OR “malformation”
• UNSCEAR 2013 (Fukushima consequences)
(b) Other health effects, F14:
“Prenatal exposure was not expected to increase .. the incidence of spontaneous
abortion, miscarriages, perinatal mortality, congenital effects or cognitive
impairment.”
2
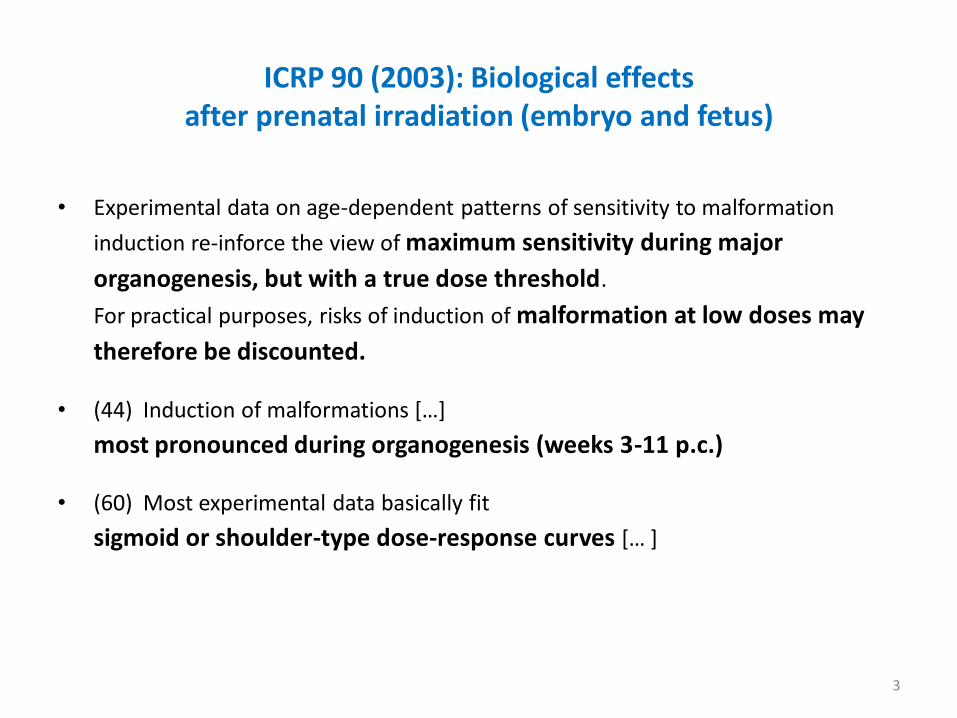
ICRP 90 (2003): Biological effects after prenatal irradiation (embryo and fetus)
• Experimental data on age-dependent patterns of sensitivity to malformation
induction re-inforce the view of maximum sensitivity during major
organogenesis, but with a true dose threshold.
For practical purposes, risks of induction of malformation at low doses may
therefore be discounted.
• (44) Induction of malformations […]
most pronounced during organogenesis (weeks 3-11 p.c.)
• (60) Most experimental data basically fit
sigmoid or shoulder-type dose-response curves [… ]
3
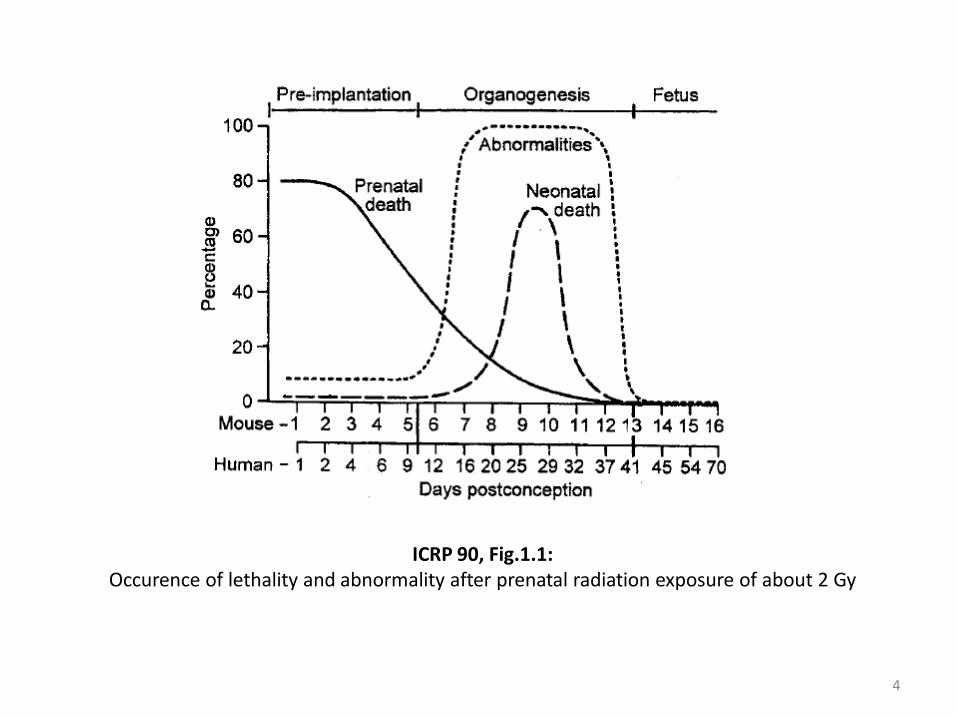
ICRP 90, Fig.1.1: Occurence of lethality and abnormality after prenatal radiation exposure of about 2 Gy
4
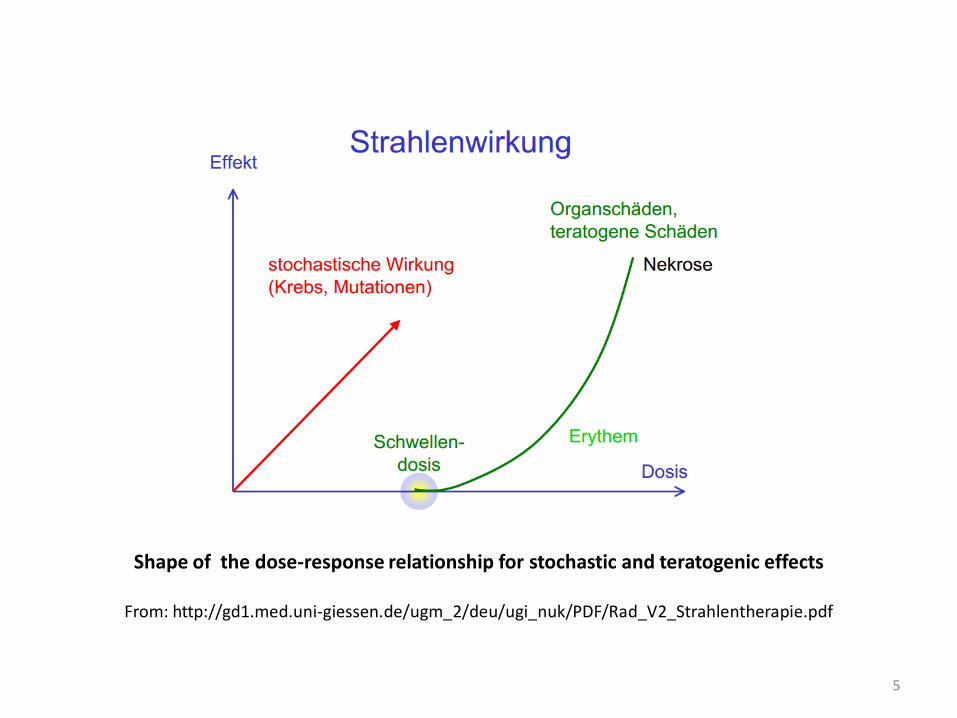
Shape of the dose-response relationship for stochastic and teratogenic effects
From: http://gd1.med.uni-giessen.de/ugm_2/deu/ugi_nuk/PDF/Rad_V2_Strahlentherapie.pdf
5
Results of epidemiologial studies
6
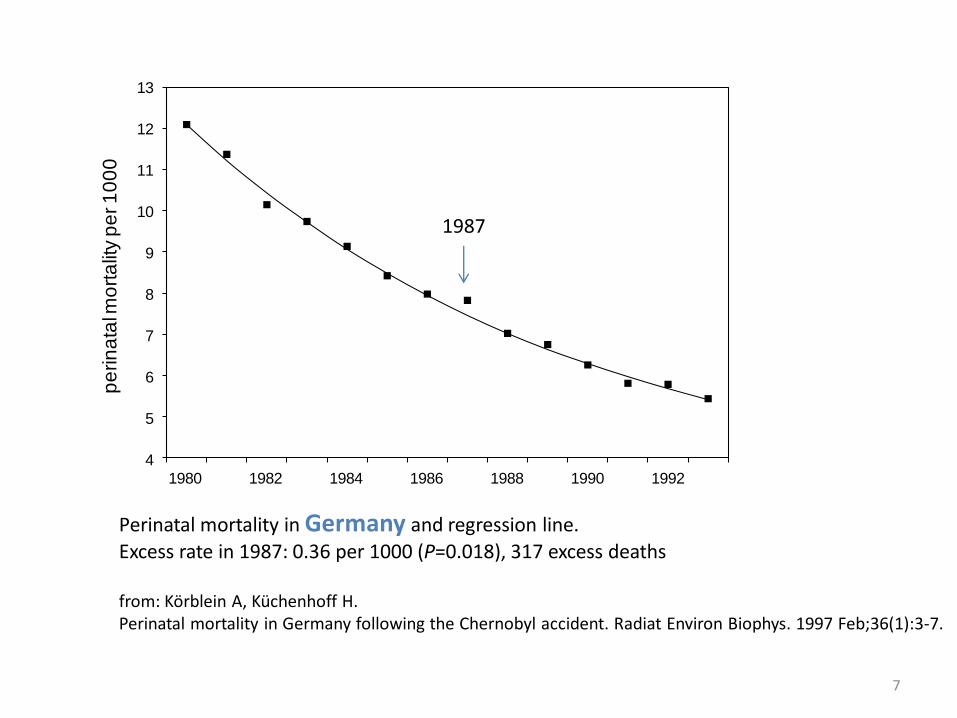
Perinatal mortality in Germany and regression line.
Excess rate in 1987: 0.36 per 1000 (P=0.018), 317 excess deaths from: Körblein A, Küchenhoff H. Perinatal mortality in Germany following the Chernobyl accident. Radiat Environ Biophys. 1997 Feb;36(1):3-7.
4
5
6
7
8
9
10
11
12
13
1980 1982 1984 1986 1988 1990 1992
pe
rin
ata
l mo
rta
lity p
er 1
00
0
7
1987
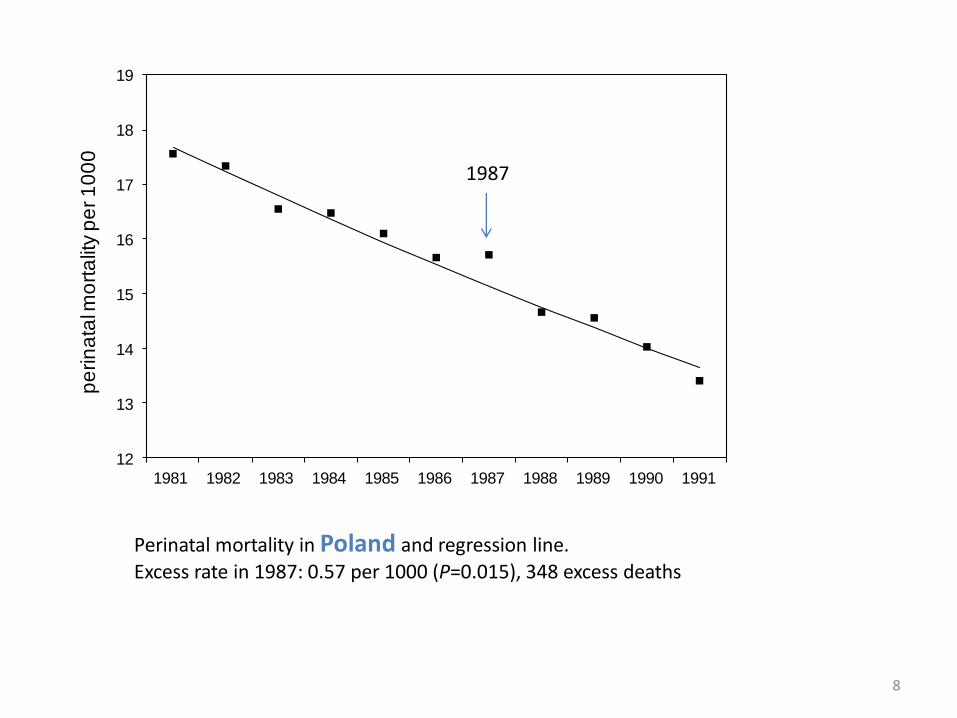
Perinatal mortality in Poland and regression line.
Excess rate in 1987: 0.57 per 1000 (P=0.015), 348 excess deaths
12
13
14
15
16
17
18
19
1981 1982 1983 1984 1985 1986 1987 1988 1989 1990 1991
pe
rin
ata
l mo
rta
lity p
er 1
00
0
8
1987
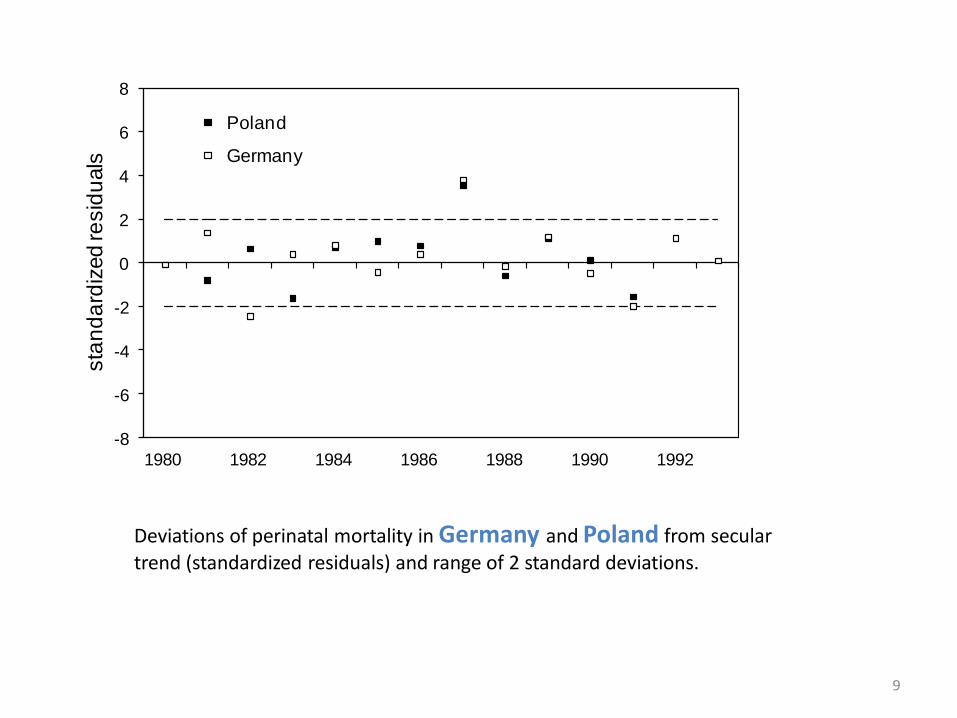
Deviations of perinatal mortality in Germany and Poland from secular
trend (standardized residuals) and range of 2 standard deviations.
-8
-6
-4
-2
0
2
4
6
8
1980 1982 1984 1986 1988 1990 1992
sta
nd
ard
ized
re
sid
uals
Poland
Germany
9
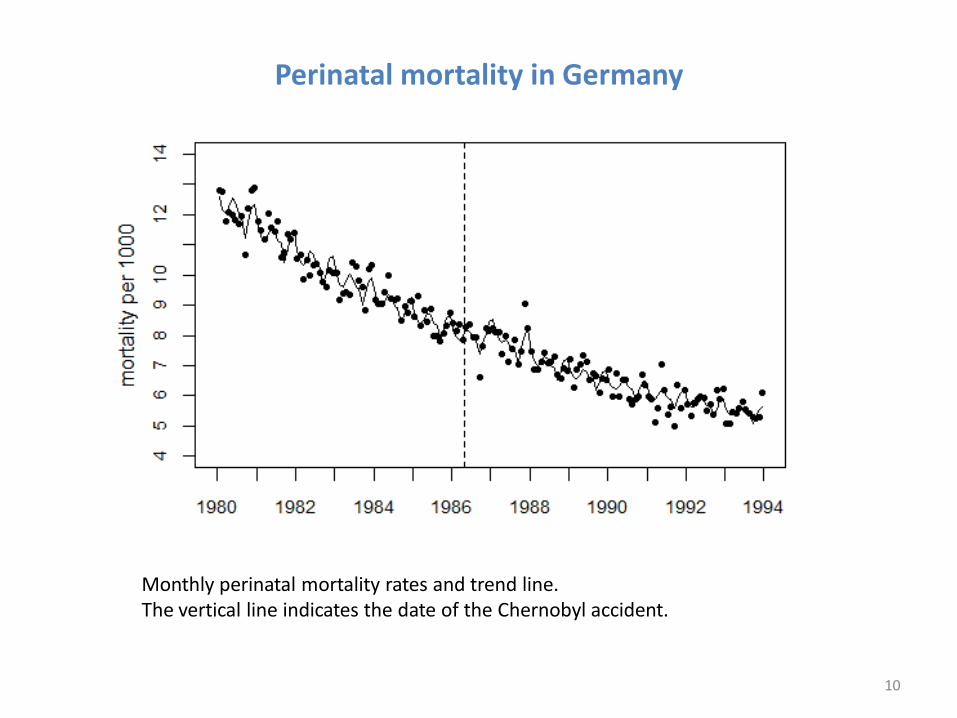
Monthly perinatal mortality rates and trend line. The vertical line indicates the date of the Chernobyl accident.
10
Perinatal mortality in Germany
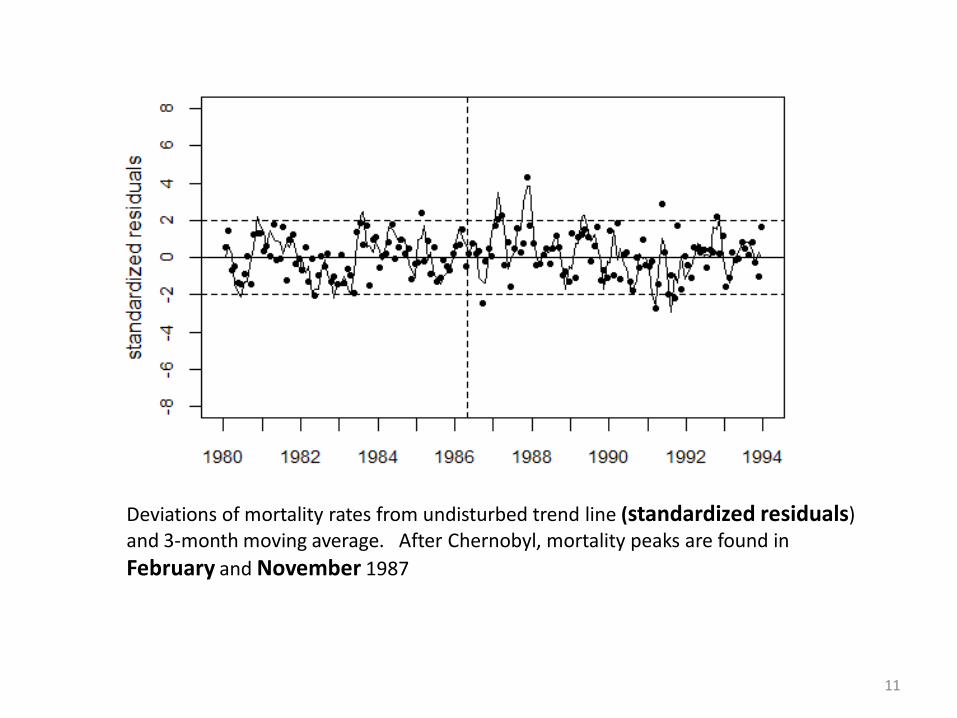
Deviations of mortality rates from undisturbed trend line (standardized residuals) and 3-month moving average. After Chernobyl, mortality peaks are found in
February and November 1987
11
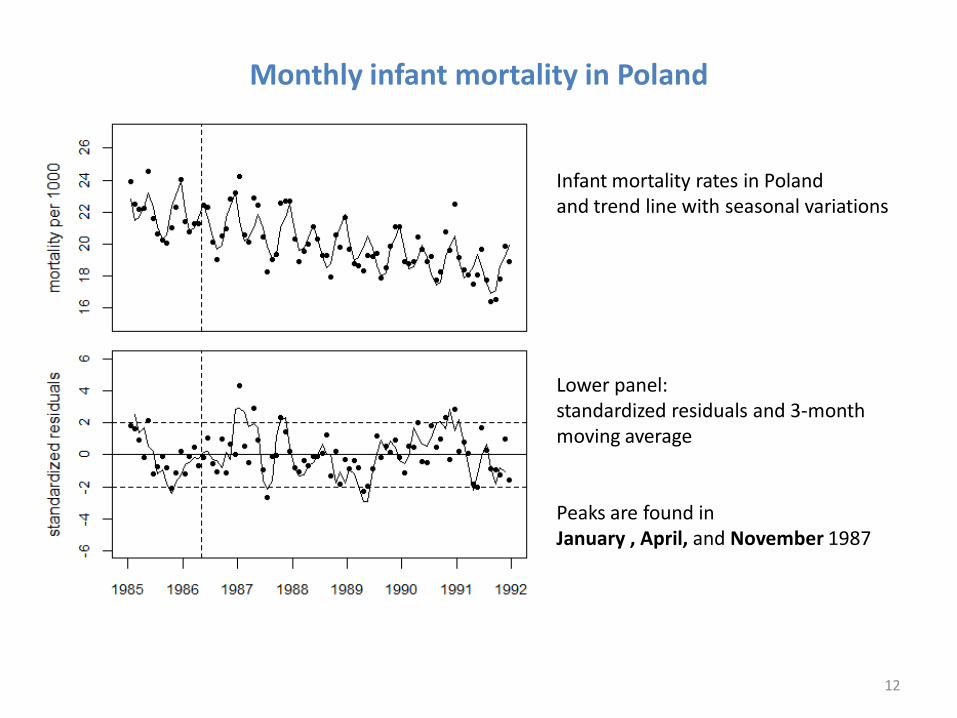
Infant mortality rates in Poland and trend line with seasonal variations Lower panel: standardized residuals and 3-month moving average Peaks are found in January , April, and November 1987
12
Monthly infant mortality in Poland
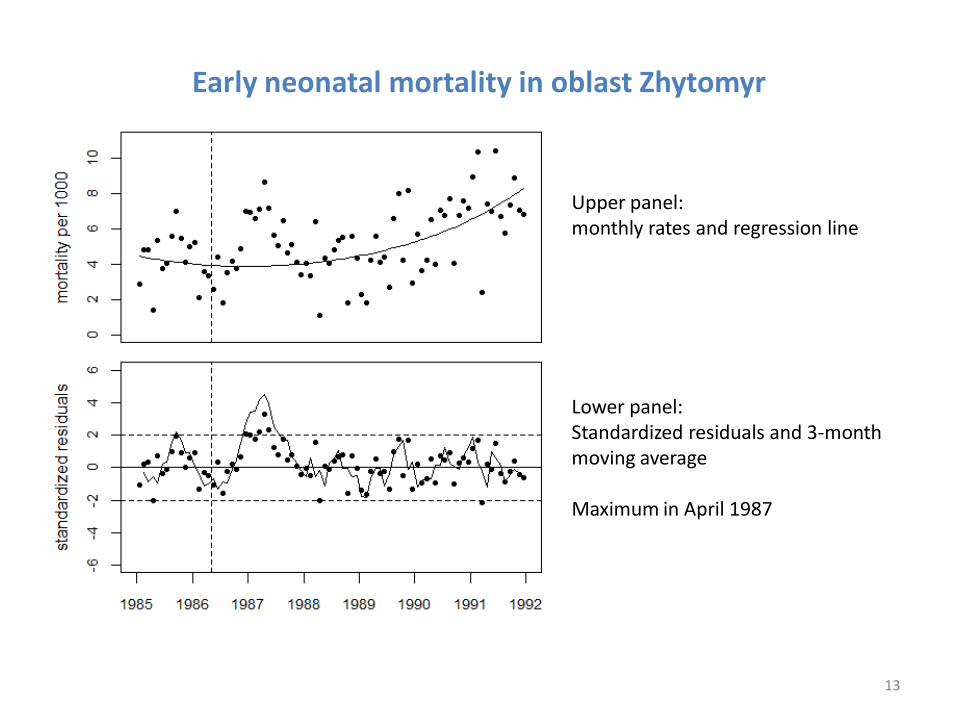
Upper panel: monthly rates and regression line Lower panel: Standardized residuals and 3-month moving average Maximum in April 1987
13
Early neonatal mortality in oblast Zhytomyr
Trend analysis of monthly data
• Logistic regression with linear-quadratic time trend
• Seasonal effect modeled by dummy coding for individual months (dummy variables for Feb through Dec, Jan=reference)
• Cesium burden of pregnant women calculated from cesium concentration in cow milk (measured), beef, cereals, and pork
• Linear- plus quadratic cesium dependency to allow for a curvilinear shape of cesium effect on perinatal mortality
14
15
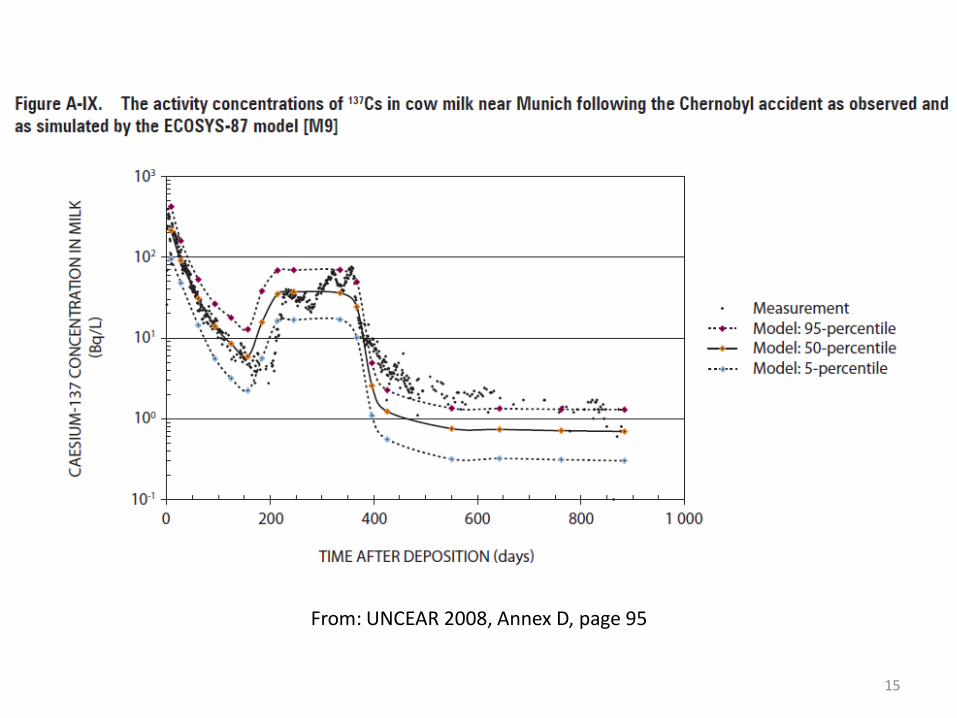
From: UNCEAR 2008, Annex D, page 95
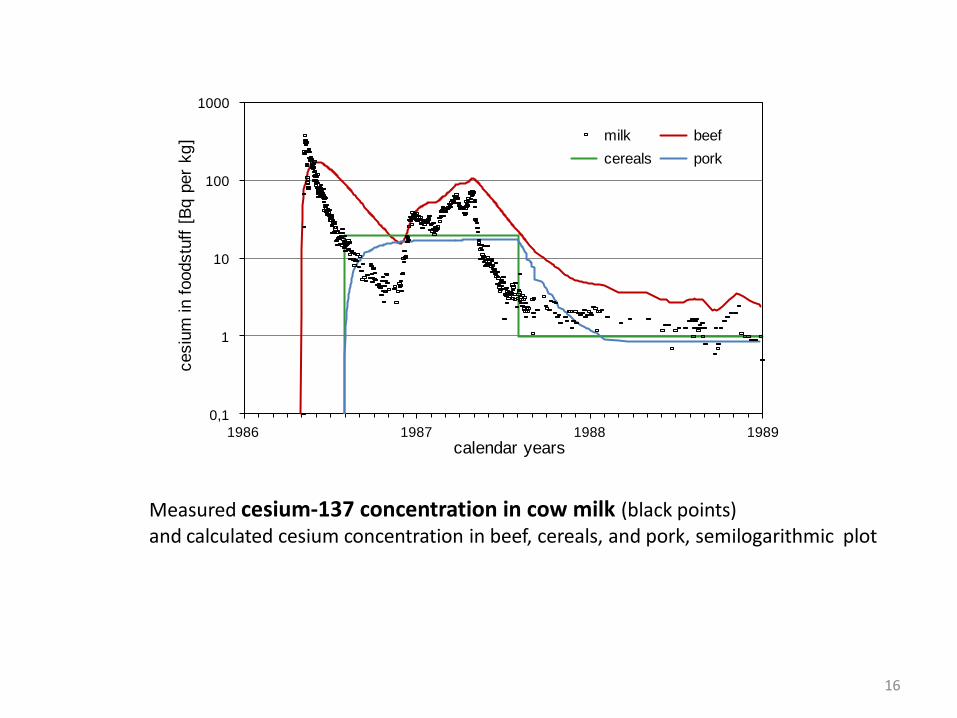
Measured cesium-137 concentration in cow milk (black points) and calculated cesium concentration in beef, cereals, and pork, semilogarithmic plot
16
0,1
1
10
100
1000
1986 1987 1988 1989
cesiu
m in f
oodstu
ff [
Bq
per
kg
]
calendar years
milk beef
cereals pork
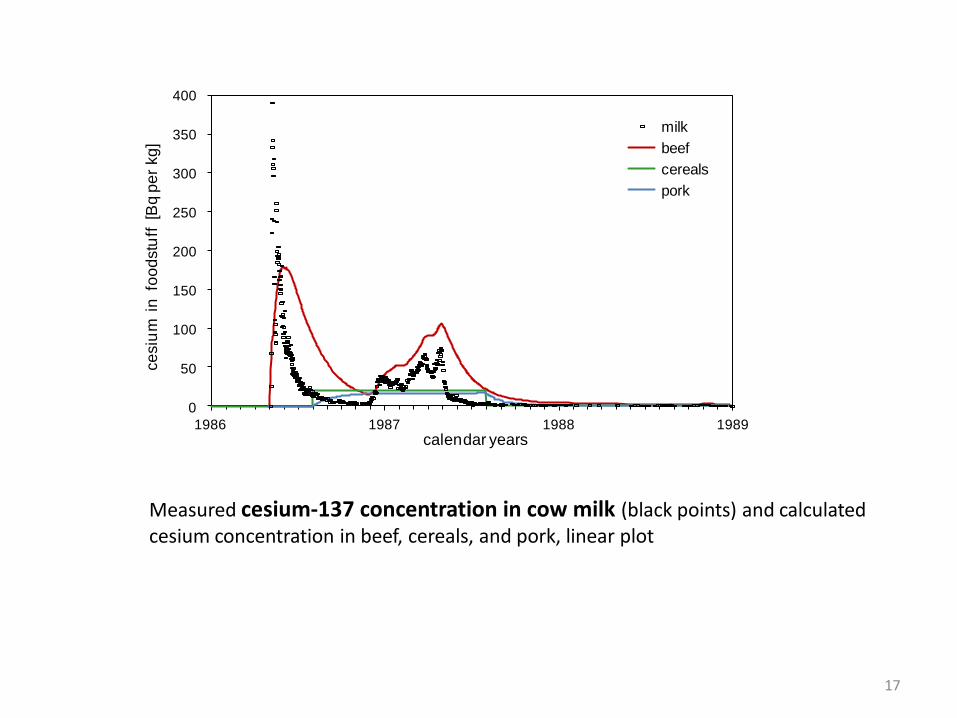
Measured cesium-137 concentration in cow milk (black points) and calculated cesium concentration in beef, cereals, and pork, linear plot
17
0
50
100
150
200
250
300
350
400
1986 1987 1988 1989
ce
siu
m i
n f
oo
dstu
ff [
Bq
pe
r kg
]
calendar years
milk
beef
cereals
pork
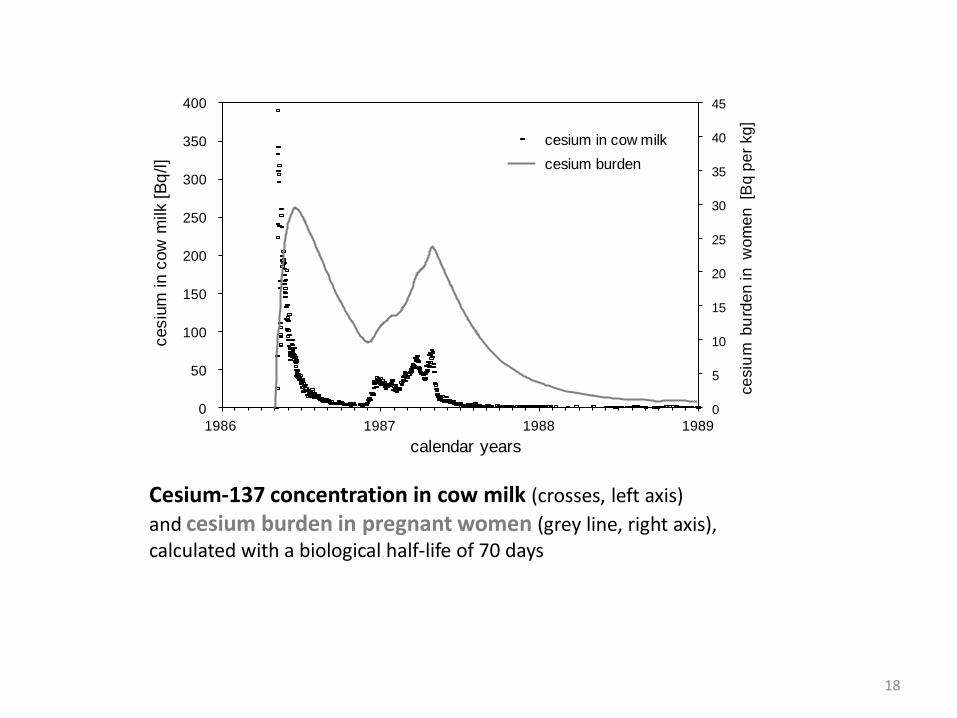
Cesium-137 concentration in cow milk (crosses, left axis)
and cesium burden in pregnant women (grey line, right axis), calculated with a biological half-life of 70 days
18
0
5
10
15
20
25
30
35
40
45
0
50
100
150
200
250
300
350
400
1986 1987 1988 1989
ce
siu
m b
urd
en
in w
om
en
[B
q p
er
kg
]
cesiu
m in c
ow
milk
[B
q/l]
calendar years
cesium in cow milk
cesium burden
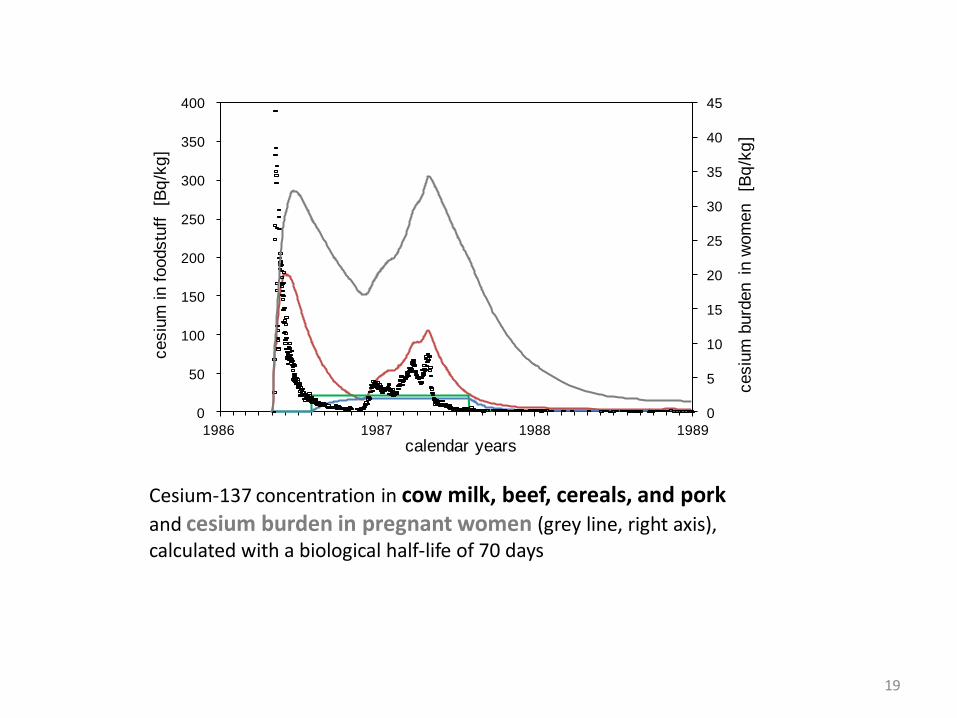
Cesium-137 concentration in cow milk, beef, cereals, and pork and cesium burden in pregnant women (grey line, right axis), calculated with a biological half-life of 70 days
19
0
5
10
15
20
25
30
35
40
45
0
50
100
150
200
250
300
350
400
1986 1987 1988 1989
cesiu
m b
urd
en in
wom
en [B
q/k
g]
cesiu
m in f
oodstu
ff
[Bq
/kg
]
calendar years
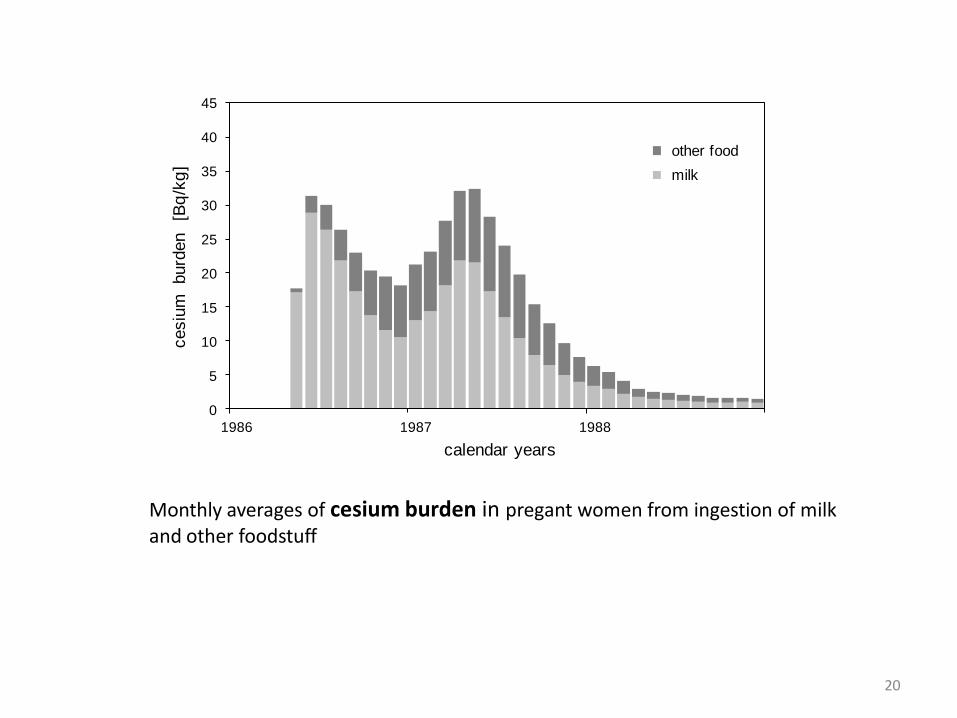
Monthly averages of cesium burden in pregant women from ingestion of milk and other foodstuff
20
0
5
10
15
20
25
30
35
40
45
1986 1987 1988
cesiu
m
burd
en
[Bq
/kg
]
calendar years
other food
milk
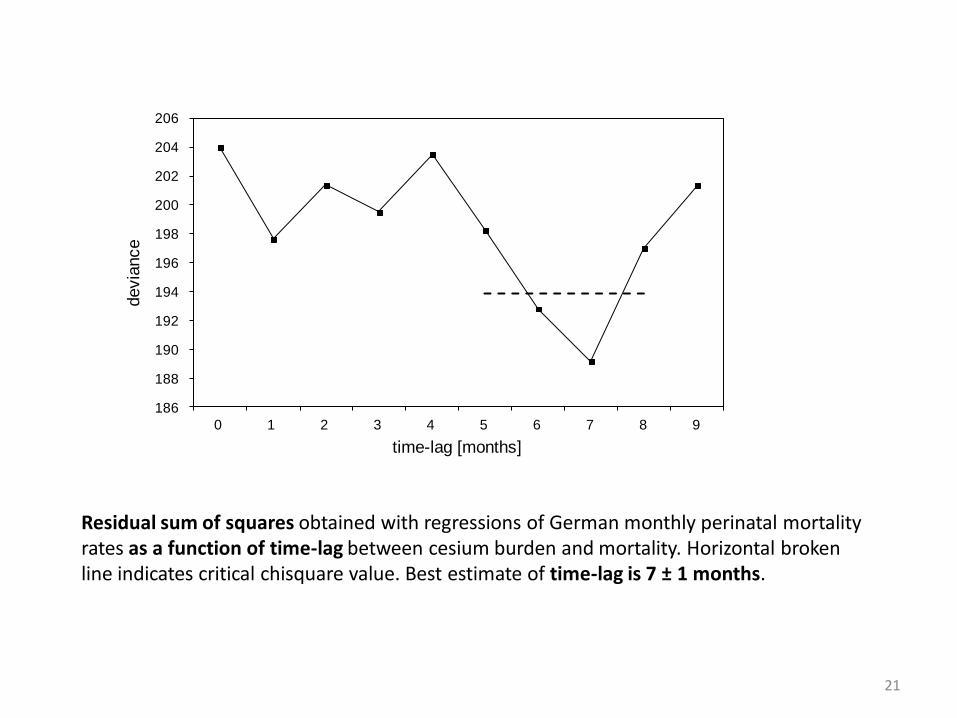
Residual sum of squares obtained with regressions of German monthly perinatal mortality rates as a function of time-lag between cesium burden and mortality. Horizontal broken line indicates critical chisquare value. Best estimate of time-lag is 7 ± 1 months.
21
186
188
190
192
194
196
198
200
202
204
206
0 1 2 3 4 5 6 7 8 9
devia
nce
time-lag [months]
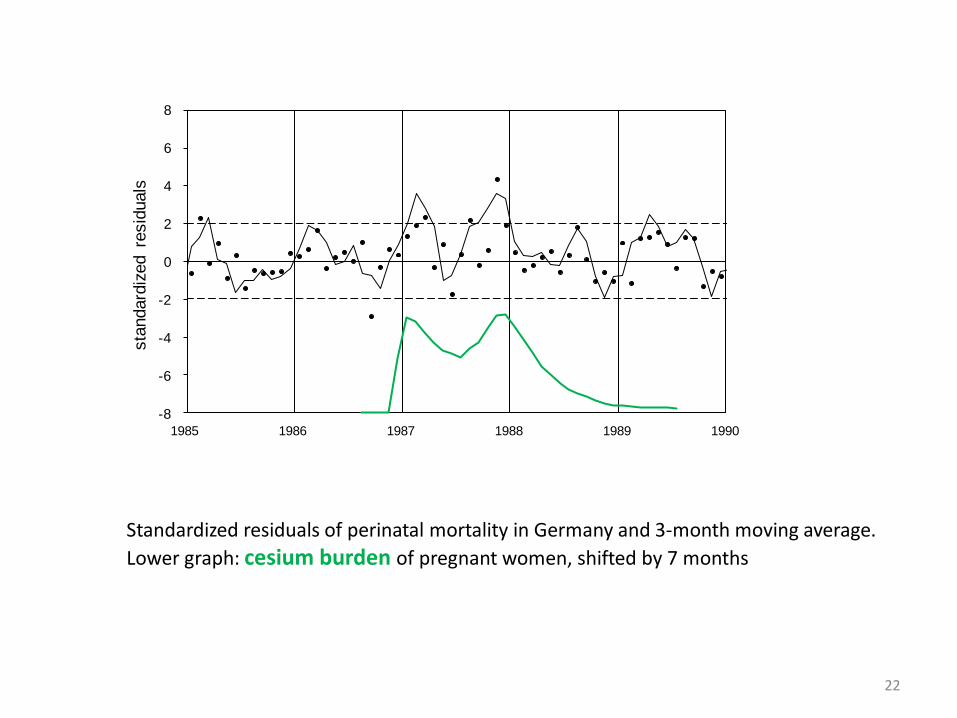
Standardized residuals of perinatal mortality in Germany and 3-month moving average.
Lower graph: cesium burden of pregnant women, shifted by 7 months
22
-8
-6
-4
-2
0
2
4
6
8
1985 1986 1987 1988 1989 1990
sta
ndard
ized re
sid
uals
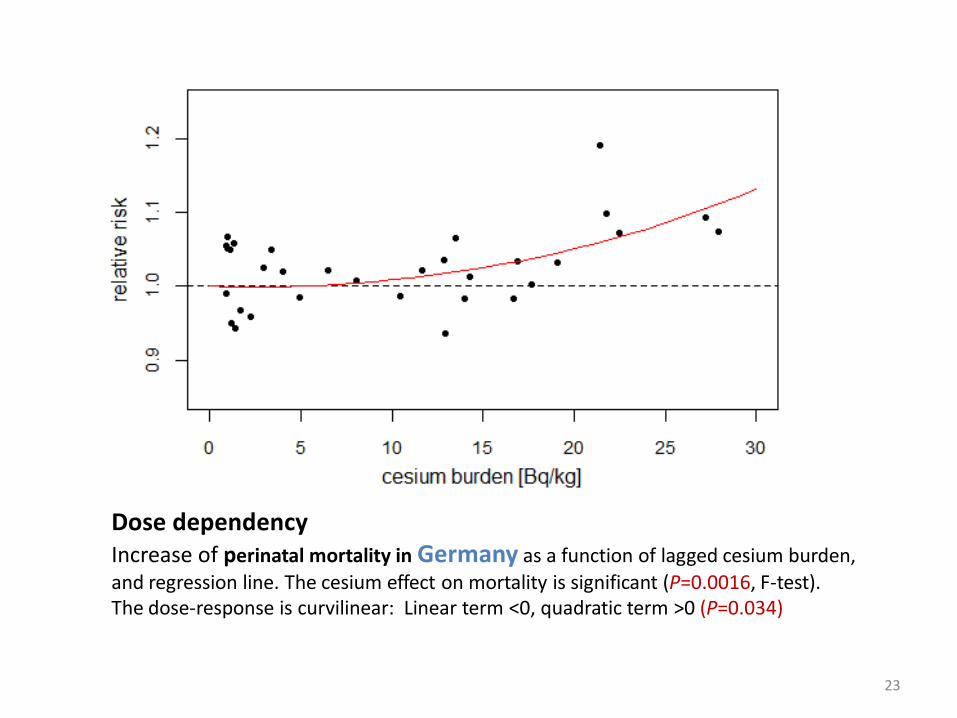
Dose dependency Increase of perinatal mortality in Germany as a function of lagged cesium burden,
and regression line. The cesium effect on mortality is significant (P=0.0016, F-test). The dose-response is curvilinear: Linear term <0, quadratic term >0 (P=0.034)
23
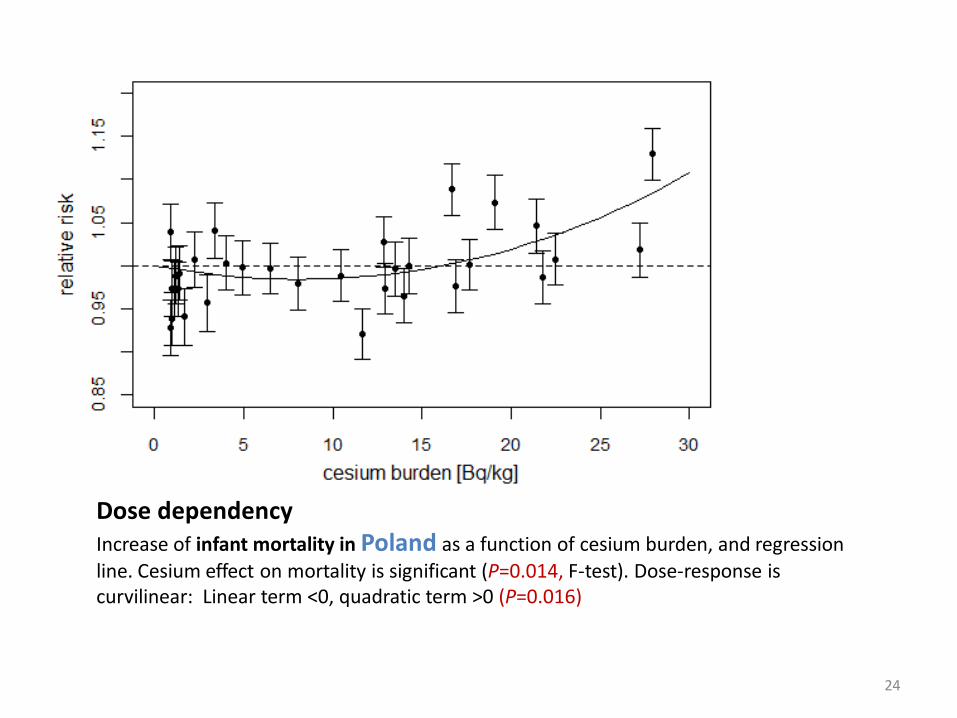
Dose dependency Increase of infant mortality in Poland as a function of cesium burden, and regression
line. Cesium effect on mortality is significant (P=0.014, F-test). Dose-response is curvilinear: Linear term <0, quadratic term >0 (P=0.016)
24
Congenital malformations in Bavaria
• After Chernobyl, a study of congenital malformations in Bavaria was conducted by German Federal Office of Radiation Protection (BfS-ISH)
• The following isolated malformations were included: - neural tube defects, - anophtalamus, microphtalamus, cararact - limb anomalies - cleft lip and palate - atresia of gastrointestinal tract - cong. anomalies of the heart, cong. anomalies of abdominal wall - diaphragmatic hernia
• Malfomations with likely genetic origin: trisomy 21, malformation syndrom (multiple malformations)
• Malformation rates in Southern Bavaria (total cesium soil contamination: ~30 kBq/m²) were compared with rates in Northern Bavaria (~10 kBq/m²)
25
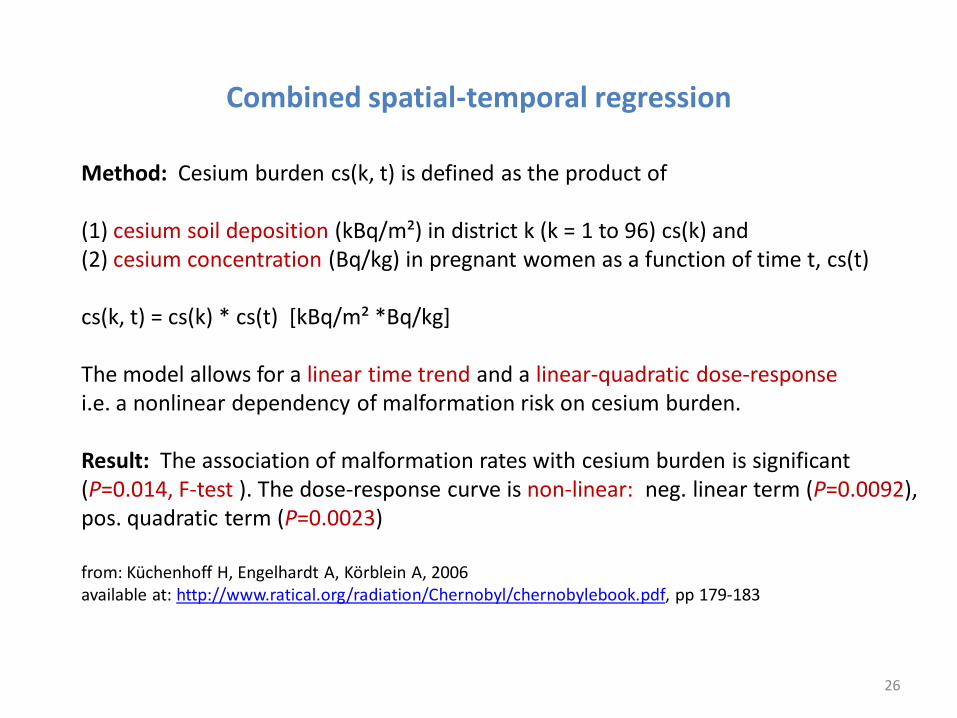
Method: Cesium burden cs(k, t) is defined as the product of (1) cesium soil deposition (kBq/m²) in district k (k = 1 to 96) cs(k) and (2) cesium concentration (Bq/kg) in pregnant women as a function of time t, cs(t) cs(k, t) = cs(k) * cs(t) [kBq/m² *Bq/kg] The model allows for a linear time trend and a linear-quadratic dose-response i.e. a nonlinear dependency of malformation risk on cesium burden. Result: The association of malformation rates with cesium burden is significant (P=0.014, F-test ). The dose-response curve is non-linear: neg. linear term (P=0.0092), pos. quadratic term (P=0.0023) from: Küchenhoff H, Engelhardt A, Körblein A, 2006 available at: http://www.ratical.org/radiation/Chernobyl/chernobylebook.pdf, pp 179-183
26
Combined spatial-temporal regression
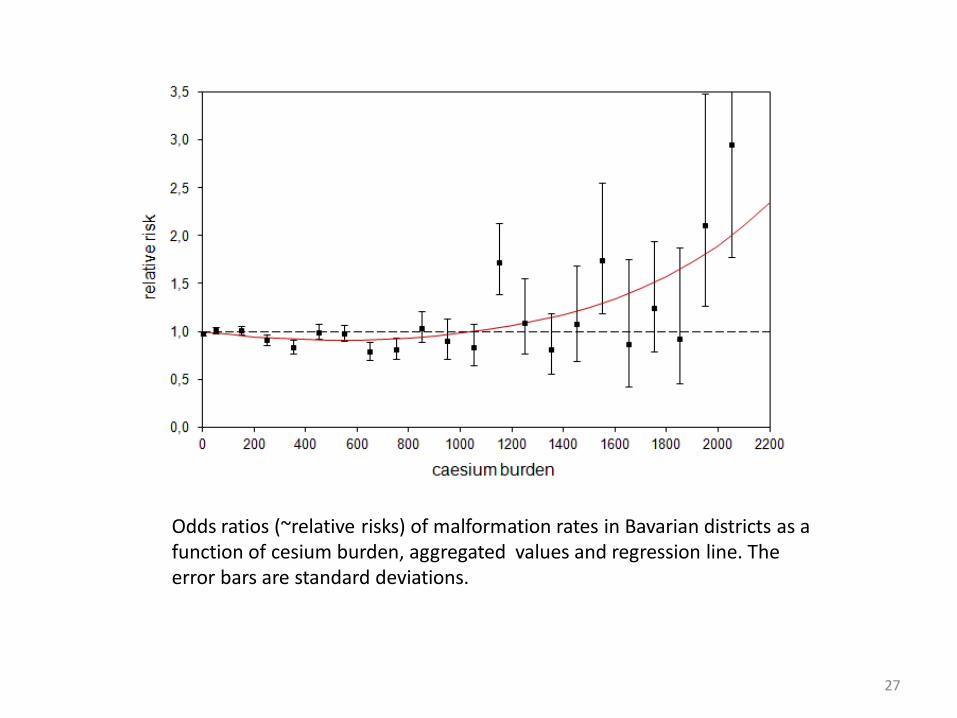
Odds ratios (~relative risks) of malformation rates in Bavarian districts as a function of cesium burden, aggregated values and regression line. The error bars are standard deviations.
27
Summary
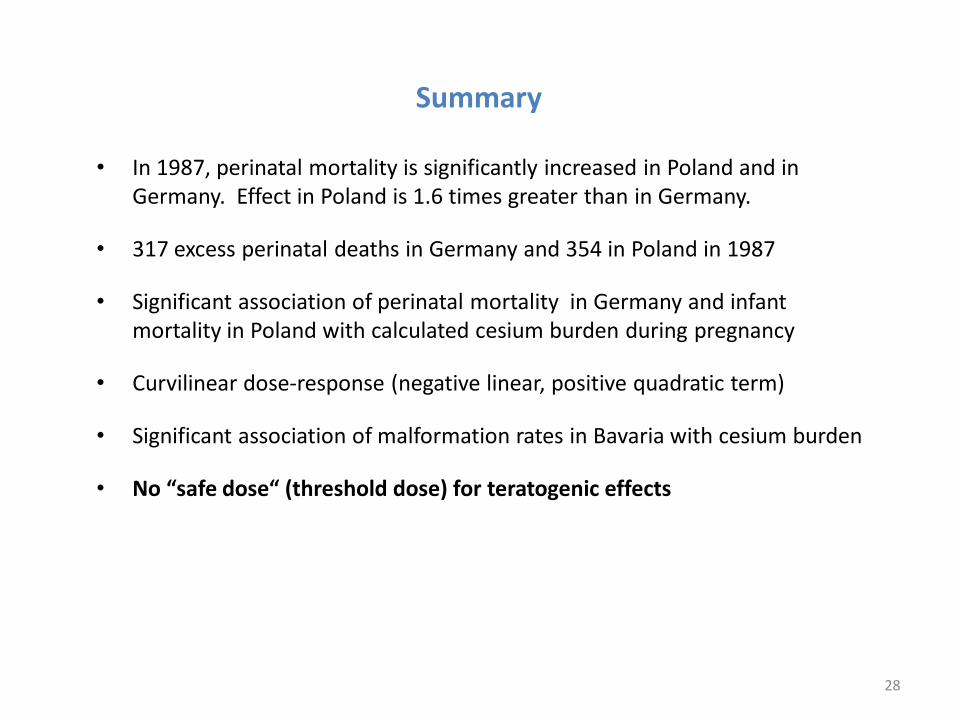
• In 1987, perinatal mortality is significantly increased in Poland and in Germany. Effect in Poland is 1.6 times greater than in Germany.
• 317 excess perinatal deaths in Germany and 354 in Poland in 1987
• Significant association of perinatal mortality in Germany and infant mortality in Poland with calculated cesium burden during pregnancy
• Curvilinear dose-response (negative linear, positive quadratic term)
• Significant association of malformation rates in Bavaria with cesium burden
• No “safe dose“ (threshold dose) for teratogenic effects
28