Embed Size (px)
Citation preview
Peruvian economic outlook and investment opportunities
Javier Correa Merchan Director, Investment Promotion Division Proinversión
• Our country: Peru
• Economic perspectives
• Investment environment
• Investment perspectives
• Infrastructure
• Our country: Peru
• Economic perspectives
• Investment environment
• Investment perspectives
• Infrastructure
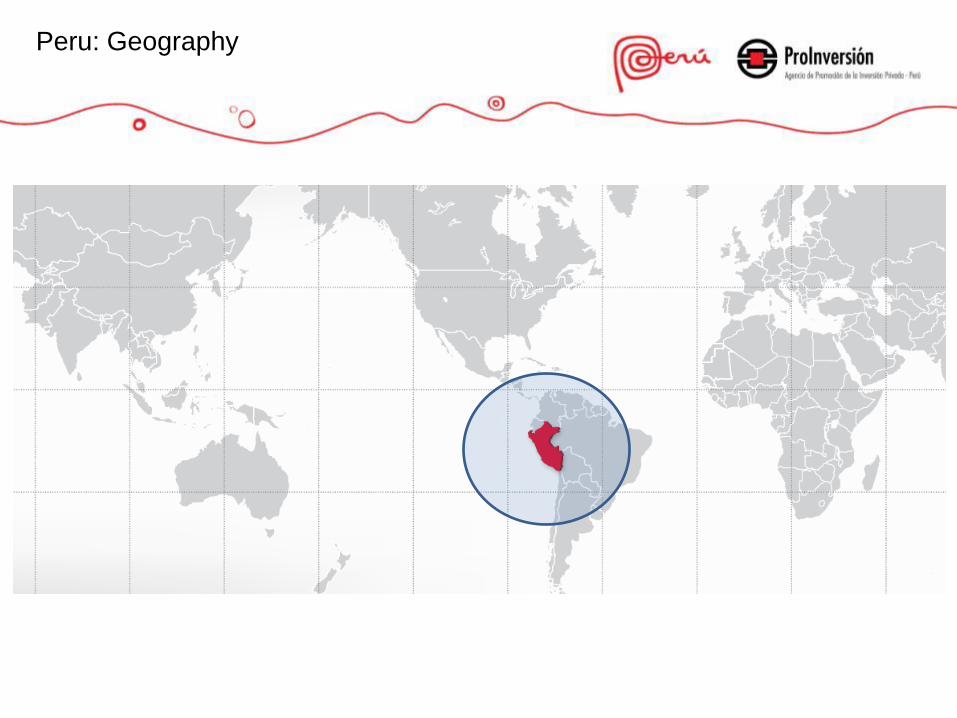
Peru: Geography
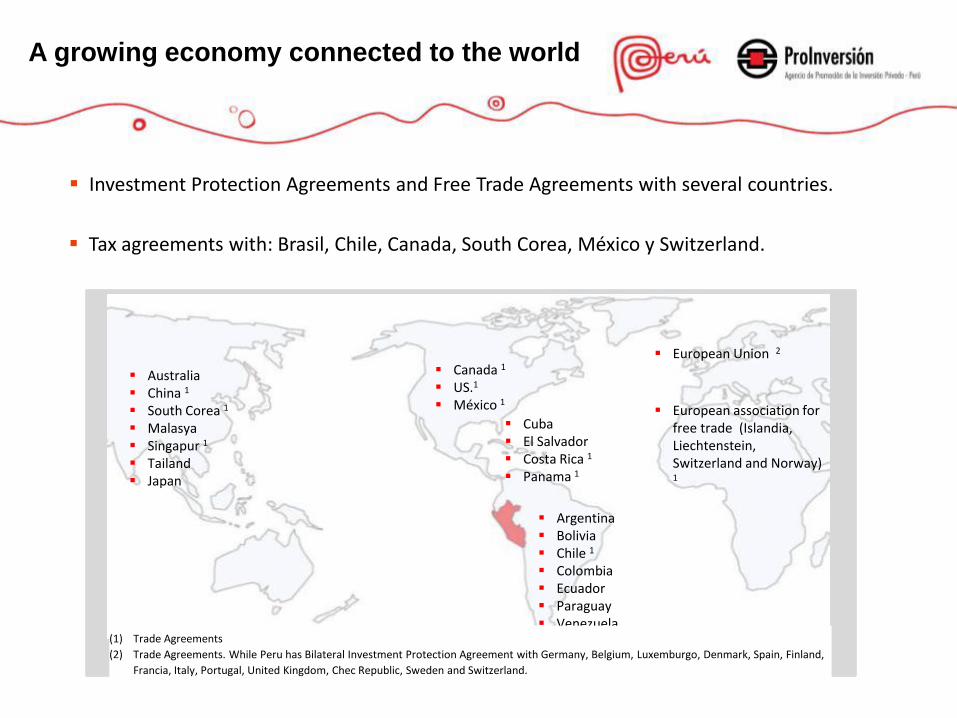
A growing economy connected to the world
Investment Protection Agreements and Free Trade Agreements with several countries.
Australia China 1
South Corea 1
Malasya Singapur 1 Tailand Japan
Argentina Bolivia Chile 1 Colombia Ecuador Paraguay Venezuela
Cuba El Salvador Costa Rica 1
Panama 1
European Union 2
European association for
free trade (Islandia, Liechtenstein, Switzerland and Norway)
1
Canada 1 US.1
México 1
(1) Trade Agreements
(2) Trade Agreements. While Peru has Bilateral Investment Protection Agreement with Germany, Belgium, Luxemburgo, Denmark, Spain, Finland,
Francia, Italy, Portugal, United Kingdom, Chec Republic, Sweden and Switzerland.
Tax agreements with: Brasil, Chile, Canada, South Corea, México y Switzerland.
2,353
1,283
540 385
258 206 203 44
202.77
119.72
47.66 41.96 31.42 30.46
17.82 3.93
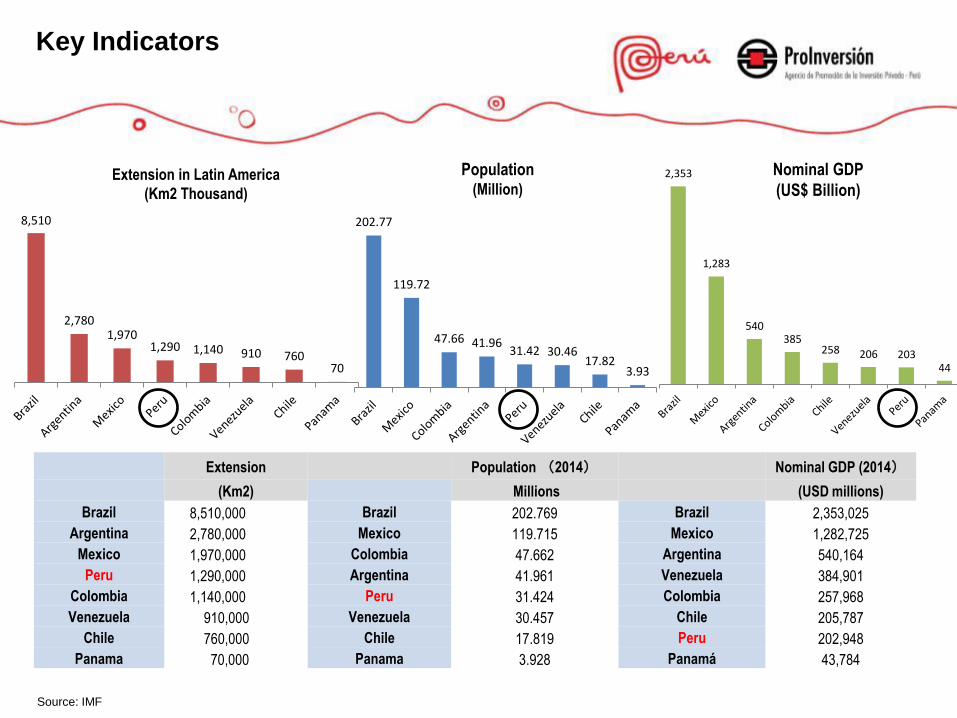
Key Indicators
Extension Population (2014) Nominal GDP (2014)
(Km2) Millions (USD millions)
Brazil 8,510,000 Brazil 202.769 Brazil 2,353,025
Argentina 2,780,000 Mexico 119.715 Mexico 1,282,725
Mexico 1,970,000 Colombia 47.662 Argentina 540,164
Peru 1,290,000 Argentina 41.961 Venezuela 384,901
Colombia 1,140,000 Peru 31.424 Colombia 257,968
Venezuela 910,000 Venezuela 30.457 Chile 205,787
Chile 760,000 Chile 17.819 Peru 202,948
Panama 70,000 Panama 3.928 Panamá 43,784
Nominal GDP
(US$ Billion)
Population
(Million) Extension in Latin America
(Km2 Thousand)
8,510
2,780 1,970
1,290 1,140 910 760 70
Source: IMF
Investm
ent a
s %
of G
DP
27,2
20,4 19,918,4
13,9 13,5
0
5
10
15
20
25
30
Chile México Colombia Brasil Perú Uruguay
26,825,0
23,122,2 21,9
17,0
0
5
10
15
20
25
30
Perú Colombia Uruguay Chile México Brasil
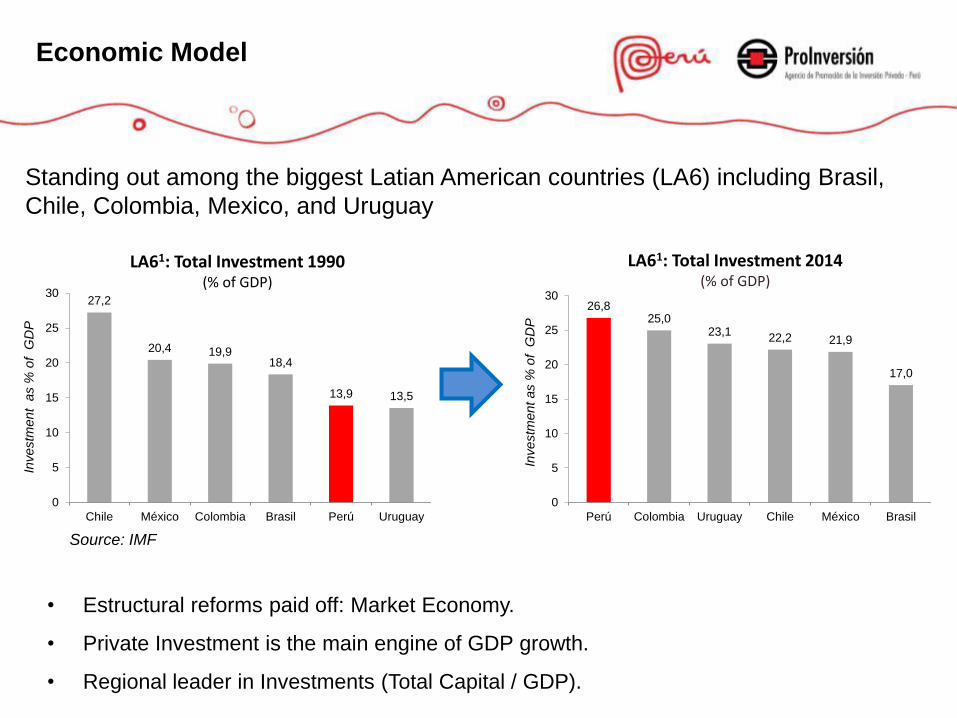
LA61: Total Investment 1990
(% of GDP)
LA61: Total Investment 2014 (% of GDP)
• Estructural reforms paid off: Market Economy.
• Private Investment is the main engine of GDP growth.
• Regional leader in Investments (Total Capital / GDP).
Economic Model
Investm
ent as %
of G
DP
Standing out among the biggest Latian American countries (LA6) including Brasil,
Chile, Colombia, Mexico, and Uruguay
Source: IMF
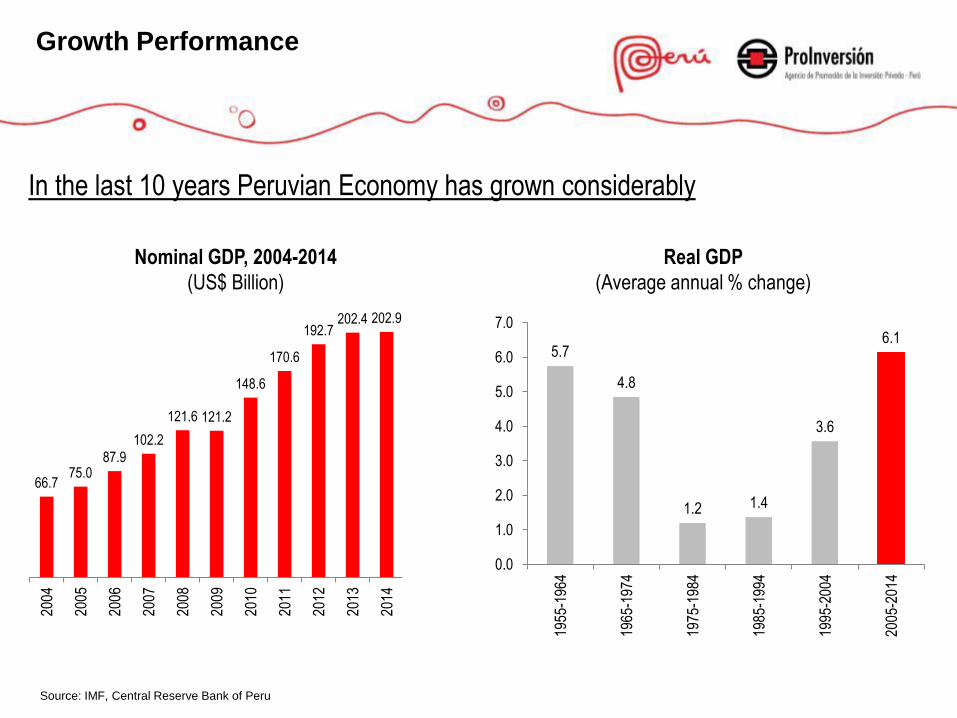
Growth Performance
In the last 10 years Peruvian Economy has grown considerably
Nominal GDP, 2004-2014
(US$ Billion)
Source: IMF, Central Reserve Bank of Peru
5.7
4.8
1.2 1.4
3.6
6.1
0.0
1.0
2.0
3.0
4.0
5.0
6.0
7.0
1955
-196
4
1965
-197
4
1975
-198
4
1985
-199
4
1995
-200
4
2005
-201
4
Real GDP
(Average annual % change)
66.7 75.0
87.9
102.2
121.6 121.2
148.6
170.6
192.7 202.4 202.9
190.3 202.3
2004
2005
2006
2007
2008
2009
2010
2011
2012
2013
2014
2015
*
2016
*
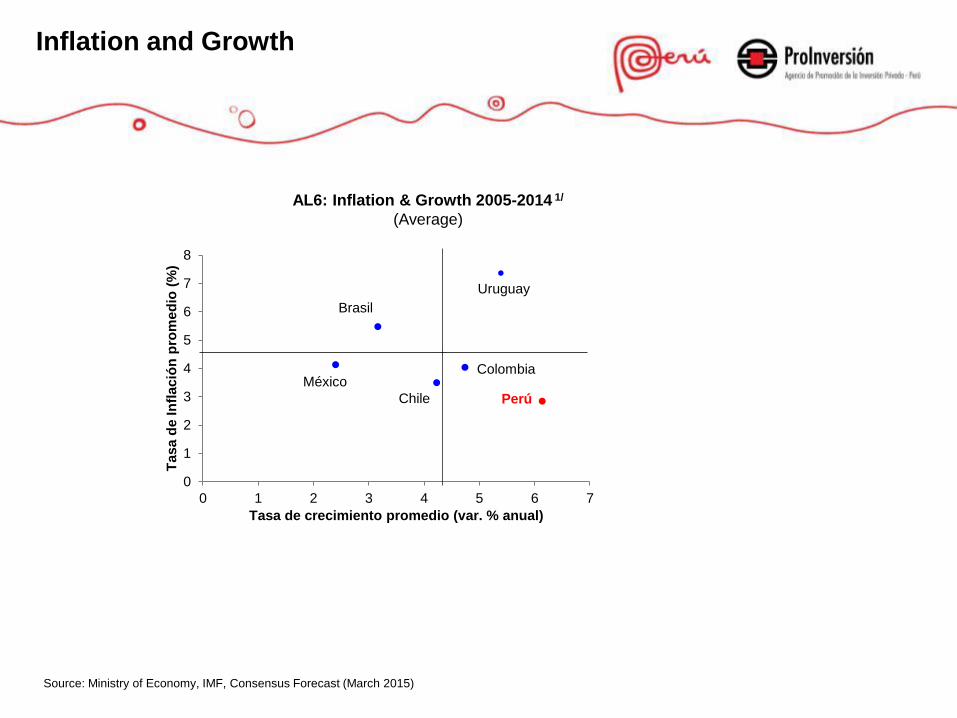
Source: Ministry of Economy, IMF, Consensus Forecast (March 2015)
AL6: Inflation & Growth 2005-2014 1/
(Average)
Brasil
Chile
ColombiaMéxico
Perú
Uruguay
0
1
2
3
4
5
6
7
8
0 1 2 3 4 5 6 7
Ta
sa
de
In
fla
ció
n p
rom
ed
io (
%)
Tasa de crecimiento promedio (var. % anual)
Inflation and Growth
• Our country: Peru
• Economic perspectives
• Investment environment
• Investment perspectives
• Infrastructure
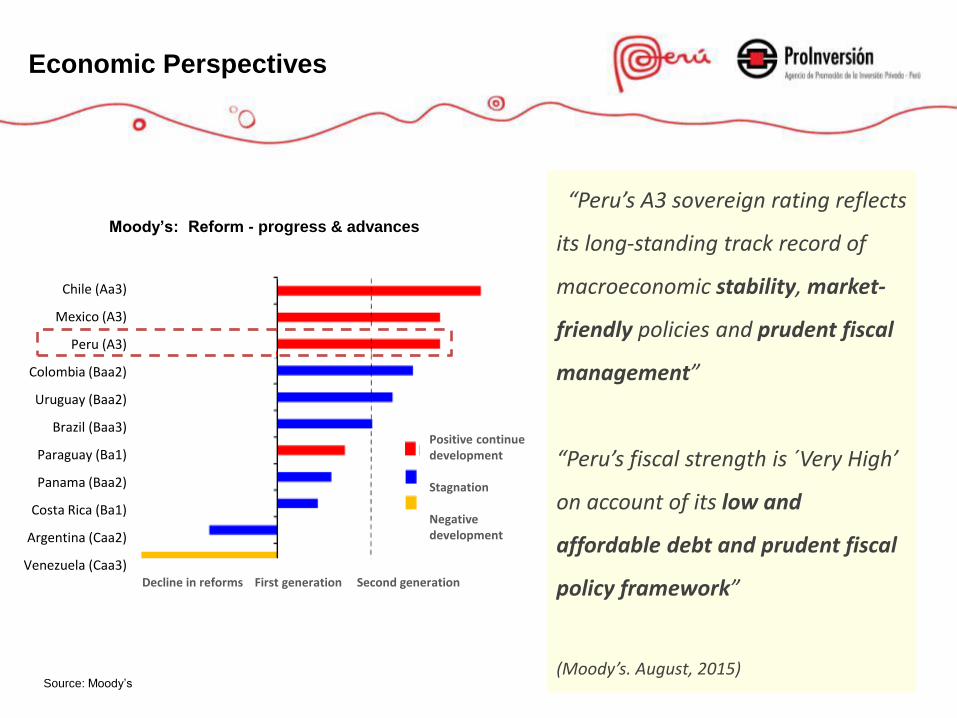
Economic Perspectives
Moody’s: Reform - progress & advances
Source: Moody’s
Chile (Aa3)
Mexico (A3)
Peru (A3)
Colombia (Baa2)
Uruguay (Baa2)
Brazil (Baa3)
Paraguay (Ba1)
Panama (Baa2)
Costa Rica (Ba1)
Argentina (Caa2)
Venezuela (Caa3)
Positive continue development Stagnation Negative development
Decline in reforms First generation Second generation
“Peru’s A3 sovereign rating reflects
its long-standing track record of
macroeconomic stability, market-
friendly policies and prudent fiscal
management”
“Peru’s fiscal strength is ´Very High’
on account of its low and
affordable debt and prudent fiscal
policy framework”
(Moody’s. August, 2015)
Economic Environment
• Reduction of commodity prices and
further troubles in China.
• Greater perception of risk in the
región.
• Lower growth in the Euro zone, US
and China.
• Potential spill over effects from the
recent downgrade of Brazil.
• El Niño Southern Oscillation.
• Fiscal strength.
• Resilent private consumption.
• Mega projects under execution.
• Capacity for public investments.
• Greater mining production.
Risks we are facing in this
enviroment
Our key strengths
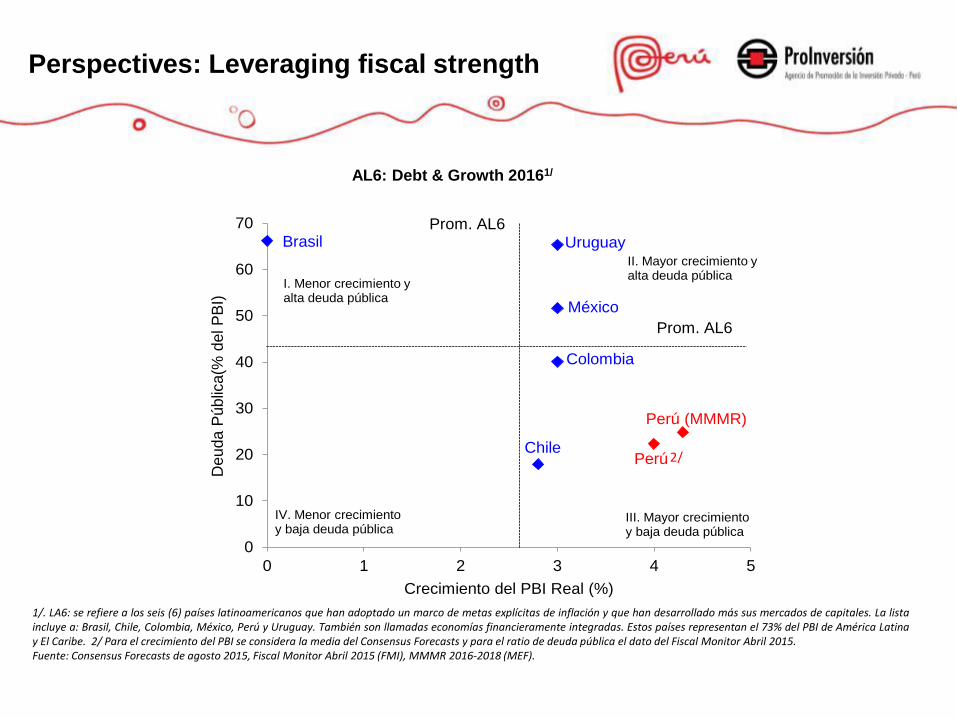
Perspectives: Leveraging fiscal strength
1/. LA6: se refiere a los seis (6) países latinoamericanos que han adoptado un marco de metas explícitas de inflación y que han desarrollado más sus mercados de capitales. La lista incluye a: Brasil, Chile, Colombia, México, Perú y Uruguay. También son llamadas economías financieramente integradas. Estos países representan el 73% del PBI de América Latina y El Caribe. 2/ Para el crecimiento del PBI se considera la media del Consensus Forecasts y para el ratio de deuda pública el dato del Fiscal Monitor Abril 2015. Fuente: Consensus Forecasts de agosto 2015, Fiscal Monitor Abril 2015 (FMI), MMMR 2016-2018 (MEF).
Chile
México
Perú
Colombia
Brasil Uruguay
Perú (MMMR)
0
10
20
30
40
50
60
70
0 1 2 3 4 5
Deuda P
úblic
a(%
del P
BI)
Crecimiento del PBI Real (%)
I. Menor crecimiento y alta deuda pública
IV. Menor crecimiento y baja deuda pública
II. Mayor crecimiento y alta deuda pública
III. Mayor crecimiento y baja deuda pública
2/
Prom. AL6
Prom. AL6
AL6: Debt & Growth 20161/
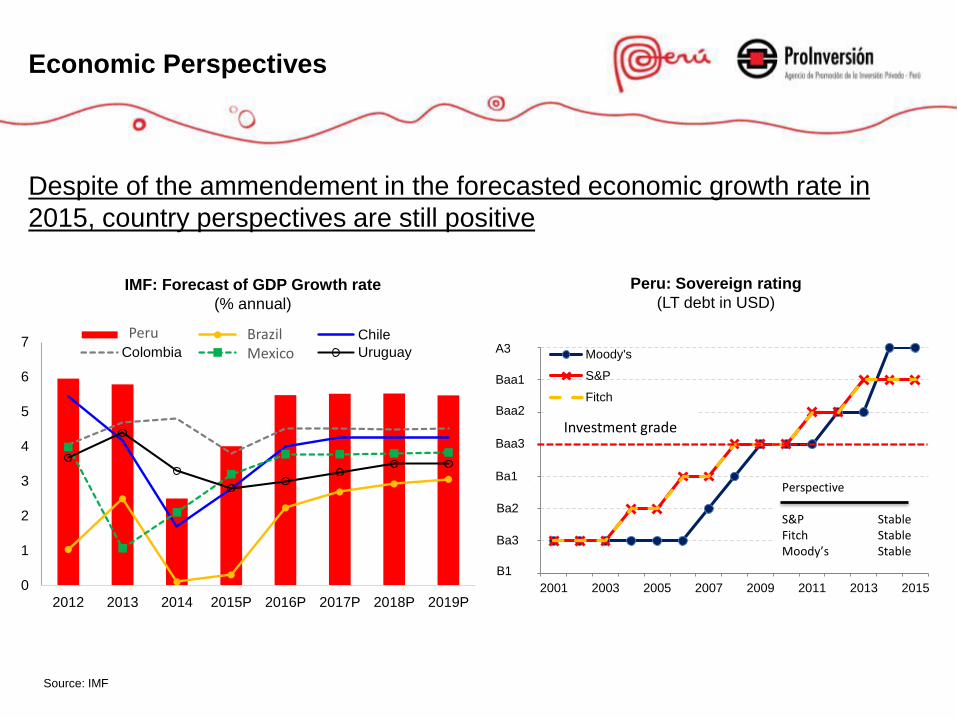
Economic Perspectives
Despite of the ammendement in the forecasted economic growth rate in
2015, country perspectives are still positive
Peru: Sovereign rating
(LT debt in USD) IMF: Forecast of GDP Growth rate
(% annual)
Source: IMF
0
1
2
3
4
5
6
7
2012 2013 2014 2015P 2016P 2017P 2018P 2019P
Perú Brasil Chile
Colombia Mexico Uruguay
Peru Brazil Mexico
15
17
19
21
23
25
27
29
2001 2003 2005 2007 2009 2011 2013 2015
Moody's
S&P
Fitch
Grado de inversión
Ba1
Ba3
Baa1
Baa2
Ba2
B1
Perspectivas
S&P
Fitch
Moody's
Estable
Estable
Estable
Baa3
A3
Investment grade
Perspective S&P Stable Fitch Stable Moody’s Stable
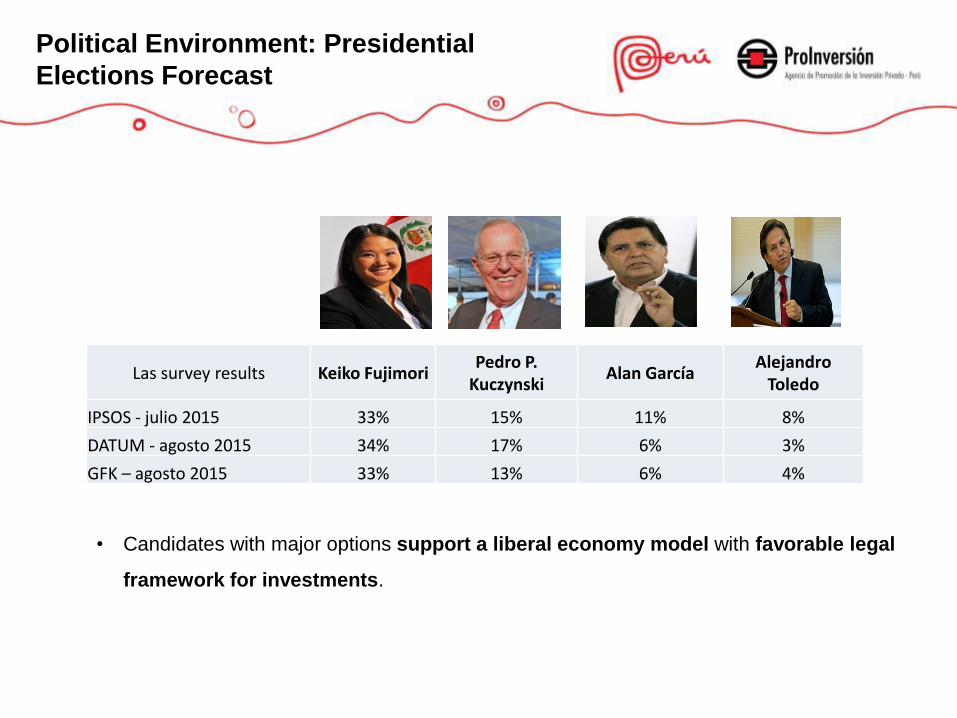
Political Environment: Presidential
Elections Forecast
• Candidates with major options support a liberal economy model with favorable legal
framework for investments.
Las survey results Keiko Fujimori Pedro P.
Kuczynski Alan García
Alejandro Toledo
IPSOS - julio 2015 33% 15% 11% 8%
DATUM - agosto 2015 34% 17% 6% 3%
GFK – agosto 2015 33% 13% 6% 4%
• Our country: Peru
• Economic perspectives
• Investment environment
• Investment perspectives
• Infrastructure
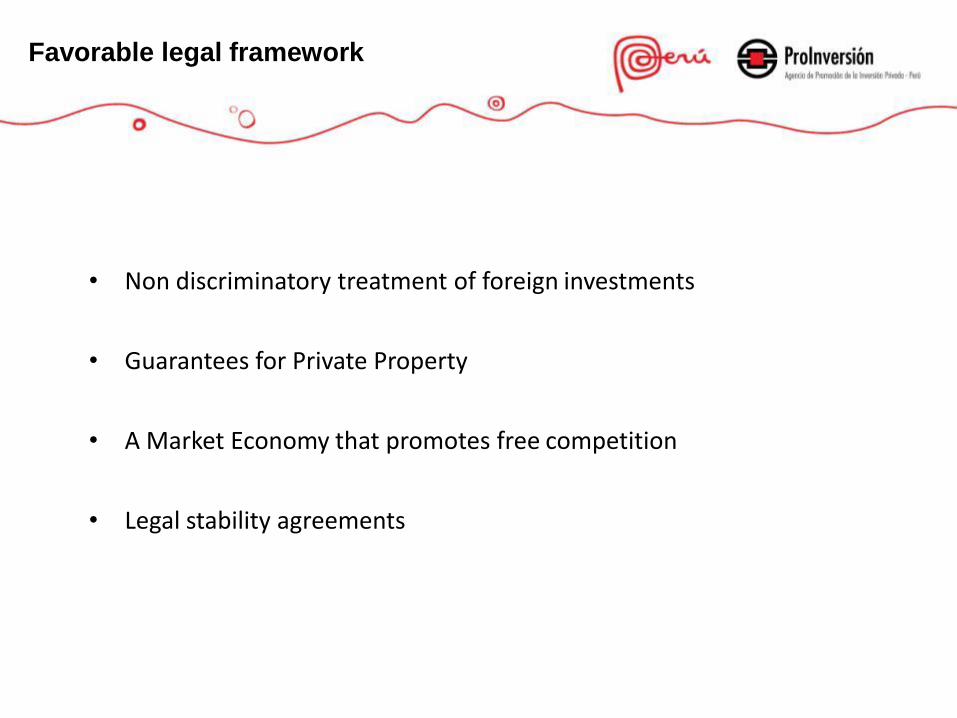
Favorable legal framework
• Non discriminatory treatment of foreign investments
• Guarantees for Private Property
• A Market Economy that promotes free competition
• Legal stability agreements
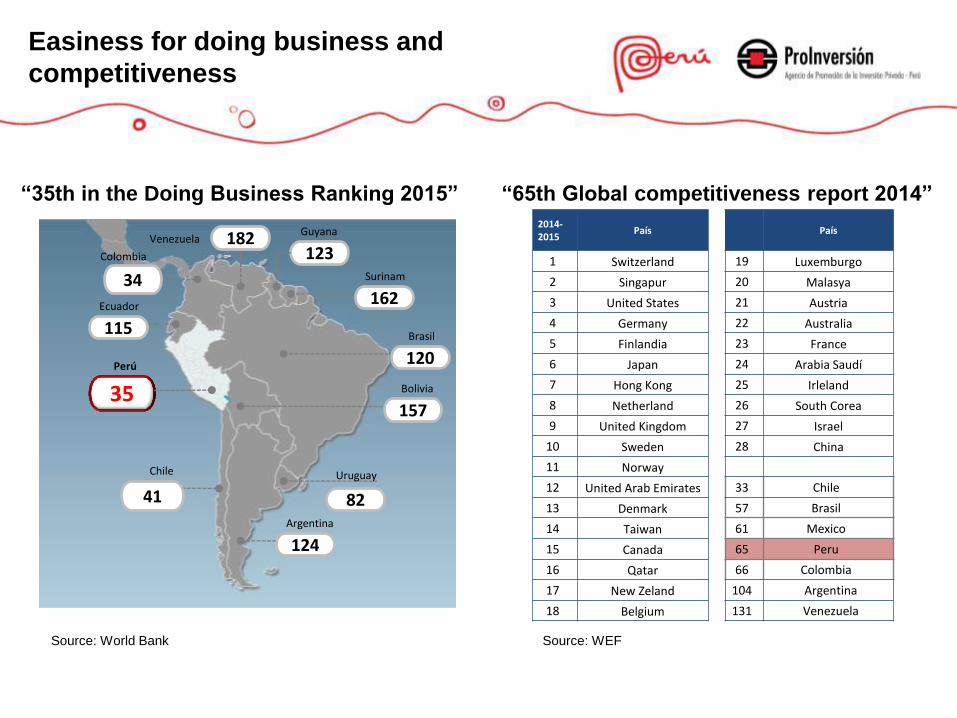
Easiness for doing business and
competitiveness
“35th in the Doing Business Ranking 2015”
120
157
82
124
162
123
34
115
41
35
182
Argentina
Uruguay
Bolivia
Brasil
Surinam
Guyana Venezuela
Colombia
Perú
Chile
Ecuador
2014- 2015
País País
1 Switzerland 19 Luxemburgo
2 Singapur 20 Malasya
3 United States 21 Austria
4 Germany 22 Australia
5 Finlandia 23 France
6 Japan 24 Arabia Saudí
7 Hong Kong 25 Irleland
8 Netherland 26 South Corea
9 United Kingdom 27 Israel
10 Sweden 28 China
11 Norway
12 United Arab Emirates 33 Chile
13 Denmark 57 Brasil
14 Taiwan 61 Mexico
15 Canada 65 Peru
16 Qatar 66 Colombia
17 New Zeland 104 Argentina
18 Belgium 131 Venezuela
“65th Global competitiveness report 2014”
Source: World Bank Source: WEF
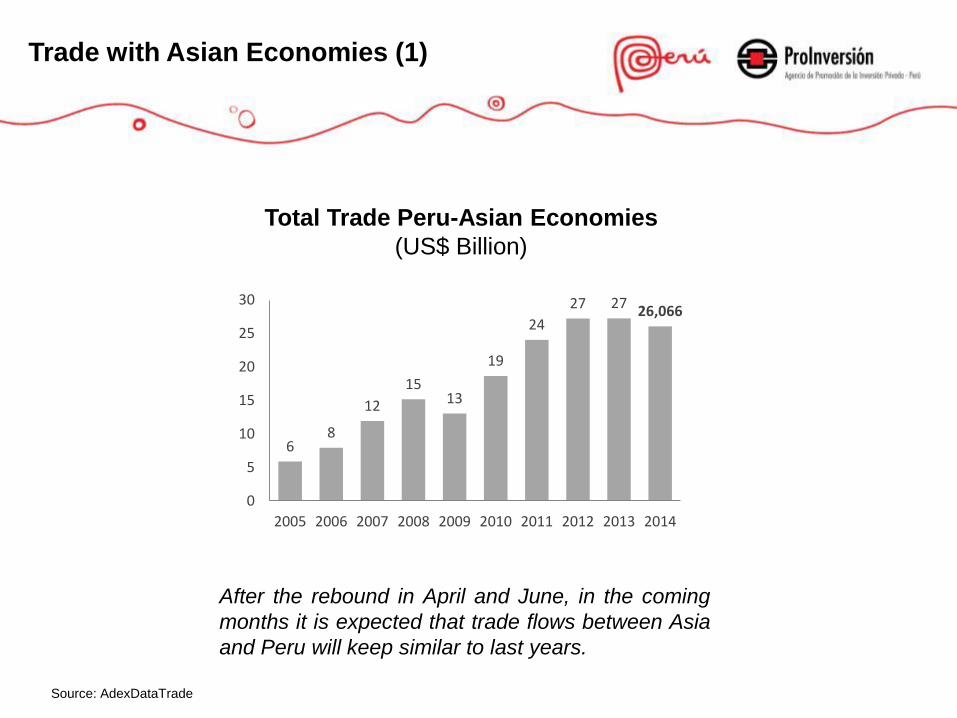
Trade with Asian Economies (1)
6 8
12
15 13
19
24
27 27 26,066
0
5
10
15
20
25
30
2005 2006 2007 2008 2009 2010 2011 2012 2013 2014
Total Trade Peru-Asian Economies
(US$ Billion)
After the rebound in April and June, in the coming
months it is expected that trade flows between Asia
and Peru will keep similar to last years.
Source: AdexDataTrade
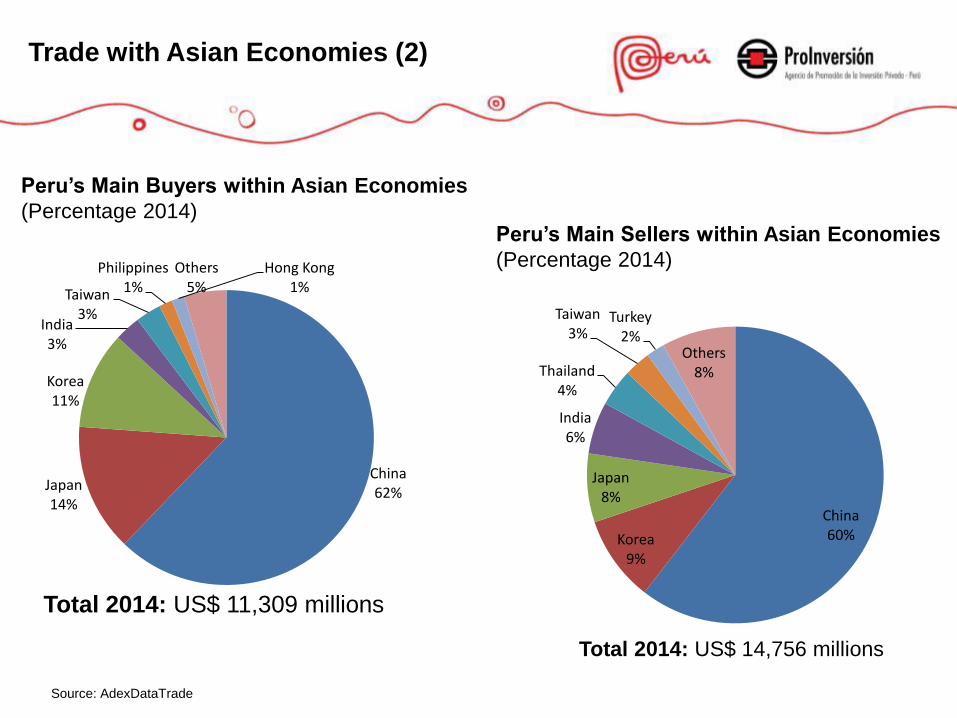
Peru’s Main Buyers within Asian Economies
(Percentage 2014)
Total 2014: US$ 11,309 millions
China 62% Japan
14%
Korea 11%
India 3%
Taiwan 3%
Philippines 1%
Hong Kong 1%
Others 5%
Peru’s Main Sellers within Asian Economies
(Percentage 2014)
Total 2014: US$ 14,756 millions
China 60% Korea
9%
Japan 8%
India 6%
Thailand 4%
Taiwan 3%
Turkey 2%
Others 8%
Source: AdexDataTrade
Trade with Asian Economies (2)
• Our country: Peru
• Economic perspectives
• Investment environment
• Investment perspectives
• Infrastructure
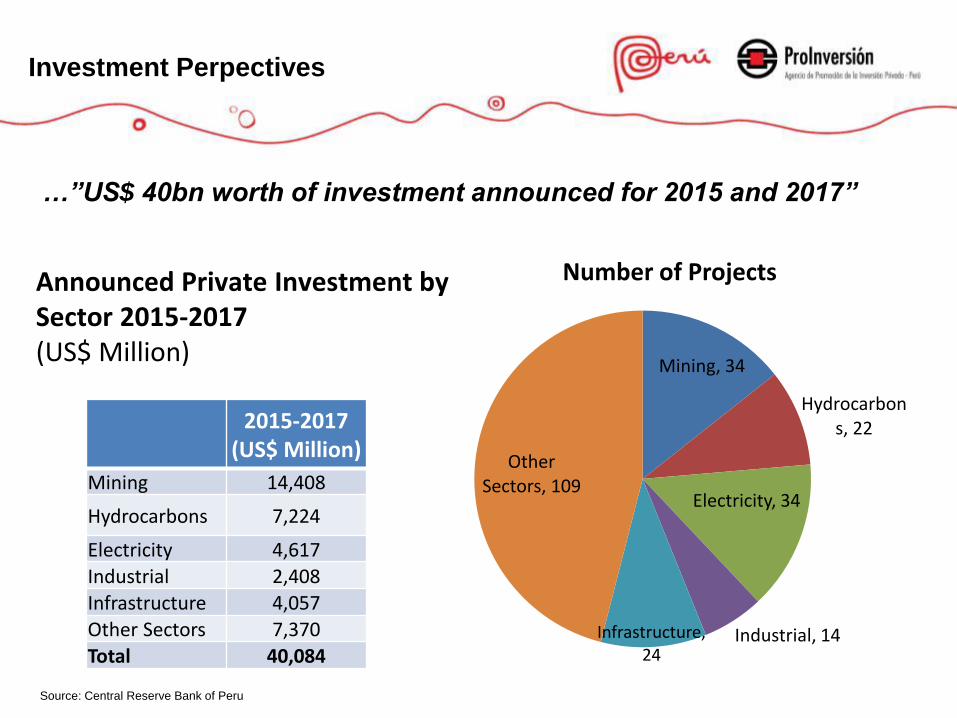
Investment Perpectives
Announced Private Investment by Sector 2015-2017 (US$ Million)
2015-2017 (US$ Million)
Mining 14,408
Hydrocarbons 7,224
Electricity 4,617
Industrial 2,408 Infrastructure 4,057
Other Sectors 7,370 Total 40,084
Number of Projects
Mining, 34
Hydrocarbons, 22
Electricity, 34
Industrial, 14 Infrastructure, 24
Other Sectors, 109
Source: Central Reserve Bank of Peru
…”US$ 40bn worth of investment announced for 2015 and 2017”
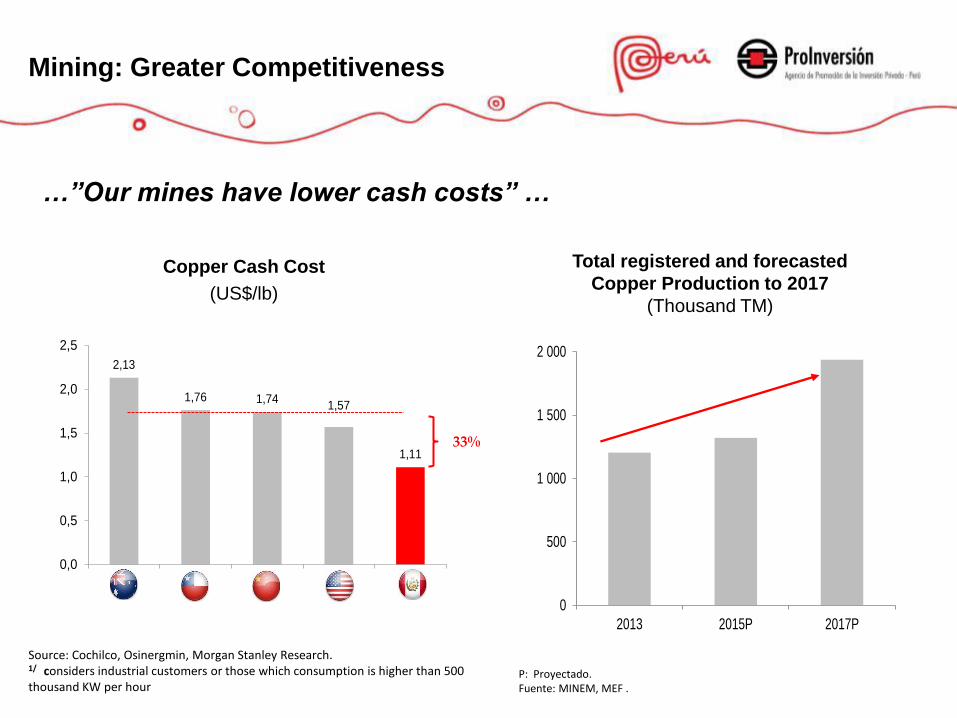
Mining: Greater Competitiveness
2,13
1,76 1,741,57
1,11
0,0
0,5
1,0
1,5
2,0
2,5
Australia Chile China EE.UU. Perú
33%
Copper Cash Cost
(US$/lb)
Source: Cochilco, Osinergmin, Morgan Stanley Research. 1/ considers industrial customers or those which consumption is higher than 500 thousand KW per hour
P: Proyectado. Fuente: MINEM, MEF .
Total registered and forecasted
Copper Production to 2017
(Thousand TM)
0
500
1 000
1 500
2 000
2013 2015P 2017P
…”Our mines have lower cash costs” …
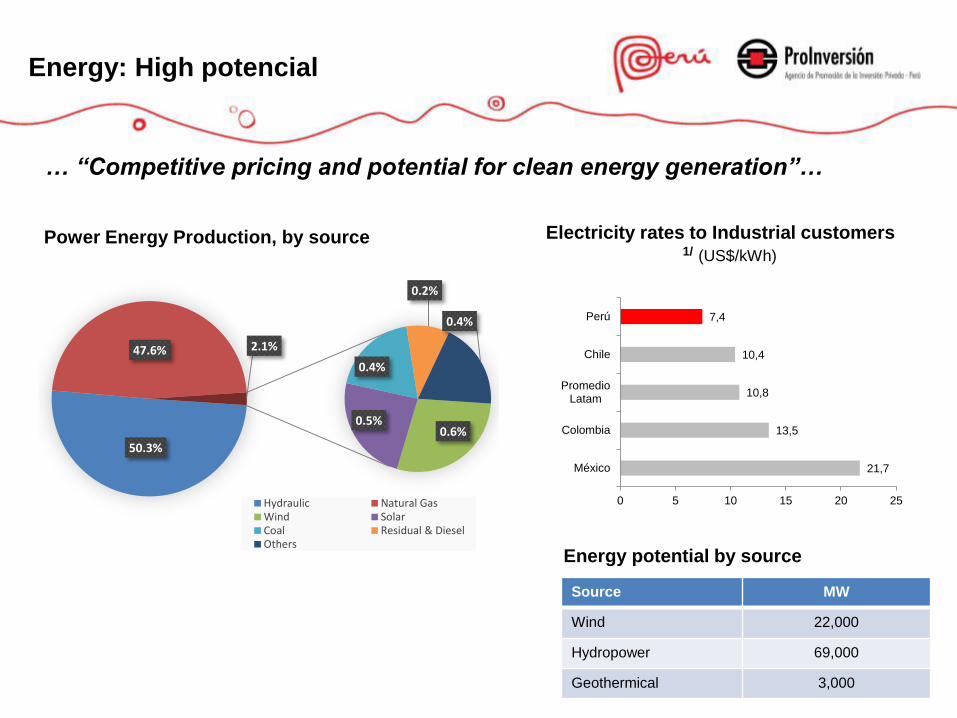
Energy: High potencial
21,7
13,5
10,8
10,4
7,4
0 5 10 15 20 25
México
Colombia
PromedioLatam
Chile
Perú
Electricity rates to Industrial customers 1/ (US$/kWh)
50.3%
47.6%
0.6% 0.5%
0.4%
0.2%
0.4%
2.1%
Power Energy Production, by source
Hydraulic Natural GasWind SolarCoal Residual & DieselOthers
Energy potential by source
Source MW
Wind 22,000
Hydropower 69,000
Geothermical 3,000
… “Competitive pricing and potential for clean energy generation”…
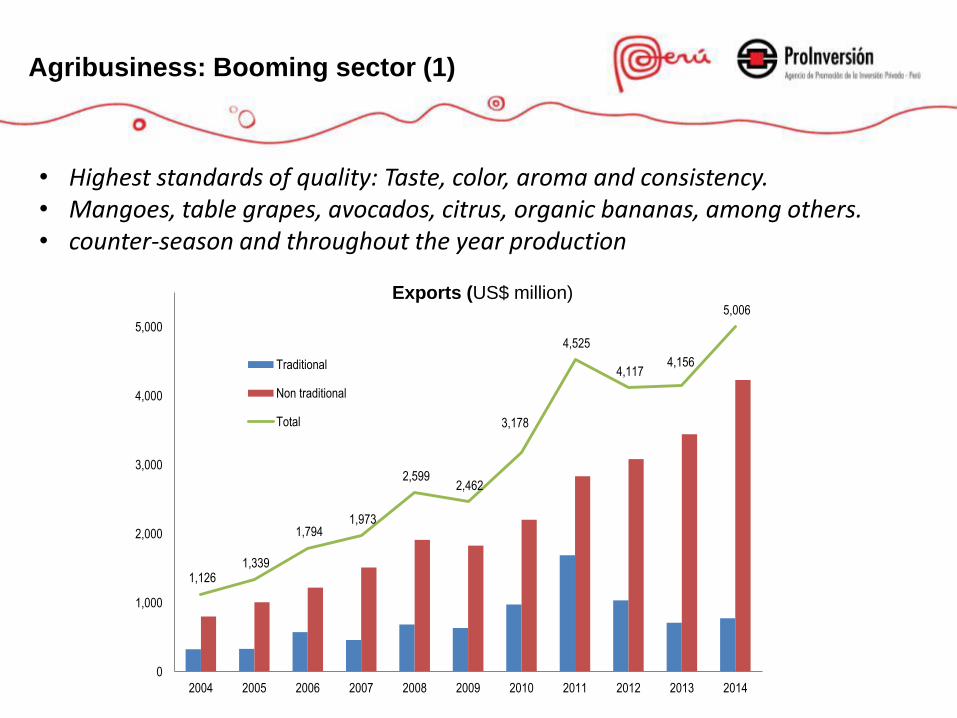
1,126 1,339
1,794 1,973
2,599 2,462
3,178
4,525
4,117 4,156
5,006
0
1,000
2,000
3,000
4,000
5,000
2004 2005 2006 2007 2008 2009 2010 2011 2012 2013 2014
Traditional
Non traditional
Total
Exports (US$ million)
• Highest standards of quality: Taste, color, aroma and consistency. • Mangoes, table grapes, avocados, citrus, organic bananas, among others. • counter-season and throughout the year production
Agribusiness: Booming sector (1)
New 100 thousand
of
hectares
Area for modern agriculture
(thousand of hectares)
78%
Chavimochic III
Majes-Siguas II
180 218
63
38
2013 2020
Agribusiness: Booming sector (2)
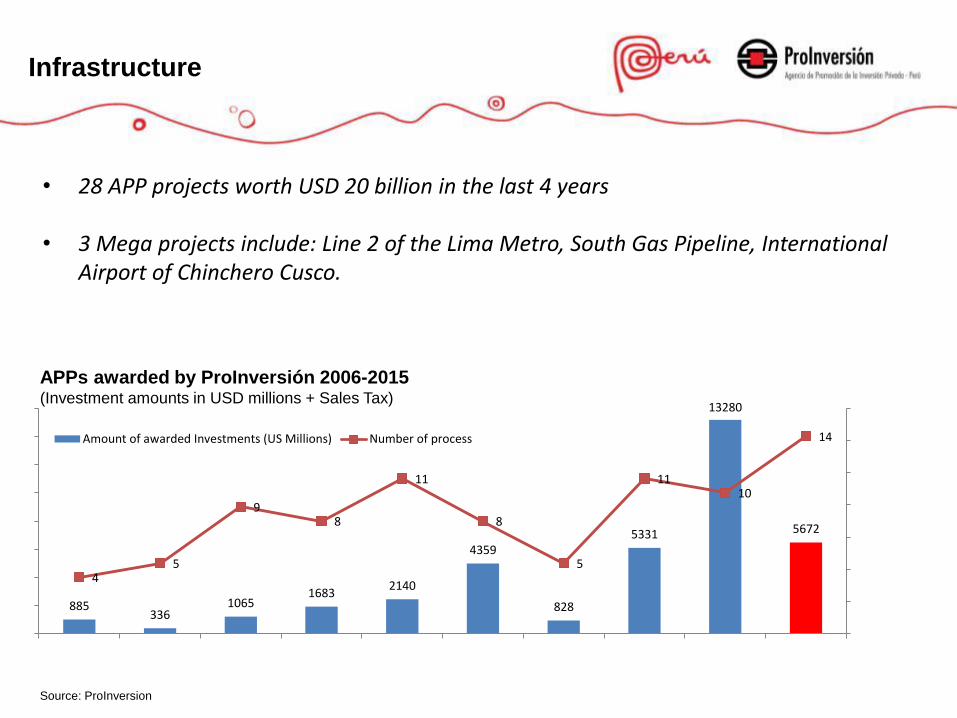
Infrastructure
APPs awarded by ProInversión 2006-2015 (Investment amounts in USD millions + Sales Tax)
885 336
1065 1683
2140
4359
828
5331
13280
5672
4 5
9 8
11
8
5
11 10
14
0
2000
4000
6000
8000
10000
12000
14000
0
2
4
6
8
10
12
14
16
2006 2007 2008 2009 2010 2011 2012 2013 2014 2015*
Amount of awarded Investments (US Millions) Number of process
• 28 APP projects worth USD 20 billion in the last 4 years
• 3 Mega projects include: Line 2 of the Lima Metro, South Gas Pipeline, International Airport of Chinchero Cusco.
Source: ProInversion
• Our country: Peru
• Economic perspectives
• Investment environment
• Investment perspectives
• Infrastructure
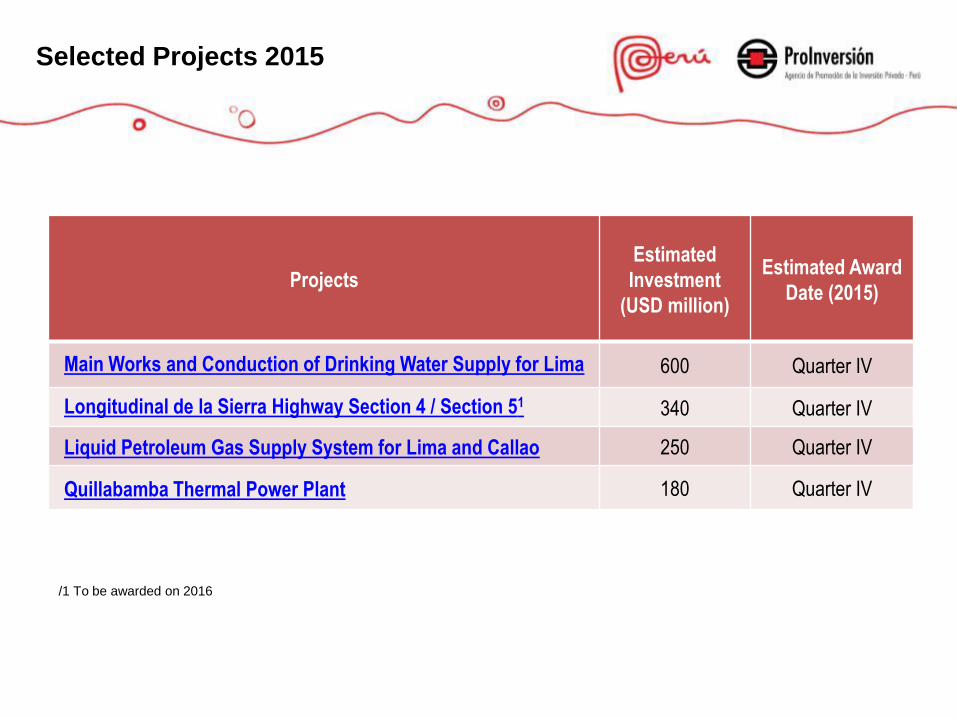
Projects
Estimated
Investment
(USD million)
Estimated Award
Date (2015)
Main Works and Conduction of Drinking Water Supply for Lima 600 Quarter IV
Longitudinal de la Sierra Highway Section 4 / Section 51 340 Quarter IV
Liquid Petroleum Gas Supply System for Lima and Callao 250 Quarter IV
Quillabamba Thermal Power Plant 180 Quarter IV
Selected Projects 2015
/1 To be awarded on 2016
Projects
Estimated
Investment
(USD million)
Estimated Award
Date in
2016
Huancayo – Huancavelica Railway 194 Quarter I
Lima Peripheral Ring Road 2,00 Quarter II
San Gaban 3 Hydroelectric Power Plant 437 Quarter II
Lines 3 and 41 of the Metro Network of Lima and Callao 5,00 (each) Quarter III
Three New High Complexity Hospital Centers 400 2016
Port Terminals - 2016
Projects 2016
/1 To be awarded on 2017

www.proinversion.gob.pe [email protected]
TO BE ANNOUNCED
represas
CALLED
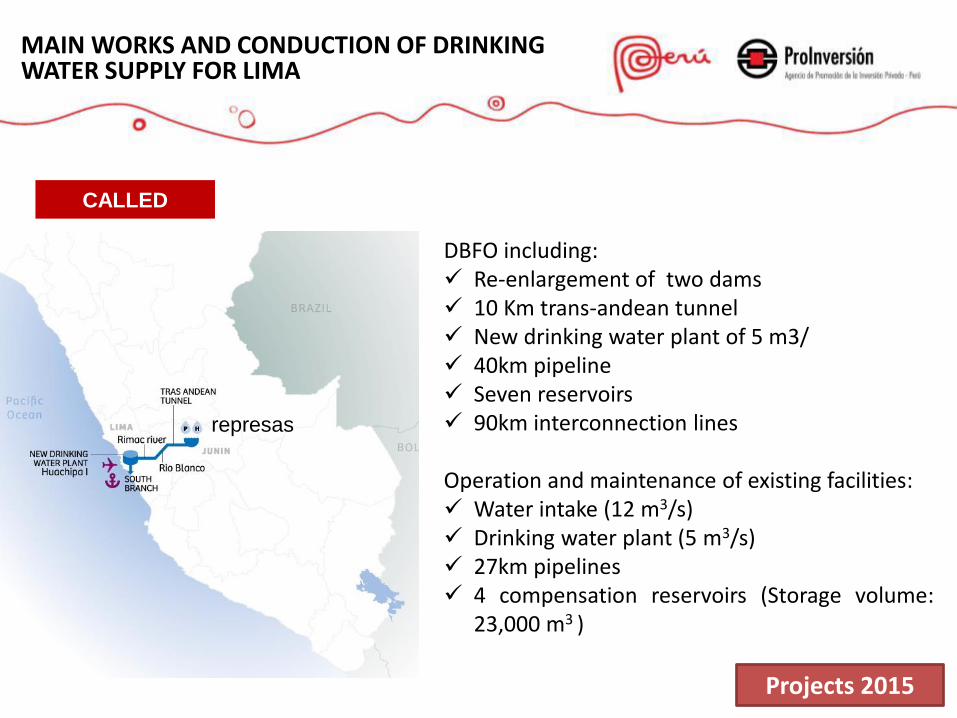
MAIN WORKS AND CONDUCTION OF DRINKING WATER SUPPLY FOR LIMA
DBFO including: Re-enlargement of two dams 10 Km trans-andean tunnel New drinking water plant of 5 m3/ 40km pipeline Seven reservoirs 90km interconnection lines Operation and maintenance of existing facilities: Water intake (12 m3/s) Drinking water plant (5 m3/s) 27km pipelines 4 compensation reservoirs (Storage volume:
23,000 m3 )
Projects 2015
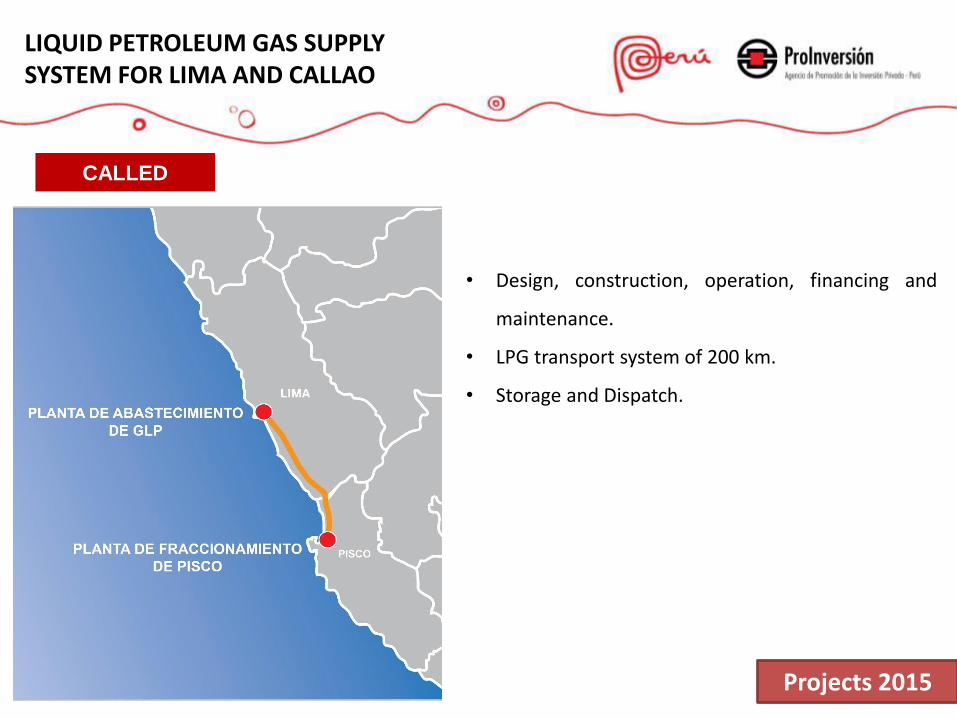
• Design, construction, operation, financing and
maintenance.
• LPG transport system of 200 km.
• Storage and Dispatch.
CALLED
LIQUID PETROLEUM GAS SUPPLY SYSTEM FOR LIMA AND CALLAO
Projects 2015
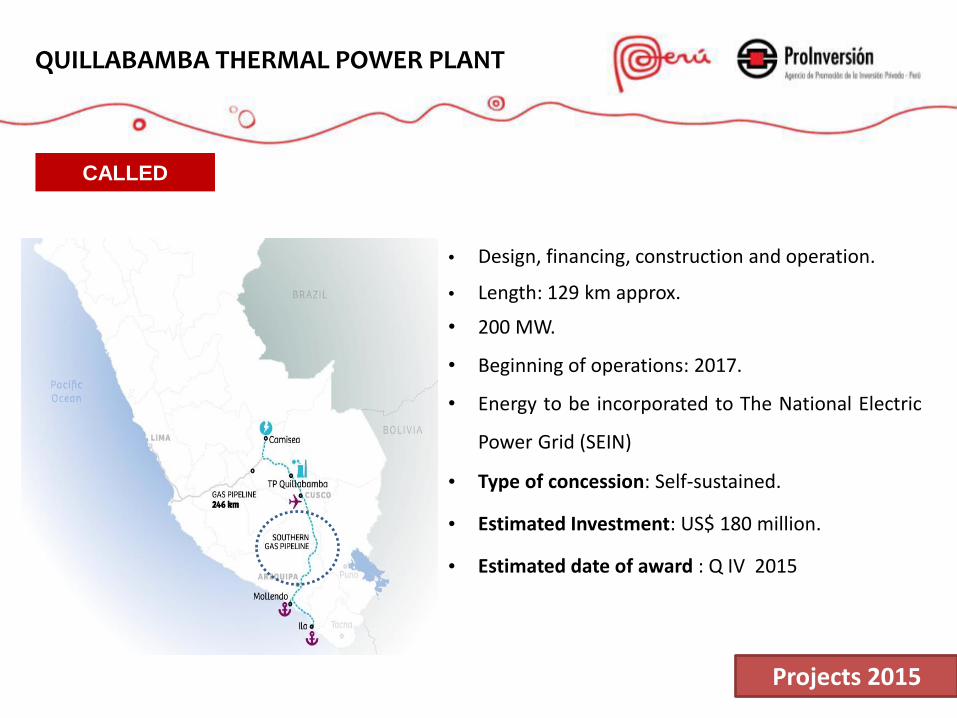
• Design, financing, construction and operation.
• Length: 129 km approx.
• 200 MW.
• Beginning of operations: 2017.
• Energy to be incorporated to The National Electric
Power Grid (SEIN)
• Type of concession: Self-sustained.
• Estimated Investment: US$ 180 million.
• Estimated date of award : Q IV 2015
QUILLABAMBA THERMAL POWER PLANT
Projects 2015
CALLED
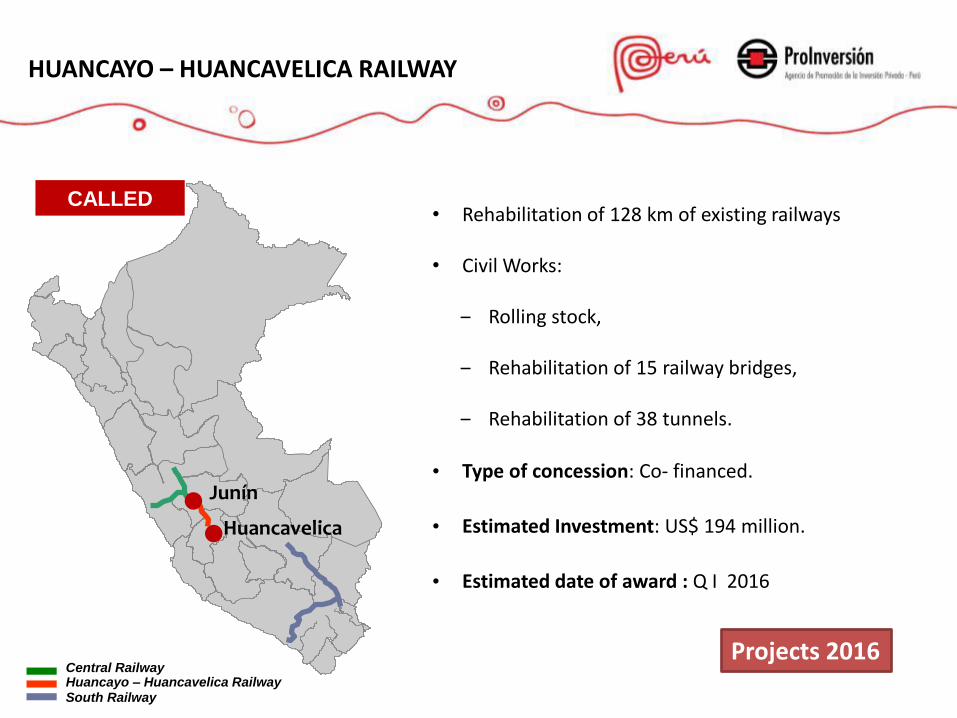
• Rehabilitation of 128 km of existing railways
• Civil Works:
‒ Rolling stock,
‒ Rehabilitation of 15 railway bridges,
‒ Rehabilitation of 38 tunnels.
• Type of concession: Co- financed.
• Estimated Investment: US$ 194 million.
• Estimated date of award : Q I 2016
HUANCAYO – HUANCAVELICA RAILWAY
Junín
Central Railway Huancayo – Huancavelica Railway South Railway
Huancavelica
CALLED
Projects 2016
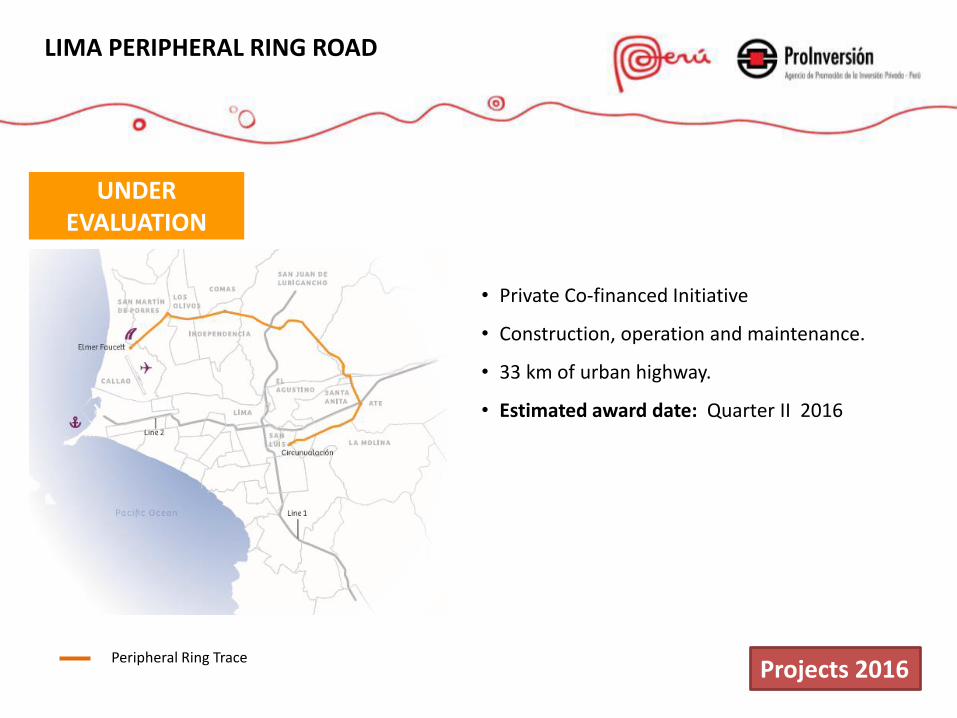
LIMA PERIPHERAL RING ROAD
• Private Co-financed Initiative
• Construction, operation and maintenance.
• 33 km of urban highway.
• Estimated award date: Quarter II 2016
UNDER EVALUATION
Peripheral Ring Trace Projects 2016
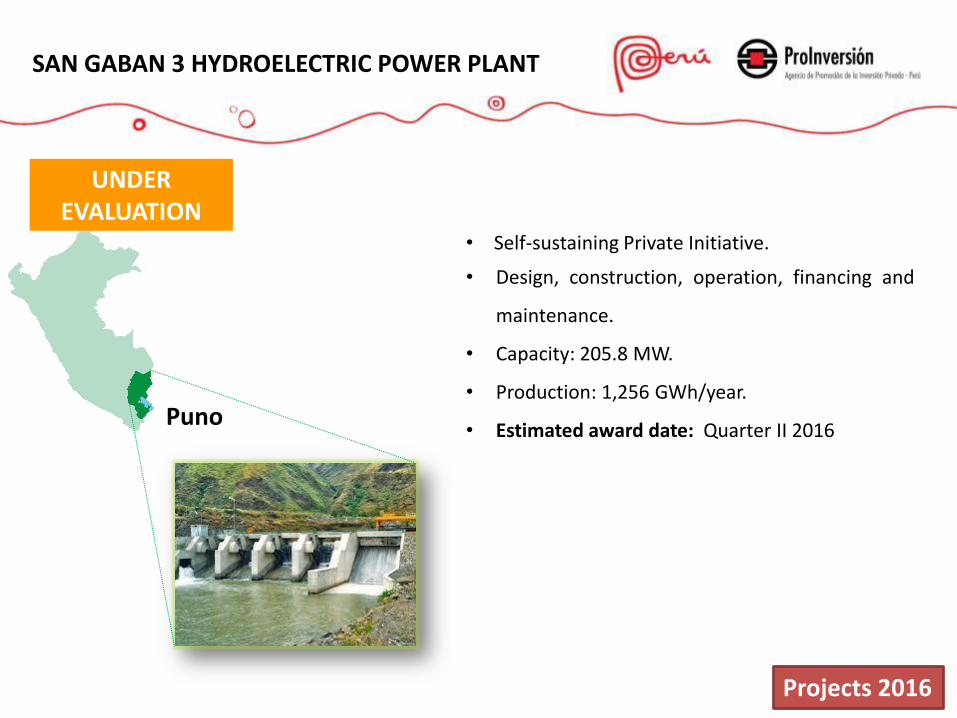
• Self-sustaining Private Initiative.
• Design, construction, operation, financing and
maintenance.
• Capacity: 205.8 MW.
• Production: 1,256 GWh/year.
• Estimated award date: Quarter II 2016 Puno
UNDER EVALUATION
SAN GABAN 3 HYDROELECTRIC POWER PLANT
Projects 2016
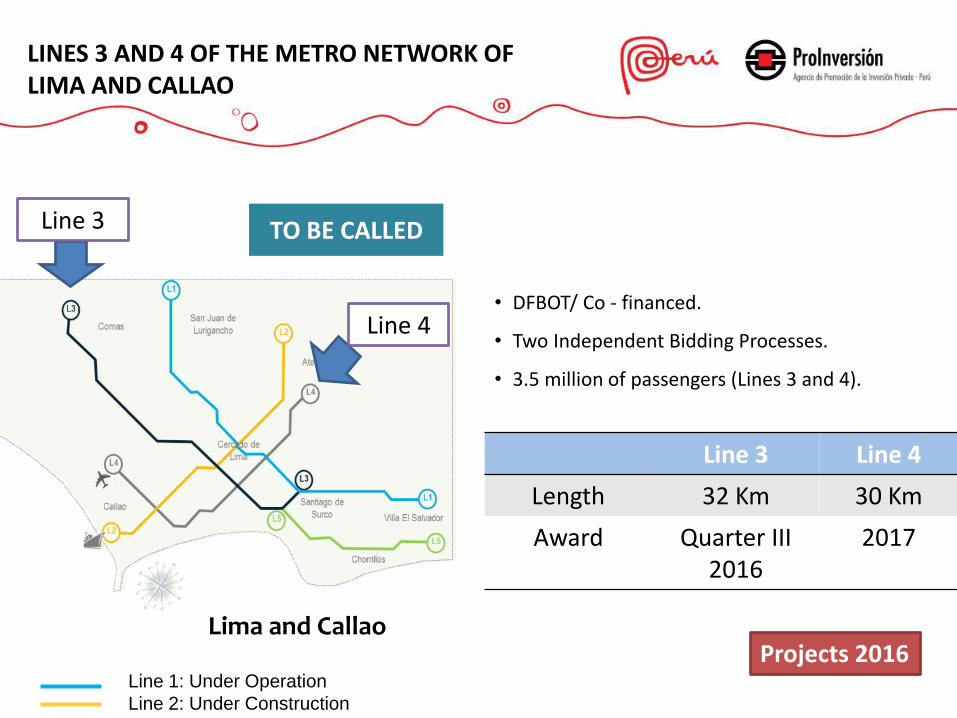
• DFBOT/ Co - financed.
• Two Independent Bidding Processes.
• 3.5 million of passengers (Lines 3 and 4).
Line 3 Line 4
Length 32 Km 30 Km
Award Quarter III 2016
2017
Lima and Callao
Line 1: Under Operation
Line 2: Under Construction
Line 4
Line 3
LINES 3 AND 4 OF THE METRO NETWORK OF LIMA AND CALLAO
TO BE CALLED
Projects 2016
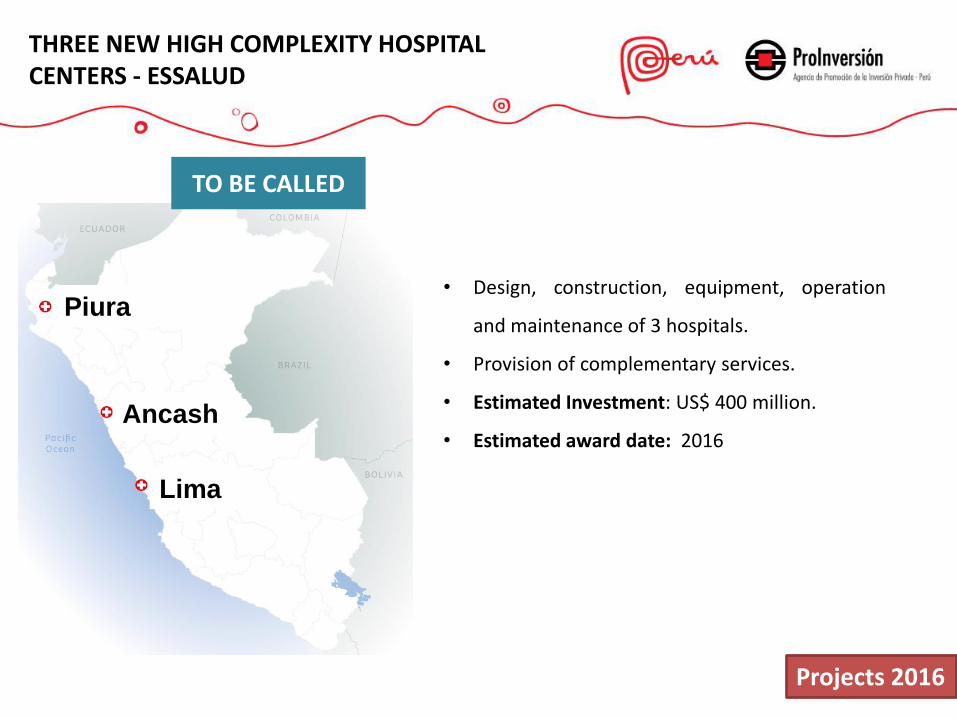
• Design, construction, equipment, operation
and maintenance of 3 hospitals.
• Provision of complementary services.
• Estimated Investment: US$ 400 million.
• Estimated award date: 2016
Piura
Ancash
Lima
THREE NEW HIGH COMPLEXITY HOSPITAL CENTERS - ESSALUD
Projects 2016
TO BE CALLED
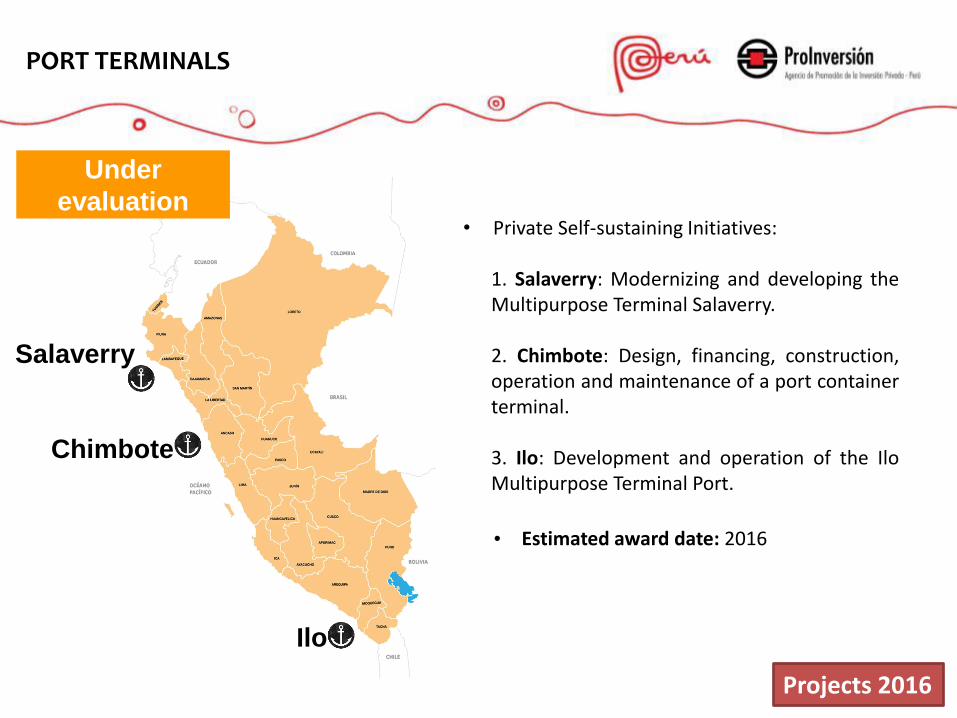
PORT TERMINALS
• Private Self-sustaining Initiatives:
1. Salaverry: Modernizing and developing the Multipurpose Terminal Salaverry. 2. Chimbote: Design, financing, construction, operation and maintenance of a port container terminal. 3. Ilo: Development and operation of the Ilo Multipurpose Terminal Port.
Under
evaluation
• Estimated award date: 2016
Ilo
Chimbote
Salaverry
Projects 2016