Embed Size (px)
Citation preview
1
Photoacoustic imaging of voltage responses beyond the optical diffusion limit
Authors: Bin Rao+, Ruiying Zhang+, Lei Li, Jin-Yu Shao, Lihong V. Wang*
+These authors contributed equally to this work
*Corresponding author
Affiliations:
Biomedical Engineering Department, Washington University of Saint Louis MO
Saint Louis MO 63130 USA
Email addresses of authors:
Bin Rao ([email protected]), Ruiying Zhang ([email protected]), Lei
Li (mailto:[email protected]), Jin-Yu Shao ([email protected]), Lihong V. Wang
Corresponding author: Lihong V. Wang. Present address: Departments of
Medical Engineering and Electrical Engineering, California Institute of
Technology, MC 138-78, 1200 E. California Blvd., Pasadena, CA 91125. Phone:
(626) 395-1959; Fax: (626) 395-1347; Email: [email protected].
2
SUPPLEMENTARY INFORMATION
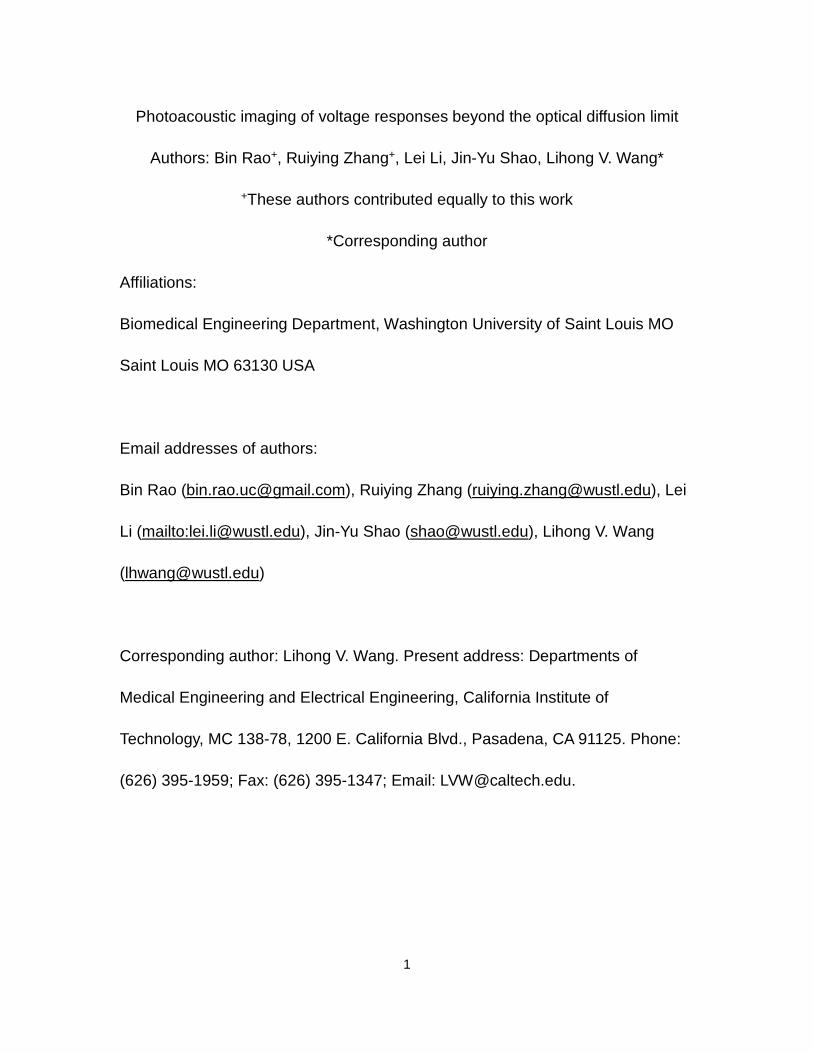
I. Animal preparation
Adult Swiss Webster (Hsd:ND4) mice were used for all in vivo imaging experiments.
During the surgery, the mouse was first secured using a tooth bar on a platform
and maintained under anesthesia with 1.5–2.0% vaporized isoflurane. The scalp
was removed, then cyanoacrylate glue was applied to the gap between the back
of the mouse’s head and an aluminum plate with a “U” shaped dent, as shown in
figure 1s. Because the plate was secured to the platform, motions of the mouse
head relative to the imaging setup were avoided. A 3 mm by 3 mm cranial window
was then created on the mouse skull with dental drill, and the isoflurane level was
decreased to ~0.5% after this preparatory surgery. For electrical stimulation
experiments, stimulation electrodes were inserted at the edge of the cranial
window and fixed on the skull surface with cyanoacrylate glue. For 4-
Aminopyridine (4-AP) drug stimulation experiments, direct injection of 4-AP in the
neocortex layer within the cranial window was used to induce epilepsy. First, 20
µM of DPA dye was injected into the cranial window, and allowed to stain the
cranium for 20 minutes before imaging. After the imaging procedures, the animal
was euthanized. All experimental procedures were carried out in conformance with
laboratory animal protocols approved by the Animal Studies Committee at
Washington University in St. Louis.
3
Figure s1. Schematic of animal preparation
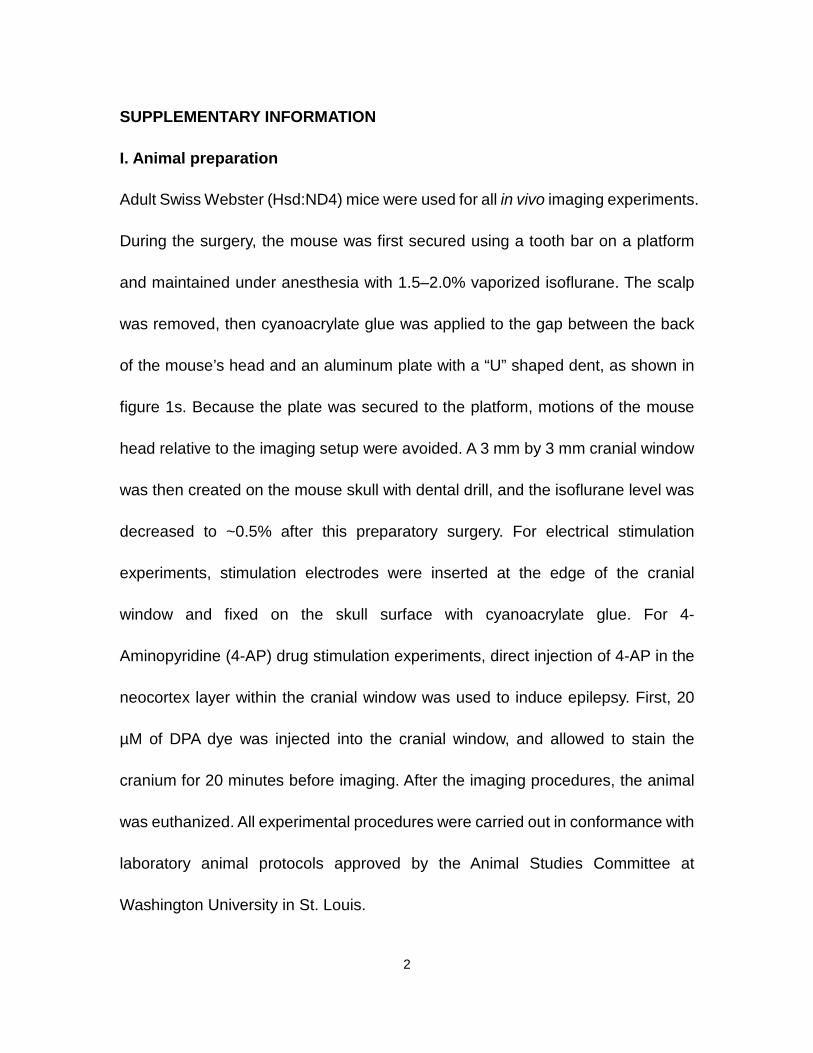
II. Experimental setup for in vitro photoacoustic cell membrane potential
imaging
Figure s2. Experimental setup for in vitro photoacoustic cell membrane potential imaging
A transmission-mode optical-resolution photoacoustic microscope, as shown in
figure s2, was used for in vitro voltage imaging of the HEK-293 cell membranes.
In figure s2, an integrated diode-pumped Q-switched laser and optical parametric
oscillator (OPO) system (NT242-SH, Ekspla) generate laser pulses (5 ns pulse
4
width, 1 kHz pulse repetition rate) at 488 nm. The laser pulse is expanded and
then focused by a 4x objective (Zeiss, 0.1 NA). The focused laser light induces an
abrupt temperature rise in an illuminated absorber and excites photoacoustic
waves, which are acoustically coupled by deionized water and detected by an
ultrasonic transducer. The photoacoustic signal is amplified, digitized, and
recorded. By raster scanning the sample with an X-Y scanning stage, a three-
dimensional image of the sample is formed. A depth-encoded maximum-
amplitude projection (MAP) image of the 3D data set shows the image in 2D format.
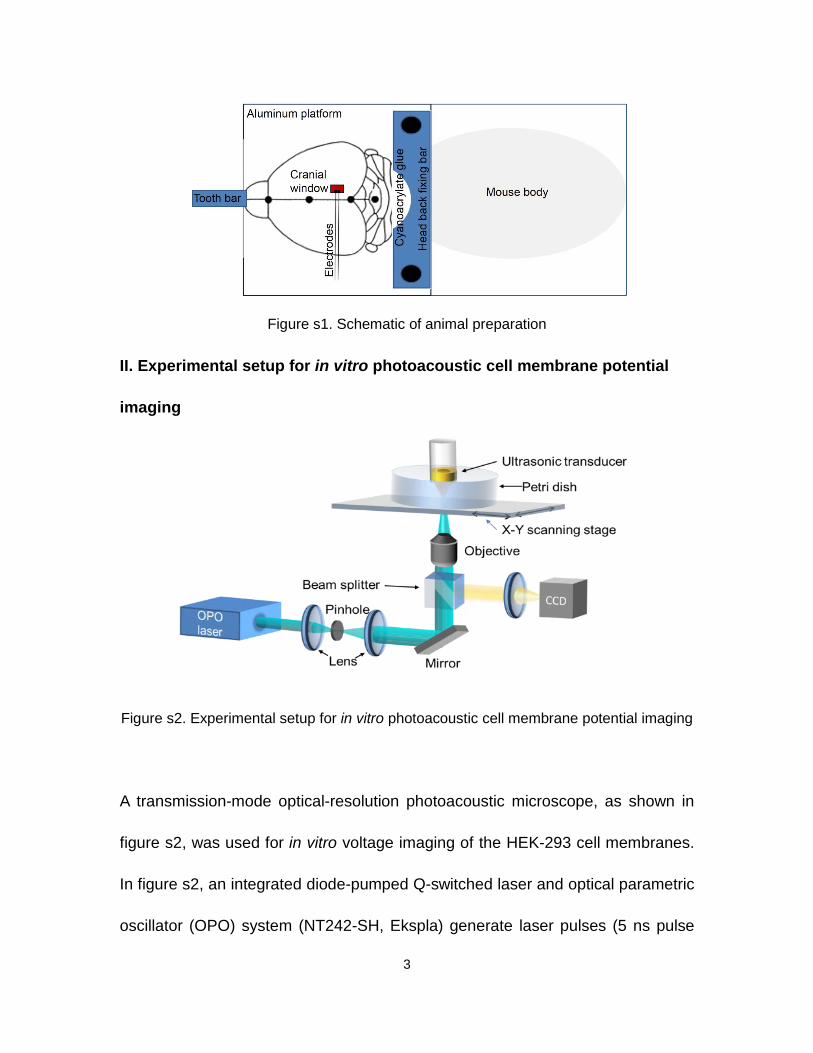
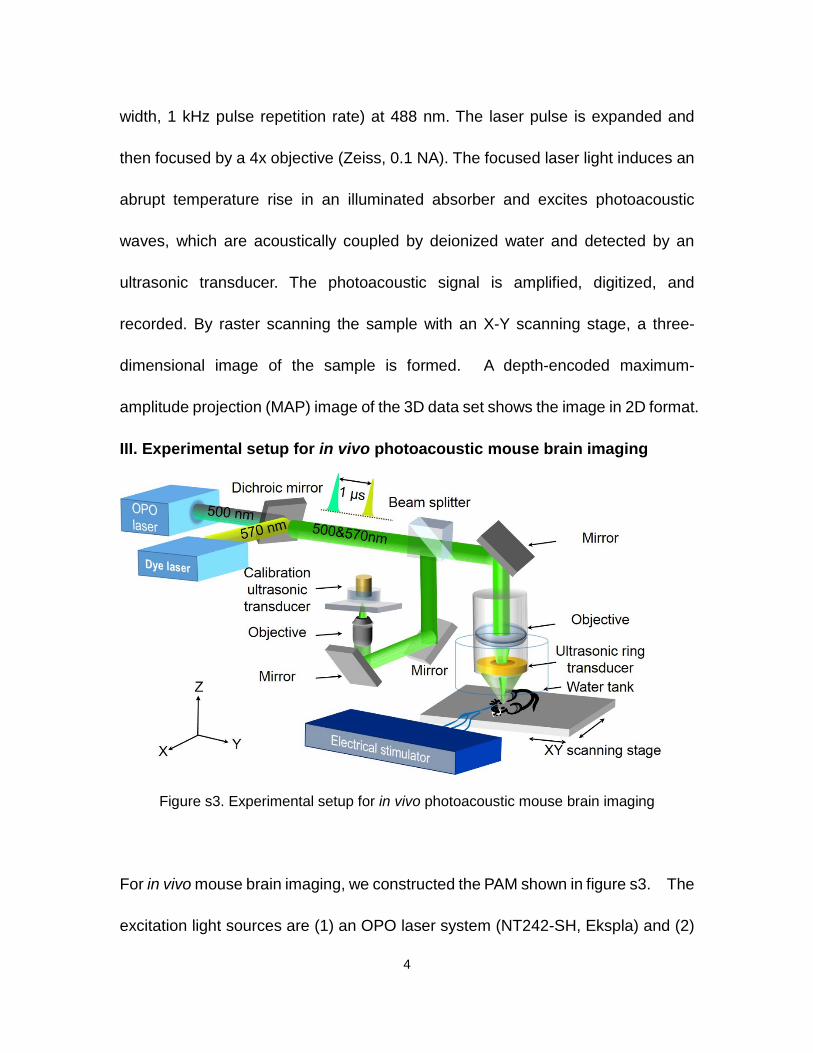
III. Experimental setup for in vivo photoacoustic mouse brain imaging
Figure s3. Experimental setup for in vivo photoacoustic mouse brain imaging
For in vivo mouse brain imaging, we constructed the PAM shown in figure s3. The
excitation light sources are (1) an OPO laser system (NT242-SH, Ekspla) and (2)
5
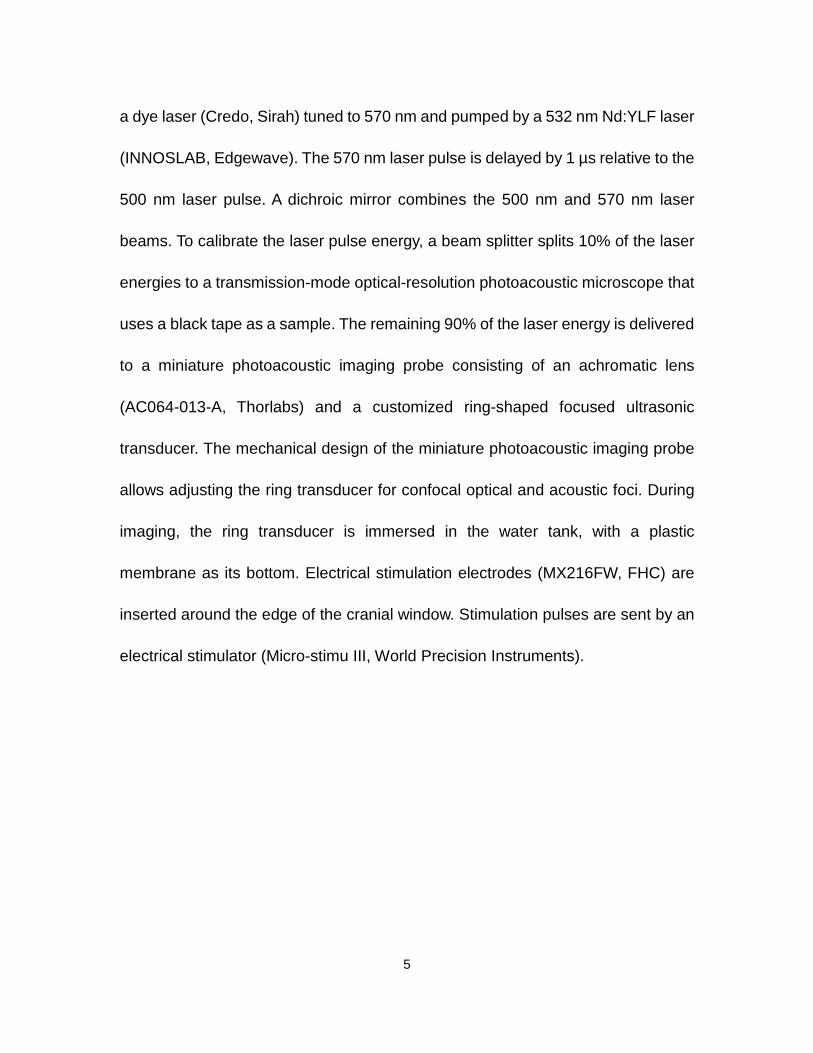
a dye laser (Credo, Sirah) tuned to 570 nm and pumped by a 532 nm Nd:YLF laser
(INNOSLAB, Edgewave). The 570 nm laser pulse is delayed by 1 µs relative to the
500 nm laser pulse. A dichroic mirror combines the 500 nm and 570 nm laser
beams. To calibrate the laser pulse energy, a beam splitter splits 10% of the laser
energies to a transmission-mode optical-resolution photoacoustic microscope that
uses a black tape as a sample. The remaining 90% of the laser energy is delivered
to a miniature photoacoustic imaging probe consisting of an achromatic lens
(AC064-013-A, Thorlabs) and a customized ring-shaped focused ultrasonic
transducer. The mechanical design of the miniature photoacoustic imaging probe
allows adjusting the ring transducer for confocal optical and acoustic foci. During
imaging, the ring transducer is immersed in the water tank, with a plastic
membrane as its bottom. Electrical stimulation electrodes (MX216FW, FHC) are
inserted around the edge of the cranial window. Stimulation pulses are sent by an
electrical stimulator (Micro-stimu III, World Precision Instruments).
6
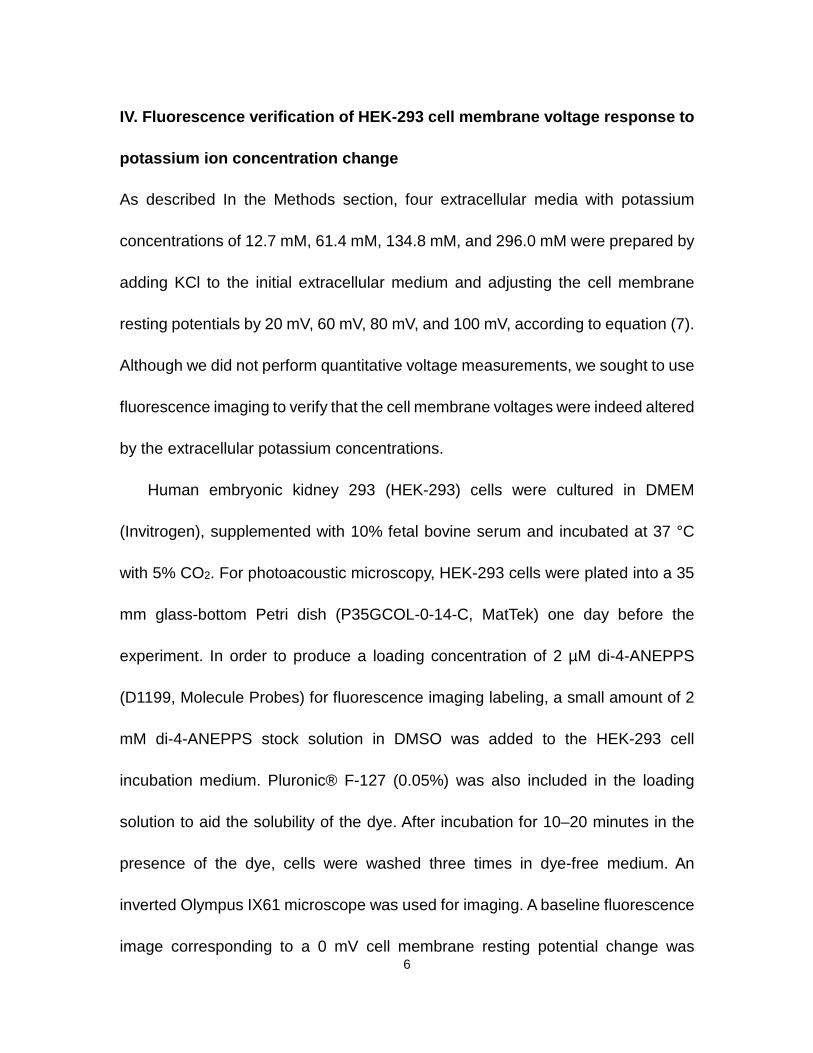
IV. Fluorescence verification of HEK-293 cell membrane voltage response to
potassium ion concentration change
As described In the Methods section, four extracellular media with potassium
concentrations of 12.7 mM, 61.4 mM, 134.8 mM, and 296.0 mM were prepared by
adding KCl to the initial extracellular medium and adjusting the cell membrane
resting potentials by 20 mV, 60 mV, 80 mV, and 100 mV, according to equation (7).
Although we did not perform quantitative voltage measurements, we sought to use
fluorescence imaging to verify that the cell membrane voltages were indeed altered
by the extracellular potassium concentrations.
Human embryonic kidney 293 (HEK-293) cells were cultured in DMEM
(Invitrogen), supplemented with 10% fetal bovine serum and incubated at 37 °C
with 5% CO2. For photoacoustic microscopy, HEK-293 cells were plated into a 35
mm glass-bottom Petri dish (P35GCOL-0-14-C, MatTek) one day before the
experiment. In order to produce a loading concentration of 2 µM di-4-ANEPPS
(D1199, Molecule Probes) for fluorescence imaging labeling, a small amount of 2
mM di-4-ANEPPS stock solution in DMSO was added to the HEK-293 cell
incubation medium. Pluronic® F-127 (0.05%) was also included in the loading
solution to aid the solubility of the dye. After incubation for 10–20 minutes in the
presence of the dye, cells were washed three times in dye-free medium. An
inverted Olympus IX61 microscope was used for imaging. A baseline fluorescence
image corresponding to a 0 mV cell membrane resting potential change was
7
acquired with the initial extracellular medium. Then the medium was sequentially
replaced by extracellular media with potassium concentrations of 12.7 mM, 61.4
mM, 134.8 mM, and 296 mM, and immediately imaged after each replacement.
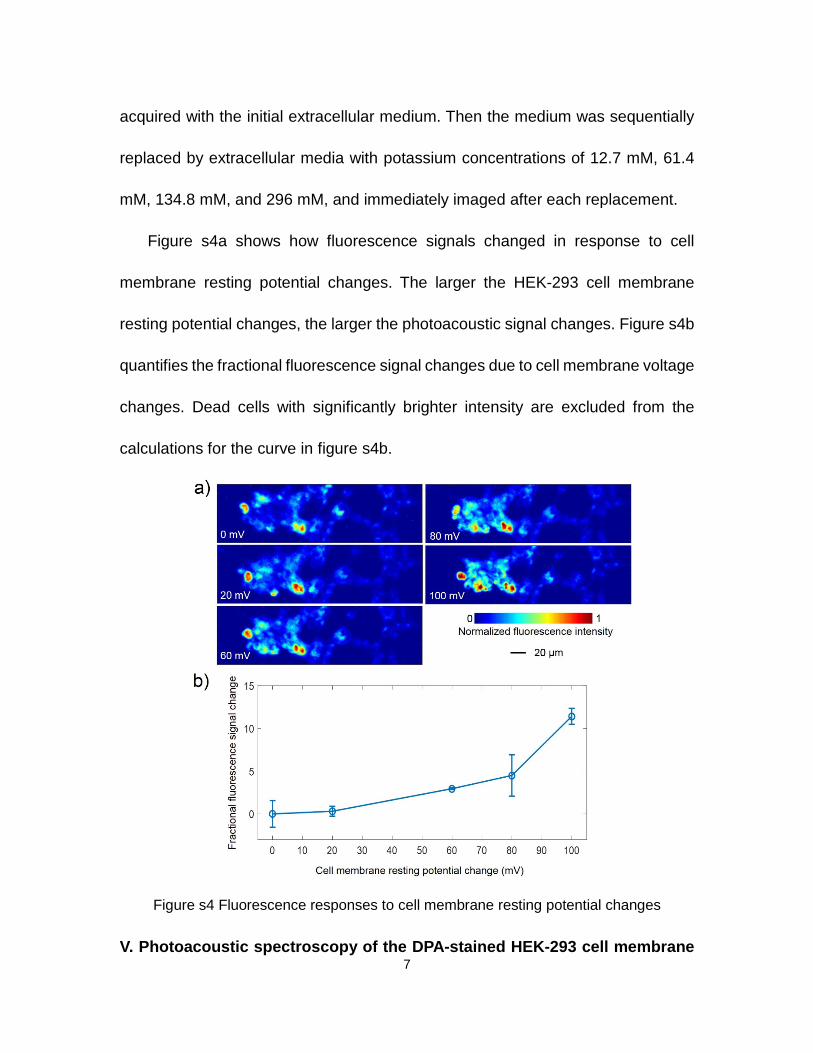
Figure s4a shows how fluorescence signals changed in response to cell
membrane resting potential changes. The larger the HEK-293 cell membrane
resting potential changes, the larger the photoacoustic signal changes. Figure s4b
quantifies the fractional fluorescence signal changes due to cell membrane voltage
changes. Dead cells with significantly brighter intensity are excluded from the
calculations for the curve in figure s4b.
Figure s4 Fluorescence responses to cell membrane resting potential changes
V. Photoacoustic spectroscopy of the DPA-stained HEK-293 cell membrane
8
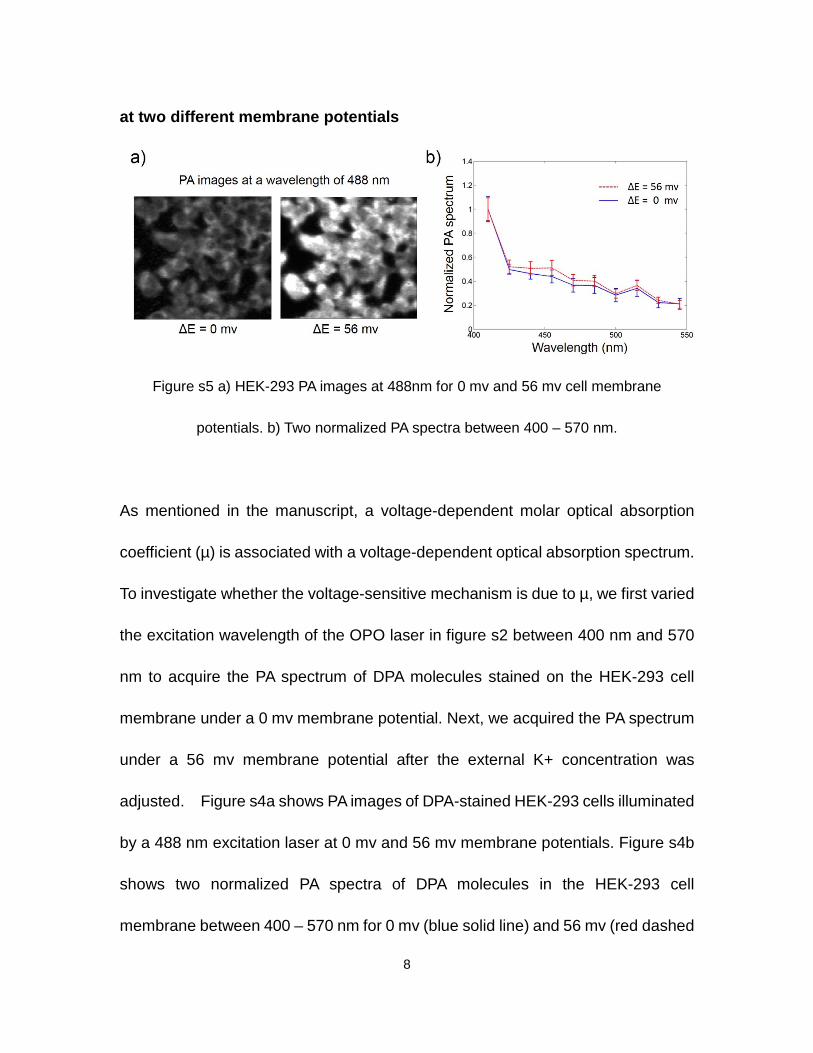
at two different membrane potentials
Figure s5 a) HEK-293 PA images at 488nm for 0 mv and 56 mv cell membrane
potentials. b) Two normalized PA spectra between 400 – 570 nm.
As mentioned in the manuscript, a voltage-dependent molar optical absorption
coefficient (µ) is associated with a voltage-dependent optical absorption spectrum.
To investigate whether the voltage-sensitive mechanism is due to µ, we first varied
the excitation wavelength of the OPO laser in figure s2 between 400 nm and 570
nm to acquire the PA spectrum of DPA molecules stained on the HEK-293 cell
membrane under a 0 mv membrane potential. Next, we acquired the PA spectrum
under a 56 mv membrane potential after the external K+ concentration was
adjusted. Figure s4a shows PA images of DPA-stained HEK-293 cells illuminated
by a 488 nm excitation laser at 0 mv and 56 mv membrane potentials. Figure s4b
shows two normalized PA spectra of DPA molecules in the HEK-293 cell
membrane between 400 – 570 nm for 0 mv (blue solid line) and 56 mv (red dashed
9
line) cell membrane potentials. The error bars identify the standard deviation of the
measurements. Statistically, we conclude that the normalized PA absorption
spectrum remains unchanged when the two different membrane potentials are
applied.
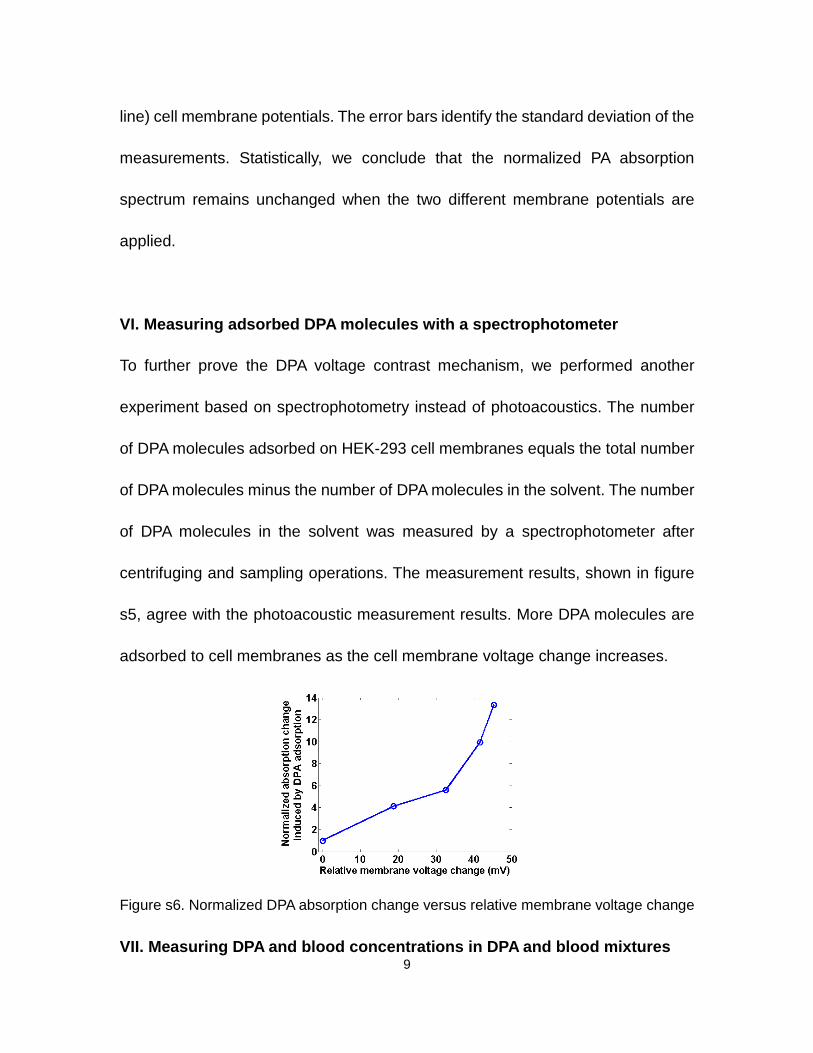
VI. Measuring adsorbed DPA molecules with a spectrophotometer
To further prove the DPA voltage contrast mechanism, we performed another
experiment based on spectrophotometry instead of photoacoustics. The number
of DPA molecules adsorbed on HEK-293 cell membranes equals the total number
of DPA molecules minus the number of DPA molecules in the solvent. The number
of DPA molecules in the solvent was measured by a spectrophotometer after
centrifuging and sampling operations. The measurement results, shown in figure
s5, agree with the photoacoustic measurement results. More DPA molecules are
adsorbed to cell membranes as the cell membrane voltage change increases.
Figure s6. Normalized DPA absorption change versus relative membrane voltage change
VII. Measuring DPA and blood concentrations in DPA and blood mixtures
10
For in vivo experiments, 20 µM DPA was used to stain a mouse brain through a
cranial window. However, the effective DPA concentration on the brain surface was
significantly higher than 20 µM because of the strong adsorption of DPA by the
lipid membrane. To estimate the effective DPA concentration in the lipid membrane,
the ratio of the PA signal from 1 mM DPA dye and the PA signal from the lipid
membrane of HEK-293 cells stained with 20 µM DPA was measured as 8.3. Thus,
the effective DPA concentration of the 20 µM DPA stained lipid membrane was 1 /
8.3 = 0.12 mM. Next, we performed phantom experiments to test our method for
separating DPA and hemoglobin signals.
A 20 mM DPA solution was purchased from Biotium Inc. Lysed bovine blood
was purchased from QuadFive.com. DPA and blood mixture phantoms were made
by mixing varied concentrations of DPA in a diluted lysed blood solution and
injecting it into a laboratory tube (CAT. No. 508-001, Dow Corning) with a 0.3 mm
inner diameter and 0.64 mm outer diameter. The DPA molar concentrations and
blood volume concentrations for the two groups of phantoms are shown in Table
1.
11
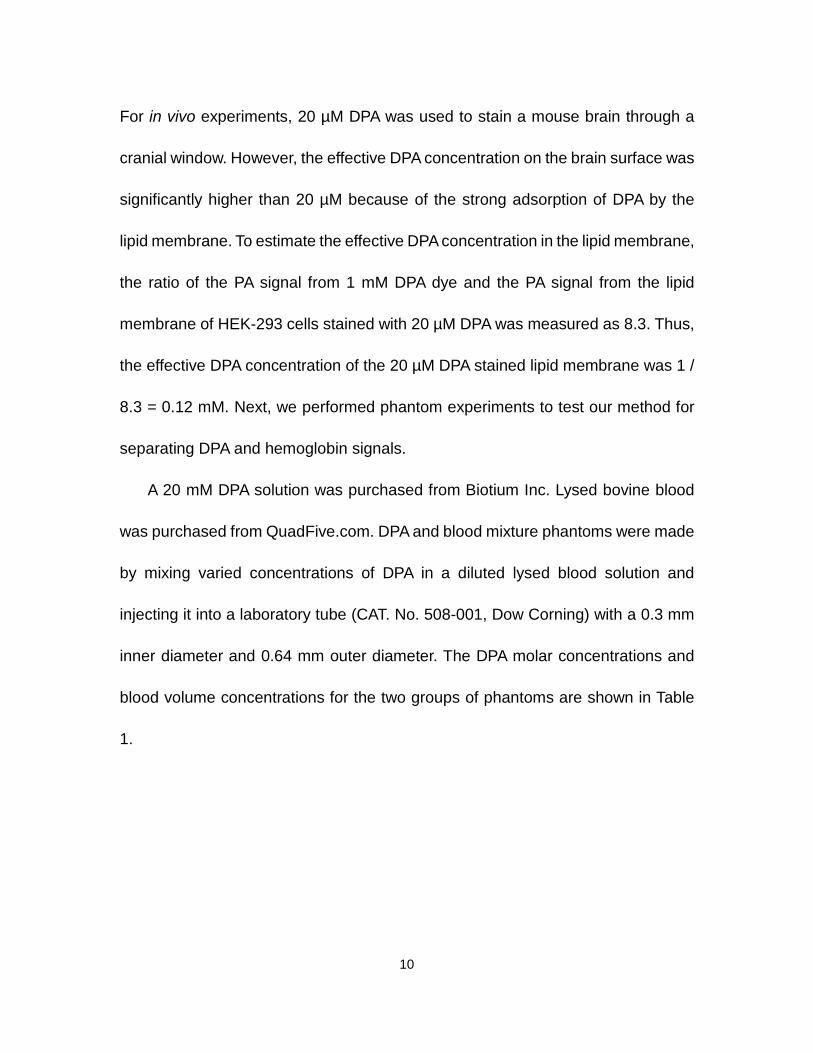
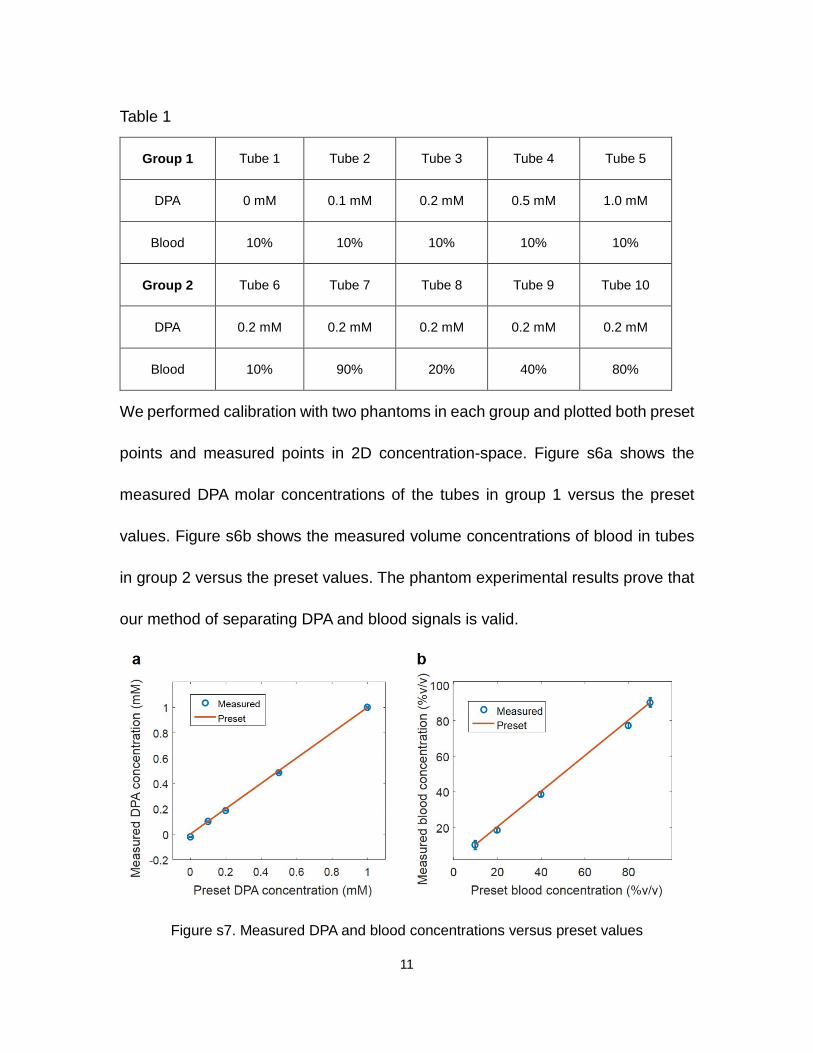
Table 1
Group 1 Tube 1 Tube 2 Tube 3 Tube 4 Tube 5
DPA 0 mM 0.1 mM 0.2 mM 0.5 mM 1.0 mM
Blood 10% 10% 10% 10% 10%
Group 2 Tube 6 Tube 7 Tube 8 Tube 9 Tube 10
DPA 0.2 mM 0.2 mM 0.2 mM 0.2 mM 0.2 mM
Blood 10% 90% 20% 40% 80%
We performed calibration with two phantoms in each group and plotted both preset
points and measured points in 2D concentration-space. Figure s6a shows the
measured DPA molar concentrations of the tubes in group 1 versus the preset
values. Figure s6b shows the measured volume concentrations of blood in tubes
in group 2 versus the preset values. The phantom experimental results prove that
our method of separating DPA and blood signals is valid.
Figure s7. Measured DPA and blood concentrations versus preset values
12
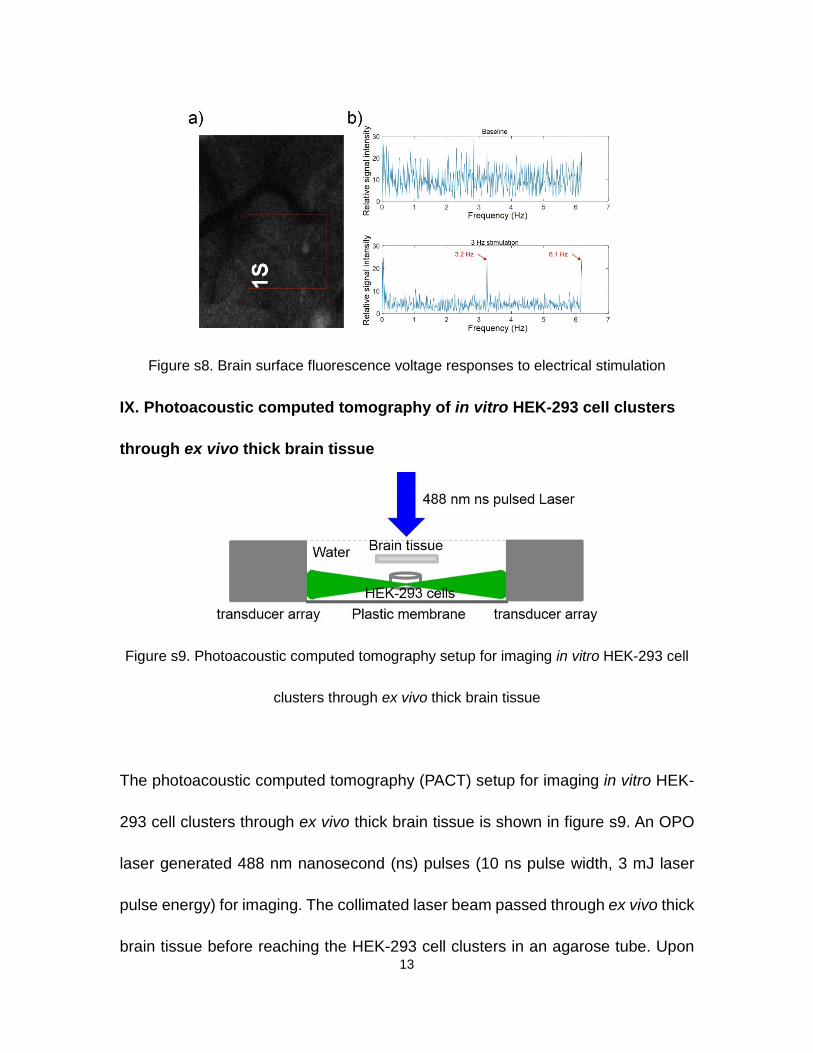
VIII. Fluorescence verification of in vivo mouse brain surface voltage
response to electrical stimulation
A fluorescence voltage dye (di-4-ANEPPS) and an upright Olympus BX61W1
microscope were used to verify the in vivo mouse brain surface voltage response
to electrical stimulation. Animal preparation is detailed in SI, section I. After the
creation of a cranial window, the animal brain surface within the cranial window
was stained with a 20 µM Di-4-ANEPPS loading solution for 15 minutes. The
loading solution contained 0.05% Pluronic® F-127. An area of 136 µm by 153 µm
within the red window (1S) in figure s8a was scanned at 12.32 frames per second
before and during the electrical stimulation sequence shown in figure 2a. The
excitation laser wavelength was 488 nm. The fluorescence signals were integrated
for each frame and analyzed in the frequency domain. The top figure of figure s8b
shows the baseline signal in the frequency domain, and the bottom figure shows
two voltage response peaks at 3.2 Hz and 6.1 Hz in response to the electrical
stimulation.
13
Figure s8. Brain surface fluorescence voltage responses to electrical stimulation
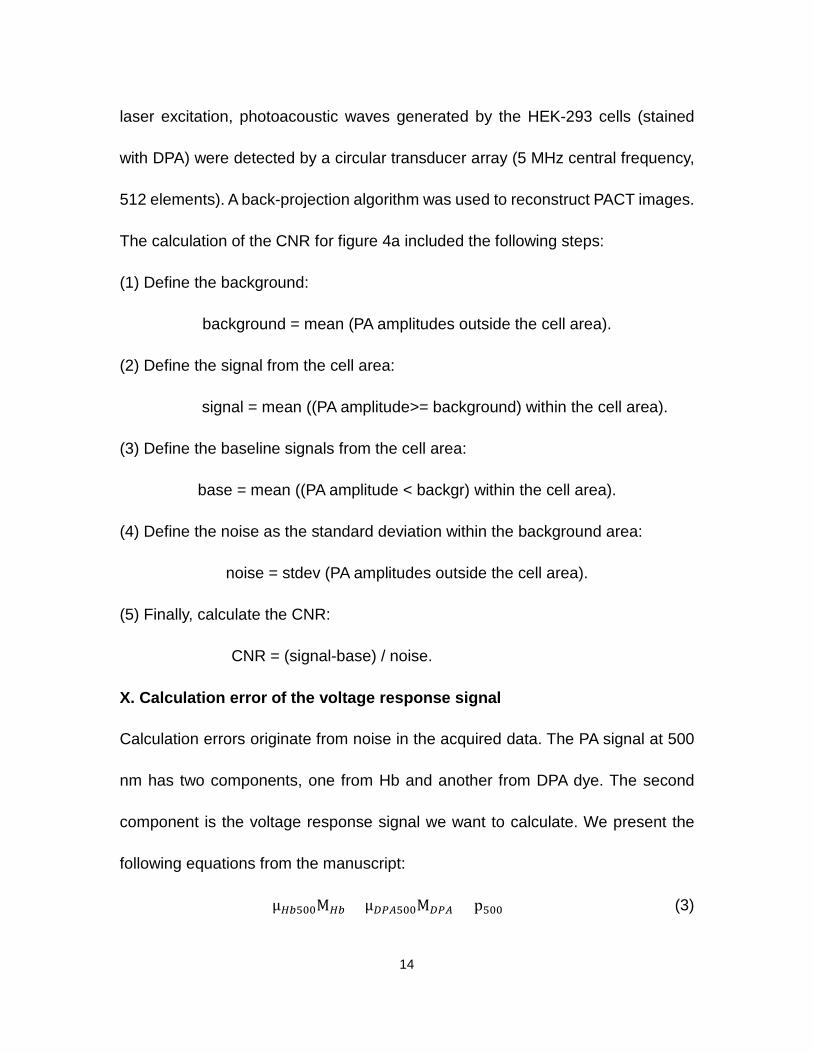
IX. Photoacoustic computed tomography of in vitro HEK-293 cell clusters
through ex vivo thick brain tissue
Figure s9. Photoacoustic computed tomography setup for imaging in vitro HEK-293 cell
clusters through ex vivo thick brain tissue
The photoacoustic computed tomography (PACT) setup for imaging in vitro HEK-
293 cell clusters through ex vivo thick brain tissue is shown in figure s9. An OPO
laser generated 488 nm nanosecond (ns) pulses (10 ns pulse width, 3 mJ laser
pulse energy) for imaging. The collimated laser beam passed through ex vivo thick
brain tissue before reaching the HEK-293 cell clusters in an agarose tube. Upon
14
laser excitation, photoacoustic waves generated by the HEK-293 cells (stained
with DPA) were detected by a circular transducer array (5 MHz central frequency,
512 elements). A back-projection algorithm was used to reconstruct PACT images.
The calculation of the CNR for figure 4a included the following steps:
(1) Define the background:
background = mean (PA amplitudes outside the cell area).
(2) Define the signal from the cell area:
signal = mean ((PA amplitude>= background) within the cell area).
(3) Define the baseline signals from the cell area:
base = mean ((PA amplitude < backgr) within the cell area).
(4) Define the noise as the standard deviation within the background area:
noise = stdev (PA amplitudes outside the cell area).
(5) Finally, calculate the CNR:
CNR = (signal-base) / noise.
X. Calculation error of the voltage response signal
Calculation errors originate from noise in the acquired data. The PA signal at 500
nm has two components, one from Hb and another from DPA dye. The second
component is the voltage response signal we want to calculate. We present the
following equations from the manuscript:
µ𝐻𝐻𝐻𝐻500M𝐻𝐻𝐻𝐻 + µ𝐷𝐷𝐷𝐷𝐷𝐷500M𝐷𝐷𝐷𝐷𝐷𝐷 = p500 (3)
15
M𝐷𝐷𝐷𝐷𝐷𝐷 = (p570 −µ𝐻𝐻𝐻𝐻570µ𝐻𝐻𝐻𝐻500
p500)/ �µ𝐷𝐷𝐷𝐷𝐷𝐷570 −µ𝐻𝐻𝐻𝐻570µ𝐻𝐻𝐻𝐻500
µ𝐷𝐷𝐷𝐷𝐷𝐷500� (5)
We can calculate the voltage response signal as
µ𝐷𝐷𝐷𝐷𝐷𝐷500M𝐷𝐷𝐷𝐷𝐷𝐷 =
µ𝐻𝐻𝐻𝐻570µ𝐻𝐻𝐻𝐻500
p500 − p570µ𝐻𝐻𝐻𝐻570µ𝐻𝐻𝐻𝐻500
µ𝐷𝐷𝐷𝐷𝐷𝐷500µ𝐷𝐷𝐷𝐷𝐷𝐷570
− 1×µ𝐷𝐷𝐷𝐷𝐷𝐷500µ𝐷𝐷𝐷𝐷𝐷𝐷570
From the known absorption curves of DPA and Hb, we calculated µ𝐻𝐻𝐻𝐻570µ𝐻𝐻𝐻𝐻500
as
2.143 and µ𝐷𝐷𝐷𝐷𝐷𝐷500µ𝐷𝐷𝐷𝐷𝐷𝐷570
as 19.8.
Thus,
µ𝐷𝐷𝐷𝐷𝐷𝐷500M𝐷𝐷𝐷𝐷𝐷𝐷 = 1.024 × p500 − 0.478 × p570
So the error of the voltage response signal 𝐸𝐸𝐸𝐸𝐸𝐸𝐸𝐸𝐸𝐸(µ𝐷𝐷𝐷𝐷𝐷𝐷500M𝐷𝐷𝐷𝐷𝐷𝐷) is
𝐸𝐸𝐸𝐸𝐸𝐸𝐸𝐸𝐸𝐸(µ𝐷𝐷𝐷𝐷𝐷𝐷500M𝐷𝐷𝐷𝐷𝐷𝐷) = 1.024 × 𝐸𝐸𝐸𝐸𝐸𝐸𝐸𝐸𝐸𝐸(p500) − 0.478 × 𝐸𝐸𝐸𝐸𝐸𝐸𝐸𝐸𝐸𝐸(p570)
|𝐸𝐸𝐸𝐸𝐸𝐸𝐸𝐸𝐸𝐸(µ𝐷𝐷𝐷𝐷𝐷𝐷500M𝐷𝐷𝐷𝐷𝐷𝐷)| ≤ 1.5 × |𝐸𝐸𝐸𝐸𝐸𝐸𝐸𝐸𝐸𝐸(p)|
Thus, the absolute calculation error of the voltage response signal is less than 1.5
times the noise of the PA imaging system.
16
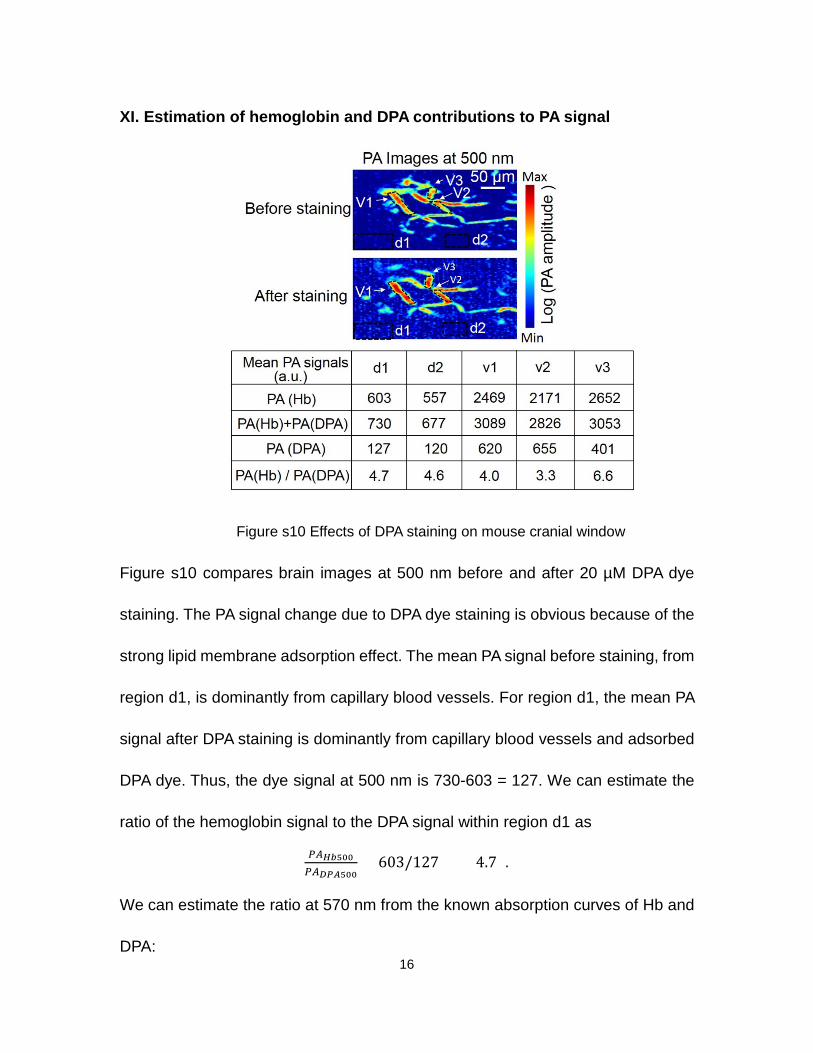
XI. Estimation of hemoglobin and DPA contributions to PA signal
Figure s10 Effects of DPA staining on mouse cranial window
Figure s10 compares brain images at 500 nm before and after 20 µM DPA dye
staining. The PA signal change due to DPA dye staining is obvious because of the
strong lipid membrane adsorption effect. The mean PA signal before staining, from
region d1, is dominantly from capillary blood vessels. For region d1, the mean PA
signal after DPA staining is dominantly from capillary blood vessels and adsorbed
DPA dye. Thus, the dye signal at 500 nm is 730-603 = 127. We can estimate the
ratio of the hemoglobin signal to the DPA signal within region d1 as
𝐷𝐷𝐷𝐷𝐻𝐻𝐻𝐻500𝐷𝐷𝐷𝐷𝐷𝐷𝐷𝐷𝐷𝐷500
= 603/127 = 4.7 .
We can estimate the ratio at 570 nm from the known absorption curves of Hb and
DPA:
17
𝑃𝑃𝑃𝑃𝐻𝐻𝐻𝐻570𝑃𝑃𝑃𝑃𝐷𝐷𝐷𝐷𝐷𝐷570
=𝑃𝑃𝑃𝑃𝐻𝐻𝐻𝐻570𝑃𝑃𝑃𝑃𝐻𝐻𝐻𝐻500
×𝑃𝑃𝑃𝑃𝐻𝐻𝐻𝐻500𝑃𝑃𝑃𝑃𝐷𝐷𝐷𝐷𝐷𝐷500
×𝑃𝑃𝑃𝑃𝐷𝐷𝐷𝐷𝐷𝐷500𝑃𝑃𝑃𝑃𝐷𝐷𝐷𝐷𝐷𝐷570
𝑃𝑃𝑃𝑃𝐻𝐻𝐻𝐻570𝑃𝑃𝑃𝑃𝐷𝐷𝐷𝐷𝐷𝐷570
=µ𝑎𝑎𝐻𝐻𝐻𝐻570µ𝑎𝑎𝐻𝐻𝐻𝐻500
×𝑃𝑃𝑃𝑃𝐻𝐻𝐻𝐻500𝑃𝑃𝑃𝑃𝐷𝐷𝐷𝐷𝐷𝐷500
×µ𝑎𝑎𝐷𝐷𝐷𝐷𝐷𝐷500µ𝑎𝑎𝐷𝐷𝐷𝐷𝐷𝐷570
= 2.143 ∗ 4.7 ∗ 19.8 = 200
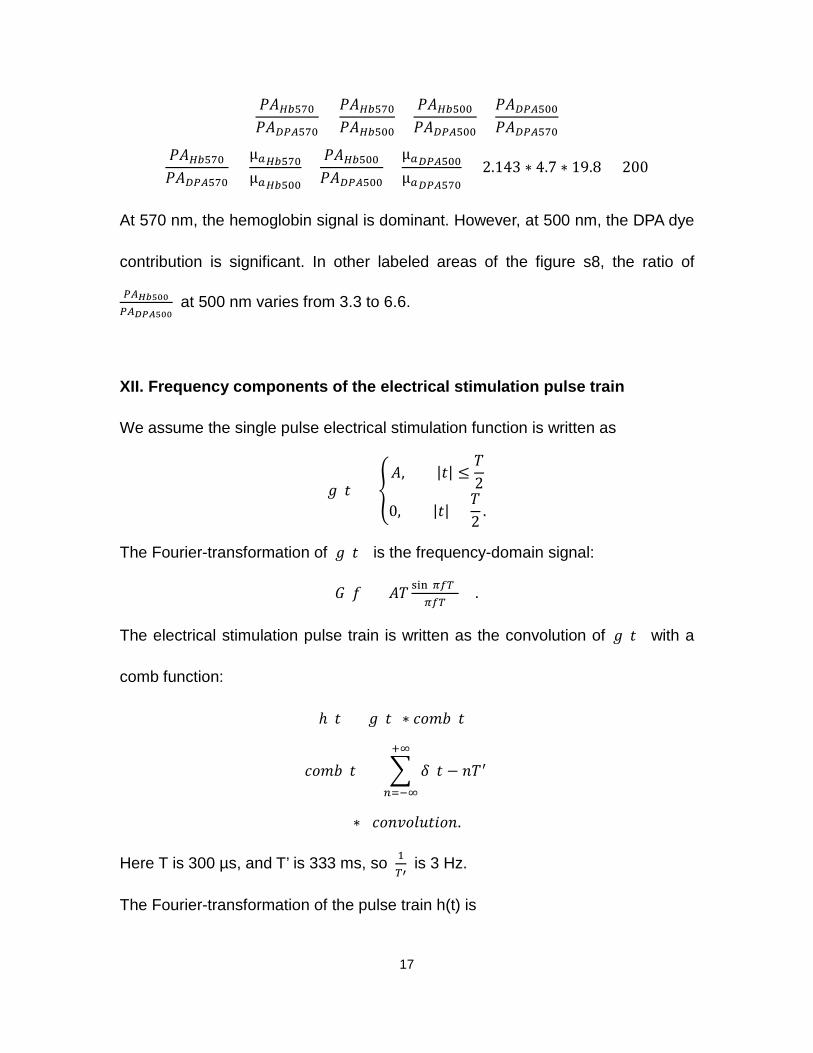
At 570 nm, the hemoglobin signal is dominant. However, at 500 nm, the DPA dye
contribution is significant. In other labeled areas of the figure s8, the ratio of
𝐷𝐷𝐷𝐷𝐻𝐻𝐻𝐻500𝐷𝐷𝐷𝐷𝐷𝐷𝐷𝐷𝐷𝐷500
at 500 nm varies from 3.3 to 6.6.
XII. Frequency components of the electrical stimulation pulse train
We assume the single pulse electrical stimulation function is written as
𝑔𝑔(𝑡𝑡) = �𝑃𝑃, |𝑡𝑡| ≤
𝑇𝑇2
0, |𝑡𝑡| >𝑇𝑇2
.
The Fourier-transformation of 𝑔𝑔(𝑡𝑡) is the frequency-domain signal:
𝐺𝐺(𝑓𝑓) = 𝑃𝑃𝑇𝑇 sin (𝜋𝜋𝜋𝜋𝜋𝜋)𝜋𝜋𝜋𝜋𝜋𝜋
.
The electrical stimulation pulse train is written as the convolution of 𝑔𝑔(𝑡𝑡) with a
comb function:
ℎ(𝑡𝑡) = 𝑔𝑔(𝑡𝑡) ∗ 𝑐𝑐𝐸𝐸𝑐𝑐𝑐𝑐(𝑡𝑡)
𝑐𝑐𝐸𝐸𝑐𝑐𝑐𝑐(𝑡𝑡) = � 𝛿𝛿(𝑡𝑡 − 𝑛𝑛𝑇𝑇′)+∞
𝑛𝑛=−∞
∗ 𝑐𝑐𝐸𝐸𝑛𝑛𝑐𝑐𝐸𝐸𝑐𝑐𝑐𝑐𝑡𝑡𝑐𝑐𝐸𝐸𝑛𝑛.
Here T is 300 µs, and T’ is 333 ms, so 1𝜋𝜋′
is 3 Hz.
The Fourier-transformation of the pulse train h(t) is

18
𝐻𝐻(𝑓𝑓) = 𝐺𝐺(𝑓𝑓) 1𝑇𝑇′
� 𝛿𝛿�𝑓𝑓 − 𝑘𝑘1𝑇𝑇′�
+∞
𝑘𝑘=−∞
𝐻𝐻(𝑓𝑓) = 𝑃𝑃𝑇𝑇sin(𝜋𝜋𝑓𝑓𝑇𝑇)𝜋𝜋𝑓𝑓𝑇𝑇
1𝑇𝑇′
� 𝛿𝛿�𝑓𝑓 − 𝑘𝑘1𝑇𝑇′�
+∞
𝑘𝑘=−∞
Thus, the pulse train stimulation has frequency components only at 𝑘𝑘 1𝜋𝜋′
, which is
an integer multiple of 3 Hz.