Embed Size (px)
Citation preview
Photoacoustic elastographyPENGFEI HAI, JUNJIE YAO, GUO LI, CHIYE LI, AND LIHONG V. WANG*Optical Imaging Laboratory, Department of Biomedical Engineering, Washington University in St. Louis, St. Louis, Missouri 63130, USA*Corresponding author: [email protected]
Received 29 September 2015; revised 28 November 2015; accepted 11 January 2016; posted 13 January 2016 (Doc. ID 250984);published 5 February 2016
Elastography can noninvasively map the elasticity distribu-tion in biological tissue, which can potentially be used to re-veal disease conditions. In this Letter, we have demonstratedphotoacoustic elastography by using a linear-array photo-acoustic computed tomography system. The feasibility ofphotoacoustic elastography was first demonstrated by imag-ing the strains of single-layer and bilayer gelatin phantomswith various stiffness values. The measured strains agreedwell with theoretical values, with an average error of less than5.2%. Next, in vivo photoacoustic elastography was demon-strated on a mouse leg, where the fat and muscle distributionwas mapped based on the elasticity contrast. We confirmedthe photoacoustic elastography results by ultrasound elastog-raphy performed simultaneously. © 2016 Optical Society ofAmerica
OCIS codes: (170.5120) Photoacoustic imaging; (170.3880) Medical
and biological imaging; (170.6935) Tissue characterization.
http://dx.doi.org/10.1364/OL.41.000725
Elastic properties of biological tissues can reflect pathologicalconditions [1,2]. Elastography, an imaging technique that istypically implemented using existing medical imaging tech-niques, can map the elasticity distribution in biological tissue[3]. Elastography was first performed using ultrasound imagingin 1991 [4]. Later, elastography was implemented usingmagnetic resonance imaging, namely, magnetic resonance elas-tography, at the whole body level with a spatial resolution of∼1–3 mm [5]. Elastography was also implemented in opticalcoherence tomography (OCT), which has greatly improved thespatial resolution to ∼1–10 μm, but OCT has limited imagingdepth (∼1 mm in the skin) due to the strong optical scatteringin biological tissue [6].
Photoacoustic (PA) tomography (PAT) is a hybrid imagingtechnique that combines rich optical absorption contrast andhigh ultrasonic spatial resolution [7]. PAT has proven capableof imaging anatomical, functional, molecular, and metabolic in-formation of biological tissue [8–11].There have been several PAstudies on measuring the elastic properties of biologicaltissue. In one study, the viscoelasticity of biological tissues wasimagedbyPA technique, but the elasticity couldnot bemeasuredbecause the detected PA signal phase delay was related to thevis-cosity-elasticity ratio instead of the elasticity alone [12,13]. In asecond study, the volume-averaged Young’s modulus of soft
tissue was measured by a PA sensing technique, which, however,possessed no spatial resolution [14]. Yet another study intro-duced speckles in PA images for sample displacement estimation,but demonstrated the concept onlywith simulation data [15]. Sofar, elastography has not been successfully implemented usingPA imaging. Here, we demonstrate PA elastography capableof high-resolution strain imaging of biological tissue based onthe contrast of Young’s modulus. Implemented using photo-acoustic computed tomography (PACT), PA elastography canmap the mechanical contrast in biological tissue while maintain-ing high spatial resolution and excellent penetration depth.
PA elastography was developed based on a linear-array PACTsystem [16], which is capable of high-resolution imaging ofthe elasticity distribution in tissue in vivo. A 10 ns pulsed laserbeam at 680 nm was used for PA excitation with a 20 Hz pulserepetition rate. Light was first coupled into a fiber bundle. Thefiber bundle was then split into two rectangular light barsmounted on each side of a linear ultrasonic transducer array(LZ250, VisualSonics Inc., 21 MHz center frequency, 256elements), which detected the generated photoacoustic waves.PA signals were sampled at 84 MHz. For each laser pulse, onequarter of the 256 ultrasonic array elements were used fordetecting PA signals. Acquired with four laser pulses, the fulldata set was used to reconstruct a cross-sectional PA image,yielding a frame rate of 5 Hz. The spatial resolutions of thePACT system were 119 μm in the lateral direction, 86 μm inthe axial direction, and 1.2 mm in the elevational direction [17].
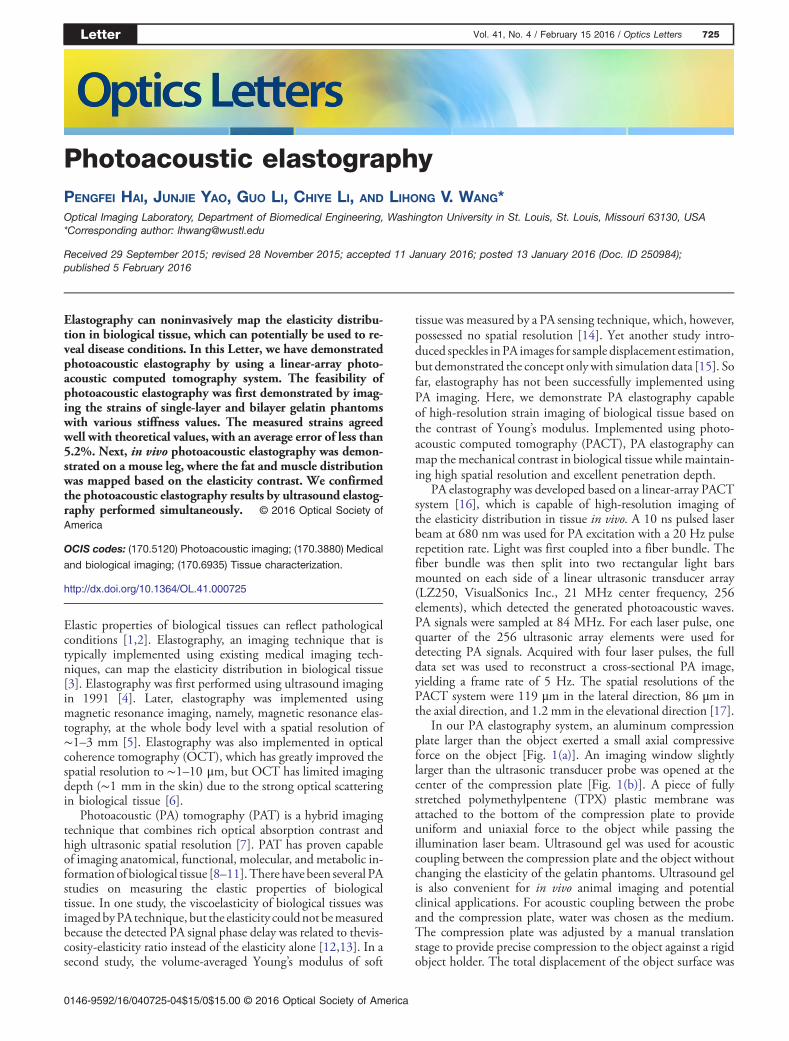
In our PA elastography system, an aluminum compressionplate larger than the object exerted a small axial compressiveforce on the object [Fig. 1(a)]. An imaging window slightlylarger than the ultrasonic transducer probe was opened at thecenter of the compression plate [Fig. 1(b)]. A piece of fullystretched polymethylpentene (TPX) plastic membrane wasattached to the bottom of the compression plate to provideuniform and uniaxial force to the object while passing theillumination laser beam. Ultrasound gel was used for acousticcoupling between the compression plate and the object withoutchanging the elasticity of the gelatin phantoms. Ultrasound gelis also convenient for in vivo animal imaging and potentialclinical applications. For acoustic coupling between the probeand the compression plate, water was chosen as the medium.The compression plate was adjusted by a manual translationstage to provide precise compression to the object against a rigidobject holder. The total displacement of the object surface was
Letter Vol. 41, No. 4 / February 15 2016 / Optics Letters 725
0146-9592/16/040725-04$15/0$15.00 © 2016 Optical Society of America
read from the translation stage. The object and the objectholder were placed on a high-precision digital weighing scale(S200, Ohaus). The compression stress applied to the objectwas calculated from the difference in the scale readings beforeand after compression
σ � g�ma − mb�A
: (1)
Here, σ is the compression stress, g is the acceleration of gravity,ma and mb are the scale readings before and after compression,and A is the area on which the compression force is applied.
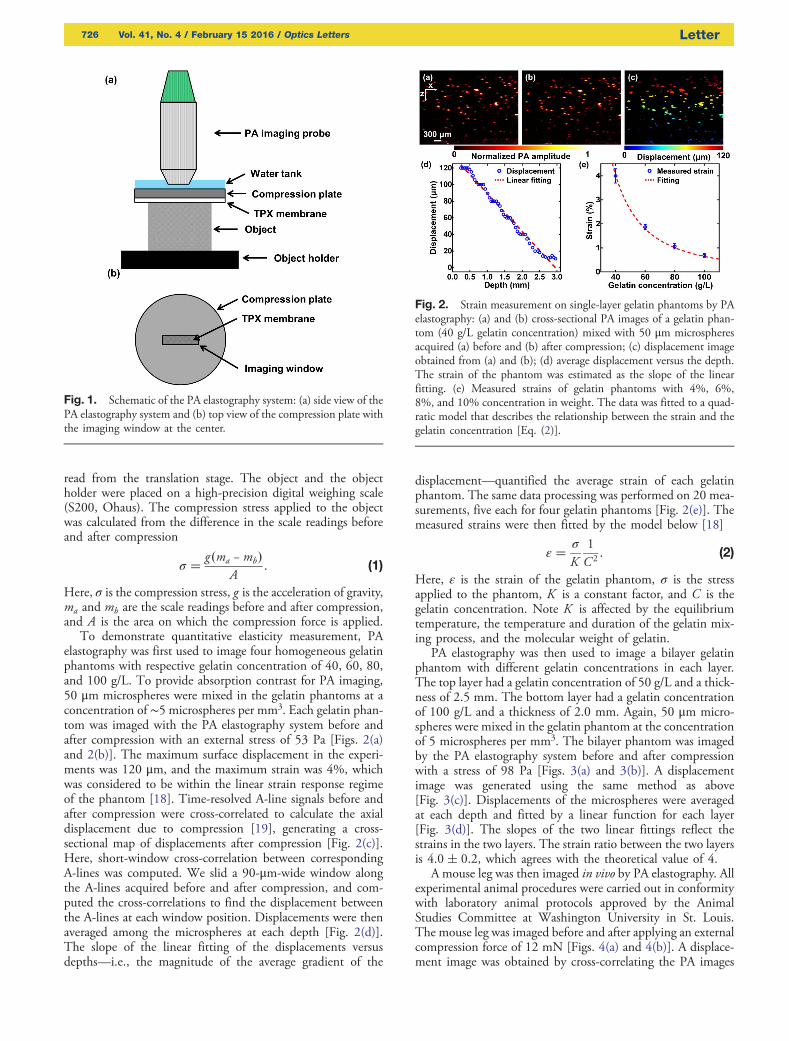
To demonstrate quantitative elasticity measurement, PAelastography was first used to image four homogeneous gelatinphantoms with respective gelatin concentration of 40, 60, 80,and 100 g/L. To provide absorption contrast for PA imaging,50 μm microspheres were mixed in the gelatin phantoms at aconcentration of ∼5microspheres permm3. Each gelatin phan-tom was imaged with the PA elastography system before andafter compression with an external stress of 53 Pa [Figs. 2(a)and 2(b)]. The maximum surface displacement in the experi-ments was 120 μm, and the maximum strain was 4%, whichwas considered to be within the linear strain response regimeof the phantom [18]. Time-resolved A-line signals before andafter compression were cross-correlated to calculate the axialdisplacement due to compression [19], generating a cross-sectional map of displacements after compression [Fig. 2(c)].Here, short-window cross-correlation between correspondingA-lines was computed. We slid a 90-μm-wide window alongthe A-lines acquired before and after compression, and com-puted the cross-correlations to find the displacement betweenthe A-lines at each window position. Displacements were thenaveraged among the microspheres at each depth [Fig. 2(d)].The slope of the linear fitting of the displacements versusdepths—i.e., the magnitude of the average gradient of the
displacement—quantified the average strain of each gelatinphantom. The same data processing was performed on 20 mea-surements, five each for four gelatin phantoms [Fig. 2(e)]. Themeasured strains were then fitted by the model below [18]
ε � σ
K1
C2 : (2)
Here, ε is the strain of the gelatin phantom, σ is the stressapplied to the phantom, K is a constant factor, and C is thegelatin concentration. Note K is affected by the equilibriumtemperature, the temperature and duration of the gelatin mix-ing process, and the molecular weight of gelatin.
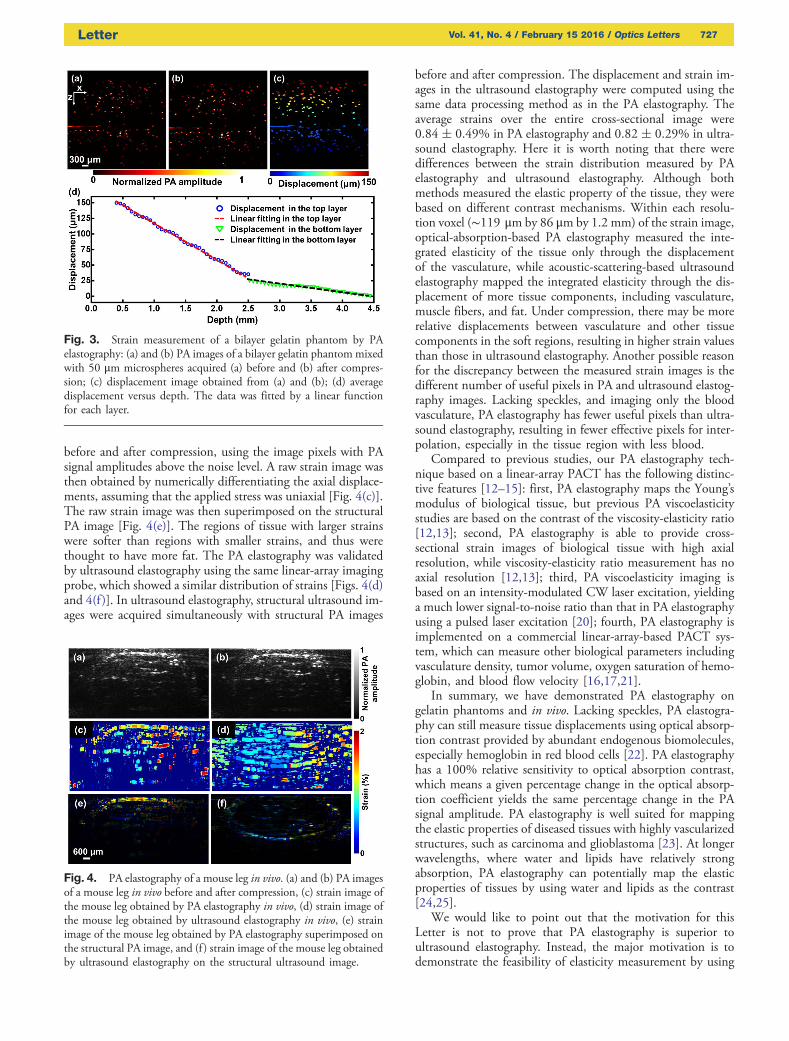
PA elastography was then used to image a bilayer gelatinphantom with different gelatin concentrations in each layer.The top layer had a gelatin concentration of 50 g/L and a thick-ness of 2.5 mm. The bottom layer had a gelatin concentrationof 100 g/L and a thickness of 2.0 mm. Again, 50 μm micro-spheres were mixed in the gelatin phantom at the concentrationof 5 microspheres per mm3. The bilayer phantom was imagedby the PA elastography system before and after compressionwith a stress of 98 Pa [Figs. 3(a) and 3(b)]. A displacementimage was generated using the same method as above[Fig. 3(c)]. Displacements of the microspheres were averagedat each depth and fitted by a linear function for each layer[Fig. 3(d)]. The slopes of the two linear fittings reflect thestrains in the two layers. The strain ratio between the two layersis 4.0� 0.2, which agrees with the theoretical value of 4.
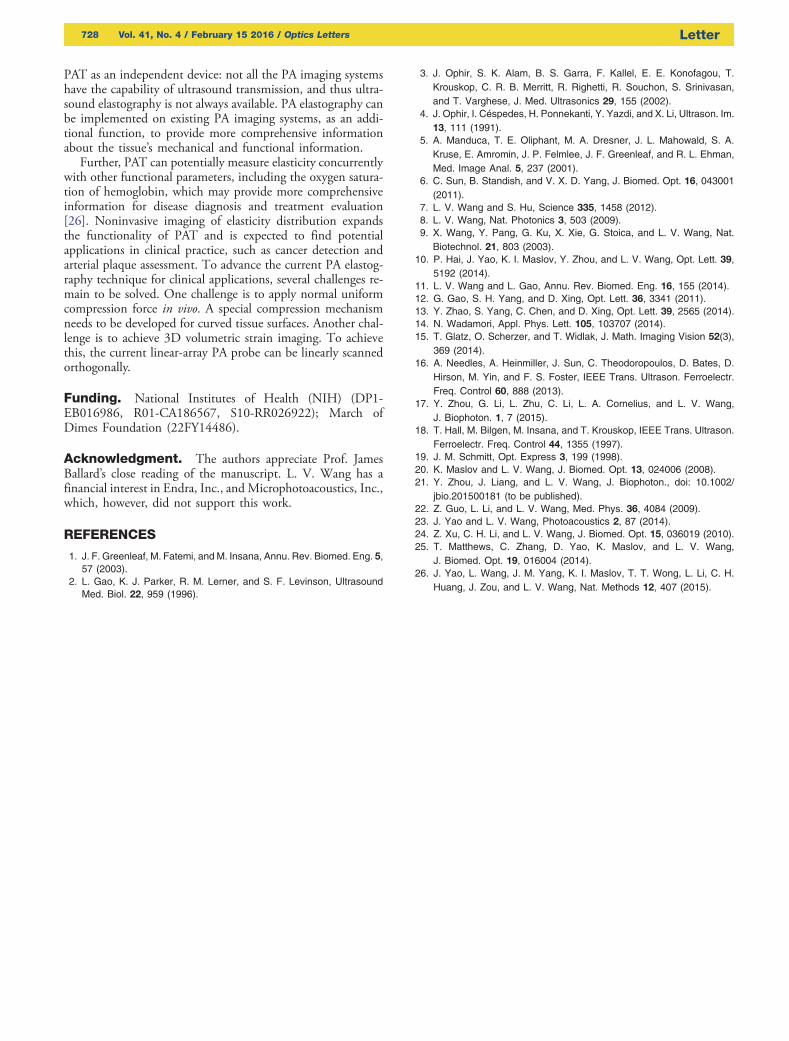
A mouse leg was then imaged in vivo by PA elastography. Allexperimental animal procedures were carried out in conformitywith laboratory animal protocols approved by the AnimalStudies Committee at Washington University in St. Louis.The mouse leg was imaged before and after applying an externalcompression force of 12 mN [Figs. 4(a) and 4(b)]. A displace-ment image was obtained by cross-correlating the PA images
Fig. 1. Schematic of the PA elastography system: (a) side view of thePA elastography system and (b) top view of the compression plate withthe imaging window at the center.
Fig. 2. Strain measurement on single-layer gelatin phantoms by PAelastography: (a) and (b) cross-sectional PA images of a gelatin phan-tom (40 g/L gelatin concentration) mixed with 50 μm microspheresacquired (a) before and (b) after compression; (c) displacement imageobtained from (a) and (b); (d) average displacement versus the depth.The strain of the phantom was estimated as the slope of the linearfitting. (e) Measured strains of gelatin phantoms with 4%, 6%,8%, and 10% concentration in weight. The data was fitted to a quad-ratic model that describes the relationship between the strain and thegelatin concentration [Eq. (2)].
726 Vol. 41, No. 4 / February 15 2016 / Optics Letters Letter
before and after compression, using the image pixels with PAsignal amplitudes above the noise level. A raw strain image wasthen obtained by numerically differentiating the axial displace-ments, assuming that the applied stress was uniaxial [Fig. 4(c)].The raw strain image was then superimposed on the structuralPA image [Fig. 4(e)]. The regions of tissue with larger strainswere softer than regions with smaller strains, and thus werethought to have more fat. The PA elastography was validatedby ultrasound elastography using the same linear-array imagingprobe, which showed a similar distribution of strains [Figs. 4(d)and 4(f )]. In ultrasound elastography, structural ultrasound im-ages were acquired simultaneously with structural PA images
before and after compression. The displacement and strain im-ages in the ultrasound elastography were computed using thesame data processing method as in the PA elastography. Theaverage strains over the entire cross-sectional image were0.84� 0.49% in PA elastography and 0.82� 0.29% in ultra-sound elastography. Here it is worth noting that there weredifferences between the strain distribution measured by PAelastography and ultrasound elastography. Although bothmethods measured the elastic property of the tissue, they werebased on different contrast mechanisms. Within each resolu-tion voxel (∼119 μm by 86 μm by 1.2 mm) of the strain image,optical-absorption-based PA elastography measured the inte-grated elasticity of the tissue only through the displacementof the vasculature, while acoustic-scattering-based ultrasoundelastography mapped the integrated elasticity through the dis-placement of more tissue components, including vasculature,muscle fibers, and fat. Under compression, there may be morerelative displacements between vasculature and other tissuecomponents in the soft regions, resulting in higher strain valuesthan those in ultrasound elastography. Another possible reasonfor the discrepancy between the measured strain images is thedifferent number of useful pixels in PA and ultrasound elastog-raphy images. Lacking speckles, and imaging only the bloodvasculature, PA elastography has fewer useful pixels than ultra-sound elastography, resulting in fewer effective pixels for inter-polation, especially in the tissue region with less blood.
Compared to previous studies, our PA elastography tech-nique based on a linear-array PACT has the following distinc-tive features [12–15]: first, PA elastography maps the Young’smodulus of biological tissue, but previous PA viscoelasticitystudies are based on the contrast of the viscosity-elasticity ratio[12,13]; second, PA elastography is able to provide cross-sectional strain images of biological tissue with high axialresolution, while viscosity-elasticity ratio measurement has noaxial resolution [12,13]; third, PA viscoelasticity imaging isbased on an intensity-modulated CW laser excitation, yieldinga much lower signal-to-noise ratio than that in PA elastographyusing a pulsed laser excitation [20]; fourth, PA elastography isimplemented on a commercial linear-array-based PACT sys-tem, which can measure other biological parameters includingvasculature density, tumor volume, oxygen saturation of hemo-globin, and blood flow velocity [16,17,21].
In summary, we have demonstrated PA elastography ongelatin phantoms and in vivo. Lacking speckles, PA elastogra-phy can still measure tissue displacements using optical absorp-tion contrast provided by abundant endogenous biomolecules,especially hemoglobin in red blood cells [22]. PA elastographyhas a 100% relative sensitivity to optical absorption contrast,which means a given percentage change in the optical absorp-tion coefficient yields the same percentage change in the PAsignal amplitude. PA elastography is well suited for mappingthe elastic properties of diseased tissues with highly vascularizedstructures, such as carcinoma and glioblastoma [23]. At longerwavelengths, where water and lipids have relatively strongabsorption, PA elastography can potentially map the elasticproperties of tissues by using water and lipids as the contrast[24,25].
We would like to point out that the motivation for thisLetter is not to prove that PA elastography is superior toultrasound elastography. Instead, the major motivation is todemonstrate the feasibility of elasticity measurement by using
Fig. 3. Strain measurement of a bilayer gelatin phantom by PAelastography: (a) and (b) PA images of a bilayer gelatin phantom mixedwith 50 μm microspheres acquired (a) before and (b) after compres-sion; (c) displacement image obtained from (a) and (b); (d) averagedisplacement versus depth. The data was fitted by a linear functionfor each layer.
Fig. 4. PA elastography of a mouse leg in vivo. (a) and (b) PA imagesof a mouse leg in vivo before and after compression, (c) strain image ofthe mouse leg obtained by PA elastography in vivo, (d) strain image ofthe mouse leg obtained by ultrasound elastography in vivo, (e) strainimage of the mouse leg obtained by PA elastography superimposed onthe structural PA image, and (f ) strain image of the mouse leg obtainedby ultrasound elastography on the structural ultrasound image.
Letter Vol. 41, No. 4 / February 15 2016 / Optics Letters 727
PAT as an independent device: not all the PA imaging systemshave the capability of ultrasound transmission, and thus ultra-sound elastography is not always available. PA elastography canbe implemented on existing PA imaging systems, as an addi-tional function, to provide more comprehensive informationabout the tissue’s mechanical and functional information.
Further, PAT can potentially measure elasticity concurrentlywith other functional parameters, including the oxygen satura-tion of hemoglobin, which may provide more comprehensiveinformation for disease diagnosis and treatment evaluation[26]. Noninvasive imaging of elasticity distribution expandsthe functionality of PAT and is expected to find potentialapplications in clinical practice, such as cancer detection andarterial plaque assessment. To advance the current PA elastog-raphy technique for clinical applications, several challenges re-main to be solved. One challenge is to apply normal uniformcompression force in vivo. A special compression mechanismneeds to be developed for curved tissue surfaces. Another chal-lenge is to achieve 3D volumetric strain imaging. To achievethis, the current linear-array PA probe can be linearly scannedorthogonally.
Funding. National Institutes of Health (NIH) (DP1-EB016986, R01-CA186567, S10-RR026922); March ofDimes Foundation (22FY14486).
Acknowledgment. The authors appreciate Prof. JamesBallard’s close reading of the manuscript. L. V. Wang has afinancial interest in Endra, Inc., and Microphotoacoustics, Inc.,which, however, did not support this work.
REFERENCES
1. J. F. Greenleaf, M. Fatemi, and M. Insana, Annu. Rev. Biomed. Eng. 5,57 (2003).
2. L. Gao, K. J. Parker, R. M. Lerner, and S. F. Levinson, UltrasoundMed. Biol. 22, 959 (1996).
3. J. Ophir, S. K. Alam, B. S. Garra, F. Kallel, E. E. Konofagou, T.Krouskop, C. R. B. Merritt, R. Righetti, R. Souchon, S. Srinivasan,and T. Varghese, J. Med. Ultrasonics 29, 155 (2002).
4. J. Ophir, I. Céspedes, H. Ponnekanti, Y. Yazdi, and X. Li, Ultrason. Im.13, 111 (1991).
5. A. Manduca, T. E. Oliphant, M. A. Dresner, J. L. Mahowald, S. A.Kruse, E. Amromin, J. P. Felmlee, J. F. Greenleaf, and R. L. Ehman,Med. Image Anal. 5, 237 (2001).
6. C. Sun, B. Standish, and V. X. D. Yang, J. Biomed. Opt. 16, 043001(2011).
7. L. V. Wang and S. Hu, Science 335, 1458 (2012).8. L. V. Wang, Nat. Photonics 3, 503 (2009).9. X. Wang, Y. Pang, G. Ku, X. Xie, G. Stoica, and L. V. Wang, Nat.
Biotechnol. 21, 803 (2003).10. P. Hai, J. Yao, K. I. Maslov, Y. Zhou, and L. V. Wang, Opt. Lett. 39,
5192 (2014).11. L. V. Wang and L. Gao, Annu. Rev. Biomed. Eng. 16, 155 (2014).12. G. Gao, S. H. Yang, and D. Xing, Opt. Lett. 36, 3341 (2011).13. Y. Zhao, S. Yang, C. Chen, and D. Xing, Opt. Lett. 39, 2565 (2014).14. N. Wadamori, Appl. Phys. Lett. 105, 103707 (2014).15. T. Glatz, O. Scherzer, and T. Widlak, J. Math. Imaging Vision 52(3),
369 (2014).16. A. Needles, A. Heinmiller, J. Sun, C. Theodoropoulos, D. Bates, D.
Hirson, M. Yin, and F. S. Foster, IEEE Trans. Ultrason. Ferroelectr.Freq. Control 60, 888 (2013).
17. Y. Zhou, G. Li, L. Zhu, C. Li, L. A. Cornelius, and L. V. Wang,J. Biophoton. 1, 7 (2015).
18. T. Hall, M. Bilgen, M. Insana, and T. Krouskop, IEEE Trans. Ultrason.Ferroelectr. Freq. Control 44, 1355 (1997).
19. J. M. Schmitt, Opt. Express 3, 199 (1998).20. K. Maslov and L. V. Wang, J. Biomed. Opt. 13, 024006 (2008).21. Y. Zhou, J. Liang, and L. V. Wang, J. Biophoton., doi: 10.1002/
jbio.201500181 (to be published).22. Z. Guo, L. Li, and L. V. Wang, Med. Phys. 36, 4084 (2009).23. J. Yao and L. V. Wang, Photoacoustics 2, 87 (2014).24. Z. Xu, C. H. Li, and L. V. Wang, J. Biomed. Opt. 15, 036019 (2010).25. T. Matthews, C. Zhang, D. Yao, K. Maslov, and L. V. Wang,
J. Biomed. Opt. 19, 016004 (2014).26. J. Yao, L. Wang, J. M. Yang, K. I. Maslov, T. T. Wong, L. Li, C. H.
Huang, J. Zou, and L. V. Wang, Nat. Methods 12, 407 (2015).
728 Vol. 41, No. 4 / February 15 2016 / Optics Letters Letter