Embed Size (px)
Citation preview
Photoacoustic Tomography Detects Early Vessel Regressionand Normalization During Ovarian Tumor Response to theAntiangiogenic Therapy Trebananib
Sarah E. Bohndiek, Laura S. Sasportas, Steven Machtaler, Jesse V. Jokerst, Sharon Hori, and Sanjiv S. Gambhir
Bio-X Program and Department of Radiology, Molecular Imaging Program at Stanford, Stanford University School of Medicine,Stanford, California
The primary aim of this study was to assess the potential of in vivo
photoacoustic tomography for direct functional measurement of
ovarian tumor response to antiangiogenic therapy.Methods: In vivostudies were performed with institutional animal care and use com-
mittee approval. We used an orthotopic mouse model of ovarian
cancer treated with trebananib (n 5 9) or vehicle (n 5 9). Tumor-
bearing mice were randomized into trebananib or vehicle groups atday 10 and dosed on days 12, 15, and 18 after implantation. Photo-
acoustic tomography and blood draws were performed at day 10
and then 24 h after each drug dose. Tumors were excised for his-
topathology after the final studies on day 19. Data analysis to testfor statistical significance was performed blinded. Results: Block-ade of angiopoietin signaling using trebananib resulted in reduced
total hemoglobin–weighted photoacoustic signal (n 5 9, P 5 0.01)and increased oxyhemoglobin-weighted photoacoustic signal (n 59, P , 0.01). The latter observation indicated normalization of the
residual tumor vessels, which was also implied by low levels of
angiopoietin 1 in serum biomarker profiling (0.76 ± 0.12 ng/mL).These noninvasive measures reflected a 30% reduction in micro-
vessel density and increased vessel maturation in ex vivo sections.
Conclusion: Photoacoustic tomography is able to evaluate both
vessel regression and normalization in response to trebananib. Non-invasive imaging data were supported by modulation of serum
markers in vitro and ex vivo histopathology.
Key Words: photoacoustics; angiogenesis; angiopoietin; ovarian
cancer
J Nucl Med 2015; 56:1942–1947DOI: 10.2967/jnumed.115.160002
Photoacoustic tomography (PAT) is a novel molecular imagingmodality that encodes the rich optical contrast of biologic tissue inan ultrasound signal, which can be detected with higher spatialresolution and penetration depth than conventional optical imag-ing (1). Emerging evidence suggests that PAT can assess tissuevascular function without the need for injectable contrast using the
differential absorption of oxy- and deoxyhemoglobin (2–5). More-over, PAT is a relatively low-cost imaging modality (6–8) that canbe combined with existing ultrasound systems (9,10). PAT there-fore holds significant potential as a future clinical tool for moni-toring therapeutic response in cancer patients.Angiogenesis is a rate-limiting step in the development and
progression of cancer (11). In particular, ovarian tumors are oftenhighly vascularized, and overexpression of angiogenic factors cor-relates with poor prognosis (11–14). Antiangiogenic therapy caninduce heterogeneous responses in these patients, ranging fromvessel normalization, which can enhance delivery of conventionalchemotherapy (15), to regression, which starves the tumor of ox-ygen (11,16,17). Standard-of-care transvaginal ultrasound mea-surements of tumor size and monitoring of serum CA125 levels(18) are poor markers of response to antiangiogenic therapy(19,20); vascular parameters are better indicators (21). We thereforehypothesized that PAT would provide a sensitive and noninvasivemethod to assess ovarian tumor response to antiangiogenic therapy.Trebananib is a peptibody that prevents the interaction of secreted
angiopoietin 1 (Ang1) and 2 (Ang2) with the receptor tyrosine kinaseTie2 (22–24) and is currently in phase III clinical trials. In normaltissues, Ang1 typically promotes blood vessel stabilization and qui-escence, whereas Ang2 stimulates angiogenesis. In tumors, the rolesof Ang1 and Ang2 are complex and context dependent (16,17,25),hence noninvasive monitoring of tumor responses to trebananib hasproved challenging in both the preclinical (23,26–29) and the clinical(30,31) settings. Early reports from phase III (TRINOVA 1) suggestbenefits in progression free, but not overall, survival, emphasizing anunmet clinical need for imaging biomarkers that can detect functionalresponse to therapy, direct drug dosing, improve combination therapyscheduling, and ultimately predict outcome.The primary aim of this study was to assess the potential of
noninvasive PAT imaging of tumor hemoglobin concentration andoxygenation as a direct measure of tumor response to antiangio-genic therapy with trebananib.
MATERIALS AND METHODS
Additional full protocols for animal model preparation, blood
biomarker profiling, and histopathology are given in the supplementalmaterials (available at http://jnm.snmjournals.org).
In Vivo Model
Tumors were established in female nu/nu mice (Charles River) at
5 wk of age by orthotopic (intrabursal) injection of 5 · 105 humanovarian carcinoma cells (A2780-SEAP-FL-eGFP) suspended in 10 mL
of sterile phosphate-buffered saline. All procedures were approved
Received Apr. 27, 2015; revision accepted Aug. 5, 2015.For correspondence or reprints contact: Sanjiv S. Gambhir, Department of
Radiology, Department of Bioengineering, and Department of MaterialsScience & Engineering, Bio-X Program, The James H. Clark Center, 318Campus Dr., Room E150A, Stanford, CA 94305-5427.E-mail: [email protected] online Aug. 27, 2015.COPYRIGHT © 2015 by the Society of Nuclear Medicine and Molecular
Imaging, Inc.
1942 THE JOURNAL OF NUCLEAR MEDICINE • Vol. 56 • No. 12 • December 2015
by the institutional animal care committee. This method of ovarian
tumor induction produces a primary tumor that is initially containedwithin the bursa and over time disseminates into the peritoneum,
hence the method was considered a more accurate recapitulationof the human disease for therapy monitoring than a subcutaneous
model.
Study Design
The study timeline is shown schematically in Figure 1. Biolumi-nescence imaging was performed on days 7, 10, and 19 to indepen-
dently monitor tumor growth using the IVIS-29 system (Caliper LifeSciences). On day 10, animals were randomized by ranking the Fluc
total flux signal and dividing animals alternately into 2 groups withmatched average tumor burden. Drug-treated mice then received tre-
bananib per manufacturer instructions (Amgen, Inc.; previously re-ferred to as AMG-386 or 2xCon4(C) (23,32)) suspended in 100 mL
of phosphate-buffered saline at 5.6 mg/kg, twice weekly by subcuta-neous injection on the nape of the neck. Vehicle mice received an
equivalent volume of phosphate-buffered saline.After baseline PAT and a blood draw of each group at day 10, we
obtained PAT images and blood draws at 24 h after each trebananibdose up to completion of the study at day 19. Serum samples were
assayed for systemic concentrations of mouse Ang1 (mAng1) andmouse Ang2 (mAng2), whereas plasma was assayed for the presence
of the serum alkaline phosphatase (SEAP) reporter gene expressed byour tumor cells, both using standard kits.
PAT
The Nexus 128 (Endra Inc.) PAT system was used to perform the
imaging. The equipment is described in the supplemental materials.Animals were anesthetized using a mixture of isoflurane and air, with
levels adjusted to maintain a respiration rate of 100 breaths per minute.For each scan, the mouse was laid supine in the animal holder
provided. Imaging was performed using the hemoglobin protocol,with scans acquired at wavelengths of 757, 797, and 837 nm using
a continuous rotation (12-s total scan time, 240 views, 1 laser pulseper view). Indocyanine green (ICG) imaging was performed at
a wavelength of 790 nm. At days 16 and 19 (24 h after the secondand third drug doses), a catheter was inserted into the tail vein, and
ICG (IO535 [Tokyo Chemical Industry Co., Ltd.], 80-mL bolus at 1.5
mM) was administered after the hemoglobin
imaging as a surrogate perfusion marker. Three-dimensional images were reconstructed in
volumes of 256 · 256 · 256 with 0.1 · 0.1 ·0.1 mm voxels using the supplied filtered
backprojection algorithm (reconstruction time, 1 min).
Histologic Tumor Analysis
Tumors were excised postmortem and ei-
ther fixed in 10% buffered formalin phosphate(Fisher Scientific) and paraffin-embedded or
immersed in 30% sucrose for 24–48 h beforebeing frozen on dry ice in optimal-cutting-
temperature compound (4583, Tissue-Tek;Sakura Finetek USA, Inc.) and then stored at
280�C until sectioning and staining was per-formed. Sectioning, staining, slide scanning,
and quantitative analysis were performedin-house. Adjacent sections from paraffin-
embedded tissues were cut for hematoxylinand eosin and CD31 staining. Sectioning of
paraffin-embedded tissues and hematoxylinand eosin staining was performed by Histotec
Laboratory. Frozen tissues were used for im-munofluorescence staining of CD31 and desmin, to indicate vessel
density and pericyte localization, respectively.
Image and Statistical Analysis
All data analysis, including image region drawing, was performedblinded until the final statistics were obtained. No outliers were
excluded from analysis, but adequate experimental data could not beobtained in some cases (poor blood draw, low imaging signal-to-noise
ratio), reducing the number of biologic replicates reported.Region-of-interest (ROI) analysis for photoacoustic imaging was
performed using 3-dimensional volumes drawn in OsiriX (Pixmeo),after the raw data were exported to DICOM format. ROIs were drawn
over equivalent regions about both the tumor and the contralateralovary. In the x (medial–lateral), y (superior–inferior), and z (anterior–
posterior) directions, the region was bounded by the inferior vena cava(medial) and skin layer of the mouse (lateral), the kidneys (superior)
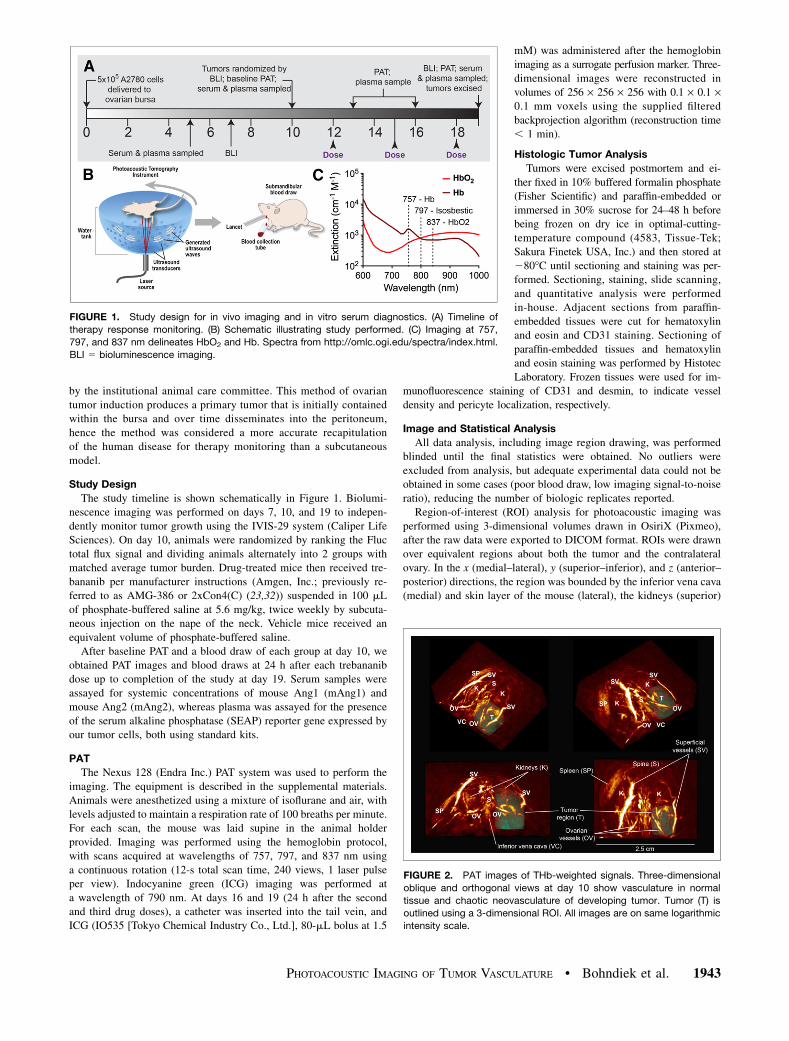
FIGURE 1. Study design for in vivo imaging and in vitro serum diagnostics. (A) Timeline of
therapy response monitoring. (B) Schematic illustrating study performed. (C) Imaging at 757,
797, and 837 nm delineates HbO2 and Hb. Spectra from http://omlc.ogi.edu/spectra/index.html.
BLI 5 bioluminescence imaging.
FIGURE 2. PAT images of THb-weighted signals. Three-dimensional
oblique and orthogonal views at day 10 show vasculature in normal
tissue and chaotic neovasculature of developing tumor. Tumor (T) is
outlined using a 3-dimensional ROI. All images are on same logarithmic
intensity scale.
PHOTOACOUSTIC IMAGING OF TUMOR VASCULATURE • Bohndiek et al. 1943
and the line defined by the lower end of the spleen (inferior), and thesuperficial skin vessels (anterior) and the ovarian vessels (posterior).
Examples of region drawing can be seen in Figure 2 and SupplementalVideo 1. Region statistics, including minimum, maximum, mean, SD,
and total photoacoustic signal, were exported from OsiriX into commaseparated value format.
All results in this work are expressed as mean 6 SE unless other-wise stated. All experiments were repeated independently in at least
10 animals, except hematoxylin and eosin staining, which was per-formed in 5 animals. Statistical significance was tested with Prism
(GraphPad Software) using a 2-tailed t test at the 95% confidencelevel (unpaired unless repeated measures) or 2-way ANOVA (compar-
ing effects of time and treatment) using Bonferroni multiple compar-isons. Correlations were tested using the nonparametric Spearman
correlation and significance established by evaluating the Spearman
correlation coefficient in light of the corre-
sponding P value (P , 0.05 indicating a true,significant correlation).
RESULTS
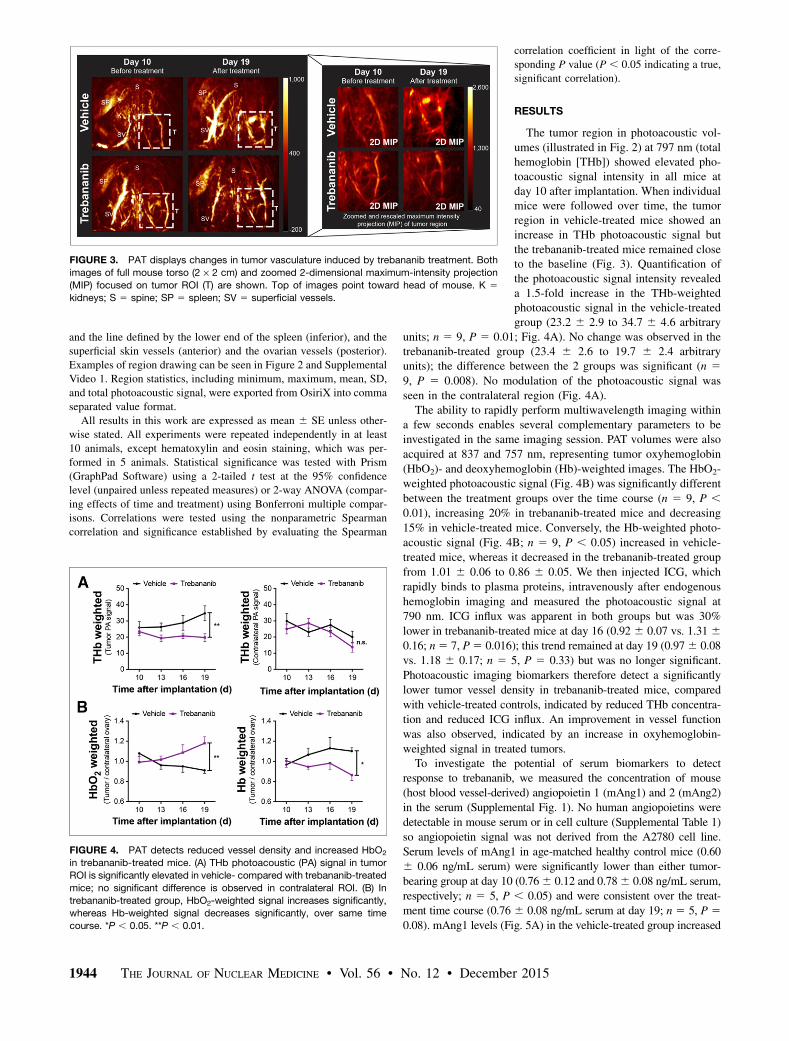
The tumor region in photoacoustic vol-umes (illustrated in Fig. 2) at 797 nm (totalhemoglobin [THb]) showed elevated pho-toacoustic signal intensity in all mice atday 10 after implantation. When individualmice were followed over time, the tumorregion in vehicle-treated mice showed anincrease in THb photoacoustic signal butthe trebananib-treated mice remained closeto the baseline (Fig. 3). Quantification ofthe photoacoustic signal intensity revealeda 1.5-fold increase in the THb-weightedphotoacoustic signal in the vehicle-treatedgroup (23.2 6 2.9 to 34.7 6 4.6 arbitrary
units; n 5 9, P 5 0.01; Fig. 4A). No change was observed in thetrebananib-treated group (23.4 6 2.6 to 19.7 6 2.4 arbitraryunits); the difference between the 2 groups was significant (n 59, P 5 0.008). No modulation of the photoacoustic signal wasseen in the contralateral region (Fig. 4A).The ability to rapidly perform multiwavelength imaging within
a few seconds enables several complementary parameters to beinvestigated in the same imaging session. PAT volumes were alsoacquired at 837 and 757 nm, representing tumor oxyhemoglobin
(HbO2)- and deoxyhemoglobin (Hb)-weighted images. The HbO2-weighted photoacoustic signal (Fig. 4B) was significantly different
between the treatment groups over the time course (n 5 9, P ,0.01), increasing 20% in trebananib-treated mice and decreasing
15% in vehicle-treated mice. Conversely, the Hb-weighted photo-acoustic signal (Fig. 4B; n 5 9, P , 0.05) increased in vehicle-treated mice, whereas it decreased in the trebananib-treated group
from 1.01 6 0.06 to 0.86 6 0.05. We then injected ICG, whichrapidly binds to plasma proteins, intravenously after endogenous
hemoglobin imaging and measured the photoacoustic signal at790 nm. ICG influx was apparent in both groups but was 30%
lower in trebananib-treated mice at day 16 (0.92 6 0.07 vs. 1.31 60.16; n5 7, P5 0.016); this trend remained at day 19 (0.976 0.08vs. 1.18 6 0.17; n 5 5, P 5 0.33) but was no longer significant.
Photoacoustic imaging biomarkers therefore detect a significantlylower tumor vessel density in trebananib-treated mice, compared
with vehicle-treated controls, indicated by reduced THb concentra-tion and reduced ICG influx. An improvement in vessel function
was also observed, indicated by an increase in oxyhemoglobin-weighted signal in treated tumors.To investigate the potential of serum biomarkers to detect
response to trebananib, we measured the concentration of mouse(host blood vessel-derived) angiopoietin 1 (mAng1) and 2 (mAng2)in the serum (Supplemental Fig. 1). No human angiopoietins were
detectable in mouse serum or in cell culture (Supplemental Table 1)so angiopoietin signal was not derived from the A2780 cell line.
Serum levels of mAng1 in age-matched healthy control mice (0.606 0.06 ng/mL serum) were significantly lower than either tumor-
bearing group at day 10 (0.766 0.12 and 0.786 0.08 ng/mL serum,respectively; n 5 5, P , 0.05) and were consistent over the treat-ment time course (0.76 6 0.08 ng/mL serum at day 19; n 5 5, P 50.08). mAng1 levels (Fig. 5A) in the vehicle-treated group increased
FIGURE 3. PAT displays changes in tumor vasculature induced by trebananib treatment. Both
images of full mouse torso (2 · 2 cm) and zoomed 2-dimensional maximum-intensity projection
(MIP) focused on tumor ROI (T) are shown. Top of images point toward head of mouse. K 5kidneys; S 5 spine; SP 5 spleen; SV 5 superficial vessels.
FIGURE 4. PAT detects reduced vessel density and increased HbO2
in trebananib-treated mice. (A) THb photoacoustic (PA) signal in tumor
ROI is significantly elevated in vehicle- compared with trebananib-treated
mice; no significant difference is observed in contralateral ROI. (B) In
trebananib-treated group, HbO2-weighted signal increases significantly,
whereas Hb-weighted signal decreases significantly, over same time
course. *P , 0.05. **P , 0.01.
1944 THE JOURNAL OF NUCLEAR MEDICINE • Vol. 56 • No. 12 • December 2015
by 1.5-fold (n 5 10, P , 0.0001) whereas the trebananib-treatedgroup remained at baseline (n 5 10, P 5 0.65). The level of serummAng1 in the trebananib-treated group was 30% lower than thevehicle-treated group at day 19 (n5 10, P5 0.03) but indistinguish-able from the healthy group (n 5 5, P 5 0.59). Serum levels ofmAng2 (Fig. 5B) were significantly lower in the healthy group (0.256 0.02 ng/mL serum) than the tumor-bearing groups at day 10 (0.306 0.04 and 0.34 6 0.05 ng/mL serum, respectively; n 5 5, P 50.03). By day 19, however, the tumor-bearing groups and healthygroups were indistinguishable (n 5 10, P 5 0.65). Levels of circu-lating mAng2 were moderately correlated with mAng1 in thehealthy and vehicle-treated groups (Supplemental Figs. 2A and2B) but not in trebananib-treated mice (Supplemental Fig. 2C).As the A2780 cells used in this study are among the subset of
human ovarian cancers that do not express CA125 (SupplementalTable 1) (33), they have been engineered to express the enzymehuman secreted alkaline phosphatase (SEAP) as a reporter protein.Plasma SEAP correlates with viable tumor burden in early stageovarian tumors and indicates response to cytotoxic therapy (34).SEAP levels (Fig. 5C) were significantly reduced by trebananibtreatment and correlated with the THb-weighted photoacousticsignal (n 5 30, Spearman r 5 0.4857, P 5 0.036). Because therewas no correlation of SEAP levels with tumor burden in vivo,tumor mass ex vivo, or tumor necrotic area, the reduced access
of the SEAP protein to the blood vasculature dominates the read-out rather than an increase in tumor cell necrosis. Vascular-derivedmAng1 or mAng2 were not correlated with SEAP (SupplementalFigs. 2D and 2E).Hematoxylin and eosin staining (Fig. 6) revealed a small in-
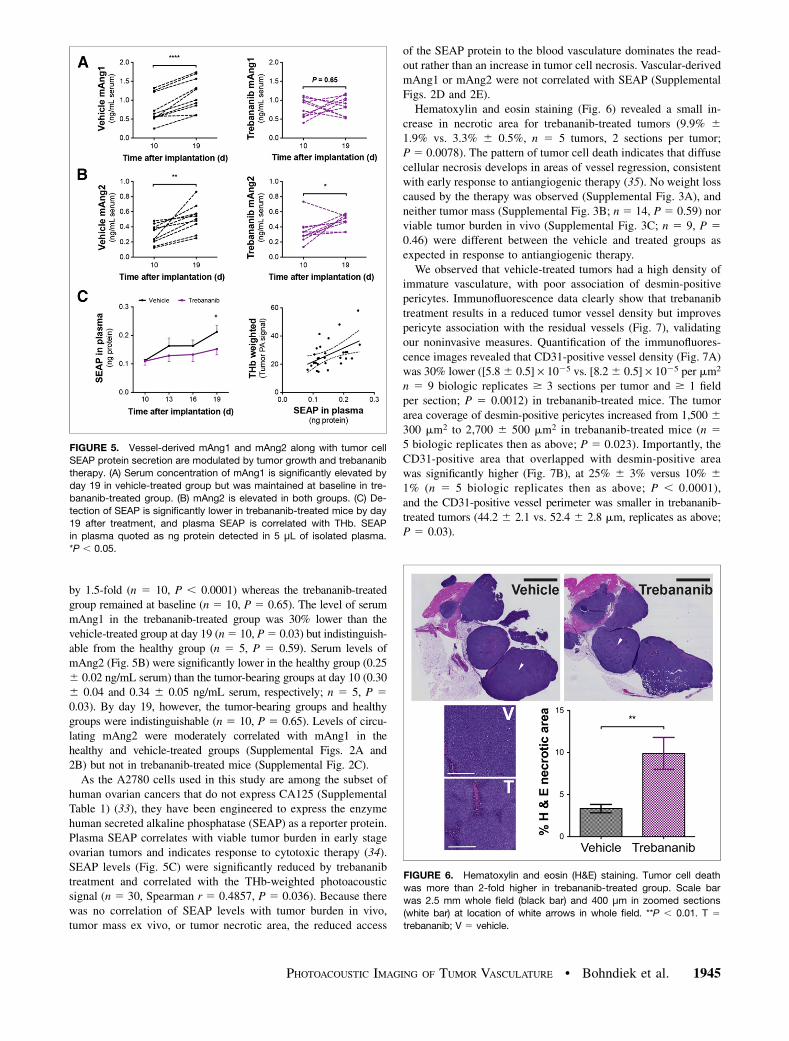
crease in necrotic area for trebananib-treated tumors (9.9% 61.9% vs. 3.3% 6 0.5%, n 5 5 tumors, 2 sections per tumor;P 5 0.0078). The pattern of tumor cell death indicates that diffusecellular necrosis develops in areas of vessel regression, consistentwith early response to antiangiogenic therapy (35). No weight losscaused by the therapy was observed (Supplemental Fig. 3A), andneither tumor mass (Supplemental Fig. 3B; n 5 14, P 5 0.59) norviable tumor burden in vivo (Supplemental Fig. 3C; n 5 9, P 50.46) were different between the vehicle and treated groups asexpected in response to antiangiogenic therapy.We observed that vehicle-treated tumors had a high density of
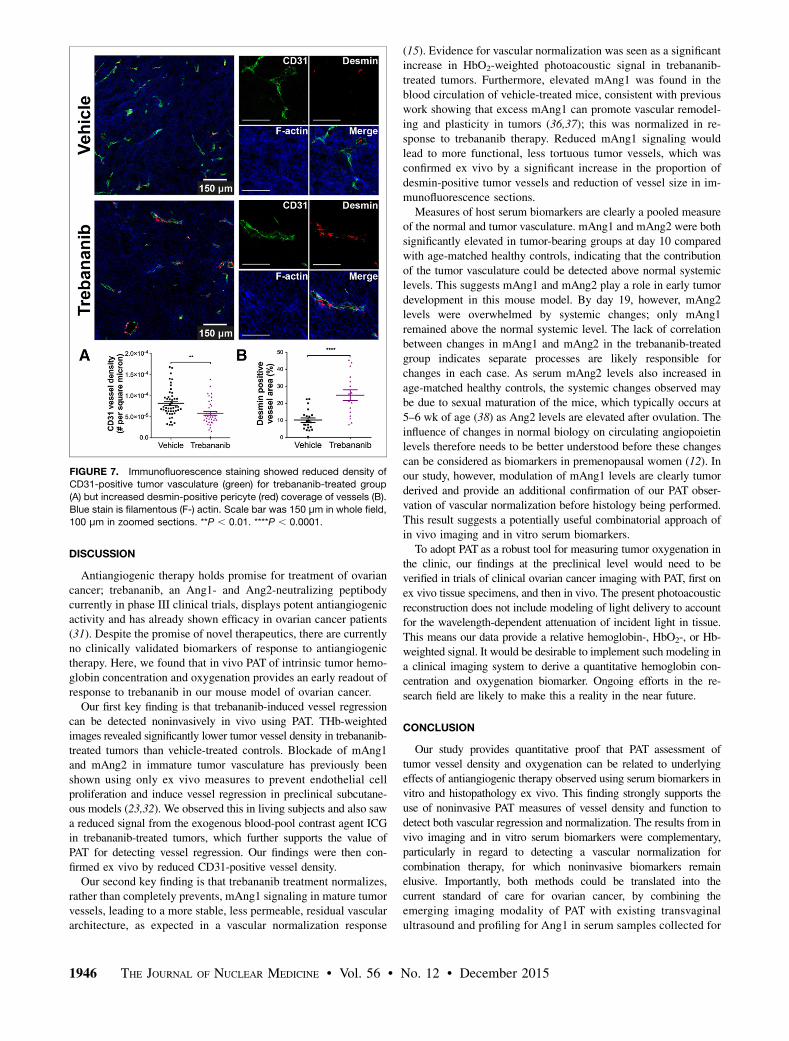
immature vasculature, with poor association of desmin-positivepericytes. Immunofluorescence data clearly show that trebananibtreatment results in a reduced tumor vessel density but improvespericyte association with the residual vessels (Fig. 7), validatingour noninvasive measures. Quantification of the immunofluores-cence images revealed that CD31-positive vessel density (Fig. 7A)was 30% lower ([5.86 0.5] · 1025 vs. [8.26 0.5] · 1025 per mm2
n 5 9 biologic replicates $ 3 sections per tumor and $ 1 fieldper section; P 5 0.0012) in trebananib-treated mice. The tumorarea coverage of desmin-positive pericytes increased from 1,500 6300 mm2 to 2,700 6 500 mm2 in trebananib-treated mice (n 55 biologic replicates then as above; P 5 0.023). Importantly, theCD31-positive area that overlapped with desmin-positive areawas significantly higher (Fig. 7B), at 25% 6 3% versus 10% 61% (n 5 5 biologic replicates then as above; P , 0.0001),and the CD31-positive vessel perimeter was smaller in trebananib-treated tumors (44.2 6 2.1 vs. 52.4 6 2.8 mm, replicates as above;P 5 0.03).
FIGURE 5. Vessel-derived mAng1 and mAng2 along with tumor cell
SEAP protein secretion are modulated by tumor growth and trebananib
therapy. (A) Serum concentration of mAng1 is significantly elevated by
day 19 in vehicle-treated group but was maintained at baseline in tre-
bananib-treated group. (B) mAng2 is elevated in both groups. (C) De-
tection of SEAP is significantly lower in trebananib-treated mice by day
19 after treatment, and plasma SEAP is correlated with THb. SEAP
in plasma quoted as ng protein detected in 5 μL of isolated plasma.
*P , 0.05.
FIGURE 6. Hematoxylin and eosin (H&E) staining. Tumor cell death
was more than 2-fold higher in trebananib-treated group. Scale bar
was 2.5 mm whole field (black bar) and 400 μm in zoomed sections
(white bar) at location of white arrows in whole field. **P , 0.01. T 5trebananib; V 5 vehicle.
PHOTOACOUSTIC IMAGING OF TUMOR VASCULATURE • Bohndiek et al. 1945
DISCUSSION
Antiangiogenic therapy holds promise for treatment of ovariancancer; trebananib, an Ang1- and Ang2-neutralizing peptibodycurrently in phase III clinical trials, displays potent antiangiogenicactivity and has already shown efficacy in ovarian cancer patients(31). Despite the promise of novel therapeutics, there are currentlyno clinically validated biomarkers of response to antiangiogenictherapy. Here, we found that in vivo PAT of intrinsic tumor hemo-globin concentration and oxygenation provides an early readout ofresponse to trebananib in our mouse model of ovarian cancer.Our first key finding is that trebananib-induced vessel regression
can be detected noninvasively in vivo using PAT. THb-weightedimages revealed significantly lower tumor vessel density in trebananib-treated tumors than vehicle-treated controls. Blockade of mAng1and mAng2 in immature tumor vasculature has previously beenshown using only ex vivo measures to prevent endothelial cellproliferation and induce vessel regression in preclinical subcutane-ous models (23,32). We observed this in living subjects and also sawa reduced signal from the exogenous blood-pool contrast agent ICGin trebananib-treated tumors, which further supports the value ofPAT for detecting vessel regression. Our findings were then con-firmed ex vivo by reduced CD31-positive vessel density.Our second key finding is that trebananib treatment normalizes,
rather than completely prevents, mAng1 signaling in mature tumorvessels, leading to a more stable, less permeable, residual vasculararchitecture, as expected in a vascular normalization response
(15). Evidence for vascular normalization was seen as a significantincrease in HbO2-weighted photoacoustic signal in trebananib-treated tumors. Furthermore, elevated mAng1 was found in theblood circulation of vehicle-treated mice, consistent with previouswork showing that excess mAng1 can promote vascular remodel-ing and plasticity in tumors (36,37); this was normalized in re-sponse to trebananib therapy. Reduced mAng1 signaling wouldlead to more functional, less tortuous tumor vessels, which wasconfirmed ex vivo by a significant increase in the proportion ofdesmin-positive tumor vessels and reduction of vessel size in im-munofluorescence sections.Measures of host serum biomarkers are clearly a pooled measure
of the normal and tumor vasculature. mAng1 and mAng2 were bothsignificantly elevated in tumor-bearing groups at day 10 comparedwith age-matched healthy controls, indicating that the contributionof the tumor vasculature could be detected above normal systemiclevels. This suggests mAng1 and mAng2 play a role in early tumordevelopment in this mouse model. By day 19, however, mAng2levels were overwhelmed by systemic changes; only mAng1remained above the normal systemic level. The lack of correlationbetween changes in mAng1 and mAng2 in the trebananib-treatedgroup indicates separate processes are likely responsible forchanges in each case. As serum mAng2 levels also increased inage-matched healthy controls, the systemic changes observed maybe due to sexual maturation of the mice, which typically occurs at5–6 wk of age (38) as Ang2 levels are elevated after ovulation. Theinfluence of changes in normal biology on circulating angiopoietinlevels therefore needs to be better understood before these changescan be considered as biomarkers in premenopausal women (12). Inour study, however, modulation of mAng1 levels are clearly tumorderived and provide an additional confirmation of our PAT obser-vation of vascular normalization before histology being performed.This result suggests a potentially useful combinatorial approach ofin vivo imaging and in vitro serum biomarkers.To adopt PAT as a robust tool for measuring tumor oxygenation in
the clinic, our findings at the preclinical level would need to beverified in trials of clinical ovarian cancer imaging with PAT, first onex vivo tissue specimens, and then in vivo. The present photoacousticreconstruction does not include modeling of light delivery to accountfor the wavelength-dependent attenuation of incident light in tissue.This means our data provide a relative hemoglobin-, HbO2-, or Hb-weighted signal. It would be desirable to implement such modeling ina clinical imaging system to derive a quantitative hemoglobin con-centration and oxygenation biomarker. Ongoing efforts in the re-search field are likely to make this a reality in the near future.
CONCLUSION
Our study provides quantitative proof that PAT assessment oftumor vessel density and oxygenation can be related to underlyingeffects of antiangiogenic therapy observed using serum biomarkers invitro and histopathology ex vivo. This finding strongly supports theuse of noninvasive PAT measures of vessel density and function todetect both vascular regression and normalization. The results from invivo imaging and in vitro serum biomarkers were complementary,particularly in regard to detecting a vascular normalization forcombination therapy, for which noninvasive biomarkers remainelusive. Importantly, both methods could be translated into thecurrent standard of care for ovarian cancer, by combining theemerging imaging modality of PAT with existing transvaginalultrasound and profiling for Ang1 in serum samples collected for
FIGURE 7. Immunofluorescence staining showed reduced density of
CD31-positive tumor vasculature (green) for trebananib-treated group
(A) but increased desmin-positive pericyte (red) coverage of vessels (B).
Blue stain is filamentous (F-) actin. Scale bar was 150 μm in whole field,
100 μm in zoomed sections. **P , 0.01. ****P , 0.0001.
1946 THE JOURNAL OF NUCLEAR MEDICINE • Vol. 56 • No. 12 • December 2015
CA125 screening. Our approach could also have broad application inother tumor types (8) to enable optimal scheduling of antiangiogenictherapy with chemotherapy or radiation therapy to yield the maximaltherapeutic outcome (15).
DISCLOSURE
The costs of publication of this article were defrayed in part bythe payment of page charges. Therefore, and solely to indicate thisfact, this article is hereby marked “advertisement” in accordancewith 18 USC section 1734. This work was funded in part by theCenter for Cancer Nanotechnology Excellence and Translation, anNCI-NIH U54 grant (1 U54-CA151459), NCI Ovarian SPORE,The Canary Foundation, NCI EDRN U01, and an AACR-Amgen,Inc. Clinical/Translational Cancer Research Fellowship awardedto Dr. Bohndiek. Dr. Bohndiek also received fellowship supportfor this work from the AAUW (International Fellowship). Dr.Gambhir is a board member and holds equity in Endra, Inc. Noother potential conflict of interest relevant to this article wasreported.
ACKNOWLEDGMENTS
We thank the following for helpful contributions to this work:Angela Coxon, Rick Kendall, and Jann Nichols at Amgen, Inc.;Mike Thornton and Paul Picot at Endra, Inc.; Tim Doyle at theStanford Small Animal Imaging Facility (SCI3); as well asAndrew Olson and the Stanford Neuroscience Microscopy Service(supported by NIH NS069375). We also thank Lingyun Xu andEdwin Chang in the laboratory of Dr. Gambhir for helpfuldiscussions regarding blood sampling, ELISA, and the animalmodel, respectively.
REFERENCES
1. Wang LV, Hu S. Photoacoustic tomography: in vivo imaging from organelles to
organs. Science. 2012;335:1458–1462.
2. Chen SL, Burnett J, Sun D, et al. Photoacoustic microscopy: a potential new tool
for evaluation of angiogenesis inhibitor. Biomed Opt Express. 2013;4:2657–
2666.
3. Laufer J, Johnson P, Zhang E, et al. In vivo preclinical photoacoustic imaging of
tumor vasculature development and therapy. J Biomed Opt. 2012;17:056016.
4. Rich LJ, Seshadri M. Photoacoustic imaging of vascular hemodynamics: valida-
tion with blood oxygenation level-dependent MR imaging. Radiology. 2015;275:
110–118.
5. Herzog E, Taruttis A, Beziere N, et al. Optical imaging of cancer heterogeneity
with multispectral optoacoustic tomography. Radiology. 2012;263:461–468.
6. Kruger RA, Lam RB, Reinecke DR, et al. Photoacoustic angiography of the
breast. Med Phys. 2010;37:6096–6100.
7. Heijblom M, Piras D, Xia W, et al. Visualizing breast cancer using the Twente
photoacoustic mammoscope: what do we learn from twelve new patient mea-
surements? Opt Express. 2012;20:11582–11597.
8. Zackrisson S, van de Ven SM, Gambhir SS. Light in and sound out: emerging
translational strategies for photoacoustic imaging. Cancer Res. 2014;74:979–
1004.
9. Aguirre A, Ardeshirpour Y, Sanders MM, et al. Potential role of coregistered
photoacoustic and ultrasound imaging in ovarian cancer detection and charac-
terization. Transl Oncol. 2011;4:29–37.
10. Aguirre A, Guo P, Gamelin J, et al. Coregistered three-dimensional ultrasound
and photoacoustic imaging system for ovarian tissue characterization. J Biomed
Opt. 2009;14:054014.
11. Teoh D, Secord AA. Antiangiogenic agents in combination with chemotherapy
for the treatment of epithelial ovarian cancer. Int J Gynecol Cancer. 2012;22:
348–359.
12. Ramakrishnan S, Subramanian IV, Yokoyama Y, et al. Angiogenesis in normal
and neoplastic ovaries. Angiogenesis. 2005;8:169–182.
13. Taylor SE, Kirwan JM. Ovarian cancer: current management and future direc-
tions. Obstetrics, Gynaecol Reprod Med. 2009;19:130–135.
14. Yap TA, Carden CP, Kaye SB. Beyond chemotherapy: targeted therapies in
ovarian cancer. Nat Rev Cancer. 2009;9:167–181.
15. Jain RK. Normalization of tumor vasculature: an emerging concept in antiangio-
genic therapy. Science. 2005;307:58–62.
16. Augustin HG, Koh GY, Thurston G, et al. Control of vascular morphogenesis and
homeostasis through the angiopoietin-Tie system. Nat Rev Mol Cell Biol.
2009;10:165–177.
17. Huang H, Bhat A, Woodnutt G, et al. Targeting the ANGPT-TIE2 pathway in
malignancy. Nat Rev Cancer. 2010;10:575–585.
18. Karam AK, Karlan BY. Ovarian cancer: the duplicity of CA125 measurement.
Nat Rev Clin Oncol. 2010;7:335–339.
19. Bohndiek SE, Brindle KM. Imaging and ‘omic’ methods for the molecular di-
agnosis of cancer. Expert Rev Mol Diagn. 2010;10:417–434.
20. Therasse P, Arbuck SG, Eisenhauer EA, et al. New guidelines to evaluate the
response to treatment in solid tumors. European Organization for Research and
Treatment of Cancer, National Cancer Institute of the United States, National
Cancer Institute of Canada. J Natl Cancer Inst. 2000;92:205–216.
21. Ehling J, Lammers T, Kiessling F. Non-Invasive imaging for studying anti-
angiogenic therapy effects. Thromb Haemost. 2013;109:375–390.
22. Maisonpierre PC, Suri C, Jones PF, et al. Angiopoietin-2, a natural antagonist for
Tie2 that disrupts in vivo angiogenesis. Science. 1997;277:55–60.
23. Coxon A, Bready J, Min H, et al. Context-dependent role of angiopoietin-1
inhibition in the suppression of angiogenesis and tumor growth: implications
for AMG 386, an angiopoietin-1/2-neutralizing peptibody. Mol Cancer Ther.
2010;9:2641–2651.
24. Davis S, Aldrich TH, Jones PF, et al. Isolation of angiopoietin-1, a ligand for the
TIE2 receptor, by secretion-trap expression cloning. Cell. 1996;87:1161–1169.
25. Azzi S, Hebda JK, Gavard J. Vascular permeability and drug delivery in cancers.
Front Oncol. 2013;3:211.
26. Daly C, Eichten A, Castanaro C, et al. Angiopoietin-2 functions as a Tie2 agonist
in tumor models, where it limits the effects of VEGF inhibition. Cancer Res.
2013;73:108–118.
27. Hashizume H, Falcon BL, Kuroda T, et al. Complementary actions of inhibitors
of angiopoietin-2 and VEGF on tumor angiogenesis and growth. Cancer Res.
2010;70:2213–2223.
28. Nasarre P, Thomas M, Kruse K, et al. Host-derived angiopoietin-2 affects early
stages of tumor development and vessel maturation but is dispensable for later
stages of tumor growth. Cancer Res. 2009;69:1324–1333.
29. Oliner J, Min H, Leal J, et al. Suppression of angiogenesis and tumor growth by
selective inhibition of angiopoietin-2. Cancer Cell. 2004;6:507–516.
30. Herbst RS, Hong D, Chap L, et al. Safety, pharmacokinetics, and antitumor
activity of AMG 386, a selective angiopoietin inhibitor, in adult patients with
advanced solid tumors. J Clin Oncol. 2009;27:3557–3565.
31. Karlan BY, Oza AM, Richardson GE, et al. Randomized, double-blind, placebo-
controlled phase II study of AMG 386 combined with weekly paclitaxel in
patients with recurrent ovarian cancer. J Clin Oncol. 2012;30:362–371.
32. Falcón BL, Hashizume H, Koumoutsakos P, et al. Contrasting actions of selective
inhibitors of angiopoietin-1 and angiopoietin-2 on the normalization of tumor
blood vessels. Am J Pathol. 2009;175:2159–2170.
33. Shaw TJ, Senterman MK, Dawson K, et al. Characterization of intraperitoneal,
orthotopic, and metastatic xenograft models of human ovarian cancer. Mol Ther.
2004;10:1032–1042.
34. Nilsson EE, Westfall SD, McDonald C. Liet al. An in vivo mouse reporter gene
(human secreted alkaline phosphatase) model to monitor ovarian tumor growth
and response to therapeutics. Cancer Chemother Pharmacol. 2002;49:93–100.
35. Bohndiek SE, Kettunen MI, Hu DE, Brindle KM. Hyperpolarized 13C spectros-
copy detects early changes in tumor vasculature and metabolism after VEGF
neutralization. Cancer Res. 2012;72:854–864.
36. Shim WS, Teh M, Bapna A, et al. Angiopoietin 1 promotes tumor angiogenesis
and tumor vessel plasticity of human cervical cancer in mice. Exp Cell Res.
2002;279:299–309.
37. Suri C, McClain J, Thurston G, et al. Increased vascularization in mice over-
expressing angiopoietin-1. Science. 1998;282:468–471.
38. Drickamer LC. Seasonal variation in litter size, bodyweight and sexual mat-
uration in juvenile female house mice (Mus musculus). Lab Anim. 1977;11:
159–162.
PHOTOACOUSTIC IMAGING OF TUMOR VASCULATURE • Bohndiek et al. 1947


![Nonlinear quantitative photoacoustic tomography with two …kr2002/publication_files/Ren-Zhang-TP-PAT-2016.pdf · Two-photon photoacoustic tomography (TP-PAT) [35,36,51,53,56,57,58,60,59]](https://img.pdfslide.net/doc/110x75/5e26be0daa2e5d594541a49c/nonlinear-quantitative-photoacoustic-tomography-with-two-kr2002publicationfilesren-zhang-tp-pat-2016pdf.jpg)