Embed Size (px)
Citation preview
PHOTOGRAMMETRIC 3D BUILDING RECONSTRUCTION FROM THERMAL IMAGES
E. Maseta,∗, A. Fusielloa, F. Crosillaa, R. Toldob and D. Zorzettoc
a DPIA, University of Udine, Via delle Scienze, 208 - 33100 Udine, Italy [email protected], (andrea.fusiello, fabio.crosilla)@uniud.it
b 3Dflow srl, Strada Le Grazie, 15 - 37134 Verona, Italy - [email protected] AIRMAP Flight Analysis, Loc. Padriciano, 272 - 34149 Trieste, Italy - [email protected]
KEY WORDS: Thermal Infrared Images, 3D Building Reconstruction, Unmanned Aerial Vehicles, Photogrammetry, Computer Vision
ABSTRACT:
This paper addresses the problem of 3D building reconstruction from thermal infrared (TIR) images. We show that a commercialComputer Vision software can be used to automatically orient sequences of TIR images taken from an Unmanned Aerial Vehicle(UAV) and to generate 3D point clouds, without requiring any GNSS/INS data about position and attitude of the images nor cameracalibration parameters. Moreover, we propose a procedure based on Iterative Closest Point (ICP) algorithm to create a model thatcombines high resolution and geometric accuracy of RGB images with the thermal information deriving from TIR images. The processcan be carried out entirely by the aforesaid software in a simple and efficient way.
1. INTRODUCTION
Nowadays, thermal imaging systems are used in a wide rangeof applications, such as archaeological heritage documentation(Brumana et al., 2013), landslide hazard assessment (Teza et al.,2015), crop health monitoring (Mangus et al., 2016) and photo-voltaic plants inspection (Tsanakas et al., 2017). Thermographiccameras are increasingly becoming important also in buildingsdiagnostics. Indeed, thermography is a non-contact testing tech-nology that allows to capture thermal irregularities caused byflaws or damages localized in buildings. Thanks to the represen-tation through digital images, thermography avoids destructiveinterventions aimed at identifying the problem sources (Balarasand Argiriou, 2002). Inspections of building envelopes with ther-mal infrared (TIR) images can be used to detect heat losses, cracks,thermal bridges, air leakages, insulation problems in walls androofs, moisture sources and other issues with thermal signature.
Moreover, the recent development of Unmanned Aerial Vehicle(UAV) platforms represents a great advantage for the data col-lection process, introducing a low-cost solution that is able toquickly deliver high temporal and spatial resolution information(Nex and Remondino, 2014). Thermal imaging cameras mountedon UAV systems thus allow an easy inspection not only of the fa-cades, but also of the building roof, that cannot be captured byterrestrial images.
The analysis of TIR images can be complicated, since it is mostlydone manually and images are often interpreted individually, with-out having a comprehensive view of the building, thus limiting inthis way the full potential of this technique. In order to moni-tor big structures, therefore, a 3D building model becomes es-sential (Hoegner and Stilla, 2016). However, exploiting existingPhotogrammetry and Computer Vision algorithms - developed toprocess RGB images - for the 3D reconstruction from TIR im-ages is a topic that has not been fully explored yet. The geometriccalibration of a thermographic camera has been studied in someworks (Luhmann et al., 2013, Laguela et al., 2011). (Hoegner andStilla, 2015) propose a method for automatic texturing of building
∗Corresponding author
facades from terrestrial thermal infrared image sequences, while(Pech et al., 2013) analyze the problem of using a TIR camera onan UAV for acquiring multi-temporal thermal images and gener-ating thermal orthophotos. In (Khodaei et al., 2015) it is demon-strated that Digital Surface Models (DSM) generated from aerialthermal imagery can have comparable accuracy with respect tothe one derived from visible images, while in (Hoegner et al.,2014) a fusion of time-of-flight depth images and TIR images isused to create an accurate 3D point cloud for subsequent scenesegmentation and people detection. Moreover, the co-registrationof images taken with both RGB and TIR cameras can give advan-tages in terms of accuracy and density of the resulting 3D pointcloud, as highlighted in (Hoegner and Stilla, 2016, Hoegner et al.,2016).
The aim of this paper is first to show that a high quality 3D modelreconstruction of a building can be obtained in a fast and auto-matic way from TIR images only, using the commercial ComputerVision software 3DF Zephyr, developed by 3Dflow1. Secondly,we also propose an automatic method for the integration of TIRand RGB images. The process is based on the registration withIterative Closest Point (ICP) algorithm of dense point clouds, ex-tracted from both datasets, and can be efficiently carried out en-tirely within the software. This approach allows to combine highresolution and geometric accuracy of RGB images with the ther-mal information deriving from TIR images.
The paper is organized as follows. In Sec. 2 the algorithms for re-constructing a 3D model directly from TIR images are described,while in Sec. 3 the procedure to automatically integrate TIR andRGB images is illustrated. Experimental validation of the twomethods are reported in the respective sections, and discussed inSec. 4.
2. AUTOMATIC 3D RECONSTRUCTION FROMTHERMAL INFRARED IMAGES
Three-dimensional models of a subject can be obtained directlyfrom unordered, uncalibrated TIR images using state-of-the-art
1www.3dflow.net
Photogrammetry and Computer Vision techniques. In the follow-ing sections, we will review the 3D reconstruction pipeline imple-mented in 3DF Zephyr, that is composed by three main modules,Samantha (Toldo et al., 2015), Stasia (Toldo et al., 2013) andSasha. Starting from a set of images, Samantha is able to auto-matically recover the orientation (position and angular attitude)of the images. The robust auto-calibration algorithm that char-acterizes Samantha makes it possible to work with any digitalcamera, including TIR ones. Stasia extracts dense and accuratepoint clouds by multi-views stereo, while Sasha finally producesa texture mapped triangular mesh.
2.1 Structure-and-motion
The first step of Samantha is key-points extraction through thedetector proposed by (Lindeberg, 1998), where blobs with as-sociated scale levels are identified from scale-space extrema ofthe scale-normalized Laplacian. As for the descriptor, Samanthaimplements a 128-dimensional radial descriptor (similar to thelog-polar grid of GLOH described by (Mikolajczyk and Schmid,2005)), based on the accumulated response of steerable deriva-tive filters. This combination of detector/descriptor performs ina comparable way to SIFT (Lowe, 2004), which is proved tobe well suited for features detection also in low resolution ther-mal imagery (Pech et al., 2013), and at the same time avoidspatent issues. Only a given number of key-points with the overallstrongest response are retained. This number is a multiple of n(number of images), so as to fix the average quota of key-pointsper image.
As the images can be unordered, one must then recover the epipo-lar graph, i.e., the graph that tells which images overlap (or canbe matched) with each other. This must be done in a computa-tionally efficient way, without trying to match key-points betweenevery image pair. In this broad phase only a small constant num-ber of descriptors for each image is considered, and in particularthe key-points with the higher scales, since their descriptors aremore representative of the whole image content. So, each key-point descriptor is matched to its approximated nearest neighborsin feature space. A 2D histogram is then built that registers ineach bin the number of matches between the corresponding im-ages. Instead of directly picking pairs with the highest score inthe histogram, that tends to create in the graph cliques of verysimilar images with weak inter-clique connection, an alternativeapproach based on taking maximum spanning trees is adopted,which creates a strongly connected epipolar graph (Toldo et al.,2015).
Subsequently, key-point matching follows a nearest neighbor ap-proach with ”ratio test” (Lowe, 2004), namely rejection of thosekey-points for which the ratio of the nearest neighbor distanceto the second nearest neighbor distance is greater than a thresh-old. Matches that are not injective are discarded. Homographiesand fundamental matrices between pairs of matching images arethen computed using M-estimator SAmple Consensus (MSAC), avariation of RANSAC proposed by (Torr and Zisserman, 2000),and outliers are rejected. In the end, if the number of remain-ing matches between two images is less than 20% of the totalnumber of matches before MSAC, they are discarded. The ratio-nale is that if an excessive fraction of outliers has been detected,the original matches are altogether unreliable (Brown and Lowe,2003). After that, key-point matching in multiple images are con-nected into tracks: consider the undirected graph key-points arethe nodes and edges represent matches; a track is a connectedcomponent of that graph. Vertices are labeled with the image the
key-points belong to: an inconsistency arises when in a track a la-bel occurs more than once. Inconsistent tracks and those shorterthan three frames are discarded. A track represents the projectionof a single 3D tie-point imaged to multiple exposures.
In the next step, images are organized into a tree (or dendrogram)with agglomerative clustering, using a measure of overlap as theaffinity. The structure-and-motion computation follows this treefrom the leaves to the root, where images are stored in the leavesand partial models (sets of exposures and 3D points expressed ina local reference frame) correspond to internal nodes.
The whole hierarchical structure-and-motion approach relies onfour basic photogrammetric procedures, that are implemented inSamantha with a special attention to outliers resilience. Intersec-tion (a.k.a. triangulation) is the procedure of computing 3D pointcoordinates from corresponding points in multiple images; Re-section consist in recovering the camera matrix (or the exteriorparameters only) from known 3D-2D correspondences; Relativeorientation is the task of retrieving the relative position and at-titude of two cameras from corresponding points in the two im-ages; Finally, absolute orientation requires to compute the rigid(or similarity) transformation that brings two models that sharesome tie-points into a common reference frame. The hierarchicalalgorithm can be summarized as follows:
1. Solve many independent relative orientation problems at theleaves of the tree, producing many independent stereo-models.
2. Traverse the tree; in each node one of these operations takesplace:
(a) Update one model by adding one image with resectionfollowed by intersection;
(b) Merge two independent models with absolute orien-tation. Once the models are registered, tie-points areupdated by intersection, and the new model is refinedwith bundle block adjustment.
If the tree reduces to a chain, the algorithm performs only steps1. and 2.(a) which is tantamount to the classical resection-intersectionsequential pipelines.
If the tree is perfectly balanced, only steps 2.(b) are taken, and theresulting procedure resembles the photogrammetric IndependentModels Block Adjustment (IMBA) (Kraus, 1997) (where for eachpair of overlapping images, a stereo-model is built and then allthese independent models are simultaneously transformed into acommon reference frame with absolute orientation), besides thefact that the models are disjoint and are recursively merged inpairs.
Compared to the standard sequential approach, this frameworkhas a lower computational complexity, is independent of the ini-tial pair of images, and copes better with drift problems, typicalof sequential schemes. In any case, the final step is a bundle blockadjustment.
The auto-calibration method of Samantha (Gherardi and Fusiello,2010) is able to compute the interior parameters of the imageswithout providing any control point. It is based on the enumer-ation of the inherently bounded space of the interior parametersof two cameras in order to find the collineation of space that up-grades a given projective reconstruction to Euclidean. Each sam-ple of the search space (which reduces to a finite subset of R2 un-der mild assumptions) defines a consistent plane at infinity. This
in turn produces a tentative, approximate Euclidean upgrade ofthe whole reconstruction which is then scored according to theexpected intrinsic parameters of a Euclidean camera.
2.2 Model georeferencing
Images taken by a camera mounted on a UAV are often providedwith GNSS/INS information, that can be exploited as initial val-ues for the unknown estimated orientation parameters. However,their availability is not guaranteed. In any case, Samantha doesnot require any ancillary information (GNSS/INS measures orcalibration parameters); the resulting camera orientation and 3Dpoints coordinates are expressed in a local reference frame anddefined up to a scale.
In order to transfer the model coordinates into a global coordinatesystem and to remove the scale ambiguity, a similarity transfor-mation must be computed. This can be done as soon as at leastthree Ground Control Points (GCPs) are available, whose coordi-nates are measured independently (by GNSS or other techniques)and are expressed in the global reference frame. These controlpoints are identified manually in the images and their position inthe 3D space is estimated by intersection. Correspondences be-tween true and estimated 3D coordinates are used to transformthe model with a similarity that aligns the control points in aleast-squares sense. Please note that GCPs can also be used asa constraint to optimize the 3D reconstruction.
2.3 Multi-view stereo
The aim of multi-view stereo is to recover a dense point cloudrepresenting the surface of the imaged object, given images po-sition and attitude. In 3DF Zephyr this procedure is performedthrough Stasia (Toldo et al., 2013).
The first step of the algorithm is the extraction of depth hypothe-sis. The goal of this phase is to estimate a number of candidatesdepths for each pixel m and for each image Ii. These hypothesiswill be later used as labels in a Markov Random Field (MRF) thatextracts the final depth map δi(m). Similarly to many multi-viewstereo algorithms, a pixel-level matching along epipolar lines isused, with Normalized Cross Correlation (NCC) as the matchingmetric, which gives a good trade-off between speed and robust-ness to photometric nuisances. Every depth map is created inde-pendently from the others. The extraction of candidate depths isperformed by considering the reference image Ii and three neigh-boring views η(Ii), chosen on the basis of the sparse structureand the visibility information provided by Samantha. The candi-date depths for each pixel are searched along the optical ray, orequivalently, along the epipolar line of each neighboring imageusing block matching and NCC. In this way, a correlation pro-file Cj(ζ), parameterized with the depth ζ, is computed for everypixel m and every neighbor image Ij ∈ η(Ii).
Candidate depths correspond to local peaks of the correlation(peaks with a NCC value lower than 0.6 are discarded). Since thesearch range of each pixel depth can heavily impact the perfor-mance of the algorithm, information coming from the structure-and-motion is used to limit the search range.
The final depth map δi is generated from the depth hypothesis us-ing a discrete MRF optimization technique over the image grid.Depth maps are then lifted in 3D space to produce a photocon-sistency volume φ, represented by an octree that accumulates thescores coming from each depth map δi. In order to avoid any
loss of accuracy, a moving average approach is used inside eachbin. At the end of the lifting process, each cell x contains a 3Dpoint position – which can be shifted with respect to the cell cen-ter – and a photoconsistency value φ(x) given by the sum of thecorrelation scores of the points that fall in that bin. The photo-consistency volume at this stage contains a lot of spurious points,which do not belong to a real surface. They are characterizedby two features: i) their photoconsistency is generally lower thanactual surface points, and ii) they usually occludes actual sur-face points. This observation leads to an iterative strategy wherethe photoconsistency of an occlusor is decreased by a fraction ofthe photoconsistency of the occluded point. Points with negativephotoconsistency are eventually removed.
2.4 Mesh generation and texture mapping
At the end of the process, a surface is generated by the modulecalled Sasha. It employs the Poisson algorithm (Kazhdan et al.,2006) starting with normals computed, at each point, by fitting aplane to the closer neighbors. Normal direction is disambiguatedwith visibility.
In addition, the surface can be further optimized inside the soft-ware with an optimization algorithm based on photoconsistency.As the initial surface reconstruction method is interpolatory andsince the point cloud may contain a decent amount of noise, theobtained initial mesh is normally noisy and may fail to capturefine details. By using all the image data, this mesh is refinedwith a variational Multi-view stereo approach: the initial meshis used as the initial condition of a gradient descent of an ade-quate energy functional with an algorithm similar to (Faugerasand Keriven, 2002, Vu et al., 2012).
Finally a texture (TIR) map is built by wisely making use of boththe visibility and the view angle information.
2.5 Experiments
To assess the applicability of the proposed method, a dataset of130 TIR images was acquired by a Optris PI450 LW thermal in-frared camera (wavelength range from 7 µm to 13 µm), with adetector of 382 × 288 pixels and a temperature resolution of 0.4mK.
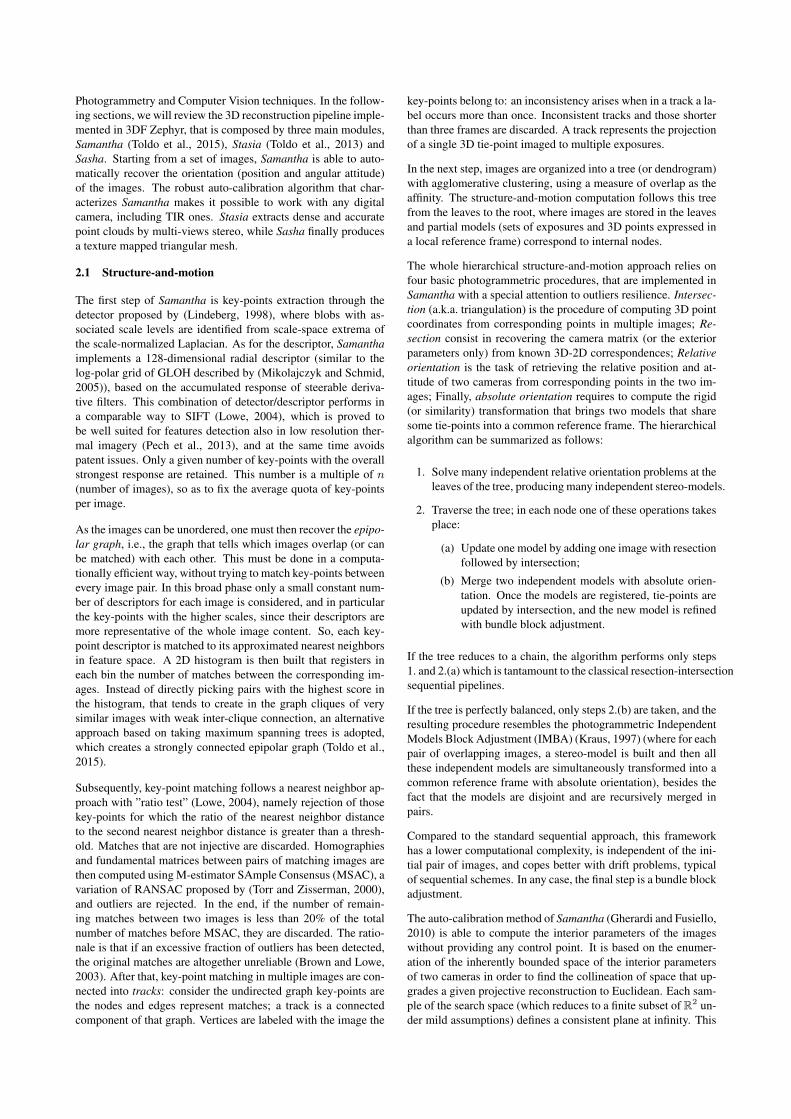
Figure 1. UAV platform used for the survey.
The camera was mounted on a octorotor UAV with a total payloadof 4 kg, roll and pitch axis stabilization, and a flight time of 20minutes (see Fig. 1). The flight was planned for the images tohave a forward and a side overlap of 80% and an average GroundSampling Distance (GSD) of 94 mm.
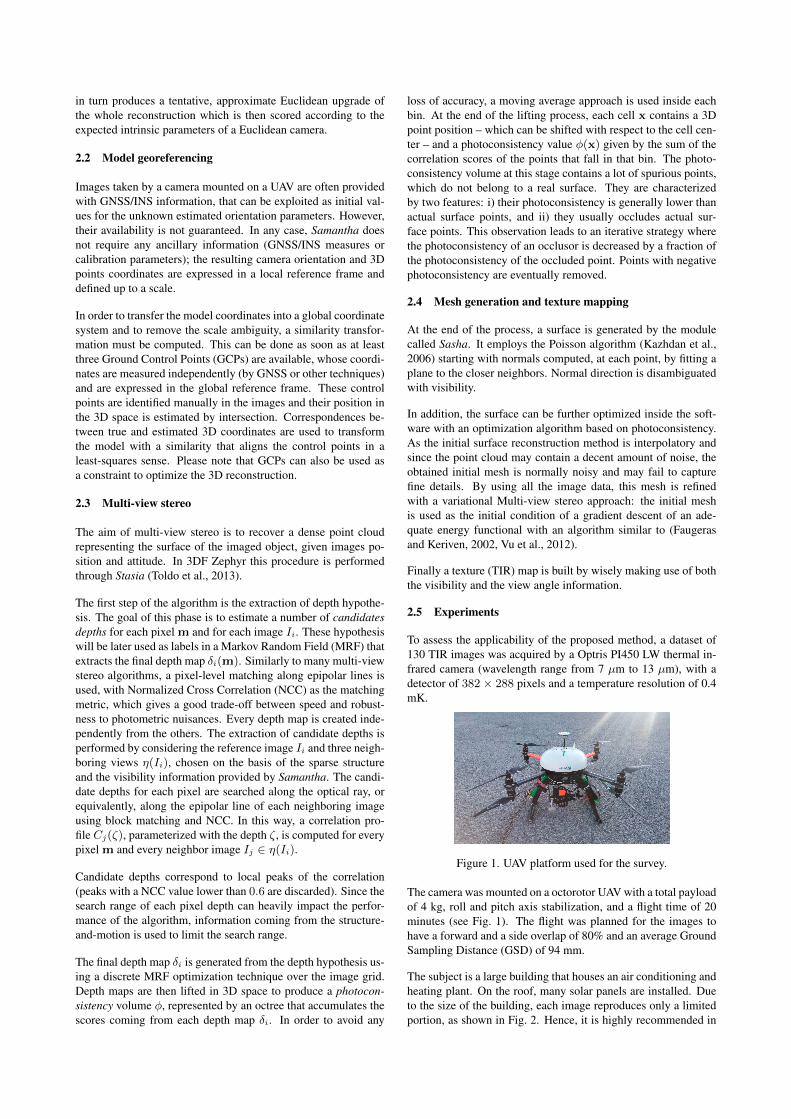
The subject is a large building that houses an air conditioning andheating plant. On the roof, many solar panels are installed. Dueto the size of the building, each image reproduces only a limitedportion, as shown in Fig. 2. Hence, it is highly recommended in
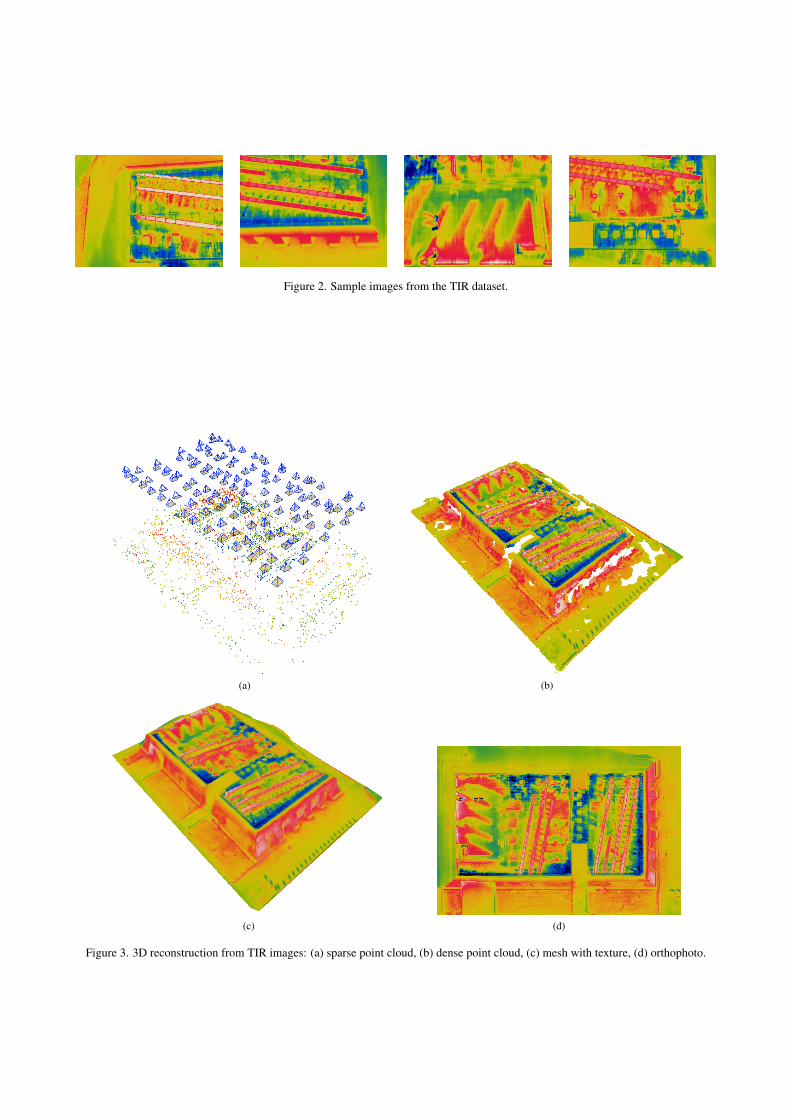
Figure 2. Sample images from the TIR dataset.
(a) (b)
(c) (d)
Figure 3. 3D reconstruction from TIR images: (a) sparse point cloud, (b) dense point cloud, (c) mesh with texture, (d) orthophoto.
this situation to create a 3D model and an ortophoto, in order tohave a comprehensive view of the building and to make it easierthe evaluation and interpretation of the thermal data.
Following the procedure described in Sec. 2, first the structure-and-motion algorithm was run to retrieve position and attitude ofeach image. After bundle adjustment, the RMSE was 0.31 pixeland the estimated reference variance was 0.35 squared pixel. Theresult, together with the generated sparse point cloud, is repre-sented in Fig. 3(a). Then the model was georeferenced exploitingthe coordinates of three GCPs, measured by highly accurate GPSdifferential positioning in a previous survey. This step was quitetricky, because the GCPs, placed on the edges of the building,were difficult to identify on the TIR images. In fact, the averageresidual was 0.8 m.
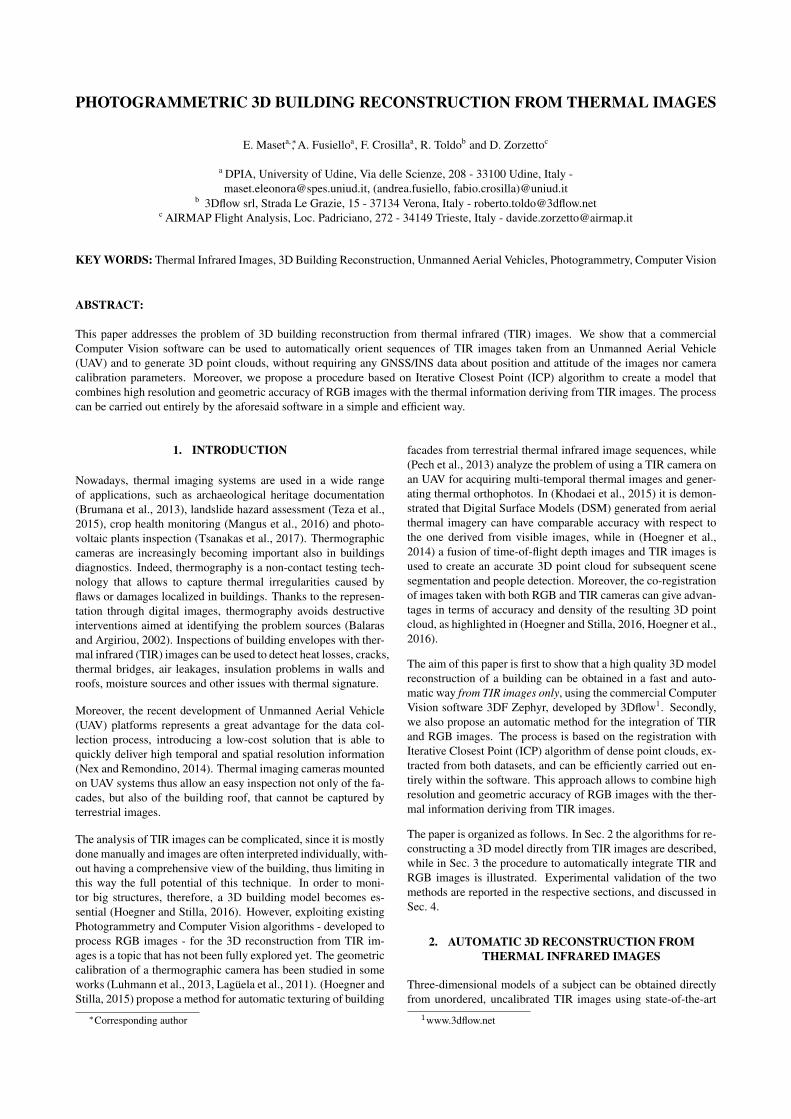
Subsequently, the dense point cloud (Fig. 3(b)) was created withthe multi-view stereo algorithm (Sec. 2.3). Please note that, ex-cept for some portions of the building facades and the sidewalkaround, the 3D point cloud has very high density and most of thedetails are reconstructed, including the solar panels (see Fig. 4).
Figure 4. Details of the dense point cloud generated from theTIR dataset. The solar panels on the roof of the building were
correctly reconstructed.
Finally, the mesh with texture was extracted (Fig. 3(c)) and a highquality thermal orthophoto was created (Fig. 3(d)). The entireprocess required less than 30 minutes on a PC with an Intel Corei5-4200M CPU @ 2.50GHz and 8GB RAM.
These results demonstrate how structure-and-motion and multi-view stereo algorithms can be successfully applied to create highdetailed dense point cloud, 3D models and orthophoto directlyfrom unordered, uncalibrated TIR images, without requiring ad-ditional RGB images or ancillary information. This makes TIRimages of immediate use, reducing considerably the processingtime.
However, due to low geometric resolution and low contrast ofTIR images, 3D point clouds generated directly from them havea lower accuracy than those obtained from RGB images. There-fore, when RGB images of the same area are already available, itmight be wise to try and use them, as we will discuss in the nextsection.
3. INTEGRATION OF TIR AND RGB IMAGES
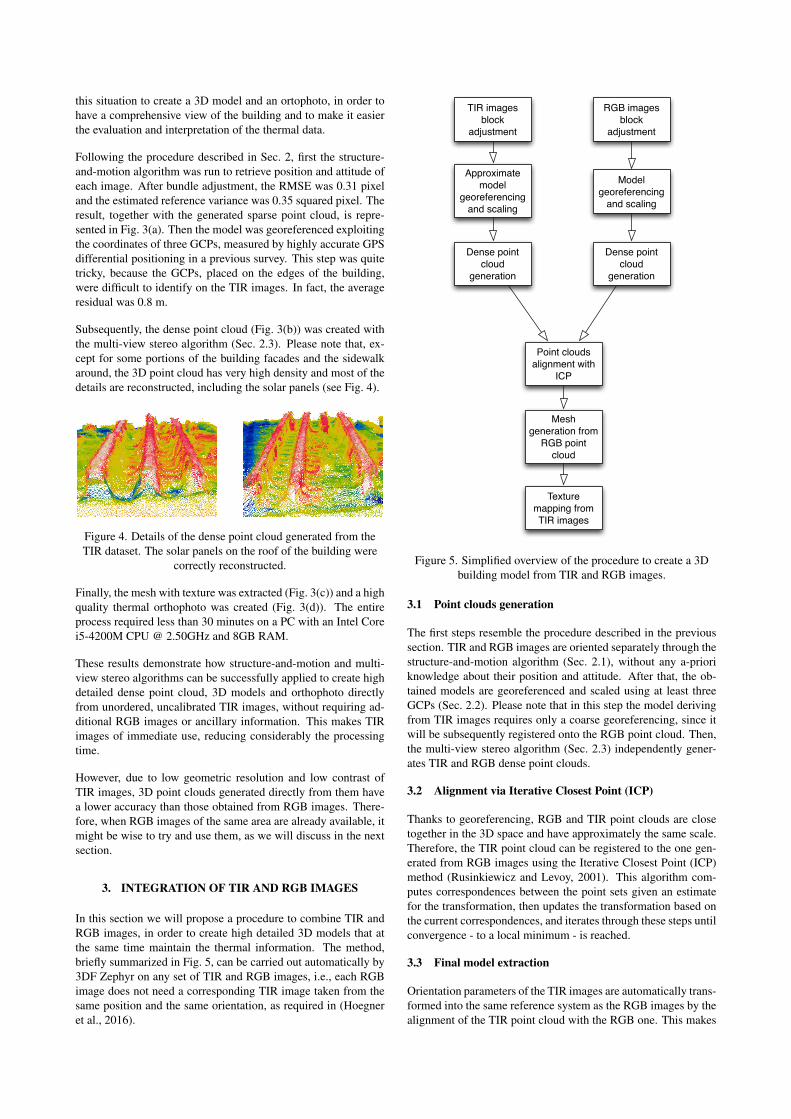
In this section we will propose a procedure to combine TIR andRGB images, in order to create high detailed 3D models that atthe same time maintain the thermal information. The method,briefly summarized in Fig. 5, can be carried out automatically by3DF Zephyr on any set of TIR and RGB images, i.e., each RGBimage does not need a corresponding TIR image taken from thesame position and the same orientation, as required in (Hoegneret al., 2016).
TIR images block
adjustment
Approximate model
georeferencing and scaling
Dense point cloud
generation
RGB images block
adjustment
Model georeferencing
and scaling
Dense point cloud
generation
Point clouds alignment with
ICP
Mesh generation from
RGB point cloud
Texture mapping from TIR images
Figure 5. Simplified overview of the procedure to create a 3Dbuilding model from TIR and RGB images.
3.1 Point clouds generation
The first steps resemble the procedure described in the previoussection. TIR and RGB images are oriented separately through thestructure-and-motion algorithm (Sec. 2.1), without any a-prioriknowledge about their position and attitude. After that, the ob-tained models are georeferenced and scaled using at least threeGCPs (Sec. 2.2). Please note that in this step the model derivingfrom TIR images requires only a coarse georeferencing, since itwill be subsequently registered onto the RGB point cloud. Then,the multi-view stereo algorithm (Sec. 2.3) independently gener-ates TIR and RGB dense point clouds.
3.2 Alignment via Iterative Closest Point (ICP)
Thanks to georeferencing, RGB and TIR point clouds are closetogether in the 3D space and have approximately the same scale.Therefore, the TIR point cloud can be registered to the one gen-erated from RGB images using the Iterative Closest Point (ICP)method (Rusinkiewicz and Levoy, 2001). This algorithm com-putes correspondences between the point sets given an estimatefor the transformation, then updates the transformation based onthe current correspondences, and iterates through these steps untilconvergence - to a local minimum - is reached.
3.3 Final model extraction
Orientation parameters of the TIR images are automatically trans-formed into the same reference system as the RGB images by thealignment of the TIR point cloud with the RGB one. This makes
it possible to associate the thermal information deriving from theTIR dataset to the 3D point clouds calculated from the RGB im-ages. The final surface is generated from the RGB point cloudsthrough the Poisson algorithm (Sec. 2.4), thus maintaining thegeometric accuracy and the high level of detail arising from im-ages acquired in the visible spectrum, whereas the texture mapis built from TIR images. The texture coordinates are obtainedprojecting the vertices of the RGB mesh into the TIR images.
3.4 Experiments
To evaluate the procedure proposed for the integration of TIRand RGB images, an already available dataset of 27 RGB imagestaken over the same area was used. The images were acquiredtwo years before with a Canon Power Shot S100 camera (1/1.7CMOS sensor) with an image size of 3000× 4000 pixels and anaverage GSD of 27 mm.
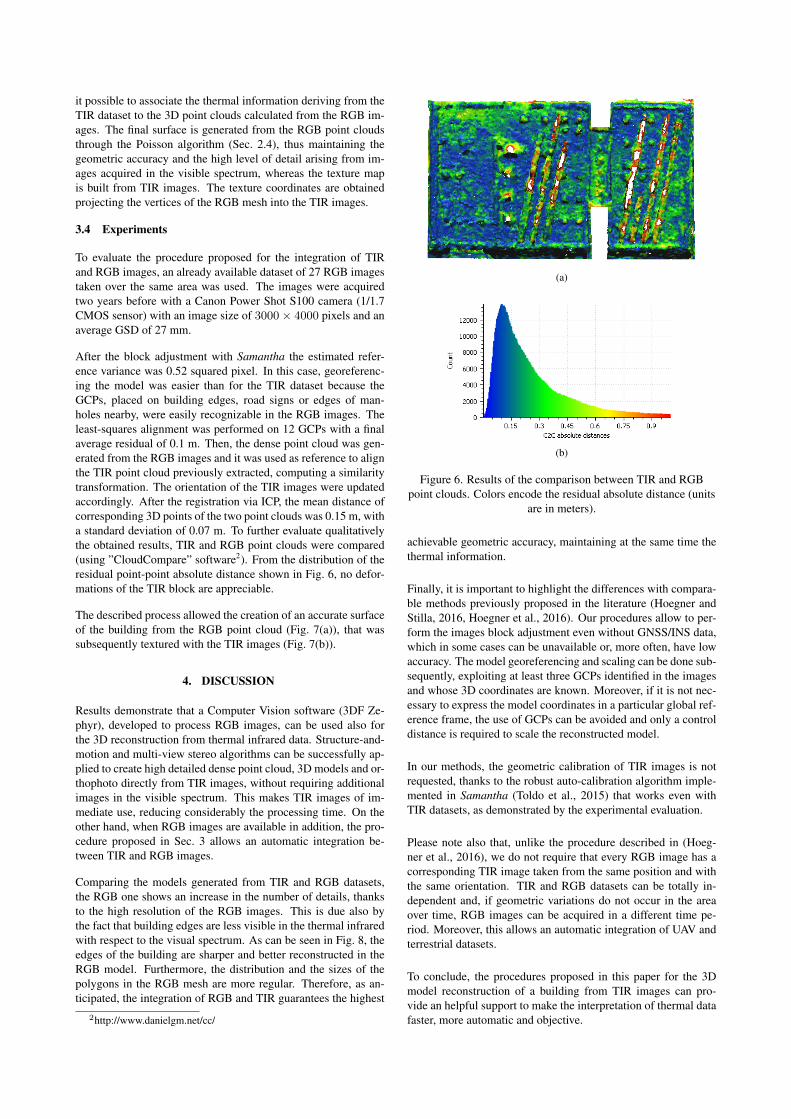
After the block adjustment with Samantha the estimated refer-ence variance was 0.52 squared pixel. In this case, georeferenc-ing the model was easier than for the TIR dataset because theGCPs, placed on building edges, road signs or edges of man-holes nearby, were easily recognizable in the RGB images. Theleast-squares alignment was performed on 12 GCPs with a finalaverage residual of 0.1 m. Then, the dense point cloud was gen-erated from the RGB images and it was used as reference to alignthe TIR point cloud previously extracted, computing a similaritytransformation. The orientation of the TIR images were updatedaccordingly. After the registration via ICP, the mean distance ofcorresponding 3D points of the two point clouds was 0.15 m, witha standard deviation of 0.07 m. To further evaluate qualitativelythe obtained results, TIR and RGB point clouds were compared(using ”CloudCompare” software2). From the distribution of theresidual point-point absolute distance shown in Fig. 6, no defor-mations of the TIR block are appreciable.
The described process allowed the creation of an accurate surfaceof the building from the RGB point cloud (Fig. 7(a)), that wassubsequently textured with the TIR images (Fig. 7(b)).
4. DISCUSSION
Results demonstrate that a Computer Vision software (3DF Ze-phyr), developed to process RGB images, can be used also forthe 3D reconstruction from thermal infrared data. Structure-and-motion and multi-view stereo algorithms can be successfully ap-plied to create high detailed dense point cloud, 3D models and or-thophoto directly from TIR images, without requiring additionalimages in the visible spectrum. This makes TIR images of im-mediate use, reducing considerably the processing time. On theother hand, when RGB images are available in addition, the pro-cedure proposed in Sec. 3 allows an automatic integration be-tween TIR and RGB images.
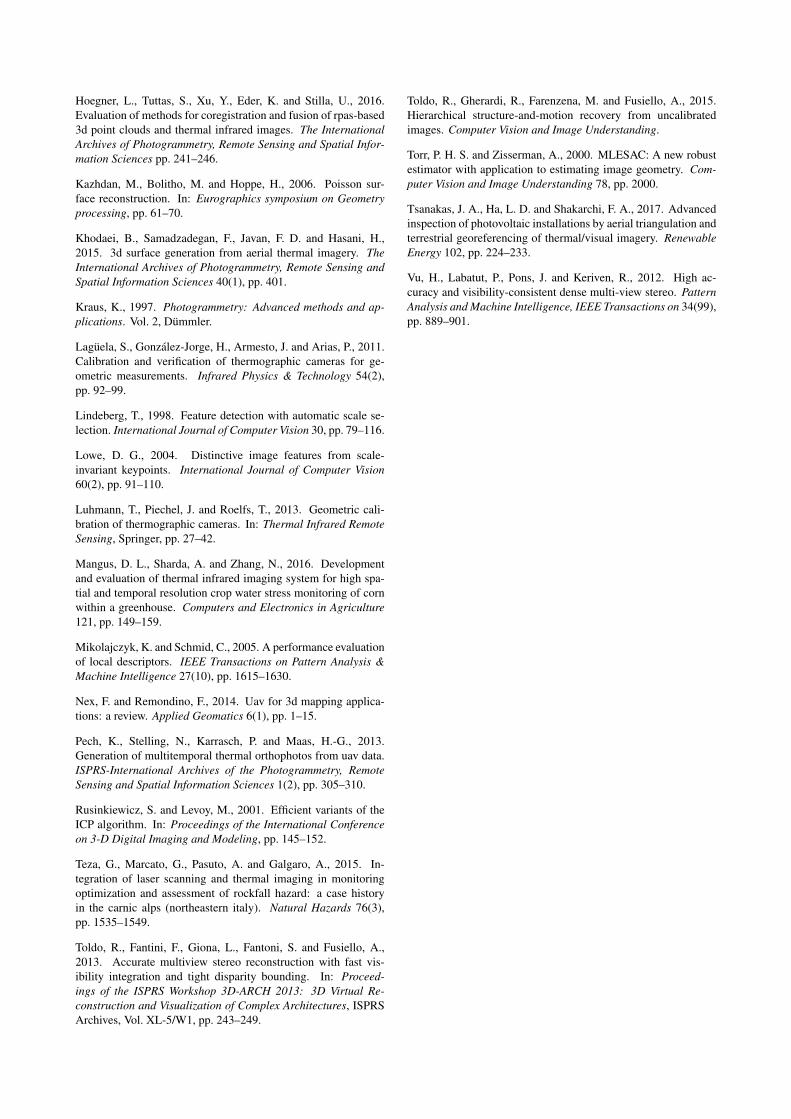
Comparing the models generated from TIR and RGB datasets,the RGB one shows an increase in the number of details, thanksto the high resolution of the RGB images. This is due also bythe fact that building edges are less visible in the thermal infraredwith respect to the visual spectrum. As can be seen in Fig. 8, theedges of the building are sharper and better reconstructed in theRGB model. Furthermore, the distribution and the sizes of thepolygons in the RGB mesh are more regular. Therefore, as an-ticipated, the integration of RGB and TIR guarantees the highest
2http://www.danielgm.net/cc/
(a)
(b)
Figure 6. Results of the comparison between TIR and RGBpoint clouds. Colors encode the residual absolute distance (units
are in meters).
achievable geometric accuracy, maintaining at the same time thethermal information.
Finally, it is important to highlight the differences with compara-ble methods previously proposed in the literature (Hoegner andStilla, 2016, Hoegner et al., 2016). Our procedures allow to per-form the images block adjustment even without GNSS/INS data,which in some cases can be unavailable or, more often, have lowaccuracy. The model georeferencing and scaling can be done sub-sequently, exploiting at least three GCPs identified in the imagesand whose 3D coordinates are known. Moreover, if it is not nec-essary to express the model coordinates in a particular global ref-erence frame, the use of GCPs can be avoided and only a controldistance is required to scale the reconstructed model.
In our methods, the geometric calibration of TIR images is notrequested, thanks to the robust auto-calibration algorithm imple-mented in Samantha (Toldo et al., 2015) that works even withTIR datasets, as demonstrated by the experimental evaluation.
Please note also that, unlike the procedure described in (Hoeg-ner et al., 2016), we do not require that every RGB image has acorresponding TIR image taken from the same position and withthe same orientation. TIR and RGB datasets can be totally in-dependent and, if geometric variations do not occur in the areaover time, RGB images can be acquired in a different time pe-riod. Moreover, this allows an automatic integration of UAV andterrestrial datasets.
To conclude, the procedures proposed in this paper for the 3Dmodel reconstruction of a building from TIR images can pro-vide an helpful support to make the interpretation of thermal datafaster, more automatic and objective.
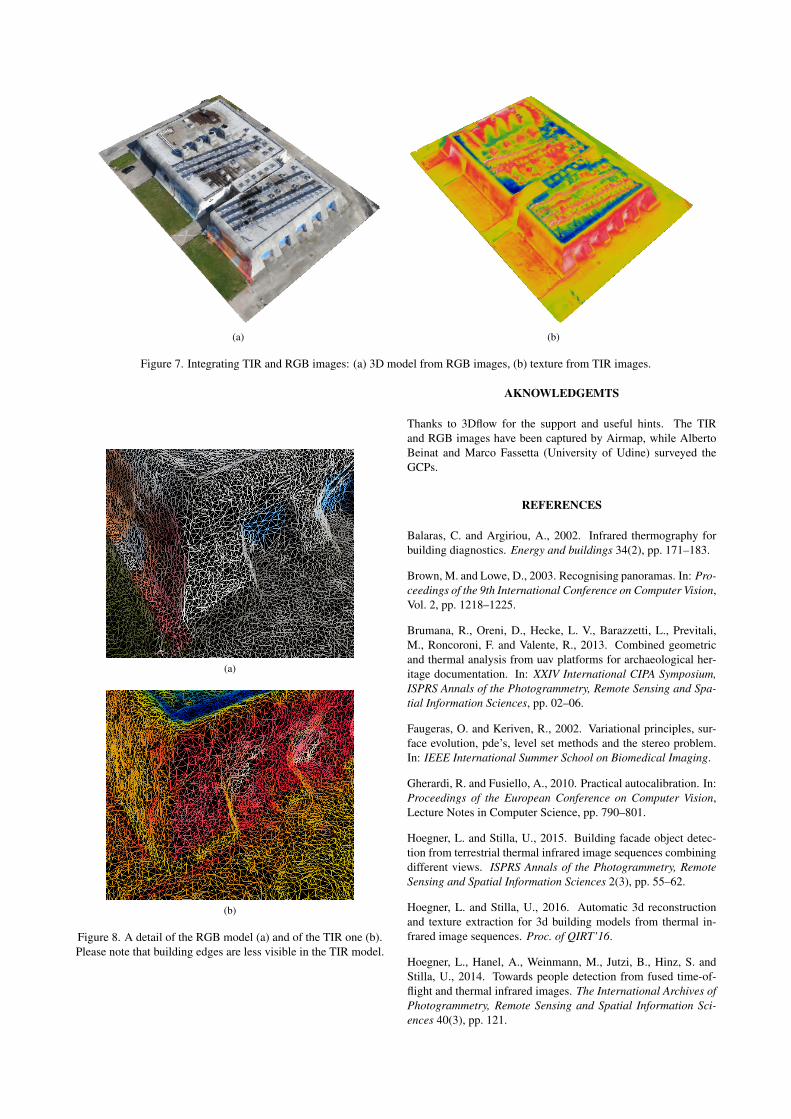
(a) (b)
Figure 7. Integrating TIR and RGB images: (a) 3D model from RGB images, (b) texture from TIR images.
(a)
(b)
Figure 8. A detail of the RGB model (a) and of the TIR one (b).Please note that building edges are less visible in the TIR model.
AKNOWLEDGEMTS
Thanks to 3Dflow for the support and useful hints. The TIRand RGB images have been captured by Airmap, while AlbertoBeinat and Marco Fassetta (University of Udine) surveyed theGCPs.
REFERENCES
Balaras, C. and Argiriou, A., 2002. Infrared thermography forbuilding diagnostics. Energy and buildings 34(2), pp. 171–183.
Brown, M. and Lowe, D., 2003. Recognising panoramas. In: Pro-ceedings of the 9th International Conference on Computer Vision,Vol. 2, pp. 1218–1225.
Brumana, R., Oreni, D., Hecke, L. V., Barazzetti, L., Previtali,M., Roncoroni, F. and Valente, R., 2013. Combined geometricand thermal analysis from uav platforms for archaeological her-itage documentation. In: XXIV International CIPA Symposium,ISPRS Annals of the Photogrammetry, Remote Sensing and Spa-tial Information Sciences, pp. 02–06.
Faugeras, O. and Keriven, R., 2002. Variational principles, sur-face evolution, pde’s, level set methods and the stereo problem.In: IEEE International Summer School on Biomedical Imaging.
Gherardi, R. and Fusiello, A., 2010. Practical autocalibration. In:Proceedings of the European Conference on Computer Vision,Lecture Notes in Computer Science, pp. 790–801.
Hoegner, L. and Stilla, U., 2015. Building facade object detec-tion from terrestrial thermal infrared image sequences combiningdifferent views. ISPRS Annals of the Photogrammetry, RemoteSensing and Spatial Information Sciences 2(3), pp. 55–62.
Hoegner, L. and Stilla, U., 2016. Automatic 3d reconstructionand texture extraction for 3d building models from thermal in-frared image sequences. Proc. of QIRT’16.
Hoegner, L., Hanel, A., Weinmann, M., Jutzi, B., Hinz, S. andStilla, U., 2014. Towards people detection from fused time-of-flight and thermal infrared images. The International Archives ofPhotogrammetry, Remote Sensing and Spatial Information Sci-ences 40(3), pp. 121.
Hoegner, L., Tuttas, S., Xu, Y., Eder, K. and Stilla, U., 2016.Evaluation of methods for coregistration and fusion of rpas-based3d point clouds and thermal infrared images. The InternationalArchives of Photogrammetry, Remote Sensing and Spatial Infor-mation Sciences pp. 241–246.
Kazhdan, M., Bolitho, M. and Hoppe, H., 2006. Poisson sur-face reconstruction. In: Eurographics symposium on Geometryprocessing, pp. 61–70.
Khodaei, B., Samadzadegan, F., Javan, F. D. and Hasani, H.,2015. 3d surface generation from aerial thermal imagery. TheInternational Archives of Photogrammetry, Remote Sensing andSpatial Information Sciences 40(1), pp. 401.
Kraus, K., 1997. Photogrammetry: Advanced methods and ap-plications. Vol. 2, Dummler.
Laguela, S., Gonzalez-Jorge, H., Armesto, J. and Arias, P., 2011.Calibration and verification of thermographic cameras for ge-ometric measurements. Infrared Physics & Technology 54(2),pp. 92–99.
Lindeberg, T., 1998. Feature detection with automatic scale se-lection. International Journal of Computer Vision 30, pp. 79–116.
Lowe, D. G., 2004. Distinctive image features from scale-invariant keypoints. International Journal of Computer Vision60(2), pp. 91–110.
Luhmann, T., Piechel, J. and Roelfs, T., 2013. Geometric cali-bration of thermographic cameras. In: Thermal Infrared RemoteSensing, Springer, pp. 27–42.
Mangus, D. L., Sharda, A. and Zhang, N., 2016. Developmentand evaluation of thermal infrared imaging system for high spa-tial and temporal resolution crop water stress monitoring of cornwithin a greenhouse. Computers and Electronics in Agriculture121, pp. 149–159.
Mikolajczyk, K. and Schmid, C., 2005. A performance evaluationof local descriptors. IEEE Transactions on Pattern Analysis &Machine Intelligence 27(10), pp. 1615–1630.
Nex, F. and Remondino, F., 2014. Uav for 3d mapping applica-tions: a review. Applied Geomatics 6(1), pp. 1–15.
Pech, K., Stelling, N., Karrasch, P. and Maas, H.-G., 2013.Generation of multitemporal thermal orthophotos from uav data.ISPRS-International Archives of the Photogrammetry, RemoteSensing and Spatial Information Sciences 1(2), pp. 305–310.
Rusinkiewicz, S. and Levoy, M., 2001. Efficient variants of theICP algorithm. In: Proceedings of the International Conferenceon 3-D Digital Imaging and Modeling, pp. 145–152.
Teza, G., Marcato, G., Pasuto, A. and Galgaro, A., 2015. In-tegration of laser scanning and thermal imaging in monitoringoptimization and assessment of rockfall hazard: a case historyin the carnic alps (northeastern italy). Natural Hazards 76(3),pp. 1535–1549.
Toldo, R., Fantini, F., Giona, L., Fantoni, S. and Fusiello, A.,2013. Accurate multiview stereo reconstruction with fast vis-ibility integration and tight disparity bounding. In: Proceed-ings of the ISPRS Workshop 3D-ARCH 2013: 3D Virtual Re-construction and Visualization of Complex Architectures, ISPRSArchives, Vol. XL-5/W1, pp. 243–249.
Toldo, R., Gherardi, R., Farenzena, M. and Fusiello, A., 2015.Hierarchical structure-and-motion recovery from uncalibratedimages. Computer Vision and Image Understanding.
Torr, P. H. S. and Zisserman, A., 2000. MLESAC: A new robustestimator with application to estimating image geometry. Com-puter Vision and Image Understanding 78, pp. 2000.
Tsanakas, J. A., Ha, L. D. and Shakarchi, F. A., 2017. Advancedinspection of photovoltaic installations by aerial triangulation andterrestrial georeferencing of thermal/visual imagery. RenewableEnergy 102, pp. 224–233.
Vu, H., Labatut, P., Pons, J. and Keriven, R., 2012. High ac-curacy and visibility-consistent dense multi-view stereo. PatternAnalysis and Machine Intelligence, IEEE Transactions on 34(99),pp. 889–901.