Embed Size (px)
Citation preview
1
PHOTOGRAMMETRIC ANALYSIS OF SOLAR CONCENTRATORS
Mark R. Shortis Science, Engineering and Technology Portfolio, RMIT University, GPO Box 2476V, Melbourne 3001, Australia
Phone: +61 3 9925 4846 Fax: +61 3 9925 4343
Glen H. G. Johnston Excelsia Accomplis 31 Neilson Street
Garran, ACT 2605, Australia Phone: +61 2 6282 3078
Klaus Pottler German Aerospace Centre (DLR) Institute
of Technical Thermodynamics Plataforma Solar de Almería
P.O. Box 39, Tabernas, 04200, Spain Phone: +34 950 387935
Fax: +34 950 365313
Eckhard Lüpfert German Aerospace Centre (DLR) Institute
of Technical Thermodynamics Plataforma Solar de Almería
P.O. Box 39, Tabernas, 04200, Spain Phone: +34 950 387915
Fax: +34 950 365313
Abstract Digital close range photogrammetry has proven to be a precise and efficient measurement technique for the assessment of shape accuracies of solar concentrators and their components. The combination of high quality megapixel digital still cameras, appropriate software, suitable targeting and calibrated reference scales in general is sufficient to provide coordinate measurements with precisions of 1:50,000 or better. The extreme flexibility of photogrammetry to provide high accuracy three dimensional coordinate measurements over almost any scale makes it particularly appropriate for the measurement of solar concentrator systems. Photogrammetry can also provide information for the analysis of curved shapes and surfaces, which can be very difficult to achieve with conventional measurement techniques. A selection of measurement projects carried out on whole solar concentrators and their components will be presented. The potential of photogrammetry will be demonstrated by presenting measured effects arising from thermal expansion and gravitational forces on selected components. The measured surface data can be used to calculate slope errors and undertake ray trace studies to compute intercept factors and assess concentrator qualities.
Introduction The optical performance of solar concentrating collectors is very sensitive to inaccuracies of components and assembly. Because of a finite sun shape and small imperfections in the collector system such as component alignments, the interception of light at the focal receiver is reduced. High precision photogrammetry is an efficient and effective tool to measure 3D coordinates of concentrator support points and mirror surfaces, especially for the analysis of

2
large concentrators [Shortis and Johnston, 1996, 1997; Lüpfert et al., 2003]. In contrast to measurement tools for monitoring solar flux in the focal region [Riffelmann et al., 2003; Ulmer et al., 2004], the photogrammetric method directly delivers coordinates of selected test points and thus allows performance assessments of the concentrator to be made. Whereas other surface evaluation methods are limited to special shapes such as point focusing devices [Wendelin and Grossman, 1995] or limited to linear parabolic concentrators indoors [Butler and Pettit, 1977] or outdoor laser ray tracing [Hansche, 1978], photogrammetry is a universal method for testing almost any type of concentrator or structure. With appropriate retro-reflective targets and flashlight photogrammetric measurement can be performed during the day, even in bright sunlight. After installation of the targets, the actual measurement time is brief, often limited to half an hour. Depending on the size of the project, the time taken from the start of target placement to final extraction of target coordinates is usually of the order of a few hours to one full working day.
Measurement of Concentrator Geometry To illustrate the coordinate data that can be obtained using photogrammetry, the measurement of a EuroTrough collector module is presented. Figure 1 shows the space frame of the module in its zenithal orientation, the position in which all presented EuroTrough measurements were undertaken.
Figure 1: Space frame of a EuroTrough module with measurement targets on the mirror support points
Retro-reflective targets were placed on all 112 of the mirror support points. In common with the other projects described in this paper, coded targets were also placed to provide scale and a recoverable reference for the coordinate system. This measurement was undertaken to check the assembly accuracy of these kinds of modules. The photogrammetric measurement included 92 exposures. This high number of photos was necessary because of the special shape of the module, to compensate for less favourable photography conditions. Digital images were captured with a Rollei RD7 metric camera, which has a 2552 by 1920 CCD sensor, for this and all projects described in the paper. For the module, an object space precision of 0.2 mm was achieved from the photogrammetric network. Figure 2 illustrates some results of this measurement, based on interpolation between the measured data points.
3
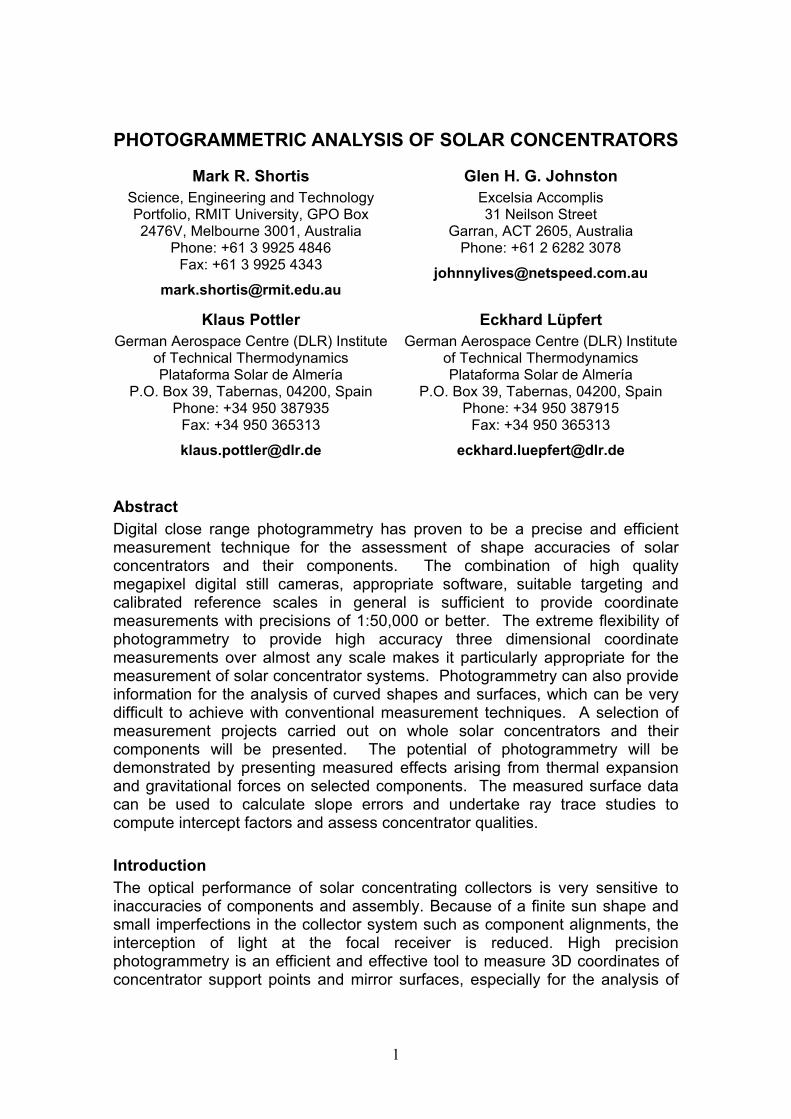
The maximal deviations from the design heights (top left and right edges of the image) indicate two incorrectly mounted mirror support clamps. The standard deviation of the height variations for all measured points is 1 mm. The bending of the structure, which was supported at central points on the left and right ends of the module, can be observed by the characteristic lower points in the centre part of the module as compared to the ends. Similar bending was found on all measured modules. After measuring the space frame, special retro-reflective targets were applied to the concentrator mirrors and the mirrors mounted onto the frame. The complete concentrator element is shown in Figure 3.
Figure 2: Deviations of EuroTrough mirror support points from design heights in mm
Figure 3: EuroTrough collector element with measurement targets on the mirrors
This module was measured again with photogrammetry, again achieving an object space precision of 0.2mm, in this case from a network of 116 exposures. The targets were fixed on the glass surface which, due to the thickness of the glass, placed them about 4 mm above the reflective surfaces of the mirrors. As for all measurements with targets on mirror surfaces, the targets cannot be positioned exactly on the desired surface and the separation distances may be variable. Further, data of the actual collector axes is difficult to measure because of poor accessibility of the axes in some cases or even non-existence of axes in other cases. Therefore the photogrammetric results had to be post-processed to transform the measured target coordinates to an established reference system. Figure 4 illustrates the shape deviations of 364 surface points
4
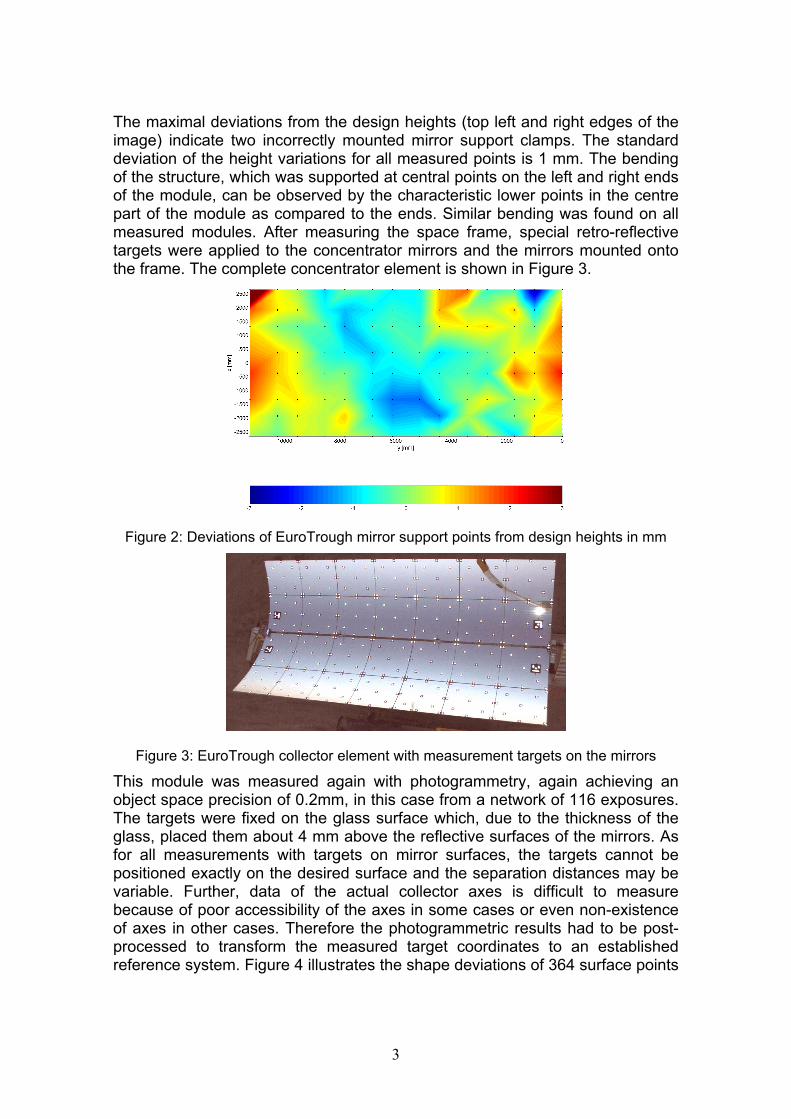
over the whole concentrator module mirror surface after mirror assembly and correction of the support clamp at the top left corner of Figure 2. The optical performance of a trough concentrator depends on the slope errors, which tend to deviate the reflected rays away from the ideal focal line. Figure 5 shows results for the slope errors in the x-direction (perpendicular to the absorber axis). The slope errors were approximated by the slope deviations from the ideal parabolic section line of neighbouring points on 35 sections in the y-direction.
Figure 4: Deviations from the design heights (exaggerated) for the EuroTrough mirror
surface.
Figure 5: Transversal slope errors of neighbouring points in milliradian.
Inspection of the figure indicates that the overall precision of the EuroTrough collector module assembly with mirror facets has maximal slope errors in the transversal direction of about 1.1 seconds of arc (5.2 milliradians) with a standard deviation of 0.4 seconds. It should be noted that this analysis investigated the quality of the EuroTrough space frame and mirror assembly. In order to calculate the optical intercept factor and conduct ray trace analysis, many more mirror points would have to be measured with high accuracy.
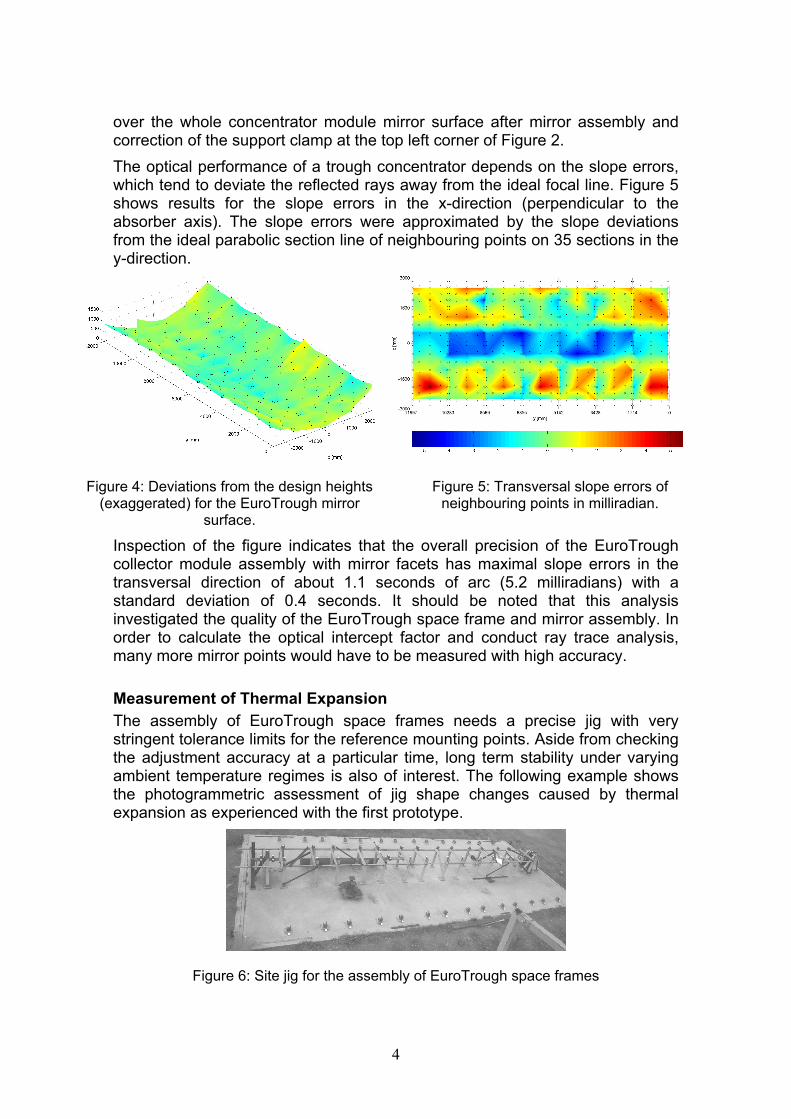
Measurement of Thermal Expansion The assembly of EuroTrough space frames needs a precise jig with very stringent tolerance limits for the reference mounting points. Aside from checking the adjustment accuracy at a particular time, long term stability under varying ambient temperature regimes is also of interest. The following example shows the photogrammetric assessment of jig shape changes caused by thermal expansion as experienced with the first prototype.
Figure 6: Site jig for the assembly of EuroTrough space frames
5
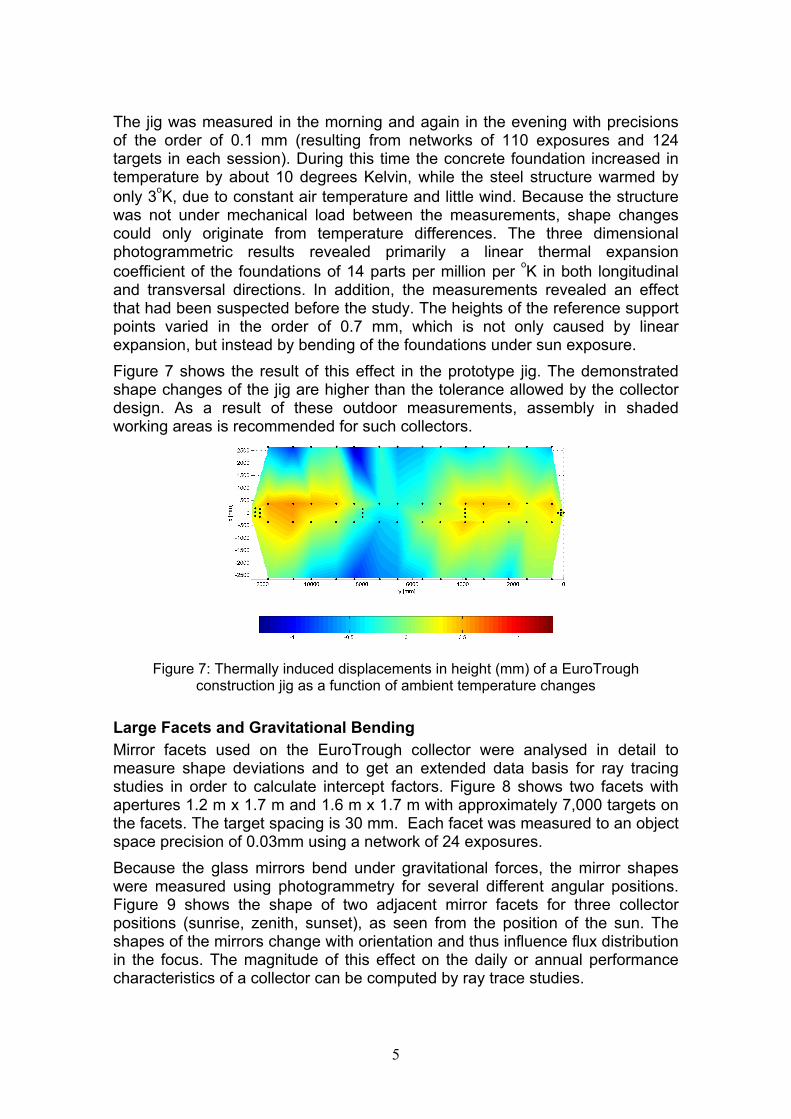
The jig was measured in the morning and again in the evening with precisions of the order of 0.1 mm (resulting from networks of 110 exposures and 124 targets in each session). During this time the concrete foundation increased in temperature by about 10 degrees Kelvin, while the steel structure warmed by only 3oK, due to constant air temperature and little wind. Because the structure was not under mechanical load between the measurements, shape changes could only originate from temperature differences. The three dimensional photogrammetric results revealed primarily a linear thermal expansion coefficient of the foundations of 14 parts per million per oK in both longitudinal and transversal directions. In addition, the measurements revealed an effect that had been suspected before the study. The heights of the reference support points varied in the order of 0.7 mm, which is not only caused by linear expansion, but instead by bending of the foundations under sun exposure. Figure 7 shows the result of this effect in the prototype jig. The demonstrated shape changes of the jig are higher than the tolerance allowed by the collector design. As a result of these outdoor measurements, assembly in shaded working areas is recommended for such collectors.
Figure 7: Thermally induced displacements in height (mm) of a EuroTrough construction jig as a function of ambient temperature changes
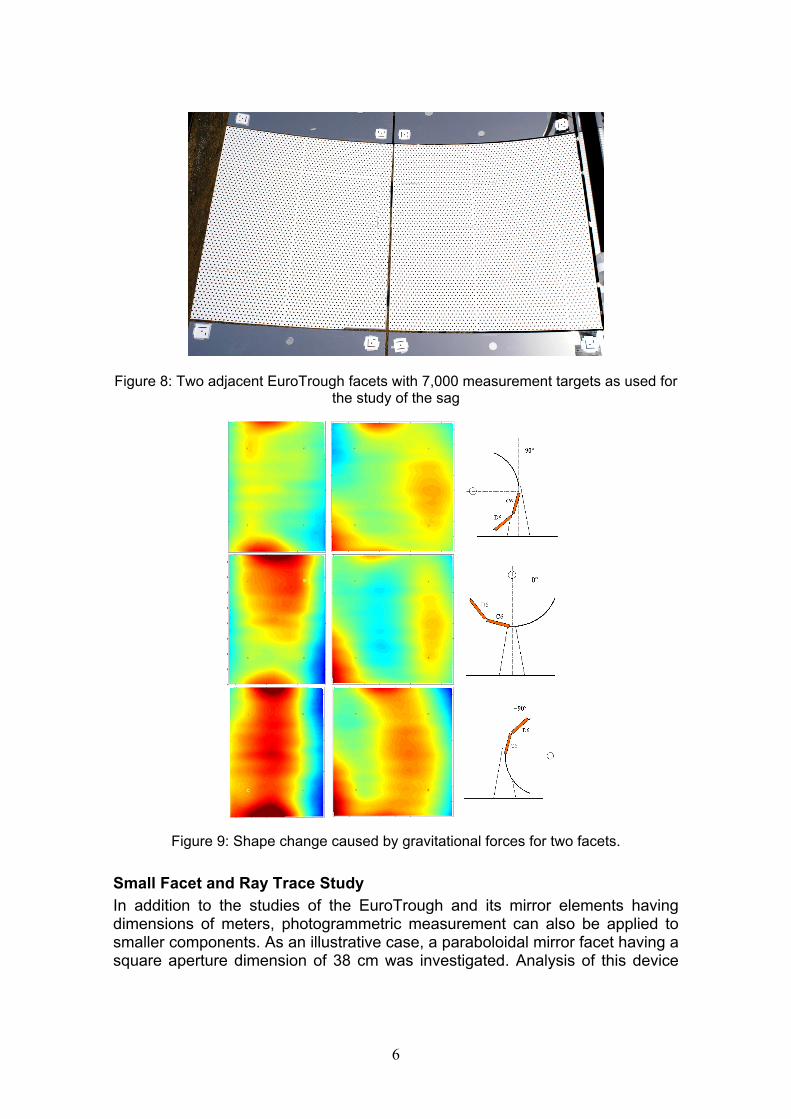
Large Facets and Gravitational Bending Mirror facets used on the EuroTrough collector were analysed in detail to measure shape deviations and to get an extended data basis for ray tracing studies in order to calculate intercept factors. Figure 8 shows two facets with apertures 1.2 m x 1.7 m and 1.6 m x 1.7 m with approximately 7,000 targets on the facets. The target spacing is 30 mm. Each facet was measured to an object space precision of 0.03mm using a network of 24 exposures. Because the glass mirrors bend under gravitational forces, the mirror shapes were measured using photogrammetry for several different angular positions. Figure 9 shows the shape of two adjacent mirror facets for three collector positions (sunrise, zenith, sunset), as seen from the position of the sun. The shapes of the mirrors change with orientation and thus influence flux distribution in the focus. The magnitude of this effect on the daily or annual performance characteristics of a collector can be computed by ray trace studies.
6
Figure 8: Two adjacent EuroTrough facets with 7,000 measurement targets as used for the study of the sag
Figure 9: Shape change caused by gravitational forces for two facets.
Small Facet and Ray Trace Study In addition to the studies of the EuroTrough and its mirror elements having dimensions of meters, photogrammetric measurement can also be applied to smaller components. As an illustrative case, a paraboloidal mirror facet having a square aperture dimension of 38 cm was investigated. Analysis of this device
7
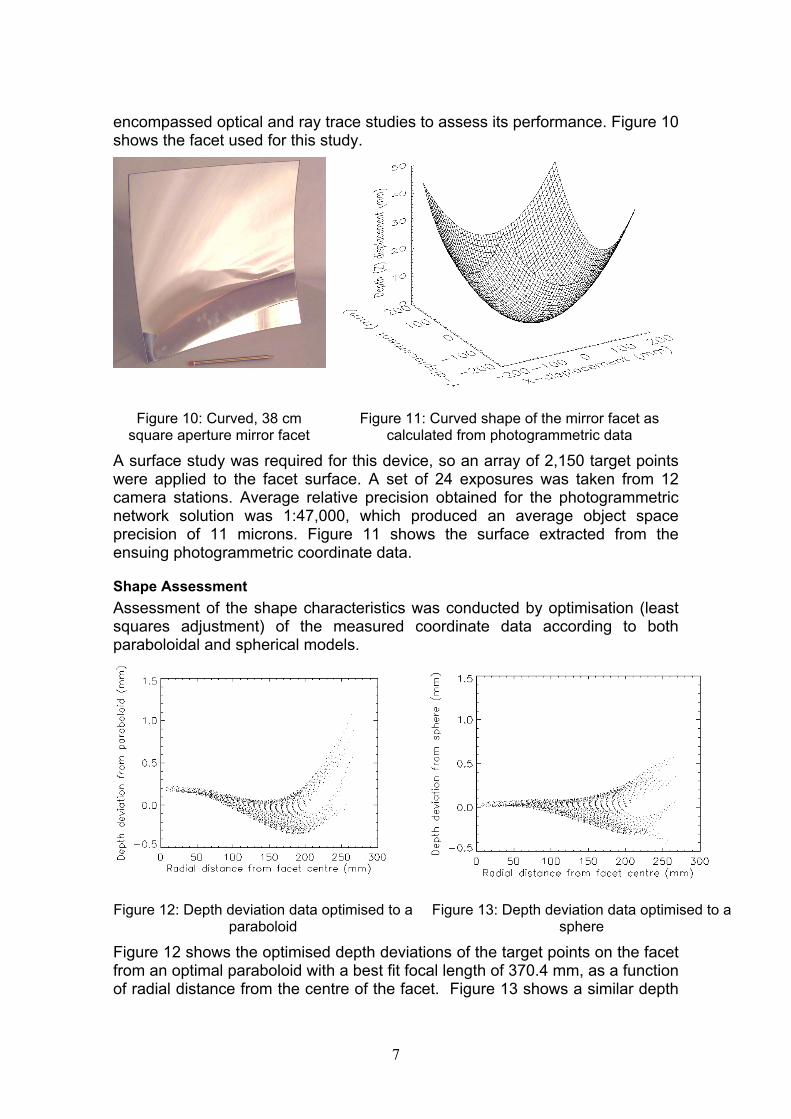
encompassed optical and ray trace studies to assess its performance. Figure 10 shows the facet used for this study.
Figure 10: Curved, 38 cm square aperture mirror facet
Figure 11: Curved shape of the mirror facet as calculated from photogrammetric data
A surface study was required for this device, so an array of 2,150 target points were applied to the facet surface. A set of 24 exposures was taken from 12 camera stations. Average relative precision obtained for the photogrammetric network solution was 1:47,000, which produced an average object space precision of 11 microns. Figure 11 shows the surface extracted from the ensuing photogrammetric coordinate data.
Shape Assessment Assessment of the shape characteristics was conducted by optimisation (least squares adjustment) of the measured coordinate data according to both paraboloidal and spherical models.
Figure 12: Depth deviation data optimised to a paraboloid
Figure 13: Depth deviation data optimised to a sphere
Figure 12 shows the optimised depth deviations of the target points on the facet from an optimal paraboloid with a best fit focal length of 370.4 mm, as a function of radial distance from the centre of the facet. Figure 13 shows a similar depth
8
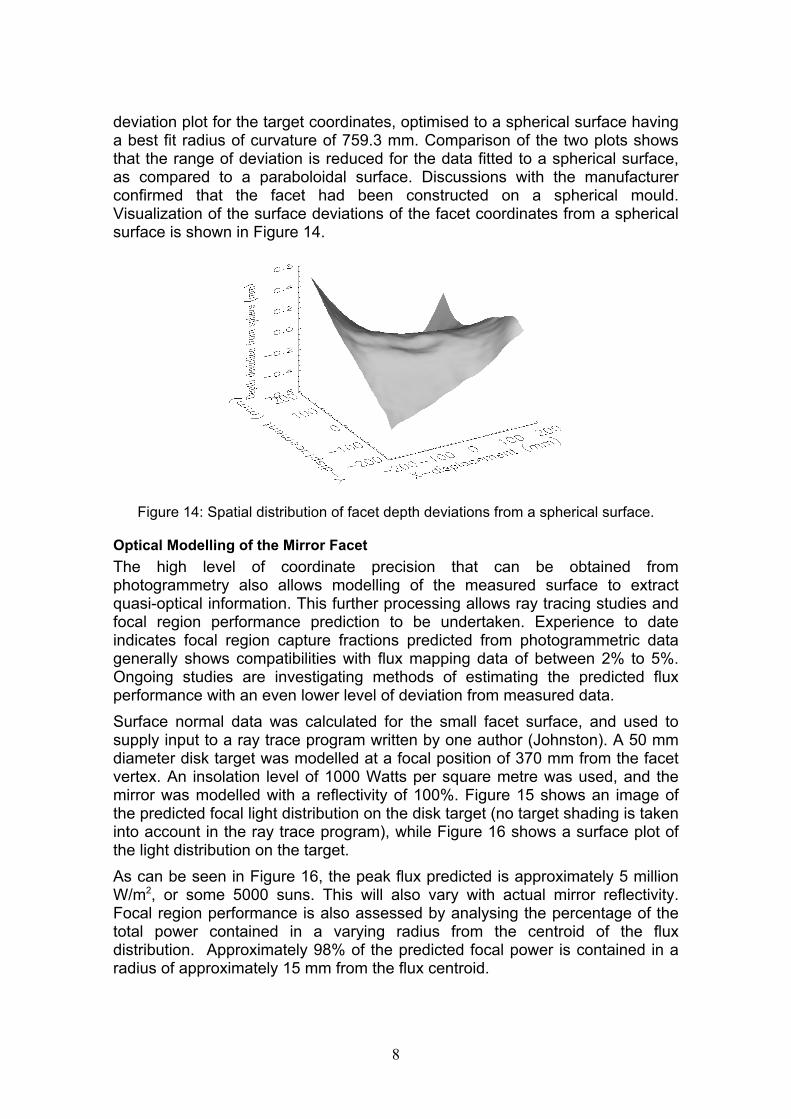
deviation plot for the target coordinates, optimised to a spherical surface having a best fit radius of curvature of 759.3 mm. Comparison of the two plots shows that the range of deviation is reduced for the data fitted to a spherical surface, as compared to a paraboloidal surface. Discussions with the manufacturer confirmed that the facet had been constructed on a spherical mould. Visualization of the surface deviations of the facet coordinates from a spherical surface is shown in Figure 14.
Figure 14: Spatial distribution of facet depth deviations from a spherical surface.
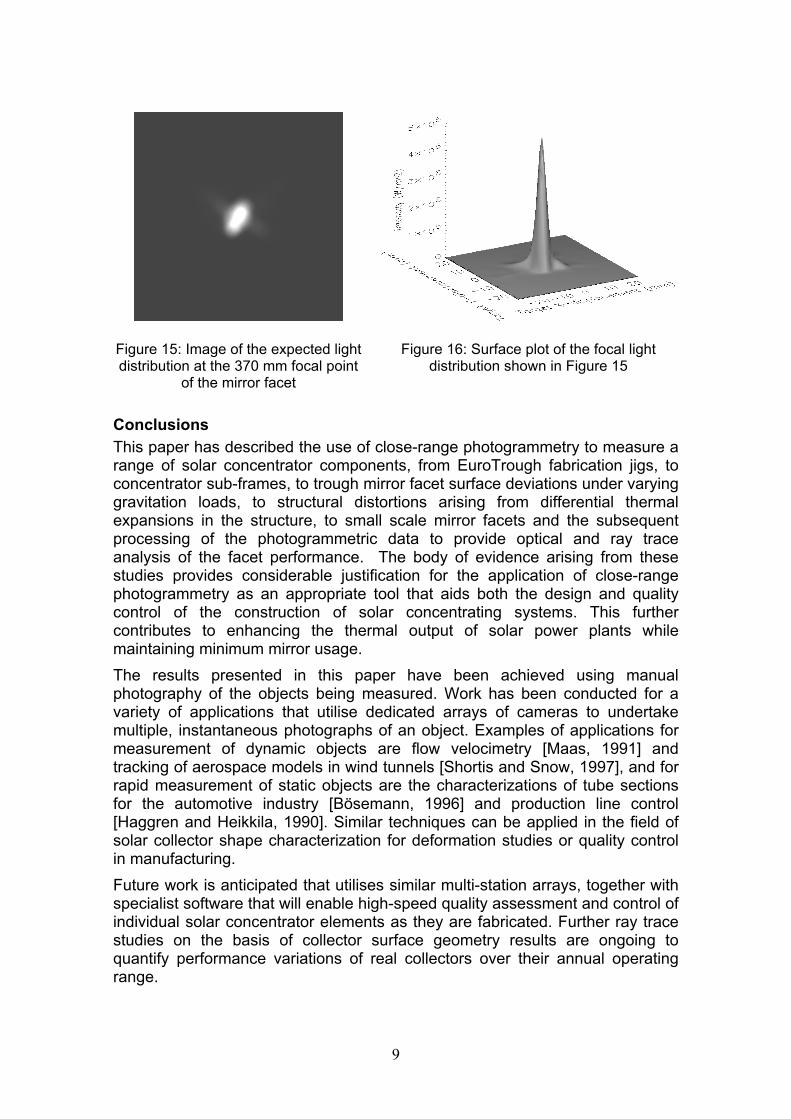
Optical Modelling of the Mirror Facet The high level of coordinate precision that can be obtained from photogrammetry also allows modelling of the measured surface to extract quasi-optical information. This further processing allows ray tracing studies and focal region performance prediction to be undertaken. Experience to date indicates focal region capture fractions predicted from photogrammetric data generally shows compatibilities with flux mapping data of between 2% to 5%. Ongoing studies are investigating methods of estimating the predicted flux performance with an even lower level of deviation from measured data. Surface normal data was calculated for the small facet surface, and used to supply input to a ray trace program written by one author (Johnston). A 50 mm diameter disk target was modelled at a focal position of 370 mm from the facet vertex. An insolation level of 1000 Watts per square metre was used, and the mirror was modelled with a reflectivity of 100%. Figure 15 shows an image of the predicted focal light distribution on the disk target (no target shading is taken into account in the ray trace program), while Figure 16 shows a surface plot of the light distribution on the target. As can be seen in Figure 16, the peak flux predicted is approximately 5 million W/m2, or some 5000 suns. This will also vary with actual mirror reflectivity. Focal region performance is also assessed by analysing the percentage of the total power contained in a varying radius from the centroid of the flux distribution. Approximately 98% of the predicted focal power is contained in a radius of approximately 15 mm from the flux centroid.
9
Figure 15: Image of the expected light distribution at the 370 mm focal point
of the mirror facet
Figure 16: Surface plot of the focal light distribution shown in Figure 15
Conclusions This paper has described the use of close-range photogrammetry to measure a range of solar concentrator components, from EuroTrough fabrication jigs, to concentrator sub-frames, to trough mirror facet surface deviations under varying gravitation loads, to structural distortions arising from differential thermal expansions in the structure, to small scale mirror facets and the subsequent processing of the photogrammetric data to provide optical and ray trace analysis of the facet performance. The body of evidence arising from these studies provides considerable justification for the application of close-range photogrammetry as an appropriate tool that aids both the design and quality control of the construction of solar concentrating systems. This further contributes to enhancing the thermal output of solar power plants while maintaining minimum mirror usage. The results presented in this paper have been achieved using manual photography of the objects being measured. Work has been conducted for a variety of applications that utilise dedicated arrays of cameras to undertake multiple, instantaneous photographs of an object. Examples of applications for measurement of dynamic objects are flow velocimetry [Maas, 1991] and tracking of aerospace models in wind tunnels [Shortis and Snow, 1997], and for rapid measurement of static objects are the characterizations of tube sections for the automotive industry [Bösemann, 1996] and production line control [Haggren and Heikkila, 1990]. Similar techniques can be applied in the field of solar collector shape characterization for deformation studies or quality control in manufacturing. Future work is anticipated that utilises similar multi-station arrays, together with specialist software that will enable high-speed quality assessment and control of individual solar concentrator elements as they are fabricated. Further ray trace studies on the basis of collector surface geometry results are ongoing to quantify performance variations of real collectors over their annual operating range.

10
Acknowledgments Financial support of the European Commission (ERK6-CT1999-00018) and of the German Ministry for the Environment (Parasol/OPAL), both related to the EuroTrough development, is gratefully acknowledged.
References Bösemann W., 1996. “The optical tube measurement system OLM – photogrammetric
methods used for industrial automation and process control”. International Archives of Photogrammetry and Remote Sensing, 30 (B5), pp. 304-309.
Butler, B. L. and Pettit, R. B., 1977, “Optical evaluation techniques for reflecting solar concentrators”, SPIE, Optics Applied to Solar Energy Conversion, 114, pp. 43-49.
Haggren, H. and Heikkila, J., 1990, “Photogrammetric measuring of windshield frames in automobile manufacturing”, Surveying Science in Finland, 1, pp. 10-18.
Hansche, B. D., 1978, “Laser Ray Trace Tester for Parabolic Trough Solar Concentrators”, ISA, pp. 485-490.
Lüpfert, E., Zarza, E., Geyer, M., Nava, P., Langenkamp, J., Schiel, W., Esteban, A., Osuna, R. and Mandelberg, E., 2003, “EuroTrough Collector Qualification Complete – Performance Test Results from PSA”, ISES Solar World Congress, Göteborg, Sweden.
Maas, H.-G., 1991, “Digital photogrammetry for determination of tracer particle coordinates in turbulent flow research”, Photogrammetric Engineering and Remote Sensing, 57 (12), pp. 1593-1597.
Riffelmann, K.-K., Neumann A. and Wittkowski, M., 2003, “PARASCAN: A new parabolic trough flux scanner”, ISES Solar World Congress, Göteborg, Sweden.
Shortis, M. R., and Johnston G. H. G., 1996, “Photogrammetry: An Available Surface Characterization Tool for Solar Concentrators, Part 1: Measurement of Surfaces”, ASME J. of Solar Energy Engineering, 118, pp. 146-150.
Shortis, M. R., and Johnston G. H. G., 1997, “Photogrammetry: An Available Surface Characterization Tool for Solar Concentrators, Part II: Assessment of Surfaces”, ASME J. of Solar Energy Engineering, 119, pp. 286-291.
Shortis, M. R. and Snow, W. L., 1997, “Videometric tracking of wind tunnel aerospace models at NASA Langley Research Centre”, Photogrammetric Record, 15 (85), pp. 673-689.
Wendelin, T. J. and Grossman, J. W., 1995, “Comparison of Three Methods for Optical Characterization of Point-Focus Concentrators”, ASME Solar Engineering, 2, pp. 775-780.
Ulmer, S., Riffelmann, K.-J., Lüpfert, E. and Neumann A., 2004, “Comparative Flux Measurement and Raytracing for the characterization of the focal region of solar parabolic trough collectors”, ASME Congress, Solar 2004, Portland, Oregon.