Embed Size (px)
Citation preview
Page 1 of 17
PHOTOGRAMMETRIC PROCESSING OF CARTOSAT-1 STEREO IMAGERY
James Lutes Geodetic Systems Engineer
GeoEye 12076 Grant Street, Thornton, CO 80241
ABSTRACT India’s CARTOSAT-1 satellite, launched in May 2005, contains a 2.5-meter resolution optical imaging platform primarily designed for the capture of stereo imagery. Separate fore- and aft-looking camera assemblies are used for collection of same-pass stereo during the entire imaging pass, with collection geometry ideally suited for extraction of 3D features and Digital Elevation Models.
This paper outlines the characteristics of CARTOSAT-1 imagery and available data products. In addition, an evaluation of achievable positional accuracy has been performed using different block adjustment strategies and recommendations are provided for different levels of ground control availability.
INTRODUCTION
CARTOSAT-1 was launched into orbit on May 5, 2005, from the Satish Dhawan Space Centre in Sriharikota, India (Antrix, 2005). This is the eleventh satellite in the Indian Space Research Organisation’s (ISRO) Indian Remote Sensing (IRS) series, and it is the first with high-resolution stereo imaging capabilities. As a dedicated stereo collection platform, CARTOSAT-1 is meant to support the extraction of 3D features and Digital Elevation Models.
In order to facilitate the introduction of CARTOSAT-1 data to the commercial marketplace, data from this satellite is offered in a convenient ‘Orthokit’ format (NRSA, 2005), which is a radiometrically corrected TIFF product with Rational Polynomial Coefficients (RPCs) for the two images. Due to the simplicity of data handling for RPC-based products, some of the major photogrammetric software vendors have already incorporated support for CARTOSAT-1 Orthokit data into their products.
While the provision of data in TIFF+RPC format promises a very shallow learning curve for working with CARTOSAT-1 stereo imagery, experience with previous IRS platforms has shown that some ground control is required to achieve acceptable positional accuracy (Lutes, 2005). This paper, in addition to providing a general overview of the sensor platform and data products available, describes a series of tests that were performed in order to determine the best strategy for block adjustment of CARTOSAT-1 Orthokit scenes.
PLATFORM DESCRIPTION
CARTOSAT-1 is a dedicated stereo platform. While it can be configured to collect imagery in a monoscopic mode, the sensor payload consists of a pair of 2.5 meter panchromatic camera assemblies mounted in a stereo viewing configuration much like the ASTER sensor onboard TERRA (Abrams et al., 2002). Table 1 describes some key characteristics of the CARTOSAT-1 sensors.
Photogrammetric Processing of CARTOSAT-1 Stereo Imagery
Page 2 of 17
Table 1. CARTOSAT-1 sensor specifications
Camera Fore (+26 deg) Aft (-5 deg) Spatial resolution 2.5 m cross-track
2.8 m along-track 2.2 m cross-track 2.2 m along-track
Spectral sensitivity 500-850 nm 500-850 nm Quantization 10 bits 10 bits Swath Width 29 km 26 km Number of detector elements 12000 12000 Detector size 7×7 µm 7×7 µm Focal length 1945 mm 1945 mm Camera field of view (FOV) 2.4º 2.4º Detector integration time 0.336 ms 0.336 ms
The two camera assemblies onboard CARTOSAT-1 are known as the ‘Fore’ camera and the ‘Aft’ camera. The
Fore camera points 26 degrees ahead of nadir, while the Aft camera points back 5 degrees behind nadir. This gives excellent stereo viewing geometry, with an average base-to-height ratio of approximately 0.62 at the satellite altitude.
CARTOSAT-1 operates, like many other remote sensing platforms, in a near-polar, circular sun synchronous orbit at an average altitude of 618 km. Some key orbit characteristics are presented in Table 2. The orbit revisit time is 126 days, but a 5-day revisit time can be achieved by tilting the satellite to the east or west of nadir.
Table 2. CARTOSAT-1 orbit characteristics
Nominal altitude 618 km Orbits per day 14 Orbit repetition 126 days Revisit time 5 days Equatorial crossing on descending pass 10:30 am local time Orbital eccentricity 0.001 Orbital inclination 97.87º
Given the orbit characteristics and sensor geometry, it can be seen that at the equator, approximately 53 seconds
will elapse between collection of the forward and aft scenes. Due to Earth rotation, however, the satellite ground track will have moved by 26 kilometers to the west in that time. To keep the aft camera following the same ground track as the fore camera, it is necessary to employ yaw steering onboard the satellite. This capability is also used to allow monoscopic collection; in this mode, yaw steering is used to keep the aft camera following a path contiguous with the fore camera, thus covering a 55 km wide monoscopic swath. Monoscopic products are not discussed in this paper, but CARTOSAT-1 can be tasked to collect them if requested.
DATA PRODUCTS
CARTOSAT-1 imagery is available in a variety of data formats, with different levels of processing applied, as described in NRSA (2005). For those interested in stereo image processing, data should be acquired with only radiometric corrections applied. Radiometric scenes, in turn, are available in two formats: LGSOWG and Orthokit. The LGSOWG format is useful for those who wish to develop or use their own physical sensor model, as it provides attitude and ephemeris data covering the time of imaging. A similar product is available for ResourceSat-1, but in that case it was found that information describing the interior geometry of the camera was not available, thus requiring estimation of camera calibration parameters by the user (Lutes, 2005).
The second format for CARTOSAT-1 data is the Orthokit product. Orthokit products provide the view geometry in the form of Rational Polynomial Coefficients (RPCs). Rational Polynomial Coefficients are already
Photogrammetric Processing of CARTOSAT-1 Stereo Imagery
Page 3 of 17
well-known by the major photogrammetric software vendors, so commercial software support for Orthokit products should not be long in coming. In fact, major vendors such as Leica (with the LPS suite), PCI (with OrthoEngine) and RSI (ENVI) have already incorporated support for CARTOSAT-1 RPCs into their products. The discussions to follow will focus on Orthokit products only.
GENERAL PRODUCT EVALUATION
A number of CARTOSAT-1 stereo Orthokit scenes were received from Antrix (effectively the commercial arm of India’s National Remote Sensing Agency, NRSA) for evaluation. Of the scenes delivered, six were selected for evaluation based on the availability of collateral data covering the same areas. The first part of evaluation consisted of general quality checks to ensure the products would be acceptable for use by most customers; the second part of evaluation comprised a more detailed assessment of the initial geometric accuracy and the accuracy achievable with introduction of ground control, which is discussed in the following section.
For the general evaluation of the product, two major items were addressed: image quality and usability of the Rational Polynomial Coefficients (RPCs) that are delivered with the scenes.
Image Quality For a stereo satellite like CARTOSAT, there are a few basic requirements for image quality: (1) the two images should be very similar in terms of radiometry and sharpness, to enable comfortable stereo viewing and effective automated matching; (2) Streaking, banding, saturation, noise and other radiometric artifacts should be minor enough to, again, enable stereo viewing and successful matching; and (3) at least one image from the stereo pair should be acceptable for use in generating an orthorectified product. The last requirement is mentioned because even with stereo data, users often wish to create image drape products or have a backdrop to use for vector overlays.
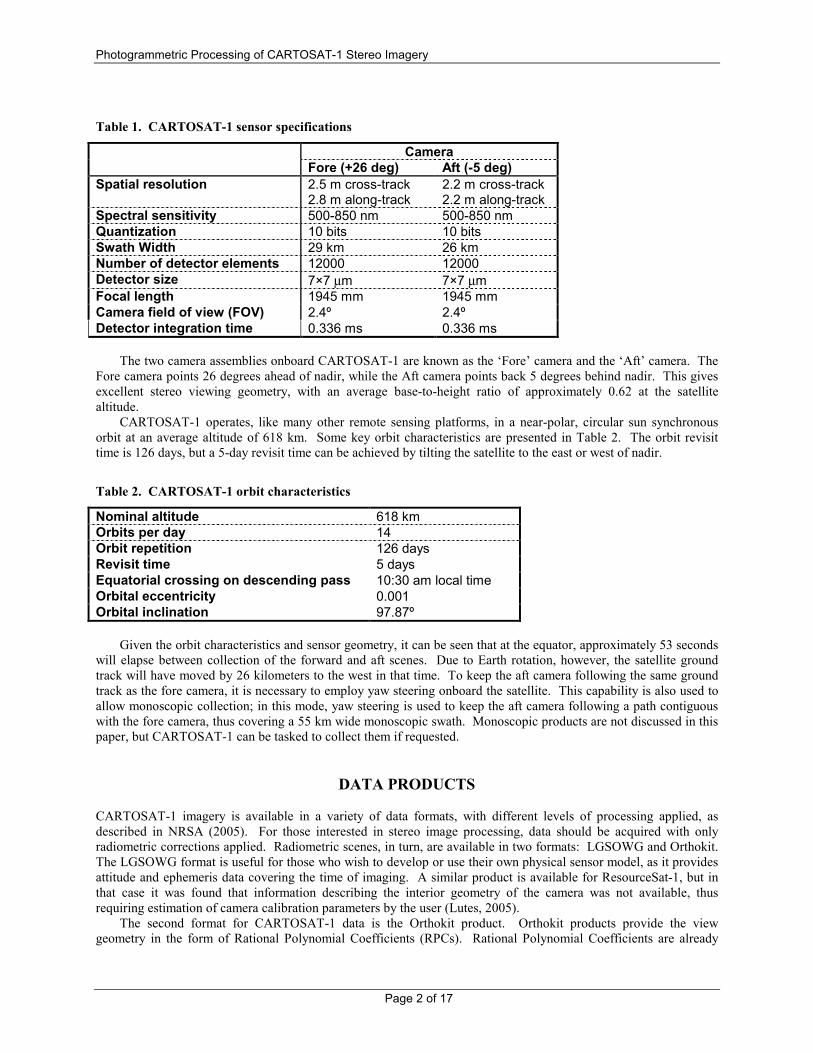
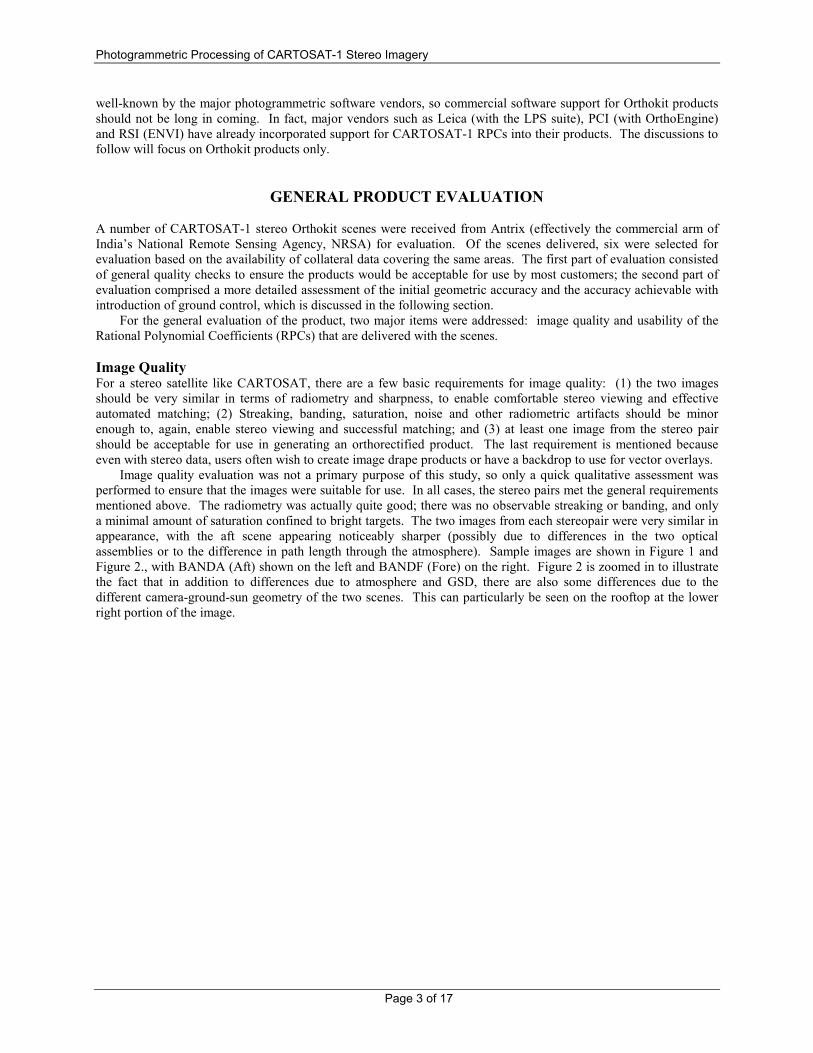
Image quality evaluation was not a primary purpose of this study, so only a quick qualitative assessment was performed to ensure that the images were suitable for use. In all cases, the stereo pairs met the general requirements mentioned above. The radiometry was actually quite good; there was no observable streaking or banding, and only a minimal amount of saturation confined to bright targets. The two images from each stereopair were very similar in appearance, with the aft scene appearing noticeably sharper (possibly due to differences in the two optical assemblies or to the difference in path length through the atmosphere). Sample images are shown in Figure 1 and Figure 2., with BANDA (Aft) shown on the left and BANDF (Fore) on the right. Figure 2 is zoomed in to illustrate the fact that in addition to differences due to atmosphere and GSD, there are also some differences due to the different camera-ground-sun geometry of the two scenes. This can particularly be seen on the rooftop at the lower right portion of the image.
Photogrammetric Processing of CARTOSAT-1 Stereo Imagery
Page 4 of 17
Figure 1. Typical CARTOSAT-1 urban scene
Figure 2. Observable differences between Aft and Fore bands
Photogrammetric Processing of CARTOSAT-1 Stereo Imagery
Page 5 of 17
While the image differences are noticeable in the split-screen displays shown in Figure 1 and Figure 2, they cause no discomfort or difficulty when viewing the imagery in stereo. In fact, due to the fixed convergence angle, stereo viewing was very comfortable for all stereo pairs.
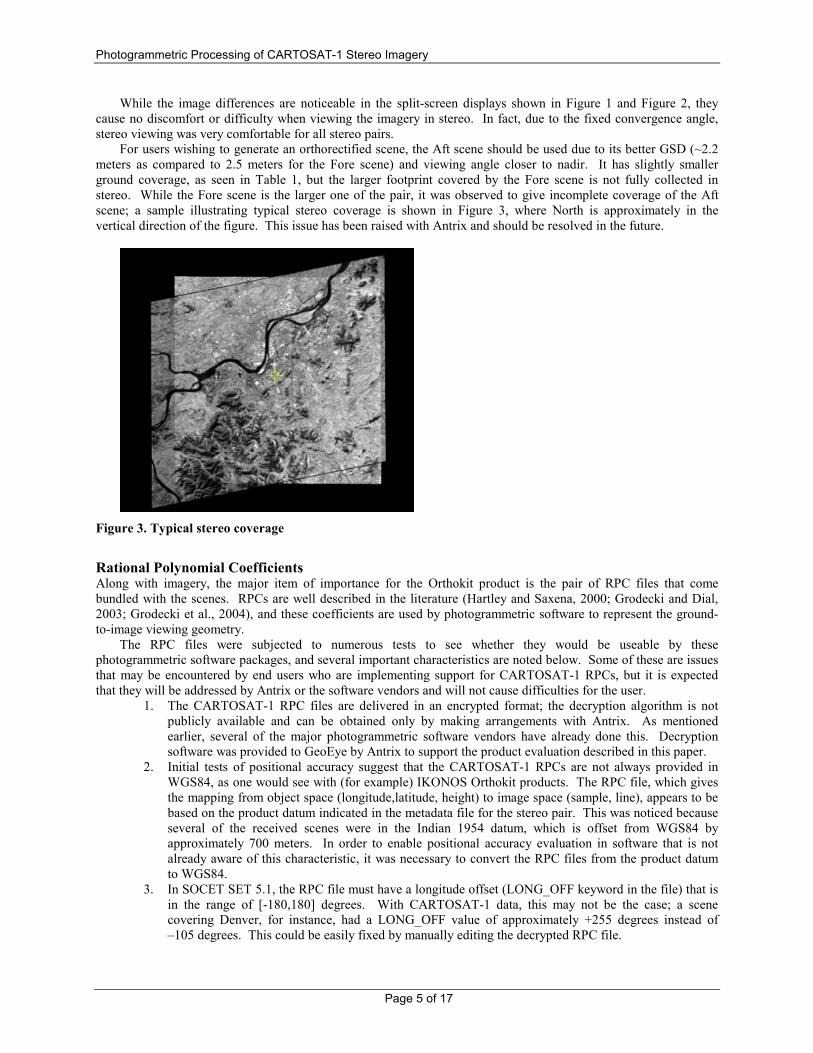
For users wishing to generate an orthorectified scene, the Aft scene should be used due to its better GSD (~2.2 meters as compared to 2.5 meters for the Fore scene) and viewing angle closer to nadir. It has slightly smaller ground coverage, as seen in Table 1, but the larger footprint covered by the Fore scene is not fully collected in stereo. While the Fore scene is the larger one of the pair, it was observed to give incomplete coverage of the Aft scene; a sample illustrating typical stereo coverage is shown in Figure 3, where North is approximately in the vertical direction of the figure. This issue has been raised with Antrix and should be resolved in the future.
Figure 3. Typical stereo coverage
Rational Polynomial Coefficients Along with imagery, the major item of importance for the Orthokit product is the pair of RPC files that come bundled with the scenes. RPCs are well described in the literature (Hartley and Saxena, 2000; Grodecki and Dial, 2003; Grodecki et al., 2004), and these coefficients are used by photogrammetric software to represent the ground-to-image viewing geometry.
The RPC files were subjected to numerous tests to see whether they would be useable by these photogrammetric software packages, and several important characteristics are noted below. Some of these are issues that may be encountered by end users who are implementing support for CARTOSAT-1 RPCs, but it is expected that they will be addressed by Antrix or the software vendors and will not cause difficulties for the user.
1. The CARTOSAT-1 RPC files are delivered in an encrypted format; the decryption algorithm is not publicly available and can be obtained only by making arrangements with Antrix. As mentioned earlier, several of the major photogrammetric software vendors have already done this. Decryption software was provided to GeoEye by Antrix to support the product evaluation described in this paper.
2. Initial tests of positional accuracy suggest that the CARTOSAT-1 RPCs are not always provided in WGS84, as one would see with (for example) IKONOS Orthokit products. The RPC file, which gives the mapping from object space (longitude,latitude, height) to image space (sample, line), appears to be based on the product datum indicated in the metadata file for the stereo pair. This was noticed because several of the received scenes were in the Indian 1954 datum, which is offset from WGS84 by approximately 700 meters. In order to enable positional accuracy evaluation in software that is not already aware of this characteristic, it was necessary to convert the RPC files from the product datum to WGS84.
3. In SOCET SET 5.1, the RPC file must have a longitude offset (LONG_OFF keyword in the file) that is in the range of [-180,180] degrees. With CARTOSAT-1 data, this may not be the case; a scene covering Denver, for instance, had a LONG_OFF value of approximately +255 degrees instead of –105 degrees. This could be easily fixed by manually editing the decrypted RPC file.
Photogrammetric Processing of CARTOSAT-1 Stereo Imagery
Page 6 of 17
4. The RPC denominator had zero crossings in one of the scenes tested; that is, the denominator term did not have a consistent sign throughout the entire range of longitude/latitude/height combinations that cover the image space. When this is the case, the denominator will be zero at some point, thus causing a divide by zero error somewhere in the image. The effect of this, as seen by a SOCET SET software user, is that the cursor will suddenly jump when navigating around the area of the sign reversal and any DEM extracted will have a patch of invalid values in this area. For the purpose of these tests, this problem was fixed by re-fitting a new set of RPCs to the provided ones, using customized software that does not exhibit this characteristic. Because this RPC re-fitting was required anyway for conversion to WGS84, it did not pose a problem for these tests. However, photogrammetric software developers should be aware of the need to test for and repair this condition.
As mentioned previously, the data provider or software vendor should resolve these issues so that they are not
encountered by the end user, and they are mentioned here only to reflect the state of the Antrix Orthokit product as of early 2006.
ACCURACY ASSESSMENT
General evaluation of the Orthokit product characteristics, particularly those of the RPC files, made it possible to implement workarounds and design a procedure for more detailed assessment of positional accuracy. The test procedures and results are presented in the following subsections.
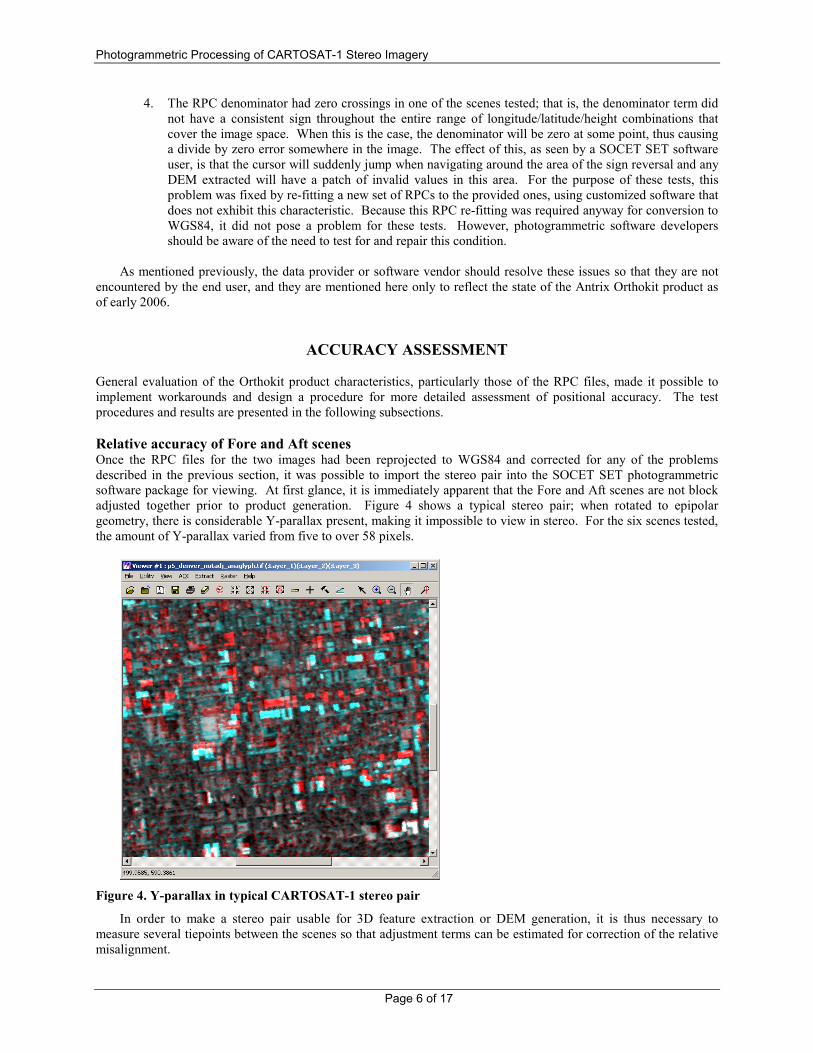
Relative accuracy of Fore and Aft scenes Once the RPC files for the two images had been reprojected to WGS84 and corrected for any of the problems described in the previous section, it was possible to import the stereo pair into the SOCET SET photogrammetric software package for viewing. At first glance, it is immediately apparent that the Fore and Aft scenes are not block adjusted together prior to product generation. Figure 4 shows a typical stereo pair; when rotated to epipolar geometry, there is considerable Y-parallax present, making it impossible to view in stereo. For the six scenes tested, the amount of Y-parallax varied from five to over 58 pixels.
Figure 4. Y-parallax in typical CARTOSAT-1 stereo pair
In order to make a stereo pair usable for 3D feature extraction or DEM generation, it is thus necessary to measure several tiepoints between the scenes so that adjustment terms can be estimated for correction of the relative misalignment.
Photogrammetric Processing of CARTOSAT-1 Stereo Imagery
Page 7 of 17
Following the RPC block adjustment model outlined in Grodecki and Dial (2003), polynomial correction terms in image space are used to model the effect of errors in interior and exterior orientation.
( )( ) K
K
+⋅⋅+⋅+⋅+⋅+⋅++=
+⋅⋅+⋅+⋅+⋅+⋅++=
LSbLbSbLbSbbHtLatLonRPCSLSaLaSaLaSaaHtLatLonRPCL
SLLSLSScorr
SLLSLSLcorr2
22
20
22
220
,,
,, (1)
where
corrcorr SL , are corrected line and sample coordinates,
SL RPCRPC , are the line and sample coordinates that were predicted by the initial set of RPCs for a given latitude, longitude, and height.
K,,,0 LS aaa are correction terms for the line RPCs K,,,0 LS bbb are correction terms for the sample RPCs
SL, are the initial (i.e., measured) line and sample coordinates of the point. Because the corrections are assumed to be small, the line and sample coordinates predicted by
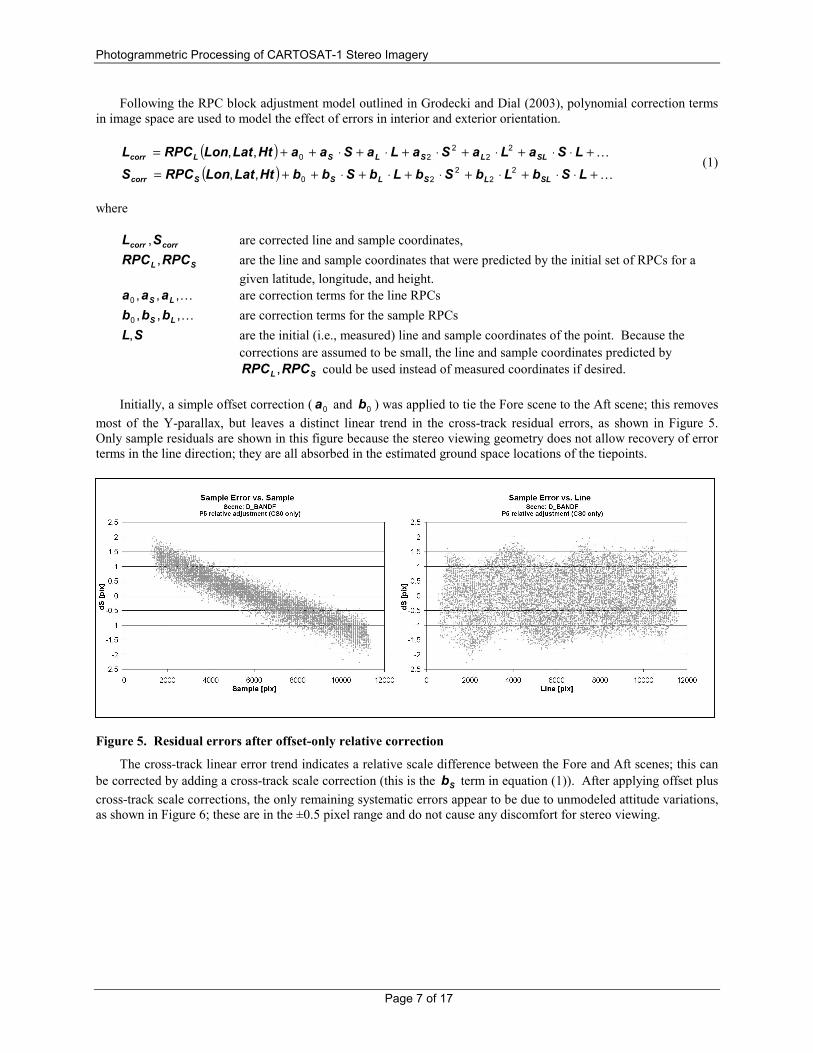
SL RPCRPC , could be used instead of measured coordinates if desired. Initially, a simple offset correction ( 0a and 0b ) was applied to tie the Fore scene to the Aft scene; this removes
most of the Y-parallax, but leaves a distinct linear trend in the cross-track residual errors, as shown in Figure 5. Only sample residuals are shown in this figure because the stereo viewing geometry does not allow recovery of error terms in the line direction; they are all absorbed in the estimated ground space locations of the tiepoints.
Figure 5. Residual errors after offset-only relative correction
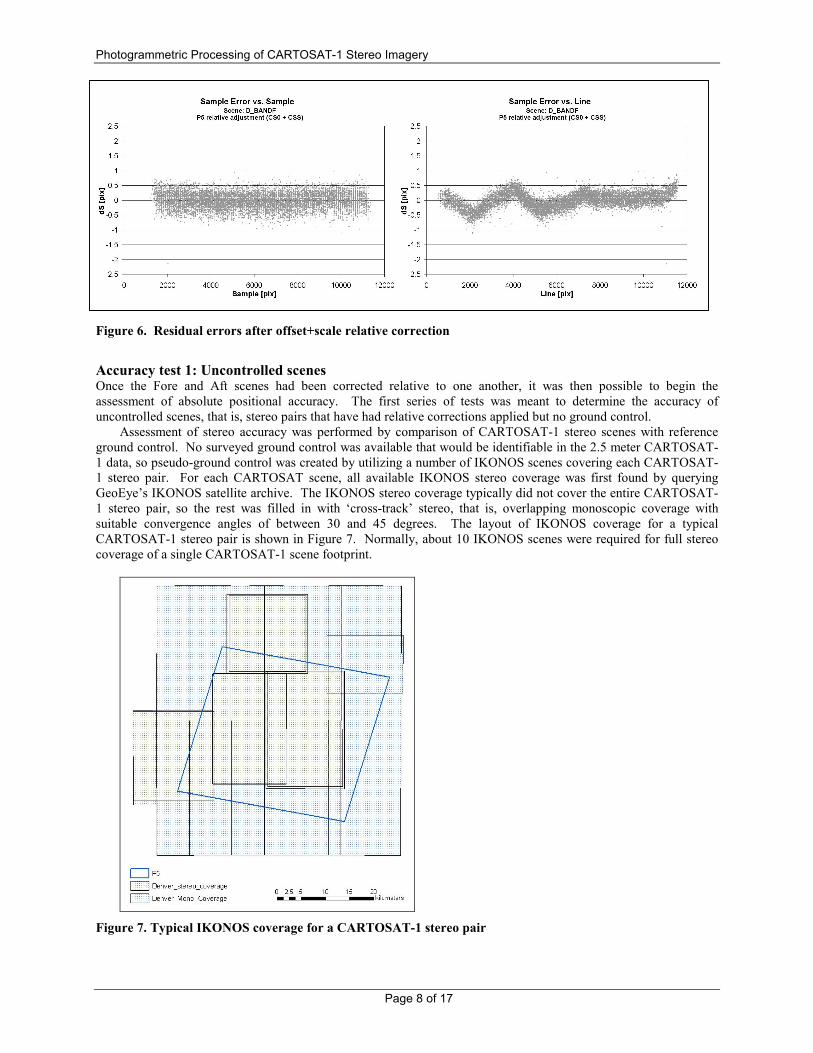
The cross-track linear error trend indicates a relative scale difference between the Fore and Aft scenes; this can be corrected by adding a cross-track scale correction (this is the Sb term in equation (1)). After applying offset plus cross-track scale corrections, the only remaining systematic errors appear to be due to unmodeled attitude variations, as shown in Figure 6; these are in the ±0.5 pixel range and do not cause any discomfort for stereo viewing.
Photogrammetric Processing of CARTOSAT-1 Stereo Imagery
Page 8 of 17
Figure 6. Residual errors after offset+scale relative correction
Accuracy test 1: Uncontrolled scenes Once the Fore and Aft scenes had been corrected relative to one another, it was then possible to begin the assessment of absolute positional accuracy. The first series of tests was meant to determine the accuracy of uncontrolled scenes, that is, stereo pairs that have had relative corrections applied but no ground control.
Assessment of stereo accuracy was performed by comparison of CARTOSAT-1 stereo scenes with reference ground control. No surveyed ground control was available that would be identifiable in the 2.5 meter CARTOSAT-1 data, so pseudo-ground control was created by utilizing a number of IKONOS scenes covering each CARTOSAT-1 stereo pair. For each CARTOSAT scene, all available IKONOS stereo coverage was first found by querying GeoEye’s IKONOS satellite archive. The IKONOS stereo coverage typically did not cover the entire CARTOSAT-1 stereo pair, so the rest was filled in with ‘cross-track’ stereo, that is, overlapping monoscopic coverage with suitable convergence angles of between 30 and 45 degrees. The layout of IKONOS coverage for a typical CARTOSAT-1 stereo pair is shown in Figure 7. Normally, about 10 IKONOS scenes were required for full stereo coverage of a single CARTOSAT-1 scene footprint.
Figure 7. Typical IKONOS coverage for a CARTOSAT-1 stereo pair
Photogrammetric Processing of CARTOSAT-1 Stereo Imagery
Page 9 of 17
The IKONOS scenes were block adjusted together in the IKONOS ground station and were treated as fixed after that. Past experience with IKONOS imagery suggests that the block adjusted IKONOS scenes have a relative accuracy in the 1-2 m CE90 range, making it a suitable data source for controlling the CARTOSAT imagery.
For comparison of the CARTOSAT-1 stereo pair with the IKONOS reference dataset, image matching software was used to measure several thousand tiepoints. For any tiepoints that were measured in at least four images (including both CARTOSAT-1 scenes and two IKONOS scenes with suitable convergence angle), the tiepoint ground space locations were determined independently using, first, IKONOS observations only and then using CARTOSAT-1 observations only. The IKONOS-derived ground space location was treated as the ‘reference’ location and then the difference between the two was considered to be the CARTOSAT-1 error. It can be seen that this is not truly an assessment of the absolute accuracy of CARTOSAT-1, but merely its accuracy relative to a reference dataset known to be of higher accuracy. A discussion of IKONOS stereo accuracy may be found in Dial (2003).
For the six datasets tested, the tiepoint matching procedure yielded a large number of points, varying from 4500 to over 31,000 points depending on scene content. This enabled not only the determination of overall statistics such as mean and standard deviation, but also trends in the residual errors that could indicate what kind of correction terms are appropriate. First, the overall statistics are presented in Table 3.
Table 3. CARTOSAT-1 uncontrolled accuracy
Scene Avg. dLon [m]
Avg. dLat [m]
Avg. dHt [m]
Std. dLon [m]
Std. dLat [m]
Std. dHt [m]
CE90 Hz [m]
LE90 V [m]
J 156.7 360.7 15.7 3.7 1.8 8.2 393.3 20.7D 79.7 111.0 -116.0 3.2 1.3 4.7 136.8 116.2R 10.2 114.6 -50.6 3.7 1.4 5.4 115.2 51.4A -66.6 61.3 -139.7 3.2 1.8 4.5 90.7 139.9P -206.1 268.9 -168.8 3.2 2.4 4.3 338.8 168.9C -66.9 353.9 -98.9 1.6 1.5 6.4 360.2 99.5
In all cases, the absolute error of uncontrolled scenes is poor, ranging from 90 to 400 meters CE90 horizontal
and 20 to 170 meters LE90 vertical. The standard deviation figures, however, suggest that this error is mostly due to overall bias in each scene.
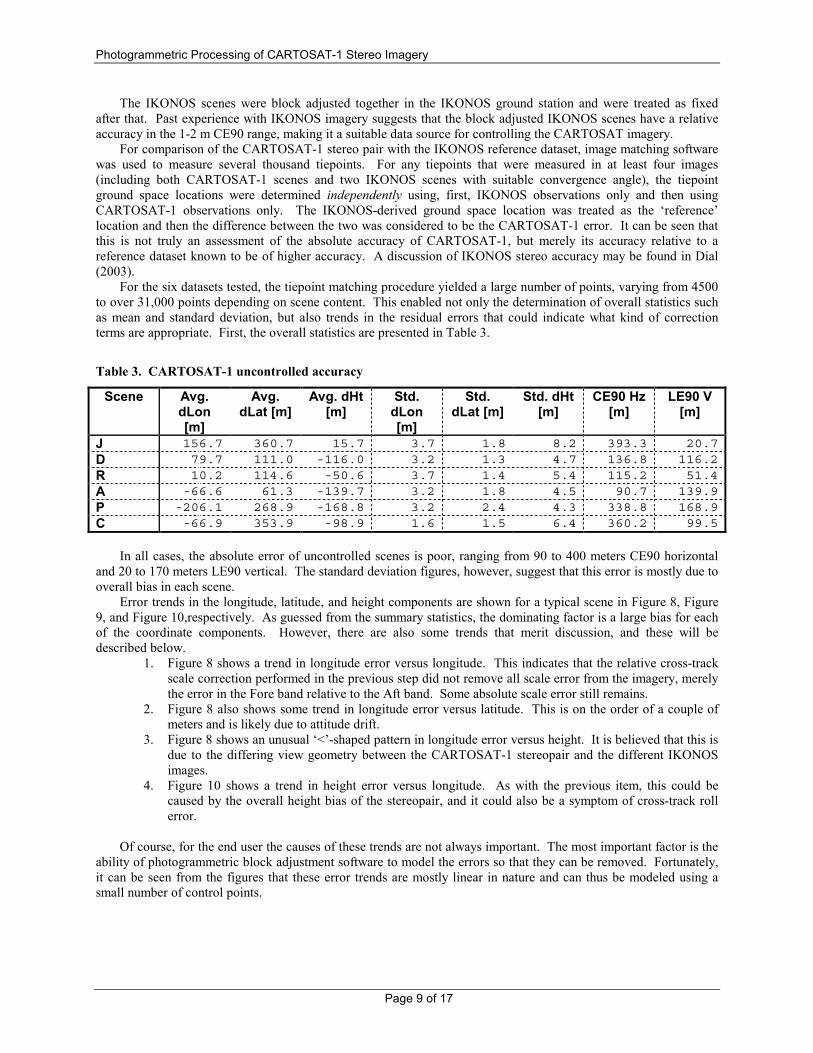
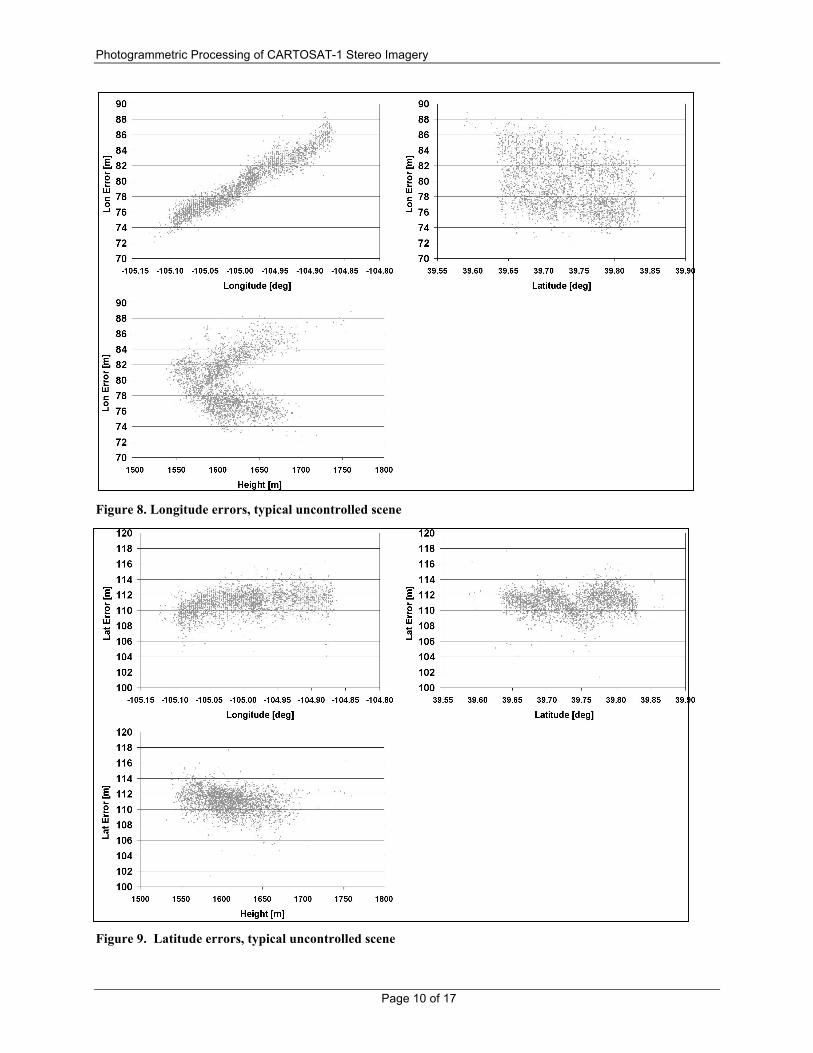
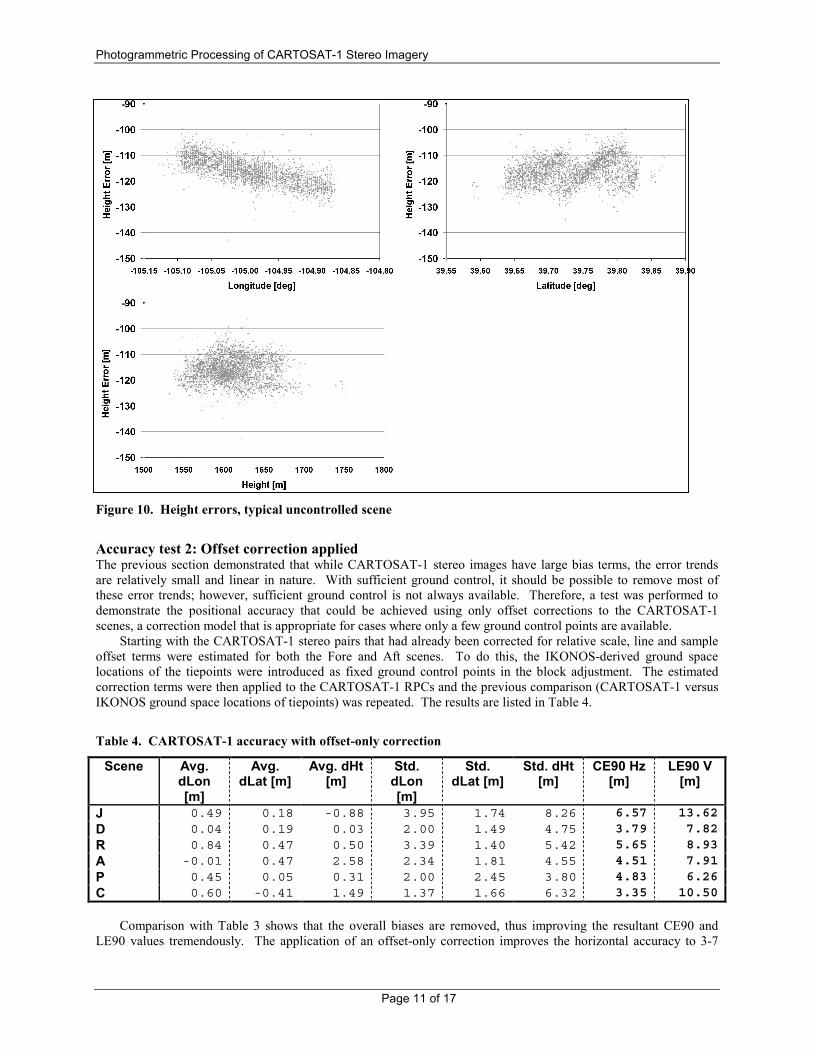
Error trends in the longitude, latitude, and height components are shown for a typical scene in Figure 8, Figure 9, and Figure 10,respectively. As guessed from the summary statistics, the dominating factor is a large bias for each of the coordinate components. However, there are also some trends that merit discussion, and these will be described below.
1. Figure 8 shows a trend in longitude error versus longitude. This indicates that the relative cross-track scale correction performed in the previous step did not remove all scale error from the imagery, merely the error in the Fore band relative to the Aft band. Some absolute scale error still remains.
2. Figure 8 also shows some trend in longitude error versus latitude. This is on the order of a couple of meters and is likely due to attitude drift.
3. Figure 8 shows an unusual ‘<’-shaped pattern in longitude error versus height. It is believed that this is due to the differing view geometry between the CARTOSAT-1 stereopair and the different IKONOS images.
4. Figure 10 shows a trend in height error versus longitude. As with the previous item, this could be caused by the overall height bias of the stereopair, and it could also be a symptom of cross-track roll error.
Of course, for the end user the causes of these trends are not always important. The most important factor is the
ability of photogrammetric block adjustment software to model the errors so that they can be removed. Fortunately, it can be seen from the figures that these error trends are mostly linear in nature and can thus be modeled using a small number of control points.
Photogrammetric Processing of CARTOSAT-1 Stereo Imagery
Page 10 of 17
Figure 8. Longitude errors, typical uncontrolled scene
Figure 9. Latitude errors, typical uncontrolled scene
Photogrammetric Processing of CARTOSAT-1 Stereo Imagery
Page 11 of 17
Figure 10. Height errors, typical uncontrolled scene
Accuracy test 2: Offset correction applied The previous section demonstrated that while CARTOSAT-1 stereo images have large bias terms, the error trends are relatively small and linear in nature. With sufficient ground control, it should be possible to remove most of these error trends; however, sufficient ground control is not always available. Therefore, a test was performed to demonstrate the positional accuracy that could be achieved using only offset corrections to the CARTOSAT-1 scenes, a correction model that is appropriate for cases where only a few ground control points are available.
Starting with the CARTOSAT-1 stereo pairs that had already been corrected for relative scale, line and sample offset terms were estimated for both the Fore and Aft scenes. To do this, the IKONOS-derived ground space locations of the tiepoints were introduced as fixed ground control points in the block adjustment. The estimated correction terms were then applied to the CARTOSAT-1 RPCs and the previous comparison (CARTOSAT-1 versus IKONOS ground space locations of tiepoints) was repeated. The results are listed in Table 4.
Table 4. CARTOSAT-1 accuracy with offset-only correction
Scene Avg. dLon [m]
Avg. dLat [m]
Avg. dHt [m]
Std. dLon [m]
Std. dLat [m]
Std. dHt [m]
CE90 Hz [m]
LE90 V [m]
J 0.49 0.18 -0.88 3.95 1.74 8.26 6.57 13.62D 0.04 0.19 0.03 2.00 1.49 4.75 3.79 7.82R 0.84 0.47 0.50 3.39 1.40 5.42 5.65 8.93A -0.01 0.47 2.58 2.34 1.81 4.55 4.51 7.91P 0.45 0.05 0.31 2.00 2.45 3.80 4.83 6.26C 0.60 -0.41 1.49 1.37 1.66 6.32 3.35 10.50
Comparison with Table 3 shows that the overall biases are removed, thus improving the resultant CE90 and
LE90 values tremendously. The application of an offset-only correction improves the horizontal accuracy to 3-7
Photogrammetric Processing of CARTOSAT-1 Stereo Imagery
Page 12 of 17
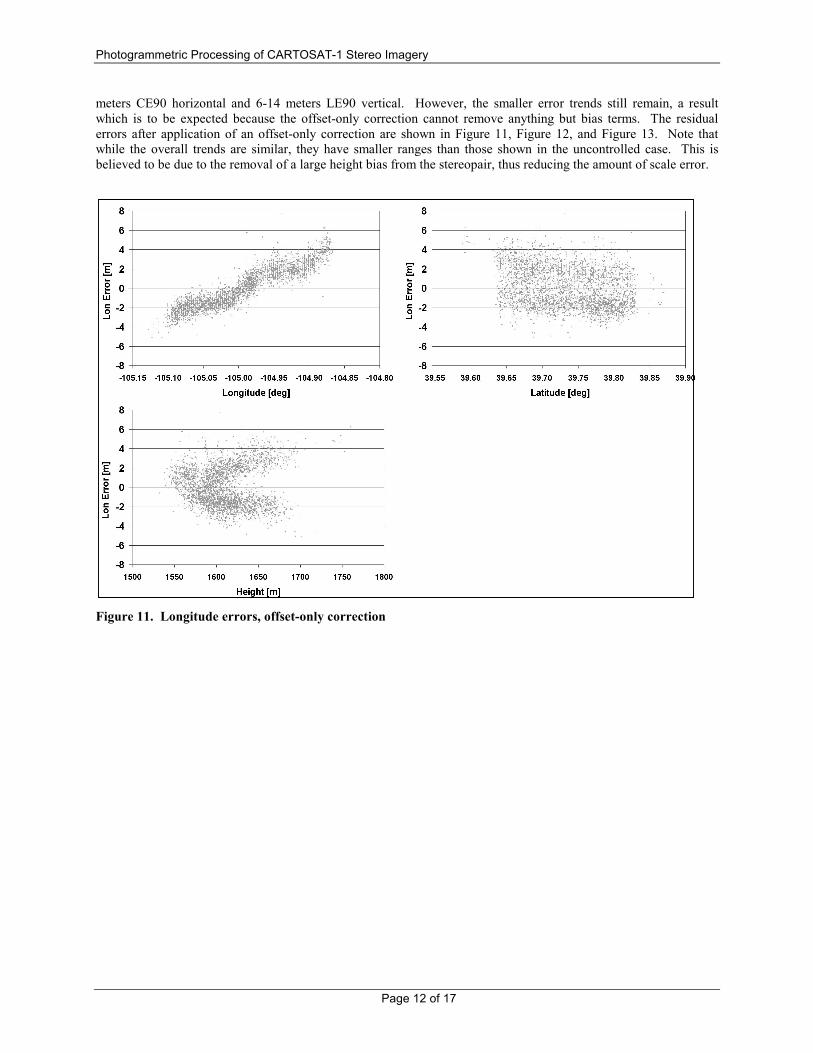
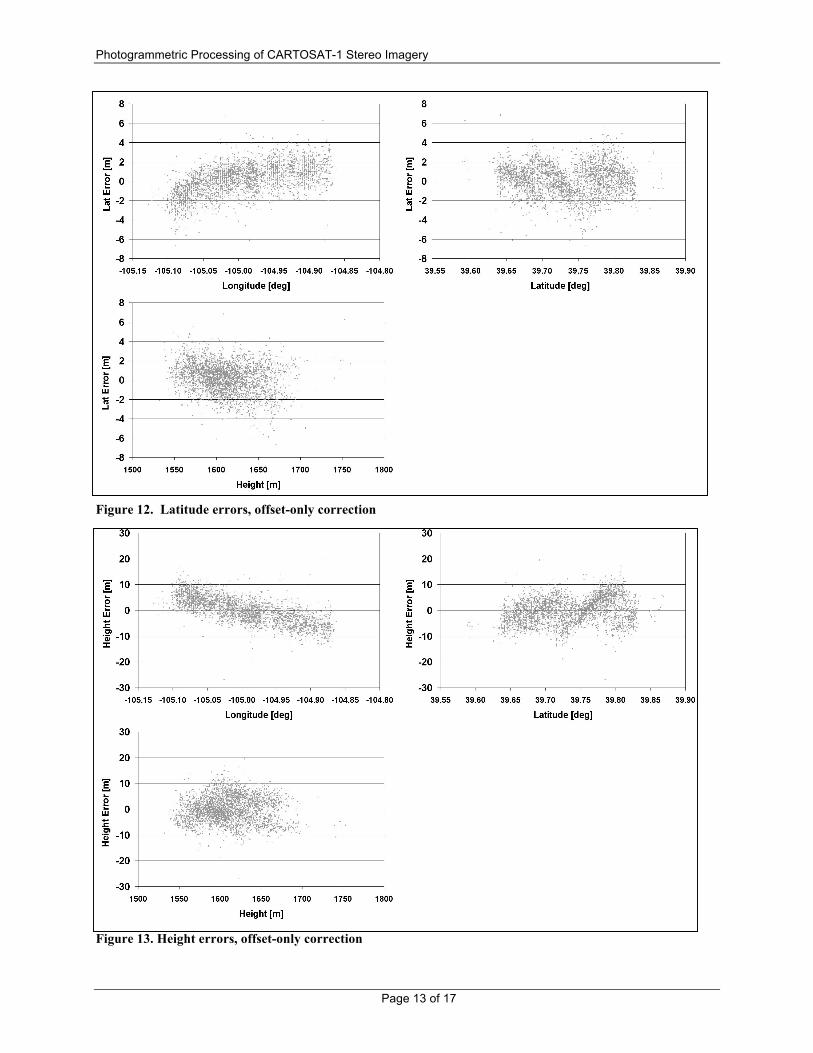
meters CE90 horizontal and 6-14 meters LE90 vertical. However, the smaller error trends still remain, a result which is to be expected because the offset-only correction cannot remove anything but bias terms. The residual errors after application of an offset-only correction are shown in Figure 11, Figure 12, and Figure 13. Note that while the overall trends are similar, they have smaller ranges than those shown in the uncontrolled case. This is believed to be due to the removal of a large height bias from the stereopair, thus reducing the amount of scale error.
Figure 11. Longitude errors, offset-only correction
Photogrammetric Processing of CARTOSAT-1 Stereo Imagery
Page 13 of 17
Figure 12. Latitude errors, offset-only correction
Figure 13. Height errors, offset-only correction
Photogrammetric Processing of CARTOSAT-1 Stereo Imagery
Page 14 of 17
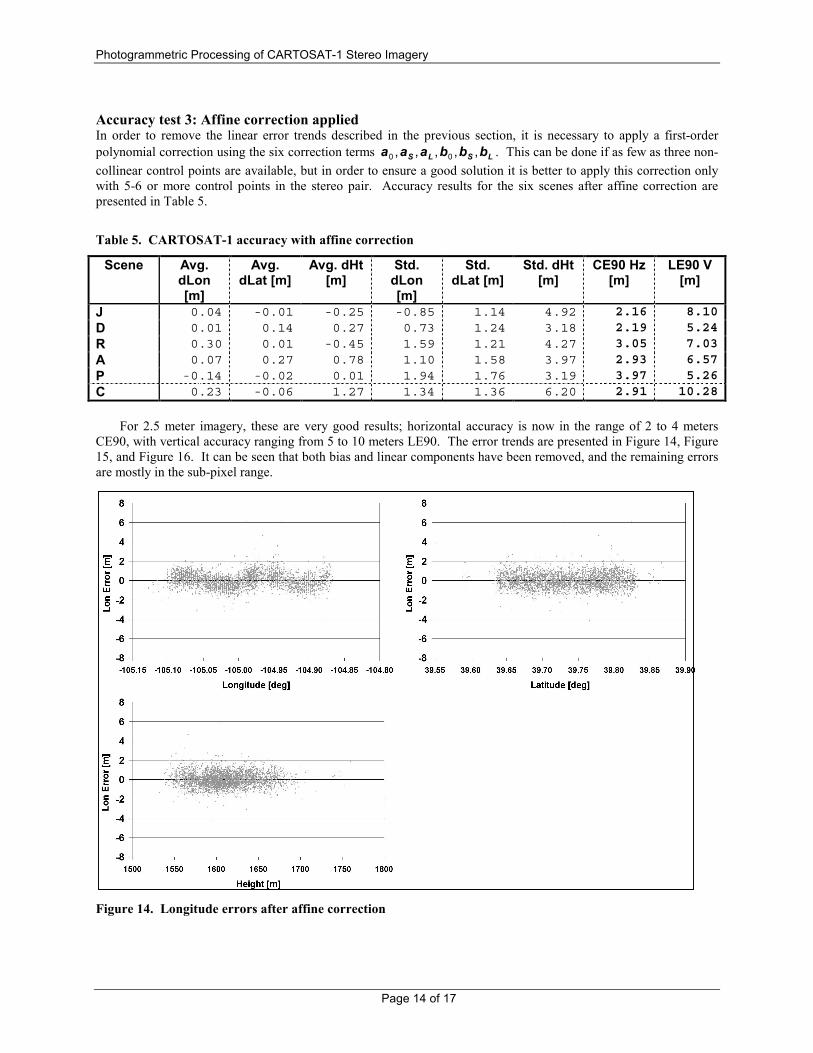
Accuracy test 3: Affine correction applied In order to remove the linear error trends described in the previous section, it is necessary to apply a first-order polynomial correction using the six correction terms LSLS bbbaaa ,,,,, 00 . This can be done if as few as three non-collinear control points are available, but in order to ensure a good solution it is better to apply this correction only with 5-6 or more control points in the stereo pair. Accuracy results for the six scenes after affine correction are presented in Table 5.
Table 5. CARTOSAT-1 accuracy with affine correction
Scene Avg. dLon [m]
Avg. dLat [m]
Avg. dHt [m]
Std. dLon [m]
Std. dLat [m]
Std. dHt [m]
CE90 Hz [m]
LE90 V [m]
J 0.04 -0.01 -0.25 -0.85 1.14 4.92 2.16 8.10D 0.01 0.14 0.27 0.73 1.24 3.18 2.19 5.24R 0.30 0.01 -0.45 1.59 1.21 4.27 3.05 7.03A 0.07 0.27 0.78 1.10 1.58 3.97 2.93 6.57P -0.14 -0.02 0.01 1.94 1.76 3.19 3.97 5.26C 0.23 -0.06 1.27 1.34 1.36 6.20 2.91 10.28
For 2.5 meter imagery, these are very good results; horizontal accuracy is now in the range of 2 to 4 meters
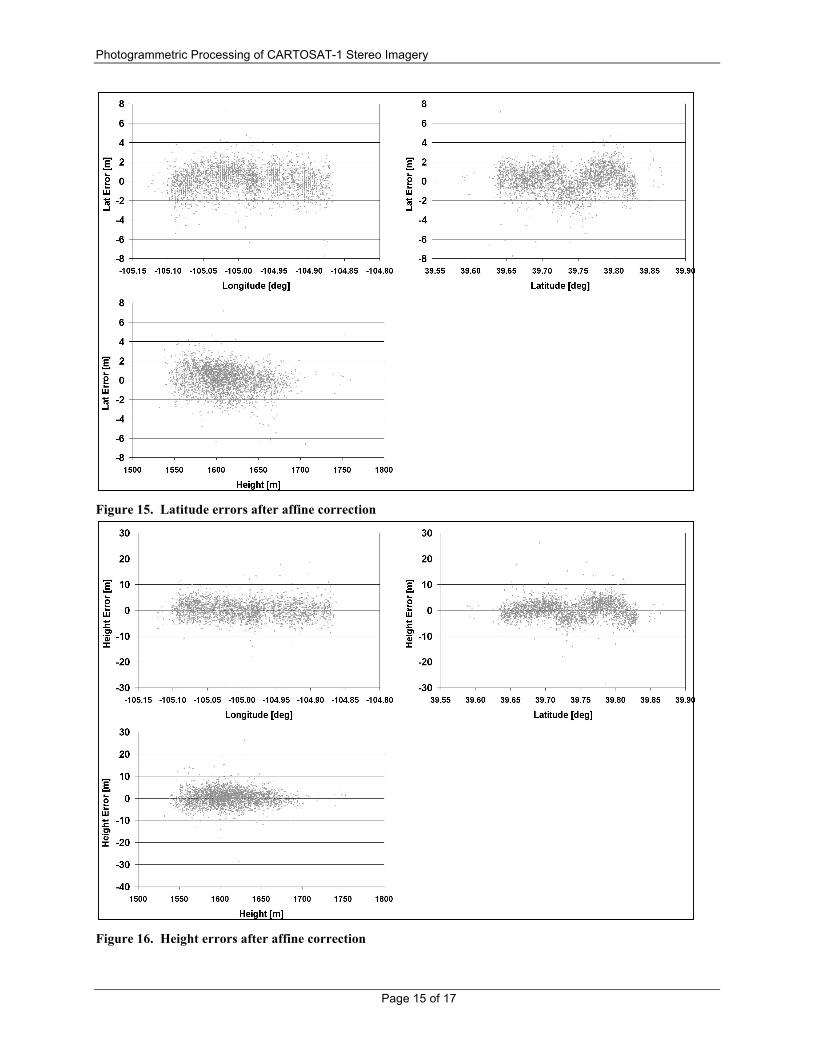
CE90, with vertical accuracy ranging from 5 to 10 meters LE90. The error trends are presented in Figure 14, Figure 15, and Figure 16. It can be seen that both bias and linear components have been removed, and the remaining errors are mostly in the sub-pixel range.
Figure 14. Longitude errors after affine correction
Photogrammetric Processing of CARTOSAT-1 Stereo Imagery
Page 15 of 17
Figure 15. Latitude errors after affine correction
Figure 16. Height errors after affine correction
Photogrammetric Processing of CARTOSAT-1 Stereo Imagery
Page 16 of 17
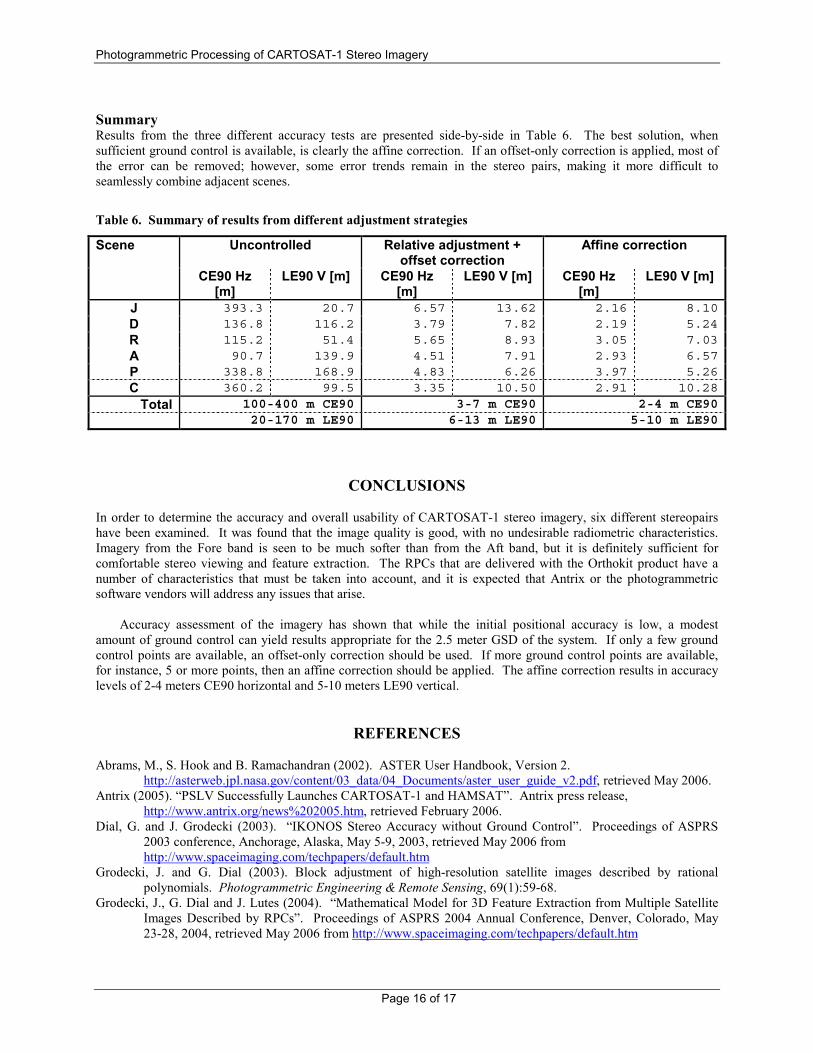
Summary Results from the three different accuracy tests are presented side-by-side in Table 6. The best solution, when sufficient ground control is available, is clearly the affine correction. If an offset-only correction is applied, most of the error can be removed; however, some error trends remain in the stereo pairs, making it more difficult to seamlessly combine adjacent scenes.
Table 6. Summary of results from different adjustment strategies
Uncontrolled Relative adjustment + offset correction
Affine correction Scene
CE90 Hz [m]
LE90 V [m] CE90 Hz [m]
LE90 V [m] CE90 Hz [m]
LE90 V [m]
J 393.3 20.7 6.57 13.62 2.16 8.10D 136.8 116.2 3.79 7.82 2.19 5.24R 115.2 51.4 5.65 8.93 3.05 7.03A 90.7 139.9 4.51 7.91 2.93 6.57P 338.8 168.9 4.83 6.26 3.97 5.26C 360.2 99.5 3.35 10.50 2.91 10.28
Total 100-400 m CE90 3-7 m CE90 2-4 m CE90 20-170 m LE90 6-13 m LE90 5-10 m LE90
CONCLUSIONS
In order to determine the accuracy and overall usability of CARTOSAT-1 stereo imagery, six different stereopairs have been examined. It was found that the image quality is good, with no undesirable radiometric characteristics. Imagery from the Fore band is seen to be much softer than from the Aft band, but it is definitely sufficient for comfortable stereo viewing and feature extraction. The RPCs that are delivered with the Orthokit product have a number of characteristics that must be taken into account, and it is expected that Antrix or the photogrammetric software vendors will address any issues that arise.
Accuracy assessment of the imagery has shown that while the initial positional accuracy is low, a modest
amount of ground control can yield results appropriate for the 2.5 meter GSD of the system. If only a few ground control points are available, an offset-only correction should be used. If more ground control points are available, for instance, 5 or more points, then an affine correction should be applied. The affine correction results in accuracy levels of 2-4 meters CE90 horizontal and 5-10 meters LE90 vertical.
REFERENCES
Abrams, M., S. Hook and B. Ramachandran (2002). ASTER User Handbook, Version 2. http://asterweb.jpl.nasa.gov/content/03_data/04_Documents/aster_user_guide_v2.pdf, retrieved May 2006.
Antrix (2005). “PSLV Successfully Launches CARTOSAT-1 and HAMSAT”. Antrix press release, http://www.antrix.org/news%202005.htm, retrieved February 2006.
Dial, G. and J. Grodecki (2003). “IKONOS Stereo Accuracy without Ground Control”. Proceedings of ASPRS 2003 conference, Anchorage, Alaska, May 5-9, 2003, retrieved May 2006 from http://www.spaceimaging.com/techpapers/default.htm
Grodecki, J. and G. Dial (2003). Block adjustment of high-resolution satellite images described by rational polynomials. Photogrammetric Engineering & Remote Sensing, 69(1):59-68.
Grodecki, J., G. Dial and J. Lutes (2004). “Mathematical Model for 3D Feature Extraction from Multiple Satellite Images Described by RPCs”. Proceedings of ASPRS 2004 Annual Conference, Denver, Colorado, May 23-28, 2004, retrieved May 2006 from http://www.spaceimaging.com/techpapers/default.htm
Photogrammetric Processing of CARTOSAT-1 Stereo Imagery
Page 17 of 17
Hartley, R. and T. Saxena (2000). The Cubic Rational Polynomial Model. http://citeseer.ist.psu.edu/hartley00cubic.html, retrieved 2003.
Krishnaswamy, M. and S. Kalyanaraman (2004). "Indian Remote Sensing Satellite Cartosat-1: Technical features and data products." http://www.gisdevelopment.net/technology/rs/techrs023pf.htm, retrieved February 2006.
Lutes, James (2005). "RESOURCESAT-1 Geometric Accuracy Assessment." Proceedings of ASPRS 2005 Conference, Baltimore, Maryland, March 7-11, 2005, retrieved May 2006 from http://www.spaceimaging.com/techpapers/default.htm
NRSA Data Center (2005). “CARTOSAT-1: A global IRS mission for large scale mapping and Terrain Modelling applications.” http://www.nrsa.gov.in/cartosat-1/images/Cartosat_E_brochure.pdf, retrieved February 2006.