Embed Size (px)
Citation preview
Photovoltaic Module Rail Bonding with Acrylic Foam Tapes
Scott R. Meyer, Senior Specialist – Product and Application Development Engineer, 3M Company, 230-1E-11, 3M Center, St. Paul, MN 55144, USA
Biography: Scott R. Meyer: Senior Specialist-Product and Application Development Engineer; 3M headquarters in St. Paul, MN, USA; Chemical Engineer B.S. degree from Iowa State University, 1985; 28 years at 3M Company in various divisions; experience with PSA tapes, epoxies, urethanes and fluoroelastomers; 5 years of tapes and adhesives experience related to the solar industry. Abstract:
Durable mounting of solar photovoltaic (PV) modules is an important application for the solar industry. Long-term durability of PV module installations is required to justify the cost of building economically viable solar farms. This paper discusses potential mounting strategies for rigid PV modules with an emphasis on rail mounting of glass/glass modules. Advantages of rails over other mounting approaches and a review of the relevant forces acting on adhesives in the rail mounting system will be discussed. The use of acrylic foam tape for this application is reviewed in detail. References are reviewed to illustrate why acrylic foam tapes are a good solution for attachment of rails to glass/glass modules. Specific data portray the long-term performance characteristics of these viscoelastic adhesive tapes. Examples of design calculations for use with specific grades of acrylic foam tape in rail mounting applications are provided as a guide for module manufacturers and installers. These calculations are based on relevant performance characteristics and material property data. Some of the benefits of using acrylic foam tapes for rail bonding application are: immediate handling strength; consistent bond quality due to ease of application in the bonding process; tolerance of thermal mechanical stresses; weather resistant, long-term durability with a proven track record in outdoor industrial and automotive applications; and cost effectiveness.
1.0 Introduction
In order to justify the cost of building viable solar farms, photovoltaic (PV) module installations must offer long-term performance. Therefore, the durable mounting of PV panels is an important application for the solar industry. The current options are limited, however, and each panel mounting method has an impact on cost and performance. The focus of this report is on the mounting of rigid modules. In this paper, two types of rigid modules are discussed: glass/glass modules and glass/backsheet modules. Discussion of mounting flexible modules is outside the scope of this paper. 2.0 Relevant Forces Key forces acting on the module mounting systems must be considered when designing attachment systems. These forces can be categorized as either dynamic or static. Dynamic forces refer to loads or displacements that change with time. Examples of dynamic forces include wind gusts, handling during installation and movement due to thermal expansion mismatches between non-similar materials. High wind gusts and handling loads typically have durations of a few seconds. Three-second wind gusts are commonly used to calculate wind loads and can be used to predict the performance of an adhesive system in an application [1,2]. Thermal expansion and contraction must also be considered when bonding non-similar materials with different thermal expansion properties.
This difference in thermal expansion can cause cyclic displacements, which occur at various rates and cause cyclic loads on the adhesive system. The time frames for cyclic displacement can be from day to day – e.g., from the hottest part of the day to the coldest part of the day – or season to season, e.g. from the hottest summer to the coldest winter days.
Static loads, such as gravitational force acting upon the module, do not change over time. In some geographical locations, loads caused by the weight of snow must be considered during the design of a system. Snow load is viewed as a static load at cold temperatures (e.g. 0°C). 3.0 Methods to Evaluate Performance
UL1703, IEC61646 & IEC61215 standards contain mechanical load testing used by the solar industry to characterize the performance of the full module attachment design [3,4,5]. IEC61646 specifies applying 2400 Pa of pressure to the front and the back of the panel to simulate wind gust. The test is run three times, with each load applied for one hour. If the module is to be qualified for handling heavy snow or ice loads, pressure is applied to the front side at 5400 Pa during the last cycle. These tests are all performed at ambient conditions. This test can be misleading because high wind gusts typically last only seconds and snow loads occur at cooler temperatures for longer durations. Speed and temperature are two key variables that can significantly impact an adhesive’s performance, as can be seen from the examples presented in Section 6.1.
One method that can be used to quantify dynamic forces is overlap shear testing, which is described in ASTM D1002 [6]. This method is typically performed at a constant extension rate and therefore is not representative of the relevant forces in many applications. This paper suggests using a “Constant Force to Rupture” (CFTR) method to characterize the time until rupture failure under various constant forces. The CFTR method has been presented in other papers to help quantify design characteristics of adhesives [1,8,9] to estimate real world performance. The CFTR method can be done in an overlap shear (OLS) or a pluck (sometimes referred to as tensile) mode. The OLS methods use similar test protocol as described in ASTM D3654 [7]. The OLS and pluck CFTR methods apply a constant force, which is believed to accurately simulate the constant forces (e.g. gravity) acting on the module. The data can be used to predict both long-term (e.g. years) and short term (e.g. 3 second wind gusts) force failures. The difficulty with the CFTR method is that it takes a long time to collect the data required to project long term failures; in addition, the prediction of performance after many years requires extrapolation, which can add uncertainty to the results. However, “good” data – in other words, statistically fitting data – can be used to estimate long-term static performance. The work in this paper evaluates performance over longer times and under more severe conditions than the other referenced papers. The conditions evaluated in this paper include severe conditions that are relevant to the solar industry. The CFTR results from this study will be discussed more in section 7.0 through 7.2. 4.0 Glass/Backsheet Modules
Glass/backsheet rigid modules are commonly used for crystalline silicon PV panels. The dominant mounting method for glass/backsheet modules utilizes metal frames that surround the entire perimeter of the module. These frames typically have a U-channel where the panel edges are inserted and secured by either a liquid adhesive or a tape. An adhesive system is required in most designs to pass UL1703 and IEC mechanical load testing. Further discussion of adhesive tapes, requirements, and related adhesive characterization for frame bonding can be found in other articles [10]. Frames increase the cost of the module due to the large amount of metal used around the
perimeter of the PV panel. They also add to the cost of installation because each module needs to be grounded.
Clips are another option for mounting PV modules. Clips contact small areas around the edge of the module, and these clips are subjected to the stress of full wind or snow loads. Clip design is very important, as module failure can occur in these areas if the clipped area is unable to withstand the applied loads. Multiple clips around the edge can be used to minimize the forces at each clip area. Thicker glass can also help reduce the potential for failure, but may be cost prohibitive.
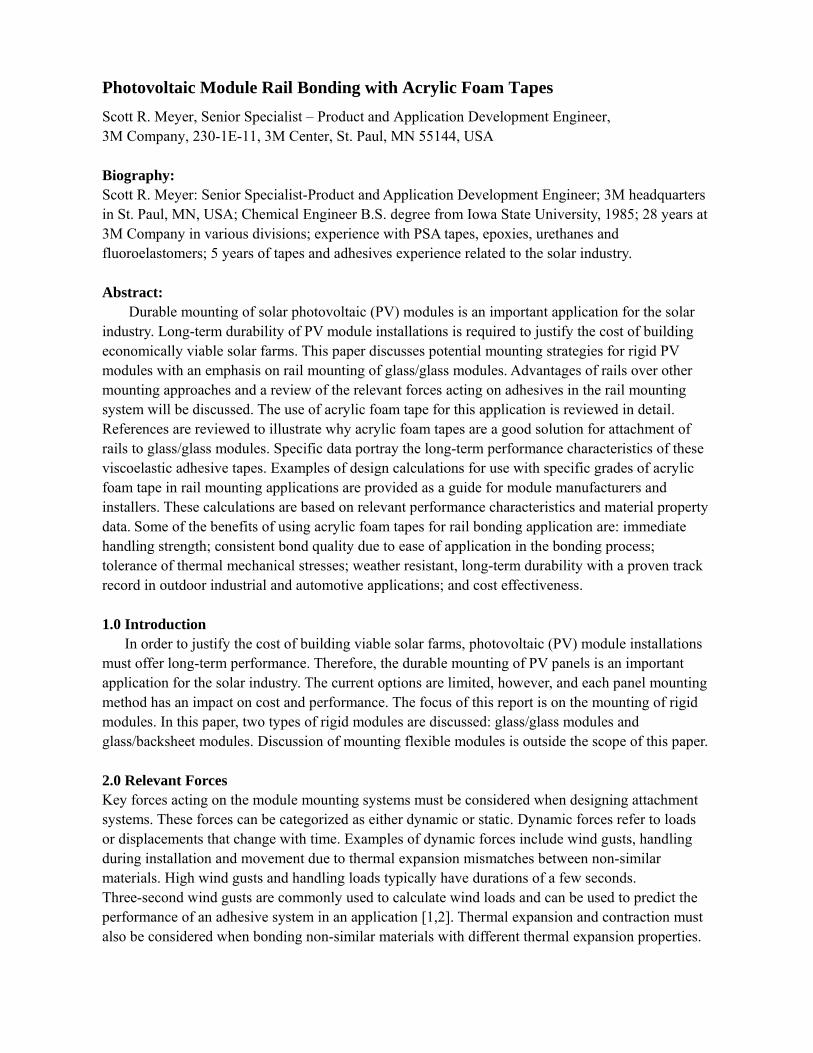
A third option for backsheet modules is to use adhesive bonded rails on the back side of the module. The adhesive can be a foam tape, liquid or combination of the two. This option presents a concern, however: forces exerted on the module’s internal components can cause internal delamination of the encapsulant or backsheet. One strategy for addressing delamination relates to adhesive properties. Properly designed viscoelastic adhesives can help protect the bond interfaces through stress relaxation, distributing the force more evenly than elastic or rigid adhesives. A second strategy for minimizing the likelihood of delamination is to reduce stress (force per area) by applying the adhesive to a larger surface area.
Figure 1. Large a-Si PV modules (~2.2m by ~2.6m) mounted using rail attachments;
Photos used with permission.
4.1 Glass/Glass Modules
Glass/glass rigid modules are the dominant type of module in the thin film PV industry. Clips are more common with glass/glass modules than glass/backsheet modules. The extra thickness of the glass helps withstand the localized forces associated with clips. While the market is trending towards larger modules and thinner glass in an effort to reduce costs, such configurations are more at risk of damage from the clips. Frames can be used with glass/glass modules, but are less common than clips due to the associated costs with completely framed modules.
Rail attachment is a cost-effective approach and a very attractive option for glass/glass modules. A correctly designed rail attachment system can withstand the relevant forces, and the advantages become more pronounced when moving to larger modules and/or thinner glass. Rails can be positioned on the back of the module to stiffen and support the module to resist wind and snow loads. 3M™ Acrylic Foam Tapes have been used in solar module rail attachment for over 5 years, and in industrial and automotive exterior applications since the early 1980s. Fig. 1 shows the use of rails with 3M Acrylic Foam Tape on large (2.2m x 2.6 m) a-Si thin film modules; a video of this installation is available online [11].
5.0 Modeling of Various Attachment Methods
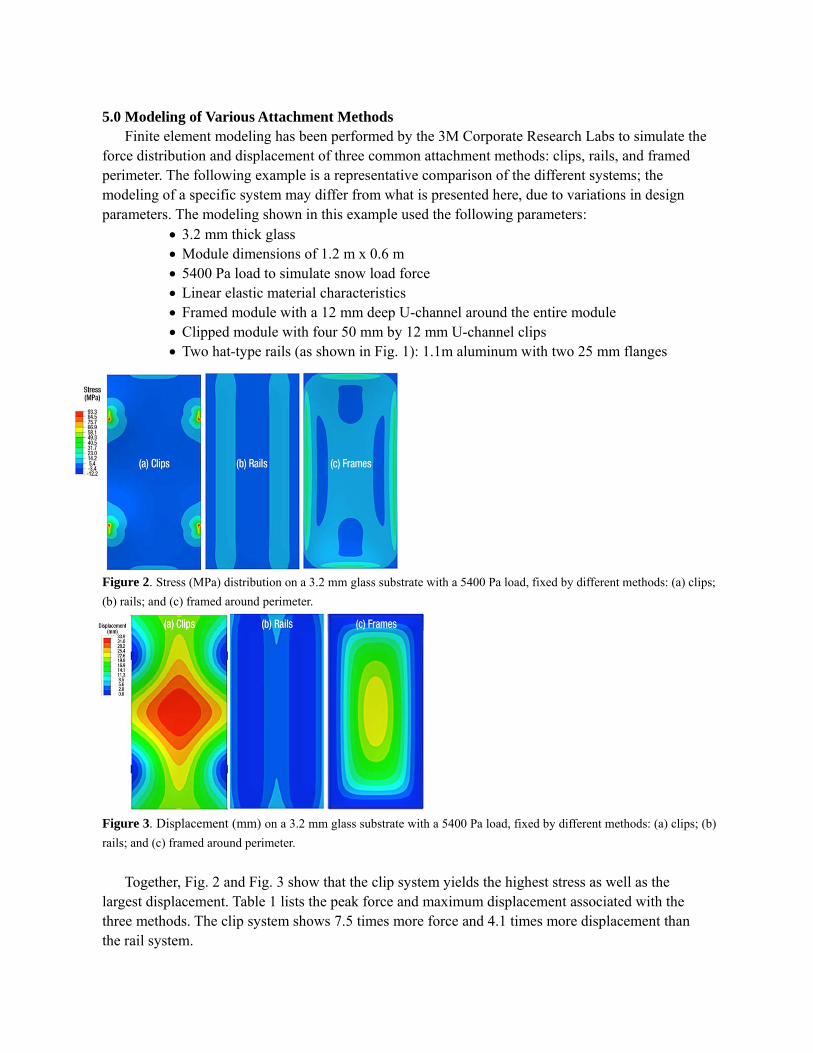
Finite element modeling has been performed by the 3M Corporate Research Labs to simulate the force distribution and displacement of three common attachment methods: clips, rails, and framed perimeter. The following example is a representative comparison of the different systems; the modeling of a specific system may differ from what is presented here, due to variations in design parameters. The modeling shown in this example used the following parameters:
3.2 mm thick glass Module dimensions of 1.2 m x 0.6 m 5400 Pa load to simulate snow load force Linear elastic material characteristics Framed module with a 12 mm deep U-channel around the entire module Clipped module with four 50 mm by 12 mm U-channel clips Two hat-type rails (as shown in Fig. 1): 1.1m aluminum with two 25 mm flanges
Figure 2. Stress (MPa) distribution on a 3.2 mm glass substrate with a 5400 Pa load, fixed by different methods: (a) clips;
(b) rails; and (c) framed around perimeter.
Figure 3. Displacement (mm) on a 3.2 mm glass substrate with a 5400 Pa load, fixed by different methods: (a) clips; (b)
rails; and (c) framed around perimeter.
Together, Fig. 2 and Fig. 3 show that the clip system yields the highest stress as well as the
largest displacement. Table 1 lists the peak force and maximum displacement associated with the three methods. The clip system shows 7.5 times more force and 4.1 times more displacement than the rail system.
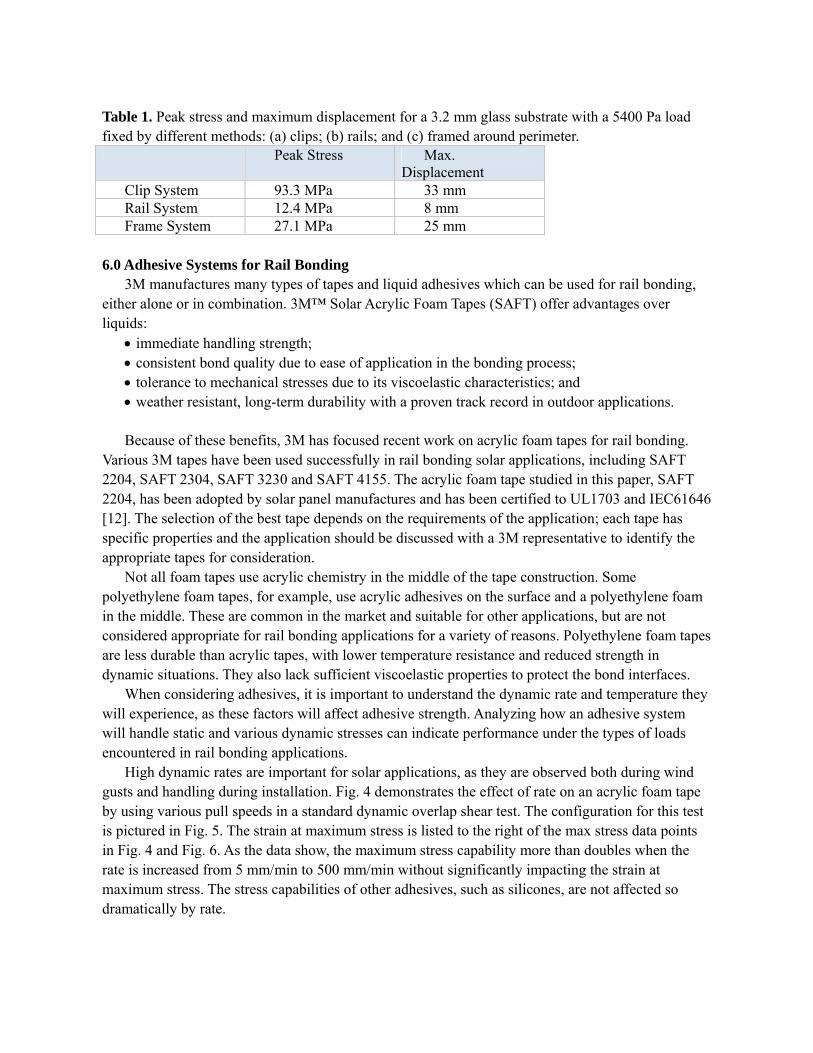
Table 1. Peak stress and maximum displacement for a 3.2 mm glass substrate with a 5400 Pa load fixed by different methods: (a) clips; (b) rails; and (c) framed around perimeter.
Peak Stress Max. Displacement
Clip System 93.3 MPa 33 mm Rail System 12.4 MPa 8 mm Frame System 27.1 MPa 25 mm
6.0 Adhesive Systems for Rail Bonding
3M manufactures many types of tapes and liquid adhesives which can be used for rail bonding, either alone or in combination. 3M™ Solar Acrylic Foam Tapes (SAFT) offer advantages over liquids:
immediate handling strength; consistent bond quality due to ease of application in the bonding process; tolerance to mechanical stresses due to its viscoelastic characteristics; and weather resistant, long-term durability with a proven track record in outdoor applications. Because of these benefits, 3M has focused recent work on acrylic foam tapes for rail bonding.
Various 3M tapes have been used successfully in rail bonding solar applications, including SAFT 2204, SAFT 2304, SAFT 3230 and SAFT 4155. The acrylic foam tape studied in this paper, SAFT 2204, has been adopted by solar panel manufactures and has been certified to UL1703 and IEC61646 [12]. The selection of the best tape depends on the requirements of the application; each tape has specific properties and the application should be discussed with a 3M representative to identify the appropriate tapes for consideration.
Not all foam tapes use acrylic chemistry in the middle of the tape construction. Some polyethylene foam tapes, for example, use acrylic adhesives on the surface and a polyethylene foam in the middle. These are common in the market and suitable for other applications, but are not considered appropriate for rail bonding applications for a variety of reasons. Polyethylene foam tapes are less durable than acrylic tapes, with lower temperature resistance and reduced strength in dynamic situations. They also lack sufficient viscoelastic properties to protect the bond interfaces.
When considering adhesives, it is important to understand the dynamic rate and temperature they will experience, as these factors will affect adhesive strength. Analyzing how an adhesive system will handle static and various dynamic stresses can indicate performance under the types of loads encountered in rail bonding applications.
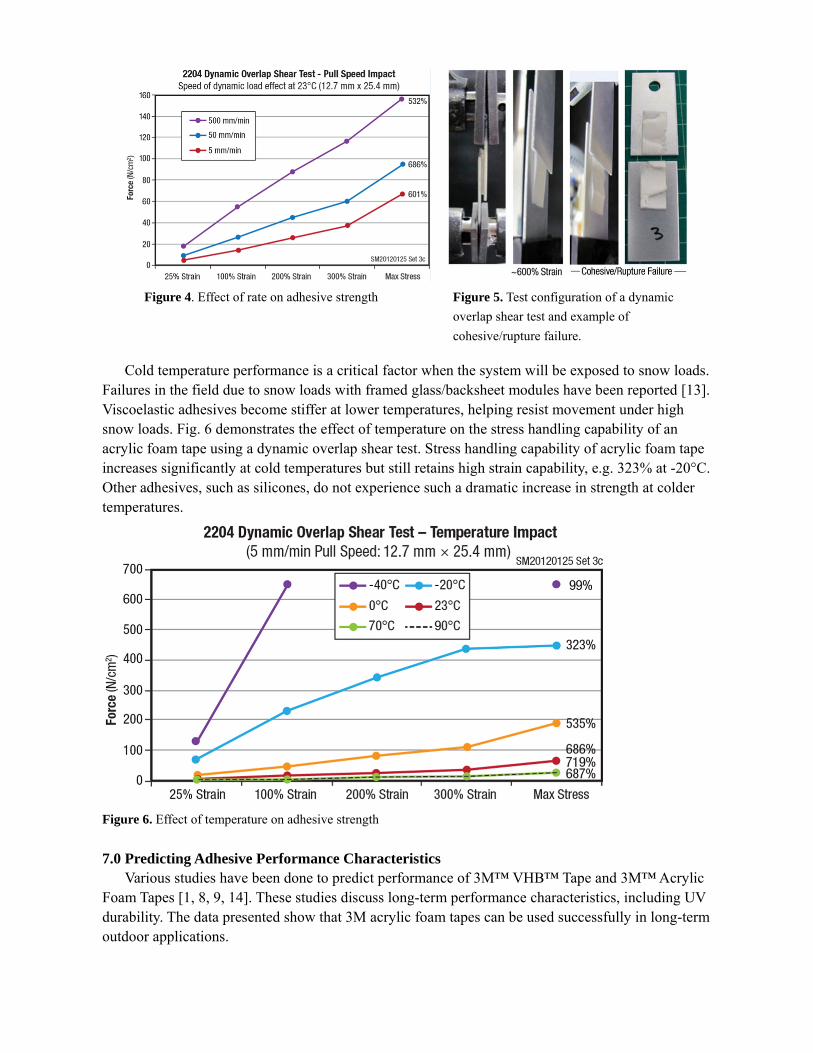
High dynamic rates are important for solar applications, as they are observed both during wind gusts and handling during installation. Fig. 4 demonstrates the effect of rate on an acrylic foam tape by using various pull speeds in a standard dynamic overlap shear test. The configuration for this test is pictured in Fig. 5. The strain at maximum stress is listed to the right of the max stress data points in Fig. 4 and Fig. 6. As the data show, the maximum stress capability more than doubles when the rate is increased from 5 mm/min to 500 mm/min without significantly impacting the strain at maximum stress. The stress capabilities of other adhesives, such as silicones, are not affected so dramatically by rate.
Cold temperature performance is a critical factor when the system will be exposed to snow loads.
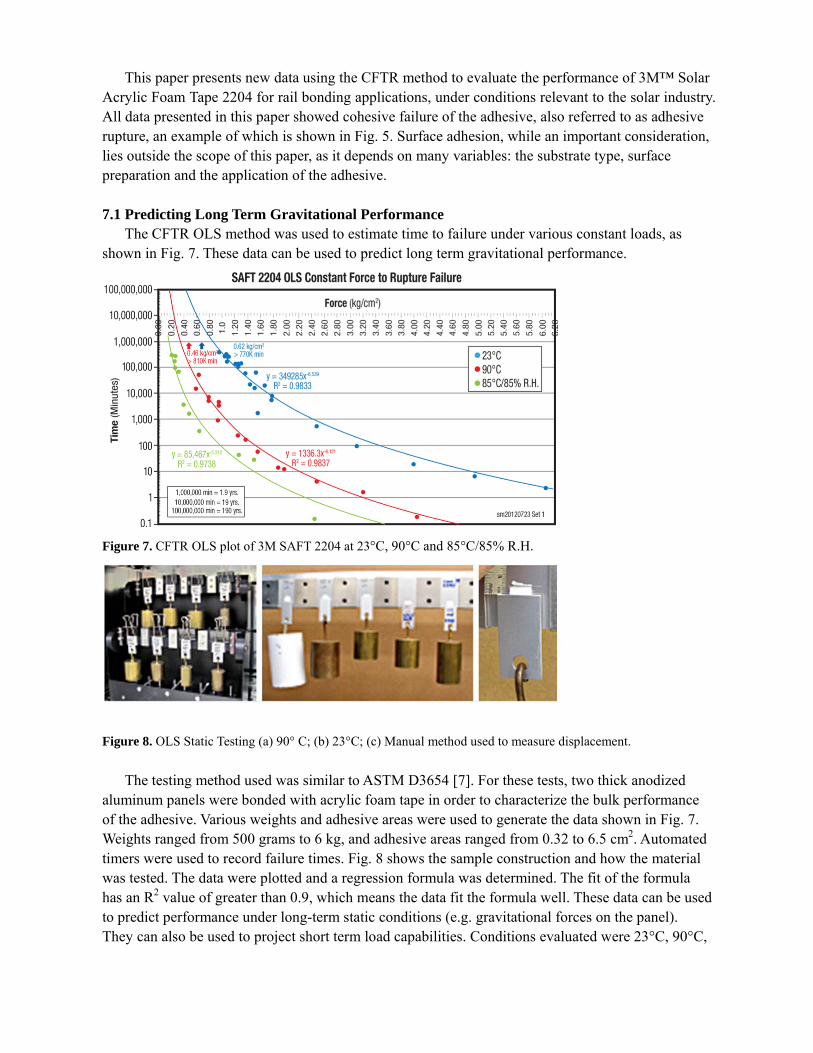
Failures in the field due to snow loads with framed glass/backsheet modules have been reported [13]. Viscoelastic adhesives become stiffer at lower temperatures, helping resist movement under high snow loads. Fig. 6 demonstrates the effect of temperature on the stress handling capability of an acrylic foam tape using a dynamic overlap shear test. Stress handling capability of acrylic foam tape increases significantly at cold temperatures but still retains high strain capability, e.g. 323% at -20°C. Other adhesives, such as silicones, do not experience such a dramatic increase in strength at colder temperatures.
Figure 6. Effect of temperature on adhesive strength
7.0 Predicting Adhesive Performance Characteristics
Various studies have been done to predict performance of 3M™ VHB™ Tape and 3M™ Acrylic Foam Tapes [1, 8, 9, 14]. These studies discuss long-term performance characteristics, including UV durability. The data presented show that 3M acrylic foam tapes can be used successfully in long-term outdoor applications.
Figure 4. Effect of rate on adhesive strength Figure 5. Test configuration of a dynamic
overlap shear test and example of
cohesive/rupture failure.
This paper presents new data using the CFTR method to evaluate the performance of 3M™ Solar Acrylic Foam Tape 2204 for rail bonding applications, under conditions relevant to the solar industry. All data presented in this paper showed cohesive failure of the adhesive, also referred to as adhesive rupture, an example of which is shown in Fig. 5. Surface adhesion, while an important consideration, lies outside the scope of this paper, as it depends on many variables: the substrate type, surface preparation and the application of the adhesive. 7.1 Predicting Long Term Gravitational Performance
The CFTR OLS method was used to estimate time to failure under various constant loads, as shown in Fig. 7. These data can be used to predict long term gravitational performance.
Figure 7. CFTR OLS plot of 3M SAFT 2204 at 23°C, 90°C and 85°C/85% R.H.
Figure 8. OLS Static Testing (a) 90° C; (b) 23°C; (c) Manual method used to measure displacement.
The testing method used was similar to ASTM D3654 [7]. For these tests, two thick anodized
aluminum panels were bonded with acrylic foam tape in order to characterize the bulk performance of the adhesive. Various weights and adhesive areas were used to generate the data shown in Fig. 7. Weights ranged from 500 grams to 6 kg, and adhesive areas ranged from 0.32 to 6.5 cm2. Automated timers were used to record failure times. Fig. 8 shows the sample construction and how the material was tested. The data were plotted and a regression formula was determined. The fit of the formula has an R2 value of greater than 0.9, which means the data fit the formula well. These data can be used to predict performance under long-term static conditions (e.g. gravitational forces on the panel). They can also be used to project short term load capabilities. Conditions evaluated were 23°C, 90°C,
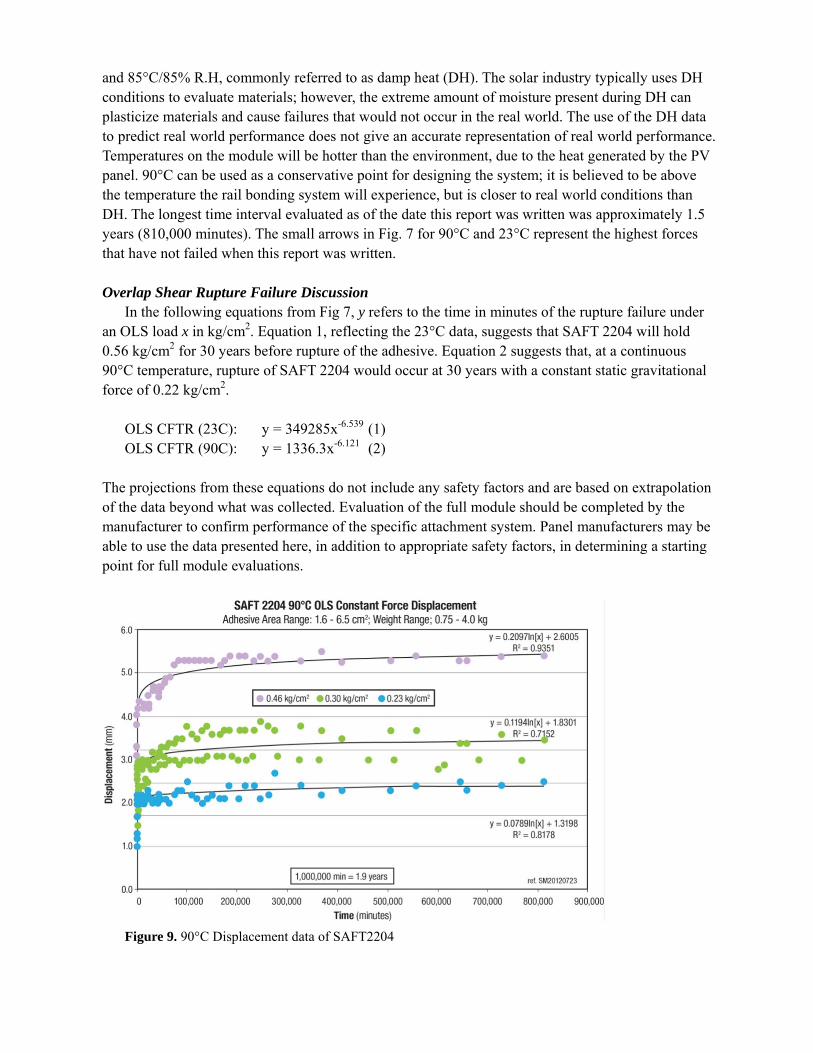
and 85°C/85% R.H, commonly referred to as damp heat (DH). The solar industry typically uses DH conditions to evaluate materials; however, the extreme amount of moisture present during DH can plasticize materials and cause failures that would not occur in the real world. The use of the DH data to predict real world performance does not give an accurate representation of real world performance. Temperatures on the module will be hotter than the environment, due to the heat generated by the PV panel. 90°C can be used as a conservative point for designing the system; it is believed to be above the temperature the rail bonding system will experience, but is closer to real world conditions than DH. The longest time interval evaluated as of the date this report was written was approximately 1.5 years (810,000 minutes). The small arrows in Fig. 7 for 90°C and 23°C represent the highest forces that have not failed when this report was written. Overlap Shear Rupture Failure Discussion
In the following equations from Fig 7, y refers to the time in minutes of the rupture failure under an OLS load x in kg/cm2. Equation 1, reflecting the 23°C data, suggests that SAFT 2204 will hold 0.56 kg/cm2 for 30 years before rupture of the adhesive. Equation 2 suggests that, at a continuous 90°C temperature, rupture of SAFT 2204 would occur at 30 years with a constant static gravitational force of 0.22 kg/cm2.
OLS CFTR (23C): y = 349285x-6.539 (1) OLS CFTR (90C): y = 1336.3x-6.121 (2)
The projections from these equations do not include any safety factors and are based on extrapolation of the data beyond what was collected. Evaluation of the full module should be completed by the manufacturer to confirm performance of the specific attachment system. Panel manufacturers may be able to use the data presented here, in addition to appropriate safety factors, in determining a starting point for full module evaluations.
Figure 9. 90°C Displacement data of SAFT2204
Overlap Shear Displacement Under Load Discussion The method (discussed in section 7.1, pictured in Fig. 8) included a manual measurement of
displacement. Fig. 9 shows displacement data of an acrylic foam tape at 90°C. The curve of the acrylic foam tape flattens out over time due to the cross-linked polymer matrix of the viscoelastic acrylic foam tape. This behavior is expected when constant stress loads are below values which would lead to rupture failure.
7.2 Predicting Wind Gust Performance
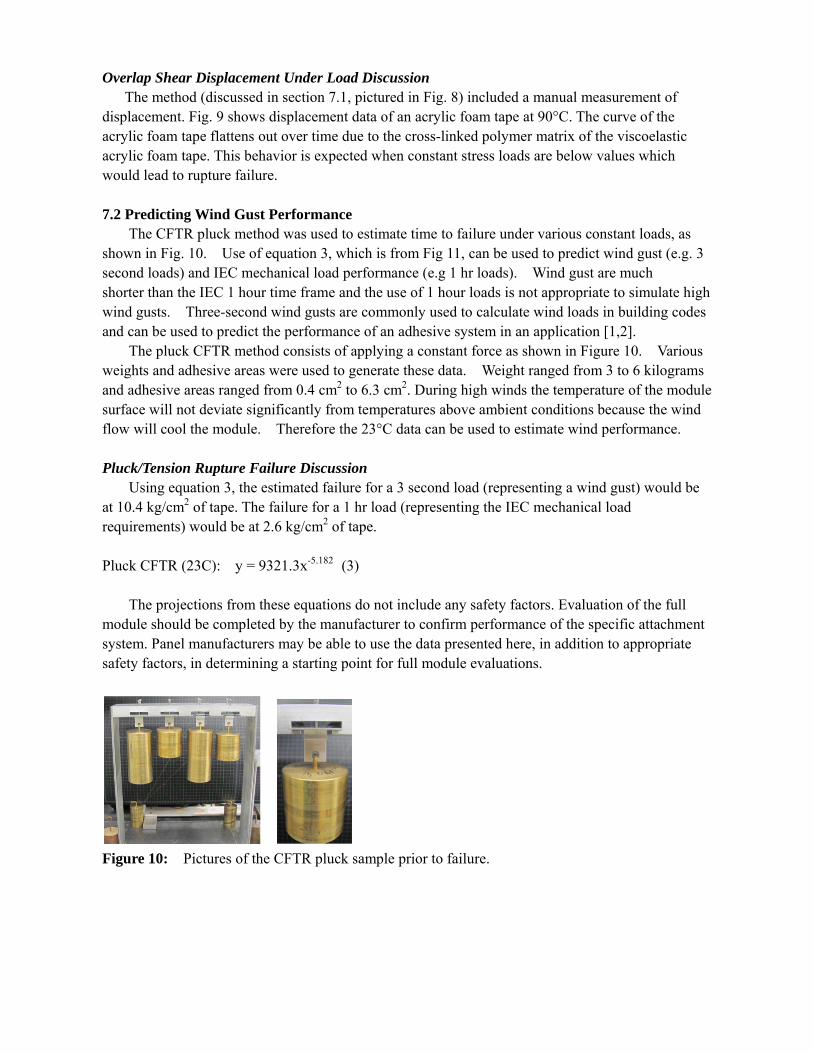
The CFTR pluck method was used to estimate time to failure under various constant loads, as shown in Fig. 10. Use of equation 3, which is from Fig 11, can be used to predict wind gust (e.g. 3 second loads) and IEC mechanical load performance (e.g 1 hr loads). Wind gust are much shorter than the IEC 1 hour time frame and the use of 1 hour loads is not appropriate to simulate high wind gusts. Three-second wind gusts are commonly used to calculate wind loads in building codes and can be used to predict the performance of an adhesive system in an application [1,2]. The pluck CFTR method consists of applying a constant force as shown in Figure 10. Various weights and adhesive areas were used to generate these data. Weight ranged from 3 to 6 kilograms and adhesive areas ranged from 0.4 cm2 to 6.3 cm2. During high winds the temperature of the module surface will not deviate significantly from temperatures above ambient conditions because the wind flow will cool the module. Therefore the 23°C data can be used to estimate wind performance. Pluck/Tension Rupture Failure Discussion
Using equation 3, the estimated failure for a 3 second load (representing a wind gust) would be at 10.4 kg/cm2 of tape. The failure for a 1 hr load (representing the IEC mechanical load requirements) would be at 2.6 kg/cm2 of tape.
Pluck CFTR (23C): y = 9321.3x-5.182 (3)
The projections from these equations do not include any safety factors. Evaluation of the full
module should be completed by the manufacturer to confirm performance of the specific attachment system. Panel manufacturers may be able to use the data presented here, in addition to appropriate safety factors, in determining a starting point for full module evaluations.
Figure 10: Pictures of the CFTR pluck sample prior to failure.
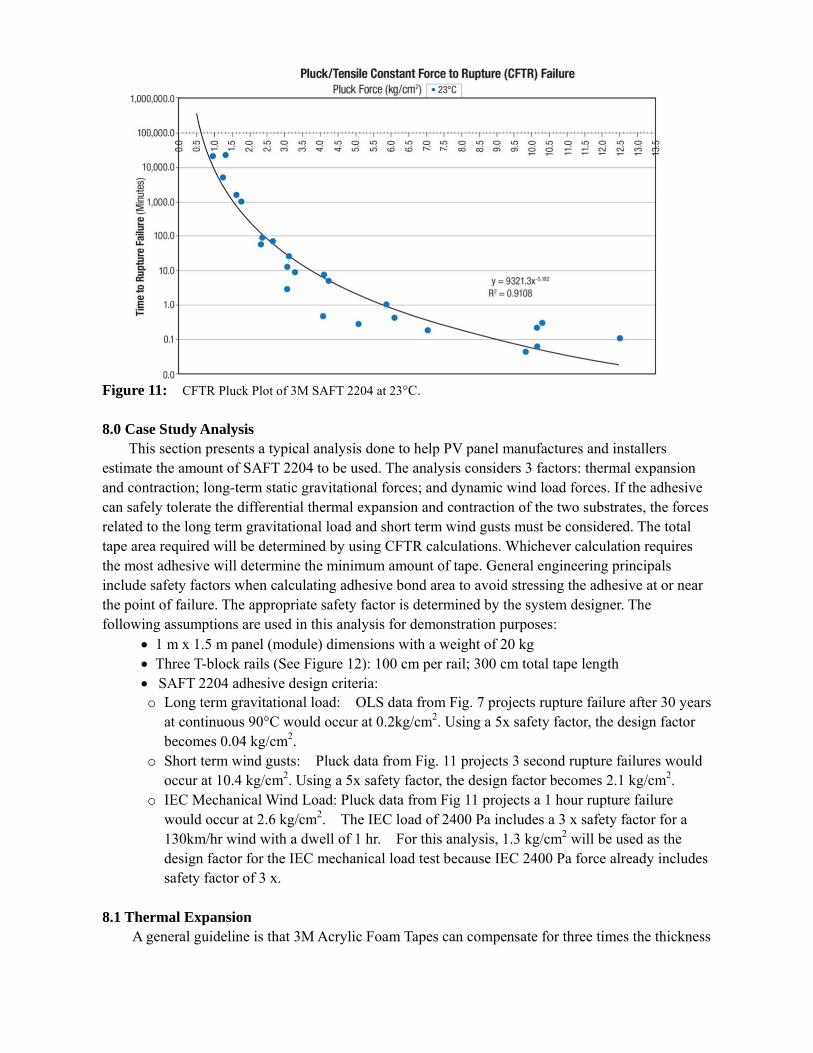
Figure 11: CFTR Pluck Plot of 3M SAFT 2204 at 23°C. 8.0 Case Study Analysis
This section presents a typical analysis done to help PV panel manufactures and installers estimate the amount of SAFT 2204 to be used. The analysis considers 3 factors: thermal expansion and contraction; long-term static gravitational forces; and dynamic wind load forces. If the adhesive can safely tolerate the differential thermal expansion and contraction of the two substrates, the forces related to the long term gravitational load and short term wind gusts must be considered. The total tape area required will be determined by using CFTR calculations. Whichever calculation requires the most adhesive will determine the minimum amount of tape. General engineering principals include safety factors when calculating adhesive bond area to avoid stressing the adhesive at or near the point of failure. The appropriate safety factor is determined by the system designer. The following assumptions are used in this analysis for demonstration purposes:
1 m x 1.5 m panel (module) dimensions with a weight of 20 kg Three T-block rails (See Figure 12): 100 cm per rail; 300 cm total tape length SAFT 2204 adhesive design criteria: o Long term gravitational load: OLS data from Fig. 7 projects rupture failure after 30 years
at continuous 90°C would occur at 0.2kg/cm2. Using a 5x safety factor, the design factor becomes 0.04 kg/cm2.
o Short term wind gusts: Pluck data from Fig. 11 projects 3 second rupture failures would occur at 10.4 kg/cm2. Using a 5x safety factor, the design factor becomes 2.1 kg/cm2.
o IEC Mechanical Wind Load: Pluck data from Fig 11 projects a 1 hour rupture failure would occur at 2.6 kg/cm2. The IEC load of 2400 Pa includes a 3 x safety factor for a 130km/hr wind with a dwell of 1 hr. For this analysis, 1.3 kg/cm2 will be used as the design factor for the IEC mechanical load test because IEC 2400 Pa force already includes safety factor of 3 x.
8.1 Thermal Expansion
A general guideline is that 3M Acrylic Foam Tapes can compensate for three times the thickness
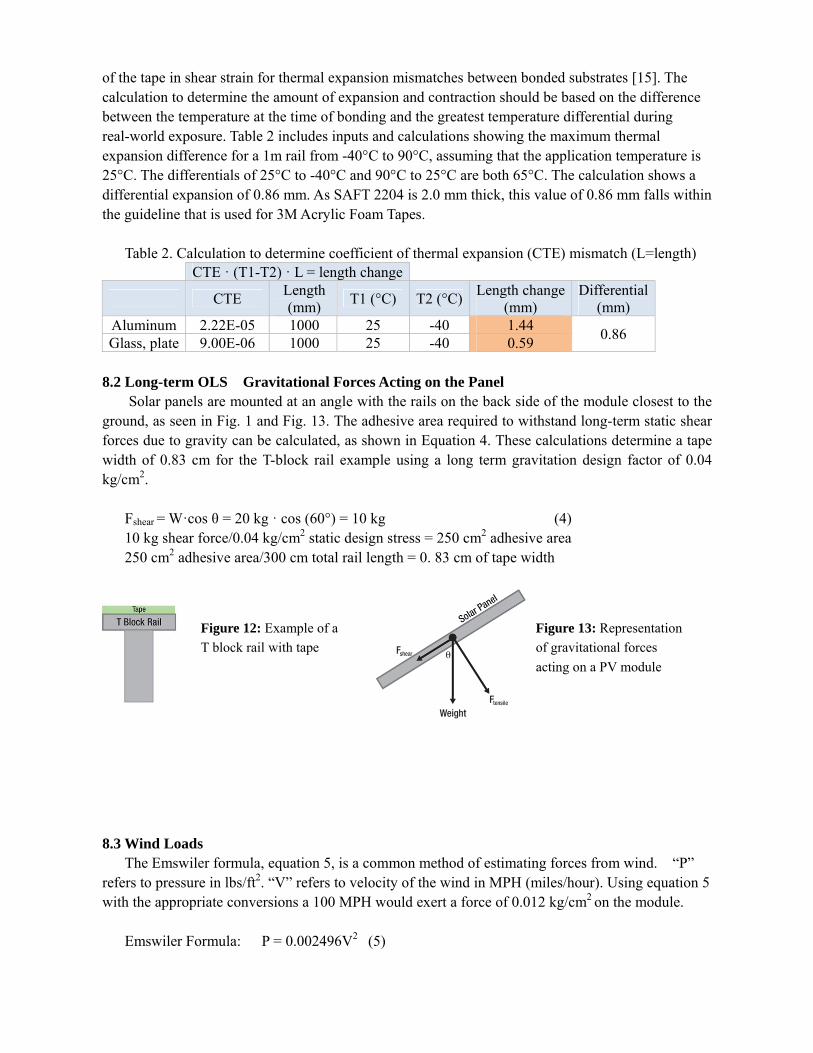
of the tape in shear strain for thermal expansion mismatches between bonded substrates [15]. The calculation to determine the amount of expansion and contraction should be based on the difference between the temperature at the time of bonding and the greatest temperature differential during real-world exposure. Table 2 includes inputs and calculations showing the maximum thermal expansion difference for a 1m rail from -40°C to 90°C, assuming that the application temperature is 25°C. The differentials of 25°C to -40°C and 90°C to 25°C are both 65°C. The calculation shows a differential expansion of 0.86 mm. As SAFT 2204 is 2.0 mm thick, this value of 0.86 mm falls within the guideline that is used for 3M Acrylic Foam Tapes.
Table 2. Calculation to determine coefficient of thermal expansion (CTE) mismatch (L=length)
CTE · (T1-T2) · L = length change
CTE Length (mm)
T1 (°C) T2 (°C)Length change
(mm) Differential
(mm) Aluminum 2.22E-05 1000 25 -40 1.44
0.86 Glass, plate 9.00E-06 1000 25 -40 0.59
8.2 Long-term OLS Gravitational Forces Acting on the Panel
Solar panels are mounted at an angle with the rails on the back side of the module closest to the ground, as seen in Fig. 1 and Fig. 13. The adhesive area required to withstand long-term static shear forces due to gravity can be calculated, as shown in Equation 4. These calculations determine a tape width of 0.83 cm for the T-block rail example using a long term gravitation design factor of 0.04 kg/cm2.
Fshear = W·cos θ = 20 kg · cos (60°) = 10 kg (4) 10 kg shear force/0.04 kg/cm2 static design stress = 250 cm2 adhesive area 250 cm2 adhesive area/300 cm total rail length = 0. 83 cm of tape width
8.3 Wind Loads
The Emswiler formula, equation 5, is a common method of estimating forces from wind. “P” refers to pressure in lbs/ft2. “V” refers to velocity of the wind in MPH (miles/hour). Using equation 5 with the appropriate conversions a 100 MPH would exert a force of 0.012 kg/cm2 on the module.
Emswiler Formula: P = 0.002496V2 (5)
Figure 13: Representation
of gravitational forces
acting on a PV module
Figure 12: Example of a
T block rail with tape
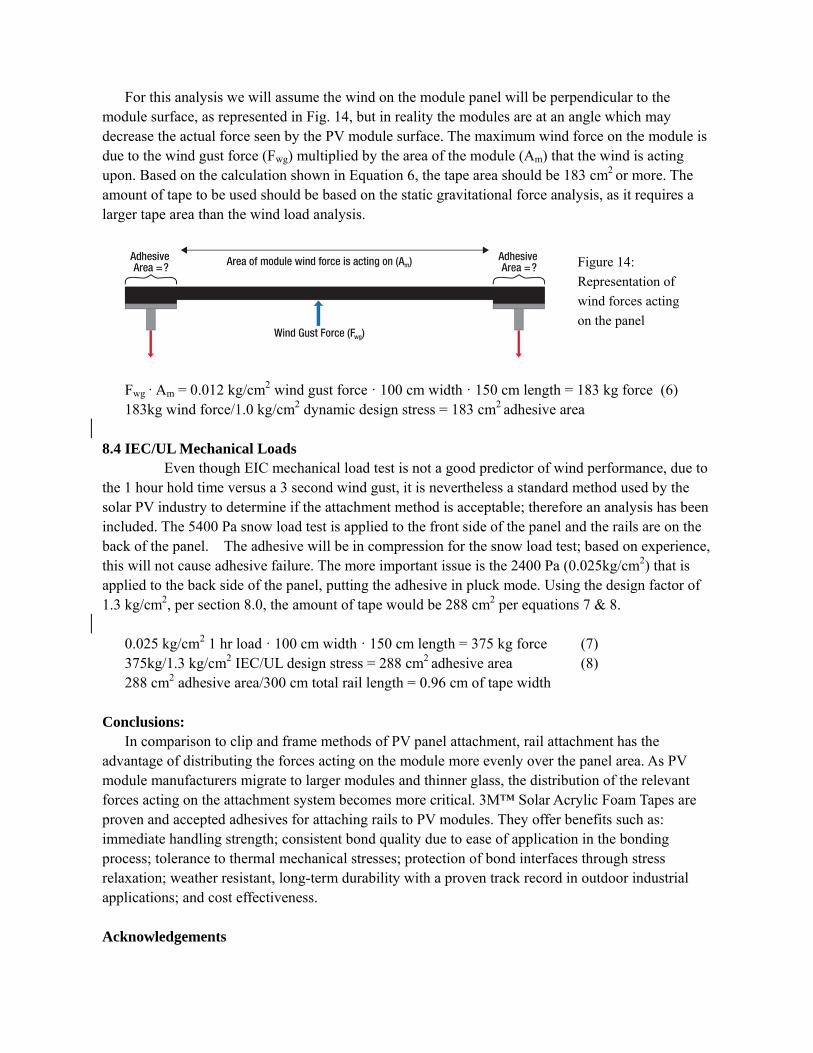
For this analysis we will assume the wind on the module panel will be perpendicular to the
module surface, as represented in Fig. 14, but in reality the modules are at an angle which may decrease the actual force seen by the PV module surface. The maximum wind force on the module is due to the wind gust force (Fwg) multiplied by the area of the module (Am) that the wind is acting upon. Based on the calculation shown in Equation 6, the tape area should be 183 cm2 or more. The amount of tape to be used should be based on the static gravitational force analysis, as it requires a larger tape area than the wind load analysis.
Fwg · Am = 0.012 kg/cm2 wind gust force · 100 cm width · 150 cm length = 183 kg force (6) 183kg wind force/1.0 kg/cm2 dynamic design stress = 183 cm2 adhesive area
8.4 IEC/UL Mechanical Loads Even though EIC mechanical load test is not a good predictor of wind performance, due to the 1 hour hold time versus a 3 second wind gust, it is nevertheless a standard method used by the solar PV industry to determine if the attachment method is acceptable; therefore an analysis has been included. The 5400 Pa snow load test is applied to the front side of the panel and the rails are on the back of the panel. The adhesive will be in compression for the snow load test; based on experience, this will not cause adhesive failure. The more important issue is the 2400 Pa (0.025kg/cm2) that is applied to the back side of the panel, putting the adhesive in pluck mode. Using the design factor of 1.3 kg/cm2, per section 8.0, the amount of tape would be 288 cm2 per equations 7 & 8.
0.025 kg/cm2 1 hr load · 100 cm width · 150 cm length = 375 kg force (7) 375kg/1.3 kg/cm2 IEC/UL design stress = 288 cm2 adhesive area (8) 288 cm2 adhesive area/300 cm total rail length = 0.96 cm of tape width
Conclusions:
In comparison to clip and frame methods of PV panel attachment, rail attachment has the advantage of distributing the forces acting on the module more evenly over the panel area. As PV module manufacturers migrate to larger modules and thinner glass, the distribution of the relevant forces acting on the attachment system becomes more critical. 3M™ Solar Acrylic Foam Tapes are proven and accepted adhesives for attaching rails to PV modules. They offer benefits such as: immediate handling strength; consistent bond quality due to ease of application in the bonding process; tolerance to thermal mechanical stresses; protection of bond interfaces through stress relaxation; weather resistant, long-term durability with a proven track record in outdoor industrial applications; and cost effectiveness. Acknowledgements
Figure 14:
Representation of
wind forces acting
on the panel
The author would like to acknowledge the help of Dylan Cosgrove, Senior Research Engineer, 3M Corporate Research Lab for the modeling work that was presented. References [1] B.W. Townsend, J. Architectural Engineering Vol. 18, No. 3 (Sept. 2012), pp. 214-222 [2] ASCE 7-10 “Minimum design loads for buildings and other structures.” American Society of
Civil Engineers; New York, NY, USA (2010) [3] UL1703 “Standard for Flat-plate Photovoltaic Modules and Panels,” Third Edition.
Underwriters Laboratory, Inc., Northbrook, IL, USA (2002) Underwriters Laboratory Inc, “UL1703 Standard for Flat-plate Photovoltaic Modules and Panels,” Third Edition; Northbrook, IL USA
[4] IEC 61215 “Crystalline Silicon Terrestrial Photovoltaic (PV) Modules – Design Qualification and Type Approval,” International Electrotechnical Commission, Geneva (2005)
[5] IEC I61646 “Thin-Film Terrestrial Photovoltaic (PV) Modules – Design Qualification and Type Approval,” International Electrotechnical Commission, Geneva (2008)
[6] ASTM-D1002-05 (2005) “Standard Test Method for Apparent Shear Strength of Single Lap-Joint Adhesively Bonded Metal Specimens by Tension Loading,” ASTM International, West Conshohocken, PA (2005)
[7] ASTM D3654/D3654N-06 (2011) “Standard Test Methods for shear Adhesion of Pressure Sensitive Tapes”
[8] B.T. Heitman, “Structural Engineering Properties of Acrylic Foam Tapes” MS thesis. Michigan Technological University, Houghton, MI (1990)
[9] T. Kremer, “Useful Design Criteria for Acrylic Foam Tapes in Demanding Industrial Applications,” in: TECH XXVIII. Proceedings of the Pressure Sensitive Tape Council, held Baltimore, MD, May 4–6 (2005)
[10] C. Yin, “Photovoltaic Module Frame Bonding with Foam Tapes,” 7th SNEC International Photovoltaic Power Generation Conference and Exhibition, Shanghai China (2013)
[11] Video on http://www.youtube.com/watch?v=lu1g7Vz99vI [12] Certificate # 10-PPV-00078/01-TIC, TUV Intercert, Group of TUV Saarland, Bonn, Germany [13] F. Reil, “Experimental Testing of PV Modules Under Inhomogeneous Snow Loads,” 27th
European Photovoltaic Solar Energy Conference and Exhibition (2012) [14] Evaluation of 3M Solar Acrylic Foam Tapes for Durability, 3M Technical Bulletin (3M
Company, St. Paul, MN) (2011) [15] 3M VHB Structural Glazing Tape Tech Guide. (3M Company, St. Paul, MN) (2010)


![Superior adhesive performance acrylic foam Double-coated adhesive tape HYPERJOINT ... · 2021. 4. 12. · H9004 [Tape thickness:0.4mm] H9008 [Tape thickness:0.8mm] H9012 [Tape](https://img.pdfslide.net/doc/110x75/612dd5e11ecc515869426f9b/superior-adhesive-performance-acrylic-foam-double-coated-adhesive-tape-hyperjoint.jpg)