Embed Size (px)
Citation preview
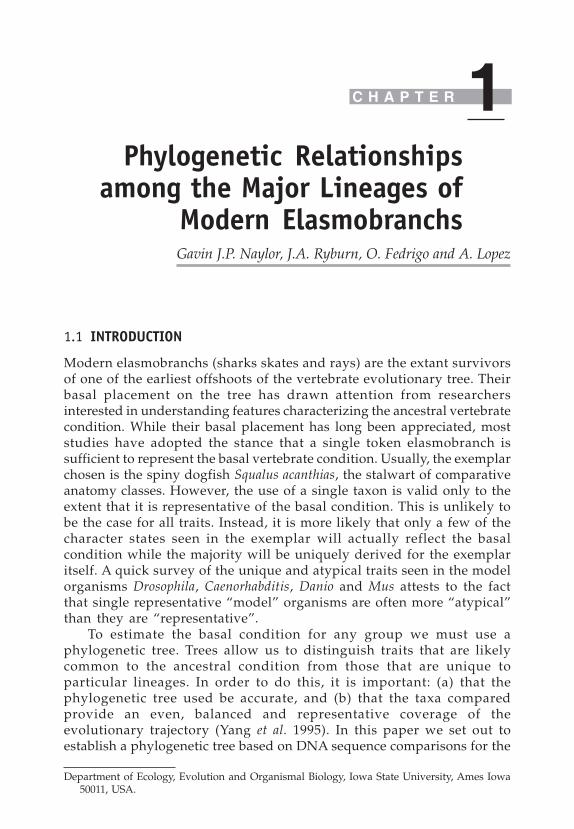
1.1 INTRODUCTION
Modern elasmobranchs (sharks skates and rays) are the extant survivorsof one of the earliest offshoots of the vertebrate evolutionary tree. Theirbasal placement on the tree has drawn attention from researchersinterested in understanding features characterizing the ancestral vertebratecondition. While their basal placement has long been appreciated, moststudies have adopted the stance that a single token elasmobranch issufficient to represent the basal vertebrate condition. Usually, the exemplarchosen is the spiny dogfish Squalus acanthias, the stalwart of comparativeanatomy classes. However, the use of a single taxon is valid only to theextent that it is representative of the basal condition. This is unlikely tobe the case for all traits. Instead, it is more likely that only a few of thecharacter states seen in the exemplar will actually reflect the basalcondition while the majority will be uniquely derived for the exemplaritself. A quick survey of the unique and atypical traits seen in the modelorganisms Drosophila, Caenorhabditis, Danio and Mus attests to the factthat single representative “model” organisms are often more “atypical”than they are “representative”.
To estimate the basal condition for any group we must use aphylogenetic tree. Trees allow us to distinguish traits that are likelycommon to the ancestral condition from those that are unique toparticular lineages. In order to do this, it is important: (a) that thephylogenetic tree used be accurate, and (b) that the taxa comparedprovide an even, balanced and representative coverage of theevolutionary trajectory (Yang et al. 1995). In this paper we set out toestablish a phylogenetic tree based on DNA sequence comparisons for the
C H A P T E R 1Phylogenetic Relationships
among the Major Lineages ofModern ElasmobranchsGavin J.P. Naylor, J.A. Ryburn, O. Fedrigo and A. Lopez
Department of Ecology, Evolution and Organismal Biology, Iowa State University, Ames Iowa50011, USA.
� ����������� �����������������������������������
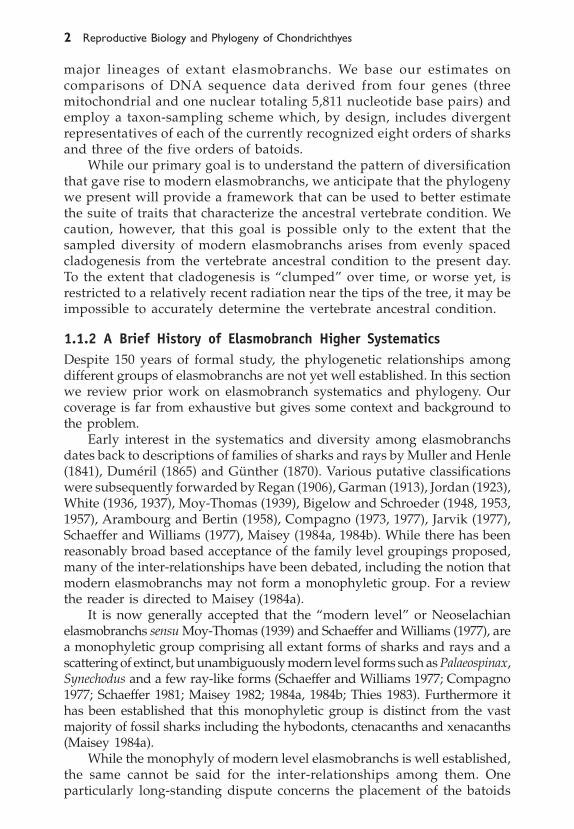
major lineages of extant elasmobranchs. We base our estimates oncomparisons of DNA sequence data derived from four genes (threemitochondrial and one nuclear totaling 5,811 nucleotide base pairs) andemploy a taxon-sampling scheme which, by design, includes divergentrepresentatives of each of the currently recognized eight orders of sharksand three of the five orders of batoids.
While our primary goal is to understand the pattern of diversificationthat gave rise to modern elasmobranchs, we anticipate that the phylogenywe present will provide a framework that can be used to better estimatethe suite of traits that characterize the ancestral vertebrate condition. Wecaution, however, that this goal is possible only to the extent that thesampled diversity of modern elasmobranchs arises from evenly spacedcladogenesis from the vertebrate ancestral condition to the present day.To the extent that cladogenesis is “clumped” over time, or worse yet, isrestricted to a relatively recent radiation near the tips of the tree, it may beimpossible to accurately determine the vertebrate ancestral condition.
1.1.2 A Brief History of Elasmobranch Higher SystematicsDespite 150 years of formal study, the phylogenetic relationships amongdifferent groups of elasmobranchs are not yet well established. In this sectionwe review prior work on elasmobranch systematics and phylogeny. Ourcoverage is far from exhaustive but gives some context and background tothe problem.
Early interest in the systematics and diversity among elasmobranchsdates back to descriptions of families of sharks and rays by Muller and Henle(1841), Duméril (1865) and Günther (1870). Various putative classificationswere subsequently forwarded by Regan (1906), Garman (1913), Jordan (1923),White (1936, 1937), Moy-Thomas (1939), Bigelow and Schroeder (1948, 1953,1957), Arambourg and Bertin (1958), Compagno (1973, 1977), Jarvik (1977),Schaeffer and Williams (1977), Maisey (1984a, 1984b). While there has beenreasonably broad based acceptance of the family level groupings proposed,many of the inter-relationships have been debated, including the notion thatmodern elasmobranchs may not form a monophyletic group. For a reviewthe reader is directed to Maisey (1984a).
It is now generally accepted that the “modern level” or Neoselachianelasmobranchs sensu Moy-Thomas (1939) and Schaeffer and Williams (1977), area monophyletic group comprising all extant forms of sharks and rays and ascattering of extinct, but unambiguously modern level forms such as Palaeospinax,Synechodus and a few ray-like forms (Schaeffer and Williams 1977; Compagno1977; Schaeffer 1981; Maisey 1982; 1984a, 1984b; Thies 1983). Furthermore ithas been established that this monophyletic group is distinct from the vastmajority of fossil sharks including the hybodonts, ctenacanths and xenacanths(Maisey 1984a).
While the monophyly of modern level elasmobranchs is well established,the same cannot be said for the inter-relationships among them. Oneparticularly long-standing dispute concerns the placement of the batoids
�������������������������������������������������������������������� �
(skates and rays) within modern elasmobranchs. The traditional view placesthe batoids as the sister group to all recent sharks (Bigelow and Schroeder1948, 1953, 1957). However recent cladistic analyses of morphological datahave suggested that batoids may be a highly derived group nested withinsharks (Shirai 1992). Another controversy concerns whether or not the foursuperordinal groupings forwarded by Compagno (1977) represent validmonophyletic groupings of taxa. The four superorders are the Galeomorphii(comprising the Carcharhiniformes, Lamniformes, Orectolobiformes andHeterodontiformes), the Squalomorphii (Squaliformes, Hexanchiformes andPristiophoriformes), the Squatinomorphii (Squatina) and the Rajomorphii(comprising all skates and rays). Maisey suggested a modification to thisarrangement and proposed that Compagno’s squalomorphii be combinedwith the squatinomorphii to form what he termed the “Orbitostylic group”of sharks, a grouping that Maisey based on the presence of a distinctivearticulation between the orbital process of the palatoquadrate and the braincase close to the interorbital wall.
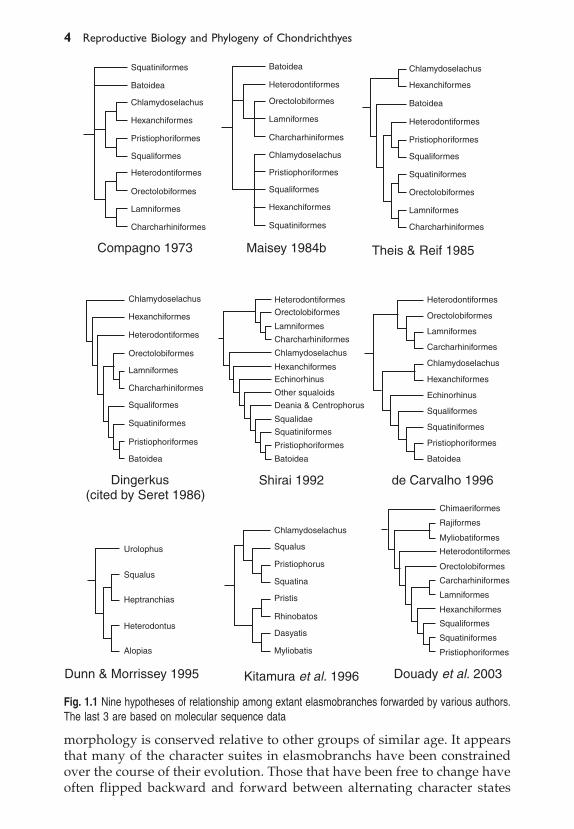
Shirai (1992) published a comprehensive anatomical survey and rigorouscladistic analysis based on skeletal and myological variation of 46 genera ofelamobranchs. While he focused on variation within squaloids (sensuCompagno 1984) he also included several batoid taxa and representatives ofall the major orders of extant elasmobranchs. Shirai concluded from hisanalysis that the batoids were nested deeply within a superordinal group hetermed “Squalea” comprising Chlamydoselachus, hexanchoids, “squaloids”,Squatina and pristiophorids. Within the Squalea he proposed that squaloidsconstituted a paraphyletic group comprising several sequential sister taxa toa monophyletic hypnosqualean group containing Squatina, pristiophorids andall batoids. In 1996 Shirai expanded his morphological survey to include agreater diversity of taxa. This more expanded survey corroborated theconclusions presented in his 1992 work. In 1996, in reviewing Shirai’s work,de Carvalho questioned the independence of some of Shirai’s characters butendorsed the major components of Shirai’s phylogenetic arrangement. Thephylogenetic hypotheses of de Carvalho and Shirai differ in their treatmentof Hexanchiformes and Squaliformes; de Carvalho (1996) suggests thatChlamydoselachus, Notorhynchus, Hexanchus and Heptranchias form amonophyletic group. Shirai, by contrast suggests that Chlamydoselachus is thesister taxon to a clade comprising the remaining hexanchoids and hishypnosqualean group (squaloids, Squatiniformes, Pristiophoriformes andbatoids). Furthermore, de Carvalho suggests that Squaliformes aremonophyletic when Echinorhinus is excluded whereas Shirai’s scheme hasmore extensive paraphyly within squaliformes. We present trees for competinghypotheses forwarded by various authors in Fig. 1.1.
If one thing stands out from the morphologically based systematic workon extant elasmobranchs it is the extent of character homoplasy (de Carvalho1996). Indeed it is the homoplasy in conjunction with the difficulties inasserting homology across widely varying structures that has led to much ofthe current phylogenetic uncertainty. Sharks are an ancient group whose
� ����������� �����������������������������������
morphology is conserved relative to other groups of similar age. It appearsthat many of the character suites in elasmobranchs have been constrainedover the course of their evolution. Those that have been free to change haveoften flipped backward and forward between alternating character states
Fig. 1.1 Nine hypotheses of relationship among extant elasmobranches forwarded by various authors.The last 3 are based on molecular sequence data
�������������������������������������������������������������������� �
over the course of their evolution. Such tight constraints have seeminglyled to character state distributions that are highly homoplasious.
Given the homoplasy and the inherently ambiguous nature of the phylo-genetic signal in the morphological data several researchers have sought toinvestigate the problems of elasmobranch phylogeny with molecular sequencecomparisons. Dunn and Morrissey (1995) used a 303 bp fragment of 12s rRNAfor five representative elasmobranch taxa (Squalus, Heptranchias, Heterodontus,Alopias and Urolophus). Kitamura et al. (1996) used 732bp nucleotide sites ofthe mitochondrial gene cytB for eight taxa (Squalus, Squatina, Rhinobatos,Pristis, Pristiophorus, Myliobatis, Dasyatis and Chlamydoselachus) in conjunc-tion with three distant outgroups (carp, sturgeon and lamprey) taken fromGen Bank. Douady et al. (2003) used a 2.4 kb segment of mitochondrial DNAcomprising predominantly 12s and 16s rRNA for 19 elasmobranch taxa witha taxon sampling scheme weighted toward lamniform and carcharhiniformtaxa (comprising nine out of the 19 taxa).
It is now widely appreciated that different genes can yield differentphylogenies (Kim 1996; Naylor and Brown 1998) and that taxon samplingcan have a strong effect on phylogenetic inference (Hillis 1996; Kim 1996;Rannala et al. 1998; Graybeal 1998; Poe 1998). Given this, we set out to (a)sequence four different protein-coding genes from representative taxa fromdiverse lineages within each of the putatively monophyletic orders of sharksand (b) to explore the variation in phylogenetic signal among genes.
We had four specific goals:(1) To evaluate the molecular evidence for elasmobranch phylogeny based
on a balanced taxon-sampling scheme across extant orders of sharks andrays using multiple genes.
(2) To assess the degree of phylogenetic signal concordance between thenuclear and mitochondrial genes.
(3) To explore the effects, if any, of three factors known to compromisephylogenetic signal in sequence data (a) saturation due to multiple hits(b) non stationarity in base composition and (c) variation in codon usagebias among taxa.
(4) To evaluate the fit of morphological hypotheses proposed to date to thehypotheses yielded by the different molecular data sets.
1.2 MATERIALS AND METHODS
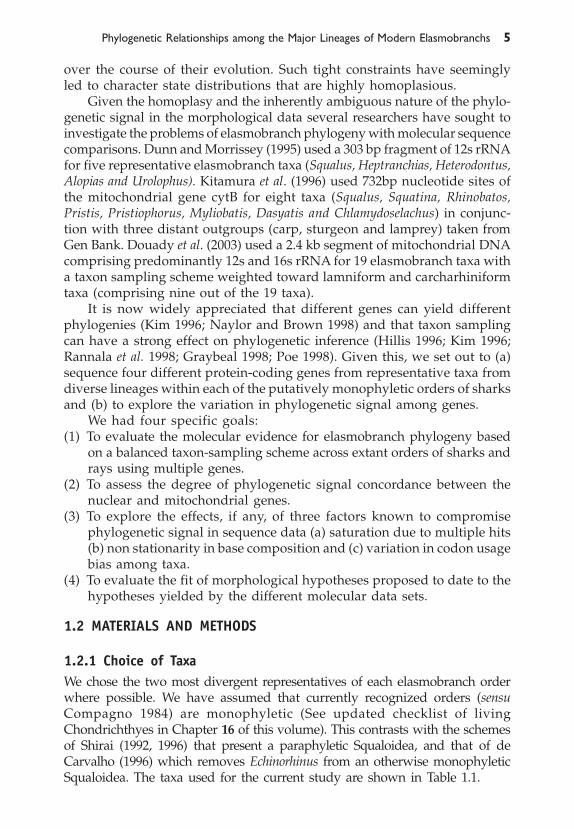
1.2.1 Choice of TaxaWe chose the two most divergent representatives of each elasmobranch orderwhere possible. We have assumed that currently recognized orders (sensuCompagno 1984) are monophyletic (See updated checklist of livingChondrichthyes in Chapter 16 of this volume). This contrasts with the schemesof Shirai (1992, 1996) that present a paraphyletic Squaloidea, and that of deCarvalho (1996) which removes Echinorhinus from an otherwise monophyleticSqualoidea. The taxa used for the current study are shown in Table 1.1.
� ����������� �����������������������������������
Tabl
e 1.
1. T
axa
used
to
repr
esen
t el
asm
obra
nch
dive
rsity
in t
he c
urre
nt s
tudy
. Sa
mpl
es w
ere
chos
en t
o re
pres
ent
dist
ant
rela
tives
with
in e
ach
orde
r. Th
e ID
colu
mn
corr
espo
nds
to th
e as
sign
men
ts in
tiss
ue d
ata
base
of t
he s
enio
r au
thor
.
Ord
erFa
mily
Rep
rese
ntat
ive
I.D.
Loca
lity
Col
lect
or
Car
char
hini
form
esC
arch
arhi
nida
eC
arch
arhi
nus
limba
tus
1340
Kota
Kin
abal
u, M
alay
sia
Rac
hel C
avan
agh
Scyl
iorh
inid
aeAp
ristu
rus
mac
rorh
ynch
us10
15Ta
hsi,T
aiw
anG
avin
Nay
lor
Het
erod
ontif
orm
esH
eter
odon
tidae
Het
erod
ontu
s fra
ncis
ci11
10Ba
ja C
alif,
Mex
ico
Jani
ne C
aira
Hex
anch
iform
esC
hlam
ydos
elac
hida
eC
hlam
ydos
elac
hus
angu
ineu
s14
81N
orth
of
Scot
land
Pam
ela
McG
arr
Hex
anch
idae
Hep
tranc
hias
per
lo97
7Ta
hsi,
Taiw
anG
avin
Nay
lor
Lam
nifo
rmes
Odo
ntas
pidi
dae
Odo
ntas
pis
fero
x10
85Sa
o M
igue
l Isl
and,
Azo
res
José
Aze
vedo
Mits
ukur
inid
aeM
itsuk
urin
a ow
ston
i10
57Ta
sman
ia,
Aust
ralia
John
Ste
vens
Myl
ioba
tifor
mes
Myl
ioba
tidae
Aeto
batu
s na
rinar
i16
02D
arw
in,
Aust
ralia
Gav
in N
aylo
rD
asya
tidae
Das
yatis
ann
onat
a15
88Th
aila
ndJa
nine
Cai
ra
Ore
ctol
obifo
rmes
Ore
ctol
obid
aeO
rect
olob
us o
rnat
us14
91So
uth
Wes
t Au
stra
liaC
olin
Sim
pfen
dorfe
rSt
egos
tom
atid
aeSt
egos
tom
a fa
scia
tum
1295
Kota
Bel
ud,
Mal
aysi
aR
ache
l Cav
anag
h
Pris
tifor
mes
Pris
tidae
Pris
tis c
lava
ta16
10D
arw
in,
Aust
ralia
Gav
in N
aylo
r
Pris
tioph
orifo
rmes
Pris
tioph
orid
aePr
istio
phor
us j
apon
icus
1049
Japa
nKa
zuna
ri Ya
no
Raj
iform
esR
ajid
aeR
aja
rhin
a16
15G
ulf
of A
lask
a, U
SAG
aine
s Ty
ler
Squa
lifor
mes
Oxy
notid
aeO
xyno
tus
para
doxu
s18
50W
est
Coa
st S
cotla
ndM
aria
nne
Du
Buit
Squa
lidae
Squa
lus
acan
thia
s91
9O
cean
City
, Md,
USA
Gav
in N
aylo
r
Squa
tinifo
rmes
Squa
tinid
aeSq
uatin
a te
rgoc
ella
toid
es10
05Ta
hsi,
Taiw
anG
avin
Nay
lor
Chi
mae
rifor
mes
Chi
mae
ridae
Chi
mae
ra p
hant
asm
a97
1Ta
hsi,
Taiw
anG
avin
Nay
lor
�������������������������������������������������������������������� �
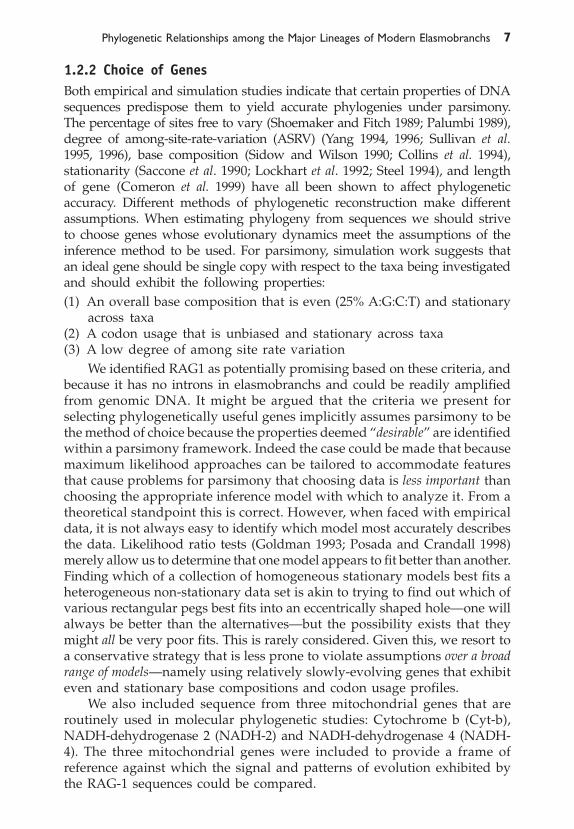
1.2.2 Choice of GenesBoth empirical and simulation studies indicate that certain properties of DNAsequences predispose them to yield accurate phylogenies under parsimony.The percentage of sites free to vary (Shoemaker and Fitch 1989; Palumbi 1989),degree of among-site-rate-variation (ASRV) (Yang 1994, 1996; Sullivan et al.1995, 1996), base composition (Sidow and Wilson 1990; Collins et al. 1994),stationarity (Saccone et al. 1990; Lockhart et al. 1992; Steel 1994), and lengthof gene (Comeron et al. 1999) have all been shown to affect phylogeneticaccuracy. Different methods of phylogenetic reconstruction make differentassumptions. When estimating phylogeny from sequences we should striveto choose genes whose evolutionary dynamics meet the assumptions of theinference method to be used. For parsimony, simulation work suggests thatan ideal gene should be single copy with respect to the taxa being investigatedand should exhibit the following properties:(1) An overall base composition that is even (25% A:G:C:T) and stationary
across taxa(2) A codon usage that is unbiased and stationary across taxa(3) A low degree of among site rate variation
We identified RAG1 as potentially promising based on these criteria, andbecause it has no introns in elasmobranchs and could be readily amplifiedfrom genomic DNA. It might be argued that the criteria we present forselecting phylogenetically useful genes implicitly assumes parsimony to bethe method of choice because the properties deemed “desirable” are identifiedwithin a parsimony framework. Indeed the case could be made that becausemaximum likelihood approaches can be tailored to accommodate featuresthat cause problems for parsimony that choosing data is less important thanchoosing the appropriate inference model with which to analyze it. From atheoretical standpoint this is correct. However, when faced with empiricaldata, it is not always easy to identify which model most accurately describesthe data. Likelihood ratio tests (Goldman 1993; Posada and Crandall 1998)merely allow us to determine that one model appears to fit better than another.Finding which of a collection of homogeneous stationary models best fits aheterogeneous non-stationary data set is akin to trying to find out which ofvarious rectangular pegs best fits into an eccentrically shaped hole—one willalways be better than the alternatives—but the possibility exists that theymight all be very poor fits. This is rarely considered. Given this, we resort toa conservative strategy that is less prone to violate assumptions over a broadrange of models—namely using relatively slowly-evolving genes that exhibiteven and stationary base compositions and codon usage profiles.
We also included sequence from three mitochondrial genes that areroutinely used in molecular phylogenetic studies: Cytochrome b (Cyt-b),NADH-dehydrogenase 2 (NADH-2) and NADH-dehydrogenase 4 (NADH-4). The three mitochondrial genes were included to provide a frame ofreference against which the signal and patterns of evolution exhibited bythe RAG-1 sequences could be compared.
� ����������� �����������������������������������
1.2.3 Laboratory ProtocolsThe DNA sequences reported here were obtained from PCR products fromgenomic DNA preparations. Genomic DNA’s were extracted with the HighPure PCR Template Preparation Kit (Boehringer-Manheim) following themanufacturer’s recommendations. The isolated genomic DNA was dilutedten-fold and the dilutions were used as PCR templates without quantitation
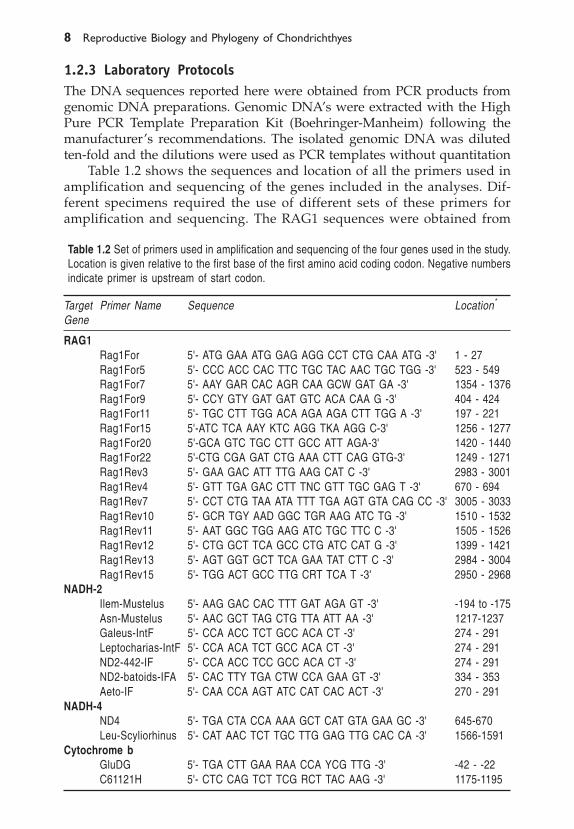
Table 1.2 shows the sequences and location of all the primers used inamplification and sequencing of the genes included in the analyses. Dif-ferent specimens required the use of different sets of these primers foramplification and sequencing. The RAG1 sequences were obtained from
Table 1.2 Set of primers used in amplification and sequencing of the four genes used in the study.Location is given relative to the first base of the first amino acid coding codon. Negative numbersindicate primer is upstream of start codon.
Target Primer Name Sequence Location*
Gene
RAG1Rag1For 5'- ATG GAA ATG GAG AGG CCT CTG CAA ATG -3' 1 - 27Rag1For5 5'- CCC ACC CAC TTC TGC TAC AAC TGC TGG -3' 523 - 549Rag1For7 5'- AAY GAR CAC AGR CAA GCW GAT GA -3' 1354 - 1376Rag1For9 5'- CCY GTY GAT GAT GTC ACA CAA G -3' 404 - 424Rag1For11 5'- TGC CTT TGG ACA AGA AGA CTT TGG A -3' 197 - 221Rag1For15 5'-ATC TCA AAY KTC AGG TKA AGG C-3' 1256 - 1277Rag1For20 5'-GCA GTC TGC CTT GCC ATT AGA-3' 1420 - 1440Rag1For22 5'-CTG CGA GAT CTG AAA CTT CAG GTG-3' 1249 - 1271Rag1Rev3 5'- GAA GAC ATT TTG AAG CAT C -3' 2983 - 3001Rag1Rev4 5'- GTT TGA GAC CTT TNC GTT TGC GAG T -3' 670 - 694Rag1Rev7 5'- CCT CTG TAA ATA TTT TGA AGT GTA CAG CC -3' 3005 - 3033Rag1Rev10 5'- GCR TGY AAD GGC TGR AAG ATC TG -3' 1510 - 1532Rag1Rev11 5'- AAT GGC TGG AAG ATC TGC TTC C -3' 1505 - 1526Rag1Rev12 5'- CTG GCT TCA GCC CTG ATC CAT G -3' 1399 - 1421Rag1Rev13 5'- AGT GGT GCT TCA GAA TAT CTT C -3' 2984 - 3004Rag1Rev15 5'- TGG ACT GCC TTG CRT TCA T -3' 2950 - 2968
NADH-2Ilem-Mustelus 5'- AAG GAC CAC TTT GAT AGA GT -3' -194 to -175Asn-Mustelus 5'- AAC GCT TAG CTG TTA ATT AA -3' 1217-1237Galeus-IntF 5'- CCA ACC TCT GCC ACA CT -3' 274 - 291Leptocharias-IntF 5'- CCA ACA TCT GCC ACA CT -3' 274 - 291ND2-442-IF 5'- CCA ACC TCC GCC ACA CT -3' 274 - 291ND2-batoids-IFA 5'- CAC TTY TGA CTW CCA GAA GT -3' 334 - 353Aeto-IF 5'- CAA CCA AGT ATC CAT CAC ACT -3' 270 - 291
NADH-4ND4 5'- TGA CTA CCA AAA GCT CAT GTA GAA GC -3' 645-670Leu-Scyliorhinus 5'- CAT AAC TCT TGC TTG GAG TTG CAC CA -3' 1566-1591
Cytochrome bGluDG 5'- TGA CTT GAA RAA CCA YCG TTG -3' -42 - -22C61121H 5'- CTC CAG TCT TCG RCT TAC AAG -3' 1175-1195
�������������������������������������������������������������������� �
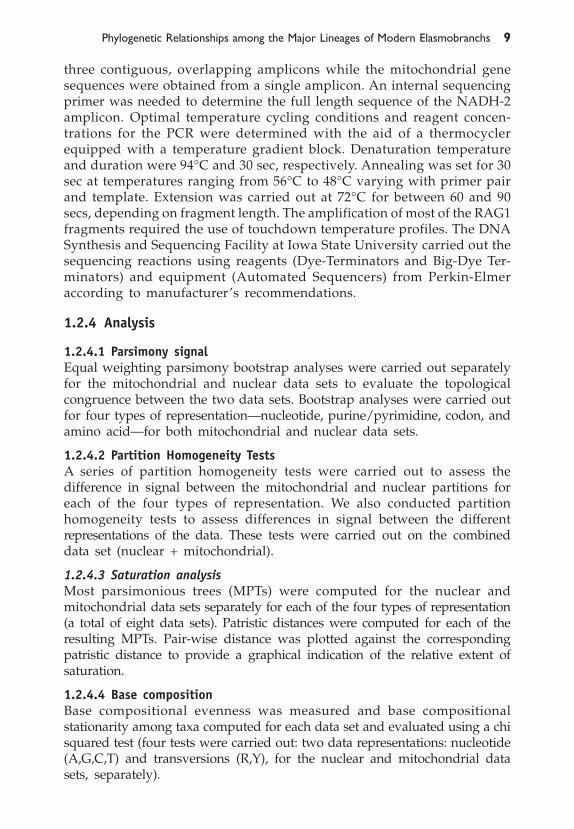
three contiguous, overlapping amplicons while the mitochondrial genesequences were obtained from a single amplicon. An internal sequencingprimer was needed to determine the full length sequence of the NADH-2amplicon. Optimal temperature cycling conditions and reagent concen-trations for the PCR were determined with the aid of a thermocyclerequipped with a temperature gradient block. Denaturation temperatureand duration were 94°C and 30 sec, respectively. Annealing was set for 30sec at temperatures ranging from 56°C to 48°C varying with primer pairand template. Extension was carried out at 72°C for between 60 and 90secs, depending on fragment length. The amplification of most of the RAG1fragments required the use of touchdown temperature profiles. The DNASynthesis and Sequencing Facility at Iowa State University carried out thesequencing reactions using reagents (Dye-Terminators and Big-Dye Ter-minators) and equipment (Automated Sequencers) from Perkin-Elmeraccording to manufacturer’s recommendations.
1.2.4 Analysis
1.2.4.1 Parsimony signalEqual weighting parsimony bootstrap analyses were carried out separatelyfor the mitochondrial and nuclear data sets to evaluate the topologicalcongruence between the two data sets. Bootstrap analyses were carried outfor four types of representation—nucleotide, purine/pyrimidine, codon, andamino acid—for both mitochondrial and nuclear data sets.
1.2.4.2 Partition Homogeneity TestsA series of partition homogeneity tests were carried out to assess thedifference in signal between the mitochondrial and nuclear partitions foreach of the four types of representation. We also conducted partitionhomogeneity tests to assess differences in signal between the differentrepresentations of the data. These tests were carried out on the combineddata set (nuclear + mitochondrial).
1.2.4.3 Saturation analysisMost parsimonious trees (MPTs) were computed for the nuclear andmitochondrial data sets separately for each of the four types of representation(a total of eight data sets). Patristic distances were computed for each of theresulting MPTs. Pair-wise distance was plotted against the correspondingpatristic distance to provide a graphical indication of the relative extent ofsaturation.
1.2.4.4 Base compositionBase compositional evenness was measured and base compositionalstationarity among taxa computed for each data set and evaluated using a chisquared test (four tests were carried out: two data representations: nucleotide(A,G,C,T) and transversions (R,Y), for the nuclear and mitochondrial datasets, separately).
����������� �����������������������������������
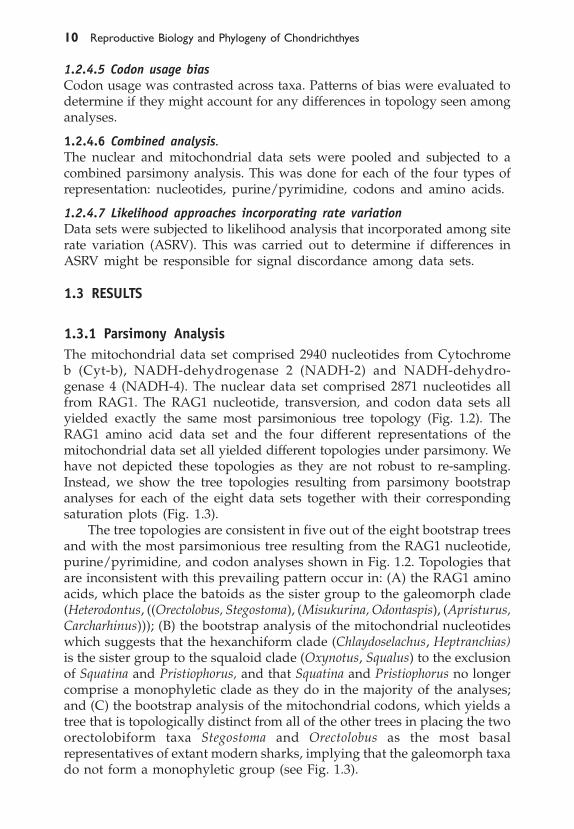
1.2.4.5 Codon usage biasCodon usage was contrasted across taxa. Patterns of bias were evaluated todetermine if they might account for any differences in topology seen amonganalyses.
1.2.4.6 Combined analysis.The nuclear and mitochondrial data sets were pooled and subjected to acombined parsimony analysis. This was done for each of the four types ofrepresentation: nucleotides, purine/pyrimidine, codons and amino acids.
1.2.4.7 Likelihood approaches incorporating rate variationData sets were subjected to likelihood analysis that incorporated among siterate variation (ASRV). This was carried out to determine if differences inASRV might be responsible for signal discordance among data sets.
1.3 RESULTS
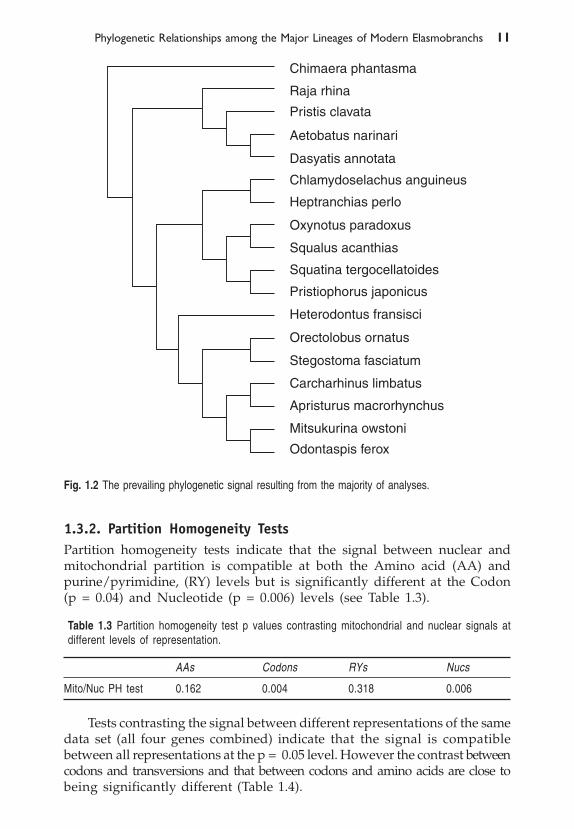
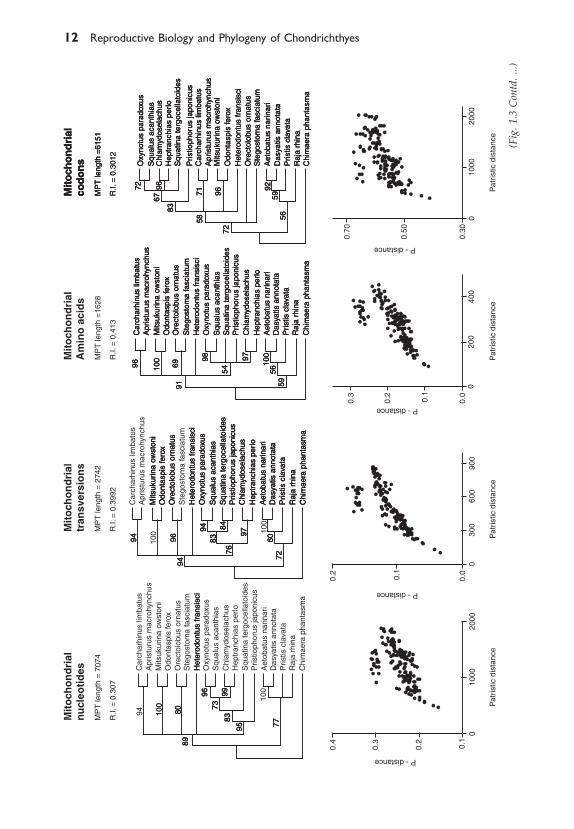
1.3.1 Parsimony AnalysisThe mitochondrial data set comprised 2940 nucleotides from Cytochromeb (Cyt-b), NADH-dehydrogenase 2 (NADH-2) and NADH-dehydro-genase 4 (NADH-4). The nuclear data set comprised 2871 nucleotides allfrom RAG1. The RAG1 nucleotide, transversion, and codon data sets allyielded exactly the same most parsimonious tree topology (Fig. 1.2). TheRAG1 amino acid data set and the four different representations of themitochondrial data set all yielded different topologies under parsimony. Wehave not depicted these topologies as they are not robust to re-sampling.Instead, we show the tree topologies resulting from parsimony bootstrapanalyses for each of the eight data sets together with their correspondingsaturation plots (Fig. 1.3).
The tree topologies are consistent in five out of the eight bootstrap treesand with the most parsimonious tree resulting from the RAG1 nucleotide,purine/pyrimidine, and codon analyses shown in Fig. 1.2. Topologies thatare inconsistent with this prevailing pattern occur in: (A) the RAG1 aminoacids, which place the batoids as the sister group to the galeomorph clade(Heterodontus, ((Orectolobus, Stegostoma), (Misukurina, Odontaspis), (Apristurus,Carcharhinus))); (B) the bootstrap analysis of the mitochondrial nucleotideswhich suggests that the hexanchiform clade (Chlaydoselachus, Heptranchias)is the sister group to the squaloid clade (Oxynotus, Squalus) to the exclusionof Squatina and Pristiophorus, and that Squatina and Pristiophorus no longercomprise a monophyletic clade as they do in the majority of the analyses;and (C) the bootstrap analysis of the mitochondrial codons, which yields atree that is topologically distinct from all of the other trees in placing the twoorectolobiform taxa Stegostoma and Orectolobus as the most basalrepresentatives of extant modern sharks, implying that the galeomorph taxado not form a monophyletic group (see Fig. 1.3).
��������������������������������������������������������������������
1.3.2. Partition Homogeneity TestsPartition homogeneity tests indicate that the signal between nuclear andmitochondrial partition is compatible at both the Amino acid (AA) andpurine/pyrimidine, (RY) levels but is significantly different at the Codon(p = 0.04) and Nucleotide (p = 0.006) levels (see Table 1.3).
Table 1.3 Partition homogeneity test p values contrasting mitochondrial and nuclear signals atdifferent levels of representation.
AAs Codons RYs Nucs
Mito/Nuc PH test 0.162 0.004 0.318 0.006
Tests contrasting the signal between different representations of the samedata set (all four genes combined) indicate that the signal is compatiblebetween all representations at the p = 0.05 level. However the contrast betweencodons and transversions and that between codons and amino acids are close tobeing significantly different (Table 1.4).
Fig. 1.2 The prevailing phylogenetic signal resulting from the majority of analyses.
� ����������� �����������������������������������
(Fig
. 1.3
Con
td. .
..)
�������������������������������������������������������������������� �
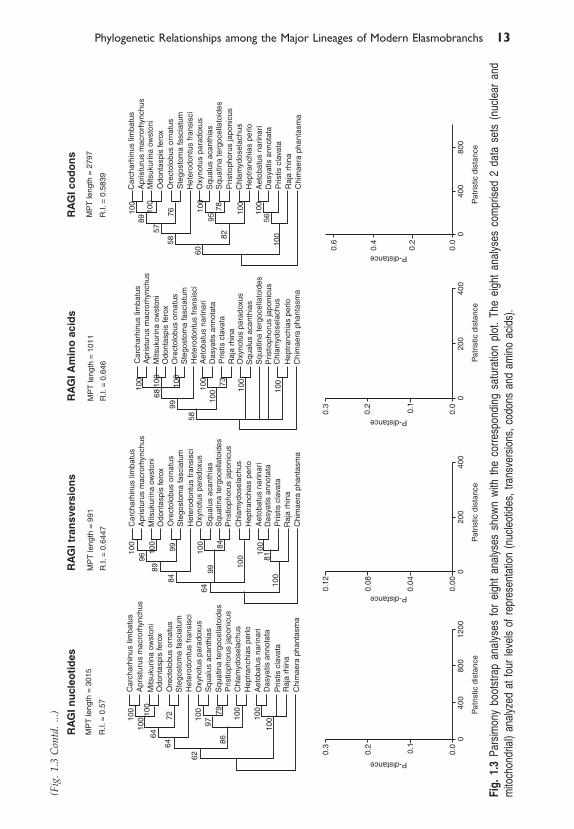
Fig.
1.3
Par
sim
ony
boot
stra
p an
alys
es f
or e
ight
ana
lyse
s sh
own
with
the
cor
resp
ondi
ng s
atur
atio
n pl
ot.
The
eigh
t an
alys
es c
ompr
ised
2 d
ata
sets
(nu
clea
r an
dm
itoch
ondr
ial)
anal
yzed
at f
our
leve
ls o
f rep
rese
ntat
ion
(nuc
leot
ides
, tra
nsve
rsio
ns, c
odon
s an
d am
ino
acid
s).
(Fig
. 1.3
Con
td. .
..)
� ����������� �����������������������������������
1.3.3. Saturation analysesSaturation plots associated with each of the eight data sets (nuclear andmitochondrial for four different representations of the same data) are shownin Fig. 1.3. The two data sets exhibiting the highest degree of saturation,the mitochondrial nucleotide and the mitochondrial codon data sets, alsoyield the most anomalous trees relative to the prevailing signal depicted inFig. 1.2. Not surprisingly, these are the two data sets identified by thepartition homogeneity tests as being most distinct.
1.3.4. Base compositionOverall base compositional stationarity is shown in tables 1.5 (RAG1) and 1.6(mitochondrial genes). Chi squared tests indicate that both the nuclear andthe mitochondrial data sets exhibit statistically significant deviation fromstationarity at the nucleotide level (Table 1.7). Neither showed any suchdeviation at the purine/pyrimidine, level.
Table 1.4 Partition homogeneity p values contrasting different representations of the combinedmitochondrial and nuclear data set.
Nucs | RY Nuc | AA RY | AA Cod | Nuc Cod | RY Cod | AA
PH test 0.68 0.67 0.748 0.51 0.077 0.065
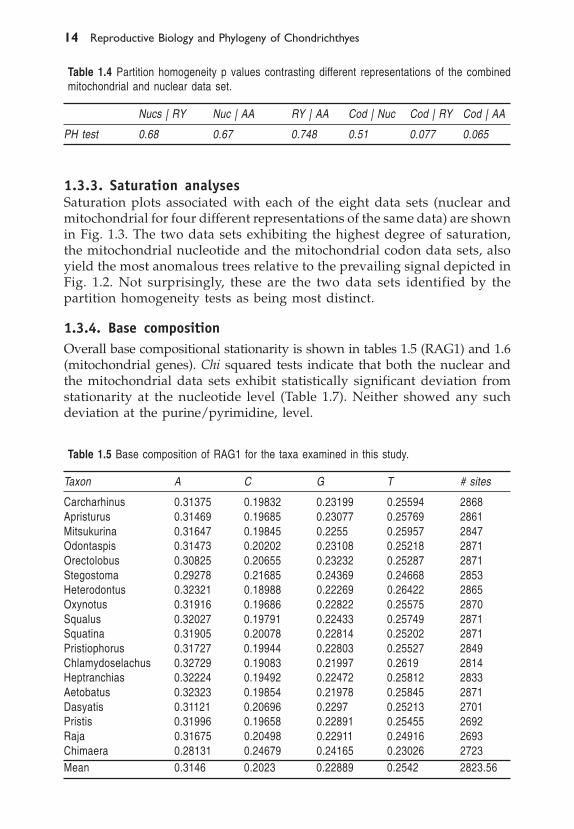
Table 1.5 Base composition of RAG1 for the taxa examined in this study.
Taxon A C G T # sites
Carcharhinus 0.31375 0.19832 0.23199 0.25594 2868Apristurus 0.31469 0.19685 0.23077 0.25769 2861Mitsukurina 0.31647 0.19845 0.2255 0.25957 2847Odontaspis 0.31473 0.20202 0.23108 0.25218 2871Orectolobus 0.30825 0.20655 0.23232 0.25287 2871Stegostoma 0.29278 0.21685 0.24369 0.24668 2853Heterodontus 0.32321 0.18988 0.22269 0.26422 2865Oxynotus 0.31916 0.19686 0.22822 0.25575 2870Squalus 0.32027 0.19791 0.22433 0.25749 2871Squatina 0.31905 0.20078 0.22814 0.25202 2871Pristiophorus 0.31727 0.19944 0.22803 0.25527 2849Chlamydoselachus 0.32729 0.19083 0.21997 0.2619 2814Heptranchias 0.32224 0.19492 0.22472 0.25812 2833Aetobatus 0.32323 0.19854 0.21978 0.25845 2871Dasyatis 0.31121 0.20696 0.2297 0.25213 2701Pristis 0.31996 0.19658 0.22891 0.25455 2692Raja 0.31675 0.20498 0.22911 0.24916 2693Chimaera 0.28131 0.24679 0.24165 0.23026 2723Mean 0.3146 0.2023 0.22889 0.2542 2823.56
�������������������������������������������������������������������� �
1.3.5. Codon UsageThe orectolobiform taxa had a different pattern of codon usage in themitochondrial data set relative to the other taxa. Differences in codon usagewere found to be restricted to the following amino acids (G) Glycine, (I)Isoleucine, (L) Leucine, (N) Asparagine, (P) Proline and (S) Serine.Hypothesizing that this difference in codon usage might be responsible forthe topology resulting from the codon level analysis of the mitochondrialdata, we reassigned codon character states such that each of the amino acidsG, I, L, N, P, S was scored as using the same codon across all taxa. This allowed
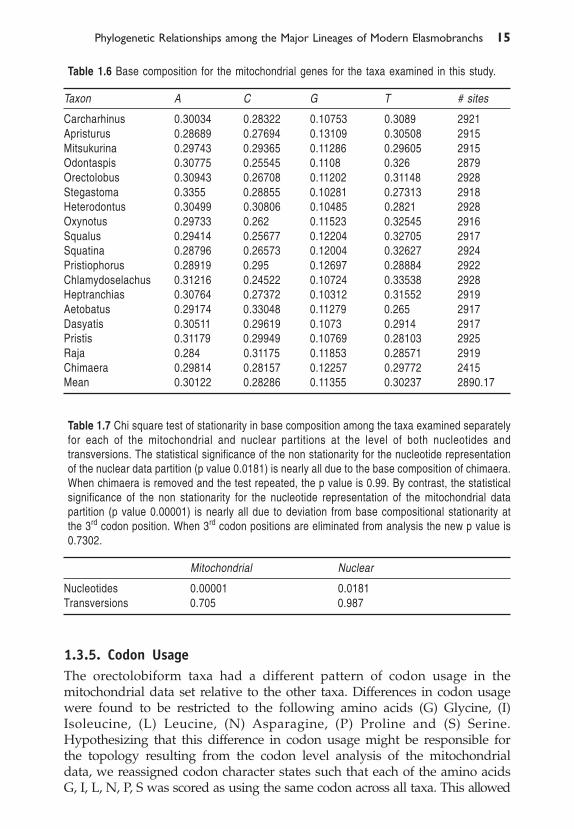
Table 1.6 Base composition for the mitochondrial genes for the taxa examined in this study.
Taxon A C G T # sites
Carcharhinus 0.30034 0.28322 0.10753 0.3089 2921Apristurus 0.28689 0.27694 0.13109 0.30508 2915Mitsukurina 0.29743 0.29365 0.11286 0.29605 2915Odontaspis 0.30775 0.25545 0.1108 0.326 2879Orectolobus 0.30943 0.26708 0.11202 0.31148 2928Stegastoma 0.3355 0.28855 0.10281 0.27313 2918Heterodontus 0.30499 0.30806 0.10485 0.2821 2928Oxynotus 0.29733 0.262 0.11523 0.32545 2916Squalus 0.29414 0.25677 0.12204 0.32705 2917Squatina 0.28796 0.26573 0.12004 0.32627 2924Pristiophorus 0.28919 0.295 0.12697 0.28884 2922Chlamydoselachus 0.31216 0.24522 0.10724 0.33538 2928Heptranchias 0.30764 0.27372 0.10312 0.31552 2919Aetobatus 0.29174 0.33048 0.11279 0.265 2917Dasyatis 0.30511 0.29619 0.1073 0.2914 2917Pristis 0.31179 0.29949 0.10769 0.28103 2925Raja 0.284 0.31175 0.11853 0.28571 2919Chimaera 0.29814 0.28157 0.12257 0.29772 2415Mean 0.30122 0.28286 0.11355 0.30237 2890.17
Table 1.7 Chi square test of stationarity in base composition among the taxa examined separatelyfor each of the mitochondrial and nuclear partitions at the level of both nucleotides andtransversions. The statistical significance of the non stationarity for the nucleotide representationof the nuclear data partition (p value 0.0181) is nearly all due to the base composition of chimaera.When chimaera is removed and the test repeated, the p value is 0.99. By contrast, the statisticalsignificance of the non stationarity for the nucleotide representation of the mitochondrial datapartition (p value 0.00001) is nearly all due to deviation from base compositional stationarity atthe 3rd codon position. When 3rd codon positions are eliminated from analysis the new p value is0.7302.
Mitochondrial Nuclear
Nucleotides 0.00001 0.0181Transversions 0.705 0.987
� ����������� �����������������������������������
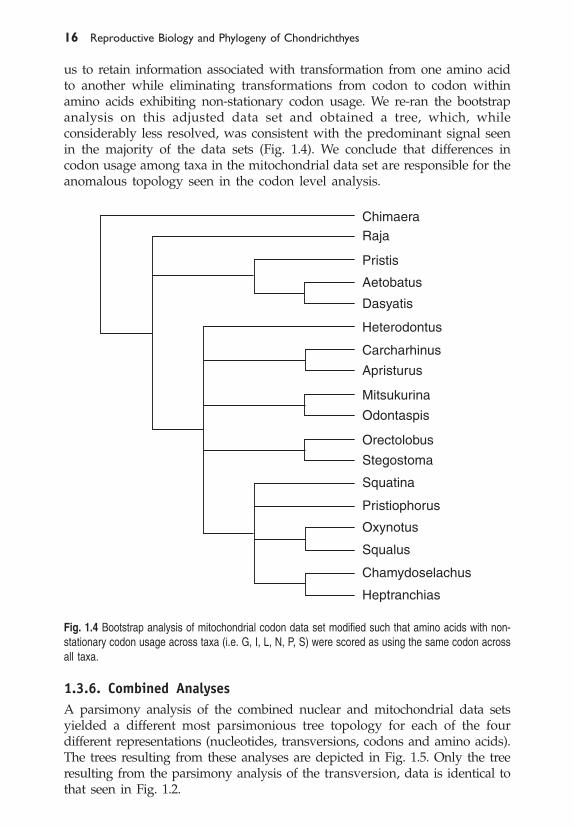
us to retain information associated with transformation from one amino acidto another while eliminating transformations from codon to codon withinamino acids exhibiting non-stationary codon usage. We re-ran the bootstrapanalysis on this adjusted data set and obtained a tree, which, whileconsiderably less resolved, was consistent with the predominant signal seenin the majority of the data sets (Fig. 1.4). We conclude that differences incodon usage among taxa in the mitochondrial data set are responsible for theanomalous topology seen in the codon level analysis.
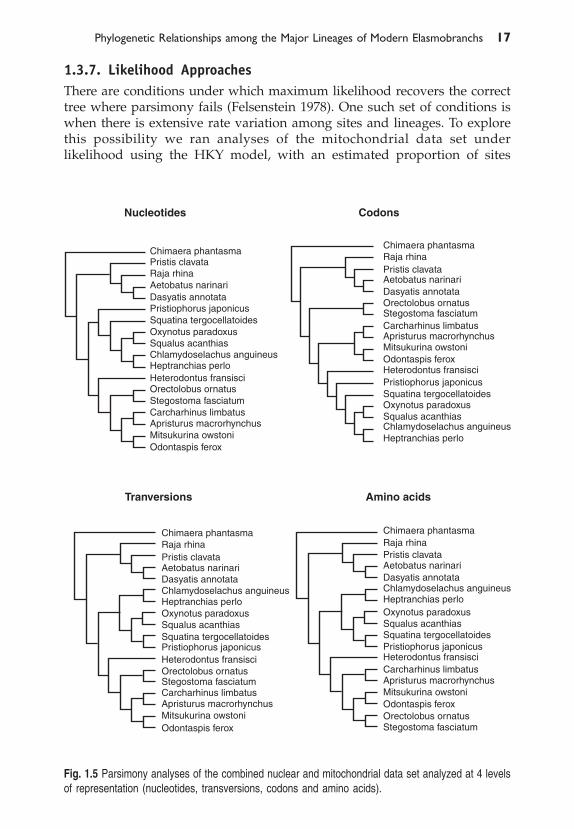
1.3.6. Combined AnalysesA parsimony analysis of the combined nuclear and mitochondrial data setsyielded a different most parsimonious tree topology for each of the fourdifferent representations (nucleotides, transversions, codons and amino acids).The trees resulting from these analyses are depicted in Fig. 1.5. Only the treeresulting from the parsimony analysis of the transversion, data is identical tothat seen in Fig. 1.2.
Fig. 1.4 Bootstrap analysis of mitochondrial codon data set modified such that amino acids with non-stationary codon usage across taxa (i.e. G, I, L, N, P, S) were scored as using the same codon acrossall taxa.
�������������������������������������������������������������������� �
1.3.7. Likelihood ApproachesThere are conditions under which maximum likelihood recovers the correcttree where parsimony fails (Felsenstein 1978). One such set of conditions iswhen there is extensive rate variation among sites and lineages. To explorethis possibility we ran analyses of the mitochondrial data set underlikelihood using the HKY model, with an estimated proportion of sites
Fig. 1.5 Parsimony analyses of the combined nuclear and mitochondrial data set analyzed at 4 levelsof representation (nucleotides, transversions, codons and amino acids).
� ����������� �����������������������������������
assumed to be invariant, and with the rates of the remaining assumed to bedistributed according to a gamma distribution with an alpha value of 0.5.
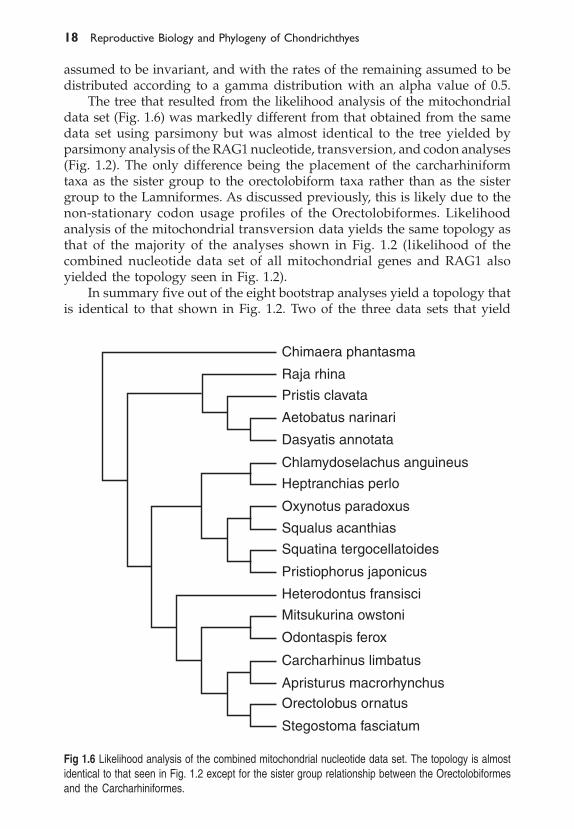
The tree that resulted from the likelihood analysis of the mitochondrialdata set (Fig. 1.6) was markedly different from that obtained from the samedata set using parsimony but was almost identical to the tree yielded byparsimony analysis of the RAG1 nucleotide, transversion, and codon analyses(Fig. 1.2). The only difference being the placement of the carcharhiniformtaxa as the sister group to the orectolobiform taxa rather than as the sistergroup to the Lamniformes. As discussed previously, this is likely due to thenon-stationary codon usage profiles of the Orectolobiformes. Likelihoodanalysis of the mitochondrial transversion data yields the same topology asthat of the majority of the analyses shown in Fig. 1.2 (likelihood of thecombined nucleotide data set of all mitochondrial genes and RAG1 alsoyielded the topology seen in Fig. 1.2).
In summary five out of the eight bootstrap analyses yield a topology thatis identical to that shown in Fig. 1.2. Two of the three data sets that yield
Fig 1.6 Likelihood analysis of the combined mitochondrial nucleotide data set. The topology is almostidentical to that seen in Fig. 1.2 except for the sister group relationship between the Orectolobiformesand the Carcharhiniformes.
�������������������������������������������������������������������� �
different topologies (the mitochondrial nucleotide and codon data sets) exhibitfeatures known to be problematic for phylogenetic inference (saturation inconjunction with non stationary codon usage).
1.4 DISCUSSION
The mitochondrial genes exhibit saturation at the level of nucleotides andcodons. Both saturated data sets yield trees that are distinct from the prevailingsignal reflected in the topology of Fig. 1.2. The degree of saturation in themitochondrial data set is ameliorated when the data are recoded astransversions or amino acids.
By contrast, the RAG1 sequences show little saturation in any of therepresentations and appear well suited to estimating phylogeny for this set oftaxa. However, while RAG1 does not appear saturated in any of the fourrepresentations (nucleotides, transversion, codons and amino acids) aparsimony bootstrap of the RAG1 amino acid data set yielded a tree that wastopologically different from that seen in the majority of analyses in placingbatoids as the sister group to galeomorph sharks. This placement has weak(58%) bootstrap support and requires only two extra steps to fit the data set tothe topology shown in Fig. 1.2. Interestingly, eight characters supported themonophyly of sharks with a retention index of 1.00. One of these (character#148: changing from a Histidine to Tyrosine) was unambiguous over all mostparsimonious reconstructions. By contrast, only one character (#6) supportedthe galeomorph/batoid grouping with a retention index of 1.00 on the mostparsimonious tree. This character change was not unambiguous over allreconstructions. Thus while there are several characters with a high retentionindex that favor the branch depicting shark monophyly, this signal is overturnedby homoplasious changes occurring further toward the tips of the tree. Ananalysis of branch lengths suggests that the inferred sister group relationshipbetween batoids and galeomorph sharks might be an artifact due to long branchattraction. In contrast to the RAG1 results, the amino acid representation ofthe mitochondrial data set yields a tree that is topologically consistent with thesignal seen in the majority of analyses Fig 1.2 However, the codonrepresentation of the same data set yields a topology in which orectolobiformesfall as the sister group to all other sharks. This begs the question “How is itthat the codon representation can appear well behaved in the RAG1 data setbut not in the mitochondrial data set while the amino acid representation showsthe opposite pattern?” The answer may lie in the mapping of codons to aminoacids. In the mitochondrial data set, there is considerable variation in the codonusage patterns among taxa. This variation reflects non stationarity in theevolutionary process and results in a misleading mitochondrial inference atthe codon level. In the RAG1 data set the codon usage patterns are stationaryamong taxa. The anomalous signal resulting from the analysis of the RAG1amino acid data is harder to explain but may be a simple consequence ofstochastic homoplasy. It is worth noting that the anomalous inferencesassociated with both the mitochondrial codon and the RAG1 amino acid datasets exhibit low bootstrap support values (58%).
� ����������� �����������������������������������
1.4.1 Signal heterogeneity across different levels ofrepresentation of the combined mitochondrial andnuclear data set
The fact that combined analyses at the level of both nucleotides and codonsyield topologies that are different from most of the other analyses isunsettling. It underscores concerns voiced in the literature that it may bepoor practice to simply assume that combining data sets will result inaccurate phylogenetic estimates (Barret et al. 1991; de Quieroz 1993). Thefact that combined parsimony analyses yields different solutions for a dataset comprising nearly 6000 base pairs should be a matter for concern.
Rather than pooling data sets and assuming that homoplasy will becomerandomly distributed with respect to the historical signal, it would bepreferable to identify potentially misleading influences from the outset andincorporate them into an explicit evolutionary model. Alternatively onemight choose to remove characters that demonstrably violate the assumptionsof the inference method a priori. In the current study, we recognized thatthere was non-stationarity in mitochondrial codon usage in a subset of aminoacids for a subset of the taxa. When we controlled for this we obtained atopology consistent with that of the nuclear sequence data. We wish to under-score that this is not an endorsement for arbitrarily removing charactersthat do not fit a cherished hypothesis. If characters are to be removed, their removalshould be contingent on their a priori failure to meet an explicit requirement ofthe inference model (such as non stationarity in codon usage across taxa).
1.4.2 Alternative ways of “explaining” anomalouspatterns in the data
We were able to reconcile the mitochondrial codon data set to the treetopology yielded by the nuclear data by accommodating deviation in codonusage for a subset of amino acids. We were also able to reconcile topologicalinconsistencies by representing ASRV as a discrete approximation to agamma distribution in a likelihood framework. The fact that two approaches,each emphasizing different aspects of the data, can reconcile themitochondrial data to a topology consistent with that of the nuclear data begsthe question “Which explanation is correct?” Is it the non-stationarity ofcodon usage bias that is causing the anomalous inference, or is the ratevariation? Or both? Or neither? Clearly there are multiple views of what isrelevant. In our case, we regard non-stationarity in codon usage to be a moresatisfying explanation than the failure to accommodate ASRV simply becauseit has a more proximal connection to the underlying biology. ModellingASRV as a gamma distribution merely provides an efficient means ofimproving the fit between model and data. However, it does not provide uswith any clues as to which of several possible biological forces might beresponsible for shaping the distribution of rates. The observed distributioncould be consistent with a particular set of structural constraints, a particularhistory of functional adaptation, nucleotide mutability or codon usage. By
�������������������������������������������������������������������� �
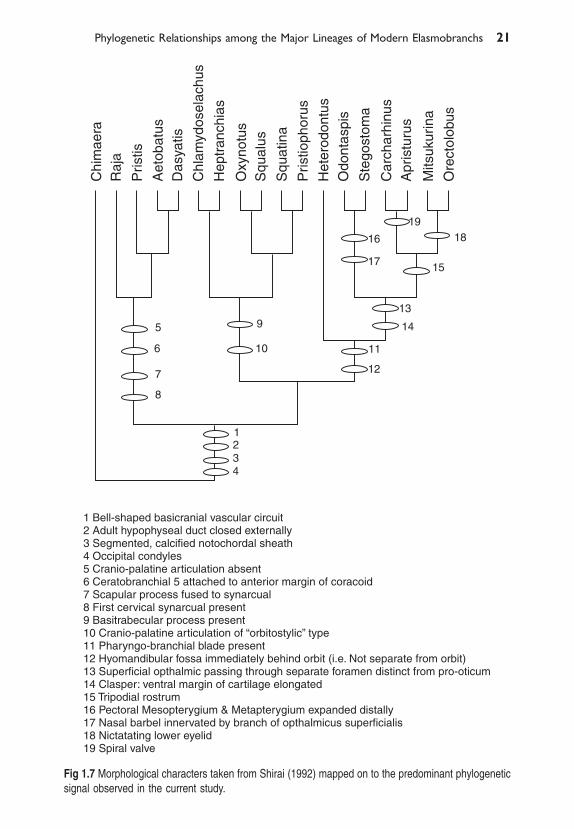
Fig 1.7 Morphological characters taken from Shirai (1992) mapped on to the predominant phylogeneticsignal observed in the current study.
�� ����������� �����������������������������������
contrast, explaining the discrepancy as an outcome of differential patterns ofcodon usage among taxa, provides more than a statistical improvement in fitbetween the model and the data—it narrows down the suite of viableexplanations to a tangible cause for the difference between the mitochondrialand nuclear signals.
1.4.3 Contrasting the Molecular Phylogeny with PreviousHypotheses
Of the morphologically based hypotheses depicted in Fig. 1.1 the topologyforwarded by Maisey (1986) is the most compatible with that suggested bythe molecular data (Fig. 1.2). However, it is also the least resolved andtherefore most predisposed to fit any hypothesis. Maisey’s groupings arebased on the idea that neoselachians fall into 3 monophyletic groups: Firstthose with an orbitostylic jaw suspension (Hexanchiformes, Squaliformes,Pristiophoriformes and Squatiniformes); Second the galeomorphs (Hetero-dontiformes, Orectolobiformes, Lamniformes and Carcharhiniformes; andthird the Batoids (skates and rays). There is considerable molecular support forthis scheme. Within the galeomorph sharks the molecular data stronglysupport the topology suggested by Shirai (1992, 1996) and de Carvalho (1996)(Heterodontiformes, (Orectolobiformes, (Lamniformes, Carcharhiniformes).We mapped morphological character data from Shirai (1996) and Maisey (pers.comm) on to the tree using parsimony. Diagnostic characters whose placementon the tree was unambiguous (i.e. not optimization dependent) are shown inFig. 1.7. Interestingly, while there are several morphological characters thatsupport the tree topology presented, characters that diagnose the monophylyof sharks as distinct from rays are conspicuously absent. If the tree we presentis correct, then the lack of morphological characters that unambiguouslydiagnose sharks as a monophyletic group would go a long way to explain whyShirai (1996) and de Carvalho (1996) obtained the tree topologies they did. Thephylogram of the likelihood tree also provides a possible explanation for thelack of diagnostic characters for the monophyly of sharks. It seems that theearly cladogenetic events that gave rise to the orbitostylic sharks, the batoidsand the galeomorph occurred over a relatively short space of time, asevidenced by the short internodal branch lengths at the base of the inferred treeand the almost simultaneous appearance in the fossil record of representativesof each of the three groups. We conjecture that if batoids are truly the sistergroup to a monophyletic shark clade as suggested by our data, there may nothave been sufficient time between cladogenetic events to fix manymorphological character states in the lineage that would give rise to sharks.
1.5 ACKNOWLEDGEMENTS
We thank John Marchalonis and Sam Schluter for providing us with theRAG1 sequence of Carcharhinus plumbeus from which we were able to designprimers. We thank John Maisey for comments on an earlier version of themanuscript, and Vicente Faria for editorial improvements.
�������������������������������������������������������������������� ��
1.6 LITERATURE CITED
Arambourg, C., and Bertin. L. 1958a. Classe des Chondrichthyens (Chondrichthyes).In P.-P. Grassé (ed.). Traité de Zoologie. Anatomie, Systématique, Biologie, Vol. 13 3:2010-2015, figs. 1410-1411.
Arambourg, C., and Bertin. L. 1958b. Sous-classe des Sélaciens (Selachii). In P.-P.Grassé (ed.). Traité de Zoologie. Anatomie, Systématique, Biologie, Vol.13 3: 2016-2056,figs. 1412-1449.
Barret, M., Donoghue M. J., and Sober E. 1991. Against consensus. SystematicZoology 40: 486-493.
Bigelow, H. B. and Schroeder, W. C. 1948. Sharks. Pp. 59-546. In Tee-Van, J. et al. (eds),Fishes of the Western North Atlantic. Memoir of the Sears Foundation, MarineResearch 1(1). Yale University, New Haven.
Bigelow, H. B. and Schroeder, W. C. 1953. Part 2. Sawfishes, Guitarfishes, Skates andRays; Chimaeroids In: Fishes of the western North Atlantic. Sears Foundation forMarine Research, Yale University, New Haven.
Bigelow, H. B. and Schroeder, W. C. 1957. A study of the sharks of the suborderSqualoidea. Bulletin of the Museum of Comparative Zoology, Harvard 117: 1-150.
de Carvalho, M. R. 1996. Higher-level elasmobranch phylogeny, basal squaleans, andparaphyly. Pp. 35-62. In: M. L. J. Stiassney, L. R. Parenti, and D. Johnson (eds),Interrelationships of fishes. Academic Press, San Diego.
Collins, T. M., Wimberger, P. H. and Naylor, G. J. P. 1994. Compositional bias,character-state bias, and character-state reconstruction using parsimony.Systematic Biology 43(4): 482-496.
Comeron, J. M., Kreitman, M. and Aguadé, M. 1999. Natural selection onsynonymous sites is correlated with gene length and recombination in Drosophila.Genetics 151: 239-249.
Compagno L. J. V. 1973. Interrelationship of living elasmobranchs. Pp. 15-61. In: P.H.Greenwood et al. (eds), Interrelationships of fishes. Academic Press, New York.
Compagno L. J. V. 1977 Phyletic relationships of living sharks and rays. AmericanZoologist 17: 303-322.
Compagno, L. J. V., 1984. Sharks of the world. An annotated and illustrated catalogue ofsharks species known to date. FAO Fisheries Synopsis Nº 125, 4 (1 and 2): 655 pp.
Douady, C. J., Dosay, M., Shivji, M. S. and Stanhope, M. J. 2003. Molecularphylogenetic evidence refuting the hypothesis of Batoidea (rays and skates) asderived sharks. Molecular Phylogeny and Evolution 26: 215-221.
Duméril, A. H. A. 1865. Histoire naturelle des poissons ou ichthyologie générale. Tomepremier, Élasmobranches, Plagiostomes et Holocéphales ou Chimères. pp. 1-720.
Dunn, K. A. and Morrissey J. F. 1995. Molecular phylogeny of elasmobranchs. Copeia1995: 526-531.
Felsenstein, J. 1978. Cases in which parsimony or compatibility methods will bepositively misleading. Systematic Zoology 27: 401-416.
Garman, S. 1913. The Plagiostomia (Sharks, skates and rays). Memoirs of theMuseum of Comparative Zoology XXXVI i-xiv+1-515 pages, 77 plates.
Goldman, N. 1993. Statistical tests of models of DNA substitution. Journal ofMolecular Evolution 36: 182-198.
Graybeal A. 1998. Is it better to add taxa or characters to a difficult phylogeneticproblem? Systematic Biology 47(1): 9-17.
Günther, A. C. 1870. Catalogue of the fishes of the British Museum. Vol. viii, pp. i-xxv, 1.Hillis, D. M. 1996. Inferring complex phylogenies. Nature 383: 130-131.
�� ����������� �����������������������������������
Jarvik, E. 1977. The systematic position of acanthodian fishes. Pp. 199-225. In: S. M.Andrews, R. S. Miles and A. D. Walker (eds), Problems in vertebrate evolution.Academic Press, London.
Jordan, D. S. 1923. A classification of fishes, including families, and genera as far asknown. Stanford University Publications University Series in Biological SciencesIII (2) 79-243 + i-x.
Kim, J. 1996. General inconsistency conditions for maximum parsimony: Effects ofbranch lengths and increasing numbers of taxa. Systematic Biology 45: 363–374.
Kitamura, T., Takemura, A., Watabe, S., Taniuchi, T. and Shimizu, M. 1996. Molecularphylogeny of the sharks and rays of superorder squalea based on mitochondrialCytochrome b gene. Fisheries Science 62(3): 340-343.
Lockhart, P. J., Howe, C. J., Bryant, D. A., Beanland, T. J. and Larkum, A. W. D. 1992.Substitutional bias confound inference of cyanelle origins from sequence data.Journal of Molecular Evolution 34: 153-162.
Maisey, J. G. 1982. The anatomy and interrelationships of Mesozoic hybodont sharks.American Museum Novitates 2724: 1-48.
Maisey, J. G. 1984a. Higher elasmobranch phylogeny and biostratigraphy. ZoologicalJournal of the Linnean Society 82: 33-54.
Maisey, J. G. 1984b. Chondrichthyan phylogeny: A look at the evidence. Journal ofVertebrate Paleontology 4: 359-371.
Moy-Thomas, J. A. 1939. The early evolution and relationships of the elasmobranchs.Biological Reviews 14: 1-26, 12 figs.
Muller, J. and Henle, F. G. J. 1841. Systematische beschreibung der Plagiostomen.Berlin. Plagiostomeni-xxii.
Naylor, G. J. P. and Brown, W. M. 1998. Amphioxus mitochondrial DNA, chordatephylogeny, and the limits of inference based on comparison of sequences.Systematic Biology 47(1): 61-76.
Poe, S. 1998. Sensitivity of phylogeny estimation to taxon sampling. SystematicBiology 47(1): 18-31.
Palumbi, S. R. 1989. Rates of molecular evolution and the proportion of nucleotidepositions free to vary. Journal of Molecular Evolution 29: 180-187.
Posada, D. and Crandall, K. A. 1998. Modeltest: Testing the model of DNAsubstitution. Bioinformatics 14: 817-818.
de Queiroz, A. 1993. For consensus (sometimes). Systematic Biology 42: 368-372.Rannala, B., Huelsenbeck, J. P., Yang, Z. and Nielsen, R. 1998. Taxon sampling and
the accuracy of large phylogenies. Systematic Biology 47(4): 702–710.Regan, C. T. 1906. A classification of the selachian fishes. Proceedings of the
Zoological Society of London 1906 (2): 722-758, text-figs. 115-124.Saccone, C. C., Lanavé, C., Pesole, G. and Preparata, G. 1990. Influence of base
composition on quantitative estimates of gene evolution. Methods inEnzymology 183: 570-583.
Schaeffer, B. 1981. The xenacanth shark neurocranium with comments onelasmobranch monophyly. Bulletin of the American Museum of Natural History169, pp. 66.
Schaeffer, B. and Williams M. E. 1977. Relationships of fossil and livingelasmobranchs. American Zoologist 17: 293-302.
Schoemaker, J. S. and Fitch, W. M. 1989. Evidence from nuclear sequences thatinvariable sites should be considered when sequence divergence is calculated.Molecular Biology and Evolution 6: 270-289.
Seret, B. 1986. Classification et phylogénèse des chondrichthyens. Océnis, 12: 161-180. Paris.
�������������������������������������������������������������������� ��
Shirai, S. 1992. Squalean phylogeny: a new framework of “squaloid” sharks andrelated taxa. Sapporo, Hokkaido University Press. 151 pp.
Shirai, S. 1992b. Phylogenetic relationships of the Angel sharks with comments ofelasmobranch phylogeny (Chondrichthyes, Squatindae) Copeia 505-518.
Shirai, S. 1996. Phylogenetic interrelationships of neoselachians (Chondrichthyes:Euselachii). Pp. 9-34. In M. L. J. Stiassny, L. R. Parenti and G. D. Johnson (eds).Interrelationships of fishes. Academic Press San Diego.
Sidow, A. and Wilson, A. C. 1990. Compositional statistics: An improvement ofevolutionary parsimony and its application to deep branches in the tree of life.Journal of Molecular Evolution. 31(1): 51-68.
Steel, M. 1994. Recovering a tree from the leaf colourations it generates under aMarkov model. Applied Mathematics Letters 7: 19-23.
Sullivan, J., Holsinger, K. E. and Simon, C. 1995. Among site rate variation andphylogenetic analysis of 12S rRNA data in sigmodontine rodents. MolecularBiology and Evolution 12: 988-1001.
Sullivan, J., Holsinger, K. E. and Simon, C. 1996. The effect of topology on estimatesof among site rate variation. Journal of Molecular Evolution 42: 308-312.
Thies, D. 1983. Jurazeitliche Neoselachier aus Deutschland und S-England. [JurassicNeoselachians from Germany and [Southern]-England.] [in German, with Englishsumm.]. CFS, Courier Forschungsinst. Senckenberg 58, Pp. 116.
Thies, D. and Reif, W. E. 1985. Phylogeny and evolutionary ecology of Mesozoic,Neoselachii. News Jahrbuch für Geologie und Palaontologie Monatshefte, Abh.169: 331-361, Stuttgart.
White, E. G. 1936. A classification and phylogeny of the elasmobranch fishes.American Museum Novitates 837: 1-16.
White, E. G. 1937. Interrelationships of the elasmobranchs with a key to the orderGalea. Bulletin of the American Museum of Natural History 74: 25-138, 66 figs., 51pls.
Yang, Z. 1994. Maximum likelihood phylogenetic estimation from DNA sequenceswith variable rates over sites: Approximate methods. Journal of MolecularEvolution 39: 306-314.
Yang, Z., Kumar, S. and Nei, M. 1995. A new method of inference of ancestralnucleotide and amino acid sequences. Genetics 141: 1641-1650.
Yang, Z. 1996. Among site rate variation and its impact on phylogenetic analyses.Trends in Ecology and Evolution. 11: 367-372.