Embed Size (px)
Citation preview
Physical Stability of Amorphous Solid Dispersions: Computational
Studies of ‘Miscibility’I. Ivanisevic, S. Bates, P. ChenSSCI, a division of Aptuit IncL. Taylor and A. Rumondor
Purdue University
This document was presented at PPXRD -Pharmaceutical Powder X-ray Diffraction Symposium
Sponsored by The International Centre for Diffraction Data
This presentation is provided by the International Centre for Diffraction Data in cooperation with the authors and presenters of the PPXRD symposia for the express purpose of educating the scientific community.
All copyrights for the presentation are retained by the original authors.
The ICDD has received permission from the authors to post this material on our website and make the material available for viewing. Usage is restricted for the purposes of education and scientific research.
ICDD Website - www.icdd.comPPXRD Website – www.icdd.com/ppxrd
2
Outline• Amorphous state and its stability and
performance• ‘Miscibility’ characterization tools• XRPD and computational methods:
• Linear combinations of XRPD patterns• Linear combinations of PDF patterns• Pure Curve Resolution Method
• Examples throughout!• Physical stability study• Effects of humidity and temperature on
dispersion miscibility
3
Amorphous State: Solubility and Dissolution Rate
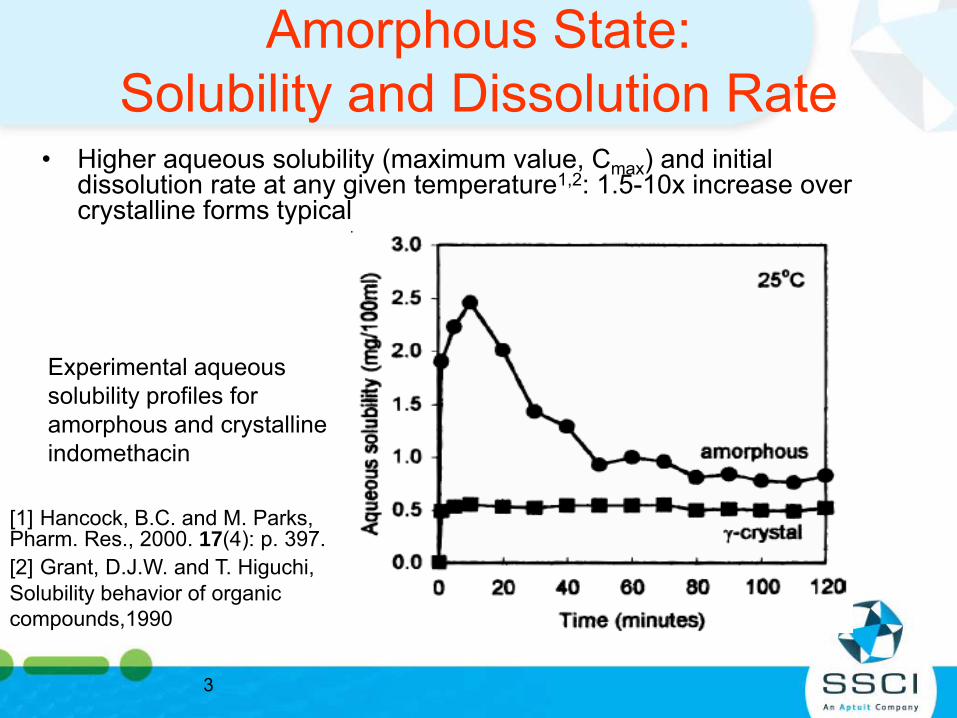
• Higher aqueous solubility (maximum value, Cmax) and initial dissolution rate at any given temperature1,2: 1.5-10x increase over crystalline forms typical
Experimental aqueous solubility profiles for amorphous and crystalline indomethacin
[1] Hancock, B.C. and M. Parks, Pharm. Res., 2000. 17(4): p. 397.[2] Grant, D.J.W. and T. Higuchi, Solubility behavior of organic compounds,1990
4
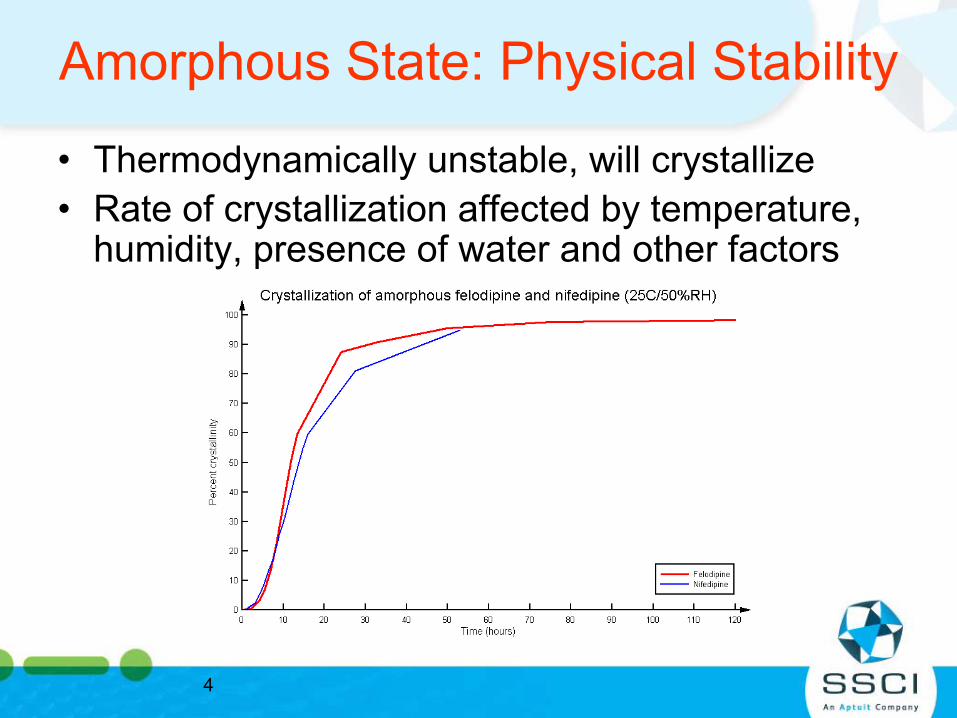
Amorphous State: Physical Stability
• Thermodynamically unstable, will crystallize• Rate of crystallization affected by temperature,
humidity, presence of water and other factors
5
Amorphous Dispersions
• Systems combining API and excipient(s)• Expected to provide enhanced dissolution rates
and increased maximum solubility (vs. crystalline forms) and greater physical stability (vs. amorphous state)
• In practice? – Initial dissolution rates and Cmax typically significantly
higher than crystalline forms– Physical stability often appears to depend on drug-to-
excipient ratio, storage conditions etc.
6
Example: Ritonavir• Ritonavir is a large, lipophilic molecule that is very poorly
soluble in aqueous media and exhibits an extremely slow intrinsic dissolution rate
• Oral absorption of ritonavir appears to be limited by both dissolution and permeability, making it a BCS Class IV compound
• Study3 evaluated solid dispersions of polyethylene glycol (PEG) and amorphous ritonavir at different drug loadings
• Both in vitro (0.1N HCl with a USP Apparatus I) and in vivo (beagle dogs) performance were evaluated
[3] Law, D. et al, J. Pharm. Sci., 2004, 93(3): p. 563-570
7
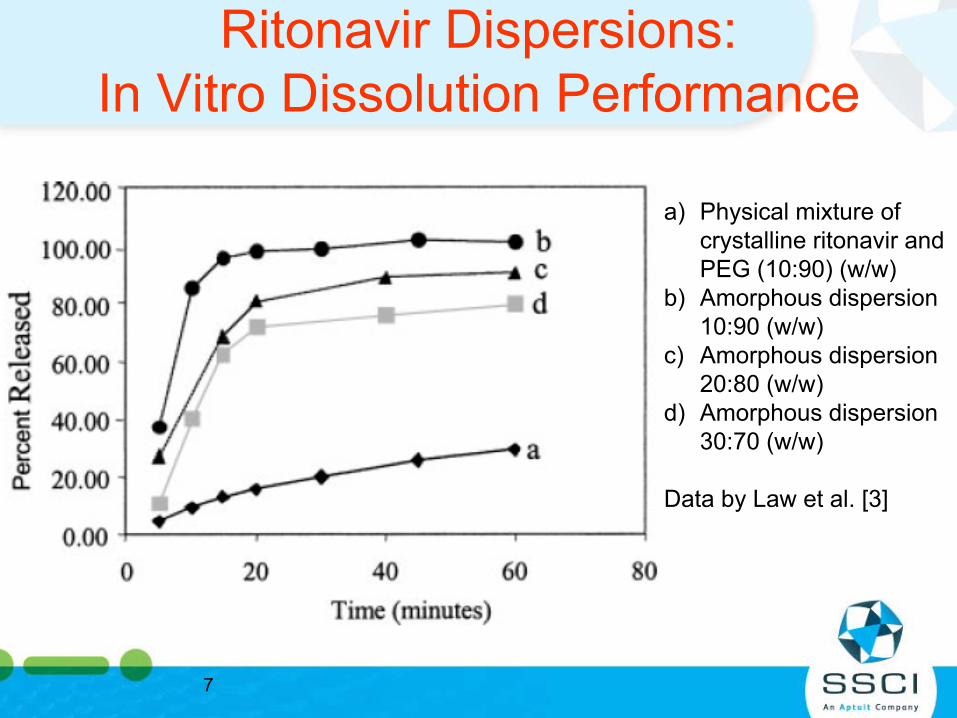
Ritonavir Dispersions:In Vitro Dissolution Performance
a) Physical mixture of crystalline ritonavir and PEG (10:90) (w/w)
b) Amorphous dispersion 10:90 (w/w)
c) Amorphous dispersion 20:80 (w/w)
d) Amorphous dispersion 30:70 (w/w)
Data by Law et al. [3]
8
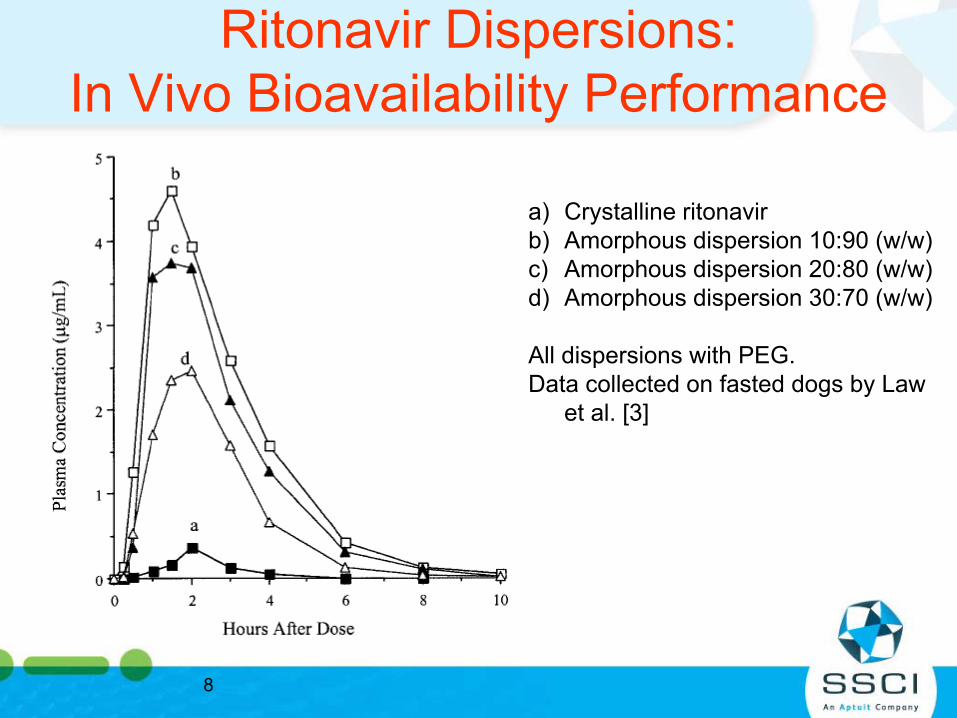
Ritonavir Dispersions:In Vivo Bioavailability Performance
a) Crystalline ritonavirb) Amorphous dispersion 10:90 (w/w)c) Amorphous dispersion 20:80 (w/w)d) Amorphous dispersion 30:70 (w/w)
All dispersions with PEG.Data collected on fasted dogs by Law
et al. [3]
9
Predicting Amorphous Dispersion Performance
• Historically hard to do without lengthy and costly stability/bioavailability studies
• Prediction?• Characterization tools:
• mDSC• XRPD• Spectroscopy (IR, Raman, NMR)• High-resolution microscopy• Melting point depression
10
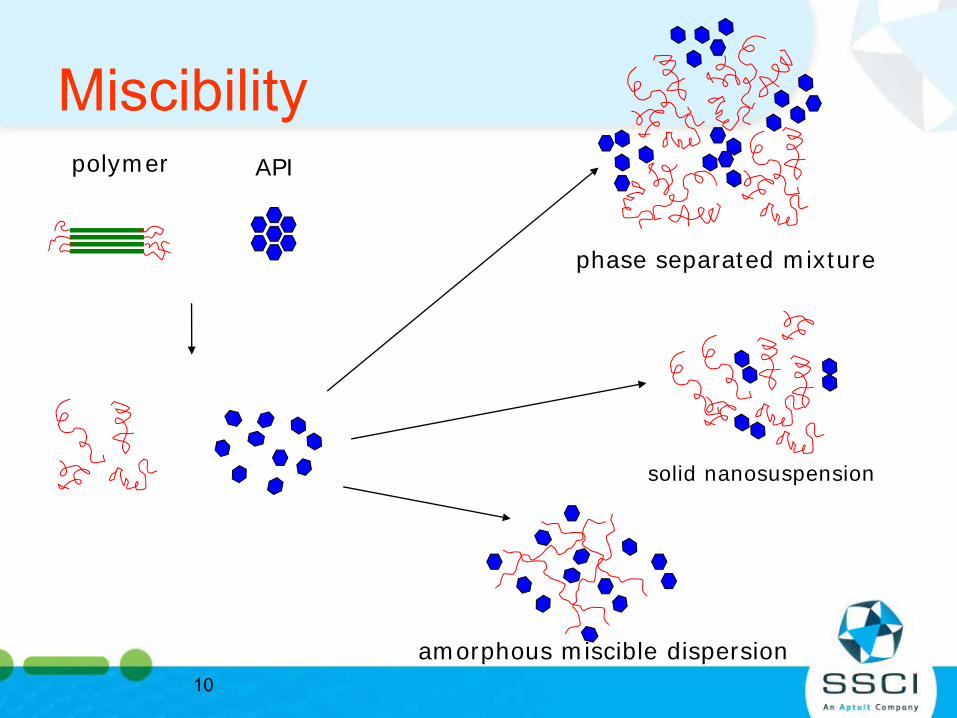
Miscibility
phase separated mixture
solid nanosuspension
polymer API
amorphous miscible dispersion
11
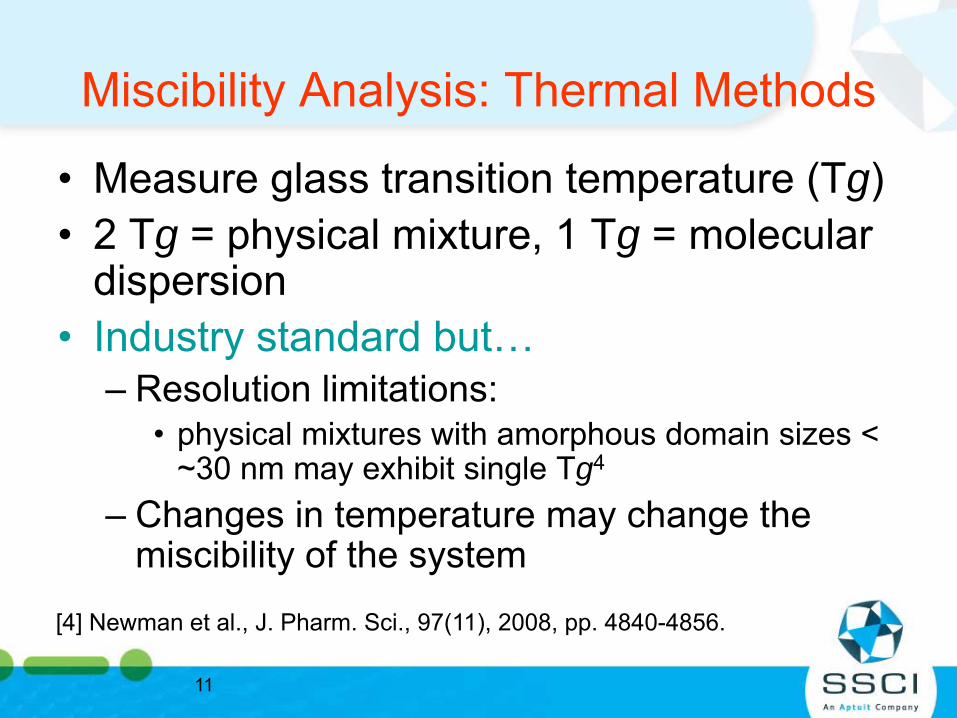
Miscibility Analysis: Thermal Methods
• Measure glass transition temperature (Tg)• 2 Tg = physical mixture, 1 Tg = molecular
dispersion• Industry standard but…
– Resolution limitations: • physical mixtures with amorphous domain sizes <
~30 nm may exhibit single Tg4
– Changes in temperature may change the miscibility of the system
[4] Newman et al., J. Pharm. Sci., 97(11), 2008, pp. 4840-4856.
12
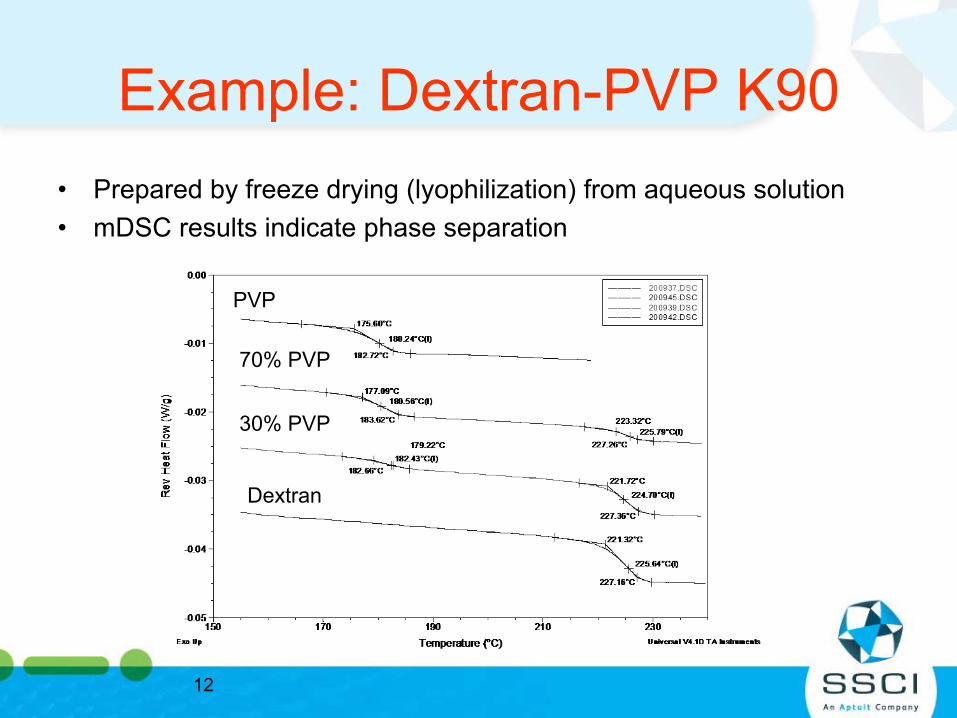
Example: Dextran-PVP K90• Prepared by freeze drying (lyophilization) from aqueous solution• mDSC results indicate phase separation
PVP
Dextran
70% PVP
30% PVP
13
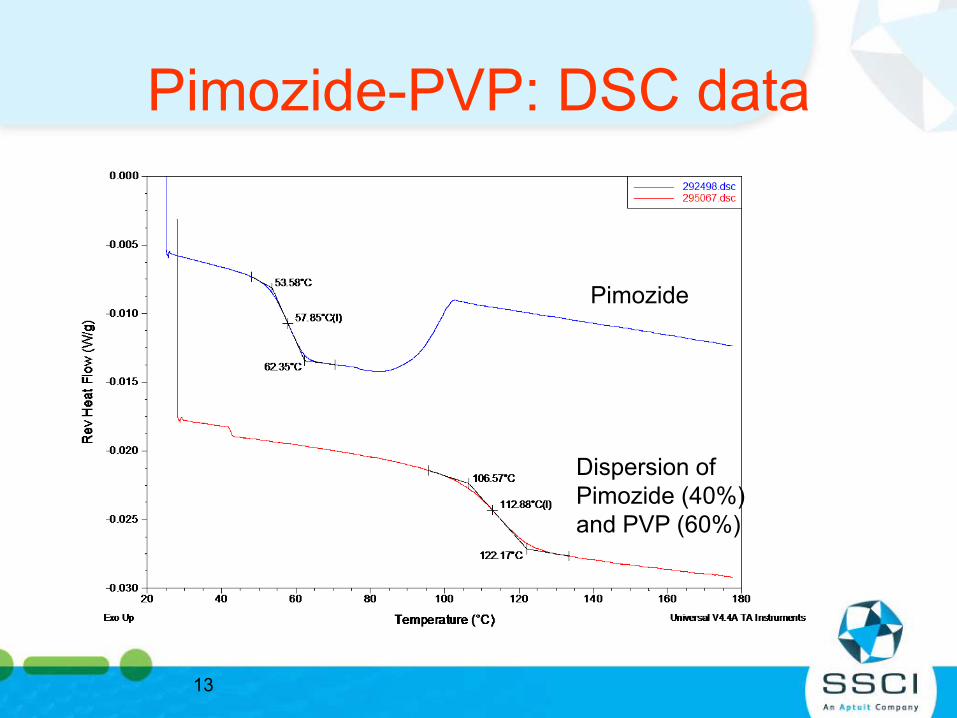
Pimozide-PVP: DSC data
Pimozide
Dispersion ofPimozide (40%)and PVP (60%)
14
A Note on Sample Preparation…
• Properties of amorphous materials can be greatly affected by method of preparation
• For these studies (unless otherwise noted):
The dispersion samples were produced by dissolving in a common solvent (e.g. ethanol-dichloromethane mixture). The solvent was then removed by rotary evaporation, and the sample stored under vacuum for 2-12 hours.
15
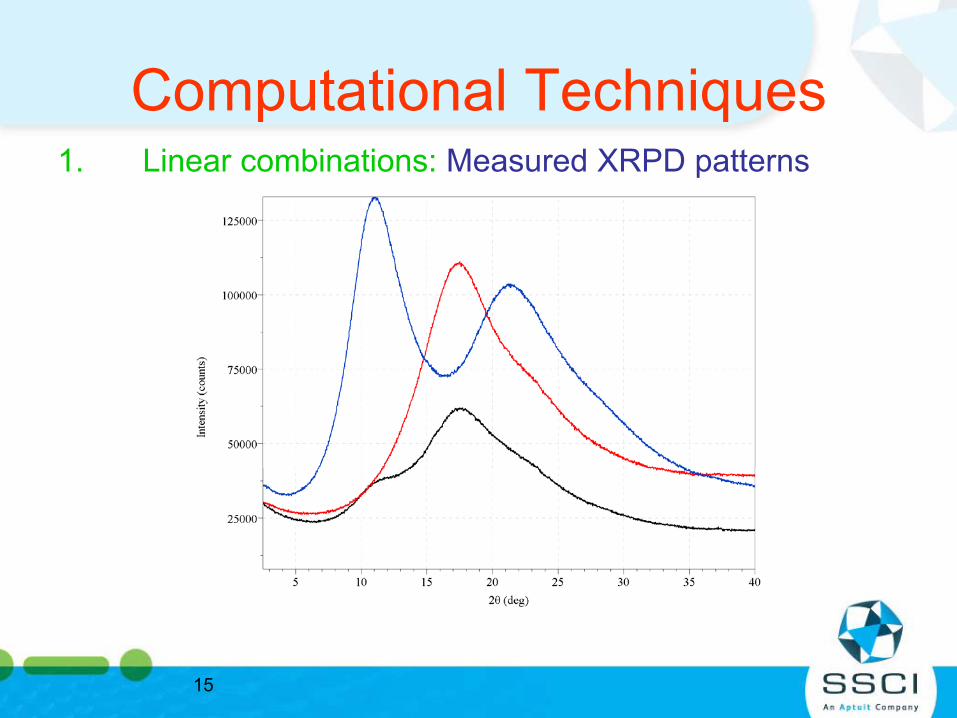
Computational Techniques1. Linear combinations: Measured XRPD patterns
16
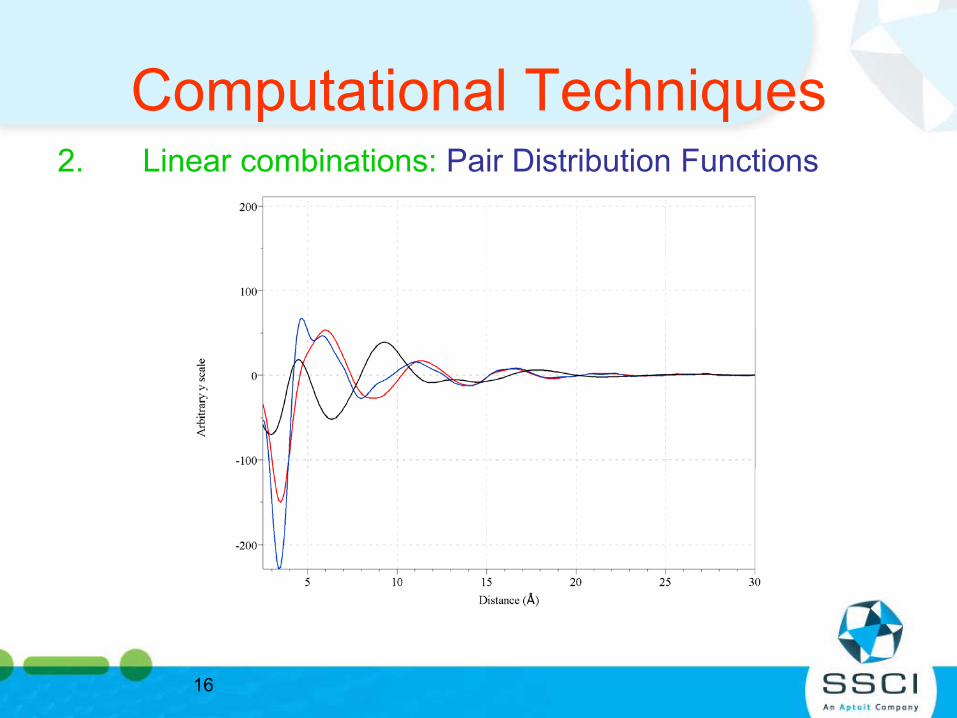
Computational Techniques2. Linear combinations: Pair Distribution Functions
17
Linear Combinations
• Model each dispersion as a linear combination of the API and excipient using XRPD or PDF patterns
• If system is phase separated: – model should agree with measured patterns – ratio of components in model should be
similar to component weight ratio in dispersion
• Otherwise system is ‘miscible’
18
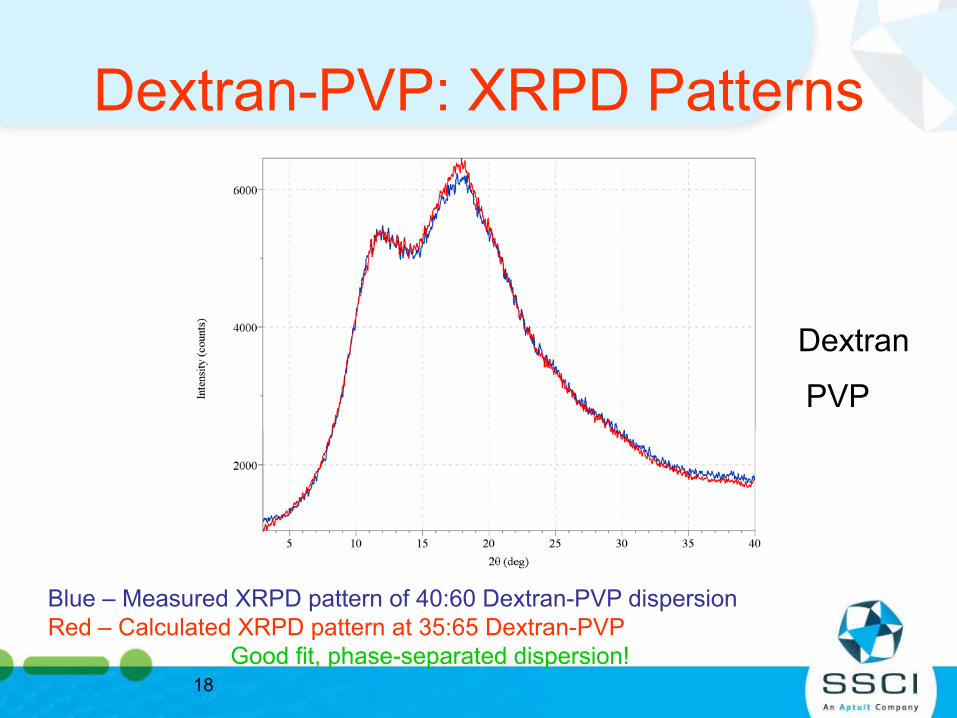
Dextran-PVP: XRPD Patterns
Dextran
PVP
Blue – Measured XRPD pattern of 40:60 Dextran-PVP dispersionRed – Calculated XRPD pattern at 35:65 Dextran-PVP
Good fit, phase-separated dispersion!
19
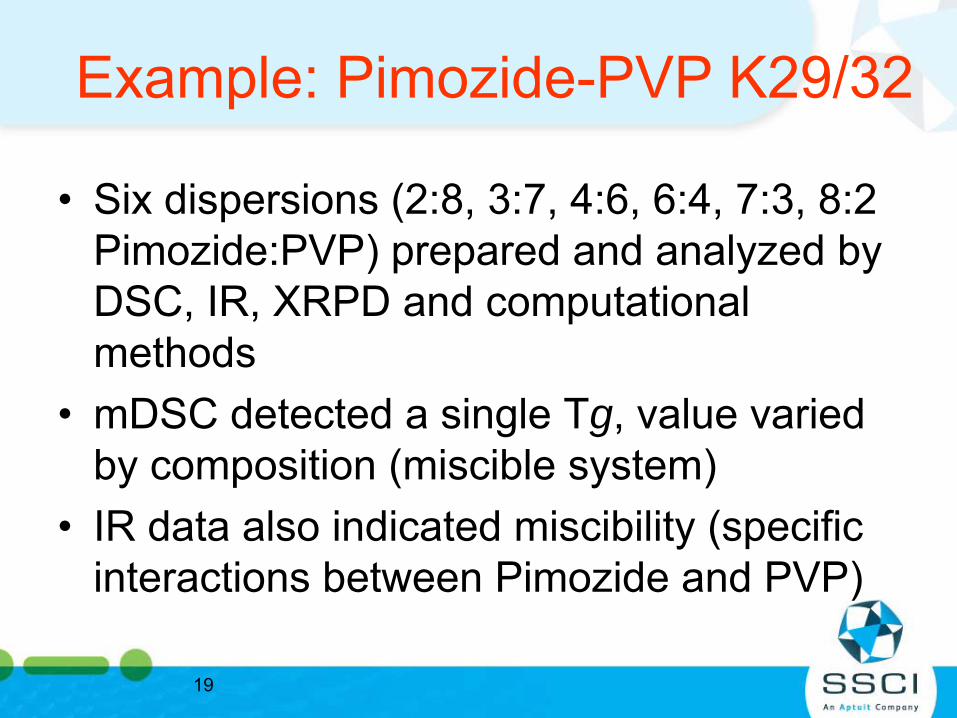
Example: Pimozide-PVP K29/32
• Six dispersions (2:8, 3:7, 4:6, 6:4, 7:3, 8:2 Pimozide:PVP) prepared and analyzed by DSC, IR, XRPD and computational methods
• mDSC detected a single Tg, value varied by composition (miscible system)
• IR data also indicated miscibility (specific interactions between Pimozide and PVP)
20
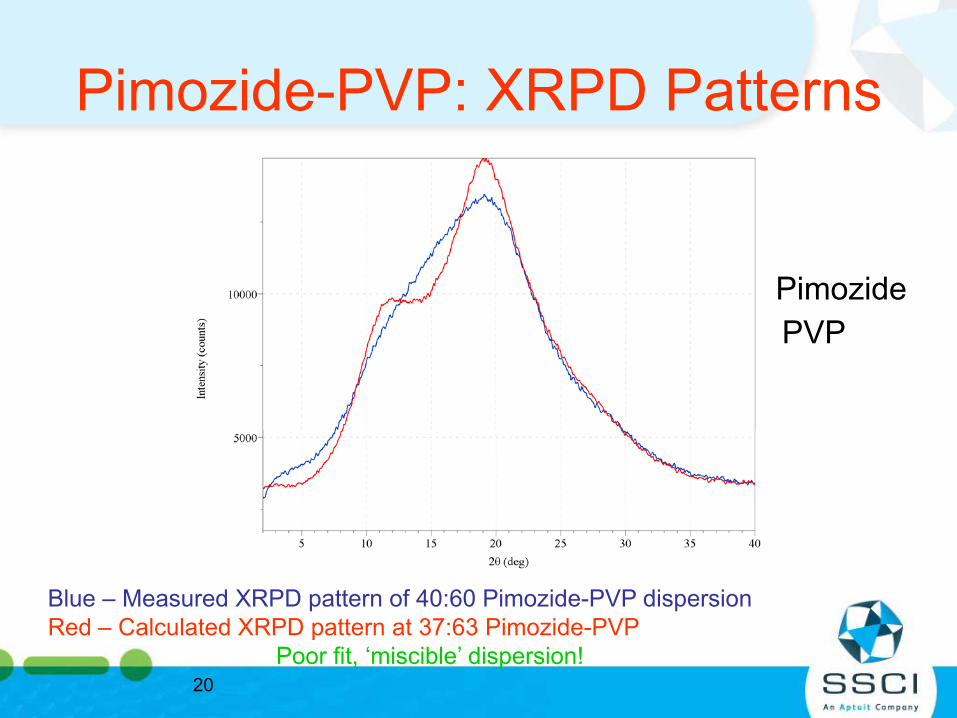
Pimozide-PVP: XRPD Patterns
PimozidePVP
Blue – Measured XRPD pattern of 40:60 Pimozide-PVP dispersionRed – Calculated XRPD pattern at 37:63 Pimozide-PVP
Poor fit, ‘miscible’ dispersion!
21
Example: Felodipine-PVP K29/32 and Felodipine-PAA
• IR spectroscopy data for FEL-PVP detect formation of H-bonds between FEL-PVP
• Therefore, system is thought to be miscible• Miscibility for FEL-PVP persists over a wide
range of drug loadings• A single Tg is detected for FEL-PVP dispersions• IR spectroscopy data for FEL-Polyacrylic acid
(PAA) reveals no change in H-bonding• Two Tg are detected for FEL-PAA dispersions
22
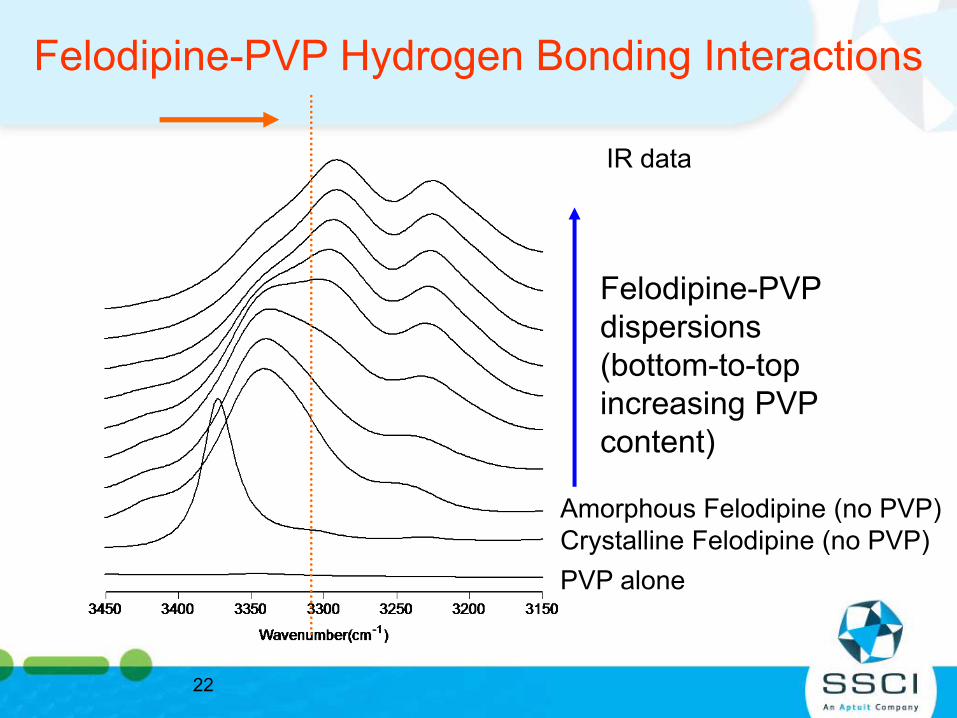
PVP aloneCrystalline Felodipine (no PVP)Amorphous Felodipine (no PVP)
Felodipine-PVP Hydrogen Bonding Interactions
Felodipine-PVPdispersions (bottom-to-top increasing PVP content)
IR data
23
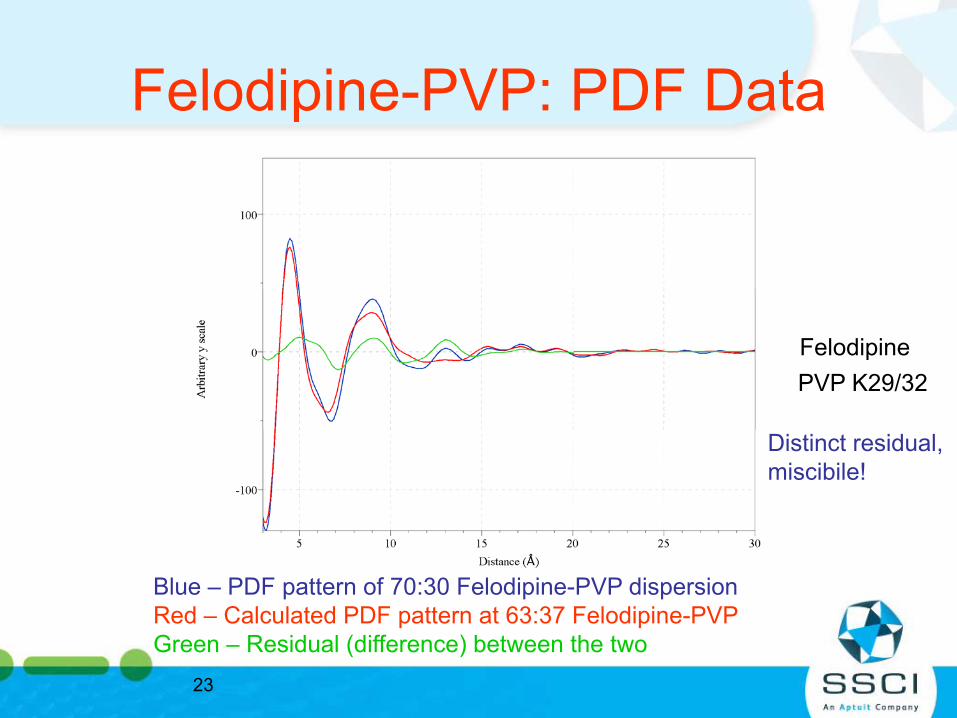
Felodipine-PVP: PDF Data
FelodipinePVP K29/32
Blue – PDF pattern of 70:30 Felodipine-PVP dispersionRed – Calculated PDF pattern at 63:37 Felodipine-PVPGreen – Residual (difference) between the two
Distinct residual, miscibile!
24
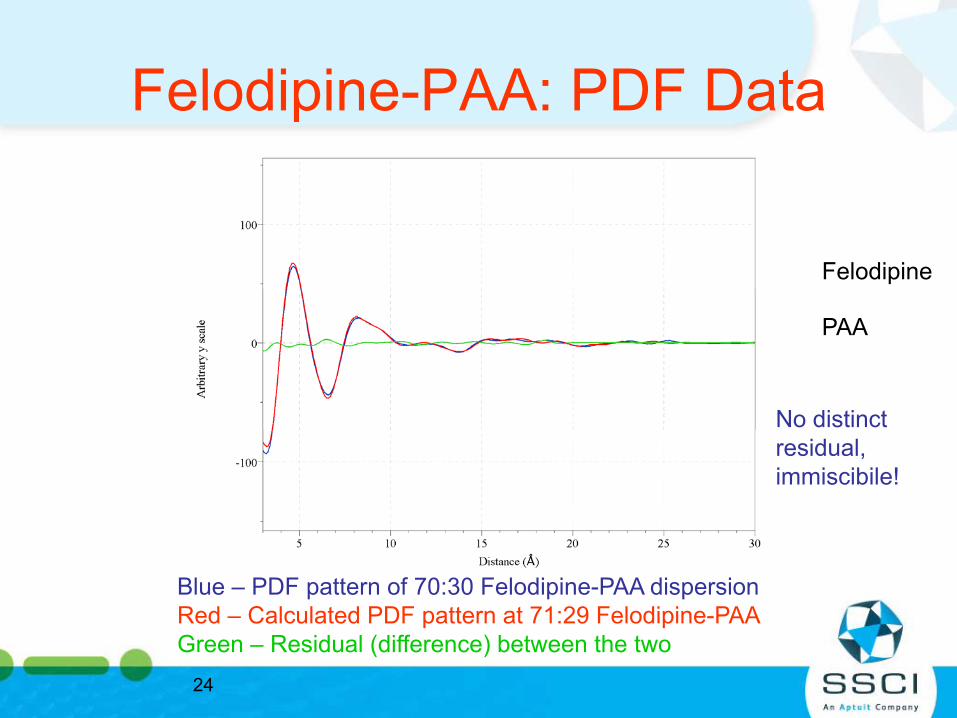
Felodipine-PAA: PDF Data
Felodipine
PAA
No distinct residual, immiscibile!
Blue – PDF pattern of 70:30 Felodipine-PAA dispersionRed – Calculated PDF pattern at 71:29 Felodipine-PAAGreen – Residual (difference) between the two
25
Linear Combinations Notes• Method is sensitive to:
– quality of reference XRPD patterns– experimental artifacts in measured data
• Need reference pattern of amorphous API, sample must be prepared using the same process as the dispersion
• PDF method more robust, can be harder to interpret results
• Qualitative (not quantitative) measure of ‘miscibility’
26
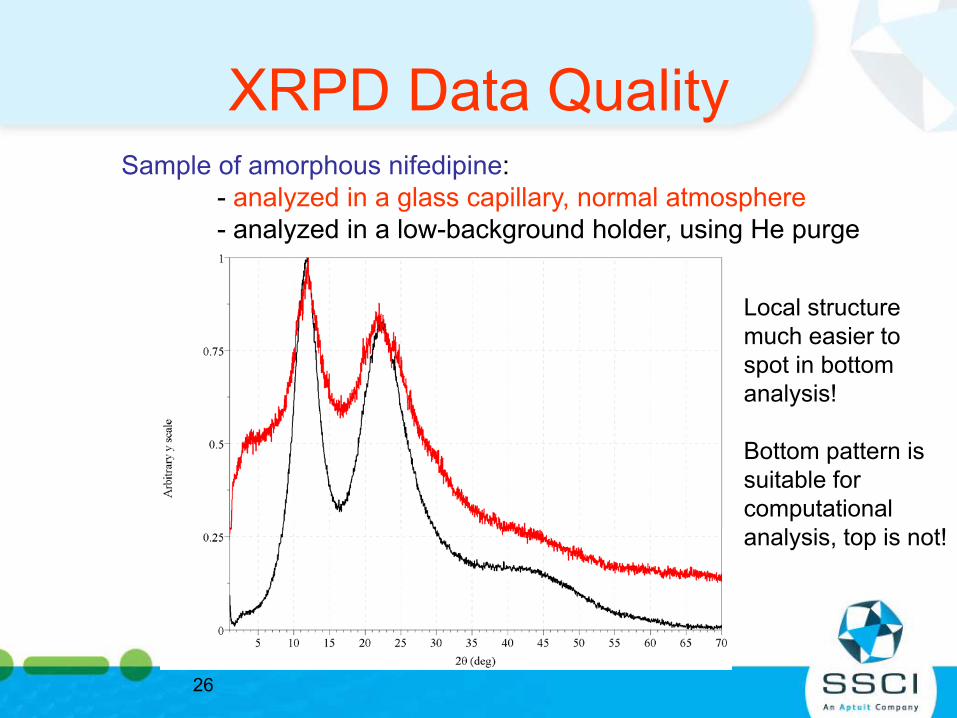
XRPD Data QualitySample of amorphous nifedipine:
- analyzed in a glass capillary, normal atmosphere- analyzed in a low-background holder, using He purge
Local structuremuch easier tospot in bottomanalysis!
Bottom pattern issuitable for computationalanalysis, top is not!
27
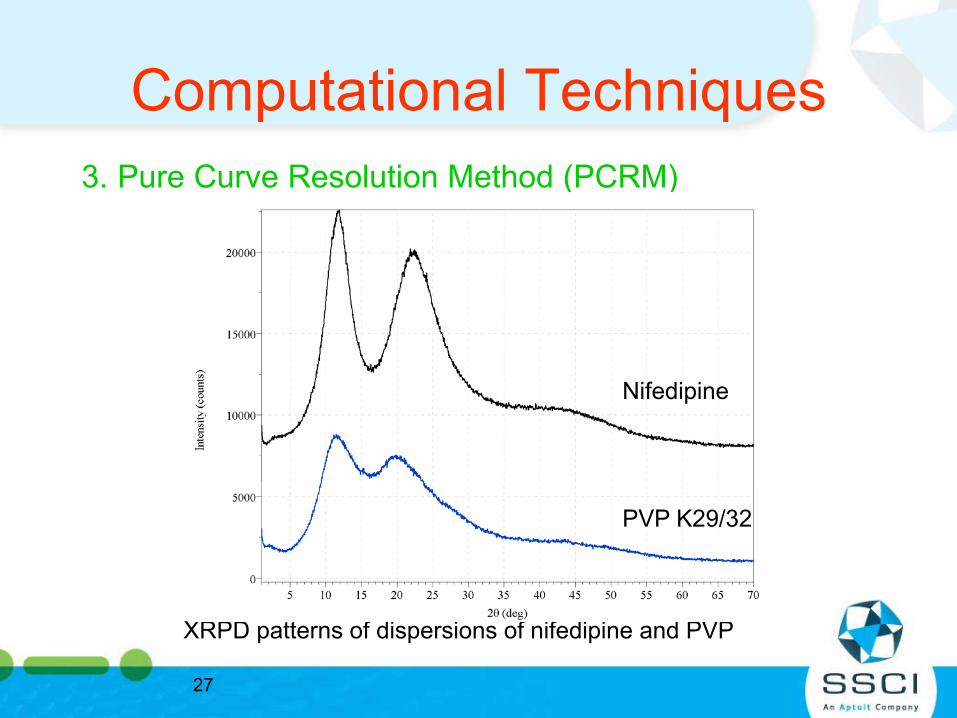
3. Pure Curve Resolution Method (PCRM)
Computational Techniques
XRPD patterns of dispersions of nifedipine and PVP
PVP-NIF (3:7)
PVP-NIF (4:6)
PVP-NIF (6:4)
PVP-NIF (7:3)
Nifedipine
PVP K29/32
28
PCRM
• Analyzes the variance in measured dispersion data sets (prepared at different loadings) to extract the pure curves (PCs)
• PCs can then be compared to measured reference patterns of API and excipient
• If good match and no residual components detected, system is phase separated
• Otherwise ‘miscible’[5] Ivanisevic et al. A novel method for the assessment of miscibility in amorphous dispersions, J. Pharm. Sci. in press Mar 2009.
29
Example: Nifedipine-PVP K29/32
• IR spectroscopy results indicate nifedipine and PVP form H-bonds (miscibility)
• One Tg observed by DSC for this system• Computational analysis (linear
combinations) suggests miscibility• Four dispersions (30:70, 40:60, 60:40,
70:30 nifedipine:PVP) used as input into the PCRM
30
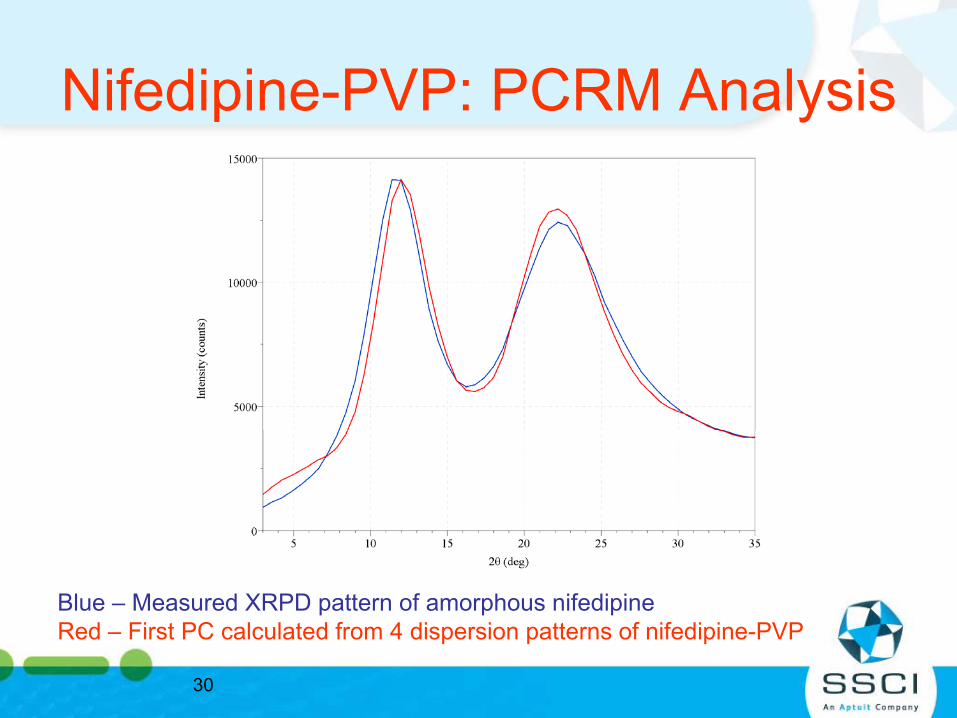
Nifedipine-PVP: PCRM Analysis
Blue – Measured XRPD pattern of amorphous nifedipineRed – First PC calculated from 4 dispersion patterns of nifedipine-PVP
31
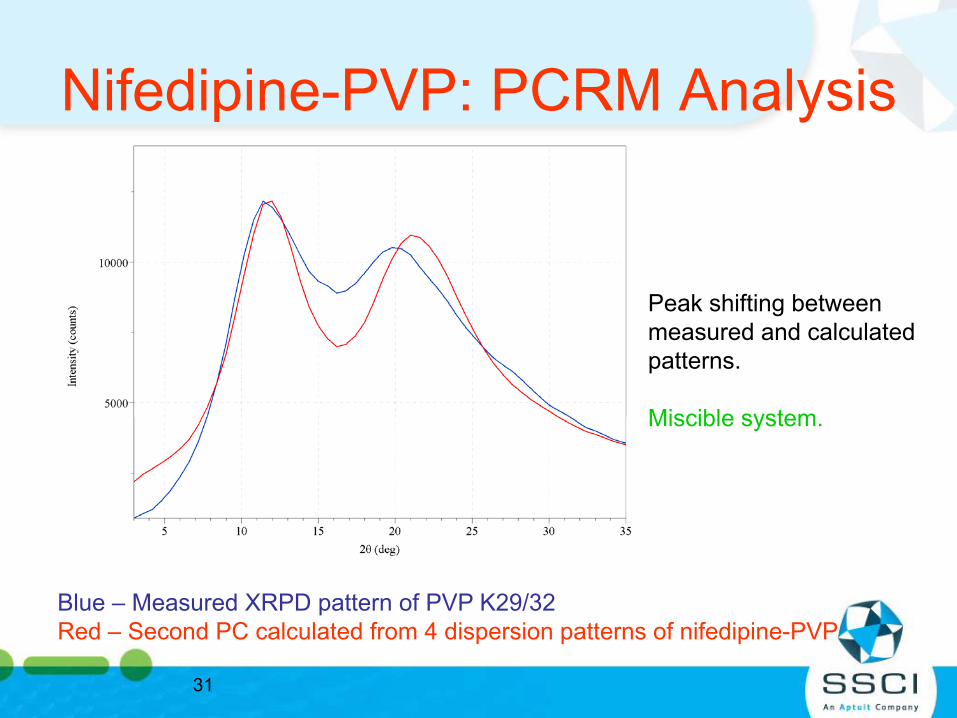
Nifedipine-PVP: PCRM Analysis
Blue – Measured XRPD pattern of PVP K29/32Red – Second PC calculated from 4 dispersion patterns of nifedipine-PVP
Peak shifting between measured and calculated patterns.
Miscible system.
32
Example: Trehalose-Dextran T500
• System previously reported to exhibit single Tg [6]
• Two Tg and trehalose crystallization observed after humidity stress is applied [6]
• Seven dispersions (2:8, 3:7, 4:6, 5:5, 6:4, 7:3, 8:2 Trehalose:Dextran) used as input into the PCRM
[6] M. Vasanthavada et al. Pharm. Res. 21(9): 1598-1606 (2004).
33
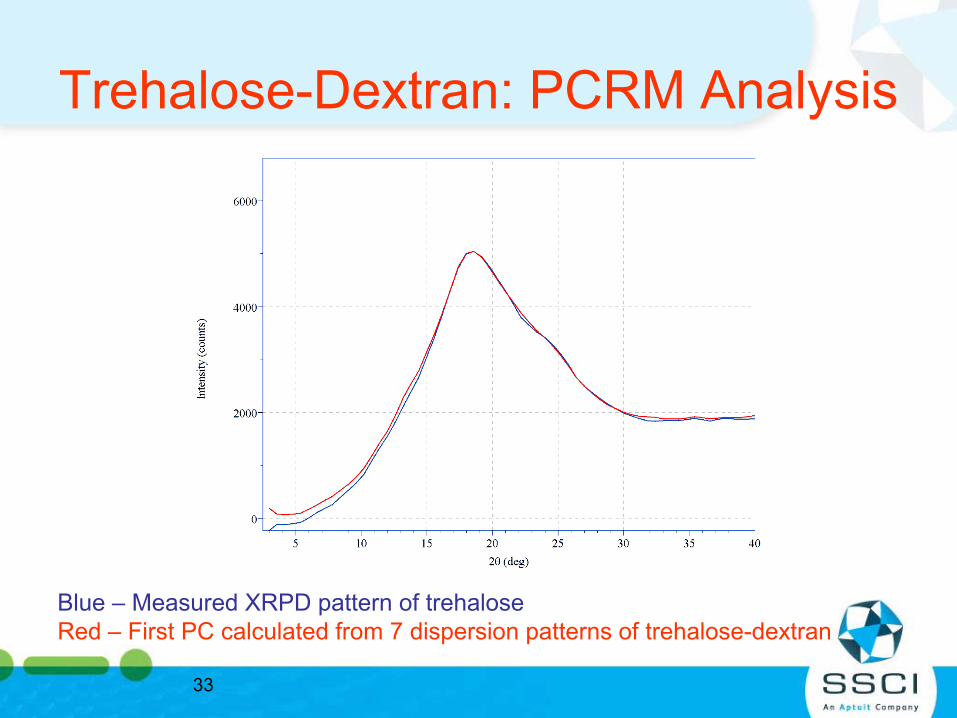
Trehalose-Dextran: PCRM Analysis
Blue – Measured XRPD pattern of trehaloseRed – First PC calculated from 7 dispersion patterns of trehalose-dextran
34
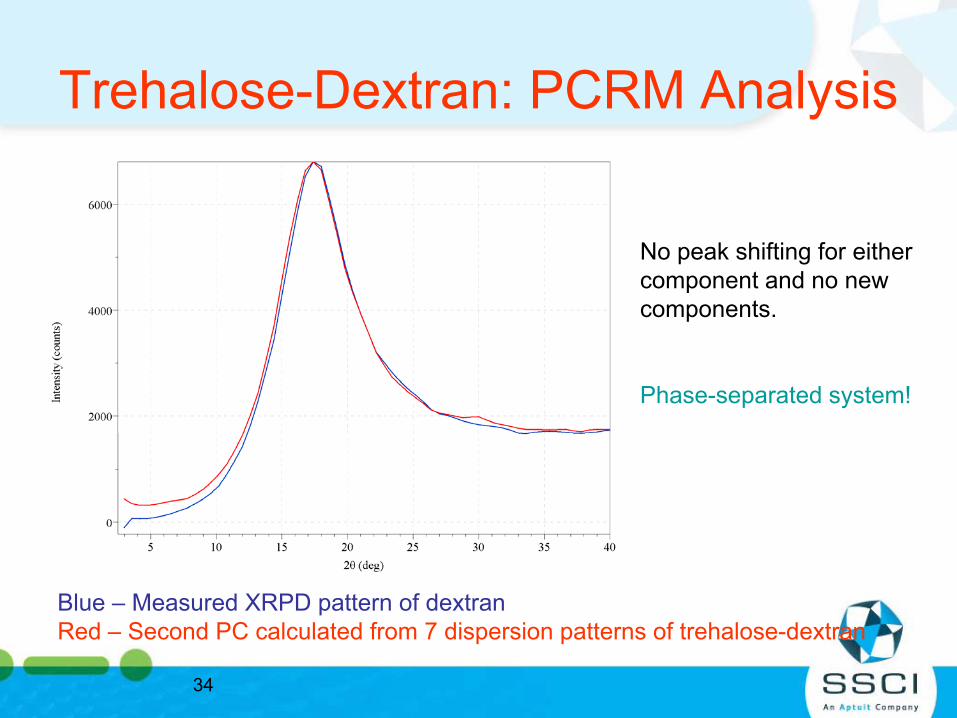
Trehalose-Dextran: PCRM Analysis
Blue – Measured XRPD pattern of dextranRed – Second PC calculated from 7 dispersion patterns of trehalose-dextran
No peak shifting for eithercomponent and no new components.
Phase-separated system!
35
Example: Ketoconazole-PVP K29/32
• System previously reported to be both immiscible [7] and miscible [8]
• Four dispersions (3:7, 4:6, 6:4, 7:3 KET:PVP) used as input into the PCRM
• DSC data: 2 Tg at 7:3, 6:4, 1 Tg at 4:6, 3:7• IR data inconclusive (partial miscibility at
low drug loadings?)[7] Van Den Mooter et al., Europ. J. Pharm. Sci. (12) 2001, pp 261.[8] Marsac et al., Pharm. Res., DOI 10.1007/s11095-008-9721-1, 2008.
36
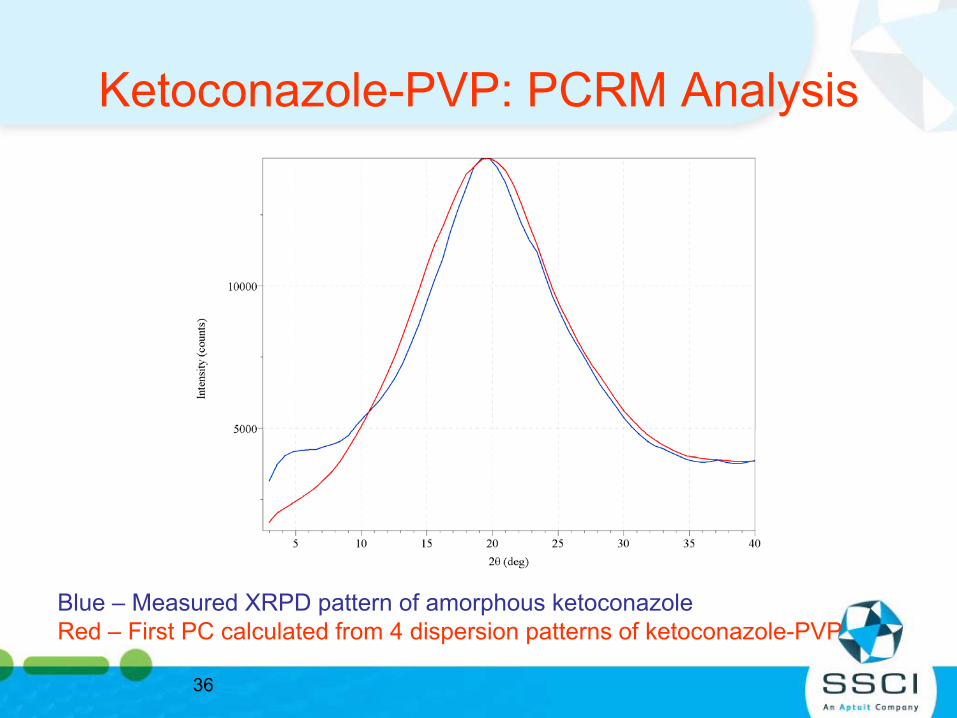
Ketoconazole-PVP: PCRM Analysis
Blue – Measured XRPD pattern of amorphous ketoconazoleRed – First PC calculated from 4 dispersion patterns of ketoconazole-PVP
37
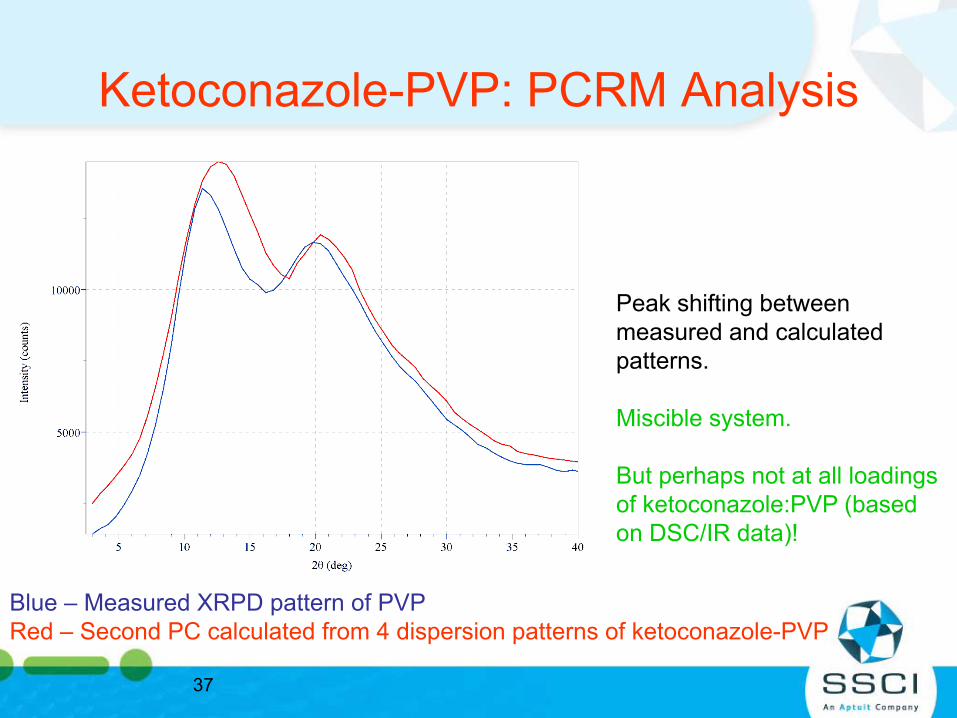
Ketoconazole-PVP: PCRM Analysis
Blue – Measured XRPD pattern of PVPRed – Second PC calculated from 4 dispersion patterns of ketoconazole-PVP
Peak shifting between measured and calculated patterns.
Miscible system.
But perhaps not at all loadings of ketoconazole:PVP (based on DSC/IR data)!
38
Ketoconazole-PVP: PDF Analysis
• PDF analysis of individual dispersion XRPD patterns to detect miscibility
• Good fit indicating mostly phase separated system at 7:3 ketoconazole:PVP
• Fit gets worse with decreased ketoconazole loading (6:4, 4:6, 3:7)
• Conclusion: system is miscible at low loadings of ketoconazole (e.g. 3:7)
39
PCRM Notes
• Requires at least two dispersions with different loadings of API and excipient
• Can be used to calculate unknown amorphous reference patterns (e.g. for amorphous API with low Tg)
• Leads into ‘miscibility index’ calculations –potentially quantitative measure of ‘miscibility’
40
Physical Stability Study
• Dispersions exposed to ambient conditions (~25°C/50%RH) and monitored for physical stability using XRPD
• 2 different loadings tested, 30/70, 70/30 API-excipient
• Multiple samples tested in some cases• Both phase-separated and miscible
dispersions included in the study
41
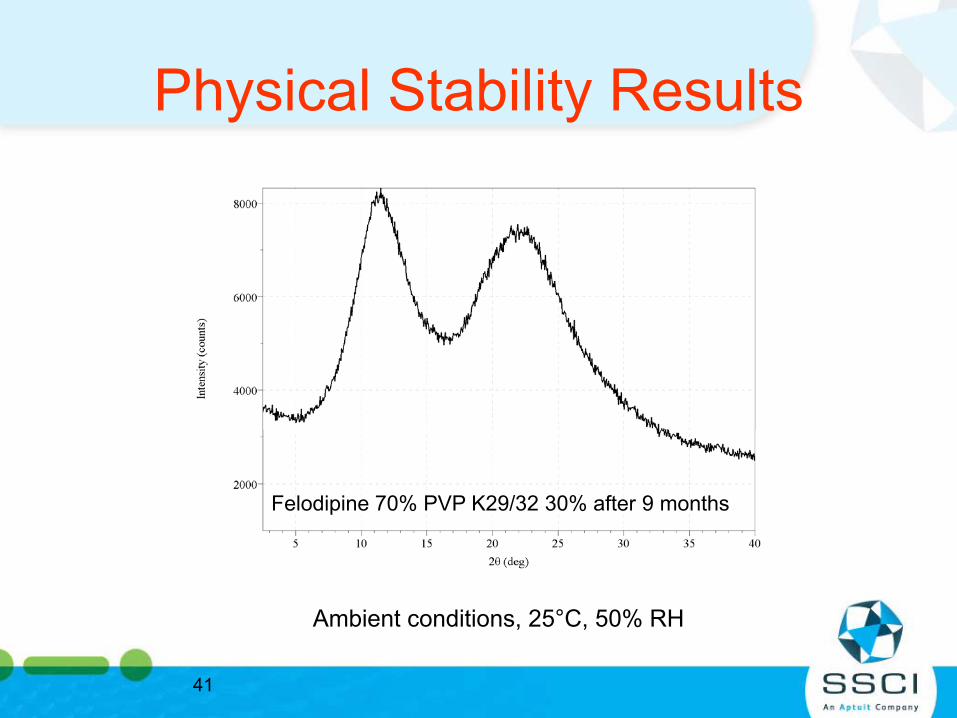
Physical Stability Results
Amorphous felodipine
Felodipine after 24 hrs at 25°C/50%RH
Dispersion of felodipine 70% and PVP K29/32 30%Felodipine 70% PVP K29/32 30% after 9 months
Ambient conditions, 25°C, 50% RH
42
Physical Stability of Miscible Dispersions (Ambient Conditions)
• Felodipine-PVP (30 and 70% API loading): amorphous after 9 months
• Nifedipine-PVP (30 and 70% API loading): 98+% amorphous after 9 months
• Indomethacin-PVP (50 and 60% API loading): amorphous after 10 months
• Ketoconazole-PVP (30% API loading): remained amorphous for 7 months, then started to crystallize (<10% crystalline after 8 months of storage)
• All of these amorphous drugs crystallize within days when not stabilized by excipient.
43
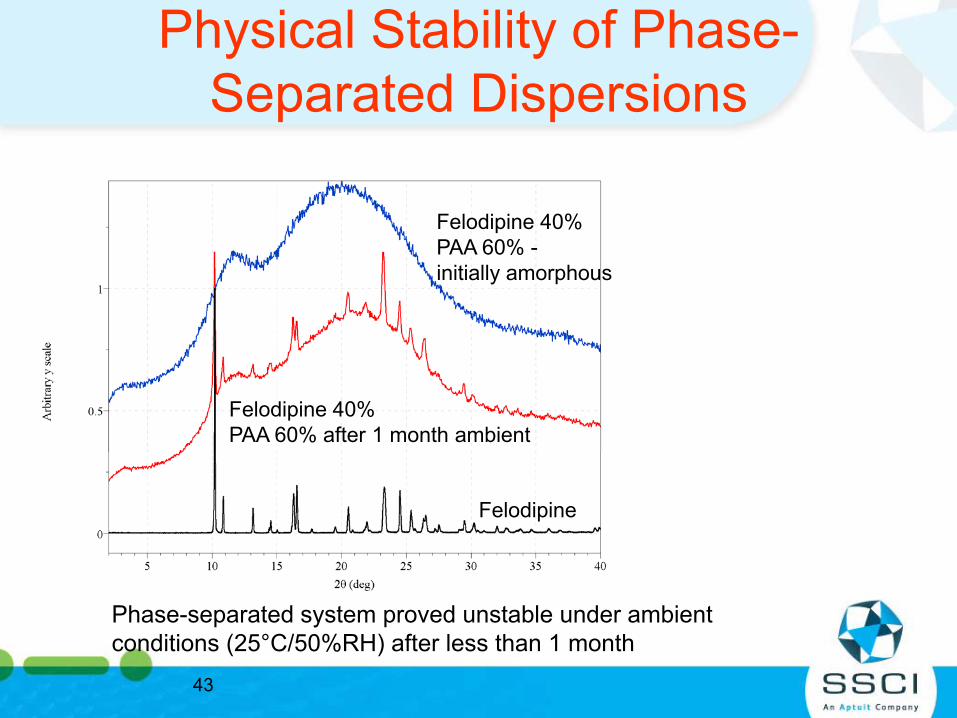
Physical Stability of Phase-Separated Dispersions
Phase-separated system proved unstable under ambient conditions (25°C/50%RH) after less than 1 month
Felodipine 40% PAA 60% -initially amorphous
Felodipine 40% PAA 60% after 1 month ambient
Felodipine
44
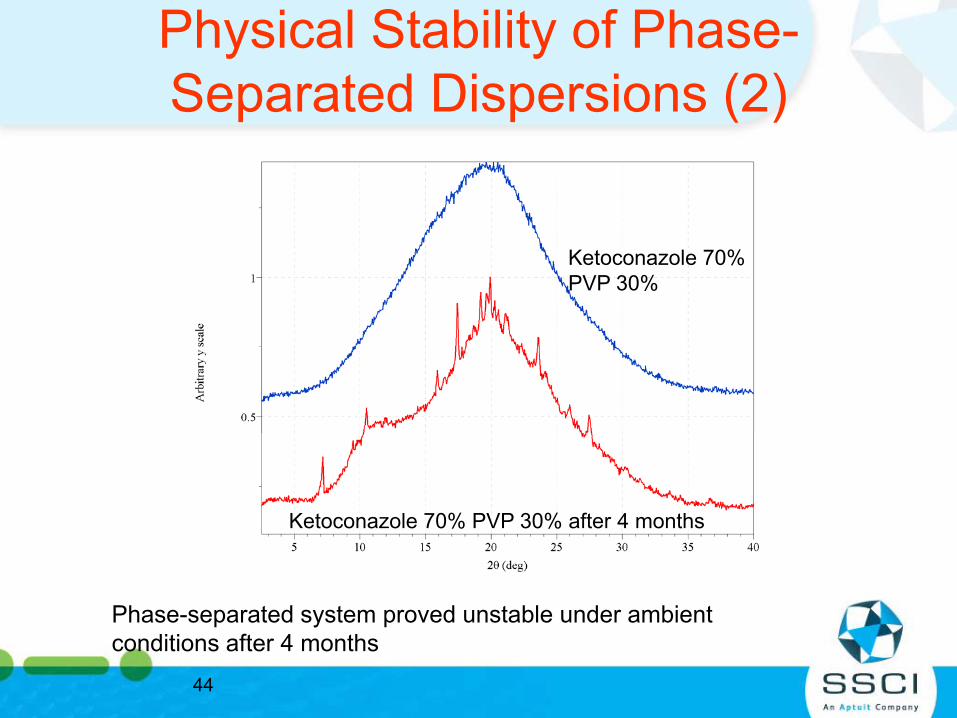
Physical Stability of Phase-Separated Dispersions (2)
Phase-separated system proved unstable under ambient conditions after 4 months
Ketoconazole 70%PVP 30%
Ketoconazole 70% PVP 30% after 4 months
45
Conclusions
• We apparently can determine whether a dispersion is phase separated or miscible
• Data quality and use of multiple techniques are important for this work
• Lots of examples of miscible systems – common property?
• Future work (short term): – ‘miscibility index’ – Connection to physical stability and bioavailability
Effects of temperature and relative humidity on dispersion
miscibility
47
Premise
• Accelerated aging studies are common methods of evaluating dispersion stability
• 40°C/75% RH stress commonly used• Stability data is often extrapolated to
ambient conditions• Oft-cited rule of thumb: 1 month stability at
40/75 equals 6 months stability at ambient• Does this apply to miscible dispersions?
48
Felodipine/PVP
• H-bonding interactions studied by FTIR as a function of temperature and RH
• Also used XRPD, AFM, DSC and SEM• Different dispersion compositions were
studied – H-bonding observed over the full range of compositions (30-74% API)
49
Effects of temperature on miscibility
• Increasing temperature weakened the interactions between FEL and PVP, but they persisted up to melting point of drug
• Changes in H-bonding interactions were found to be reversible with changes in temperature
50
Effects of humidity on miscibility
• Introduction of water into dispersions at room temperature irreversibly disruptedinteractions between FEL and PVP
• DSC, AFM and SEM confirmed these results
• Moisture-induced immiscibility occurred at or above 75% RH
51
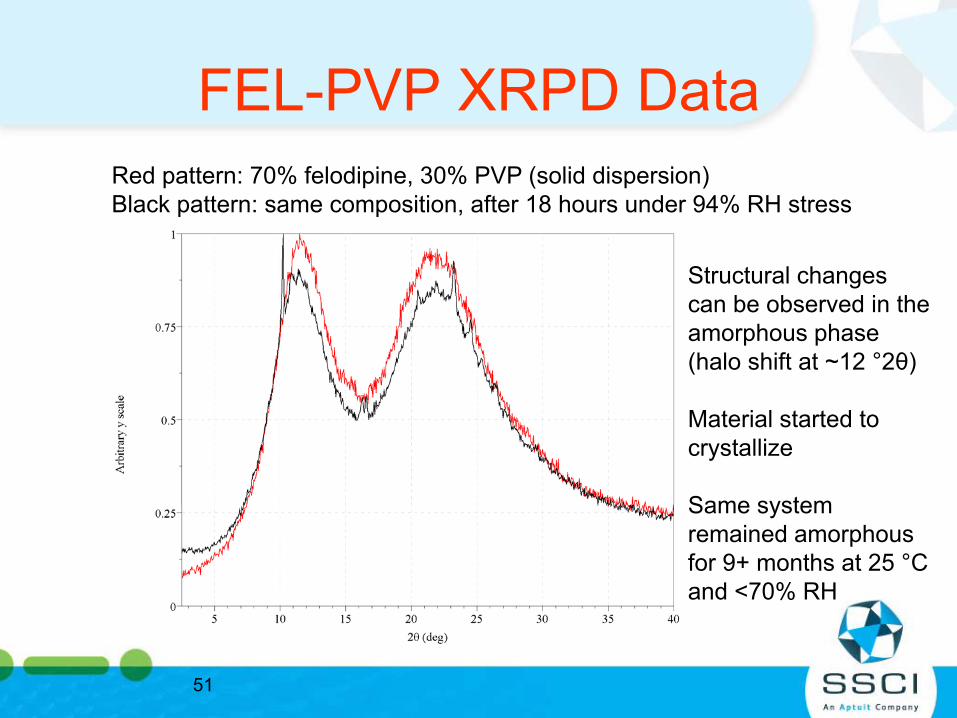
FEL-PVP XRPD DataRed pattern: 70% felodipine, 30% PVP (solid dispersion)Black pattern: same composition, after 18 hours under 94% RH stress
Structural changes can be observed in the amorphous phase (halo shift at ~12 °2θ)
Material started to crystallize
Same system remained amorphous for 9+ months at 25 °C and <70% RH

52
Acknowledgments
• Simon Bates, Ping Chen, SSCI• Claire Gendron, David Engers, Paul Schields,
Kevin Leach, Erin VanMeter, Ping Chen, Jan-Olav Henck, SSCI
• Prof. Lynne Taylor and Alfred Rumondor, Purdue University