Embed Size (px)
Citation preview
Physician Compensation Trends and Models
Boyd P. Murayama, MBA CPC CPC-I
1
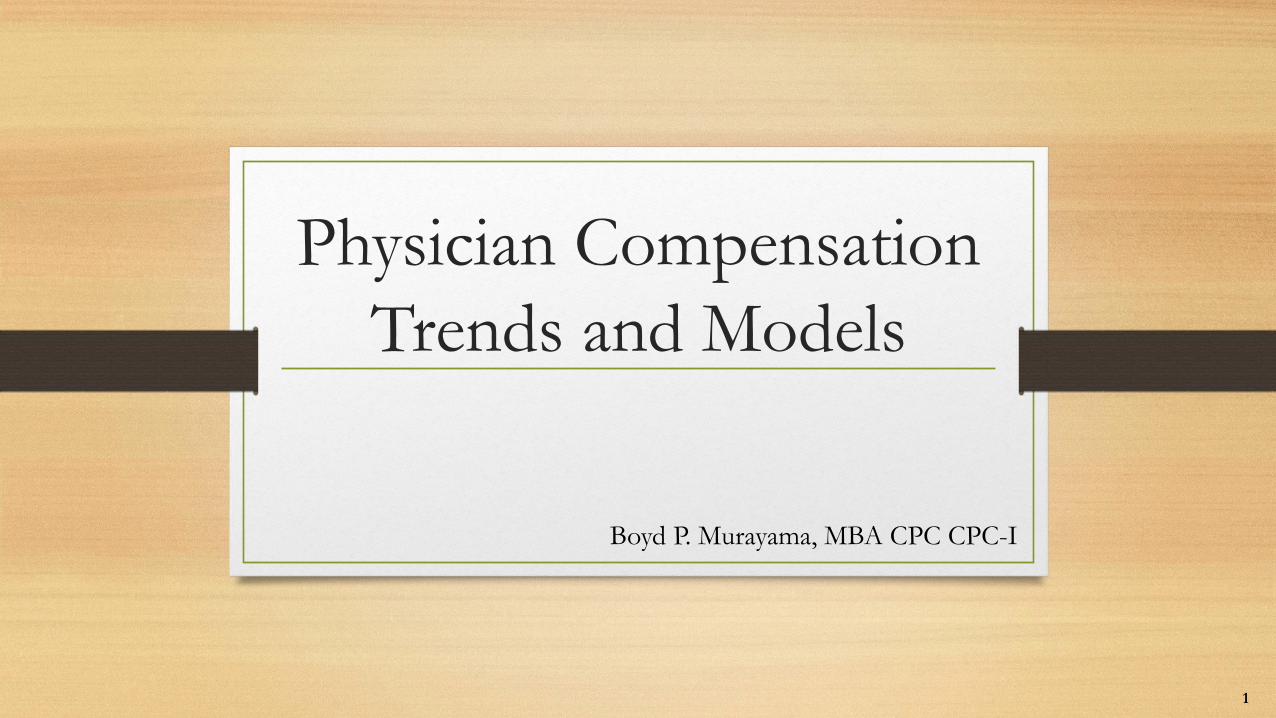
Road Map
KEY TAKEAWAYS
EXPLORE COMPENSATION
MODELS
EMPLOYMENT TRENDS
OUR WORLD IS CHANGING
2

OUR WORLD IS CHANGING
Road Map
3
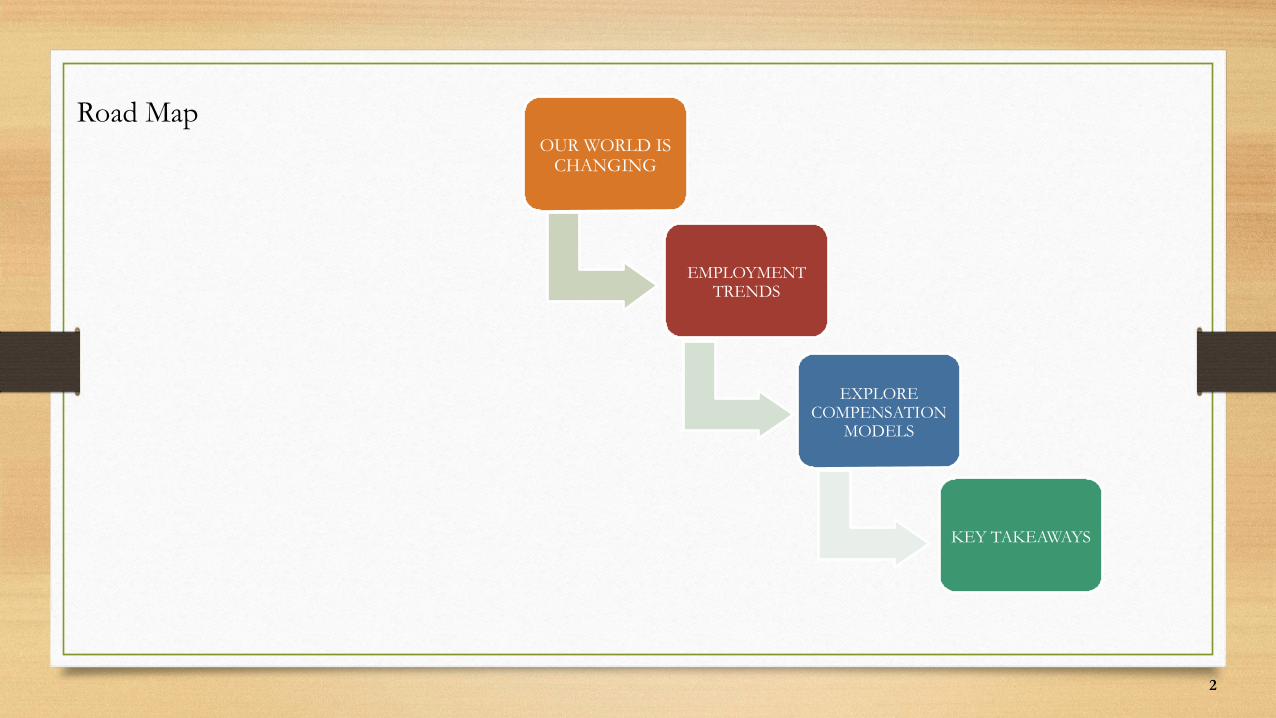
Market Forces Continue to Threaten Status Quo
All Purchasers Looking to Curb Spending
GOVERNMENT
Site neutrality provision receiving attention
Value-based payment heightening performance pressure
Medicare doubling down on risk
1
EMPLOYERS
Continued expansion of high deductibles, narrow networks
Self-insured employers focusing on utilization control
Sustained adoption of private exchanges
2
CONSUMERS
Continued premium sensitivity on exchanges
Price sensitivity increasing at point of care
3
4
No End in Sight
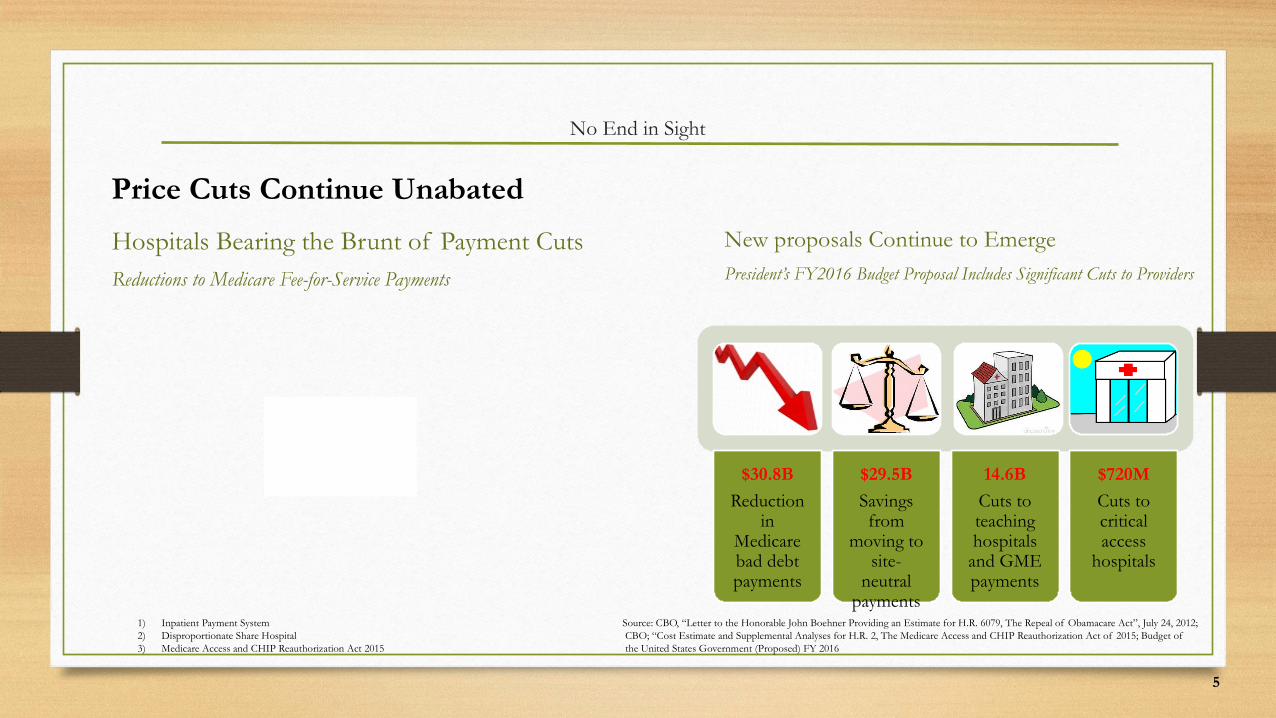
Hospitals Bearing the Brunt of Payment CutsReductions to Medicare Fee-for-Service Payments
New proposals Continue to EmergePresident’s FY2016 Budget Proposal Includes Significant Cuts to Providers
$30.8B
Reduction in
Medicare bad debt payments
$29.5B
Savings from
moving to site-
neutral payments
14.6B
Cuts to teaching hospitals
and GME payments
$720M
Cuts to critical access
hospitals
Price Cuts Continue Unabated
Source: CBO, “Letter to the Honorable John Boehner Providing an Estimate for H.R. 6079, The Repeal of Obamacare Act”, July 24, 2012; CBO; “Cost Estimate and Supplemental Analyses for H.R. 2, The Medicare Access and CHIP Reauthorization Act of 2015; Budget of the United States Government (Proposed) FY 2016
1) Inpatient Payment System2) Disproportionate Share Hospital3) Medicare Access and CHIP Reauthorization Act 2015
5
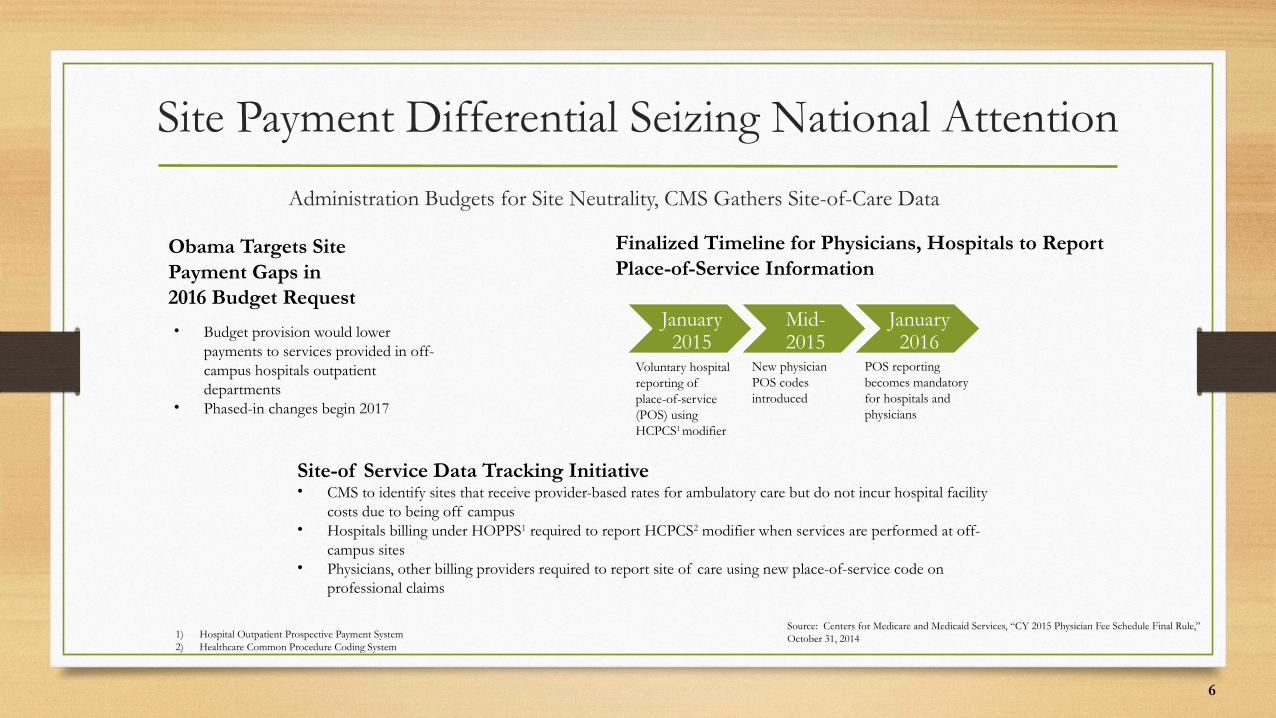
Site Payment Differential Seizing National Attention
Administration Budgets for Site Neutrality, CMS Gathers Site-of-Care Data
Obama Targets SitePayment Gaps in 2016 Budget Request
Finalized Timeline for Physicians, Hospitals to ReportPlace-of-Service Information
• Budget provision would lower payments to services provided in off-campus hospitals outpatient departments
• Phased-in changes begin 2017
Site-of Service Data Tracking Initiative• CMS to identify sites that receive provider-based rates for ambulatory care but do not incur hospital facility
costs due to being off campus• Hospitals billing under HOPPS1 required to report HCPCS2 modifier when services are performed at off-
campus sites• Physicians, other billing providers required to report site of care using new place-of-service code on
professional claims
January 2015
Mid-2015
January 2016
Voluntary hospital reporting of place-of-service (POS) using HCPCS1 modifier
New physician POS codes introduced
POS reporting becomes mandatory for hospitals and physicians
1) Hospital Outpatient Prospective Payment System2) Healthcare Common Procedure Coding System
Source: Centers for Medicare and Medicaid Services, “CY 2015 Physician Fee Schedule Final Rule,”October 31, 2014
6
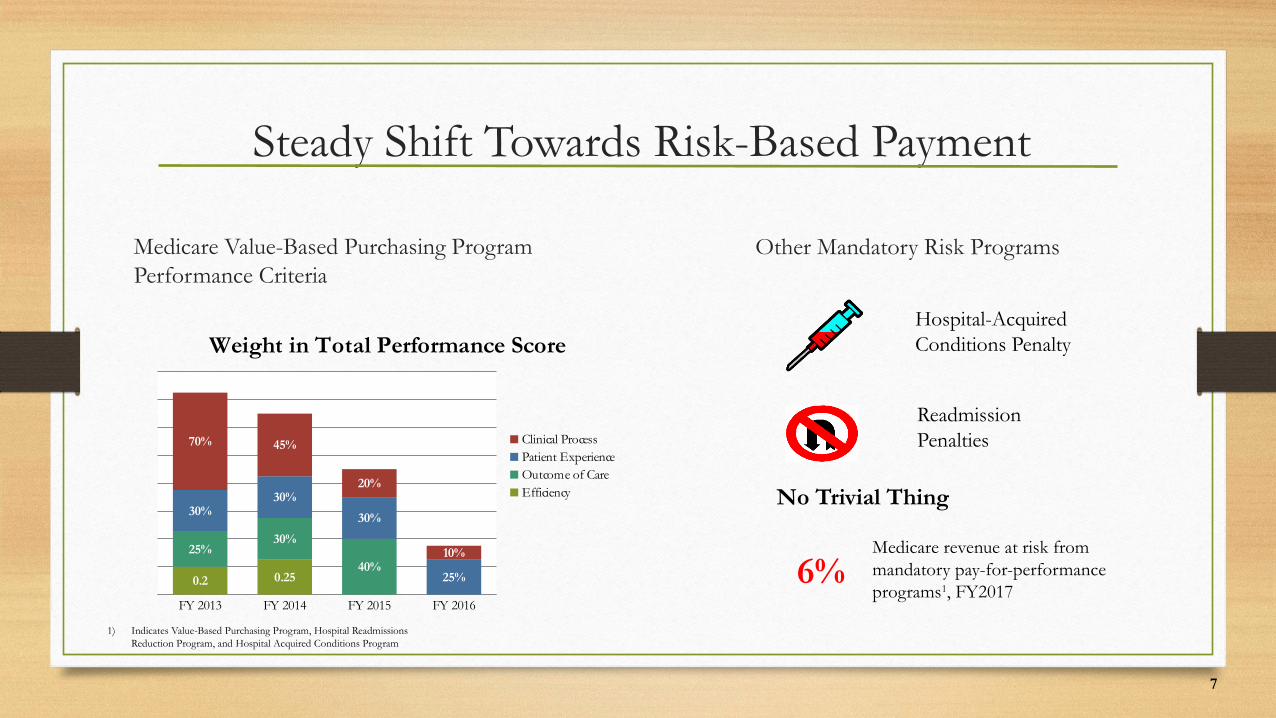
Steady Shift Towards Risk-Based Payment
Medicare Value-Based Purchasing Program Performance Criteria
Other Mandatory Risk Programs
Hospital-Acquired Conditions Penalty
Readmission Penalties
No Trivial Thing
6%Medicare revenue at risk from mandatory pay-for-performance programs1, FY2017
1) Indicates Value-Based Purchasing Program, Hospital Readmissions Reduction Program, and Hospital Acquired Conditions Program
FY 2013 FY 2014 FY 2015 FY 2016
0.2 0.25
25%30%
40%
30%30%
30%
25%
70% 45%
20%
10%
Weight in Total Performance Score
Clinical ProcessPatient ExperienceOutcome of CareEfficiency
7
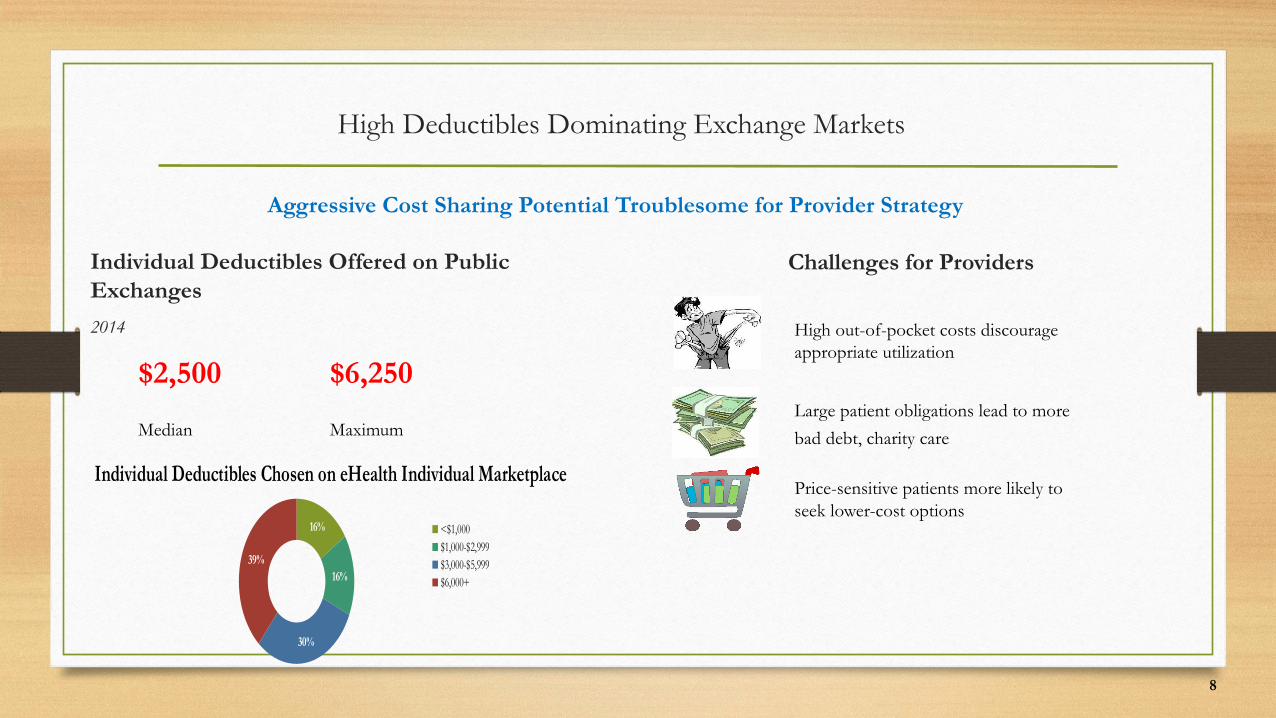
High Deductibles Dominating Exchange Markets
Individual Deductibles Offered on Public Exchanges
2014
$2,500 $6,250
Median Maximum
Challenges for Providers
High out-of-pocket costs discourageappropriate utilization
Large patient obligations lead to more
bad debt, charity care
Price-sensitive patients more likely to seek lower-cost options
Aggressive Cost Sharing Potential Troublesome for Provider Strategy
16%
16%
30%
39%
Individual Deductibles Chosen on eHealth Individual Marketplace
<$1,000$1,000-$2,999$3,000-$5,999$6,000+
8
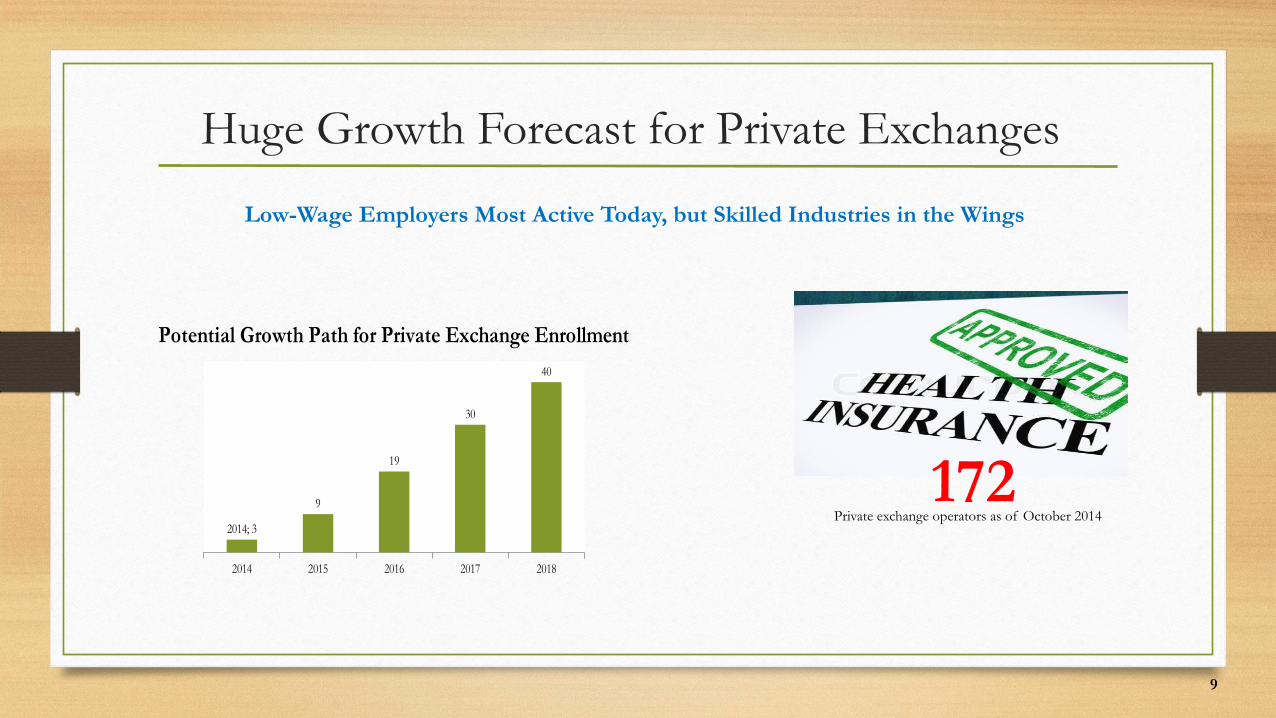
Huge Growth Forecast for Private Exchanges
Low-Wage Employers Most Active Today, but Skilled Industries in the Wings
Private exchange operators as of October 2014172
2014 2015 2016 2017 2018
2014; 3
9
19
30
40
Potential Growth Path for Private Exchange Enrollment
9
10
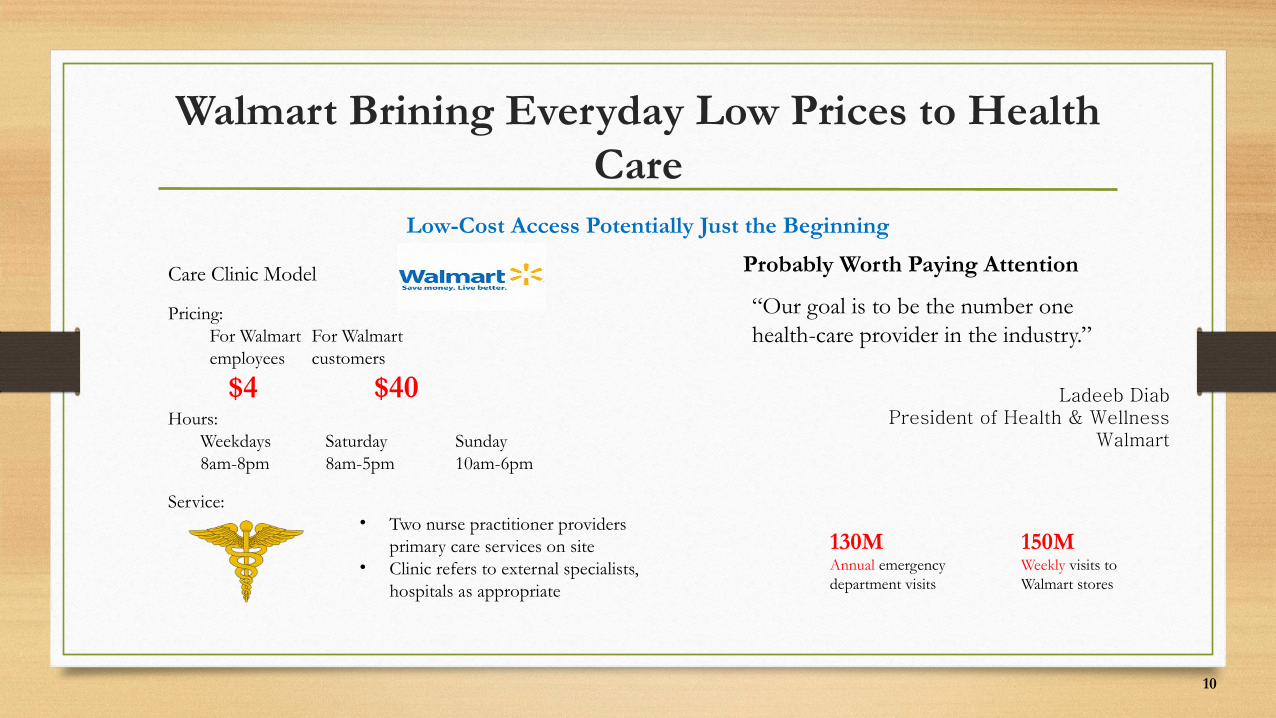
Walmart Brining Everyday Low Prices to Health Care
Low-Cost Access Potentially Just the Beginning
Care Clinic Model
Pricing: For Walmart For Walmart employees customers
Hours: Weekdays Saturday Sunday 8am-8pm 8am-5pm 10am-6pm
Service:• Two nurse practitioner providers
primary care services on site • Clinic refers to external specialists,
hospitals as appropriate
$4 $40
Probably Worth Paying Attention
“Our goal is to be the number one health-care provider in the industry.”
Ladeeb DiabPresident of Health & Wellness
Walmart
130MAnnual emergency department visits
150MWeekly visits to Walmart stores
11
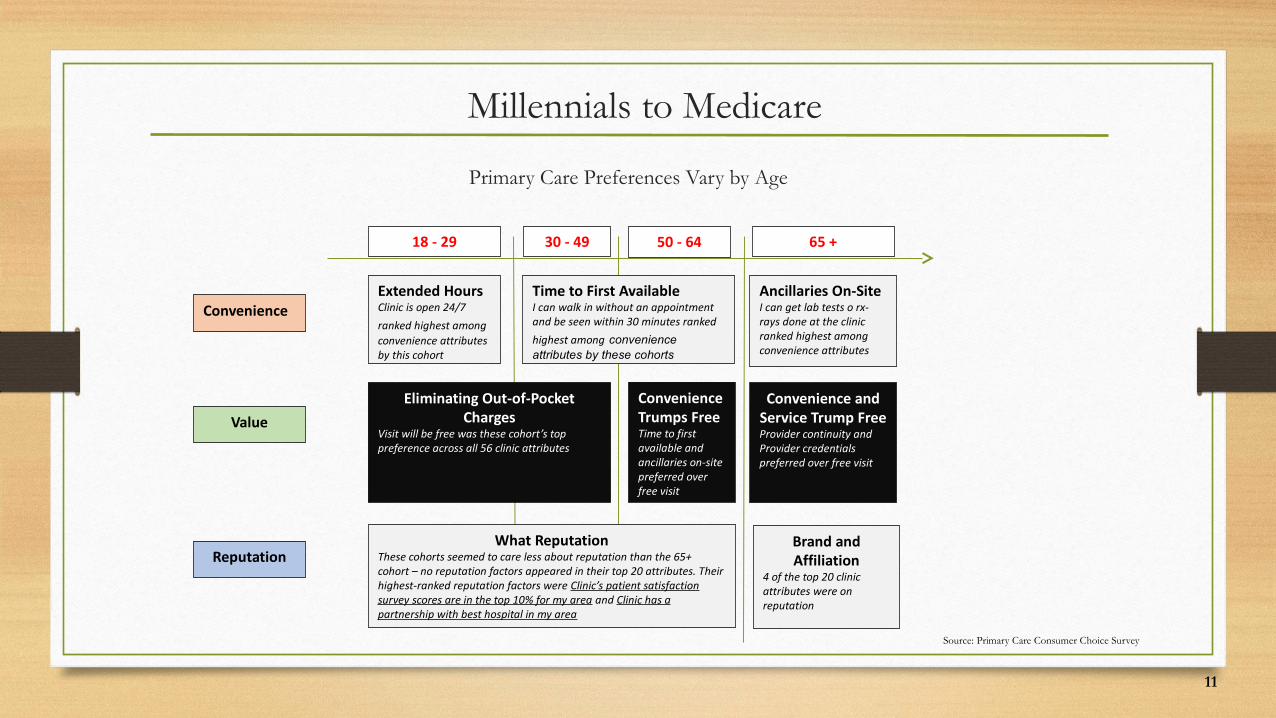
Millennials to Medicare
Primary Care Preferences Vary by Age
Extended HoursClinic is open 24/7 ranked highest among convenience attributes by this cohort
Time to First AvailableI can walk in without an appointment and be seen within 30 minutes ranked highest among convenience attributes by these cohorts
Ancillaries On-SiteI can get lab tests o rx-rays done at the clinic ranked highest among convenience attributes
Eliminating Out-of-Pocket Charges
Visit will be free was these cohort’s top preference across all 56 clinic attributes
Convenience Trumps FreeTime to first available and ancillaries on-site preferred over free visit
Convenience and Service Trump FreeProvider continuity and Provider credentials preferred over free visit
What ReputationThese cohorts seemed to care less about reputation than the 65+ cohort – no reputation factors appeared in their top 20 attributes. Their highest-ranked reputation factors were Clinic’s patient satisfaction survey scores are in the top 10% for my area and Clinic has a partnership with best hospital in my area
Brand and Affiliation
4 of the top 20 clinic attributes were on reputation
18 - 29 30 - 49 50 - 64 65 +
Convenience
Value
Reputation
Source: Primary Care Consumer Choice Survey

EMPLOYMENT TRENDS
Road Map
12
13
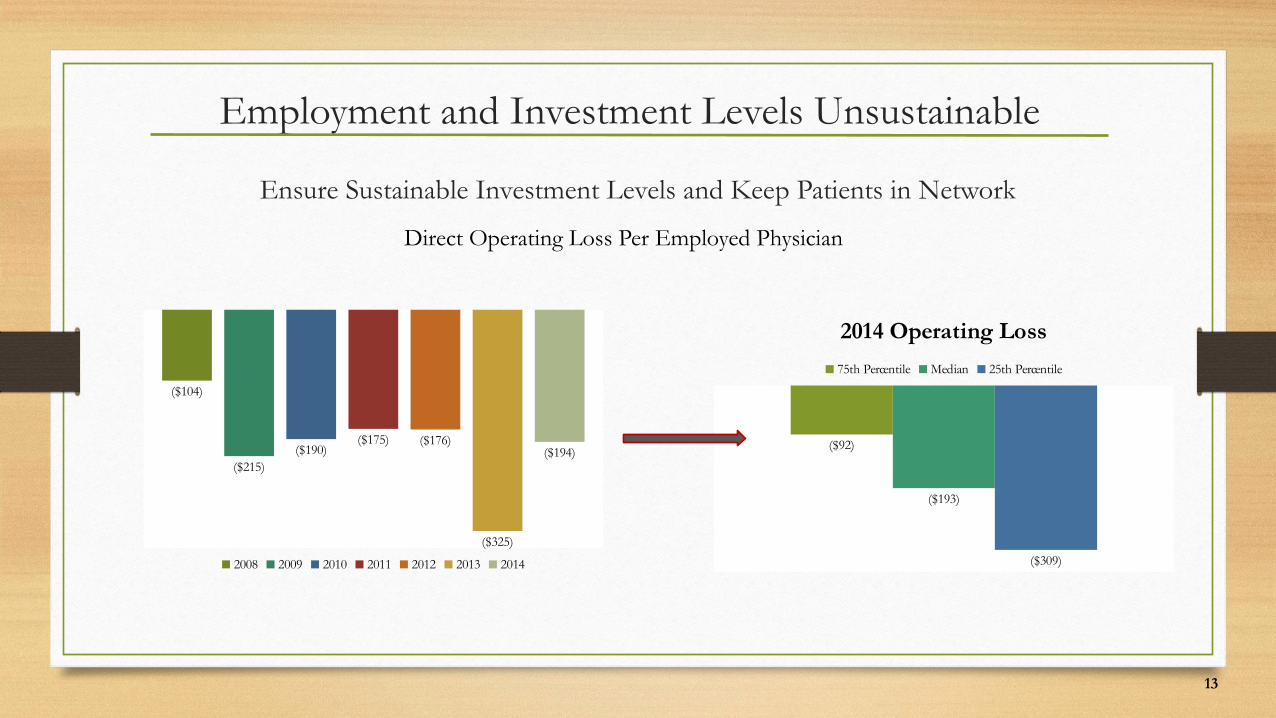
Employment and Investment Levels Unsustainable
Ensure Sustainable Investment Levels and Keep Patients in Network
Direct Operating Loss Per Employed Physician
($104)
($215)($190)
($175) ($176)
($325)
($194)
2008 2009 2010 2011 2012 2013 2014
($92)
($193)
($309)
2014 Operating Loss
75th Percentile Median 25th Percentile
14
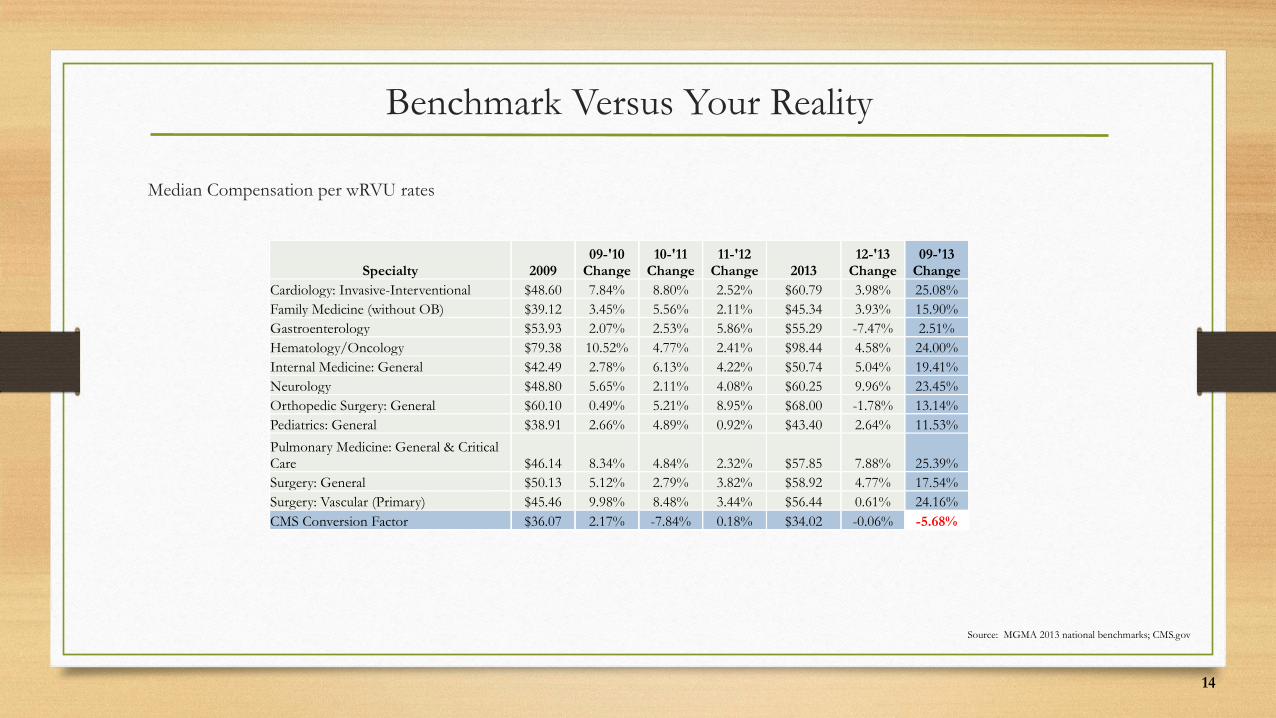
Benchmark Versus Your Reality
Median Compensation per wRVU rates
Specialty 200909-'10
Change10-'11
Change11-'12
Change 201312-'13
Change09-'13
ChangeCardiology: Invasive-Interventional $48.60 7.84% 8.80% 2.52% $60.79 3.98% 25.08%Family Medicine (without OB) $39.12 3.45% 5.56% 2.11% $45.34 3.93% 15.90%Gastroenterology $53.93 2.07% 2.53% 5.86% $55.29 -7.47% 2.51%Hematology/Oncology $79.38 10.52% 4.77% 2.41% $98.44 4.58% 24.00%Internal Medicine: General $42.49 2.78% 6.13% 4.22% $50.74 5.04% 19.41%Neurology $48.80 5.65% 2.11% 4.08% $60.25 9.96% 23.45%Orthopedic Surgery: General $60.10 0.49% 5.21% 8.95% $68.00 -1.78% 13.14%Pediatrics: General $38.91 2.66% 4.89% 0.92% $43.40 2.64% 11.53%
Pulmonary Medicine: General & Critical Care $46.14 8.34% 4.84% 2.32% $57.85 7.88% 25.39%Surgery: General $50.13 5.12% 2.79% 3.82% $58.92 4.77% 17.54%Surgery: Vascular (Primary) $45.46 9.98% 8.48% 3.44% $56.44 0.61% 24.16%CMS Conversion Factor $36.07 2.17% -7.84% 0.18% $34.02 -0.06% -5.68%
Source: MGMA 2013 national benchmarks; CMS.gov
15
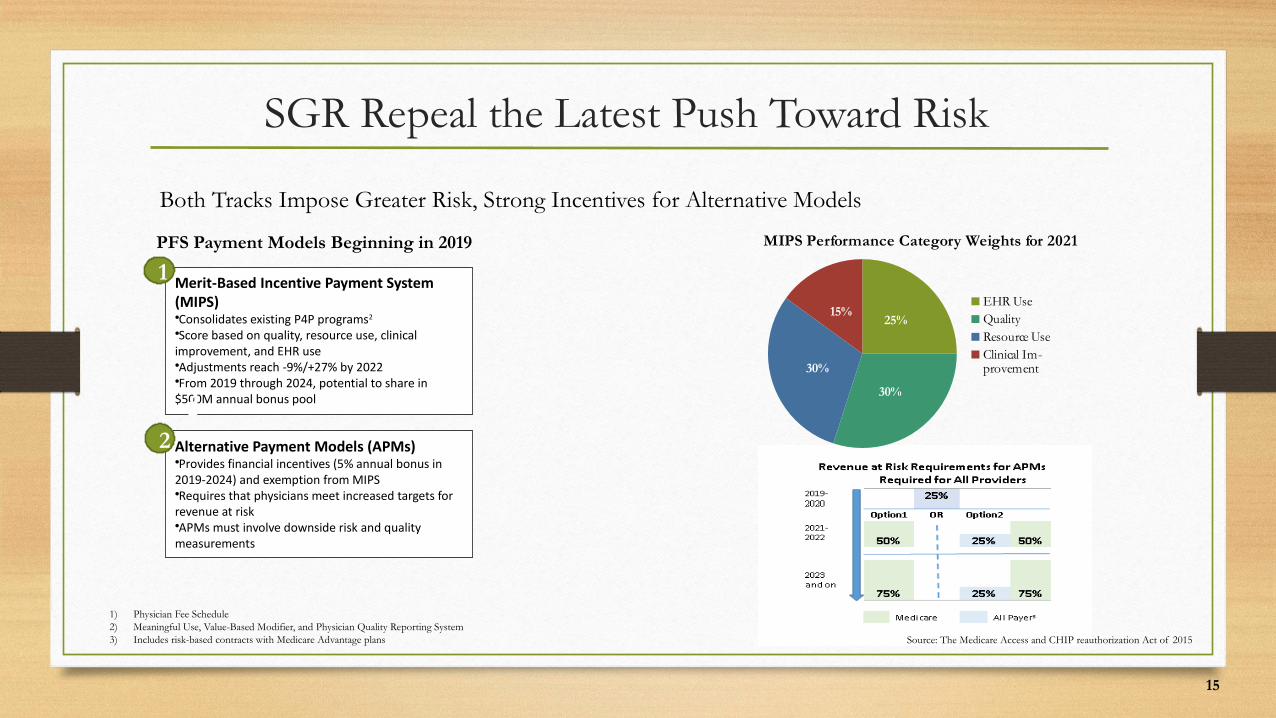
SGR Repeal the Latest Push Toward Risk
Both Tracks Impose Greater Risk, Strong Incentives for Alternative Models
Merit-Based Incentive Payment System (MIPS)•Consolidates existing P4P programs2
•Score based on quality, resource use, clinical improvement, and EHR use•Adjustments reach -9%/+27% by 2022•From 2019 through 2024, potential to share in $500M annual bonus pool
1
1
Alternative Payment Models (APMs)•Provides financial incentives (5% annual bonus in 2019-2024) and exemption from MIPS•Requires that physicians meet increased targets for revenue at risk•APMs must involve downside risk and quality measurements
22
PFS Payment Models Beginning in 2019
25%
30%
30%
15%
MIPS Performance Category Weights for 2021
EHR UseQualityResource UseClinical Im-provement
1) Physician Fee Schedule2) Meaningful Use, Value-Based Modifier, and Physician Quality Reporting System3) Includes risk-based contracts with Medicare Advantage plans Source: The Medicare Access and CHIP reauthorization Act of 2015

Road Map
EXPLORE COMPENSATION
MODELS
16
17
An Uphill Battle
Compensation Change Elicits Strong Feelings on All Sides
It Takes An Expert
“Anyone who can settle the issue of fairand appropriate physician compensationto everyone’s satisfaction within a diverseGroup of doctors should then go to the Middle East and settle their affairs.”
Watch Your Back
“When compensation redesign is donewrong, it’s career ending …. While wewere going through these changeswith our physicians, I was so scared I should have had a dog sniff my car atthe end of the day.”
18
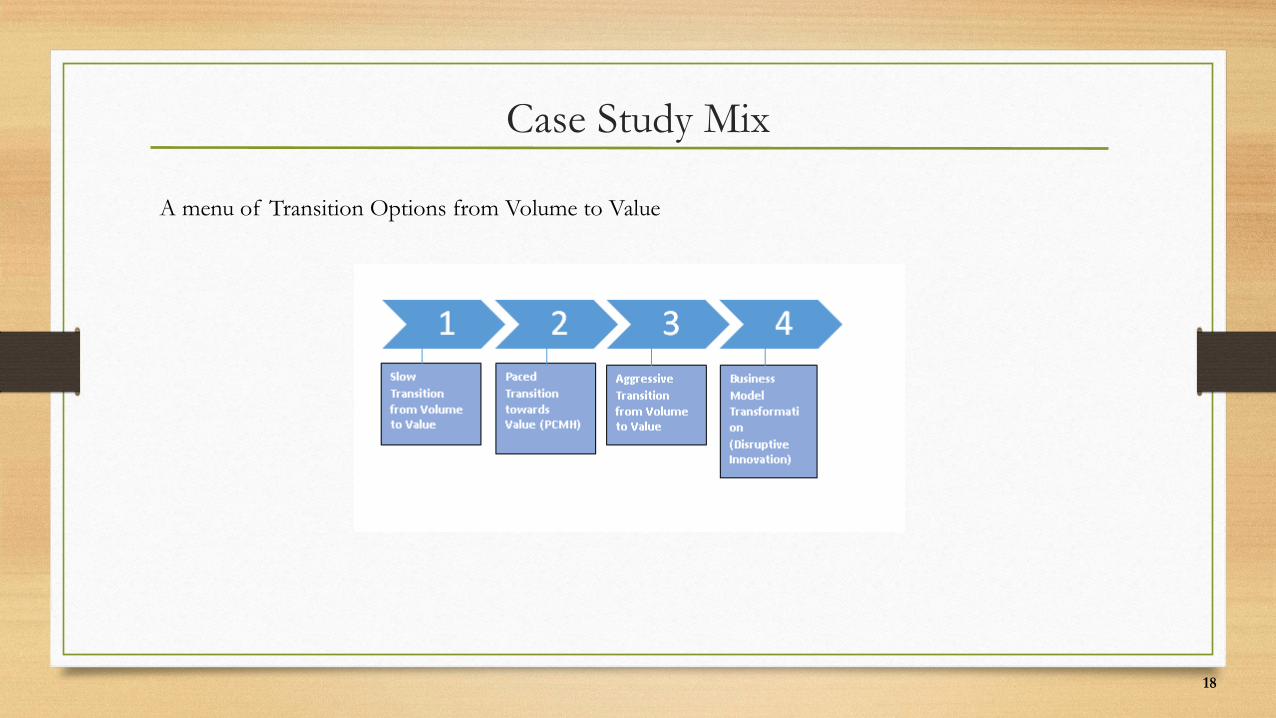
Case Study Mix
A menu of Transition Options from Volume to Value
19
Case Study #1University Health System and Faculty Plan
Physicians compensated via base salary and limited productivity incentives
Difficult to retain and recruit, losing high producers
Compensation model design and implementation
20
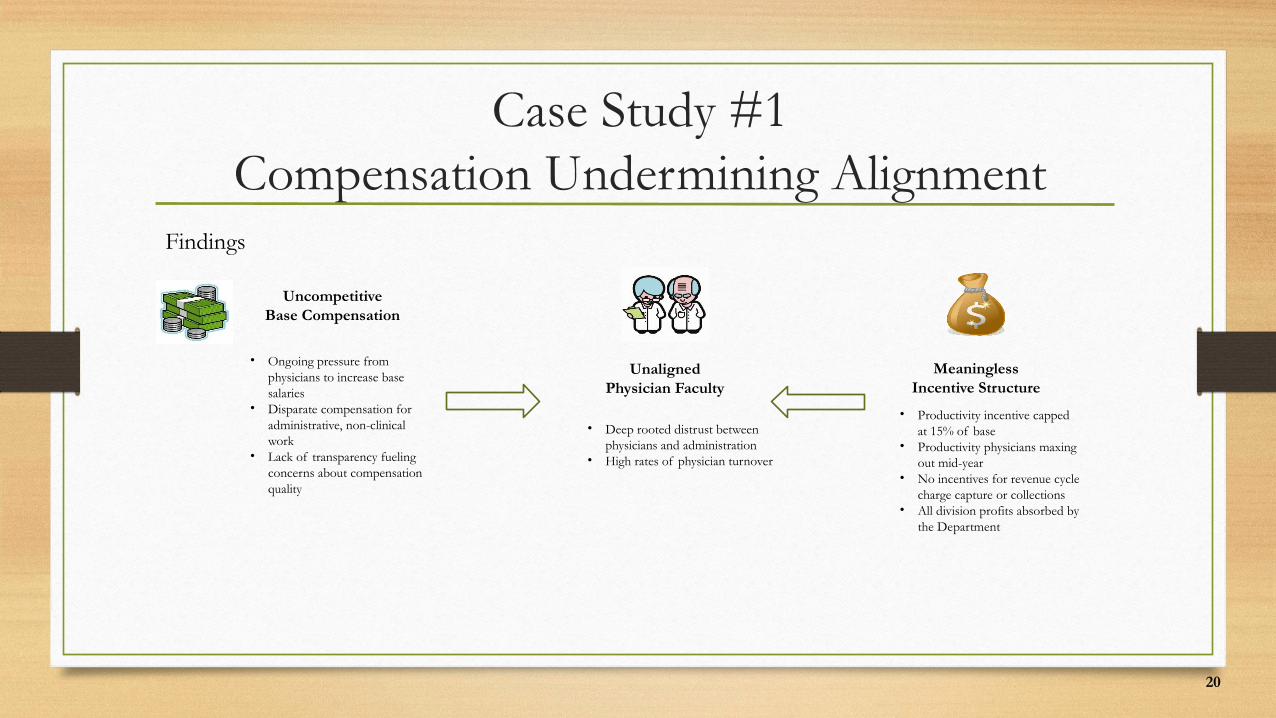
Case Study #1Compensation Undermining Alignment
Findings
UncompetitiveBase Compensation
• Ongoing pressure from physicians to increase base salaries
• Disparate compensation for administrative, non-clinical work
• Lack of transparency fueling concerns about compensation quality
UnalignedPhysician Faculty
• Deep rooted distrust between physicians and administration
• High rates of physician turnover
MeaninglessIncentive Structure
• Productivity incentive capped at 15% of base
• Productivity physicians maxing out mid-year
• No incentives for revenue cycle charge capture or collections
• All division profits absorbed by the Department
21
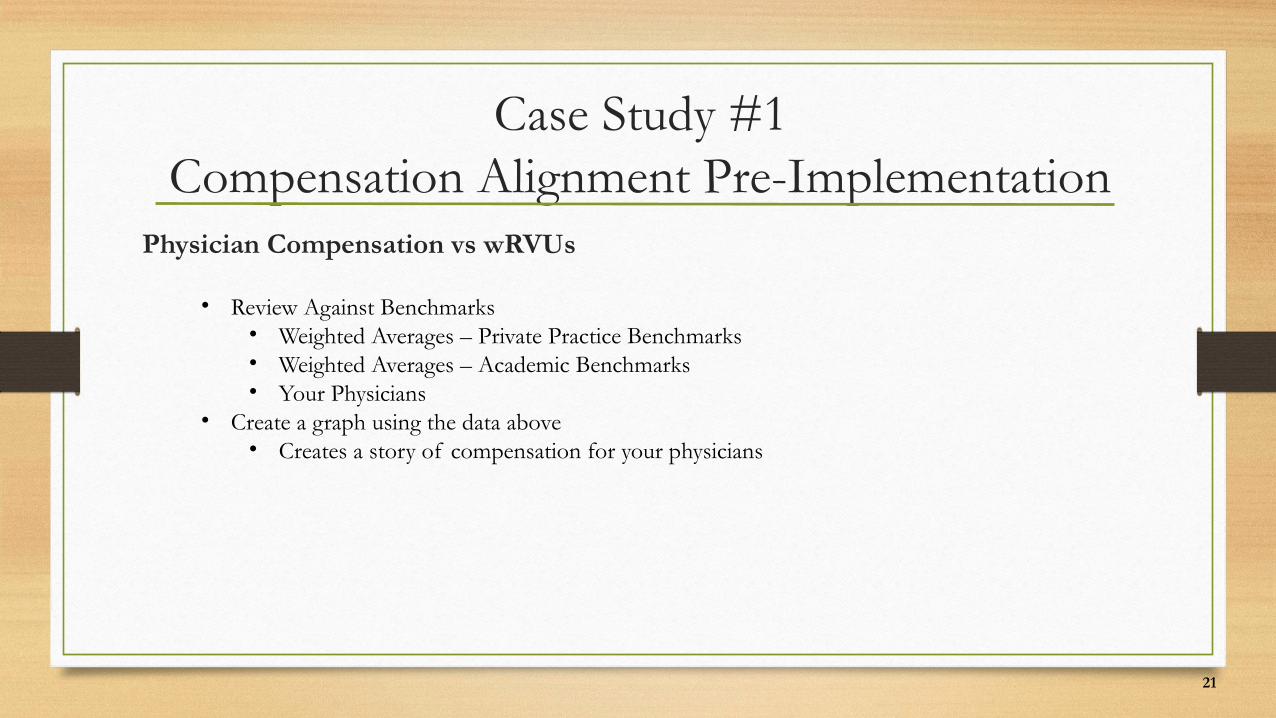
Case Study #1Compensation Alignment Pre-Implementation
Physician Compensation vs wRVUs
• Review Against Benchmarks• Weighted Averages – Private Practice Benchmarks• Weighted Averages – Academic Benchmarks• Your Physicians
• Create a graph using the data above• Creates a story of compensation for your physicians
22
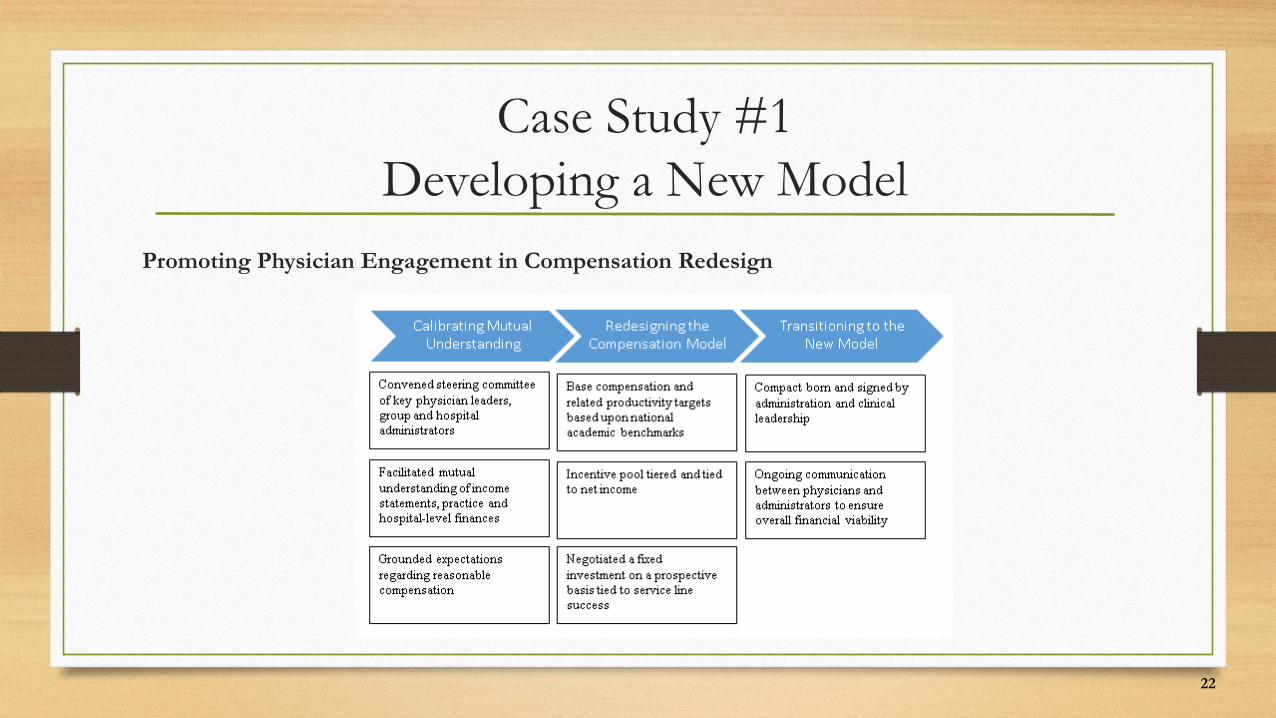
Case Study #1Developing a New Model
Promoting Physician Engagement in Compensation Redesign
23
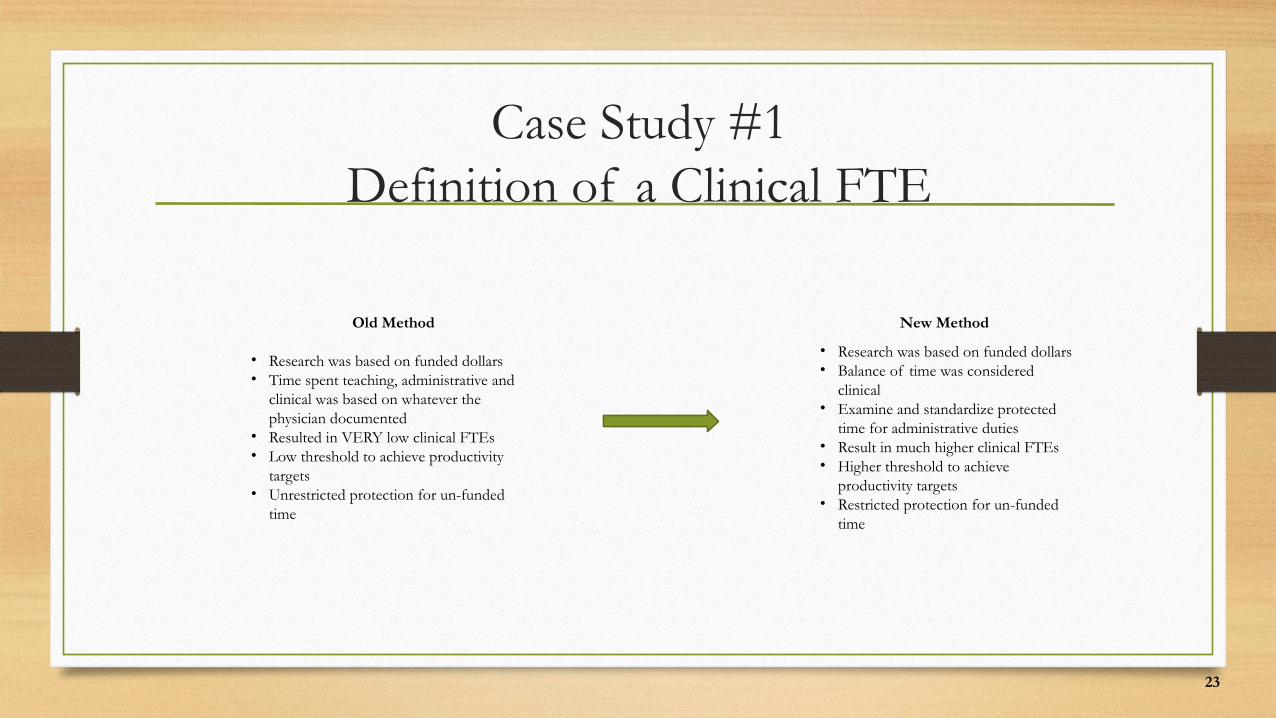
Case Study #1Definition of a Clinical FTE
Old Method
• Research was based on funded dollars• Time spent teaching, administrative and
clinical was based on whatever the physician documented
• Resulted in VERY low clinical FTEs• Low threshold to achieve productivity
targets• Unrestricted protection for un-funded
time
New Method
• Research was based on funded dollars• Balance of time was considered
clinical• Examine and standardize protected
time for administrative duties• Result in much higher clinical FTEs• Higher threshold to achieve
productivity targets• Restricted protection for un-funded
time
24
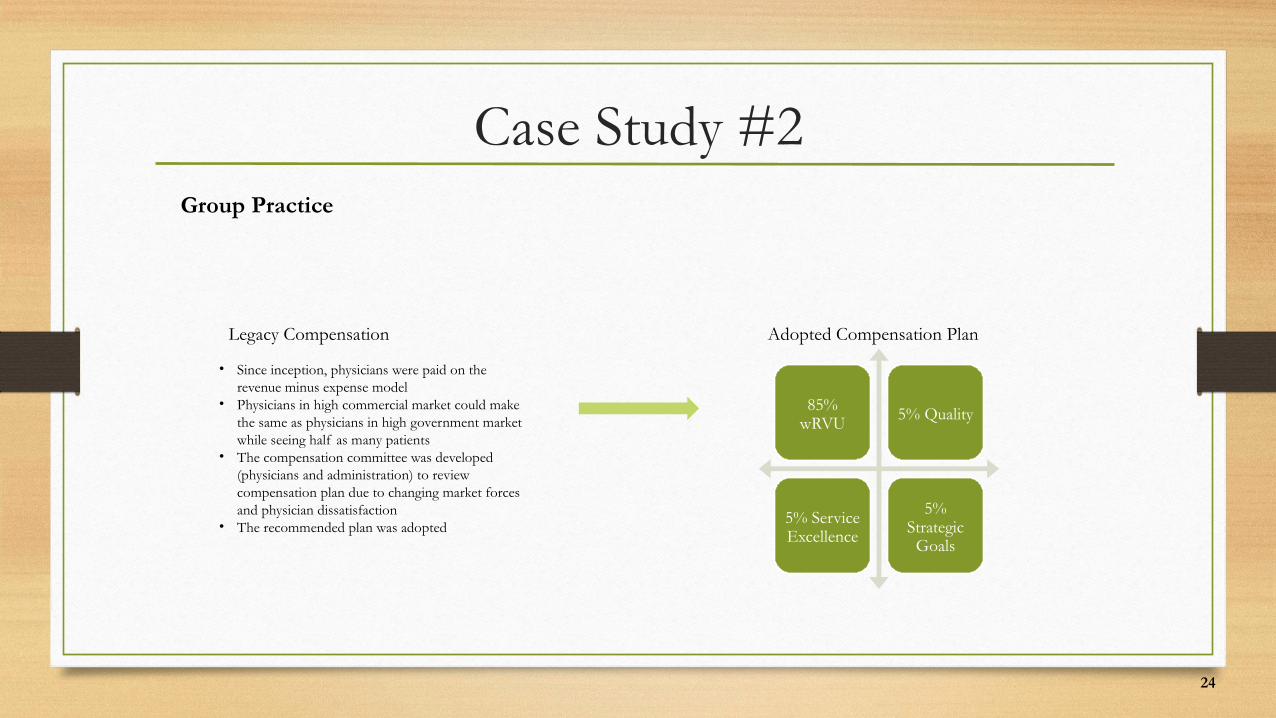
Case Study #2Group Practice
Legacy Compensation
• Since inception, physicians were paid on the revenue minus expense model
• Physicians in high commercial market could make the same as physicians in high government market while seeing half as many patients
• The compensation committee was developed (physicians and administration) to review compensation plan due to changing market forces and physician dissatisfaction
• The recommended plan was adopted
Adopted Compensation Plan
85% wRVU 5% Quality
5% Service Excellence
5% Strategic
Goals

25
Case Study #2Group Practice
Productivity
• 85% of the conversion factor times the number of RVUs
• Reconciled quarterly based on year-to-date productivity level
Service Excellence
• The metric used in this case is patient experience
• Scoring: If 95% or above (5% comp), 90-94.9% (3% comp), 85-89.9% (1% comp), <85% (0% comp)
Quality
• Specialty specific. Each specialty is measured on the least 2 metrics which will be approved by the Clinical Quality Committee
• Scoring: 2 metrics met (5% comp), 1 metric met (2.5% comp), 0 metrics met (0% comp)
Strategic Goals
Metrics used in this include:• Expense Management (2%)• Patient Access (2%)• Culture of Collegiality (1%)
26
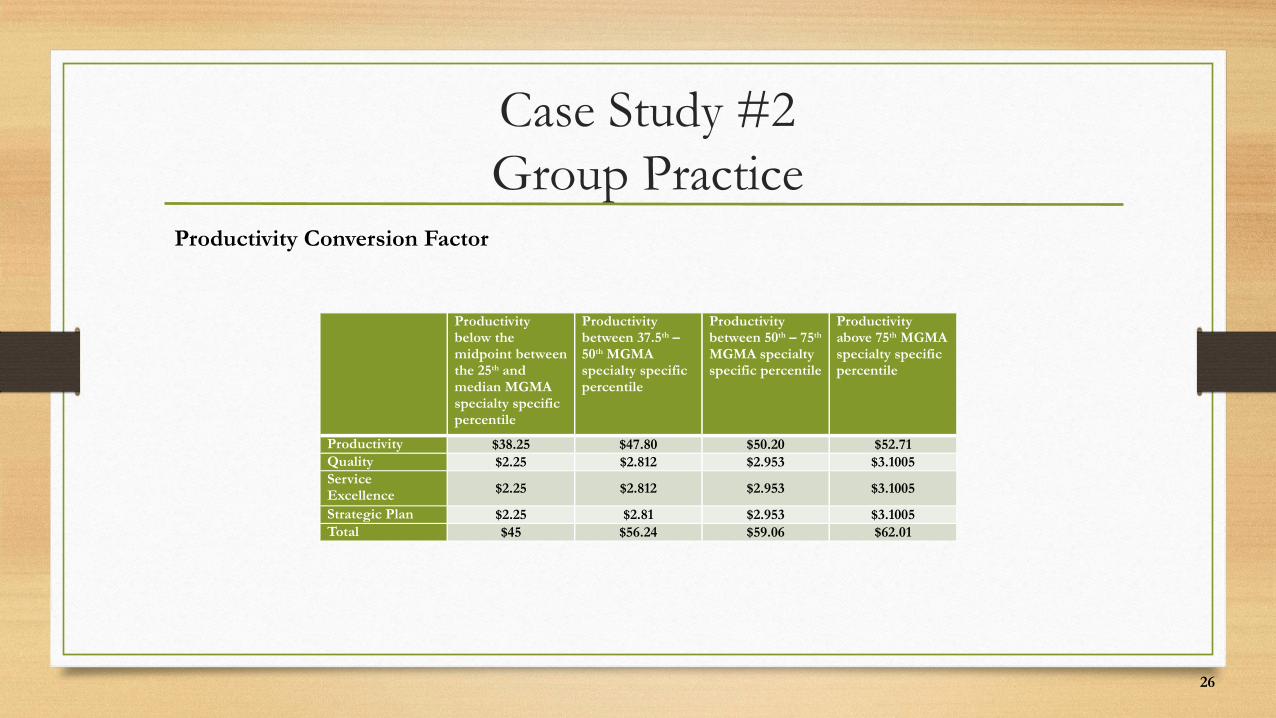
Case Study #2Group Practice
Productivity Conversion Factor
Productivity below the midpoint between the 25th and median MGMA specialty specific percentile
Productivity between 37.5th – 50th MGMA specialty specific percentile
Productivity between 50th – 75th MGMA specialty specific percentile
Productivity above 75th MGMA specialty specific percentile
Productivity $38.25 $47.80 $50.20 $52.71Quality $2.25 $2.812 $2.953 $3.1005Service Excellence $2.25 $2.812 $2.953 $3.1005
Strategic Plan $2.25 $2.81 $2.953 $3.1005Total $45 $56.24 $59.06 $62.01
27
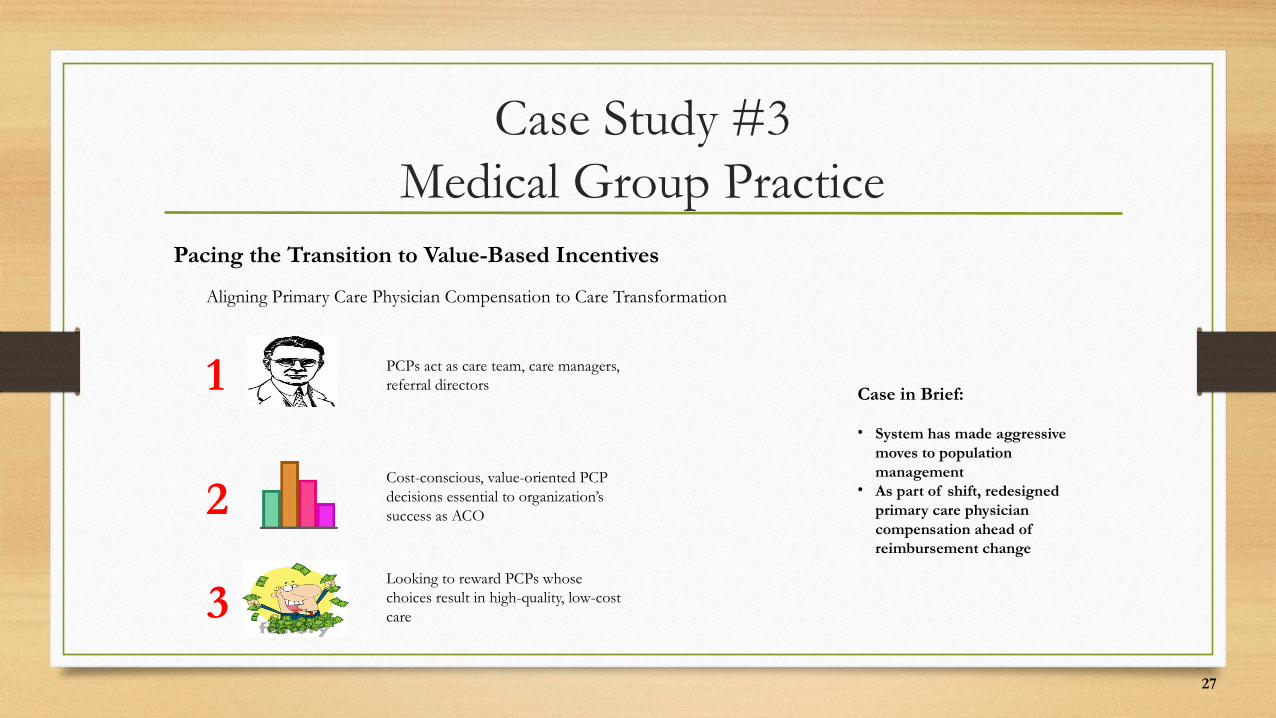
Case Study #3Medical Group Practice
Pacing the Transition to Value-Based Incentives
Aligning Primary Care Physician Compensation to Care Transformation
1 PCPs act as care team, care managers, referral directors
2
3
Cost-conscious, value-oriented PCP decisions essential to organization’s success as ACO
Looking to reward PCPs whose choices result in high-quality, low-cost care
Case in Brief:
• System has made aggressive moves to population management
• As part of shift, redesigned primary care physician compensation ahead of reimbursement change
28
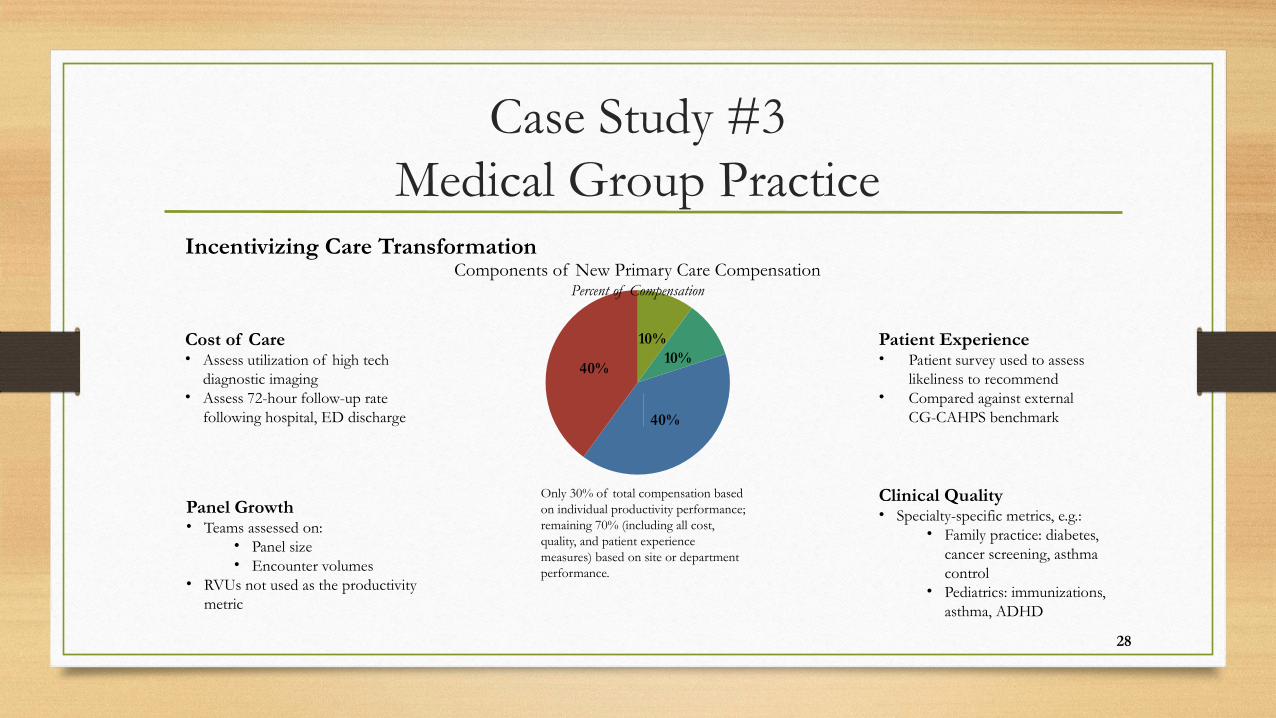
Case Study #3Medical Group Practice
10%10%
40%
40%
Only 30% of total compensation based on individual productivity performance; remaining 70% (including all cost, quality, and patient experience measures) based on site or department performance.
Incentivizing Care TransformationComponents of New Primary Care Compensation
Percent of Compensation
Cost of Care• Assess utilization of high tech
diagnostic imaging• Assess 72-hour follow-up rate
following hospital, ED discharge
Panel Growth• Teams assessed on:
• Panel size• Encounter volumes
• RVUs not used as the productivity metric
Patient Experience• Patient survey used to assess
likeliness to recommend• Compared against external
CG-CAHPS benchmark
Clinical Quality• Specialty-specific metrics, e.g.:
• Family practice: diabetes, cancer screening, asthma control
• Pediatrics: immunizations, asthma, ADHD

KEY TAKEAWAYS
29
Road Map
30
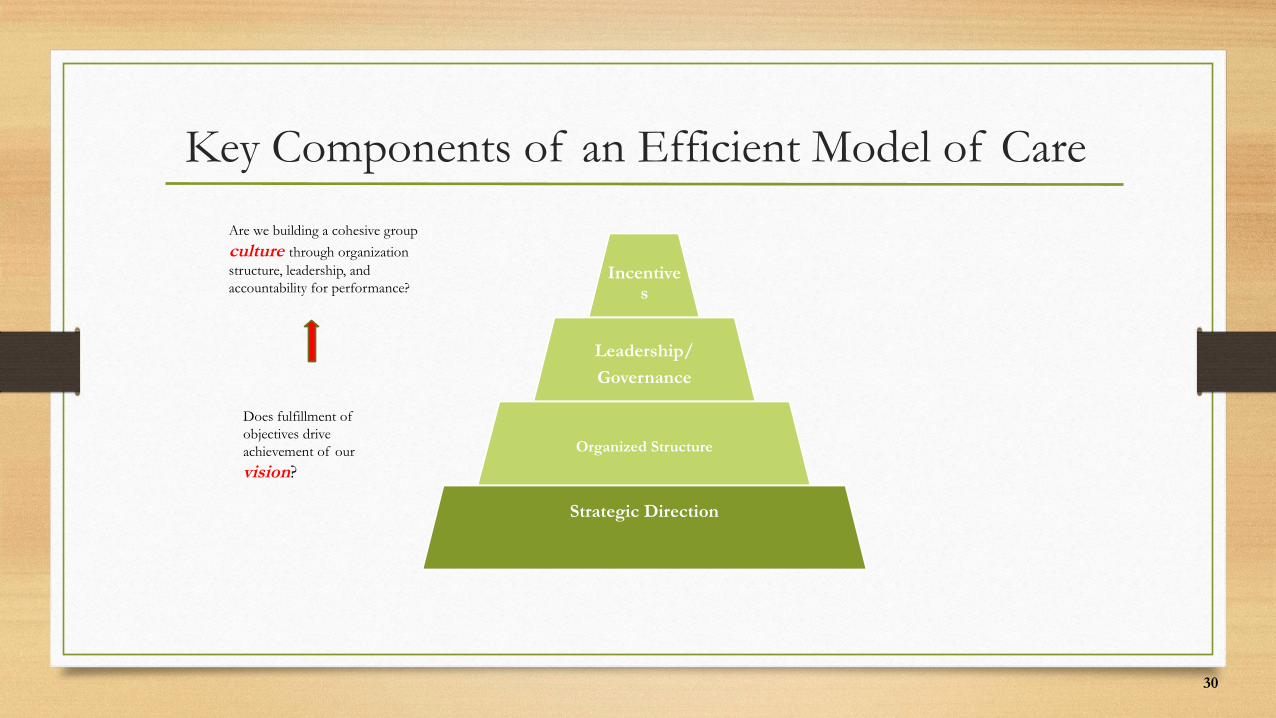
Key Components of an Efficient Model of Care
Are we building a cohesive group
culture through organization structure, leadership, and accountability for performance?
Does fulfillment of objectives drive achievement of our
vision?
Incentives
Leadership/
Governance
Organized Structure
Strategic Direction
31
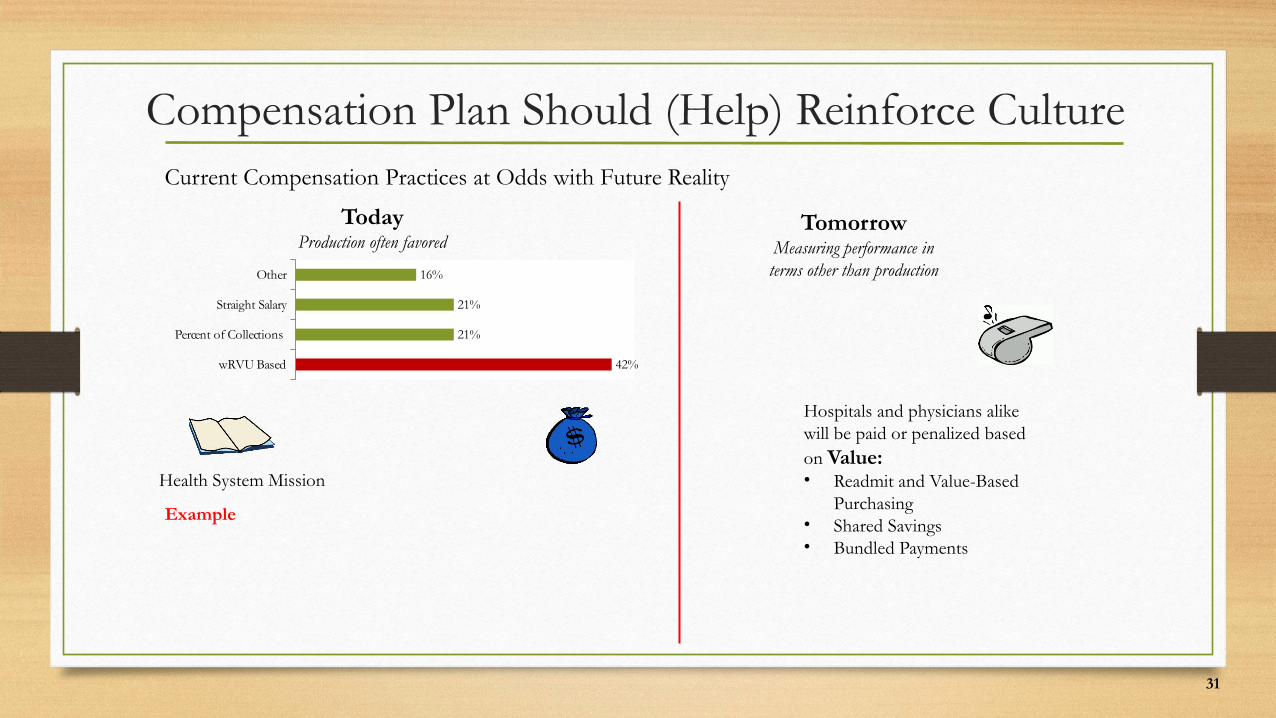
Compensation Plan Should (Help) Reinforce CultureCurrent Compensation Practices at Odds with Future Reality
TodayProduction often favored
TomorrowMeasuring performance in terms other than production
Hospitals and physicians alike will be paid or penalized based on Value:• Readmit and Value-Based
Purchasing• Shared Savings• Bundled Payments
Health System Mission
Example
wRVU Based
Percent of Collections
Straight Salary
Other
42%
21%
21%
16%
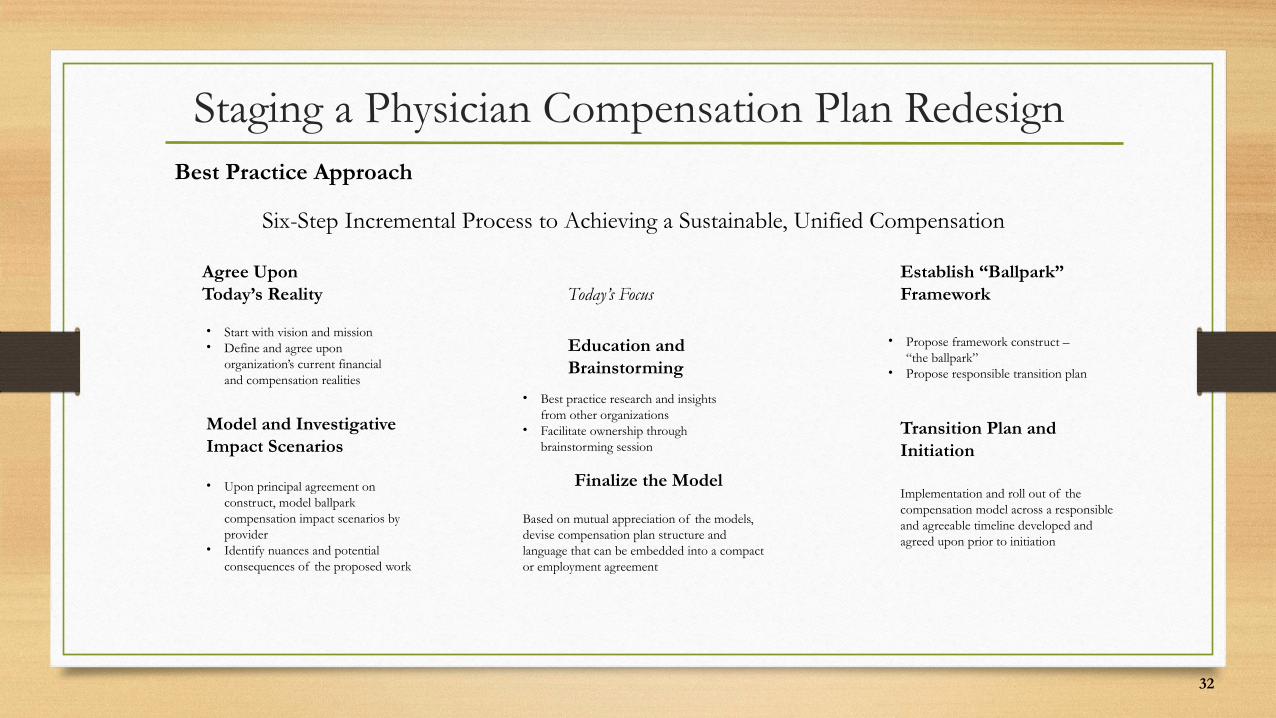
Staging a Physician Compensation Plan RedesignBest Practice Approach
Six-Step Incremental Process to Achieving a Sustainable, Unified Compensation
Today’s FocusAgree Upon Today’s Reality
Education and Brainstorming
Establish “Ballpark” Framework
• Start with vision and mission• Define and agree upon
organization’s current financial and compensation realities
• Best practice research and insights from other organizations
• Facilitate ownership through brainstorming session
• Propose framework construct – “the ballpark”
• Propose responsible transition plan
Model and Investigative Impact Scenarios
Finalize the Model
Transition Plan and Initiation
• Upon principal agreement on construct, model ballpark compensation impact scenarios by provider
• Identify nuances and potential consequences of the proposed work
Based on mutual appreciation of the models, devise compensation plan structure and language that can be embedded into a compact or employment agreement
Implementation and roll out of the compensation model across a responsible and agreeable timeline developed and agreed upon prior to initiation
32
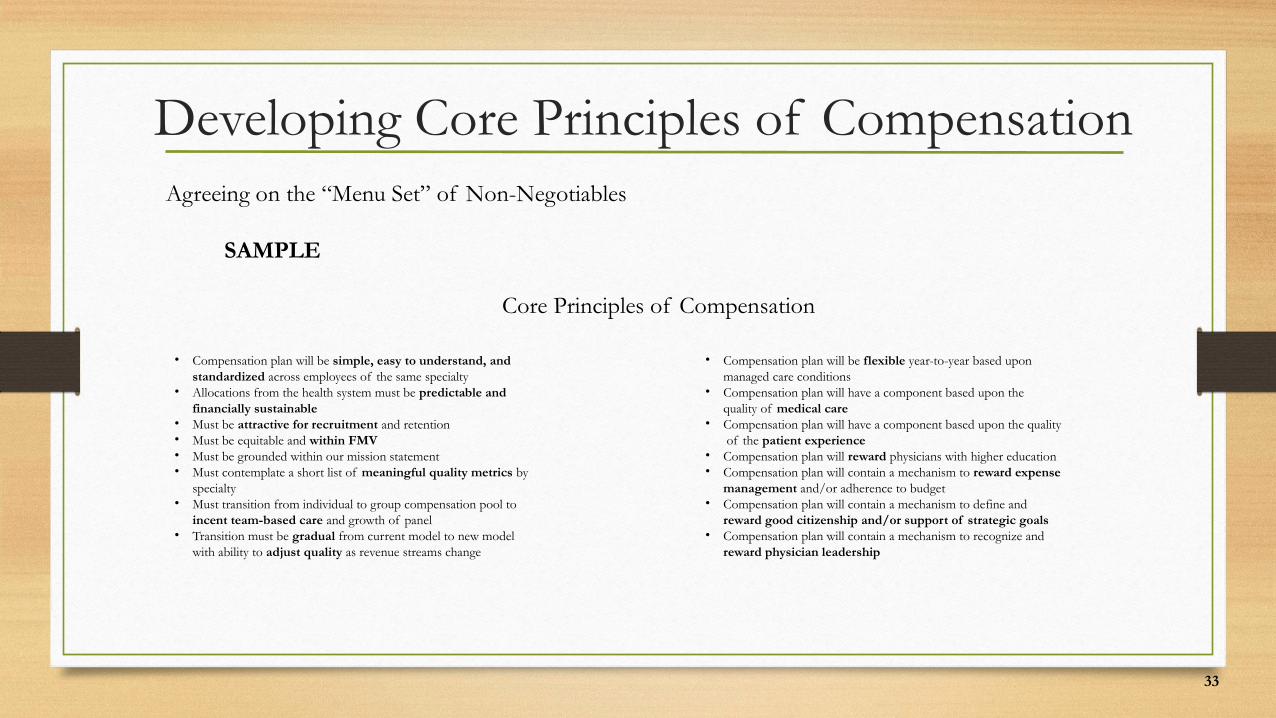
Developing Core Principles of CompensationAgreeing on the “Menu Set” of Non-Negotiables
SAMPLE
Core Principles of Compensation
• Compensation plan will be simple, easy to understand, and standardized across employees of the same specialty
• Allocations from the health system must be predictable and financially sustainable
• Must be attractive for recruitment and retention• Must be equitable and within FMV• Must be grounded within our mission statement• Must contemplate a short list of meaningful quality metrics by
specialty• Must transition from individual to group compensation pool to
incent team-based care and growth of panel• Transition must be gradual from current model to new model
with ability to adjust quality as revenue streams change
• Compensation plan will be flexible year-to-year based upon managed care conditions
• Compensation plan will have a component based upon the quality of medical care
• Compensation plan will have a component based upon the quality of the patient experience
• Compensation plan will reward physicians with higher education• Compensation plan will contain a mechanism to reward expense
management and/or adherence to budget• Compensation plan will contain a mechanism to define and
reward good citizenship and/or support of strategic goals• Compensation plan will contain a mechanism to recognize and
reward physician leadership
33
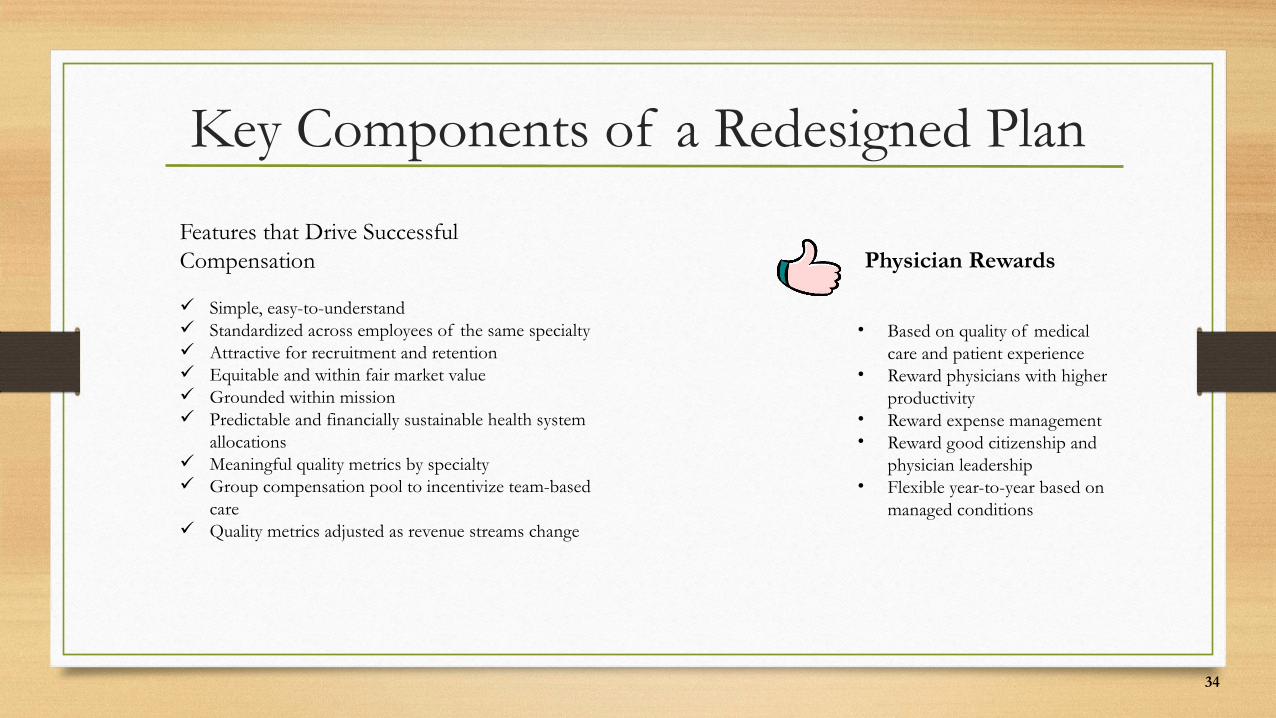
Key Components of a Redesigned Plan
Features that Drive Successful Compensation
Simple, easy-to-understand Standardized across employees of the same specialty Attractive for recruitment and retention Equitable and within fair market value Grounded within mission Predictable and financially sustainable health system
allocations Meaningful quality metrics by specialty Group compensation pool to incentivize team-based
care Quality metrics adjusted as revenue streams change
Physician Rewards
• Based on quality of medical care and patient experience
• Reward physicians with higher productivity
• Reward expense management• Reward good citizenship and
physician leadership• Flexible year-to-year based on
managed conditions
34
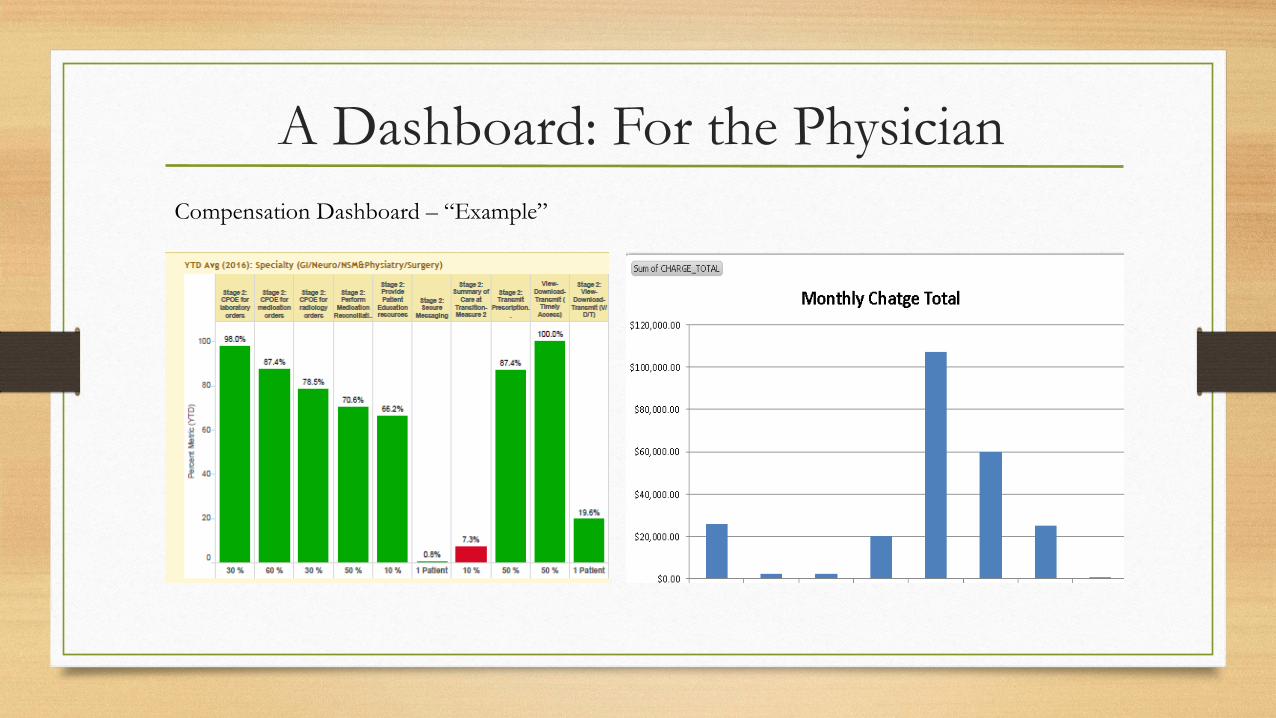
A Dashboard: For the PhysicianCompensation Dashboard – “Example”
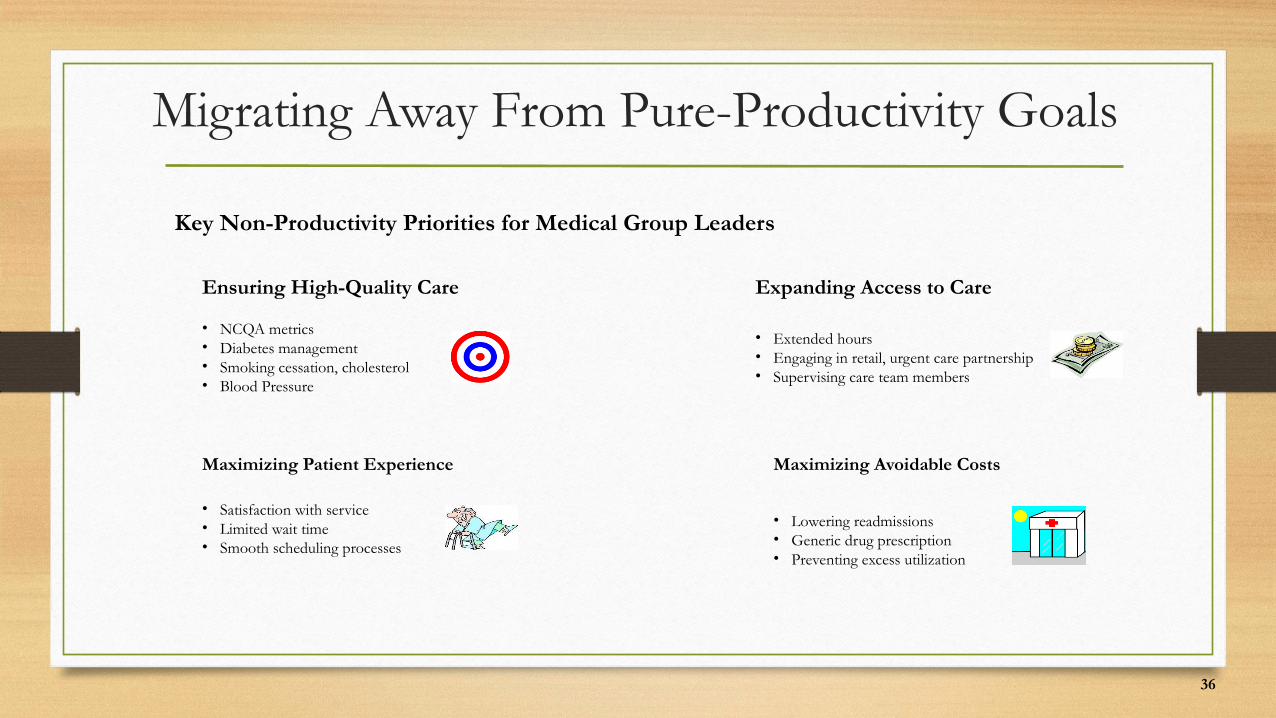
Migrating Away From Pure-Productivity Goals
Key Non-Productivity Priorities for Medical Group Leaders
Ensuring High-Quality Care
• NCQA metrics• Diabetes management• Smoking cessation, cholesterol• Blood Pressure
Expanding Access to Care
• Extended hours• Engaging in retail, urgent care partnership• Supervising care team members
Maximizing Patient Experience
• Satisfaction with service• Limited wait time• Smooth scheduling processes
Maximizing Avoidable Costs
• Lowering readmissions• Generic drug prescription• Preventing excess utilization
36
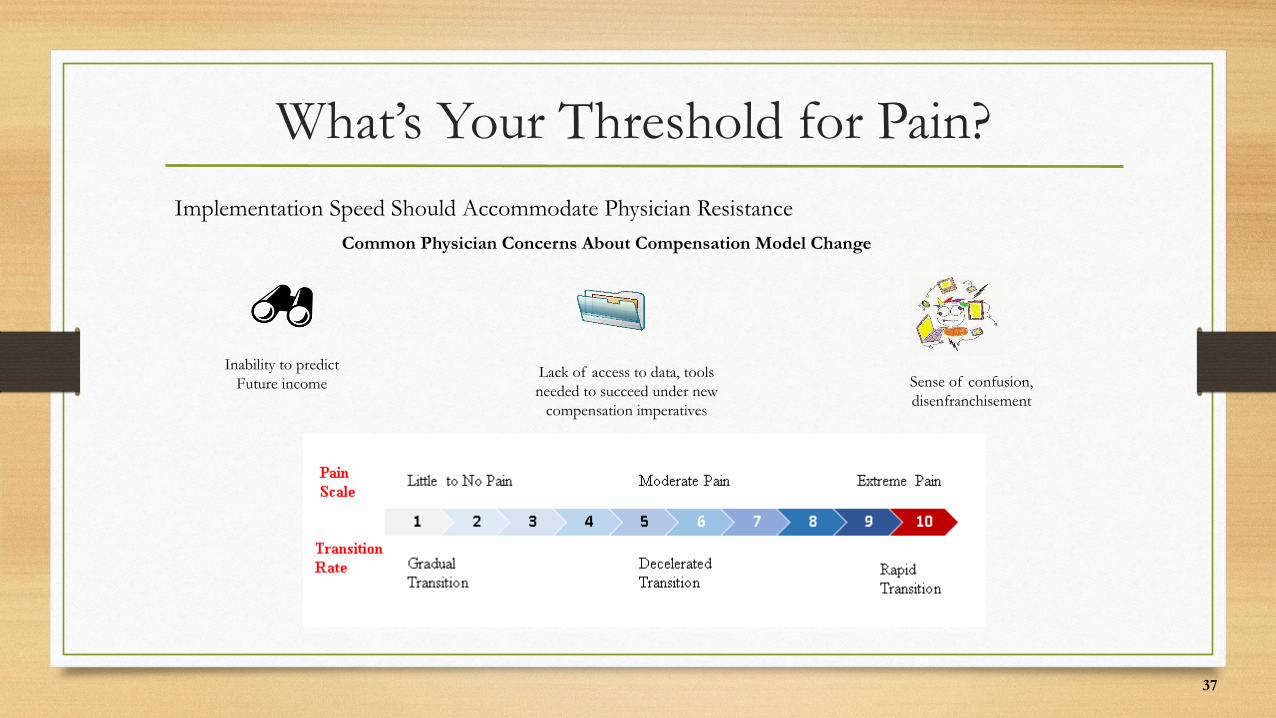
What’s Your Threshold for Pain?Implementation Speed Should Accommodate Physician Resistance
Common Physician Concerns About Compensation Model Change
Inability to predictFuture income
Lack of access to data, tools needed to succeed under new
compensation imperatives
Sense of confusion, disenfranchisement
37
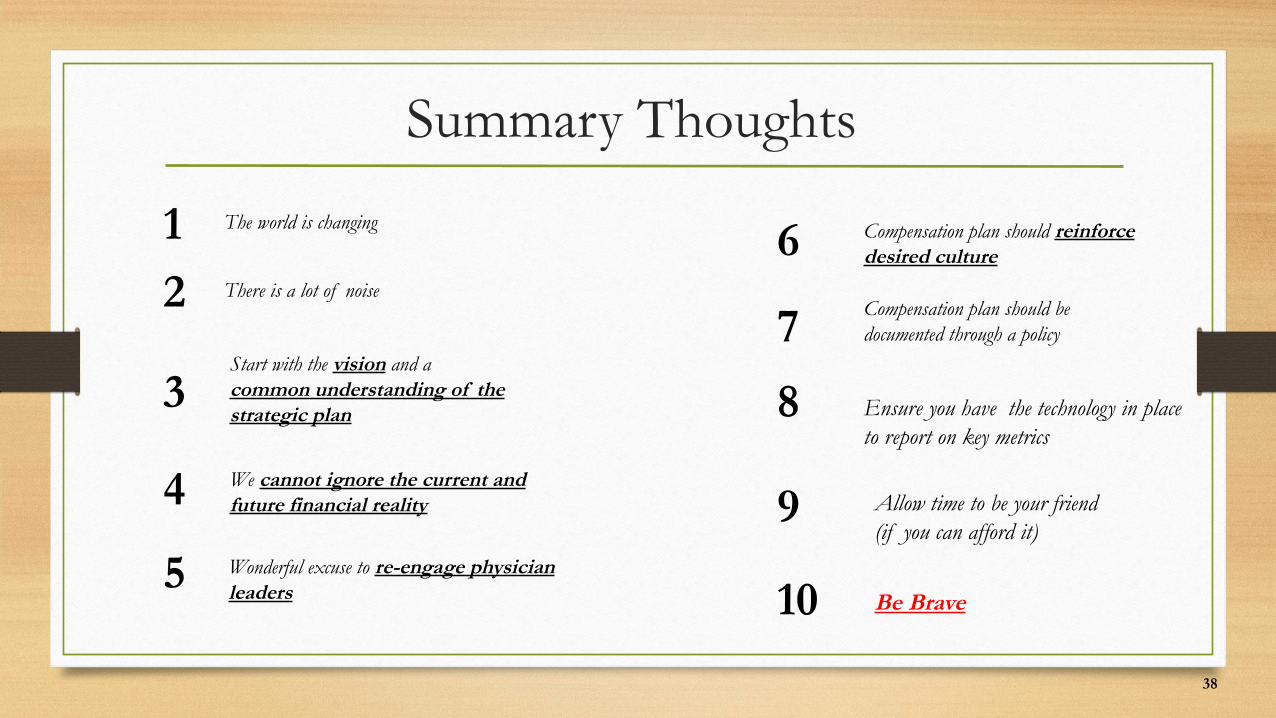
Summary Thoughts
1
2
3
4
5
The world is changing
There is a lot of noise
Start with the vision and a common understanding of the strategic plan
6
7
8
9
10Wonderful excuse to re-engage physician leaders
We cannot ignore the current and future financial reality
Compensation plan should reinforce desired culture
Compensation plan should be documented through a policy
Ensure you have the technology in place to report on key metrics
Allow time to be your friend (if you can afford it)
Be Brave
38