Embed Size (px)
Citation preview
Physics Exam Problems Reconsidered: Using Logger Pro to Evaluate Student Understanding of PhysicsMarina Milner-Bolotin, Ryerson University, Toronto, ON
Rachel Moll, The University of British Columbia, Vancouver, BC
In the past few decades, the physics teaching community has witnessed a surge in creative and often effective ways of using technology to
improve physics instruction.1-3 Most of these find-ings suggest how technology can help instructors create interactive learning environments and how interactivity influences the effectiveness of physics learning.4 However, every physics teacher knows that in order for any teaching method to be effec-tive, the exams have to test the skills and concepts addressed by the teacher. Exam content and style sends the clearest message to students about what skills and content are valued by instructors. The mis-match between what we intend to teach and what we effectively test in exams is of great concern to many science teachers. These were our motives for creating data-rich questions to be used in the exams in a large undergraduate first-year physics course at the University of British Columbia. These data-rich questions were developed to support the use of an innovative teaching pedagogy called Interactive Lecture Experiments.3
Interactive Lecture ExperimentsInteractive Lecture Experiments described here
have been implemented in a large (700 students) first-year algebra-based introductory physics course (Physics 100)3,5 for science majors at the University of British Columbia. The course is split into three sec-tions of about 230 students, with three instructors, including one of the authors (MMB). This teaching method builds on Sokoloff and Thornton’s1 Interac-
tive Lecture Demonstrations. Every Interactive Lec-ture Experiment had a similar format: the students observe an experiment during a lecture; the data from the experiment were recorded using either Logger Pro sensors or video cameras (Vernier Technology);6 then the data were uploaded on the web as a Logger Pro file to be analyzed by the students at home. In the next lecture, students were asked to bring their results to class for discussion and assessment.
Logger Pro Technology allows the course instructor to collect experimental data using electronic probes (for example, motion detectors for recording an ob-ject’s displacement at various times) and displays this data in a spreadsheet and/or graph form when paired with the Logger Pro software. Thanks to Vernier Soft-ware & Technology, each student has a copy of Logger Pro software and can analyze the data outside of class while working in small groups or alone. It is impor-tant to mention that traditionally Logger Pro or simi-lar technology is used in labs or during small group collaborative problem solving sessions where every group of students has access to it and can conduct experiments independently.7-10 In the study described here, Logger Pro was used during the labs as well as during the large lectures.
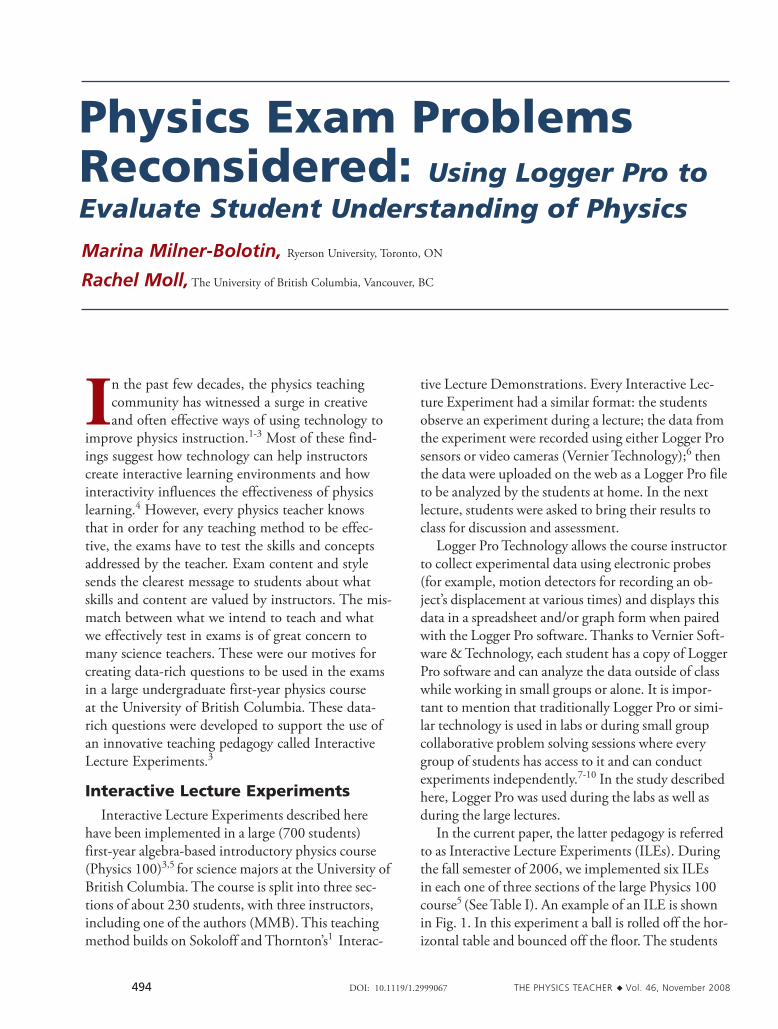
In the current paper, the latter pedagogy is referred to as Interactive Lecture Experiments (ILEs). During the fall semester of 2006, we implemented six ILEs in each one of three sections of the large Physics 100 course5 (See Table I). An example of an ILE is shown in Fig. 1. In this experiment a ball is rolled off the hor-izontal table and bounced off the floor. The students
494 DOI: 10.1119/1.2999067 The Physics Teacher ◆ Vol. 46, November 2008
were asked to analyze the motion of the ball during its fall off the table as well as during and after the bounce. This simple experiment can be used to illustrate many topics including projectile motion, free fall, conserva-tion of linear momentum, and energy during elastic and inelastic collisions.
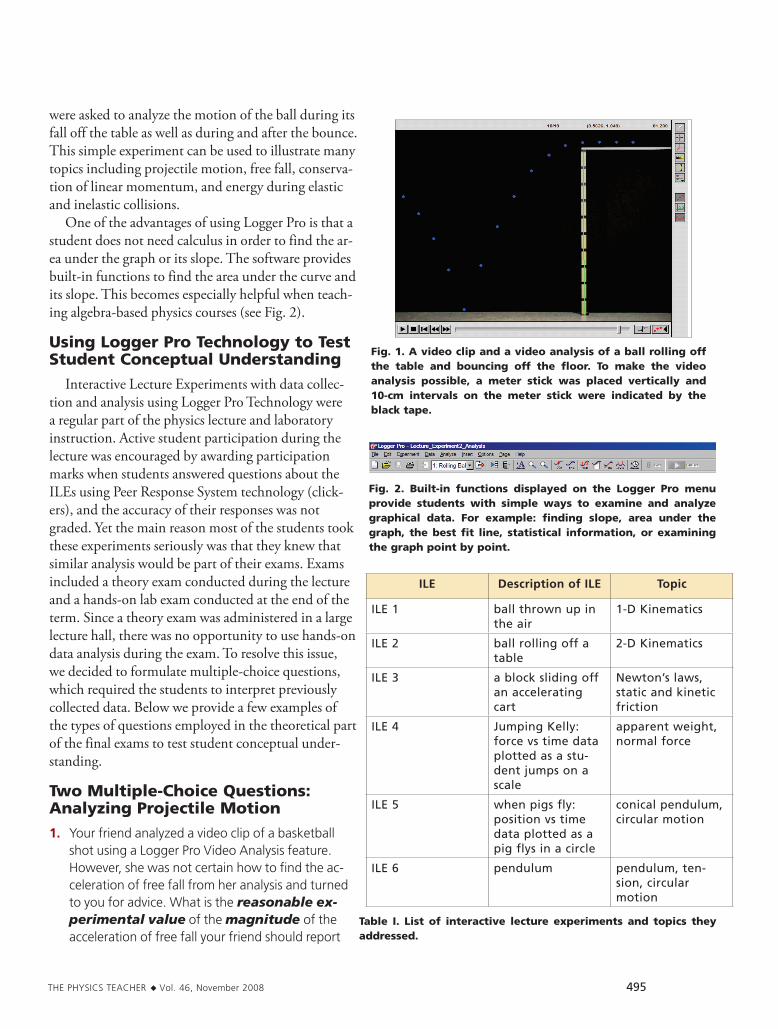
One of the advantages of using Logger Pro is that a student does not need calculus in order to find the ar-ea under the graph or its slope. The software provides built-in functions to find the area under the curve and its slope. This becomes especially helpful when teach-ing algebra-based physics courses (see Fig. 2).
Using Logger Pro Technology to Test Student Conceptual Understanding
Interactive Lecture Experiments with data collec-tion and analysis using Logger Pro Technology were a regular part of the physics lecture and laboratory instruction. Active student participation during the lecture was encouraged by awarding participation marks when students answered questions about the ILEs using Peer Response System technology (click-ers), and the accuracy of their responses was not graded. Yet the main reason most of the students took these experiments seriously was that they knew that similar analysis would be part of their exams. Exams included a theory exam conducted during the lecture and a hands-on lab exam conducted at the end of the term. Since a theory exam was administered in a large lecture hall, there was no opportunity to use hands-on data analysis during the exam. To resolve this issue, we decided to formulate multiple-choice questions, which required the students to interpret previously collected data. Below we provide a few examples of the types of questions employed in the theoretical part of the final exams to test student conceptual under-standing.
Two Multiple-Choice Questions: Analyzing Projectile Motion1. your friend analyzed a video clip of a basketball
shot using a Logger Pro Video analysis feature. however, she was not certain how to find the ac-celeration of free fall from her analysis and turned to you for advice. What is the reasonable ex-perimental value of the magnitude of the acceleration of free fall your friend should report
Fig. 1. A video clip and a video analysis of a ball rolling off the table and bouncing off the floor. To make the video analysis possible, a meter stick was placed vertically and 10-cm intervals on the meter stick were indicated by the black tape.
Fig. 2. Built-in functions displayed on the Logger Pro menu provide students with simple ways to examine and analyze graphical data. For example: finding slope, area under the graph, the best fit line, statistical information, or examining the graph point by point.
ILE Description of ILE Topic
ILE 1 ball thrown up in the air
1-D Kinematics
ILE 2 ball rolling off a table
2-D Kinematics
ILE 3 a block sliding off an accelerating cart
Newton’s laws, static and kinetic friction
ILE 4 Jumping Kelly: force vs time data plotted as a stu-dent jumps on a scale
apparent weight, normal force
ILE 5 when pigs fly: position vs time data plotted as a pig flys in a circle
conical pendulum, circular motion
ILE 6 pendulum pendulum, ten-sion, circular motion
Table I. List of interactive lecture experiments and topics they addressed.
The Physics Teacher ◆ Vol. 46, November 2008 495
during the next class?
a) 5.037 m/s2
b) 6.807 m/s2
c) 9.823 m/s2
d) 10.074 m/s2
e) 10.10 m/s2
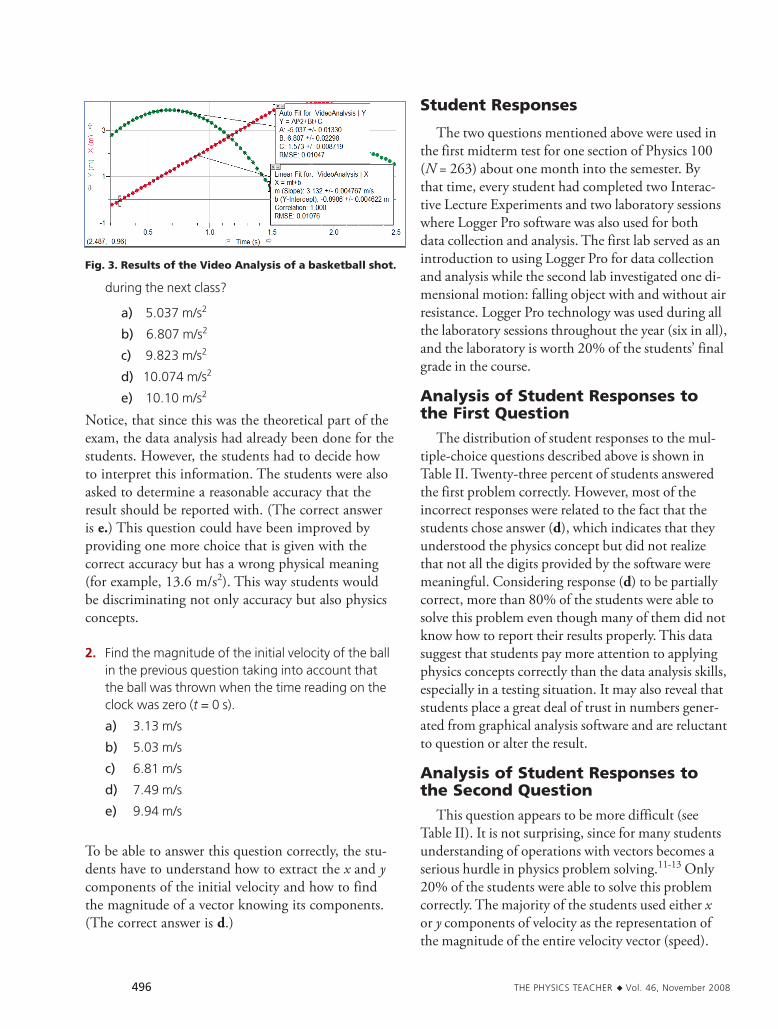
Notice, that since this was the theoretical part of the exam, the data analysis had already been done for the students. However, the students had to decide how to interpret this information. The students were also asked to determine a reasonable accuracy that the result should be reported with. (The correct answer is e.) This question could have been improved by providing one more choice that is given with the correct accuracy but has a wrong physical meaning (for example, 13.6 m/s2). This way students would be discriminating not only accuracy but also physics concepts.
2. Find the magnitude of the initial velocity of the ball in the previous question taking into account that the ball was thrown when the time reading on the clock was zero (t = 0 s).
a) 3.13 m/s
b) 5.03 m/s
c) 6.81 m/s
d) 7.49 m/s
e) 9.94 m/s
To be able to answer this question correctly, the stu-dents have to understand how to extract the x and y components of the initial velocity and how to find the magnitude of a vector knowing its components. (The correct answer is d.)
Student Responses
The two questions mentioned above were used in the first midterm test for one section of Physics 100 (N = 263) about one month into the semester. By that time, every student had completed two Interac-tive Lecture Experiments and two laboratory sessions where Logger Pro software was also used for both data collection and analysis. The first lab served as an introduction to using Logger Pro for data collection and analysis while the second lab investigated one di-mensional motion: falling object with and without air resistance. Logger Pro technology was used during all the laboratory sessions throughout the year (six in all), and the laboratory is worth 20% of the students’ final grade in the course.
Analysis of Student Responses to the First Question
The distribution of student responses to the mul-tiple-choice questions described above is shown in Table II. Twenty-three percent of students answered the first problem correctly. However, most of the incorrect responses were related to the fact that the students chose answer (d), which indicates that they understood the physics concept but did not realize that not all the digits provided by the software were meaningful. Considering response (d) to be partially correct, more than 80% of the students were able to solve this problem even though many of them did not know how to report their results properly. This data suggest that students pay more attention to applying physics concepts correctly than the data analysis skills, especially in a testing situation. It may also reveal that students place a great deal of trust in numbers gener-ated from graphical analysis software and are reluctant to question or alter the result.
Analysis of Student Responses to the Second Question
This question appears to be more difficult (see Table II). It is not surprising, since for many students understanding of operations with vectors becomes a serious hurdle in physics problem solving.11-13 Only 20% of the students were able to solve this problem correctly. The majority of the students used either x or y components of velocity as the representation of the magnitude of the entire velocity vector (speed).
Figure 3: Results of the Video Analysis of a basketball shot Fig. 3. Results of the Video Analysis of a basketball shot.
496 The Physics Teacher ◆ Vol. 46, November 2008
This is a common problem among introductory phys-ics students. In response to low results on exercises involving 2-D motion and resolving of vectors, a tuto-rial was designed and conducted that gave students extra practice in these types of problems in a variety of contexts. The use of Logger Pro software to plot both the x and y dependence should also help students to recognize that both need to be taken into account. On the final exam the same group of students fared much better on a 2-D conservation of momentum question (67% correct) showing marked improve-ment over the semester on this important skill.
Open Ended Problems: Two Examples
1. Finding acceleration of an elevator using a force plate and a jar of water
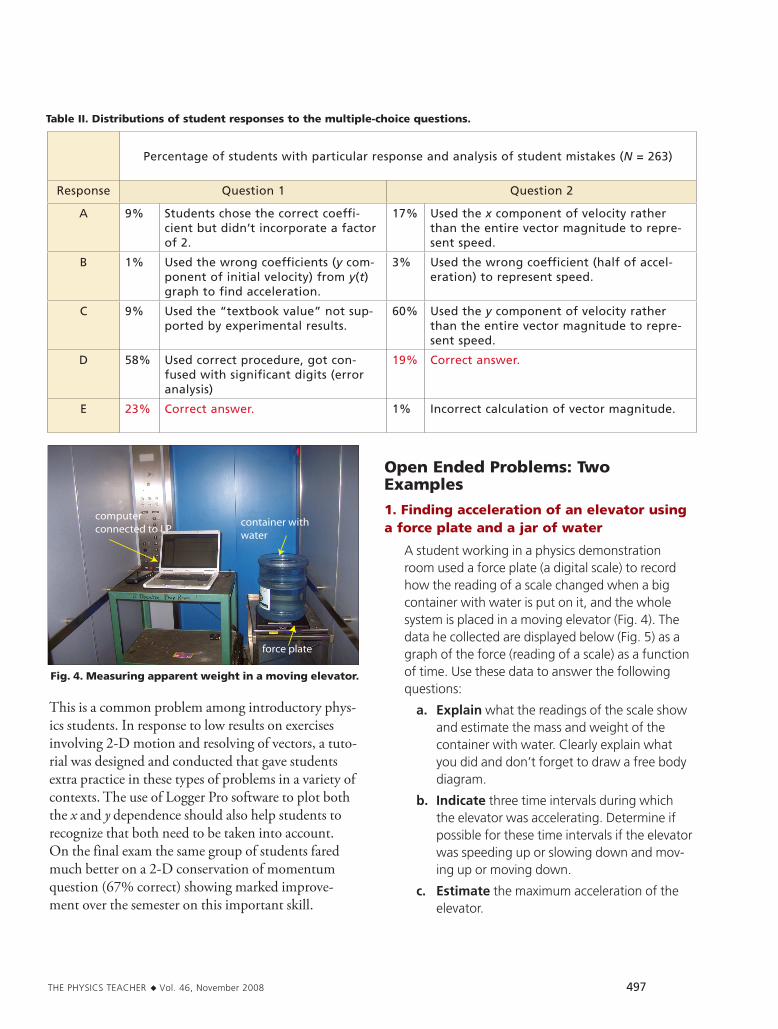
a student working in a physics demonstration room used a force plate (a digital scale) to record how the reading of a scale changed when a big container with water is put on it, and the whole system is placed in a moving elevator (Fig. 4). The data he collected are displayed below (Fig. 5) as a graph of the force (reading of a scale) as a function of time. Use these data to answer the following questions:
a. Explain what the readings of the scale show and estimate the mass and weight of the container with water. clearly explain what you did and don’t forget to draw a free body diagram.
b. Indicate three time intervals during which the elevator was accelerating. Determine if possible for these time intervals if the elevator was speeding up or slowing down and mov-ing up or moving down.
c. Estimate the maximum acceleration of the elevator.
Percentage of students with particular response and analysis of student mistakes (N = 263)
Response Question 1 Question 2
A 9% Students chose the correct coeffi-cient but didn’t incorporate a factor of 2.
17% Used the x component of velocity rather than the entire vector magnitude to repre-sent speed.
B 1% Used the wrong coefficients (y com-ponent of initial velocity) from y(t) graph to find acceleration.
3% Used the wrong coefficient (half of accel-eration) to represent speed.
C 9% Used the “textbook value” not sup-ported by experimental results.
60% Used the y component of velocity rather than the entire vector magnitude to repre-sent speed.
D 58% Used correct procedure, got con-fused with significant digits (error analysis)
19% Correct answer.
E 23% Correct answer. 1% Incorrect calculation of vector magnitude.
Table II. Distributions of student responses to the multiple-choice questions.
computerconnected to LP
container withwater
force plate
Fig. 4. Measuring apparent weight in a moving elevator.
The Physics Teacher ◆ Vol. 46, November 2008 497
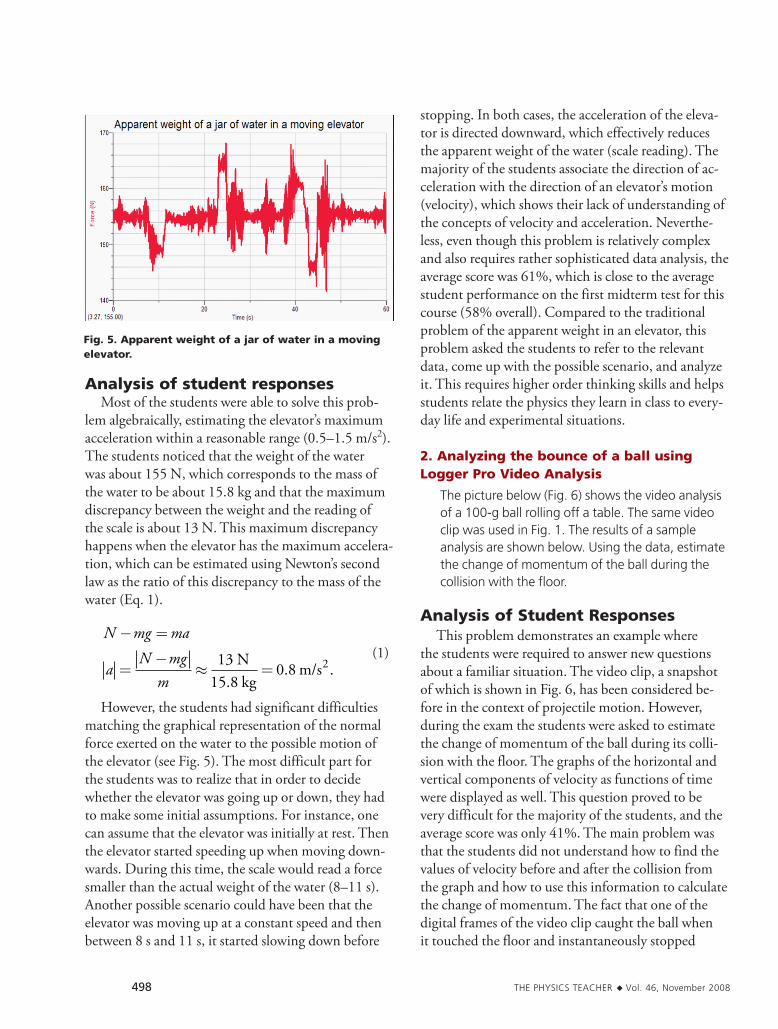
Analysis of student responsesMost of the students were able to solve this prob-
lem algebraically, estimating the elevator’s maximum acceleration within a reasonable range (0.5–1.5 m/s2). The students noticed that the weight of the water was about 155 N, which corresponds to the mass of the water to be about 15.8 kg and that the maximum discrepancy between the weight and the reading of the scale is about 13 N. This maximum discrepancy happens when the elevator has the maximum accelera-tion, which can be estimated using Newton’s second law as the ratio of this discrepancy to the mass of the water (Eq. 1).
(1)
N mg ma
aN mg
m
− =
=−
≈ =13
15 80 8 2N
kgm/s
.. .
However, the students had significant difficulties matching the graphical representation of the normal force exerted on the water to the possible motion of the elevator (see Fig. 5). The most difficult part for the students was to realize that in order to decide whether the elevator was going up or down, they had to make some initial assumptions. For instance, one can assume that the elevator was initially at rest. Then the elevator started speeding up when moving down-wards. During this time, the scale would read a force smaller than the actual weight of the water (8–11 s). Another possible scenario could have been that the elevator was moving up at a constant speed and then between 8 s and 11 s, it started slowing down before
stopping. In both cases, the acceleration of the eleva-tor is directed downward, which effectively reduces the apparent weight of the water (scale reading). The majority of the students associate the direction of ac-celeration with the direction of an elevator’s motion (velocity), which shows their lack of understanding of the concepts of velocity and acceleration. Neverthe-less, even though this problem is relatively complex and also requires rather sophisticated data analysis, the average score was 61%, which is close to the average student performance on the first midterm test for this course (58% overall). Compared to the traditional problem of the apparent weight in an elevator, this problem asked the students to refer to the relevant data, come up with the possible scenario, and analyze it. This requires higher order thinking skills and helps students relate the physics they learn in class to every-day life and experimental situations.
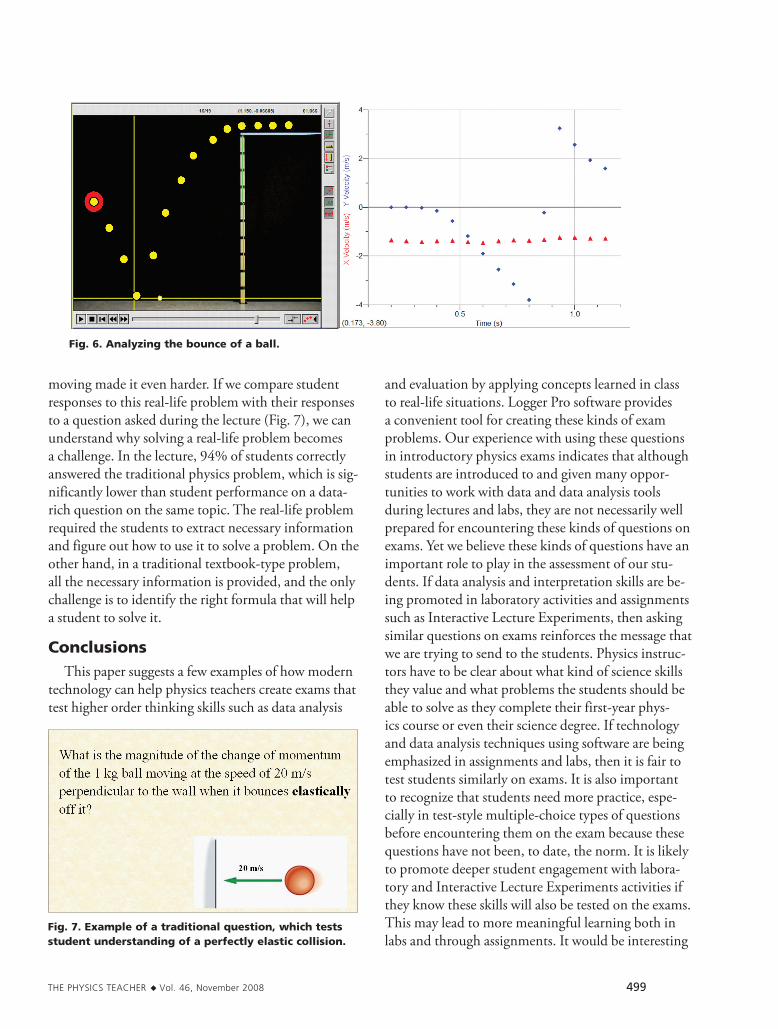
2. Analyzing the bounce of a ball using Logger Pro Video Analysis
The picture below (Fig. 6) shows the video analysis of a 100-g ball rolling off a table. The same video clip was used in Fig. 1. The results of a sample analysis are shown below. Using the data, estimate the change of momentum of the ball during the collision with the floor.
Analysis of Student ResponsesThis problem demonstrates an example where
the students were required to answer new questions about a familiar situation. The video clip, a snapshot of which is shown in Fig. 6, has been considered be-fore in the context of projectile motion. However, during the exam the students were asked to estimate the change of momentum of the ball during its colli-sion with the floor. The graphs of the horizontal and vertical components of velocity as functions of time were displayed as well. This question proved to be very difficult for the majority of the students, and the average score was only 41%. The main problem was that the students did not understand how to find the values of velocity before and after the collision from the graph and how to use this information to calculate the change of momentum. The fact that one of the digital frames of the video clip caught the ball when it touched the floor and instantaneously stopped
Fig. 5. Apparent weight of a jar of water in a moving elevator.
498 The Physics Teacher ◆ Vol. 46, November 2008
moving made it even harder. If we compare student responses to this real-life problem with their responses to a question asked during the lecture (Fig. 7), we can understand why solving a real-life problem becomes a challenge. In the lecture, 94% of students correctly answered the traditional physics problem, which is sig-nificantly lower than student performance on a data-rich question on the same topic. The real-life problem required the students to extract necessary information and figure out how to use it to solve a problem. On the other hand, in a traditional textbook-type problem, all the necessary information is provided, and the only challenge is to identify the right formula that will help a student to solve it.
ConclusionsThis paper suggests a few examples of how modern
technology can help physics teachers create exams that test higher order thinking skills such as data analysis
and evaluation by applying concepts learned in class to real-life situations. Logger Pro software provides a convenient tool for creating these kinds of exam problems. Our experience with using these questions in introductory physics exams indicates that although students are introduced to and given many oppor-tunities to work with data and data analysis tools during lectures and labs, they are not necessarily well prepared for encountering these kinds of questions on exams. Yet we believe these kinds of questions have an important role to play in the assessment of our stu-dents. If data analysis and interpretation skills are be-ing promoted in laboratory activities and assignments such as Interactive Lecture Experiments, then asking similar questions on exams reinforces the message that we are trying to send to the students. Physics instruc-tors have to be clear about what kind of science skills they value and what problems the students should be able to solve as they complete their first-year phys-ics course or even their science degree. If technology and data analysis techniques using software are being emphasized in assignments and labs, then it is fair to test students similarly on exams. It is also important to recognize that students need more practice, espe-cially in test-style multiple-choice types of questions before encountering them on the exam because these questions have not been, to date, the norm. It is likely to promote deeper student engagement with labora-tory and Interactive Lecture Experiments activities if they know these skills will also be tested on the exams. This may lead to more meaningful learning both in labs and through assignments. It would be interesting
Fig. 6. Analyzing the bounce of a ball.
Fig. 7. Example of a traditional question, which tests student understanding of a perfectly elastic collision.
The Physics Teacher ◆ Vol. 46, November 2008 499
to investigate if using these data-rich questions during exams affects how students prepare for the exams and how they perceive the value of the data analysis skills learned in a physics class and their applications to ev-ery-day life.
AcknowledgmentsSpecial thanks to UBC undergraduate students Kelly McPhee, Robert Kehoe, and Will Walters for help-ing with the data collection and Drs. A. Kotlicki, G. Rieger, and F. Bates for helping with the design and implementation of the Interactive Lecture Experiments. This research project has been sup-ported by the Teaching and Learning Enhancement Fund at the University of British Columbia.
References1. D.R. Sokoloff and R.K. Thornton, “Using interactive
lecture demonstrations to create an active learning envi-ronment,” Phys. Teach. 35, 340–347 (Sept. 1997).
2. K. Perkins, et al. “PhET: Interactive simulations for teaching and learning physics,” Phys. Teach. 44, 18–23(Jan. 2006).
3. M. Milner-Bolotin, A. Kotlicki, and G. Reiger, “Can students learn from lecture demonstrations: The role and place of interactive lecture experiments in large introductory science courses,” J. Coll. Sci. Teach. 37, 45–49 (Jan-Feb. 2007).
4. R.R. Hake, “Interactive-engagement versus traditional methods: A six-thousand-student survey of mechanics test data for introductory physics courses,” Am. J. Phys. 66, 64–74 (Jan. 1998).
5. M. Milner-Bolotin, Interactive Lecture Experiments, (Department of Physics and Astronomy, University of British Columbia, 2006).
6. Vernier Software and Technology; http://www.vernier.com.
7. T.L. Escalada and D.A. Zollman, “An investigation on the effects of using interactive digital video in a physics classroom on student learning and attitudes,” J. Res. Sci. Teach. 34, 467–489 (May 1997).
8. B. Royuk and D.W. Brooks, “Cookbook procedures in MBL physics exercises,” J. Sci. Educ. Tech. 12, 317–324 (Sept. 2003).
9. D.R. Sokoloff et al., Real Time Physics (Wiley, New York, 2004).
10. T. Erickson and B. Cooley, A Den of Inquiry (Vernier Technology, 2006).
11. D.Hestenes and M. Wells, “A mechanics baseline test,” Phys. Teach. 30, 159–166 (March 1992).
12. D. Hestenes, M. Wells, and G. Swackhamer, “Force Concept Inventory,” Phys. Teach. 30, 141–157 (March 1992).
13. A.B. Arons, Teaching Introductory Physics (Wiley, New York, 1997).
PACS codes: 01.50.ht, 01.55.+b
Marina Milner-Bolotin is an assistant professor of phys-ics at the Department of Physics at Ryerson University, Toronto, ON, [email protected]
Rachel Moll is a PhD candidate in Science Education at the Department of Curriculum and Pedagogy, University of British Columbia, Vancouver, BC, [email protected]
500 The Physics Teacher ◆ Vol. 46, November 2008
I hear, I forgetI see, I remember
I do, I understand
Members $24 • Nonmembers $31order online: thephysicsstore.com or call: 301-209-3333
Explore physics with 46 fun and interactive physics demonstrations.
152 pp. introductory level