Embed Size (px)
Citation preview
21 July 2017 #ORLEN2Q17@PKN_ORLEN
PKN ORLEN consolidated financial results
2Q17
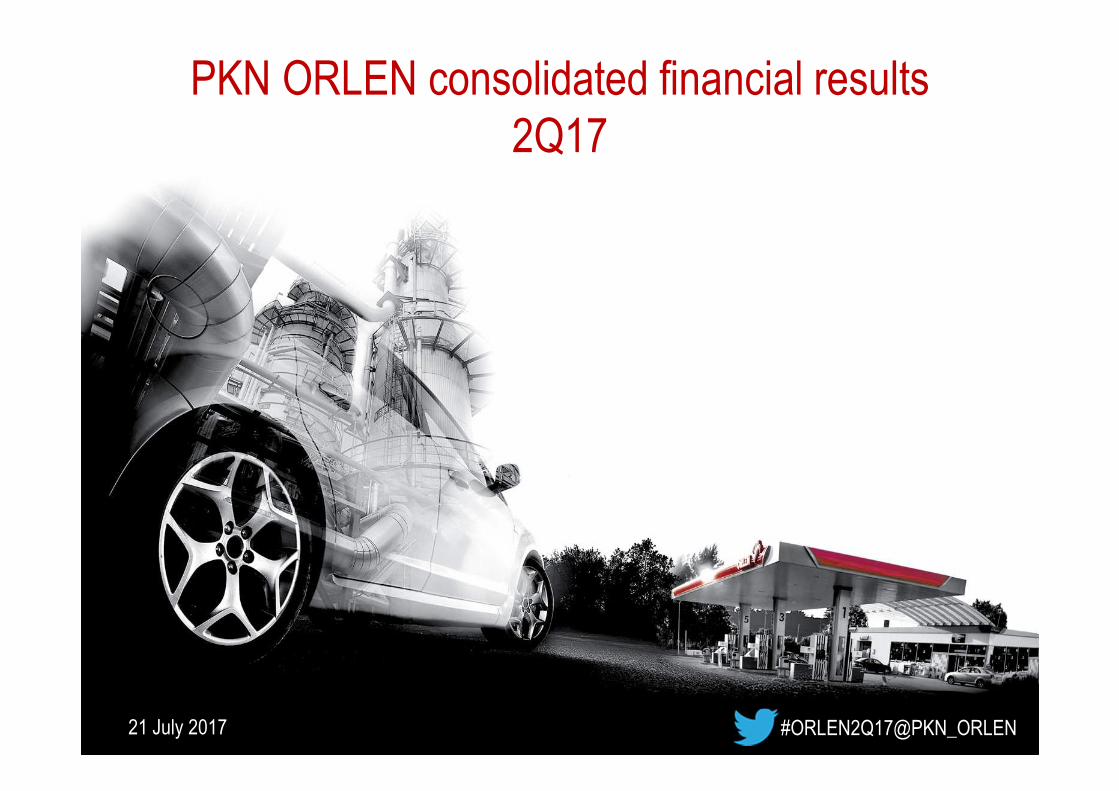
Key highlights 2Q17
Macroeconomic environment
Liquidity and investments
Market outlook for 2017
Agenda
Financial and operating results
2
3
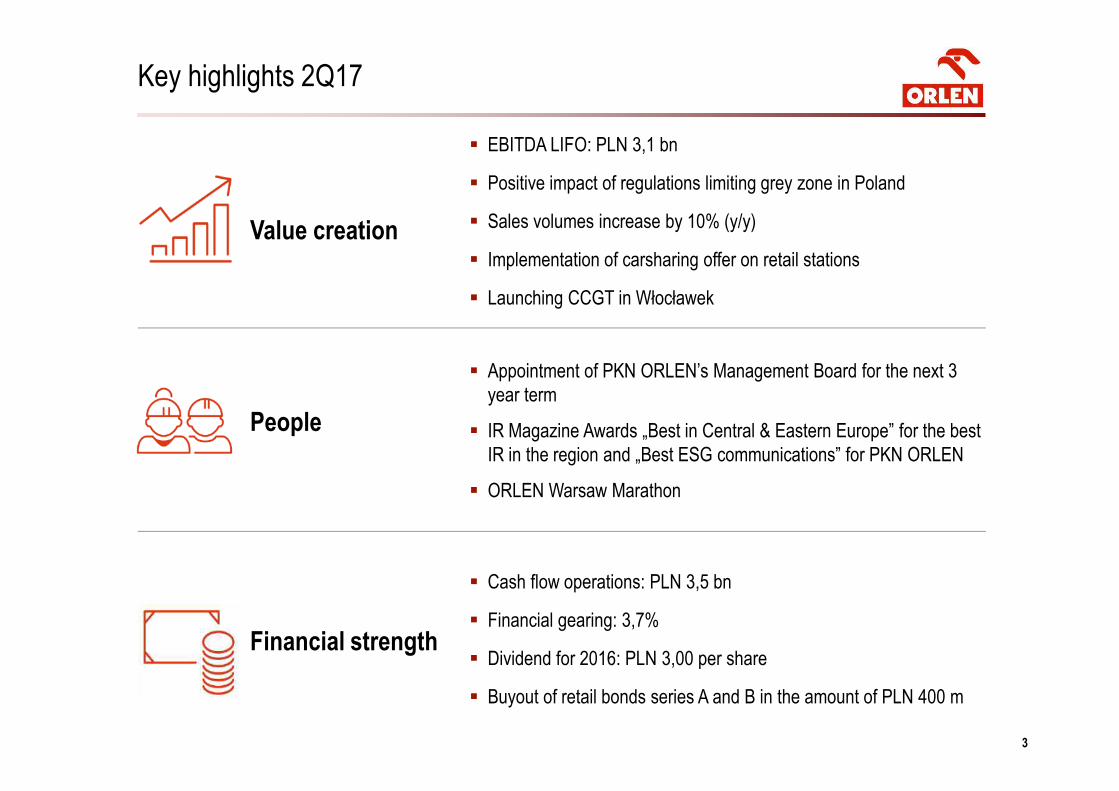
Key highlights 2Q17
� EBITDA LIFO: PLN 3,1 bn
� Positive impact of regulations limiting grey zone in Poland
� Sales volumes increase by 10% (y/y)
� Implementation of carsharing offer on retail stations
� Launching CCGT in Włocławek
Financial strength
Value creation
People
� Cash flow operations: PLN 3,5 bn
� Financial gearing: 3,7%
� Dividend for 2016: PLN 3,00 per share
� Buyout of retail bonds series A and B in the amount of PLN 400 m
� Appointment of PKN ORLEN’s Management Board for the next 3
year term
� IR Magazine Awards „Best in Central & Eastern Europe” for the best
IR in the region and „Best ESG communications” for PKN ORLEN
� ORLEN Warsaw Marathon
Key highlights 2Q17
Macroeconomic environment
Liquidity and investments
Market outlook for 2017
Agenda
Financial and operating results
4
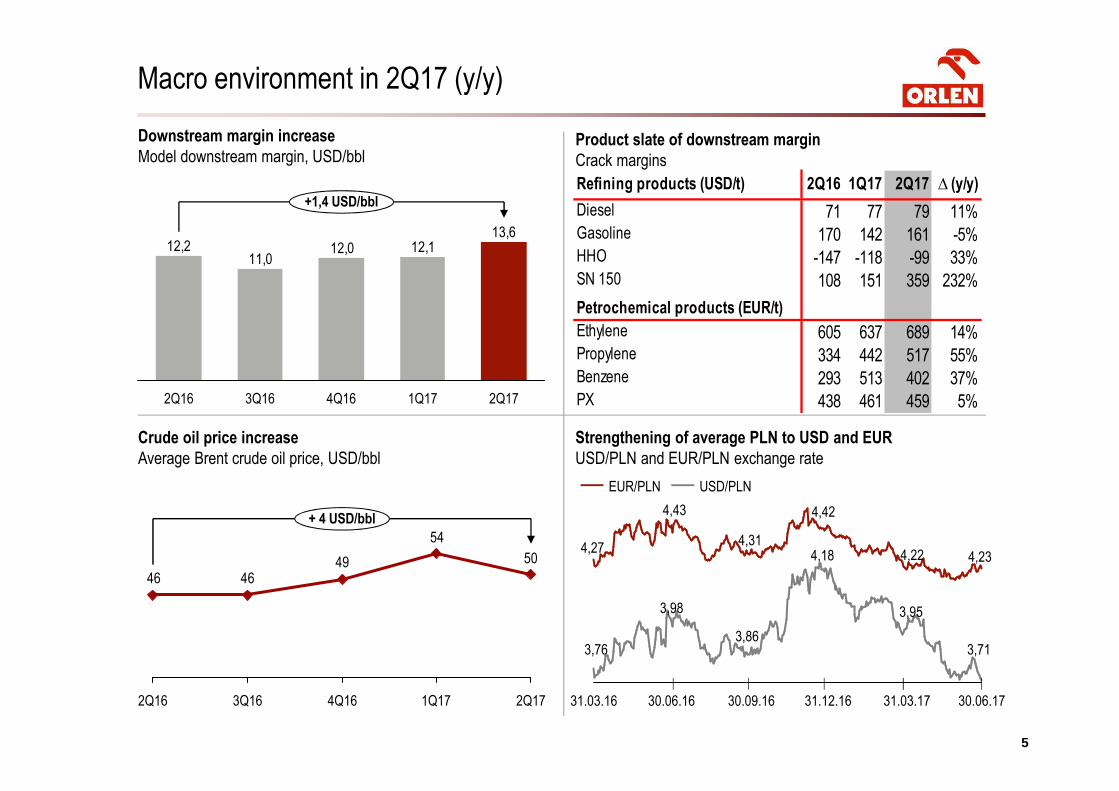
Macro environment in 2Q17 (y/y)
5
Refining products (USD/t) 2Q16 1Q17 2Q17 ∆ (y/y)
Diesel 71 77 79 11%Gasoline 170 142 161 -5%HHO -147 -118 -99 33%SN 150 108 151 359 232%
Petrochemical products (EUR/t)
Ethylene 605 637 689 14%Propylene 334 442 517 55%Benzene 293 513 402 37%PX 438 461 459 5%
Downstream margin increase
Model downstream margin, USD/bblProduct slate of downstream margin
Crack margins
Strengthening of average PLN to USD and EUR
USD/PLN and EUR/PLN exchange rate
Crude oil price increase
Average Brent crude oil price, USD/bbl
31.12.1630.06.16 31.03.1730.09.1631.03.16 30.06.17
USD/PLNEUR/PLN
13,612,112,0
11,012,2
+1,4 USD/bbl
1Q174Q163Q162Q16 2Q17
50
54
494646
+ 4 USD/bbl
1Q17 2Q173Q162Q16 4Q16
4,27
3,76
4,43
3,98
4,31
3,86
4,42
4,18 4,22
3,95
4,23
3,71
6
Diesel Gasoline
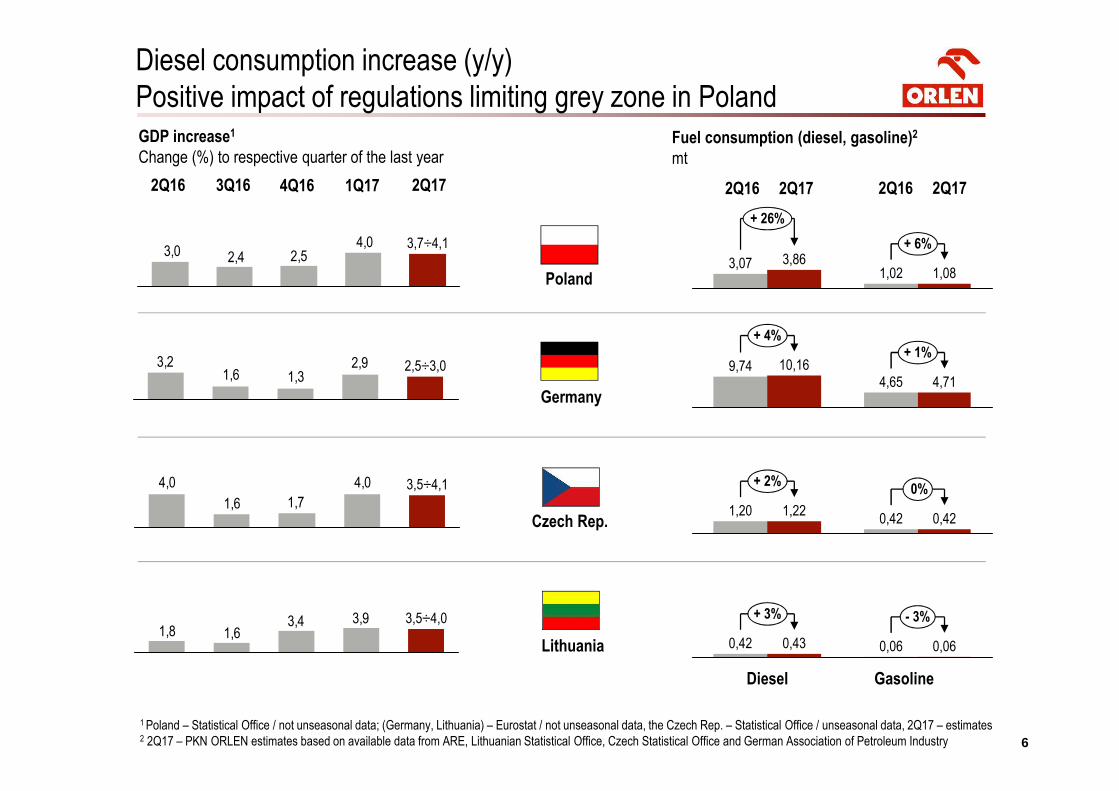
Diesel consumption increase (y/y)
Positive impact of regulations limiting grey zone in PolandGDP increase1
Change (%) to respective quarter of the last yearFuel consumption (diesel, gasoline)2
mt
Poland
Germany
Czech Rep.
Lithuania
1 Poland – Statistical Office / not unseasonal data; (Germany, Lithuania) – Eurostat / not unseasonal data, the Czech Rep. – Statistical Office / unseasonal data, 2Q17 – estimates 2 2Q17 – PKN ORLEN estimates based on available data from ARE, Lithuanian Statistical Office, Czech Statistical Office and German Association of Petroleum Industry
4,0
1,71,6
4,0 3,5÷4,1
2,91,31,6
3,2 2,5÷3,0
4,02,52,43,0
3,7÷4,1
3,93,41,61,8
3,5÷4,0
2Q16 3Q16 4Q16 1Q17 2Q17
+ 1%+ 4%
4,714,6510,169,74
+ 6%
+ 26%
1,081,023,07 3,86
0%+ 2%
0,420,421,221,20
- 3%+ 3%
0,060,060,430,42
2Q16 2Q17 2Q16 2Q17
Key highlights 2Q17
Macroeconomic environment
Liquidity and investments
Market outlook for 2017
Agenda
Financial and operating results
7
8
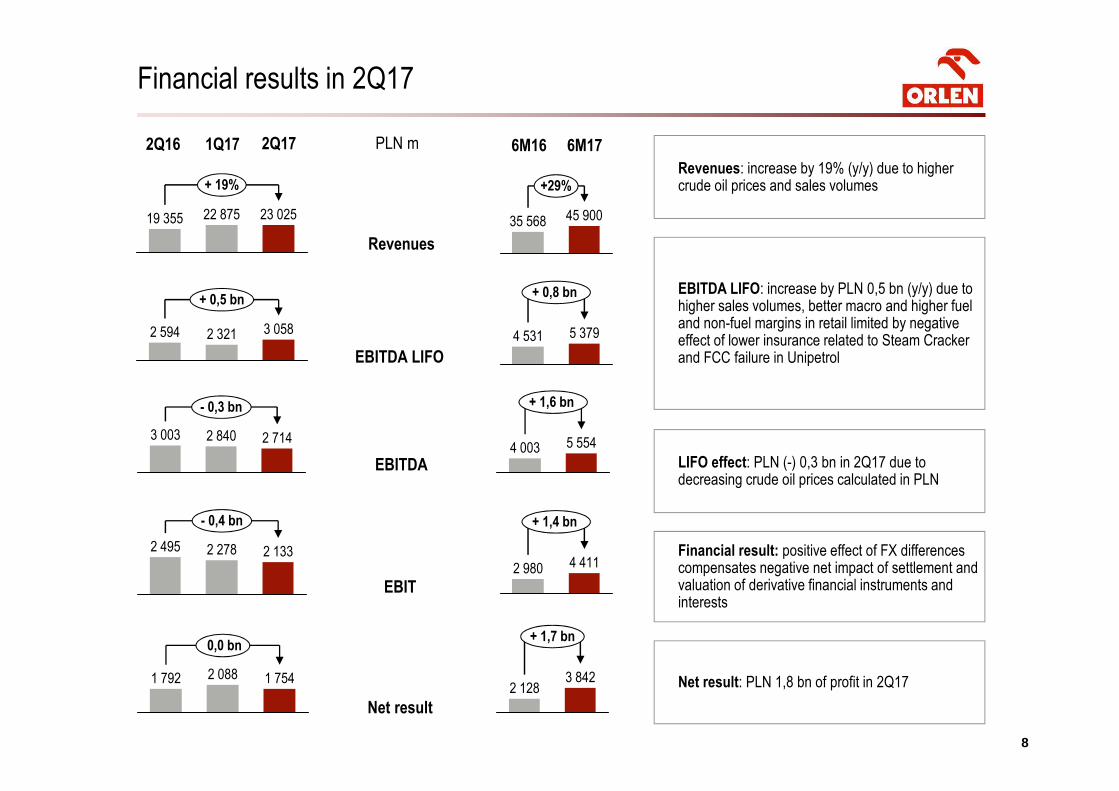
Financial results in 2Q17
Revenues: increase by 19% (y/y) due to higher crude oil prices and sales volumes
EBITDA LIFO: increase by PLN 0,5 bn (y/y) due to higher sales volumes, better macro and higher fuel and non-fuel margins in retail limited by negative effect of lower insurance related to Steam Cracker and FCC failure in Unipetrol
LIFO effect: PLN (-) 0,3 bn in 2Q17 due to decreasing crude oil prices calculated in PLN
Financial result: positive effect of FX differences compensates negative net impact of settlement and valuation of derivative financial instruments and interests
Net result: PLN 1,8 bn of profit in 2Q17
2Q16 1Q17 PLN m 6M16 6M172Q17
2 840
- 0,3 bn
3 003 2 714
1 7542 088
0,0 bn
1 792
23 02519 355
+ 19%
22 875
2 594
+ 0,5 bn
3 0582 321
2 495 2 278 2 133
- 0,4 bn
Revenues
EBITDA LIFO
EBITDA
EBIT
Net result
4 003
+ 1,6 bn
5 554
2 128
+ 1,7 bn
3 842
45 900
+29%
35 568
+ 0,8 bn
5 3794 531
+ 1,4 bn
2 980 4 411
99
3 05882576
2 550
Downstream EBITDA
LIFO 2Q17
Corporate
functions
-150
UpstreamRetail
3 0583040135259
2 594
EBITDA
LIFO 2Q17
PLN + 464 m
Corporate
functions
Retail UpstreamDownstreamEBITDA
LIFO 2Q16
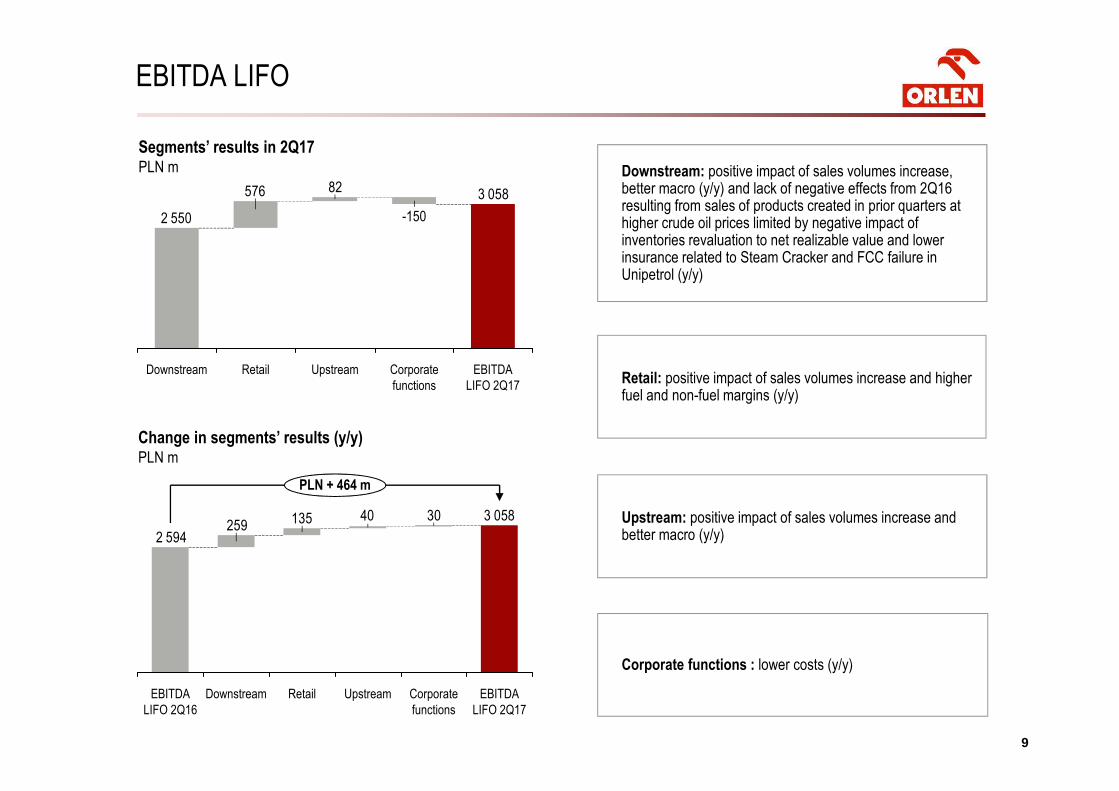
Segments’ results in 2Q17PLN m
Change in segments’ results (y/y)PLN m
EBITDA LIFO
Downstream: positive impact of sales volumes increase, better macro (y/y) and lack of negative effects from 2Q16 resulting from sales of products created in prior quarters at higher crude oil prices limited by negative impact of inventories revaluation to net realizable value and lower insurance related to Steam Cracker and FCC failure in Unipetrol (y/y)
Retail: positive impact of sales volumes increase and higher fuel and non-fuel margins (y/y)
Corporate functions : lower costs (y/y)
Upstream: positive impact of sales volumes increase and better macro (y/y)
1010
EBITDA LIFO
PLN m
Downstream – EBITDA LIFO
Higher sales volumes and better macro
255023632291
1656
2712
1000
2000
3000
2Q171Q17
2021
4Q163Q16
1698
2Q161Q16
1755
4Q153Q15
1655
2Q151Q15
1753
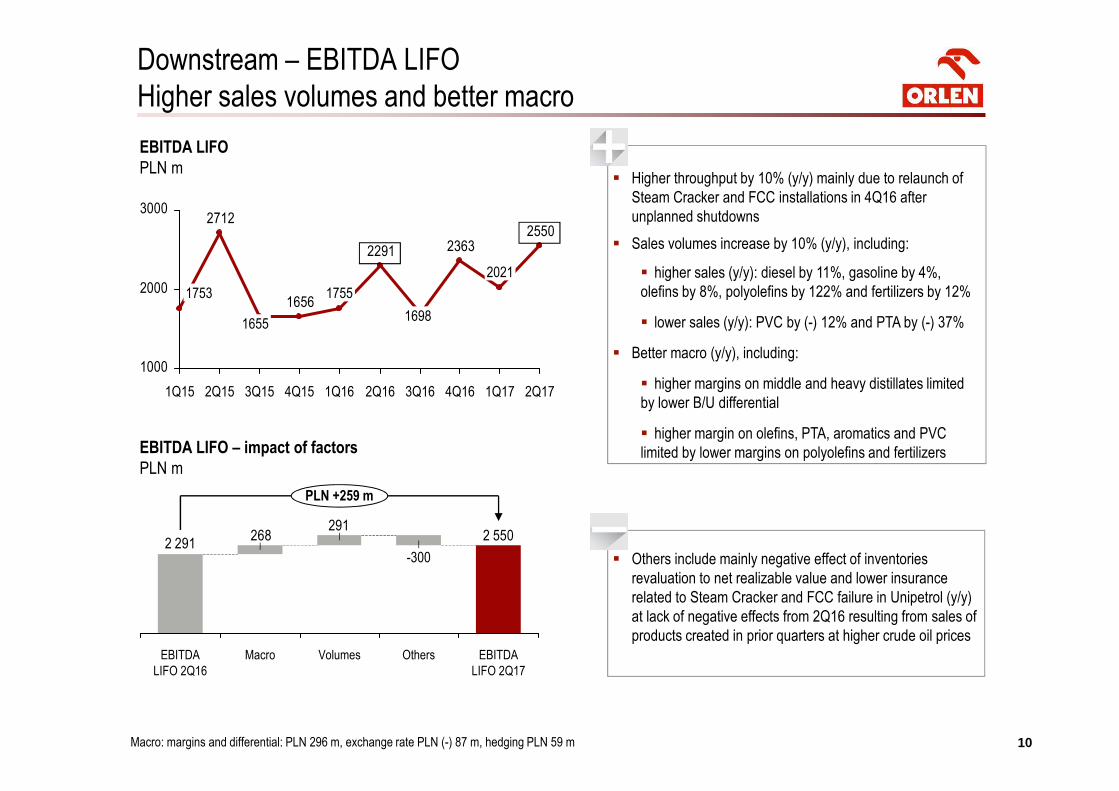
EBITDA LIFO – impact of factors
PLN m
Macro: margins and differential: PLN 296 m, exchange rate PLN (-) 87 m, hedging PLN 59 m
2 550291
2682 291
Macro
PLN +259 m
-300
EBITDA
LIFO 2Q17
OthersEBITDA
LIFO 2Q16
Volumes
� Higher throughput by 10% (y/y) mainly due to relaunch of
Steam Cracker and FCC installations in 4Q16 after
unplanned shutdowns
� Sales volumes increase by 10% (y/y), including:
� higher sales (y/y): diesel by 11%, gasoline by 4%,
olefins by 8%, polyolefins by 122% and fertilizers by 12%
� lower sales (y/y): PVC by (-) 12% and PTA by (-) 37%
� Better macro (y/y), including:
� higher margins on middle and heavy distillates limited
by lower B/U differential
� higher margin on olefins, PTA, aromatics and PVC
limited by lower margins on polyolefins and fertilizers
� Others include mainly negative effect of inventories
revaluation to net realizable value and lower insurance
related to Steam Cracker and FCC failure in Unipetrol (y/y)
at lack of negative effects from 2Q16 resulting from sales of
products created in prior quarters at higher crude oil prices
1111
Sales volumes
mtUtilization ratio
%
Crude oil throughput and fuel yield
mt, %
UnipetrolPłock ORLEN Lietuva
30 34
4646
76
2Q172Q16
80
Light distillates yield Middle distillates yield
Downstream – operational data
Higher throughput and sales volumes increase
7,9
7,6
8,28,1
7,3
7,7
8,17,9
6
7
8
9+10%
3Q152Q15
6,8
1Q15 4Q15 2Q16 3Q16 4Q16 1Q171Q16
7,2
2Q17
33 35
4650
2Q16
83
2Q17
81
34 32
4748
82
2Q16 2Q17
796,9
7,6
2Q16 2Q17
Throughput (mt) Yields (%)
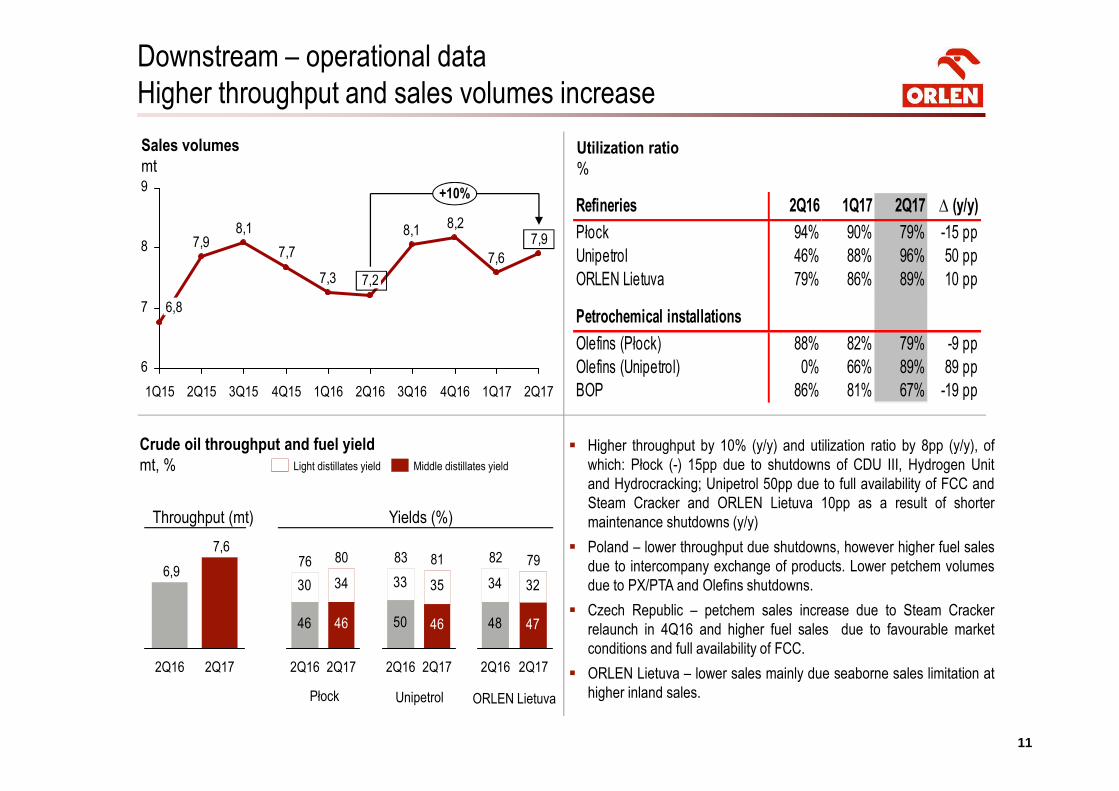
Refineries 2Q16 1Q17 2Q17 ∆ (y/y)
Płock 94% 90% 79% -15 pp
Unipetrol 46% 88% 96% 50 pp
ORLEN Lietuva 79% 86% 89% 10 pp
Petrochemical installations
Olefins (Płock) 88% 82% 79% -9 pp
Olefins (Unipetrol) 0% 66% 89% 89 pp
BOP 86% 81% 67% -19 pp
� Higher throughput by 10% (y/y) and utilization ratio by 8pp (y/y), of
which: Płock (-) 15pp due to shutdowns of CDU III, Hydrogen Unit
and Hydrocracking; Unipetrol 50pp due to full availability of FCC and
Steam Cracker and ORLEN Lietuva 10pp as a result of shorter
maintenance shutdowns (y/y)
� Poland – lower throughput due shutdowns, however higher fuel sales
due to intercompany exchange of products. Lower petchem volumes
due to PX/PTA and Olefins shutdowns.
� Czech Republic – petchem sales increase due to Steam Cracker
relaunch in 4Q16 and higher fuel sales due to favourable market
conditions and full availability of FCC.
� ORLEN Lietuva – lower sales mainly due seaborne sales limitation at
higher inland sales.
12
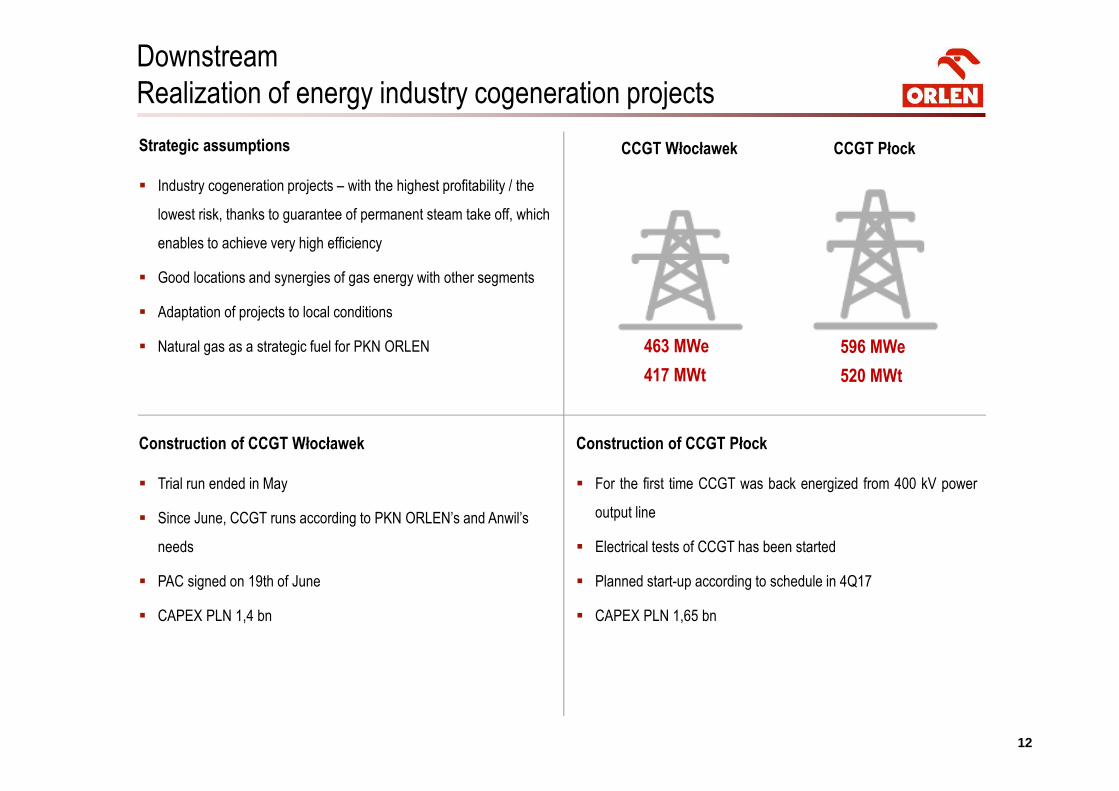
Construction of CCGT Włocławek
� Trial run ended in May
� Since June, CCGT runs according to PKN ORLEN’s and Anwil’s
needs
� PAC signed on 19th of June
� CAPEX PLN 1,4 bn
Construction of CCGT Płock
� For the first time CCGT was back energized from 400 kV power
output line
� Electrical tests of CCGT has been started
� Planned start-up according to schedule in 4Q17
� CAPEX PLN 1,65 bn
Downstream
Realization of energy industry cogeneration projects
12
Strategic assumptions
� Industry cogeneration projects – with the highest profitability / the
lowest risk, thanks to guarantee of permanent steam take off, which
enables to achieve very high efficiency
� Good locations and synergies of gas energy with other segments
� Adaptation of projects to local conditions
� Natural gas as a strategic fuel for PKN ORLEN 463 MWe
417 MWt
596 MWe
520 MWt
CCGT Włocławek CCGT Płock
1313
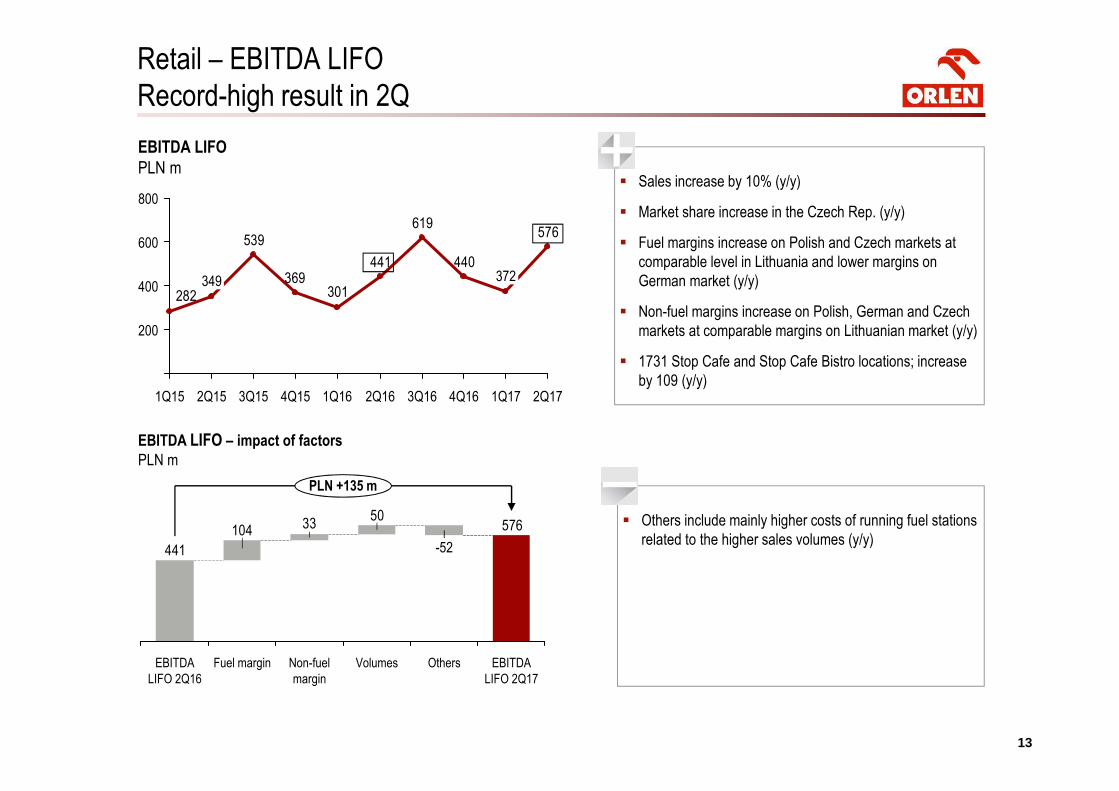
� Sales increase by 10% (y/y)
� Market share increase in the Czech Rep. (y/y)
� Fuel margins increase on Polish and Czech markets at
comparable level in Lithuania and lower margins on
German market (y/y)
� Non-fuel margins increase on Polish, German and Czech
markets at comparable margins on Lithuanian market (y/y)
� 1731 Stop Cafe and Stop Cafe Bistro locations; increase
by 109 (y/y)
Retail – EBITDA LIFO
Record-high result in 2Q
57650
33104
441
PLN +135 m
EBITDA
LIFO 2Q17
OthersVolumesNon-fuel
margin
Fuel marginEBITDA
LIFO 2Q16
-52
EBITDA LIFO – impact of factors
PLN m
EBITDA LIFO
PLN m
576
440
619
441
301369
539
282400
200
600
800
2Q16 2Q17
372
1Q171Q164Q153Q152Q15
349
1Q15 3Q16 4Q16
� Others include mainly higher costs of running fuel stations
related to the higher sales volumes (y/y)
14
Number of Stop Cafe and Stop Cafe Bistro in Poland
#
Retail – operational data
Increase of sales, fuel margins and non-fuel margins (y/y)
Number of petrol stations and market shares (by volume)
#, %
Sales volumes
mt
2,3
2,1
2,2
2,1
1,9
2,0
2,1
2,0
1,5
2,0
2,5
1Q15 2Q161Q164Q152Q15 2Q17
1,8
4Q16 1Q173Q16
+ 10%
2,0
3Q15
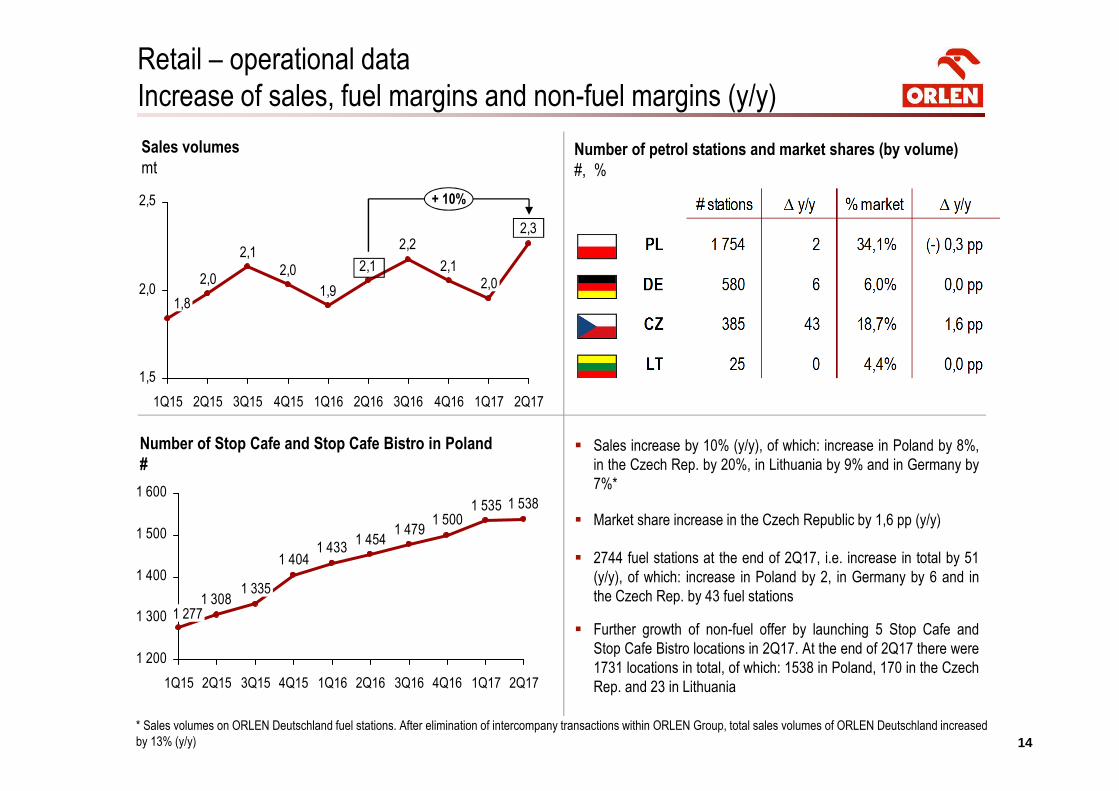
� Sales increase by 10% (y/y), of which: increase in Poland by 8%,
in the Czech Rep. by 20%, in Lithuania by 9% and in Germany by
7%*
� Market share increase in the Czech Republic by 1,6 pp (y/y)
� 2744 fuel stations at the end of 2Q17, i.e. increase in total by 51
(y/y), of which: increase in Poland by 2, in Germany by 6 and in
the Czech Rep. by 43 fuel stations
� Further growth of non-fuel offer by launching 5 Stop Cafe and
Stop Cafe Bistro locations in 2Q17. At the end of 2Q17 there were
1731 locations in total, of which: 1538 in Poland, 170 in the Czech
Rep. and 23 in Lithuania
1 5381 5351 500
1 4791 454
1 4331 404
1 308
1 200
1 300
1 400
1 500
1 600
3Q16 1Q17 2Q171Q164Q15
1 335
1 277
4Q163Q15 2Q162Q151Q15
* Sales volumes on ORLEN Deutschland fuel stations. After elimination of intercompany transactions within ORLEN Group, total sales volumes of ORLEN Deutschland increased
by 13% (y/y)
1515
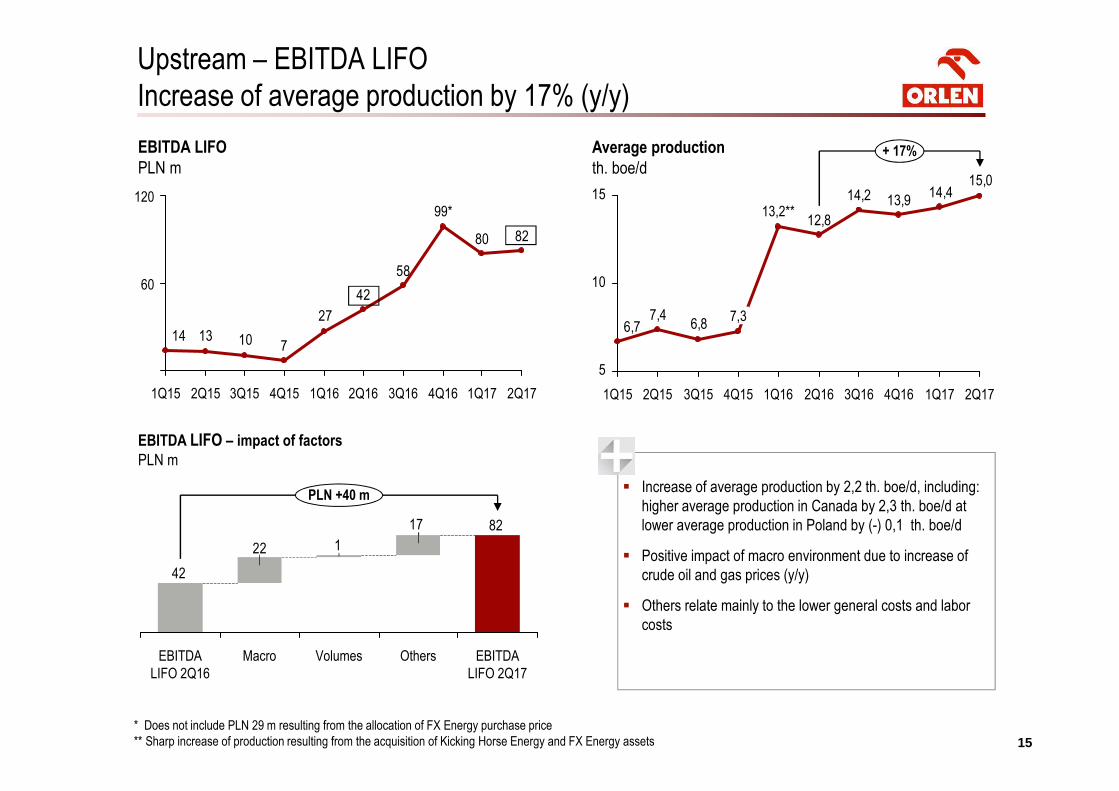
� Increase of average production by 2,2 th. boe/d, including:
higher average production in Canada by 2,3 th. boe/d at
lower average production in Poland by (-) 0,1 th. boe/d
� Positive impact of macro environment due to increase of
crude oil and gas prices (y/y)
� Others relate mainly to the lower general costs and labor
costs
Upstream – EBITDA LIFO
Increase of average production by 17% (y/y)
EBITDA LIFO – impact of factors
PLN m
EBITDA LIFO
PLN m
8280
58
42
27
7101314
60
120
4Q16 1Q173Q162Q16 2Q171Q16
99*
2Q151Q15 3Q15 4Q15
* Does not include PLN 29 m resulting from the allocation of FX Energy purchase price
** Sharp increase of production resulting from the acquisition of Kicking Horse Energy and FX Energy assets
8217
122
42
Macro Volumes EBITDA
LIFO 2Q17
PLN +40 m
EBITDA
LIFO 2Q16
Others
Average production
th. boe/d15,0
14,413,914,2
12,8
6,87,4
6,7
5
10
15
1Q173Q161Q15 2Q17
13,2**
1Q16
+ 17%
3Q152Q15 4Q164Q15 2Q16
7,3
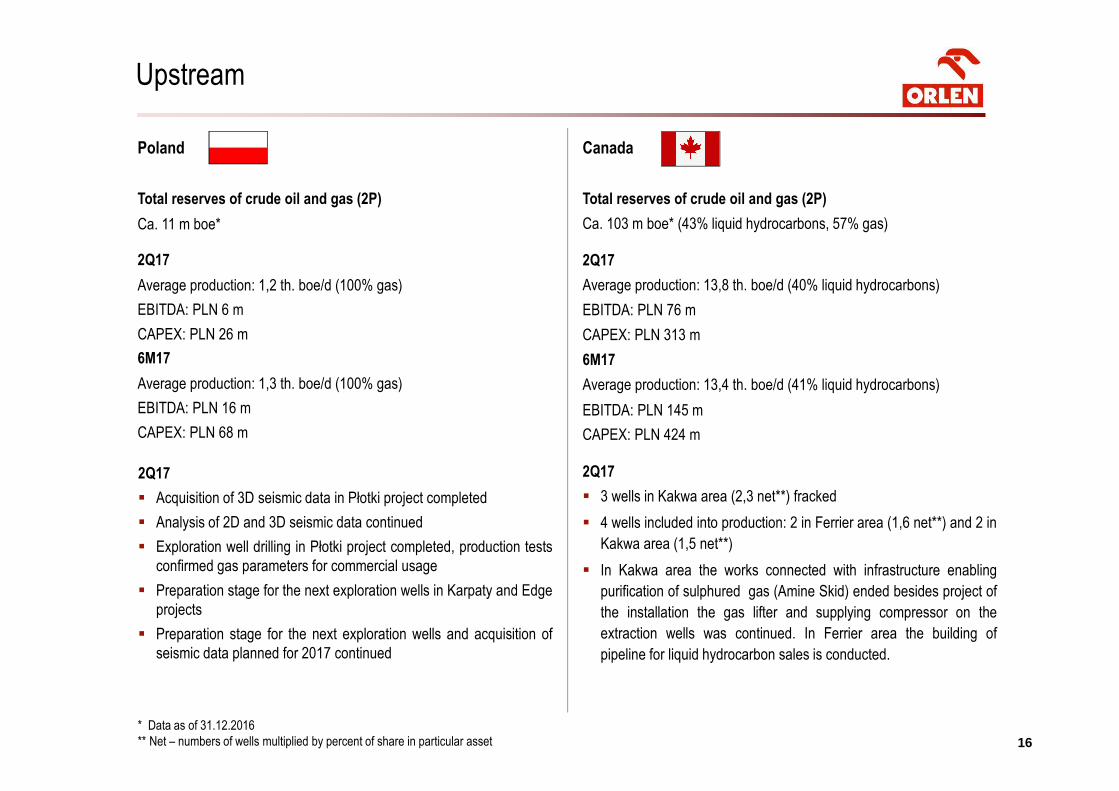
Poland
Total reserves of crude oil and gas (2P)
Ca. 11 m boe*
2Q17
Average production: 1,2 th. boe/d (100% gas)
EBITDA: PLN 6 m
CAPEX: PLN 26 m
6M17
Average production: 1,3 th. boe/d (100% gas)
EBITDA: PLN 16 m
CAPEX: PLN 68 m
Upstream
16* Data as of 31.12.2016
** Net – numbers of wells multiplied by percent of share in particular asset
2Q17
� Acquisition of 3D seismic data in Płotki project completed
� Analysis of 2D and 3D seismic data continued
� Exploration well drilling in Płotki project completed, production tests
confirmed gas parameters for commercial usage
� Preparation stage for the next exploration wells in Karpaty and Edge
projects
� Preparation stage for the next exploration wells and acquisition of
seismic data planned for 2017 continued
Canada
Total reserves of crude oil and gas (2P)
Ca. 103 m boe* (43% liquid hydrocarbons, 57% gas)
2Q17
Average production: 13,8 th. boe/d (40% liquid hydrocarbons)
EBITDA: PLN 76 m
CAPEX: PLN 313 m
6M17
Average production: 13,4 th. boe/d (41% liquid hydrocarbons)
EBITDA: PLN 145 m
CAPEX: PLN 424 m
2Q17
� 3 wells in Kakwa area (2,3 net**) fracked
� 4 wells included into production: 2 in Ferrier area (1,6 net**) and 2 in
Kakwa area (1,5 net**)
� In Kakwa area the works connected with infrastructure enabling
purification of sulphured gas (Amine Skid) ended besides project of
the installation the gas lifter and supplying compressor on the
extraction wells was continued. In Ferrier area the building of
pipeline for liquid hydrocarbon sales is conducted.
Key highlights 2Q17
Macroeconomic environment
Liquidity and investments
Market outlook for 2017
Agenda
Financial and operating results
17
1818
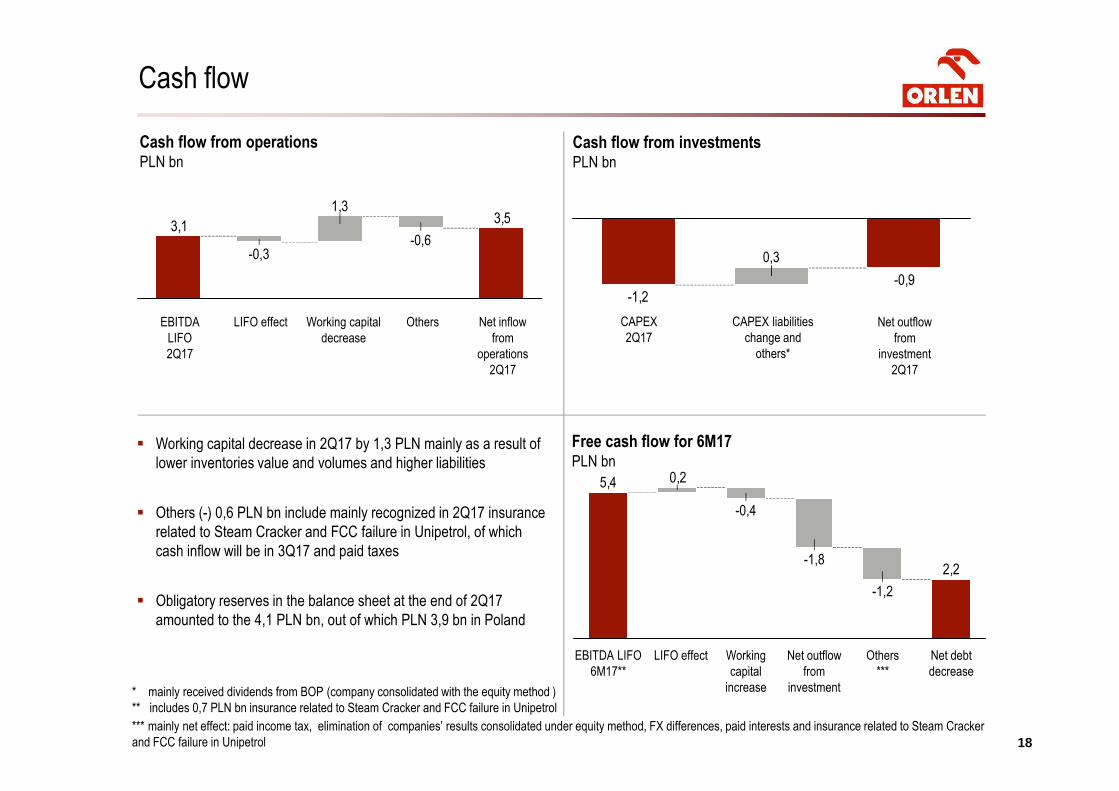
Cash flow
Cash flow from operationsPLN bn
Cash flow from investmentsPLN bn
CAPEX
2Q17
CAPEX liabilities
change and
others*
Net outflow
from
investment
2Q17
3,51,3
3,1-0,6
-0,3
LIFO effect Working capital
decrease
OthersEBITDA
LIFO
2Q17
Net inflow
from
operations
2Q17
Free cash flow for 6M17PLN bn
� Working capital decrease in 2Q17 by 1,3 PLN mainly as a result of
lower inventories value and volumes and higher liabilities
� Others (-) 0,6 PLN bn include mainly recognized in 2Q17 insurance
related to Steam Cracker and FCC failure in Unipetrol, of which
cash inflow will be in 3Q17 and paid taxes
� Obligatory reserves in the balance sheet at the end of 2Q17
amounted to the 4,1 PLN bn, out of which PLN 3,9 bn in Poland
-0,9-1,2
0,3
2,2
0,25,4
-1,8
-0,4
Net debt
decrease
Others
***
Net outflow
from
investment
Working
capital
increase
LIFO effectEBITDA LIFO
6M17**
-1,2
* mainly received dividends from BOP (company consolidated with the equity method )
** includes 0,7 PLN bn insurance related to Steam Cracker and FCC failure in Unipetrol
*** mainly net effect: paid income tax, elimination of companies’ results consolidated under equity method, FX differences, paid interests and insurance related to Steam Cracker
and FCC failure in Unipetrol
1919
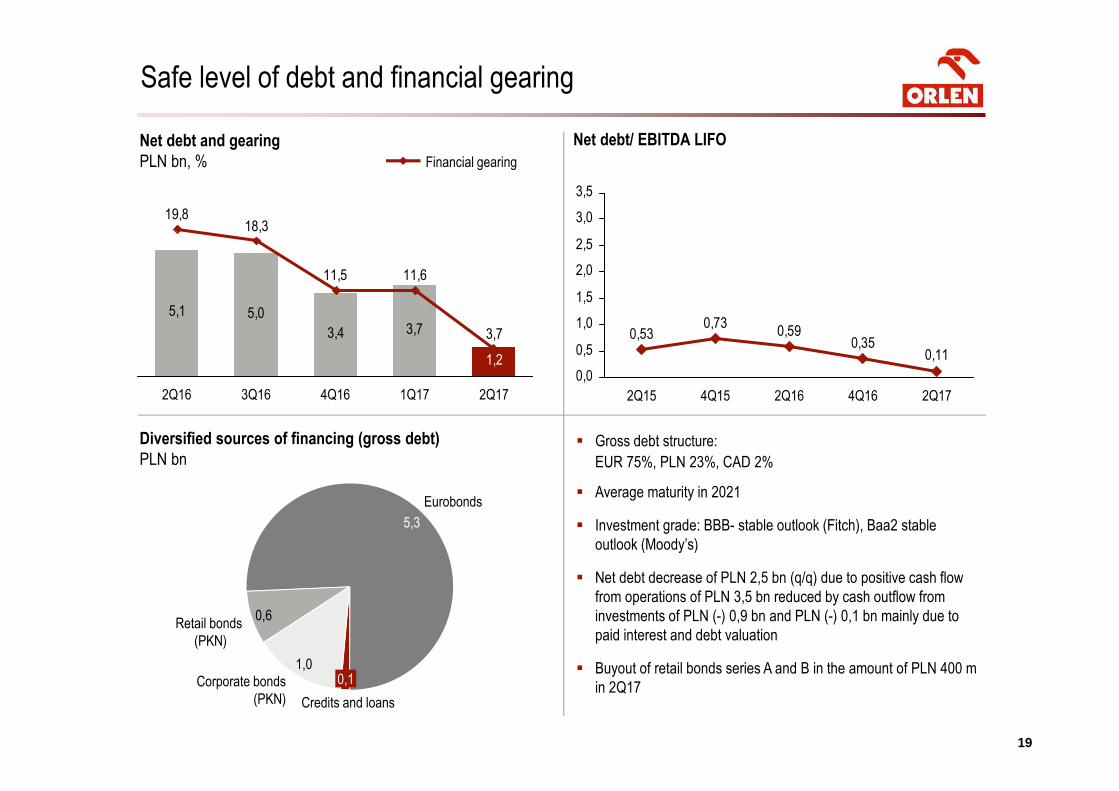
� Gross debt structure:
EUR 75%, PLN 23%, CAD 2%
� Average maturity in 2021
� Investment grade: BBB- stable outlook (Fitch), Baa2 stable
outlook (Moody’s)
� Net debt decrease of PLN 2,5 bn (q/q) due to positive cash flow
from operations of PLN 3,5 bn reduced by cash outflow from
investments of PLN (-) 0,9 bn and PLN (-) 0,1 bn mainly due to
paid interest and debt valuation
� Buyout of retail bonds series A and B in the amount of PLN 400 m
in 2Q17
Net debt and gearing
PLN bn, %
Diversified sources of financing (gross debt)
PLN bn
5,1 5,0
3,4 3,7
1,2
3,7
11,611,5
18,319,8
2Q16 3Q16 2Q174Q16 1Q17
Financial gearing
Eurobonds
5,3
Retail bonds
(PKN)
0,6
Corporate bonds
(PKN) Credits and loans
0,11,0
Safe level of debt and financial gearing
0,110,35
0,590,73
0,53
0,0
0,5
1,0
1,5
2,0
2,5
3,0
3,5
2Q15 4Q15 2Q16 4Q16 2Q17
Net debt/ EBITDA LIFO
2020
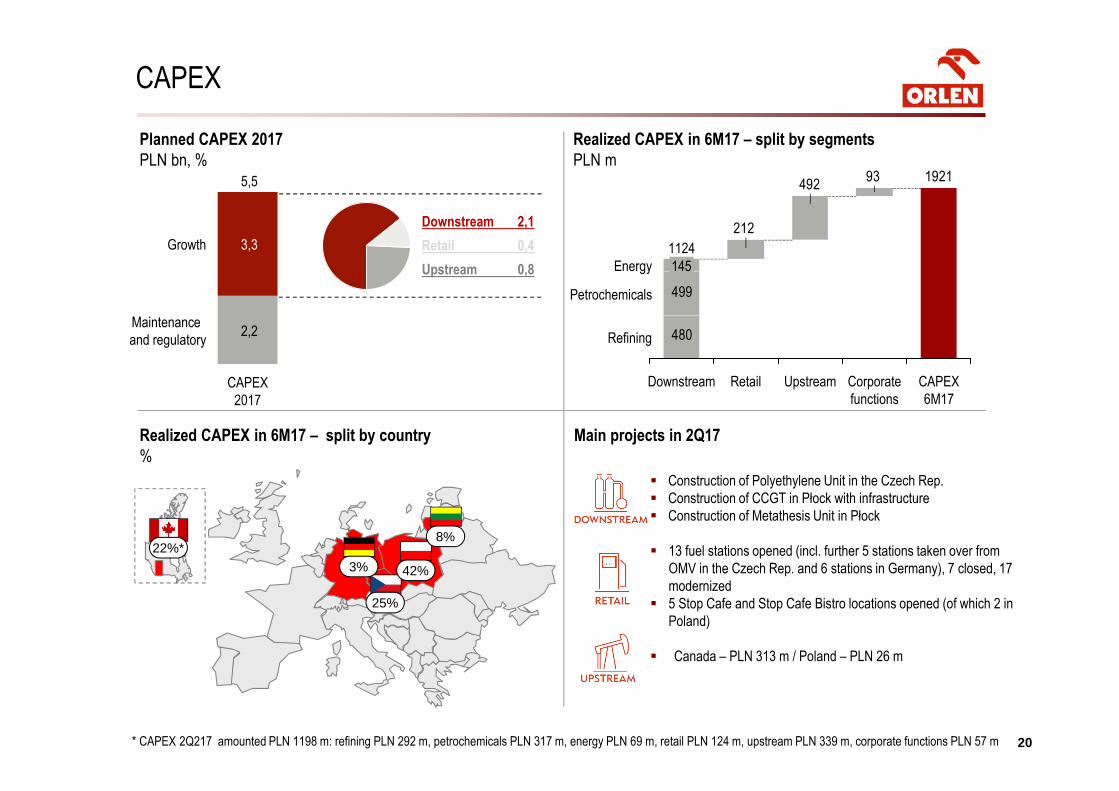
CAPEX
Main projects in 2Q17
Planned CAPEX 2017
PLN bn, %
� Construction of Polyethylene Unit in the Czech Rep.
� Construction of CCGT in Płock with infrastructure
� Construction of Metathesis Unit in Płock
� 13 fuel stations opened (incl. further 5 stations taken over from
OMV in the Czech Rep. and 6 stations in Germany), 7 closed, 17
modernized
� 5 Stop Cafe and Stop Cafe Bistro locations opened (of which 2 in
Poland)
� Canada – PLN 313 m / Poland – PLN 26 m
Realized CAPEX in 6M17 – split by segments
PLN m
480
192193
212
492
499
Refining
Petrochemicals
Energy
CAPEX
6M17
Corporate
functions
UpstreamRetailDownstream
1124
145
5,85,1
Maintenance
and regulatory
Growth
CAPEX
2017
5,5
2,2
3,3
Downstream 2,1
Retail 0,4
Upstream 0,8
Realized CAPEX in 6M17 – split by country
%
42%
25%
8%
3%22%*
* CAPEX 2Q217 amounted PLN 1198 m: refining PLN 292 m, petrochemicals PLN 317 m, energy PLN 69 m, retail PLN 124 m, upstream PLN 339 m, corporate functions PLN 57 m
Key highlights 2Q17
Macroeconomic environment
Liquidity and investments
Market outlook for 2017
Agenda
Financial and operating results
21
2222
Market outlook for 2017
* Poland (NBP, July 2017); Germany (IMF, April 2017); Czech Rep. (CNB, May 2017); Lithuania (Lietuvos Bankas, June 2017)
Macroeconomic environment
� Brent crude oil price – expected increase of yearly average crude oil price vs. the average for 2016 due to limited supply as a
result of the main producers agreement (OPEC) at simultaneous higher production in US and higher consumption.
� Downstream margin – high margin level recorded in 1H17 due to relatively low crude oil price and increase in consumption of
fuels and petrochemical products may be under the pressure in 2H17. Nevertheless, it is likely that yearly average margin
will be above or close to the average margin from 2016.
Economy
� GDP outlook for 2017* - the highest increase is estimated for Poland in amount of 4,0% (y/y). GDP growth on our other
markets: the Czech Rep. 2,9%, Lithuania 3,3%, Germany 1,6%.
� Fuel consumption – expected fuel demand increase in Poland, the Czech Rep. and Lithuania along with flat consumption in
Germany. Growth dynamics in Poland maintained as a result of limited grey zone and higher consumption due to economic
growth.
Regulatory environment
� Grey zone – implemented regulations limiting grey zone: fuel package (August 2016), energy package (September 2016)
and transportation package (from 18 April 2017)
� Obligatory crude oil reserves – reduction of reserves in 2017 from 60 to 53 days (ca. 0,3 mt). Currently 57 days is applied.
Reduction to 53 days from 30 December 2017.
� National Index Target – reduction of ratio for PKN ORLEN in 2017 from 6,035% to 5,822%.
Thank you for your attention
For more information on PKN ORLEN, please contact Investor Relations Department:
phone: + 48 24 256 81 80
fax: + 48 24 367 77 11
e-mail: [email protected]
www.orlen.pl
2424
Agenda
Supporting slides
2525
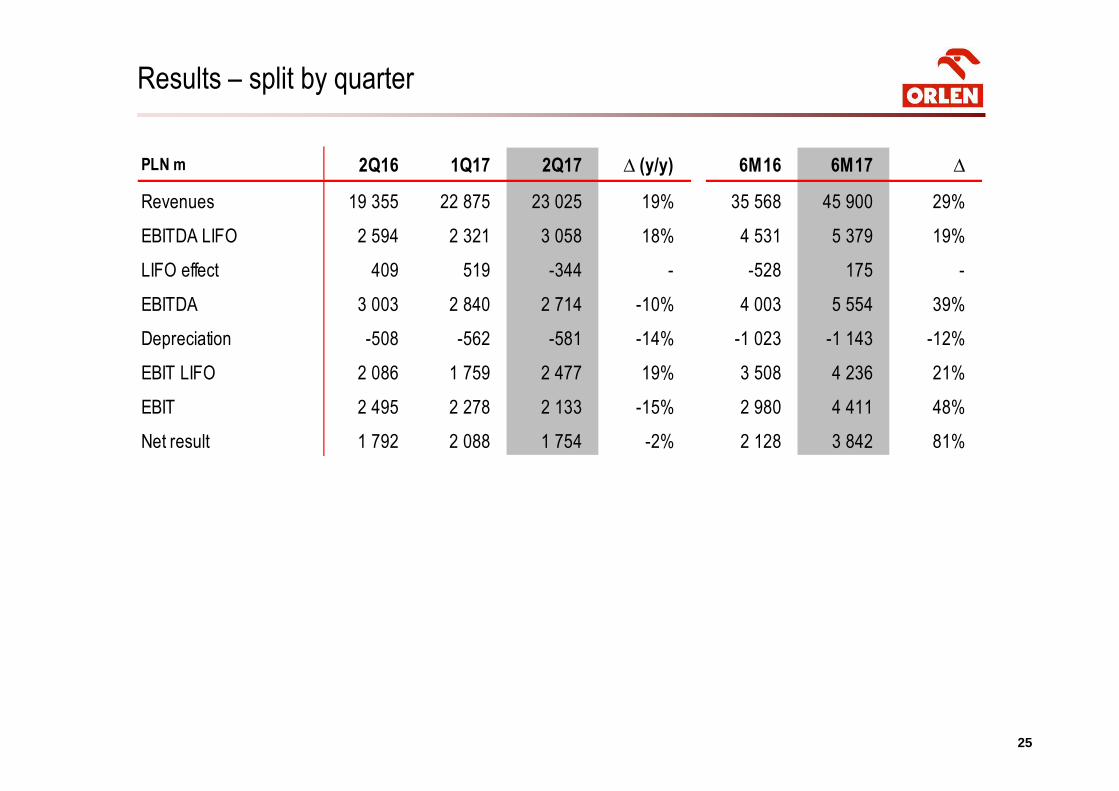
PLN m 2Q16 1Q17 2Q17 ∆ (y/y) 6M16 6M17 ∆
Revenues 19 355 22 875 23 025 19% 35 568 45 900 29%
EBITDA LIFO 2 594 2 321 3 058 18% 4 531 5 379 19%
LIFO effect 409 519 -344 - -528 175 -
EBITDA 3 003 2 840 2 714 -10% 4 003 5 554 39%
Depreciation -508 -562 -581 -14% -1 023 -1 143 -12%
EBIT LIFO 2 086 1 759 2 477 19% 3 508 4 236 21%
EBIT 2 495 2 278 2 133 -15% 2 980 4 411 48%
Net result 1 792 2 088 1 754 -2% 2 128 3 842 81%
Results – split by quarter
2626
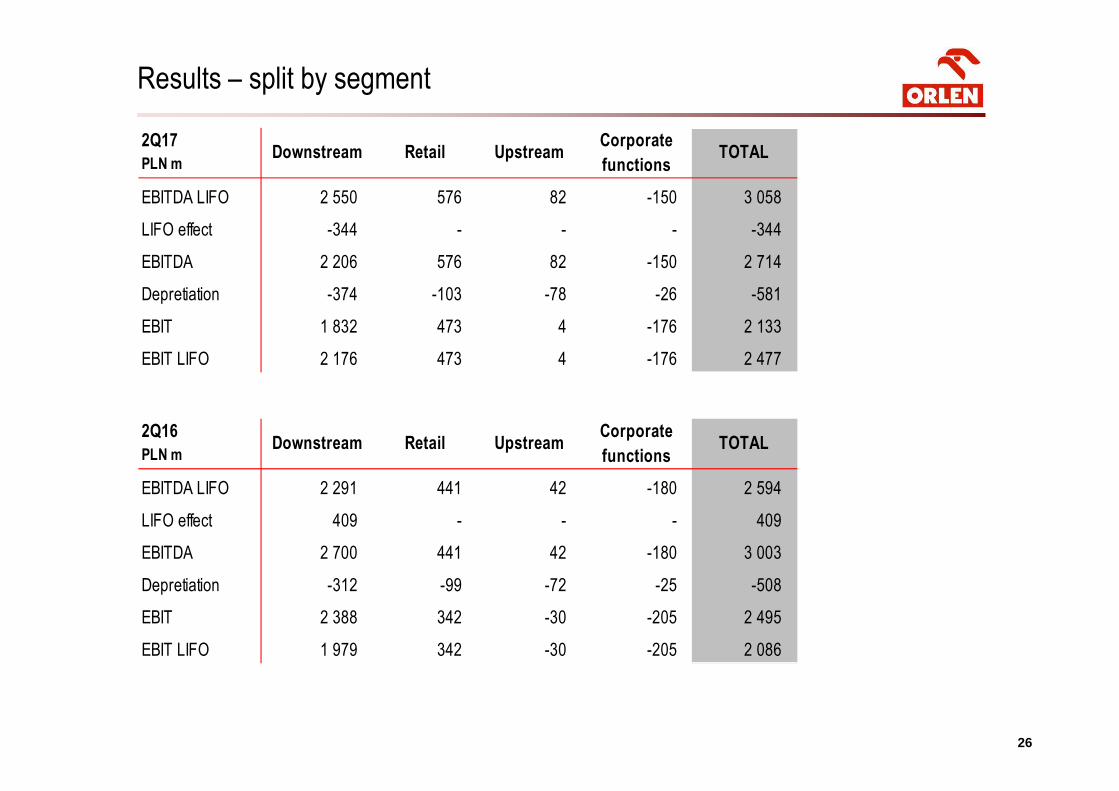
2Q17
PLN mDownstream Retail Upstream
Corporate
functionsTOTAL
EBITDA LIFO 2 550 576 82 -150 3 058
LIFO effect -344 - - - -344
EBITDA 2 206 576 82 -150 2 714
Depretiation -374 -103 -78 -26 -581
EBIT 1 832 473 4 -176 2 133
EBIT LIFO 2 176 473 4 -176 2 477
2Q16
PLN mDownstream Retail Upstream
Corporate
functionsTOTAL
EBITDA LIFO 2 291 441 42 -180 2 594
LIFO effect 409 - - - 409
EBITDA 2 700 441 42 -180 3 003
Depretiation -312 -99 -72 -25 -508
EBIT 2 388 342 -30 -205 2 495
EBIT LIFO 1 979 342 -30 -205 2 086
Results – split by segment
2727
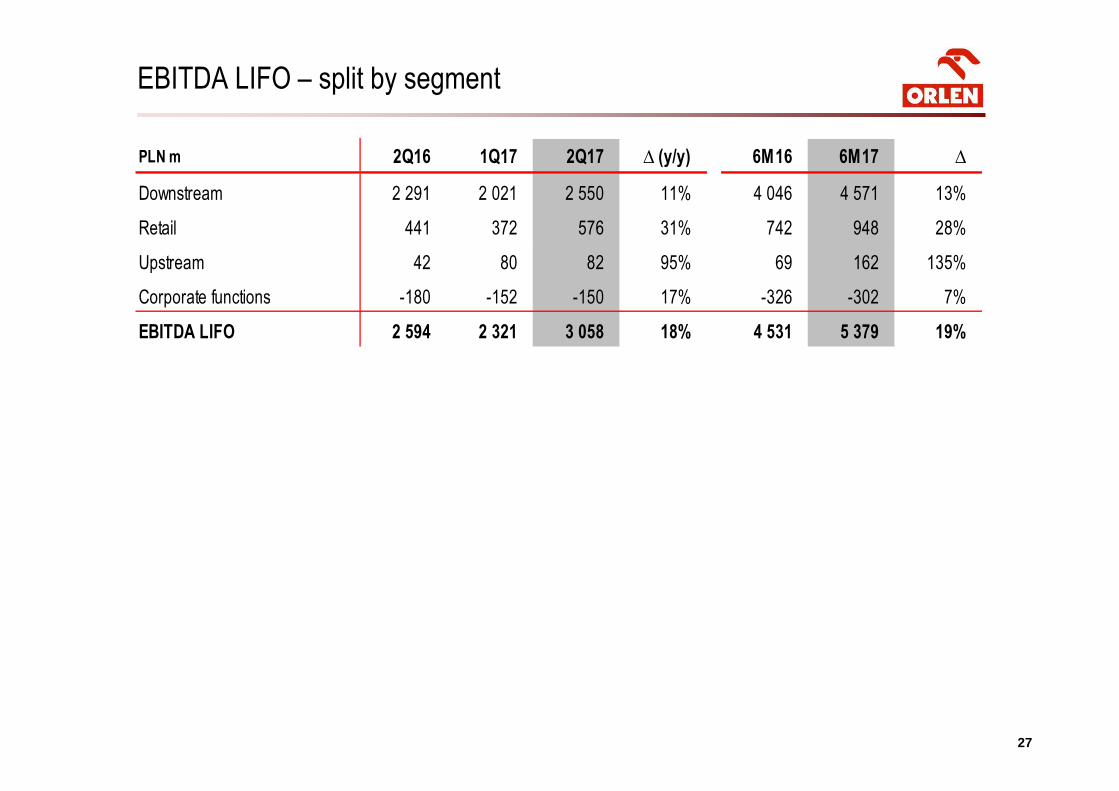
EBITDA LIFO – split by segment
PLN m 2Q16 1Q17 2Q17 ∆ (y/y) 6M16 6M17 ∆
Downstream 2 291 2 021 2 550 11% 4 046 4 571 13%
Retail 441 372 576 31% 742 948 28%
Upstream 42 80 82 95% 69 162 135%
Corporate functions -180 -152 -150 17% -326 -302 7%
EBITDA LIFO 2 594 2 321 3 058 18% 4 531 5 379 19%
2828
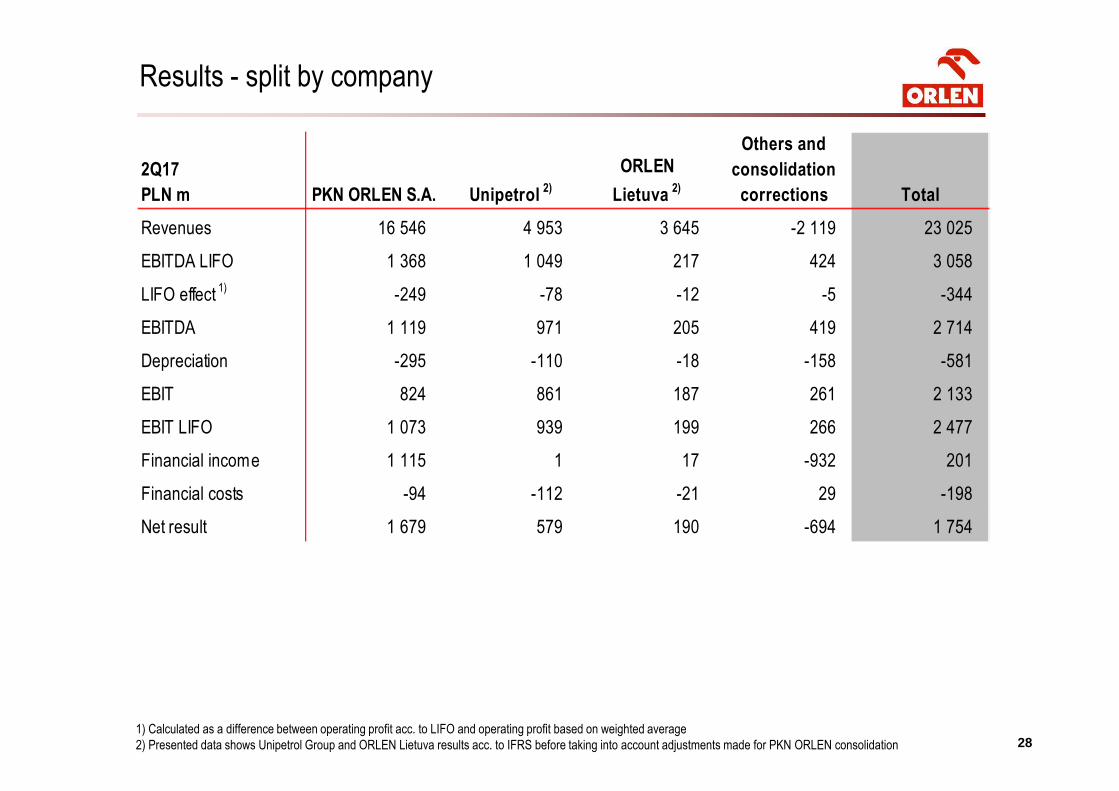
Results - split by company
1) Calculated as a difference between operating profit acc. to LIFO and operating profit based on weighted average
2) Presented data shows Unipetrol Group and ORLEN Lietuva results acc. to IFRS before taking into account adjustments made for PKN ORLEN consolidation
2Q17
PLN m PKN ORLEN S.A. Unipetrol 2)
ORLEN
Lietuva 2)
Others and
consolidation
corrections Total
Revenues 16 546 4 953 3 645 -2 119 23 025
EBITDA LIFO 1 368 1 049 217 424 3 058
LIFO effect 1)
-249 -78 -12 -5 -344
EBITDA 1 119 971 205 419 2 714
Depreciation -295 -110 -18 -158 -581
EBIT 824 861 187 261 2 133
EBIT LIFO 1 073 939 199 266 2 477
Financial income 1 115 1 17 -932 201
Financial costs -94 -112 -21 29 -198
Net result 1 679 579 190 -694 1 754
2929
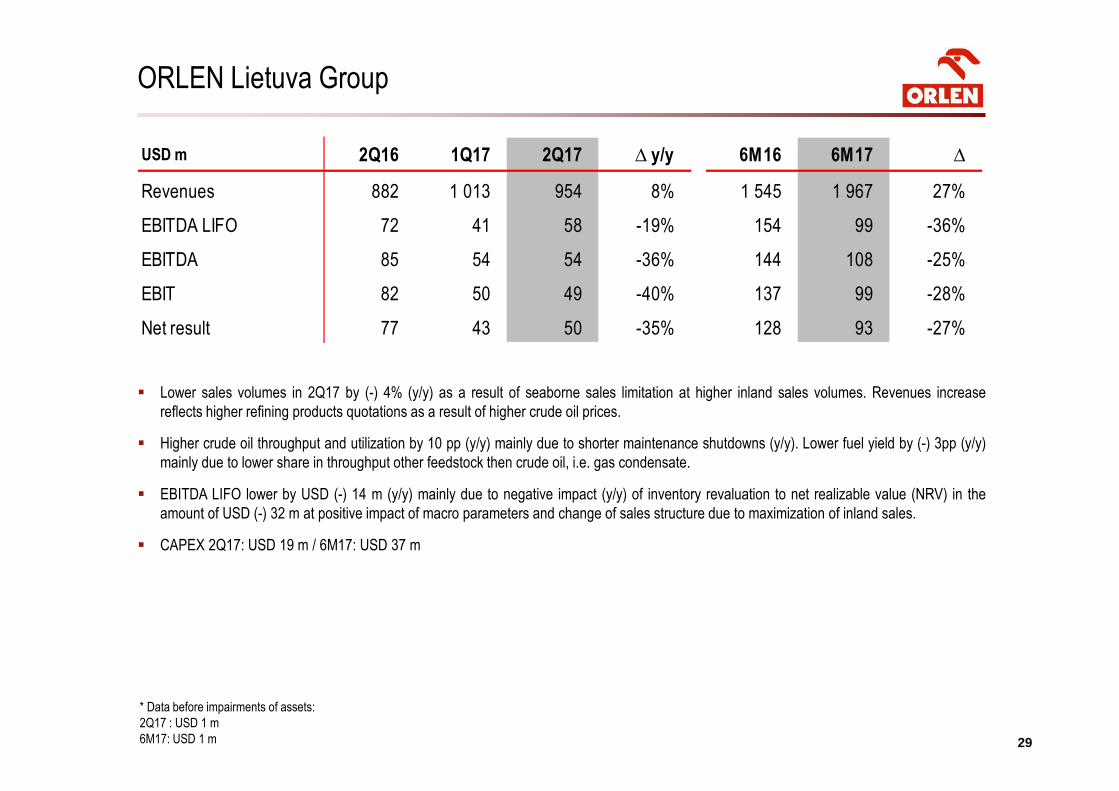
� Lower sales volumes in 2Q17 by (-) 4% (y/y) as a result of seaborne sales limitation at higher inland sales volumes. Revenues increase
reflects higher refining products quotations as a result of higher crude oil prices.
� Higher crude oil throughput and utilization by 10 pp (y/y) mainly due to shorter maintenance shutdowns (y/y). Lower fuel yield by (-) 3pp (y/y)
mainly due to lower share in throughput other feedstock then crude oil, i.e. gas condensate.
� EBITDA LIFO lower by USD (-) 14 m (y/y) mainly due to negative impact (y/y) of inventory revaluation to net realizable value (NRV) in the
amount of USD (-) 32 m at positive impact of macro parameters and change of sales structure due to maximization of inland sales.
� CAPEX 2Q17: USD 19 m / 6M17: USD 37 m
USD m 2Q16 1Q17 2Q17 ∆ y/y 6M16 6M17 ∆
Revenues 882 1 013 954 8% 1 545 1 967 27%
EBITDA LIFO 72 41 58 -19% 154 99 -36%
EBITDA 85 54 54 -36% 144 108 -25%
EBIT 82 50 49 -40% 137 99 -28%
Net result 77 43 50 -35% 128 93 -27%
ORLEN Lietuva Group
* Data before impairments of assets:
2Q17 : USD 1 m
6M17: USD 1 m
3030
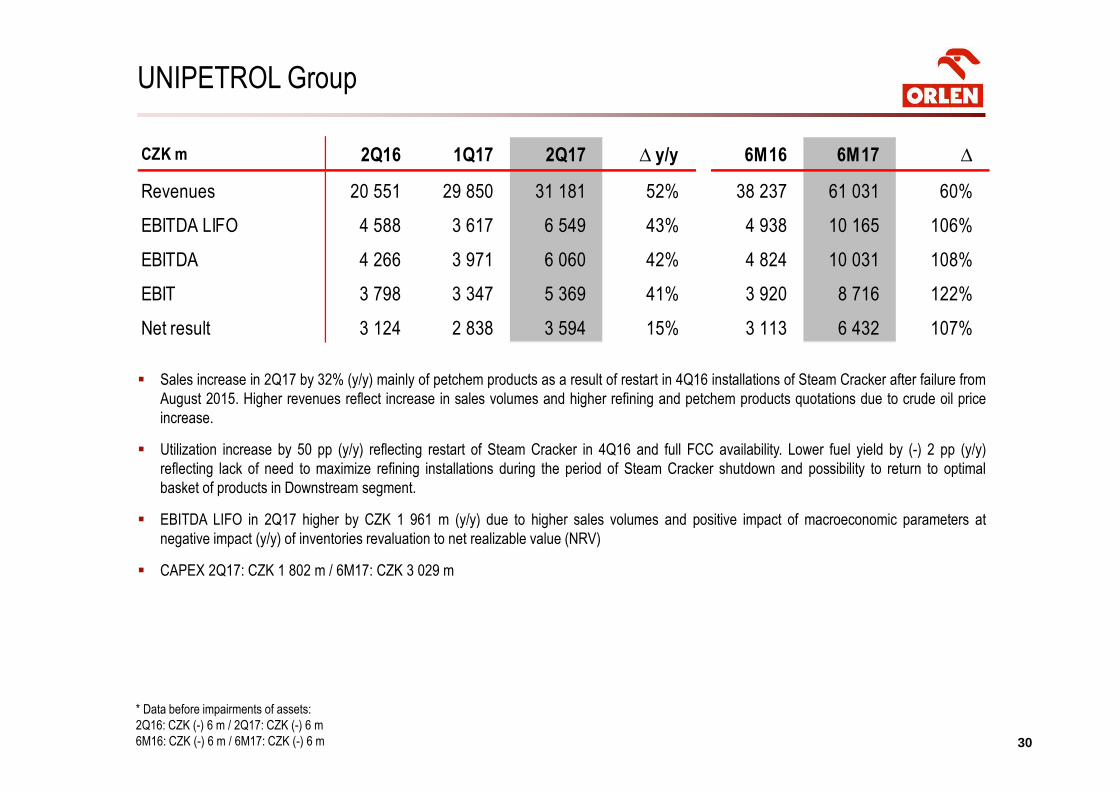
� Sales increase in 2Q17 by 32% (y/y) mainly of petchem products as a result of restart in 4Q16 installations of Steam Cracker after failure from
August 2015. Higher revenues reflect increase in sales volumes and higher refining and petchem products quotations due to crude oil price
increase.
� Utilization increase by 50 pp (y/y) reflecting restart of Steam Cracker in 4Q16 and full FCC availability. Lower fuel yield by (-) 2 pp (y/y)
reflecting lack of need to maximize refining installations during the period of Steam Cracker shutdown and possibility to return to optimal
basket of products in Downstream segment.
� EBITDA LIFO in 2Q17 higher by CZK 1 961 m (y/y) due to higher sales volumes and positive impact of macroeconomic parameters at
negative impact (y/y) of inventories revaluation to net realizable value (NRV)
� CAPEX 2Q17: CZK 1 802 m / 6M17: CZK 3 029 m
CZK m 2Q16 1Q17 2Q17 ∆ y/y 6M16 6M17 ∆
Revenues 20 551 29 850 31 181 52% 38 237 61 031 60%
EBITDA LIFO 4 588 3 617 6 549 43% 4 938 10 165 106%
EBITDA 4 266 3 971 6 060 42% 4 824 10 031 108%
EBIT 3 798 3 347 5 369 41% 3 920 8 716 122%
Net result 3 124 2 838 3 594 15% 3 113 6 432 107%
UNIPETROL Group
* Data before impairments of assets:
2Q16: CZK (-) 6 m / 2Q17: CZK (-) 6 m
6M16: CZK (-) 6 m / 6M17: CZK (-) 6 m
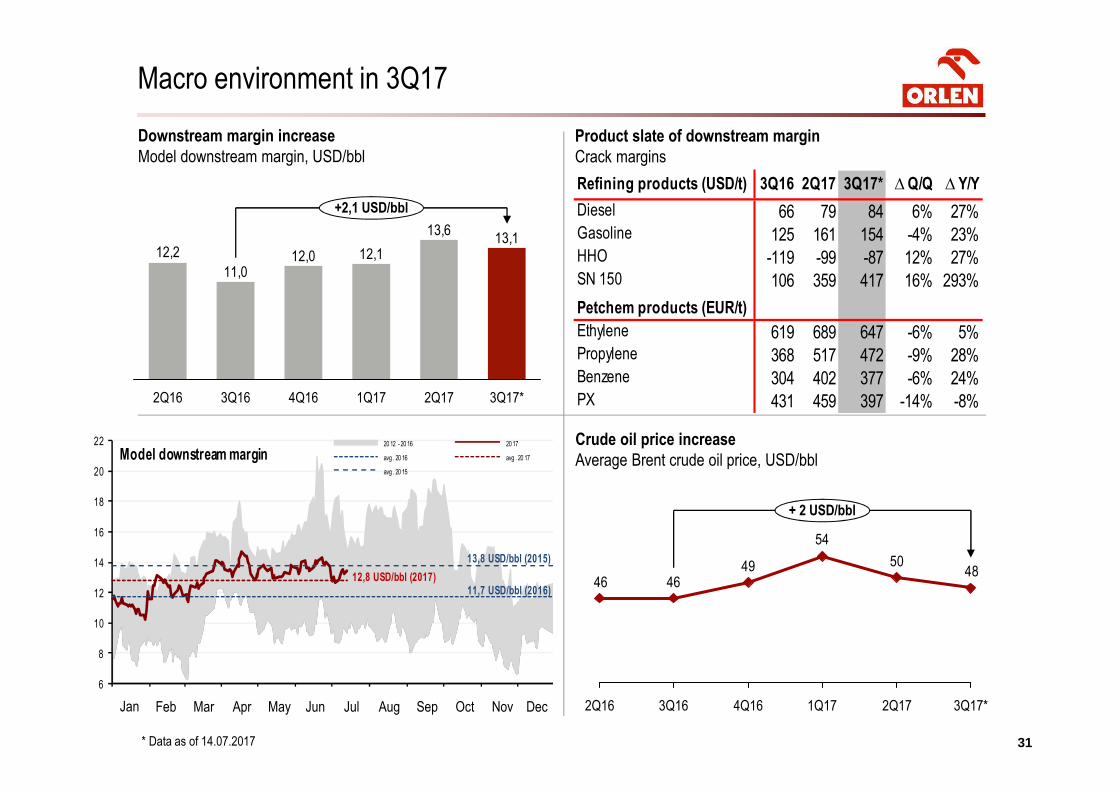
Macro environment in 3Q17
Downstream margin increase
Model downstream margin, USD/bbl
Product slate of downstream margin
Crack margins
Crude oil price increase
Average Brent crude oil price, USD/bbl
Refining products (USD/t) 3Q16 2Q17 3Q17* ∆ Q/Q ∆ Y/Y
Diesel 66 79 84 6% 27%Gasoline 125 161 154 -4% 23%HHO -119 -99 -87 12% 27%SN 150 106 359 417 16% 293%
Petchem products (EUR/t)
Ethylene 619 689 647 -6% 5%Propylene 368 517 472 -9% 28%Benzene 304 402 377 -6% 24%PX 431 459 397 -14% -8%
31
Jan Feb Mar Apr May Jun Jul Aug Sep Oct Nov Dec
6
8
10
12
14
16
18
20
22
Model downstream margin20 12 - 20 16 20 17
avg . 20 16 avg . 20 17
avg . 20 15
11,7 USD/bbl (2016)12,8 USD/bbl (2017)
13,8 USD/bbl (2015)
13,113,6
12,112,011,0
12,2
3Q17*2Q171Q174Q16
+2,1 USD/bbl
3Q162Q16
4850
54
494646
2Q17
+ 2 USD/bbl
3Q17*4Q163Q162Q16 1Q17
* Data as of 14.07.2017
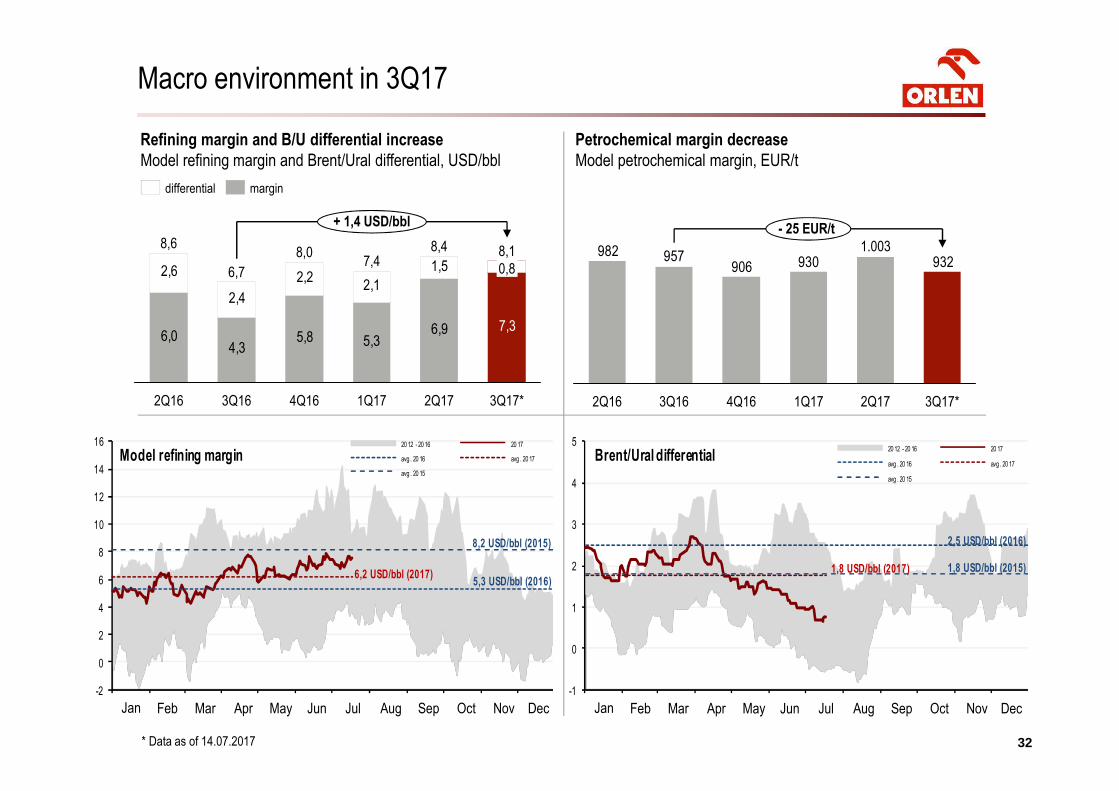
32
Refining margin and B/U differential increase
Model refining margin and Brent/Ural differential, USD/bbl
Petrochemical margin decrease
Model petrochemical margin, EUR/t
Macro environment in 3Q17
32
-2
0
2
4
6
8
10
12
14
16
Model refining margin20 12 - 20 16 20 17
avg . 20 16 avg . 20 17
avg . 20 15
5,3 USD/bbl (2016)6,2 USD/bbl (2017)
8,2 USD/bbl (2015)
-1
0
1
2
3
4
5
Brent/Ural differential20 12 - 20 16 20 17
avg . 20 16 avg . 20 17
avg . 20 15
2,5 USD/bbl (2016)
1,8 USD/bbl (2017) 1,8 USD/bbl (2015)
Jan Feb Mar Apr May Jun Jul Aug Sep Oct Nov Dec Jan Feb Mar Apr May Jun Jul Aug Sep Oct Nov Dec
6,04,3
5,8 5,36,9
2,6
2,4
2,22,1
1,5
7,3
8,1
+ 1,4 USD/bbl
3Q17*2Q17
8,4
1Q17
7,4
4Q16
8,0
3Q16
6,7
2Q16
8,6
0,8
margindifferential
930906957982
932
- 25 EUR/t
3Q17*2Q17
1.003
1Q174Q163Q162Q16
* Data as of 14.07.2017
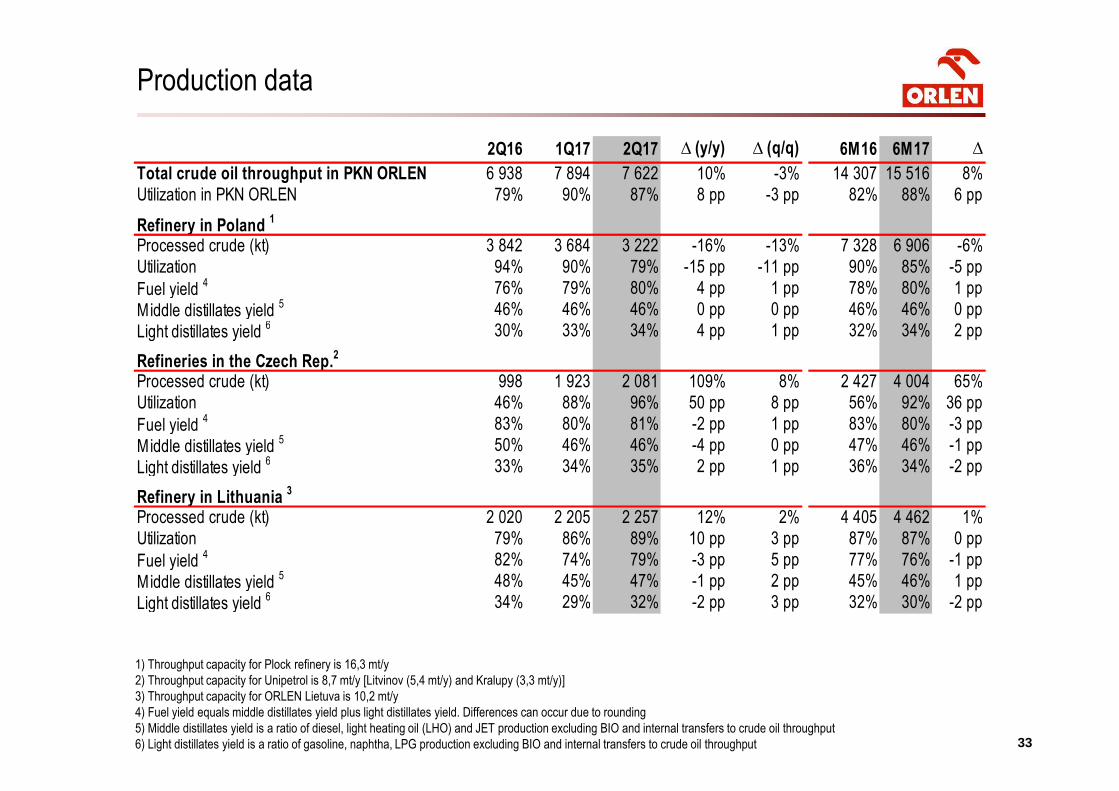
333333
1) Throughput capacity for Plock refinery is 16,3 mt/y
2) Throughput capacity for Unipetrol is 8,7 mt/y [Litvinov (5,4 mt/y) and Kralupy (3,3 mt/y)]
3) Throughput capacity for ORLEN Lietuva is 10,2 mt/y
4) Fuel yield equals middle distillates yield plus light distillates yield. Differences can occur due to rounding
5) Middle distillates yield is a ratio of diesel, light heating oil (LHO) and JET production excluding BIO and internal transfers to crude oil throughput
6) Light distillates yield is a ratio of gasoline, naphtha, LPG production excluding BIO and internal transfers to crude oil throughput
Production data
2Q16 1Q17 2Q17 ∆ (y/y) ∆ (q/q) 6M16 6M17 ∆
Total crude oil throughput in PKN ORLEN 6 938 7 894 7 622 10% -3% 14 307 15 516 8%
Utilization in PKN ORLEN 79% 90% 87% 8 pp -3 pp 82% 88% 6 pp
Refinery in Poland 1
Processed crude (kt) 3 842 3 684 3 222 -16% -13% 7 328 6 906 -6%
Utilization 94% 90% 79% -15 pp -11 pp 90% 85% -5 pp
Fuel yield 4 76% 79% 80% 4 pp 1 pp 78% 80% 1 pp
Middle distillates yield 5 46% 46% 46% 0 pp 0 pp 46% 46% 0 pp
Light distillates yield 6 30% 33% 34% 4 pp 1 pp 32% 34% 2 pp
Refineries in the Czech Rep.2
Processed crude (kt) 998 1 923 2 081 109% 8% 2 427 4 004 65%
Utilization 46% 88% 96% 50 pp 8 pp 56% 92% 36 pp
Fuel yield 4 83% 80% 81% -2 pp 1 pp 83% 80% -3 pp
Middle distillates yield 5 50% 46% 46% -4 pp 0 pp 47% 46% -1 pp
Light distillates yield 6 33% 34% 35% 2 pp 1 pp 36% 34% -2 pp
Refinery in Lithuania 3
Processed crude (kt) 2 020 2 205 2 257 12% 2% 4 405 4 462 1%
Utilization 79% 86% 89% 10 pp 3 pp 87% 87% 0 pp
Fuel yield 4 82% 74% 79% -3 pp 5 pp 77% 76% -1 pp
Middle distillates yield 5 48% 45% 47% -1 pp 2 pp 45% 46% 1 pp
Light distillates yield 6 34% 29% 32% -2 pp 3 pp 32% 30% -2 pp
3434
Dictionary
Model downstream margin = revenues (90,7% Products = 22,8% Gasoline + 44,2% Diesel + 15,3% HHO + 1,0% SN 150 + 2,9%
Ethylene + 2,1% Propylene + 1,2% Benzene + 1,2% PX) – costs (input 100% = 6,5% Brent crude oil + 91,1% URAL crude oil + 2,4%
natural gas)
Model refining margin = revenues (93,5% Products = 36% Gasoline + 43% Diesel + 14,5% HHO) - costs (100% input: crude oil and
other raw materials). Total input calculated acc. to Brent Crude quotations. Spot market quotations.
Spread Ural Rdam vs fwd Brent Dtd = Med Strip - Ural Rdam (Ural CIF Rotterdam).
Model petrochemical margin = revenues (98% Products = 44% HDPE + 7% LDPE + 35% PP Homo + 12% PP Copo) - costs (100%
input = 75% Naphtha + 25% LS VGO). Contract market quotations.
Fuel yield = middle distillates yield + gasoline yield (yields calculated in relation to crude oil)
Working capital (in balance sheet) = inventories + trading receivables and other receivables – trading liabilities and other liabilities
Working capital change (in cash flow) = changes in receivables + changes in inventories + changes in liabilities
Gearing = net debt / equity calculated acc. to average balance sheet amount in the period
Net debt = (short-term + long-term Interest-bearing loans and borrowings)– cash
3535
This presentation (“Presentation”) has been prepared by PKN ORLEN S.A. (“PKN ORLEN” or “Company”). Neither the Presentation nor any copy hereof may be copied,
distributed or delivered directly or indirectly to any person for any purpose without PKN ORLEN’s knowledge and consent. Copying, mailing, distribution or delivery of this
Presentation to any person in some jurisdictions may be subject to certain legal restrictions, and persons who may or have received this Presentation should familiarize
themselves with any such restrictions and abide by them. Failure to observe such restrictions may be deemed an infringement of applicable laws.
This Presentation contains neither a complete nor a comprehensive financial or commercial analysis of PKN ORLEN and of the ORLEN Group, nor does it present its position
or prospects in a complete or comprehensive manner. PKN ORLEN has prepared the Presentation with due care, however certain inconsistencies or omissions might have
appeared in it. Therefore it is recommended that any person who intends to undertake any investment decision regarding any security issued by PKN ORLEN or its subsidiaries
shall only rely on information released as an official communication by PKN ORLEN in accordance with the legal and regulatory provisions that are binding for PKN ORLEN.
The Presentation, as well as the attached slides and descriptions thereof may and do contain forward-looking statements. However, such statements must not be understood as
PKN ORLEN’s assurances or projections concerning future expected results of PKN ORLEN or companies of the ORLEN Group. The Presentation is not and shall not be
understood as a forecast of future results of PKN ORLEN as well as of the ORLEN Group.
It should be also noted that forward-looking statements, including statements relating to expectations regarding the future financial results give no guarantee or assurance that
such results will be achieved. The Management Board’s expectations are based on present knowledge, awareness and/or views of PKN ORLEN’s Management Board’s
members and are dependent on a number of factors, which may cause that the actual results that will be achieved by PKN ORLEN may differ materially from those discussed in
the document. Many such factors are beyond the present knowledge, awareness and/or control of the Company, or cannot be predicted by it.
No warranties or representations can be made as to the comprehensiveness or reliability of the information contained in this Presentation. Neither PKN ORLEN nor its directors,
managers, advisers or representatives of such persons shall bear any liability that might arise in connection with any use of this Presentation. Furthermore, no information
contained herein constitutes an obligation or representation of PKN ORLEN, its managers or directors, its Shareholders, subsidiary undertakings, advisers or representatives of
such persons.
This Presentation was prepared for information purposes only and is neither a purchase or sale offer, nor a solicitation of an offer to purchase or sell any securities or financial
instruments or an invitation to participate in any commercial venture. This Presentation is neither an offer nor an invitation to purchase or subscribe for any securities in any
jurisdiction and no statements contained herein may serve as a basis for any agreement, commitment or investment decision, or may be relied upon in connection with any
agreement, commitment or investment decision.
Disclaimer
For more information on PKN ORLEN, please contact Investor Relations Department:
phone: + 48 24 256 81 80
fax: + 48 24 367 77 11
e-mail: [email protected]
www.orlen.pl