Embed Size (px)
Citation preview
Planning and Financial Literacy: How Do Women Fare?
Annamaria Lusardi and Olivia S. Mitchell
August 2007
PRC WP2007-17 Pension Research Council Working Paper
Pension Research Council
The Wharton School, University of Pennsylvania 3620 Locust Walk, 3000 SH-DH
Philadelphia, PA 19104-6302 Tel: 215.898.7620 Fax: 215.573.3418
Email: [email protected] http://www.pensionresearchcouncil.org
The research reported herein was pursuant to a grant from the US Social Security Administration (SSA) funded as part of the Retirement Research Consortium (RRC); research support was also provided by the Pension Research Council and Boettner Center at the Wharton School. Without implicating them, we are grateful for comments provided by Alan Gustman and participants at the April 2006 MRRC researcher workshop. Opinions and errors are solely those of the authors and not of the institutions with whom the authors are affiliated. Financial support was also provided by the Pension Research Council and the Boettner Center at The Wharton School of the University of Pennsylvania. The findings and conclusions of this paper do not represent the views of the SSA, any agency of the Federal Government, the RRC, or any other institutions with which the authors may be affiliated. ©2007 Lusardi and Mitchell. All rights reserved. © 2007 Pension Research Council of the Wharton School of the University of Pennsylvania. All rights reserved.
Planning and Financial Literacy: How Do Women Fare?
Abstract Many older US households have done little or no planning for retirement, and there is a substantial population that seems to undersave for retirement. Of particular concern is the relative position of older women, who are more vulnerable to old-age poverty due to their longer longevity. This paper uses data from a special module we devised on planning and financial literacy in the 2004 Health and Retirement Study. The evidence indicates that women display much lower levels of financial literacy than the older population as a whole. In addition, women who are less financially literate are also less likely to plan for retirement and be successful planners. These findings have important implications for policy and for programs aimed at fostering financial security at older ages. Annamaria Lusardi Department of Economics Dartmouth College Hanover, NH 03755 Tel: (603) 646-2099 Fax: (603) 646-2122 E-mail: [email protected] Olivia S. Mitchell Department of Insurance & Risk Management The Wharton School, Univ. of Pennsylvania 3620 Locust Walk, St. 3000 SH-DH Philadelphia, PA 19104 Tel: (215) 898-0424 E-mail: [email protected]
1
Planning and Financial Literacy: How Do Women Fare?
Many US households have done little or no planning for retirement, and there is a
substantial population that seems to undersave for retirement.1 For instance, Lusardi (1999) uses
the 1992 Health and Retirement Study (HRS) to show that as many as one in three respondents
over the age of 50 had given no thought to retirement, even when they were only five to 10 years
away from retirement. There is little understanding of the reasons that people fail to plan for
retirement, along with the roles that planning and information costs play in affecting retirement
saving decisions. Yet lack of planning has important consequences for savings and portfolio
choice, since there is evidence that those who do not plan accumulate much less wealth than
those who plan and are less likely to invest in stocks and tax-favored assets (Lusardi, 2003). The
literature also suggests that there is particular room for concern about how female-headed
households will fare after retirement (Weir and Willis, 2000).
To gain insight into the issues pertinent to women’s retirement planning, this paper
examines a new module we have developed for the 2004 Health and Retirement study (HRS) on
planning and financial literacy. In this module, we inserted several questions to assess how
respondents plan and save for retirement. For example, we asked respondents about the tools
they use and the sources of information they rely on for making saving decisions. Moreover, we
included questions to measure basic levels of financial literacy. These questions can be of
enormous help in understanding the financial behavior of older women.
Our results have important public policy implications. Since the early 1990s, there has
been an explosion of products and programs for personal financial planning. The government has
2
instituted several programs to foster financial education and employers have increasingly offered
retirement seminars to their workers. But these programs have had minimal effect on saving
patterns.2 This could simply be due to the fact that these programs cannot be expected to address
lack of savings among different groups in the population. For example if, as shown in this paper,
financial illiteracy is disproportionately widespread among women, a one-time financial
education seminar is unlikely to sufficiently influence planning and saving decisions. Similarly,
educational programs targeted specifically at women may be better suited to address fundamental
differences in their preferences, saving needs, and financial knowledge.
Prior Literature
Several studies have confirmed that few older Americans have planned for retirement
(Ameriks et al. 2003; Hurst, 2003; Lusardi, 1999). Moreover, workers do not seem well-
informed about two of their major sources of retirement income: Social Security benefits and
pensions (Gustman and Steinmeier, 2004). Many people report they will be eligible for full
Social Security benefits sooner than the rules actually allow (e.g. prior to age 65), and many do
not know what benefits are associated with their pensions. In fact, many employees do not even
know what type of pension they have. Other researchers have argued that workers are ill-
equipped to make saving decisions, as they display little financial literacy (Bernheim, 1995,
1998). As an example, a recent EBRI (1996) survey showed that only 55 percent of workers
knew that U.S. government bonds averaged a lower return than U.S. stocks, over the past 20
years.
1 See Mitchell and Moore 1998; Mitchell, Moore and Phillips 2000; Moore and Mitchell 2000 for a discussion of these points. 2 See Lusardi (2004) for a review of the literature.
3
Many employers, particularly larger ones, have begun to express concern about their
employees’ lack of retirement preparedness. To remedy these shortfalls, some have sought to
improve financial literacy by offering retirement seminars and other educational programs for
their workers (Bernheim and Garrett, 2003; Lusardi, 2004). To date, it is unclear how efficacious
this financial education is. Inasmuch as women represent some of the most vulnerable
individuals in the population (Weir and Willis, 2000), it is useful to focus in particular on how
women plan for retirement, what tools and sources of information they use, and what their level
of financial literacy is. This will provide a basis for building better models of saving and
portfolio choice, and for financial education programs better suited to address women’s saving
needs.
Empirical Strategy
The decision of how much to save for retirement is a complex one, as it requires
collecting and processing information on a huge set of variables including Social Security and
pensions, inflation, and interest rates, to name a few, and also make predictions about future
values of these variables. It is also necessary for the consumer to understand compound interest,
inflation, financial markets, mortality tables, and more. Nevertheless, little research has asked
exactly how households make saving decisions, how they overcome the difficulty of making
those decisions, and whether they are financially literate enough to make good quality decisions.
These topics are of paramount importance, particularly when older households must take on the
responsibility for investing, allocating, and decumulating their financial as well as their pension
wealth.
4
To gain insight into how households make saving decisions, we devised a module on
planning and financial literacy for the 2004 HRS (Lusardi and Mitchell, 2005; 2007a and b).3
The module includes three questions on financial literacy, as follows:
1. Suppose you had $100 in a savings account and the interest rate was 2% per year. After 5 years, how much do you think you would have in the account if you left the money to grow: more than $102, exactly $102, less than $102? 2. Imagine that the interest rate on your savings account was 1% per year and inflation was 2% per year. After 1 year, would you be able to buy more than, exactly the same as, or less than today with the money in this account? 3. Do you think that the following statement is true or false? “Buying a single company stock usually provides a safer return than a stock mutual fund.”
The first two questions, which we refer to as “Compound Interest” and “Inflation,” help evaluate
whether respondents display knowledge of fundamental economic concepts and basic numeracy.
The third question, which we dub “Stock Risk,” evaluates respondents’ knowledge of risk
diversification, a crucial element of an informed investment decision.4
The module also asked respondents how they have calculated their retirement saving
needs. Other surveys, including those devised by EBRI (2001) in its Retirement Confidence
Survey (RCS) and questionnaires developed by TIAA-CREF have previously asked respondents
whether they plan for retirement.5 However, it is not only whether respondents attempted to plan
for retirement that is important; the outcome of such a plan is crucial.6 The questions about
retirement planning calculations we devised for the module are as follows:
3 The Health and Retirement Study (HRS), a nationally representative longitudinal dataset of Americans over the age of 50, collects information about health, assets, liabilities, and patterns of wellbeing in older households. Beginning in 1992, a 90-minute core questionnaire has been administered every two years to age-eligible respondents and their spouses. In addition, a random sample of respondents has also been subjected to very short experimental modules in each wave, aimed at helping researchers assess additional topics of substantive interest. 4 For a description and detailed analysis of the data in this module, see Lusardi and Mitchell (2005). 5 See Ameriks et al. (2003), and Yakobosk and Dickemper (1997). 6 See also Venti and Wise (2001).
5
4. Have you ever tried to figure out how much your household would need to save for retirement?
5. Did you develop a plan for retirement saving? 6. How often were you able to stick to this plan: Would you say always, mostly, rarely,
or never?
Finally, to gain insight into the planning process, we devised questions to assess what
planning tools people rely on to devise and carry out their retirement saving plans. Specifically,
we inquired whether respondents contacted friends, relatives, or experts, and whether they used
retirement calculators. The specific question phrasing is as follows:
7. Tell me about the ways you tried to figure out how much your household would need. o Did you talk to family and relatives? o Did you talk to co-workers or friends? o Did you attend retirement seminars? o Did you use calculators or worksheets that are computer or Internet-based? o Did you consult a financial planner or advisor or an accountant?
In what follows, we tabulate the prevalence of financial literacy, retirement calculations,
and retirement planning tools in the total sample and among women. In addition, we evaluate
whether women who lack insight into simple economic facts also have particular difficulty
devising and carrying out plans. The idea is to evaluate whether those who are more financially
literate are also those more likely to plan and be successful planners.
Financial Literacy by Demographic Characteristic
Next we present findings from the financial literacy module in the 2004 HRS. After
deleting a handful of observations with missing data about the variables of interest, the analysis
sample consists of 1,264 respondents of which 60% are women. Respondents are mostly 50
years or older (the average age is 66), 64% are married, 13.7% are Blacks and 8.3% are
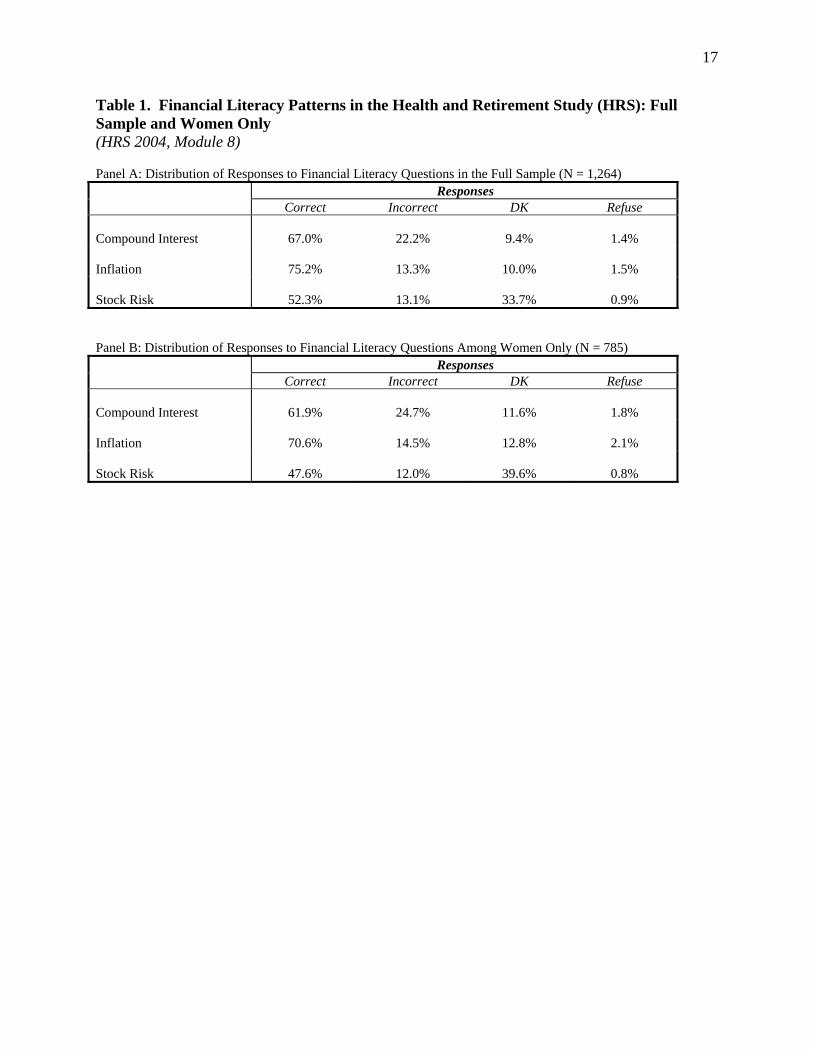
Hispanics. Results for all respondents appear in Table 1, where Panel A shows that the
compound interest question has a 67% correct response rate. This is an easy question and it is
6
rather astounding that one-third of the sample cannot respond correctly, particularly because the
sample includes older respondents who have most likely made interest rate calculations over
their lifetimes.7 The inflation question has a higher correct response rate, with three-quarters
(75%) answering correctly that they would be able to buy less after a year if the interest rate were
1% and inflation were 2%. By contrast, only 52% of the respondents understood that holding a
single company stock implies a riskier investment than a stock mutual fund.8 Findings for
women are less positive (Table 1, Panel B). Overall, the fraction of correct answers is lower for
women, such that only 62% respond correctly to the question about interest compounding and
70% respond correctly to the inflation question. Less than half of the women respondents (47%)
knows about risk diversification. Differences by sex are as high as 5 percentage points and are
statistically significant.
We further distinguish between those offering correct answers and those giving an
incorrect answer or responding “don’t know” (abbreviated DK). The proportion of incorrect or
DK responses varies according to the question. For example, regarding interest compounding,
only 9% did not know, but over one-fifth (22%) gave an incorrect answer. On the inflation
question, 10% did not know, while 13% gave a wrong answer. The question about stock risk
elicited the most DKs: 34% of the sample did not know, while a smaller fraction (13%) gave a
wrong answer. The fraction of “DKs” is substantially larger, in the sample of women. For
example, almost 13% of women respondents cannot evaluate the effect of inflation, and close to
40% do not know about risk diversification. As it will be shown later, those DKs are also those
7 See also the findings about knowledge of compound interest in the experimental saving module in the 1996 HRS (Venti and Wise, 2001). 8 Similar findings about general lack of financial literacy are also reported by Lusardi and Mitchell (2006), which examine an alternative set of financial literacy questions asked to Early Baby Boomers only (aged 51 to 56 in 2004).
7
who display the lowest level of knowledge, which is important as lack of knowledge affects
behavior.
We also calculate how many respondents answer all of these questions correctly. Only
slightly over half (56%) of the total sample gets both the interest compounding and inflation
questions right. This is a remarkably low ratio, if we contemplate the complex financial
calculations that households on the verge of retirement have most likely engaged in over their
lifetimes. Also disturbing is the fact that only one-third (34%) of respondents correctly answer
all three questions. The proportion among women is even smaller: less than 50% correctly
answer the two questions about interest compounding and inflation, and only 29% answer
correctly all three questions. Another relevant finding is that the “DK” responses are highly
correlated: that is, people are consistently financial illiterate or literate. For instance, there is a
70% correlation between those who reply “DK” to both the interest compounding question and
the inflation question, in both the full sample and also for women only. Erroneous answers are
more scattered, with mistakes having a correlation of only 10% (the highest correlation among
incorrect responses).
These results reinforce survey findings about financial literacy where it appears that most
respondents do not understand basic financial concepts, particularly those relating to bonds,
stocks, mutual funds, and the working of compound interest (Bernheim 1995, 1998; Hogarth and
Hilgerth 2002; Hogarth et al. 2004; Moore 2003). Prior studies also report that such people often
fail to understand loans and, particularly, mortgages.9 Our results also hold outside the US: for
instance, UK borrowers display poor understanding of mortgages and interest rates (Miles,
2004), while in several European nations, respondents also score low on financial numeracy and
9 Other surveys also find similar results, in particular concerning knowledge regarding properties of bonds, stocks, and mutual funds (Agnew and Szykman, 2005)
8
literacy scales (Christelis, Jappelli, and Padula, 2005). These findings are also relevant to
younger persons: for instance the National Council on Economic Education (NCEE 2005) found
a general lack of knowledge of fundamental economic concepts among high school students and
working-age adults, confirming analysis from the Jump$tart Coalition for Personal Financial
Literacy, which surveys U.S. high school students (Mandell, 2004).
Planning for Retirement
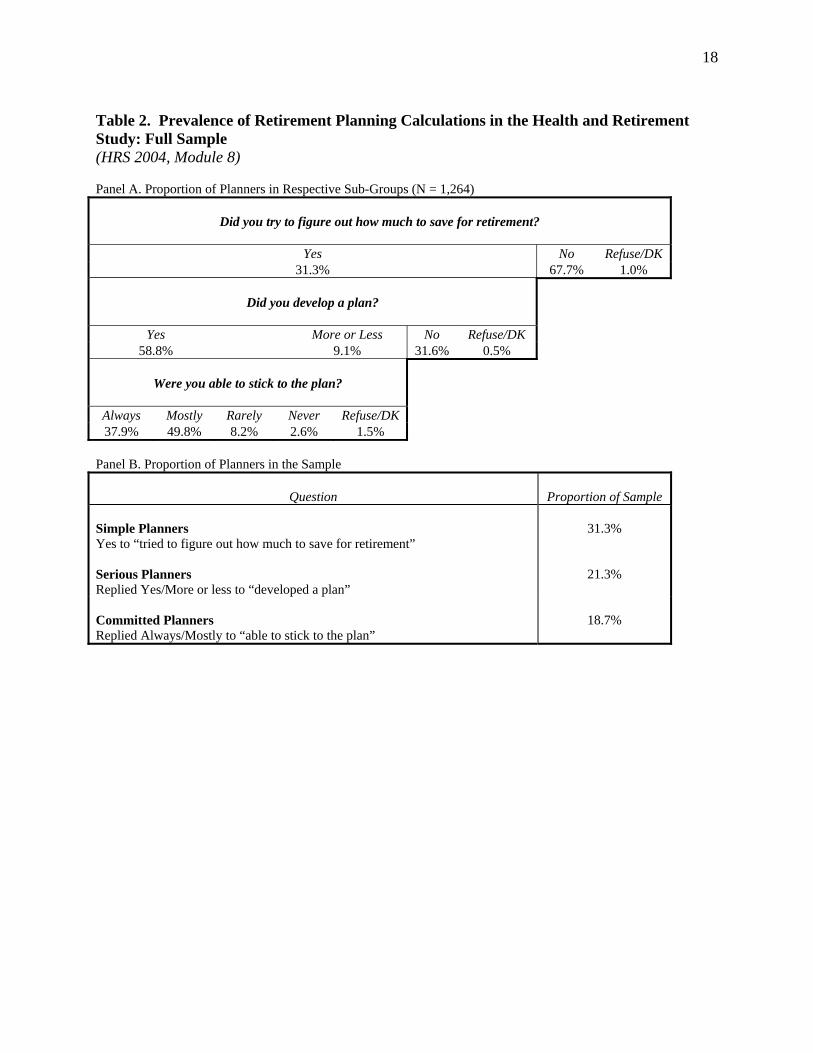
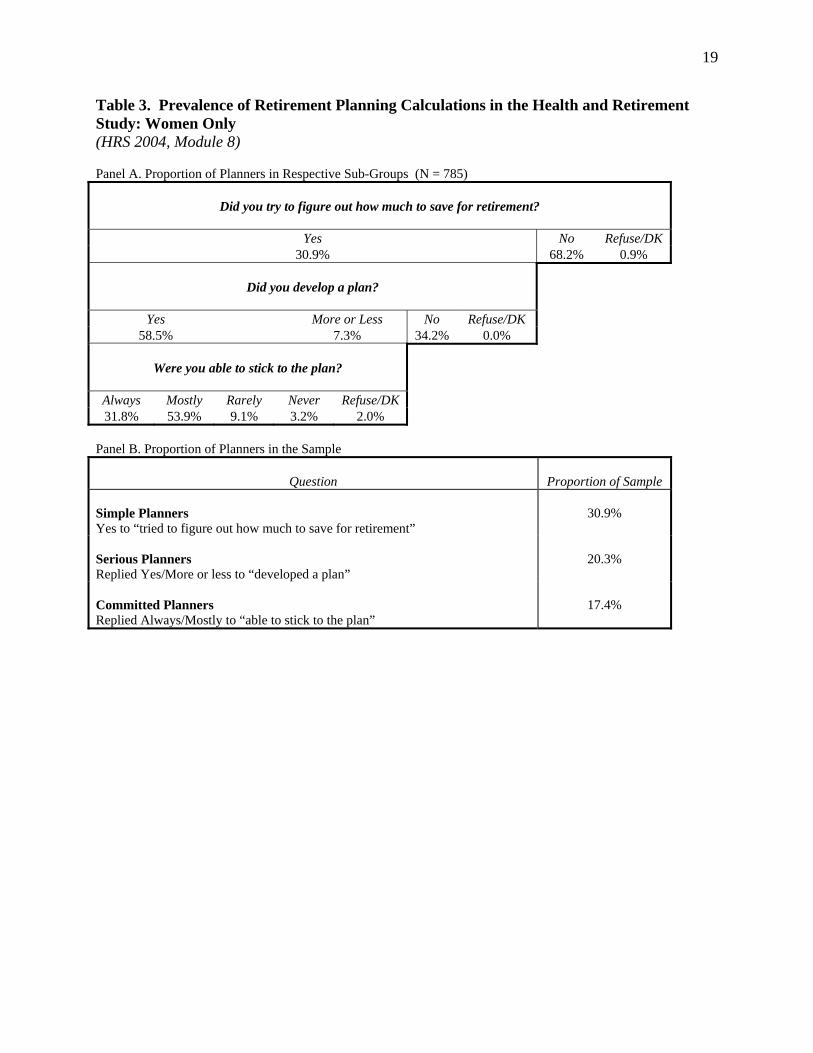
Tables 2 and 3 help assess the extent of retirement planning in the full sample and among
HRS women only. Fewer than one-third of all respondents (31%) indicated that they actually
attempted to do a retirement saving calculation. The fraction of women who say they attempted
to plan is slightly lower, at 31%. This group of respondents we call Simple Planners. The fact
that we find such a small number of planners confirms earlier findings (Lusardi 1999, 2002,
2003; Lusardi and Beeler, 2006; Venti and Wise 2001). Further, it confirms prior research
indicating that, even among the highly educated, few undertake retirement planning (Yakobosky
and Dickempers, 1997; Ameriks et al., 2003). It is also consistent with the work of Mitchell
(1988) and Gustman and Steinmeier (2004) who found that workers display little knowledge
about their Social Security and pension benefits, two of the most important components of
retirement wealth. In fact, close to half of workers in the HRS sample analyzed by Gustman and
Steinmeier (2004) could not name their type of pension plan, and an even larger portion was
ignorant of future Social Security benefits.10
A key advantage of our HRS module, compared to previous surveys, is that we are able
to link respondents’ financial knowledge with factors indicating the outcomes of their
10 There is also mounting evidence that knowledge about pensions and Social Security affects retirement decisions (Chan and Huff Stevens, 2003; Mastrobuoni, 2005).
9
calculations. Thus Panel A of Tables 2 and 3 shows that only 58% of those who tried to figure
out how much they need to save for retirement did develop a plan, both in the full sample and
among women only, while another handful “more or less” developed a plan (9% in the full
sample, and 7% among women). Both of these we refer to below as the Serious Planners. The
high failure rate in terms of developing a plan underscores the difficulty of developing retirement
projections. Furthermore, of the subset of serious planners, only one-third (38%) was always
able to stick to the plan and the fraction is even lower among women (32%). Close to half of the
serious planners said they were “mostly” able to stick to their plans (50% in the total sample and
54% among women only). The respondents who are “always” or “mostly” able to stick to a plan
are called Committed Planners. In the sample as a whole, this represents a meager 19% overall
rate of successful planning, which decreases to 17% when we consider women only. Of course,
households may face unexpected shocks that make them deviate from plans, but the fact remains
that few respondents do what the economic models suggest that they should. In other words,
planning for retirement is difficult, few do it, and fewer still think they get it right.
Planning has important consequences for savings and portfolio choice. Those who do not
plan are less likely to accumulate substantial retirement wealth (Lusardi,1999, 2002, 2003;
Lusardi and Mitchell 2007a; Lusardi and Beeler, 2006; Ameriks et al., 2003) and they are also
less likely to invest in stocks (Lusardi, 2003).
Use of Planning Tools
To further evaluate what planning means and what people actually do when planning for
retirement, we ask HRS respondents to indicate which tools they use in this process. To the
extent that they use crude or inaccurate tools, this could explain the low success rates for
10
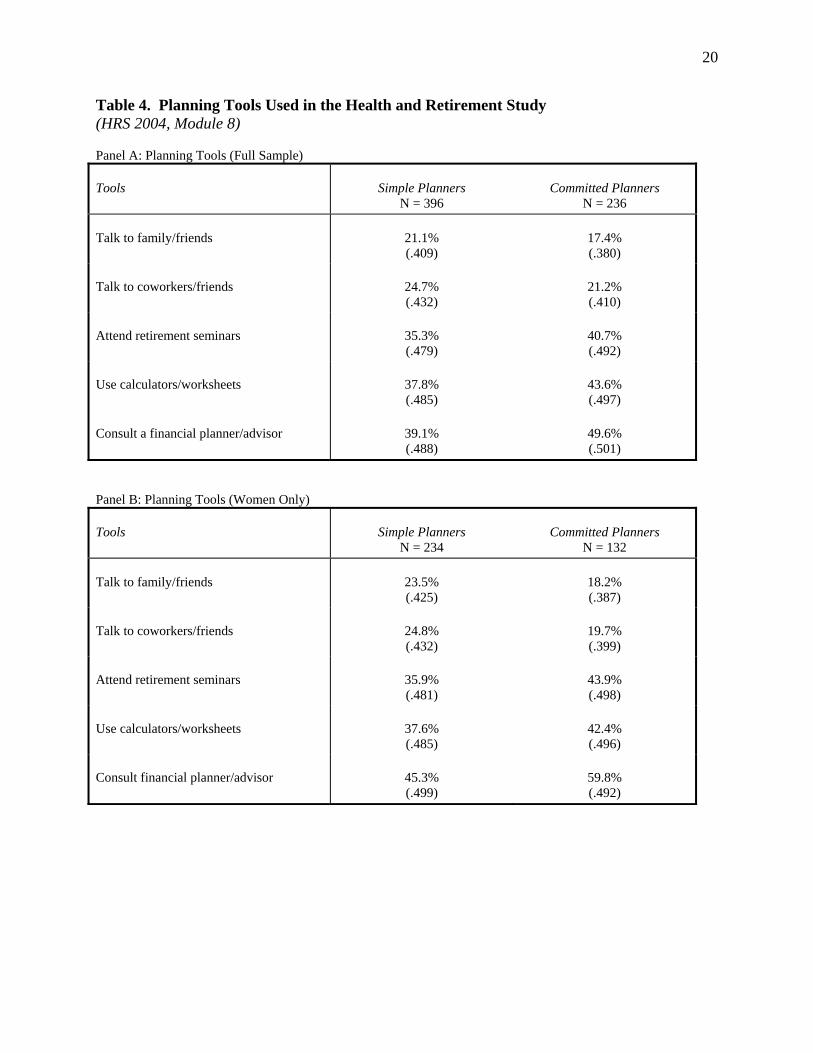
planning discussed above. Panel A of Table 4 shows that respondents in the full sample say they
use a wide range of tools to calculate their retirement needs (note that these questions are asked
only of the 31% who reported that they attempted a retirement saving calculations). Between
one-quarter and one-fifth of respondents talk to family/relatives or co-workers/friends, while
one-third or more use formal means such as retirement calculators, retirement seminars, or
financial experts. Committed Planners are more likely to use formal means (over 40%), whereas
Simple Planners, some of whom tried and failed, tend to rely on less formal approaches. The list
of tools does not exhaust what people might do; in fact, as many as one quarter of the self-
reported planners indicated that they did not use any of the listed tools.
In the sub-sample of women only (Table 4, Panel B), results are similar, even though
women tend to consult more often with both family and friends and with financial planners. The
correlation between formal methods of planning and success at planning is even stronger; for
example women who consult a financial planner are more like to be committed planners and so
are those who attended a retirement seminar. On the contrary, only a very small fraction of
committed planners have used informal tools, such as talking to family and relatives or friends
and coworkers.
Financial Literacy and Planning
One reason people fail to plan for retirement, or do so unsuccessfully, may be because
they are financially illiterate. In this case, they may fail to appreciate the role of (or have a hard
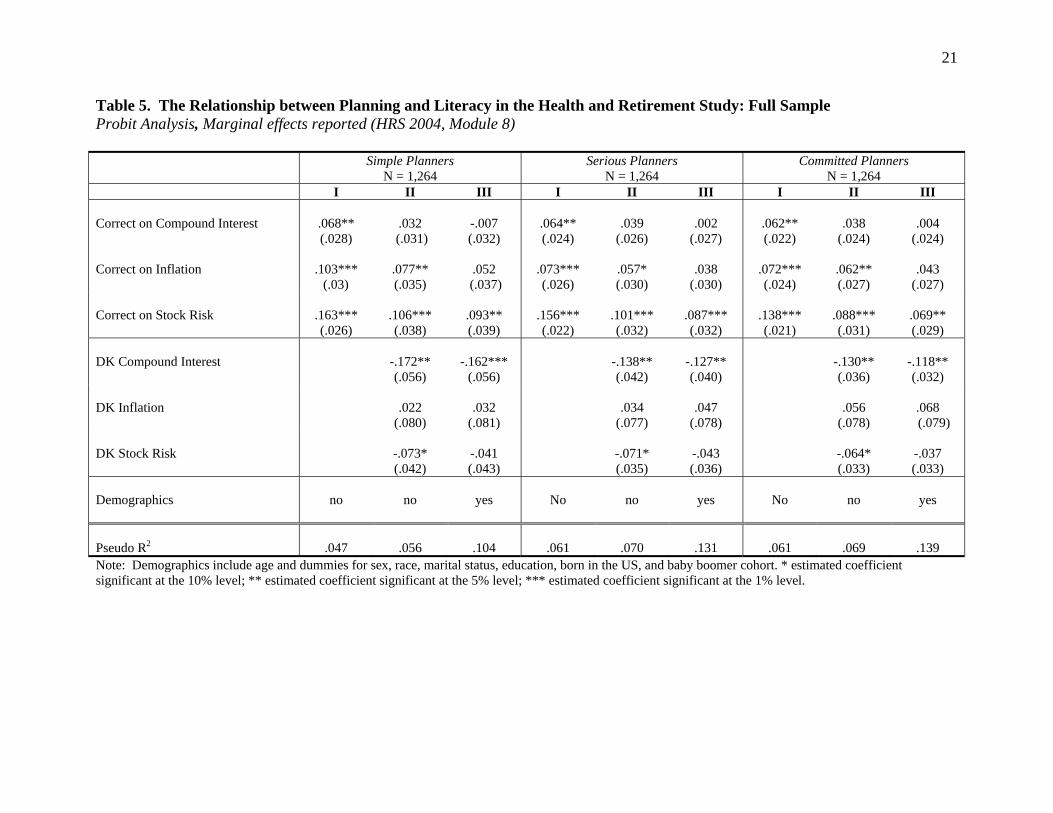
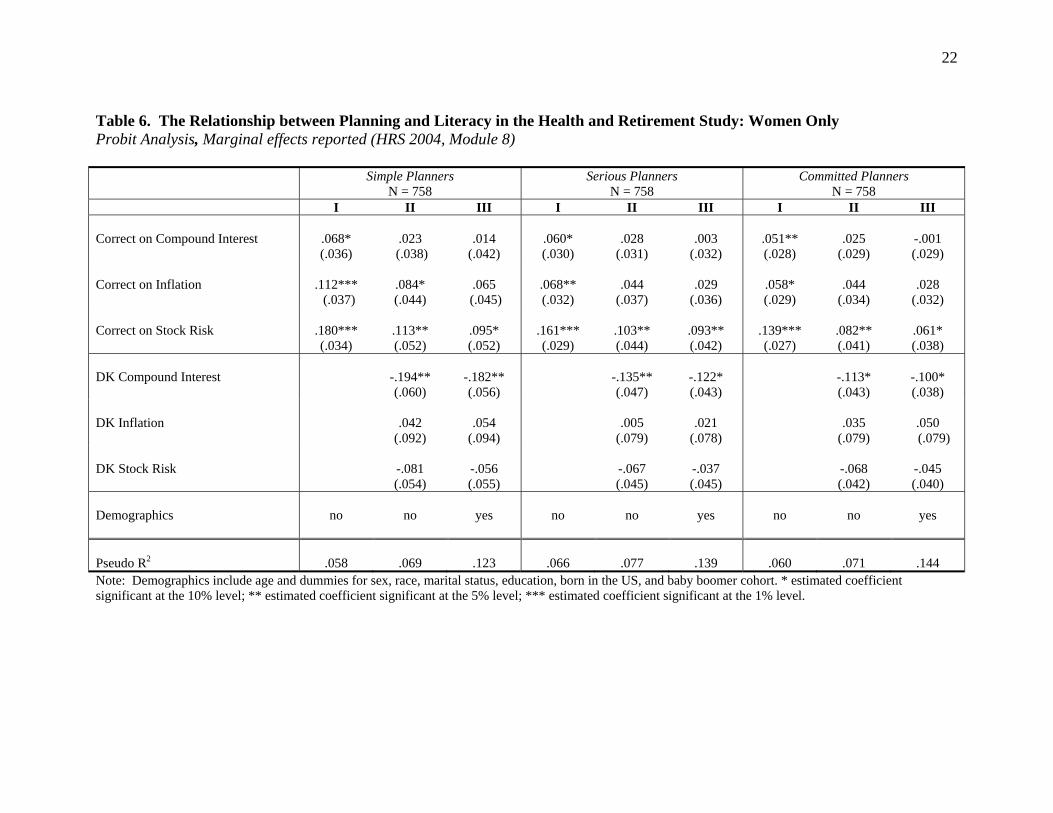
time solving problems with) compound interest, inflation, and risk. Tables 5 and 6 report results
of a multivariate analysis that sheds some light on the importance of financial literacy and its
11
relationship to planning in the full sample, as well as for women only.11 The three dependent
variables show who is a planner, who developed a plan, and who has been able to stick to the
plan. The dependent variable in Column I, in each case, takes on a value of 1 if the respondent
was correct regarding the literacy variables (else, = 0); Column II adds an indicator equal to 1 if
the respondent indicated he did not know the answer to the question (else, = 0); and Column III
has the same dependent variable but adds controls for demographics, age, race, sex, educational
attainment, marital status, being born in the US, and being a Baby Boomer. The results depicted
are marginal effects from Probit analysis.
The findings have several interesting aspects. First, we see that financial literacy is
strongly and positively associated with planning, and the results are statistically significant at
conventional levels. That is, planners of all types are much more likely to give a correct answer
to the basic questions about financial literacy (Column I). Estimates of the effects of literacy are
similar when considering the sample of women only. In particular, those who understand risk
diversification are much more likely to plan. Second, knowledge about risk diversification
strongly differentiates between sophisticated and unsophisticated respondents. Not only does it
have a much larger estimated marginal effect than being able to correctly answer the interest and
the inflation questions, but it also remains statistically significant even after accounting for the
demographic characteristics of the respondent. Third, lack of knowledge also matters. Even with
respect to those answering incorrectly, those who cannot answer the questions are much less
likely to plan and to succeed in their planning effort (Columns II). The effect is somewhat larger
in the sample of women only. What appears most crucial is a lack of knowledge about interest
11 Clearly, the causality may also go the other way: that is, those who plan also develop financial literacy and an ability to do retirement calculations. Causality issues are addressed more formally by Lusardi and Mitchell (2007a).
12
compounding, which makes sense since basic numeracy is crucial for doing calculations about
retirement savings.
Column III in Tables 5 and 6 indicate that some financial literacy indicators remain
statistically significant after controlling for demographic characteristics. For example, financial
literacy still affects planning above and beyond the effect of education. This is a particularly
important results for women; women in this sample are less likely to have higher education and
many are unmarried (widow, divorced or separated). In other words, there is reason to believe
that these financial literacy variables may prove very useful in explaining the differences
observed among households in their behavior toward retirement saving.
Discussion
Policymakers seek to learn whether households are effectively protected for many years
in retirement, which we have argued is intimately related to whether they know how to plan for
retirement and whether they can execute these plans effectively. Indeed, we posit that this topic
of particular interest for women who tend to live longer than men and have shorter work
experiences and lower earnings. Our research shows that older women in the US display very
little financial literacy. Fewer than half of women respondents from our nationally representative
sample can correctly answer simple questions regarding interest compounding and inflation, and
an even smaller fraction (29%) can correctly answer those questions and another about risk
diversification. In other words, financial illiteracy is widespread among older Americans and
women in particular.
We also assess whether older consumers have attempted to figure out how much they
need to save for retirement, whether they devised a plan, and whether they succeeded at the plan.
13
Our results show that retirement calculations are not easy to implement for most respondents,
and women in particular seem to have a difficult time using them: only approximately one-third
of our sample had ever tried to devise a retirement plan, and only two0thirds of those felt they
had succeeded. Only 17% of the women engaged in successful retirement planning. When we
evaluate the planning tools people use, we find that women rely more on both family and friends
and financial experts; those who consult financial planners are more likely to be successful in
drawing up their retirement strategies. We also show that financial knowledge and planning are
clearly interrelated: women who display higher financial literacy are more likely to plan and be
successful planners.
In sum, our results suggest that older women’s financial literacy is rather limited, so
much so that it raises concerns about their ability to make sound saving and investment decisions
over a very long retirement period. In an increasingly “disintermediated” environment, where
individuals rather than employers and governments are charged with handing retirement
finances, it is essential that consumers become more financially literate in order to be more
successful in retirement.
14
References Agnew, Julie and Lisa Szykman. 2005. “Asset Allocation and Information Overload: The
Influence of Information Display, Asset Choice and Investor Experience.” Journal of Behavioral Finance 6: 57-70.
Ameriks, John, Andrew Caplin and John Leahy. 2003. “Wealth Accumulation and the Propensity to Plan.” Quarterly Journal of Economics 68: 1007-1047.
Bernheim, Douglas. 1995. “Do Households Appreciate their Financial Vulnerabilities? An Analysis of Actions, Perceptions, and Public Policy.” In Tax Policy and Economic Growth. Washington, DC: American Council for Capital Formation.
Bernheim, Douglas. 1998. “Financial Illiteracy, Education and Retirement Saving.” In Living with Defined Contribution Pensions, edited by Olivia Mitchell and Sylvester Schieber. Philadelphia: University of Pennsylvania Press: 36-86.
Bernheim, Douglas and Daniel Garrett. 2003. “The Effects of Financial Education in the Workplace: Evidence from a Survey of Households.” Journal of Public Economics 87, 487-1519.
Chan, Sewin and Ann Huff Stevens.2003. “What You Don’t Know Can’t Help You: Knowledge and Retirement Decision Making.” Mimeo, New York University.
Christelis, Dimitris, Tullio Jappelli, and Mario Padula. 2005. “Health Risk, Financial Information and Social Interaction: the Portfolio Choice of European Elderly Households.” Working paper. University of Salerno.
Employee Benefits Research Institute (EBRI). 1996. “Participant Education: Actions and Outcomes.” Issue Brief 169.
Employee Benefits Research Institute (EBRI). 2001. “Retirement Confidence Survey (RCS), Minority RCS, and Small Employer Retirement Survey.” Issue Brief 234.
Gustman, Alan and Tom Steinmeier. 2004. “What People Don’t Know about their Pensions and Social Security.” In Private Pensions and Public Policies, edited by William Gale, John Shoven and Mark Warshawsky, Washington, DC: Brookings Institution: 57-125.
Hilgert, Marianne, Jeanne Hogarth, and Sondra Beverly. 2003. "Household Financial Management: The Connection between Knowledgee and Behavior." Federal Reserve Bulletin, 309-322.
Hogarth, Jeanne, Chris Anguelov, and Jinkook Lee. 2004. “Why Don’t Households Have a Checking Account?” The Journal of Consumer Affairs 38: 1-34.
Hogarth, Jeanne and Marianne Hilgert. 2002. "Financial Knowledge, Experience and Learning Preferences: Preliminary Results from a New Survey on Financial Literacy." Consumer Interest Annual, 48.
Hurst, Erik. 2003. “Grasshoppers, Ants and Pre-Retirement Wealth: A Test of Permanent Income Consumers.” Working Paper, University of Chicago Graduate School of Business.
Lusardi, Annamaria. 1999. "Information, Expectations, and Savings for Retirement." In Behavioral Dimensions of Retirement Economics, edited by Henry Aaron. Washington, D.C.: Brookings Institution Press and Russell Sage Foundation: 81-115.
15
Lusardi, Annamaria. 2002. “Preparing for Retirement: The Importance of Planning Costs”. National Tax Association Proceedings 2002: 148-154.
Lusardi, Annamaria. 2003. “Planning and Saving for Retirement.” Working paper. Dartmouth College.
Lusardi, Annamaria. 2004. “Savings and the Effectiveness of Financial Education.” In Pension Design and Structure: New Lessons from Behavioral Finance, edited by Olivia Mitchell and Stephen Utkus. Oxford: Oxford University Press: 157-184.
Lusardi, Annamaria and Jason Beeler. 2006. “Saving Between Cohorts: The Role of Planning.” In Redefining Retirement. Edited by Brigitte Madrian, Olivia S Mitchell, Beth Soldo. Oxford: Oxford University Press.
Lusardi, Annamaria and Olivia Mitchell. 2005. “Financial Literacy and Planning: Implications for Retirement Well-Being.” MRRC Working Paper 2005-108. University of Michigan.
Lusardi, Annamaria and Olivia S. Mitchell.2007a. “Baby Boomer Retirement Security: The Roles of Planning, Financial Literacy, and Housing Wealth.” Journal of Monetary Economics. 54(1) January: 205-224.
Lusardi, Annamaria and Olivia S. Olivia Mitchell.2007b. “Financial Literacy and Retirement Preparedness: Evidence and Implications for Financial Education,” Business Economics, January: 35-44.
Mandell, Lewis. 2004. “Financial Literacy: Are We Improving?” Washington, D.C.: Jump$tart Coalition for Personal Financial Literacy.
Mastrobuoni, Giovanni. 2005. “Do Better-Informed Workers Make Better Retirement Choice? A Test Based on the Social Security Statement.” Mimeo, Princeton University.
Miles, David. 2004. “The UK Mortgage Market: Taking a Longer-Term View.” UK Treasury.
Mitchell, Olivia. 1988. “Worker Knowledge of Pensions Provisions.” Journal of Labor Economics 6: 28-29.
Mitchell, Olivia S. and James Moore.1998. “Can Americans Afford to Retire? New Evidence on Retirement Saving Adequacy.” Journal of Risk and Insurance 65: 371-400.
Mitchell, Olivia S., James Moore, and John Phillips. 2000. “Explaining Retirement Saving Shortfalls”. In Forecasting Retirement Needs and Retirement Wealth edited by O. S. Mitchell, B. Hammond, & A. Rappaport. Philadelphia, PA: Univ. of Pennsylvania Press: 139-166.
Moore, Danna. 2003. “Survey of Financial Literacy in Washington State: Knowledge, Behavior, Attitudes, and Experiences.” Technical report 03-39, Social and Economic Sciences Research Center, Washington State University.
Moore, James, and Olivia S. Mitchell. 2000. “Projected Retirement Wealth and Saving Adequacy.” In Forecasting Retirement Needs and Retirement Wealth, edited by O.S. Mitchell, B. Hammond, and A. Rappaport. Philadelphia, PA: Univ. of Pennsylvania Press: 68-94.
National Council on Economic Education. 2005. “What American Teens and Adults Know About Economics.”
16
Venti, Steven and David Wise. 2001. “Choice, Chance, and Wealth Dispersion at Retirement”. In Aging Issues in the United States and Japan, edited by S. Ogura, T. Tachibanaki and D. Wise. Chicago: University of Chicago Press: 25-64.
Weir, David and Robert Willis. 2000. “Prospect for Widow Poverty.” In Forecasting Retirement Needs and Retirement Wealth, edited by Olivia Mitchell, Peter Hammond and Anna Rappaport, Philadelphia, University of Pennsylvania Press, 208-234.
Yakoboski, Paul and Jennifer Dickemper. 1997. “Increased Saving but Little Planning. Results of the 1997 Retirement Confidence Survey.” EBRI Issue Brief 191.
17
Table 1. Financial Literacy Patterns in the Health and Retirement Study (HRS): Full Sample and Women Only (HRS 2004, Module 8) Panel A: Distribution of Responses to Financial Literacy Questions in the Full Sample (N = 1,264)
Responses Correct Incorrect DK Refuse
Compound Interest
67.0%
22.2%
9.4%
1.4%
Inflation
75.2%
13.3%
10.0%
1.5%
Stock Risk
52.3%
13.1%
33.7%
0.9%
Panel B: Distribution of Responses to Financial Literacy Questions Among Women Only (N = 785)
Responses Correct Incorrect DK Refuse
Compound Interest
61.9%
24.7%
11.6%
1.8%
Inflation
70.6%
14.5%
12.8%
2.1%
Stock Risk
47.6%
12.0%
39.6%
0.8%
18
Table 2. Prevalence of Retirement Planning Calculations in the Health and Retirement Study: Full Sample (HRS 2004, Module 8) Panel A. Proportion of Planners in Respective Sub-Groups (N = 1,264)
Did you try to figure out how much to save for retirement?
Yes No Refuse/DK
31.3% 67.7% 1.0%
Did you develop a plan?
Yes More or Less No Refuse/DK 58.8% 9.1% 31.6% 0.5%
Were you able to stick to the plan?
Always Mostly Rarely Never Refuse/DK 37.9% 49.8% 8.2% 2.6% 1.5%
Panel B. Proportion of Planners in the Sample
Question
Proportion of Sample Simple Planners Yes to “tried to figure out how much to save for retirement”
31.3%
Serious Planners Replied Yes/More or less to “developed a plan”
21.3%
Committed Planners Replied Always/Mostly to “able to stick to the plan”
18.7%
19
Table 3. Prevalence of Retirement Planning Calculations in the Health and Retirement Study: Women Only (HRS 2004, Module 8) Panel A. Proportion of Planners in Respective Sub-Groups (N = 785)
Did you try to figure out how much to save for retirement?
Yes No Refuse/DK
30.9% 68.2% 0.9%
Did you develop a plan?
Yes More or Less No Refuse/DK 58.5% 7.3% 34.2% 0.0%
Were you able to stick to the plan?
Always Mostly Rarely Never Refuse/DK 31.8% 53.9% 9.1% 3.2% 2.0%
Panel B. Proportion of Planners in the Sample
Question
Proportion of Sample Simple Planners Yes to “tried to figure out how much to save for retirement”
30.9%
Serious Planners Replied Yes/More or less to “developed a plan”
20.3%
Committed Planners Replied Always/Mostly to “able to stick to the plan”
17.4%
20
Table 4. Planning Tools Used in the Health and Retirement Study (HRS 2004, Module 8) Panel A: Planning Tools (Full Sample) Tools
Simple Planners
N = 396
Committed Planners
N = 236 Talk to family/friends
21.1% (.409)
17.4% (.380)
Talk to coworkers/friends
24.7% (.432)
21.2% (.410)
Attend retirement seminars
35.3% (.479)
40.7% (.492)
Use calculators/worksheets
37.8% (.485)
43.6% (.497)
Consult a financial planner/advisor
39.1% (.488)
49.6% (.501)
Panel B: Planning Tools (Women Only) Tools
Simple Planners
N = 234
Committed Planners
N = 132 Talk to family/friends
23.5% (.425)
18.2% (.387)
Talk to coworkers/friends
24.8% (.432)
19.7% (.399)
Attend retirement seminars
35.9% (.481)
43.9% (.498)
Use calculators/worksheets
37.6% (.485)
42.4% (.496)
Consult financial planner/advisor
45.3% (.499)
59.8% (.492)
21
Table 5. The Relationship between Planning and Literacy in the Health and Retirement Study: Full Sample Probit Analysis, Marginal effects reported (HRS 2004, Module 8) Simple Planners
N = 1,264 Serious Planners
N = 1,264 Committed Planners
N = 1,264 I II III I II III I II III Correct on Compound Interest
.068** (.028)
.032
(.031)
-.007 (.032)
.064** (.024)
.039
(.026)
.002
(.027)
.062** (.022)
.038
(.024)
.004
(.024) Correct on Inflation
.103***
(.03)
.077** (.035)
.052
(.037)
.073*** (.026)
.057* (.030)
.038
(.030)
.072*** (.024)
.062** (.027)
.043
(.027) Correct on Stock Risk
.163*** (.026)
.106*** (.038)
.093** (.039)
.156*** (.022)
.101*** (.032)
.087*** (.032)
.138*** (.021)
.088*** (.031)
.069** (.029)
DK Compound Interest
-.172** (.056)
-.162***
(.056)
-.138** (.042)
-.127** (.040)
-.130** (.036)
-.118** (.032)
DK Inflation
.022
(.080)
.032
(.081)
.034
(.077)
.047
(.078)
.056
(.078)
.068
(.079) DK Stock Risk
-.073* (.042)
-.041 (.043)
-.071* (.035)
-.043 (.036)
-.064* (.033)
-.037 (.033)
Demographics
no
no
yes
No
no
yes
No
no
yes
Pseudo R2
.047
.056
.104
.061
.070
.131
.061
.069
.139
Note: Demographics include age and dummies for sex, race, marital status, education, born in the US, and baby boomer cohort. * estimated coefficient significant at the 10% level; ** estimated coefficient significant at the 5% level; *** estimated coefficient significant at the 1% level.
22
Table 6. The Relationship between Planning and Literacy in the Health and Retirement Study: Women Only Probit Analysis, Marginal effects reported (HRS 2004, Module 8) Simple Planners
N = 758 Serious Planners
N = 758 Committed Planners
N = 758 I II III I II III I II III Correct on Compound Interest
.068* (.036)
.023
(.038)
.014
(.042)
.060* (.030)
.028
(.031)
.003
(.032)
.051** (.028)
.025
(.029)
-.001 (.029)
Correct on Inflation
.112***
(.037)
.084* (.044)
.065
(.045)
.068** (.032)
.044
(.037)
.029
(.036)
.058* (.029)
.044
(.034)
.028
(.032) Correct on Stock Risk
.180*** (.034)
.113** (.052)
.095* (.052)
.161*** (.029)
.103** (.044)
.093** (.042)
.139*** (.027)
.082** (.041)
.061* (.038)
DK Compound Interest
-.194** (.060)
-.182** (.056)
-.135** (.047)
-.122* (.043)
-.113* (.043)
-.100* (.038)
DK Inflation
.042
(.092)
.054
(.094)
.005
(.079)
.021
(.078)
.035
(.079)
.050
(.079) DK Stock Risk
-.081 (.054)
-.056 (.055)
-.067 (.045)
-.037 (.045)
-.068 (.042)
-.045 (.040)
Demographics
no
no
yes
no
no
yes
no
no
yes
Pseudo R2
.058
.069
.123
.066
.077
.139
.060
.071
.144
Note: Demographics include age and dummies for sex, race, marital status, education, born in the US, and baby boomer cohort. * estimated coefficient significant at the 10% level; ** estimated coefficient significant at the 5% level; *** estimated coefficient significant at the 1% level.