Embed Size (px)
Citation preview
Planning for NAIC ORSA
2
Agenda
Introduction
NAIC ORSA Overview
Qualitative vs. Quantitative Analysis
Deterministic vs. Stochastic Approaches
Top-down vs. Bottom-up Approaches
Modeling Risk Correlations
Conclusion
Q&A
3
Conning
Leading insurance asset management specialist
Provides investment, research and advisory services to the insurance industry
Insurance specialists for more than fifty years; investing insurance assets for nearly three decades
Headquartered in Hartford, CT, with locations in New York, London, Cologne and Hong Kong
4
Milliman
Leading provider of actuarial and related risk solutions to insurance markets worldwide
Consulting practices in property and casualty insurance, life insurance and financial services, healthcare, and employee benefits
Covering markets in North America, Latin America, Europe, Asia-Pacific, and the Middle East

5
Your Presenters
Matthew Killough, FCAS, MAAAConsulting Actuary
Milliman
Chris Suchar, FCAS, MAAADirector, Risk & Capital Management Solutions
Conning
Wayne Blackburn, FCAS, MAAAPrincipal & Consulting Actuary
Milliman
6
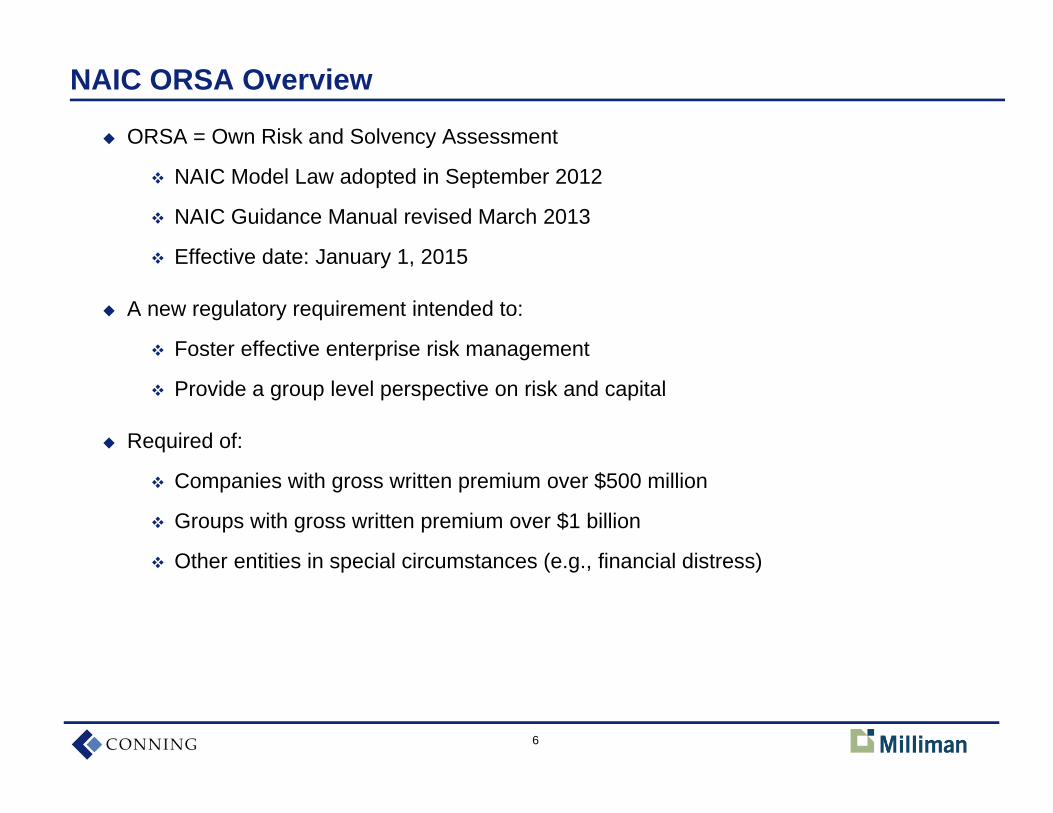
NAIC ORSA Overview
ORSA = Own Risk and Solvency Assessment
NAIC Model Law adopted in September 2012
NAIC Guidance Manual revised March 2013
Effective date: January 1, 2015
A new regulatory requirement intended to:
Foster effective enterprise risk management
Provide a group level perspective on risk and capital
Required of:
Companies with gross written premium over $500 million
Groups with gross written premium over $1 billion
Other entities in special circumstances (e.g., financial distress)
7
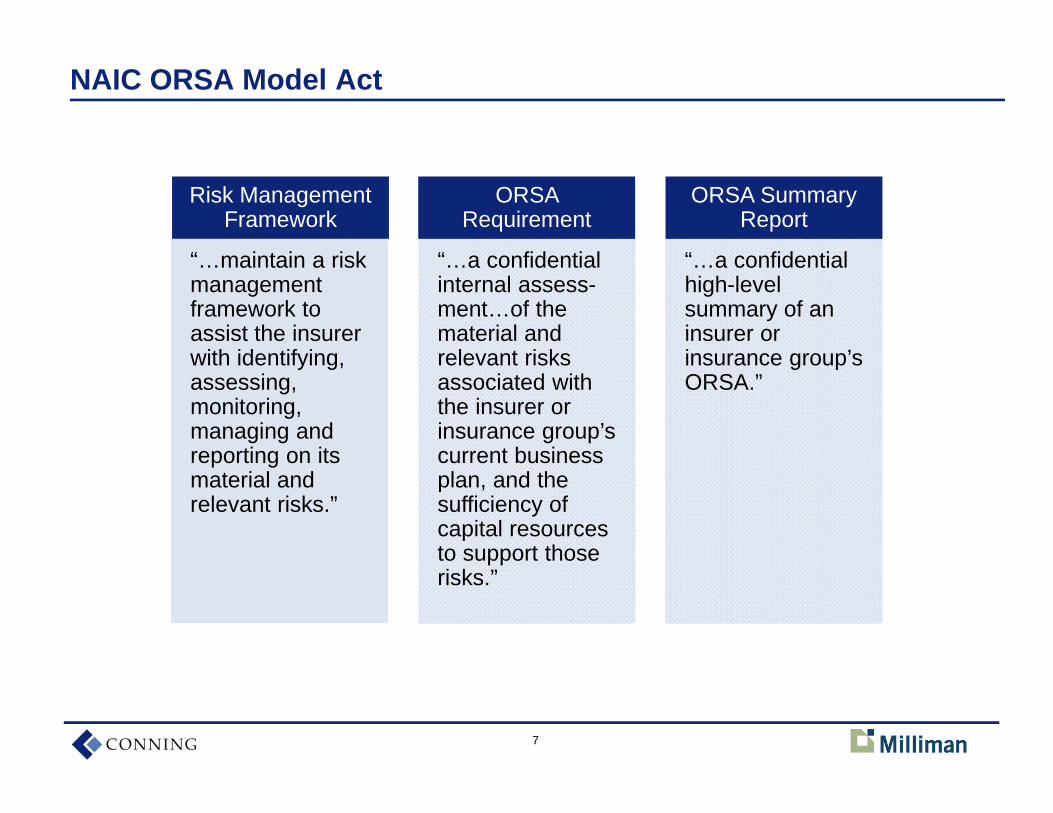
ORSA Summary Report
ORSA Requirement
Risk Management Framework
NAIC ORSA Model Act
“…maintain a risk management framework to assist the insurer with identifying, assessing, monitoring, managing and reporting on its material and relevant risks.”
“…a confidential internal assess-ment…of the material and relevant risks associated with the insurer or insurance group’s current business plan, and the sufficiency of capital resources to support those risks.”
“…a confidential high-level summary of an insurer or insurance group’s ORSA.”
8
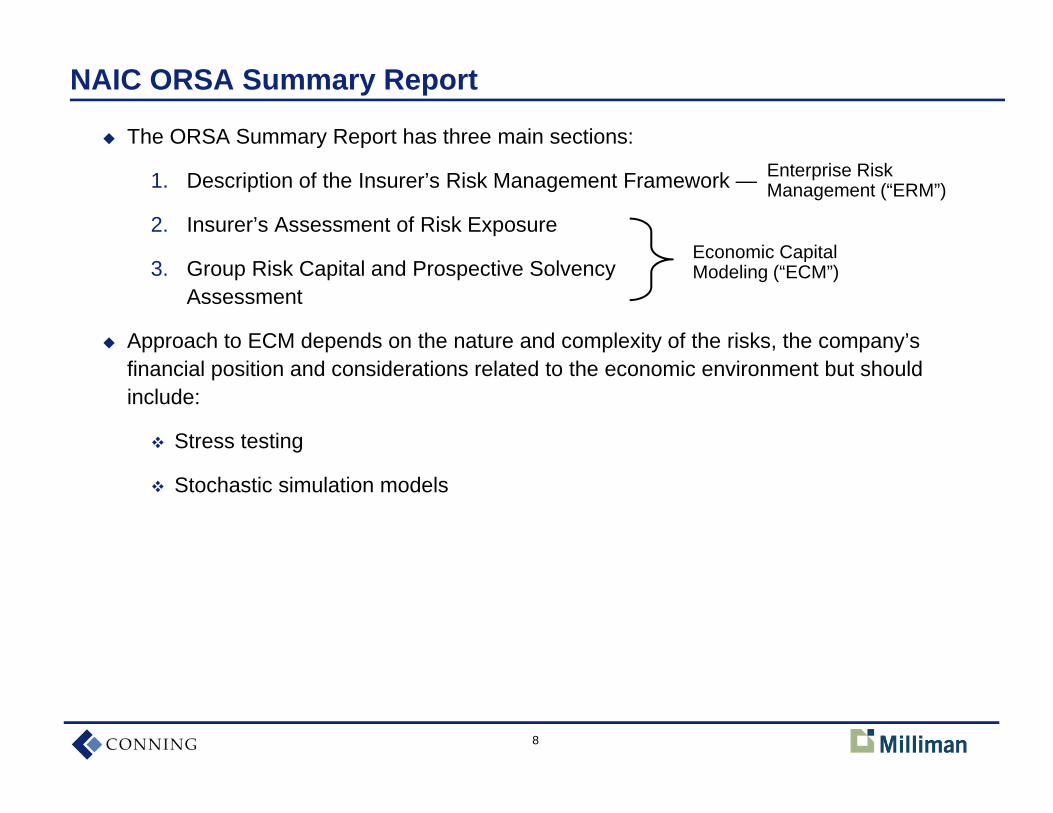
NAIC ORSA Summary Report
The ORSA Summary Report has three main sections:
1. Description of the Insurer’s Risk Management Framework —
2. Insurer’s Assessment of Risk Exposure
3. Group Risk Capital and Prospective Solvency Assessment
Approach to ECM depends on the nature and complexity of the risks, the company’s financial position and considerations related to the economic environment but should include:
Stress testing
Stochastic simulation models
Economic Capital Modeling (“ECM”)
Enterprise Risk Management (“ERM”)
9
Risk Management Framework – Key Principles
Risk culture and governance
Risk identification and prioritization
Risk appetite, tolerances and limits
Risk management and controls
Risk reporting and communication
10
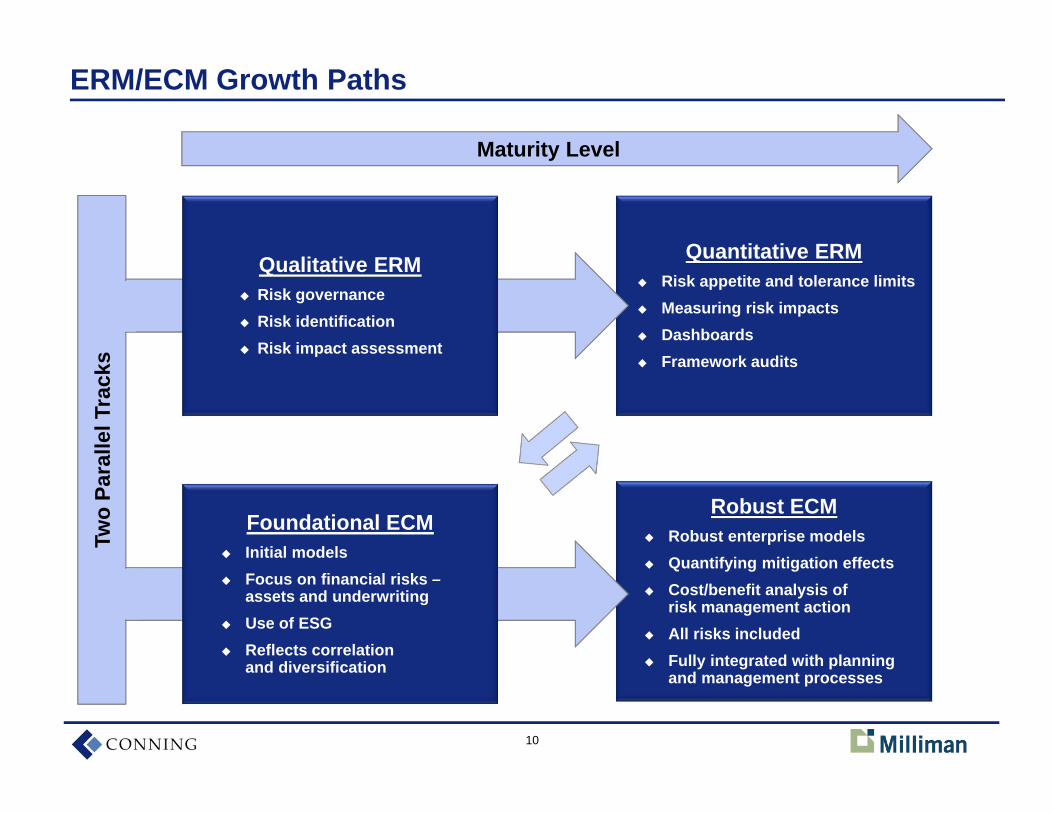
Quantitative ERM Risk appetite and tolerance limits Measuring risk impacts Dashboards Framework audits
Robust ECM Robust enterprise models Quantifying mitigation effects Cost/benefit analysis of
risk management action All risks included Fully integrated with planning
and management processes
ERM/ECM Growth Paths
Maturity Level
Two
Para
llel T
rack
s
Qualitative ERM Risk governance Risk identification Risk impact assessment
Foundational ECM Initial models Focus on financial risks –
assets and underwriting Use of ESG Reflects correlation
and diversification
11
Two
Para
llel T
rack
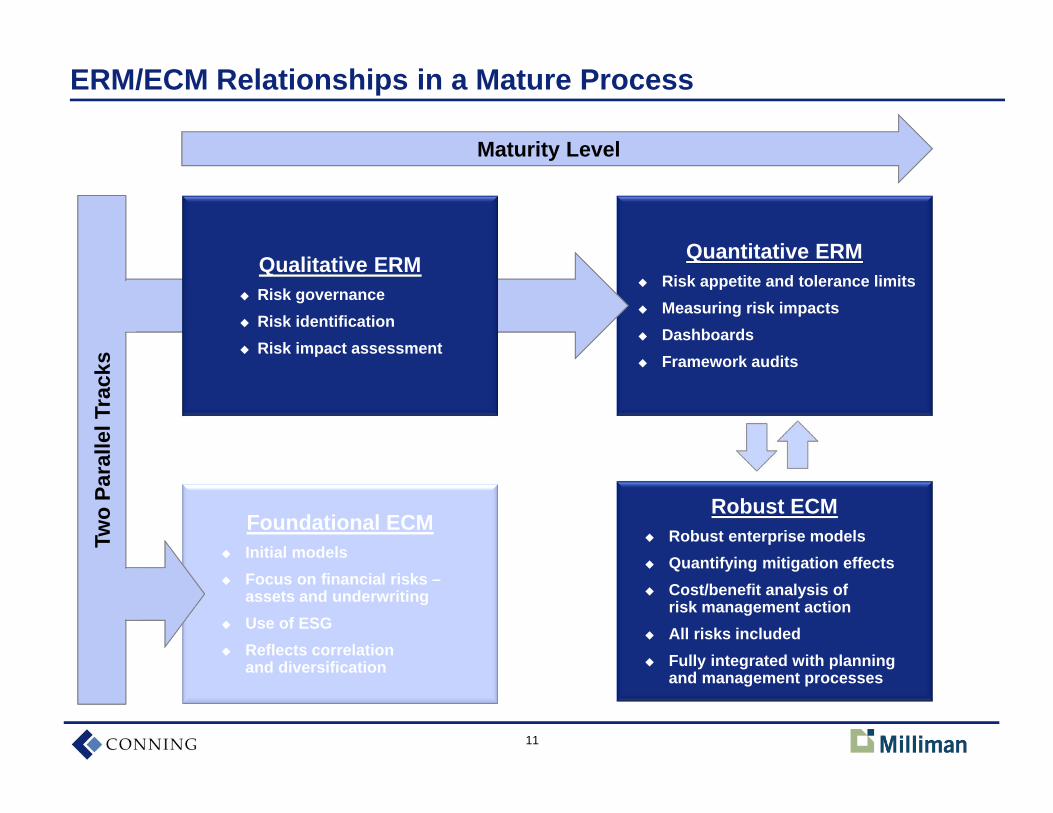
sERM/ECM Relationships in a Mature Process
Maturity Level
Quantitative ERM Risk appetite and tolerance limits Measuring risk impacts Dashboards Framework audits
Robust ECM Robust enterprise models Quantifying mitigation effects Cost/benefit analysis of
risk management action All risks included Fully integrated with planning
and management processes
Foundational ECM Initial models Focus on financial risks –
assets and underwriting Use of ESG Reflects correlation
and diversification
Qualitative ERM Risk governance Risk identification Risk impact assessment
12
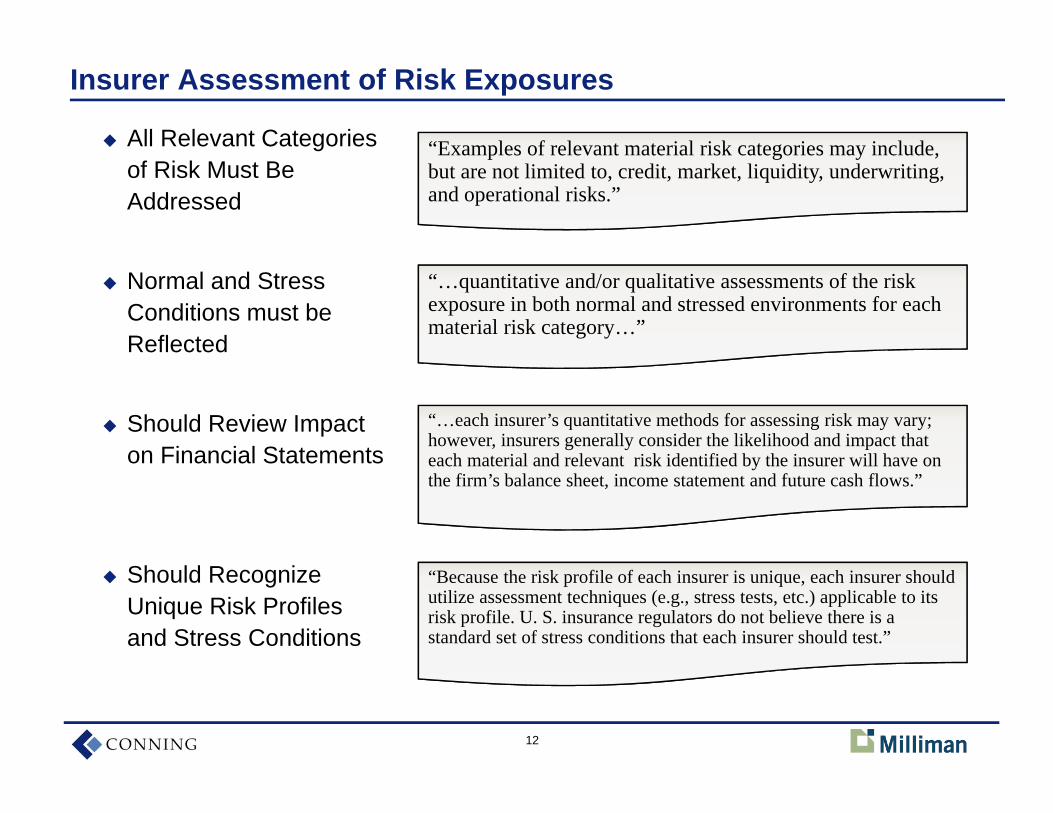
Insurer Assessment of Risk Exposures
All Relevant Categories of Risk Must Be Addressed
Normal and Stress Conditions must be Reflected
Should Review Impact on Financial Statements
Should Recognize Unique Risk Profiles and Stress Conditions
“…quantitative and/or qualitative assessments of the risk exposure in both normal and stressed environments for each material risk category…”
“Examples of relevant material risk categories may include, but are not limited to, credit, market, liquidity, underwriting, and operational risks.”
“…each insurer’s quantitative methods for assessing risk may vary; however, insurers generally consider the likelihood and impact that each material and relevant risk identified by the insurer will have on the firm’s balance sheet, income statement and future cash flows.”
“Because the risk profile of each insurer is unique, each insurer should utilize assessment techniques (e.g., stress tests, etc.) applicable to its risk profile. U. S. insurance regulators do not believe there is a standard set of stress conditions that each insurer should test.”
13
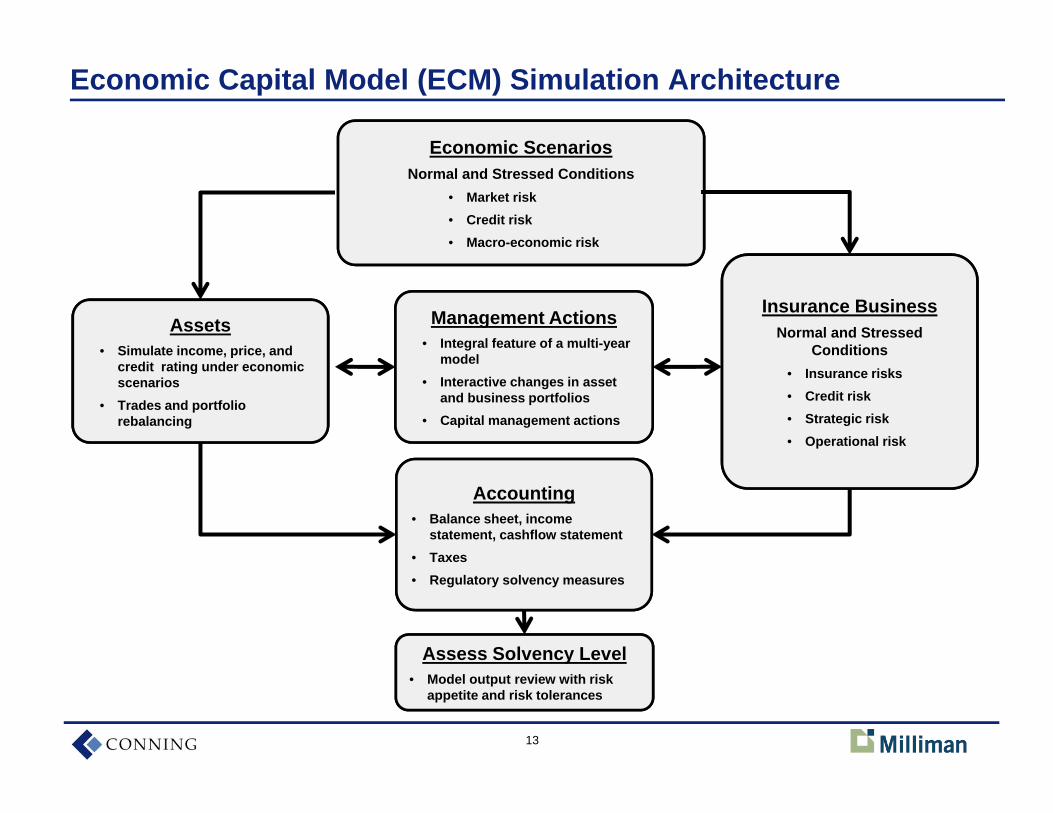
Economic Capital Model (ECM) Simulation Architecture
Economic ScenariosNormal and Stressed Conditions
• Market risk• Credit risk• Macro-economic risk
Insurance BusinessNormal and Stressed
Conditions• Insurance risks• Credit risk• Strategic risk• Operational risk
Assets• Simulate income, price, and
credit rating under economic scenarios
• Trades and portfolio rebalancing
Accounting• Balance sheet, income
statement, cashflow statement• Taxes• Regulatory solvency measures
Management Actions• Integral feature of a multi-year
model• Interactive changes in asset
and business portfolios• Capital management actions
Assess Solvency Level• Model output review with risk
appetite and risk tolerances
14
An Approach to “Non-quantifiable” Risks
Example: Regulatory Risk—the risk to earnings, capital and reputation arising from changes in regulations or failure to comply with regulations
1. Identify causal sources of regulatory uncertainty through focused interviews with business managers. Examples: new government mandates on pricing and profit levels and possible retroactive expansion of insurance coverage.
2. Discuss and create scenarios of how neutral, favorable, and adverse regulatory outcomes would affect the insurance business. A key facet of this is understanding the “timing” of the risk occurrence (regulatory ruling) with the future financial impact on the organization’s financials.
3. Design and implement the cause-and-effect process into the economic capital model. An insightful risk assessment does not really need complex modeling and should be fully explainable back to the business management.
15
Stress and Stochastic Modeling Approaches
ORSA Guidance Manual suggests usage of both stress testing approaches and stochastic risk modeling approaches
Each has distinct pros and cons
A robust analysis will employ both
16
Stress Test Modeling
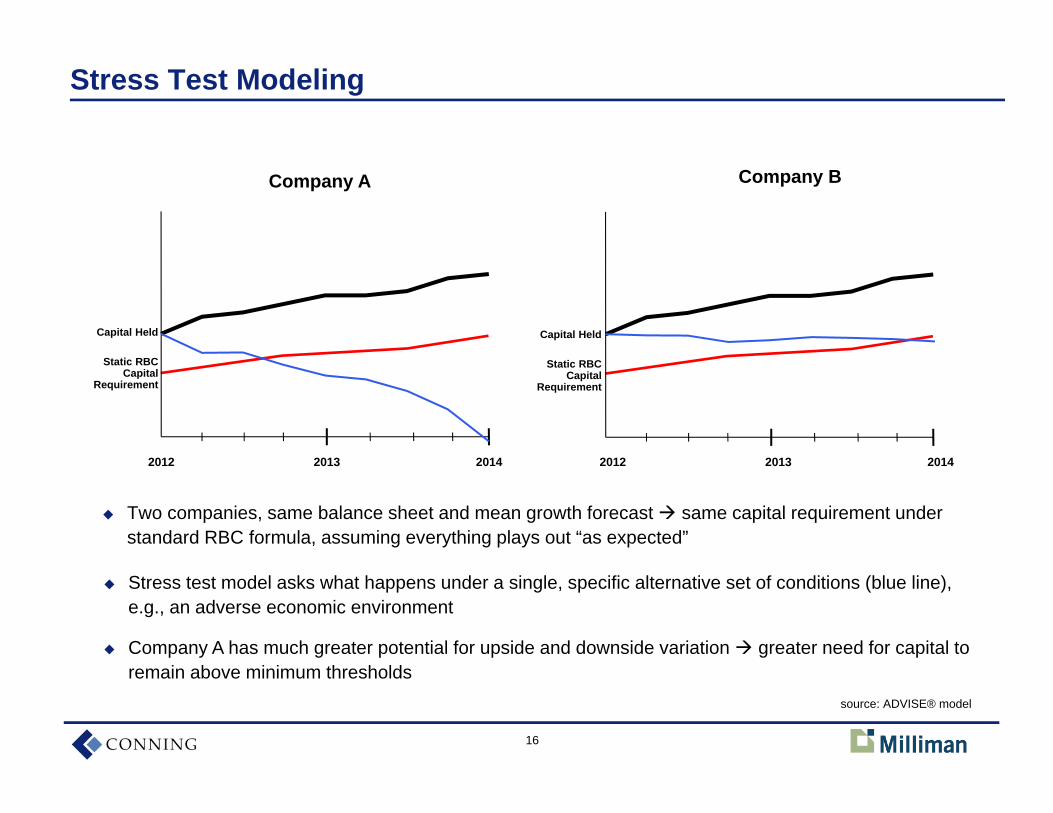
Two companies, same balance sheet and mean growth forecast same capital requirement under standard RBC formula, assuming everything plays out “as expected”
Capital Held
Static RBC Capital
Requirement
Capital Held
Static RBC Capital
Requirement
Company A Company B
Stress test model asks what happens under a single, specific alternative set of conditions (blue line), e.g., an adverse economic environment
Company A has much greater potential for upside and downside variation greater need for capital to remain above minimum thresholds
20132012 2014 20132012 2014
source: ADVISE® model
17
Stochastic Risk Modeling
Capital Held
Static RBC Capital
Requirement
Capital Held
Static RBC Capital
Requirement
Company A Company B
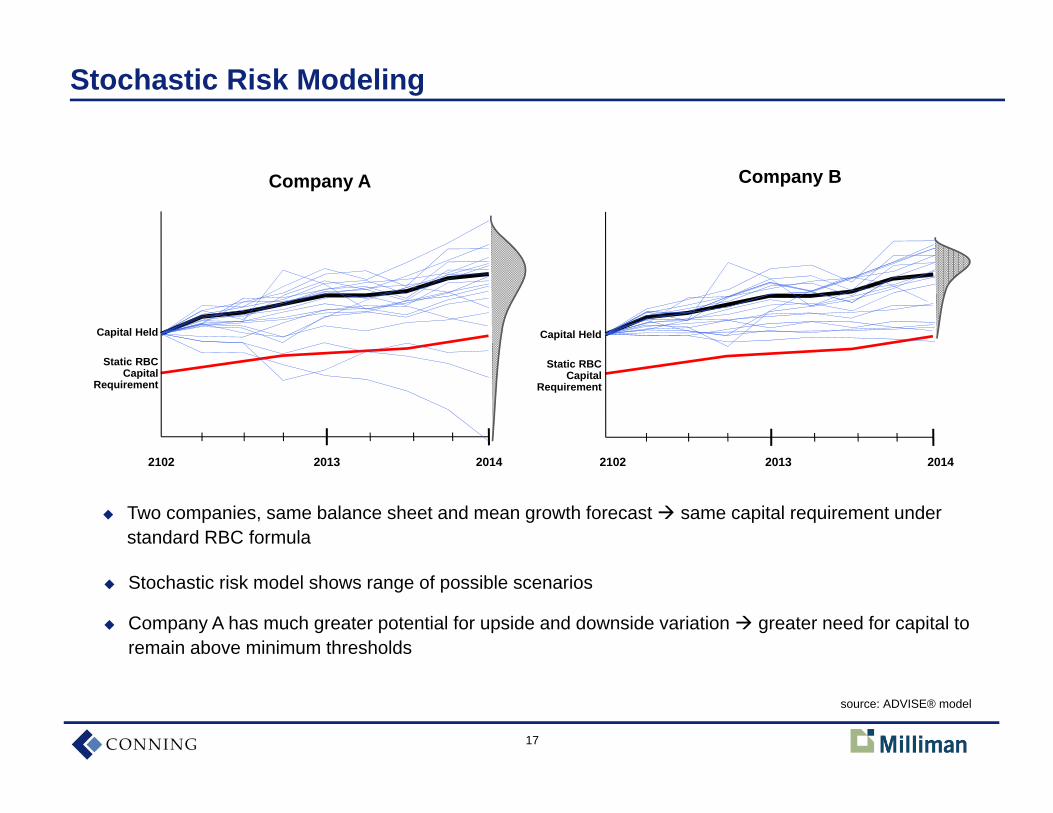
Stochastic risk model shows range of possible scenarios
Company A has much greater potential for upside and downside variation greater need for capital to remain above minimum thresholds
Two companies, same balance sheet and mean growth forecast same capital requirement under standard RBC formula
20132102 2014 20132102 2014
source: ADVISE® model
18
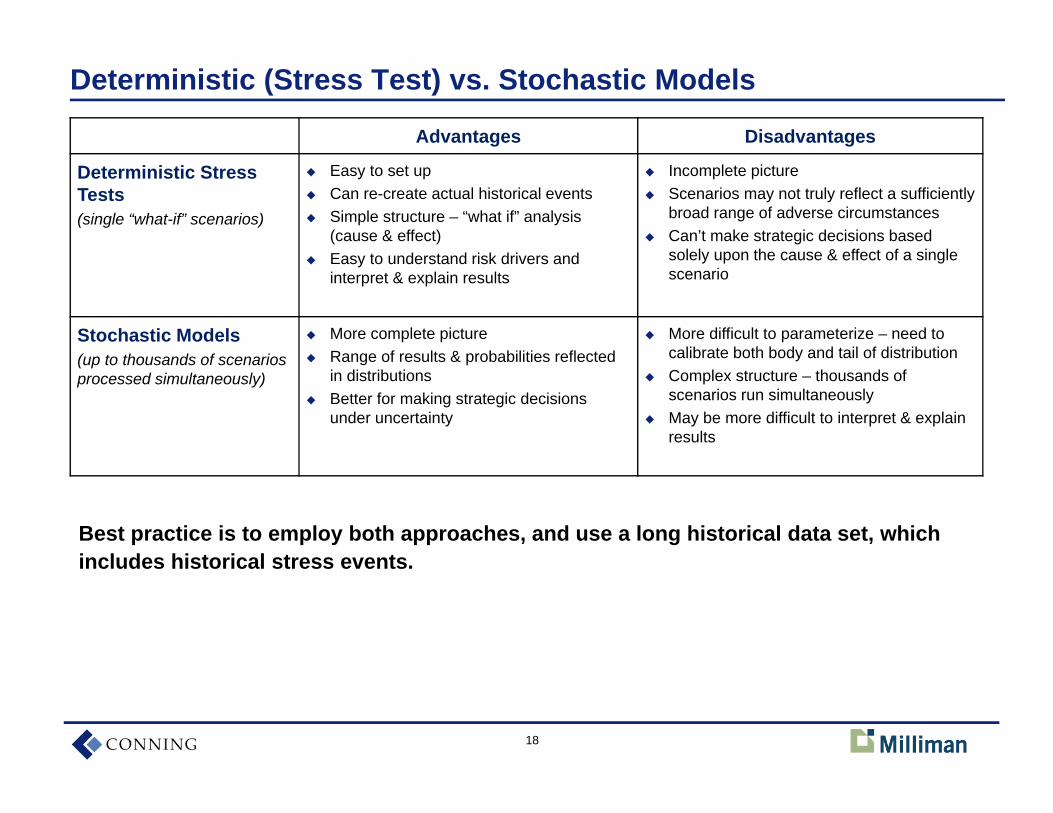
Deterministic (Stress Test) vs. Stochastic Models
Advantages Disadvantages
Deterministic Stress Tests(single “what-if” scenarios)
Easy to set up Can re-create actual historical events Simple structure – “what if” analysis
(cause & effect) Easy to understand risk drivers and
interpret & explain results
Incomplete picture Scenarios may not truly reflect a sufficiently
broad range of adverse circumstances Can’t make strategic decisions based
solely upon the cause & effect of a single scenario
Stochastic Models(up to thousands of scenarios processed simultaneously)
More complete picture Range of results & probabilities reflected
in distributions Better for making strategic decisions
under uncertainty
More difficult to parameterize – need to calibrate both body and tail of distribution
Complex structure – thousands of scenarios run simultaneously
May be more difficult to interpret & explain results
Best practice is to employ both approaches, and use a long historical data set, which includes historical stress events.
19
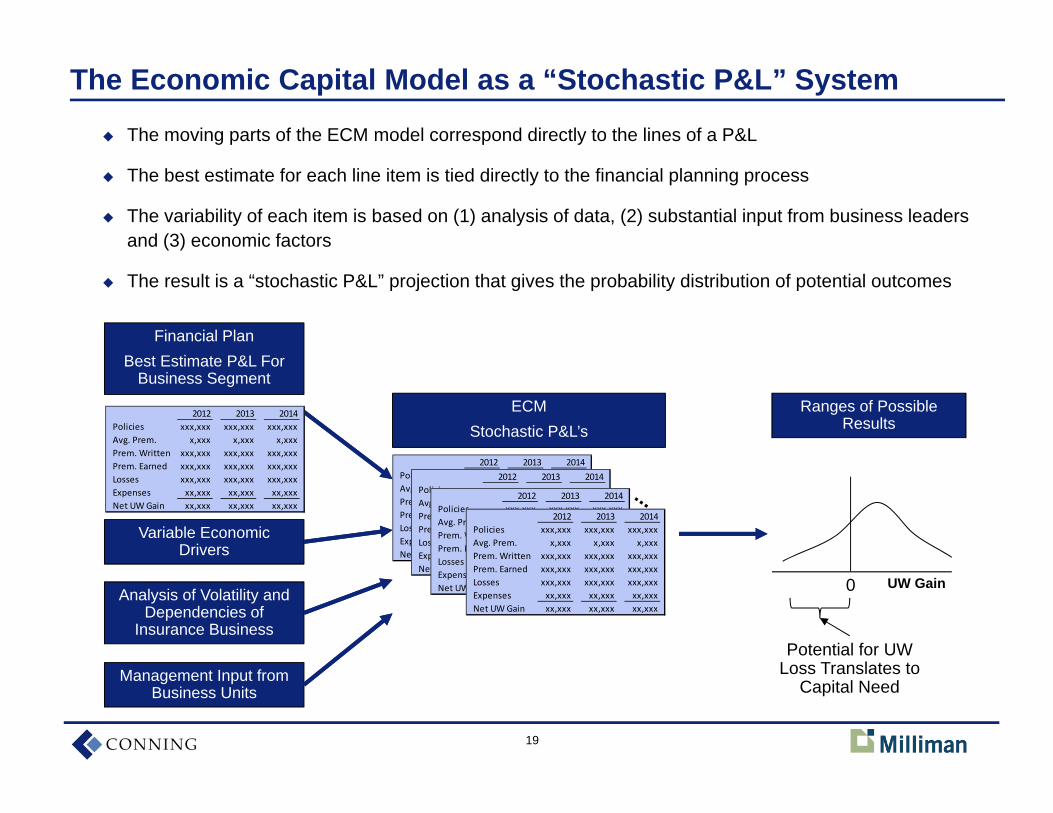
The Economic Capital Model as a “Stochastic P&L” System
The moving parts of the ECM model correspond directly to the lines of a P&L
The best estimate for each line item is tied directly to the financial planning process
The variability of each item is based on (1) analysis of data, (2) substantial input from business leaders and (3) economic factors
The result is a “stochastic P&L” projection that gives the probability distribution of potential outcomes
Variable Economic Drivers
Analysis of Volatility and Dependencies of
Insurance Business
Financial PlanBest Estimate P&L For
Business Segment
ECMStochastic P&L’s
0
Potential for UW Loss Translates to
Capital Need
UW Gain
Management Input from Business Units
Ranges of Possible Results
2012 2013 2014Policies xxx,xxx xxx,xxx xxx,xxxAvg. Prem. x,xxx x,xxx x,xxxPrem. Written xxx,xxx xxx,xxx xxx,xxxPrem. Earned xxx,xxx xxx,xxx xxx,xxxLosses xxx,xxx xxx,xxx xxx,xxxExpenses xx,xxx xx,xxx xx,xxxNet UW Gain xx,xxx xx,xxx xx,xxx
2012 2013 2014Policies xxx,xxx xxx,xxx xxx,xxxAvg. Prem. x,xxx x,xxx x,xxxPrem. Written xxx,xxx xxx,xxx xxx,xxxPrem. Earned xxx,xxx xxx,xxx xxx,xxxLosses xxx,xxx xxx,xxx xxx,xxxExpenses xx,xxx xx,xxx xx,xxxNet UW Gain xx,xxx xx,xxx xx,xxx
2012 2013 2014Policies xxx,xxx xxx,xxx xxx,xxxAvg. Prem. x,xxx x,xxx x,xxxPrem. Written xxx,xxx xxx,xxx xxx,xxxPrem. Earned xxx,xxx xxx,xxx xxx,xxxLosses xxx,xxx xxx,xxx xxx,xxxExpenses xx,xxx xx,xxx xx,xxxNet UW Gain xx,xxx xx,xxx xx,xxx
2012 2013 2014Policies xxx,xxx xxx,xxx xxx,xxxAvg. Prem. x,xxx x,xxx x,xxxPrem. Written xxx,xxx xxx,xxx xxx,xxxPrem. Earned xxx,xxx xxx,xxx xxx,xxxLosses xxx,xxx xxx,xxx xxx,xxxExpenses xx,xxx xx,xxx xx,xxxNet UW Gain xx,xxx xx,xxx xx,xxx
2012 2013 2014Policies xxx,xxx xxx,xxx xxx,xxxAvg. Prem. x,xxx x,xxx x,xxxPrem. Written xxx,xxx xxx,xxx xxx,xxxPrem. Earned xxx,xxx xxx,xxx xxx,xxxLosses xxx,xxx xxx,xxx xxx,xxxExpenses xx,xxx xx,xxx xx,xxxNet UW Gain xx,xxx xx,xxx xx,xxx
20
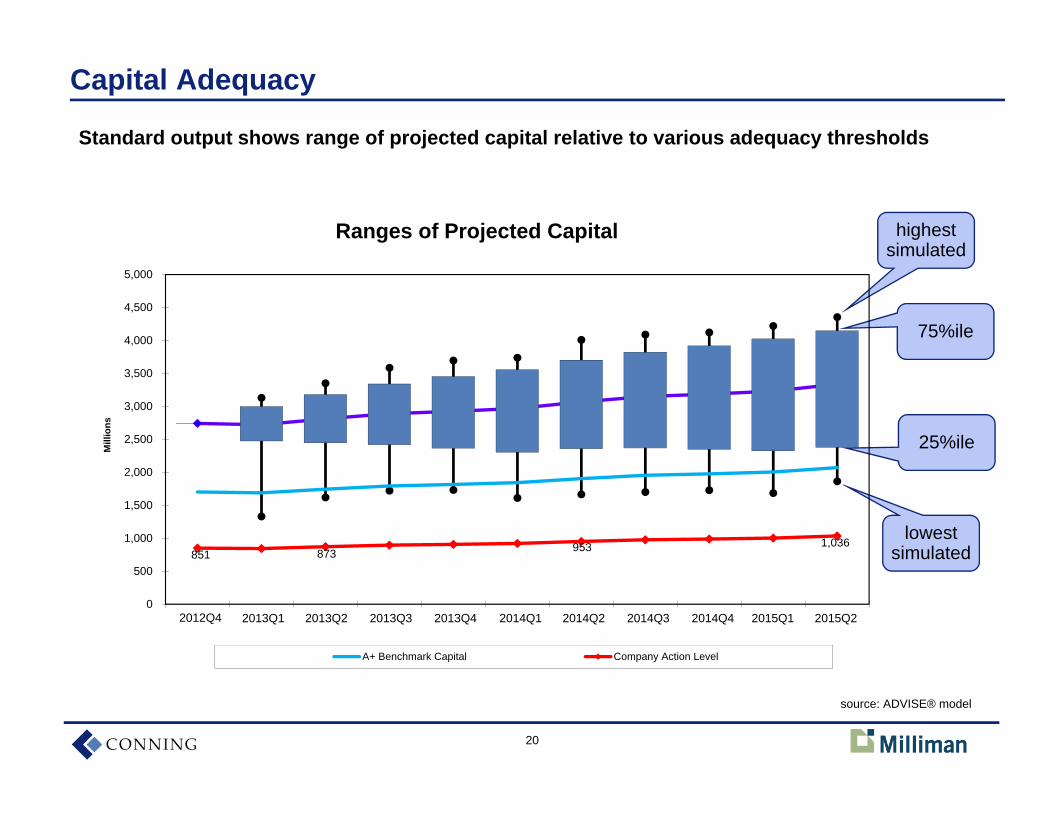
Capital Adequacy
Standard output shows range of projected capital relative to various adequacy thresholds
75%ile
25%ile
lowest simulated
highest simulated
851 873 953 1,036
0
500
1,000
1,500
2,000
2,500
3,000
3,500
4,000
4,500
5,000
2011Q4 2012Q1 2012Q2 2012Q3 2012Q4 2013Q1 2013Q2 2013Q3 2013Q4 2014Q1 2014Q2
Mill
ions
Ranges of Projected Capital
A+ Benchmark Capital Company Action Level
2012Q4 2013Q1 2013Q42013Q32013Q2 2014Q1 2014Q42014Q32014Q2 2015Q1 2015Q2
source: ADVISE® model
21
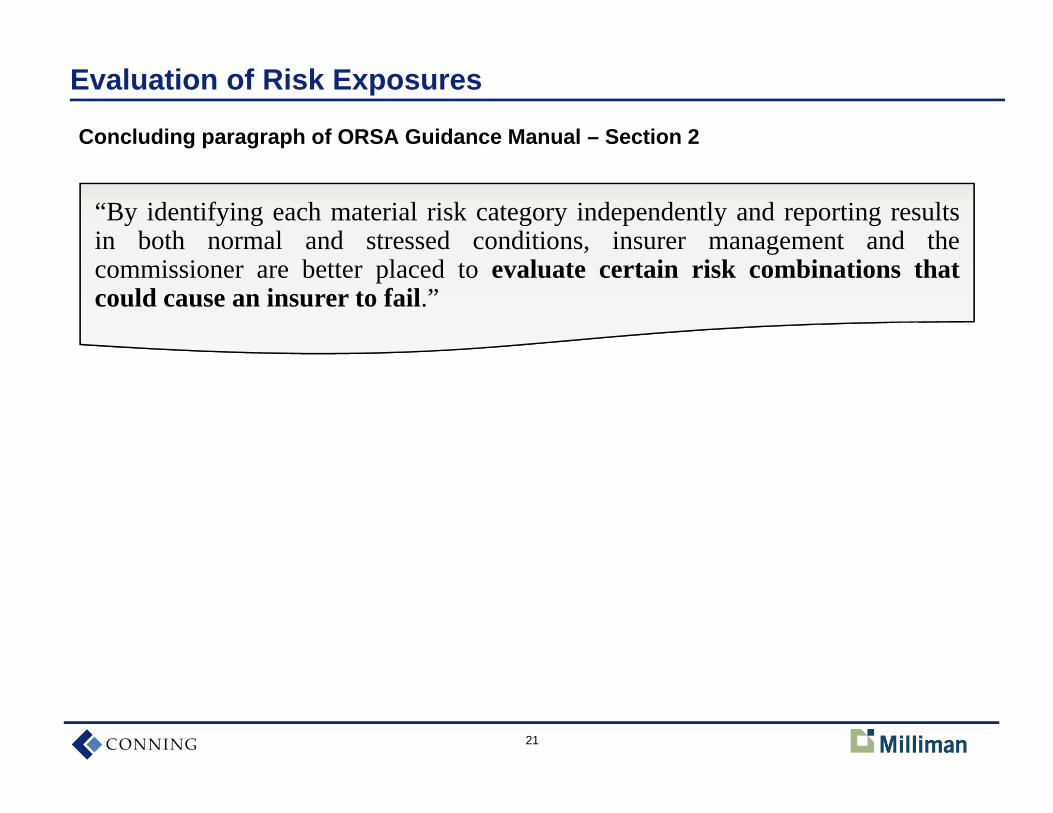
Evaluation of Risk Exposures
Concluding paragraph of ORSA Guidance Manual – Section 2
“By identifying each material risk category independently and reporting resultsin both normal and stressed conditions, insurer management and thecommissioner are better placed to evaluate certain risk combinations thatcould cause an insurer to fail.”
22
0
500
1,000
1,500
2,000
2,500
3,000
3,500
4,000
4,500
5,000
2011Q4 2012Q1 2012Q2 2012Q3 2012Q4 2013Q1 2013Q2 2013Q3 2013Q4 2014Q1 2014Q2
Mill
ions
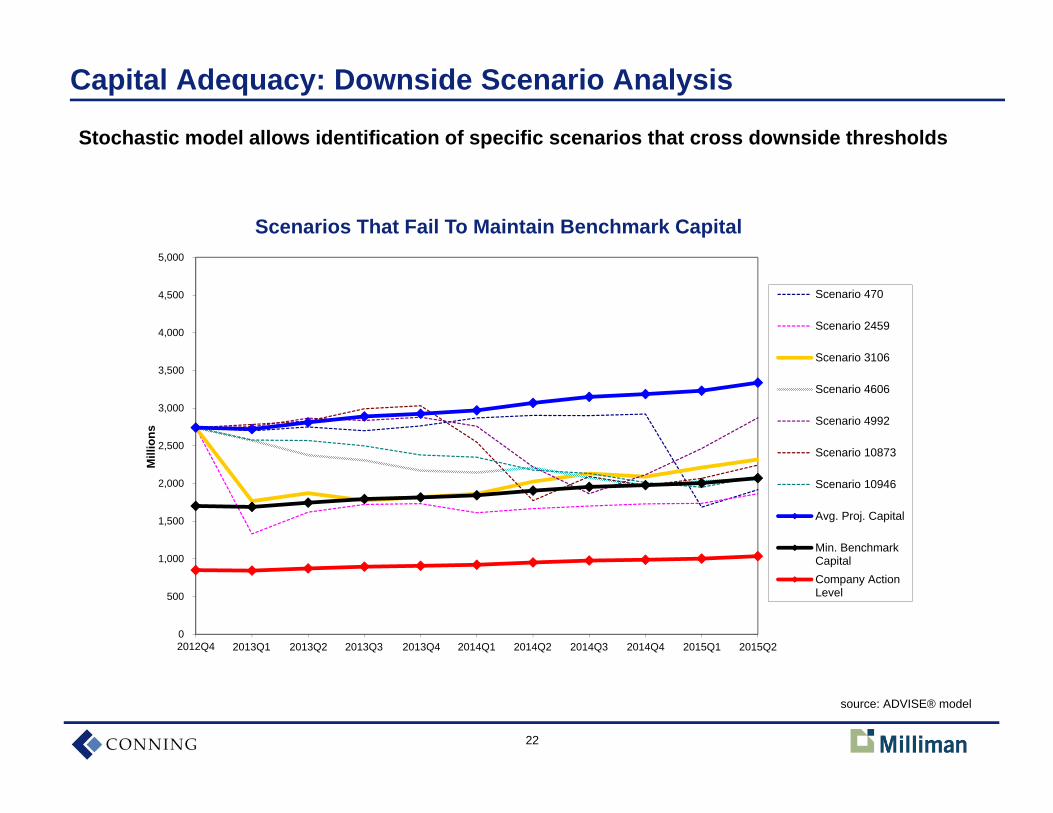
Scenarios That Fail To Maintain Benchmark Capital
Scenario 470
Scenario 2459
Scenario 3106
Scenario 4606
Scenario 4992
Scenario 10873
Scenario 10946
Avg. Proj. Capital
Min. BenchmarkCapitalCompany ActionLevel
Capital Adequacy: Downside Scenario Analysis
Stochastic model allows identification of specific scenarios that cross downside thresholds
2012Q4 2013Q1 2013Q42013Q32013Q2 2014Q1 2014Q42014Q32014Q2 2015Q1 2015Q2
source: ADVISE® model
23
Group Assessment of Risk Capital and Prospective Solvency Assessment
ORSA Guidance Manual – Section 3
“Within the Group Assessment of Risk Capital (Assessment), aggregate avail-able capital is compared against the various risks that may adversely affect theenterprise. Insurers should consider how the Assessment is integrated into theinsurer’s management and decision making culture, how the insurer evaluates itsavailable capital and how risk capital is integrated into its capital managementactivities.”
“Insurers should have sound processes for assessing capital adequacy in relationto their risk profile and those processes should be integrated into the insurer’smanagement and decision-making culture.”
24
Drill-Down Into Adverse Scenarios
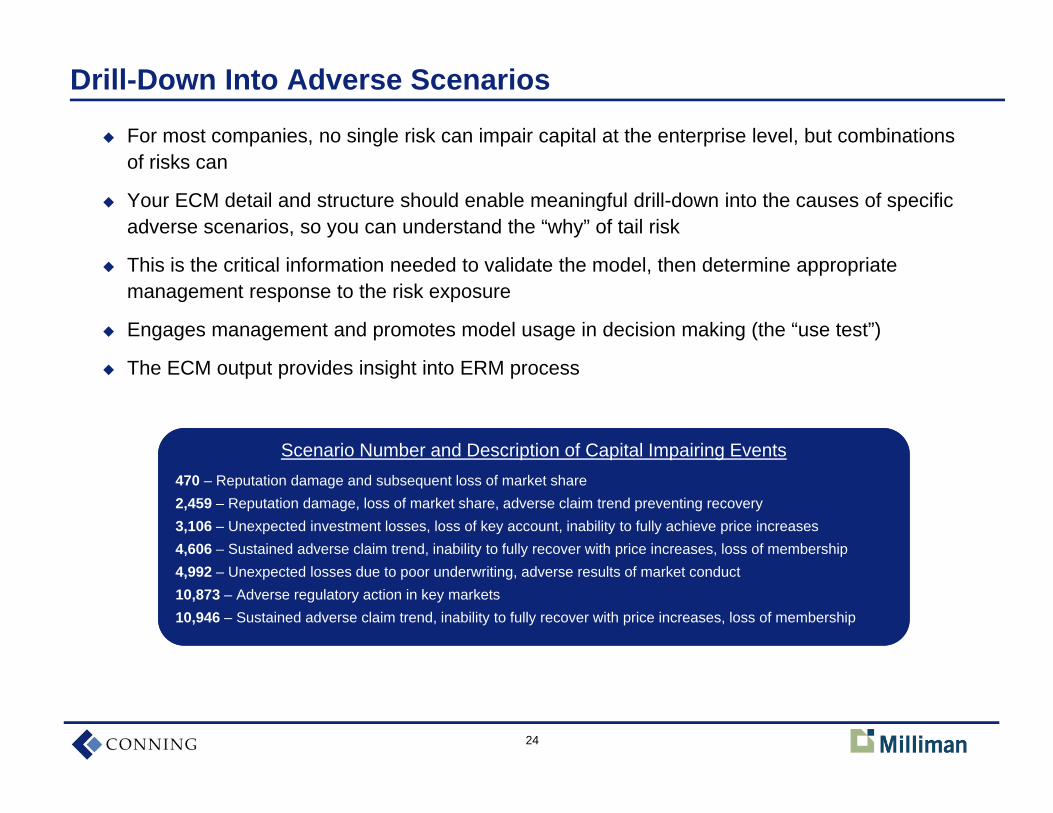
For most companies, no single risk can impair capital at the enterprise level, but combinations of risks can
Your ECM detail and structure should enable meaningful drill-down into the causes of specific adverse scenarios, so you can understand the “why” of tail risk
This is the critical information needed to validate the model, then determine appropriate management response to the risk exposure
Engages management and promotes model usage in decision making (the “use test”)
The ECM output provides insight into ERM process
Scenario Number and Description of Capital Impairing Events470 – Reputation damage and subsequent loss of market share2,459 – Reputation damage, loss of market share, adverse claim trend preventing recovery3,106 – Unexpected investment losses, loss of key account, inability to fully achieve price increases4,606 – Sustained adverse claim trend, inability to fully recover with price increases, loss of membership4,992 – Unexpected losses due to poor underwriting, adverse results of market conduct 10,873 – Adverse regulatory action in key markets10,946 – Sustained adverse claim trend, inability to fully recover with price increases, loss of membership
Scenario Number and Description of Capital Impairing Events470 – Reputation damage and subsequent loss of market share2,459 – Reputation damage, loss of market share, adverse claim trend preventing recovery3,106 – Unexpected investment losses, loss of key account, inability to fully achieve price increases4,606 – Sustained adverse claim trend, inability to fully recover with price increases, loss of membership4,992 – Unexpected losses due to poor underwriting, adverse results of market conduct 10,873 – Adverse regulatory action in key markets10,946 – Sustained adverse claim trend, inability to fully recover with price increases, loss of membership
25
Risk Category Relationships
Concluding paragraph of ORSA Guidance Manual – Section 2
“...One of the most difficult exercises in modeling insurer results is determiningthe relationships, if any, between risk categories. History may provide someempirical evidence of relationships, but the future is not always best estimated byhistorical data.”
26
Aggregation and Diversification — Modeling Issues
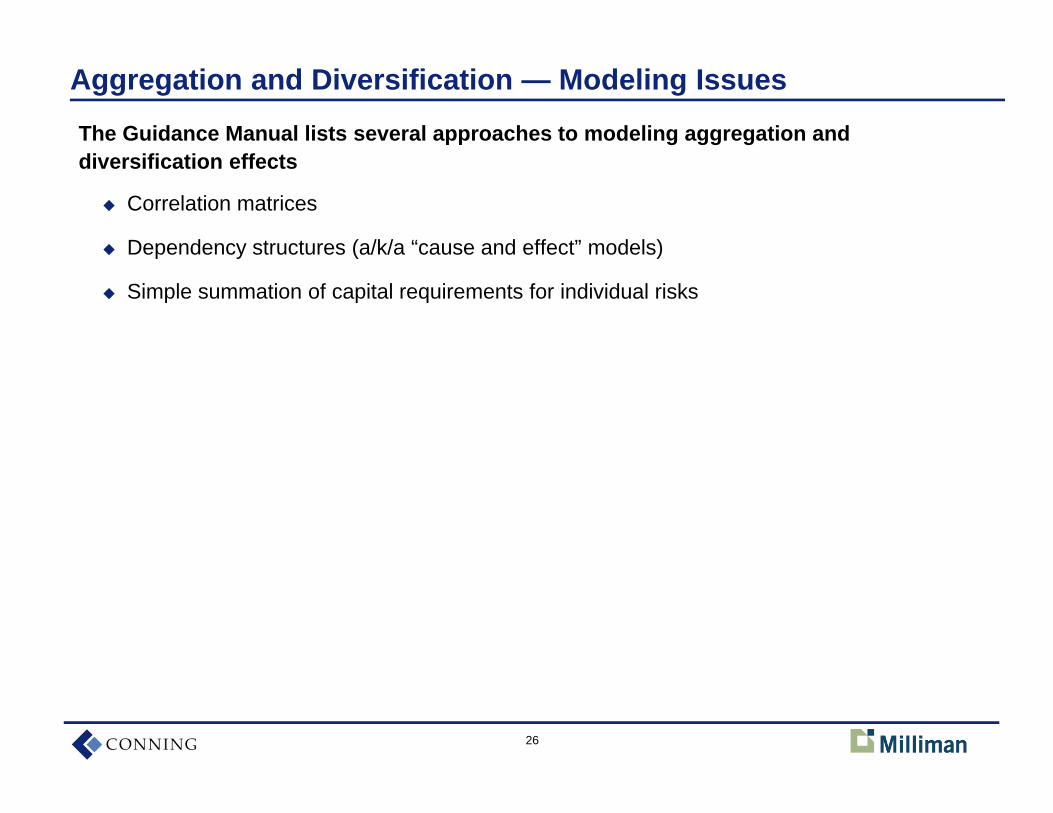
Correlation matrices
Dependency structures (a/k/a “cause and effect” models)
Simple summation of capital requirements for individual risks
The Guidance Manual lists several approaches to modeling aggregation and diversification effects
27
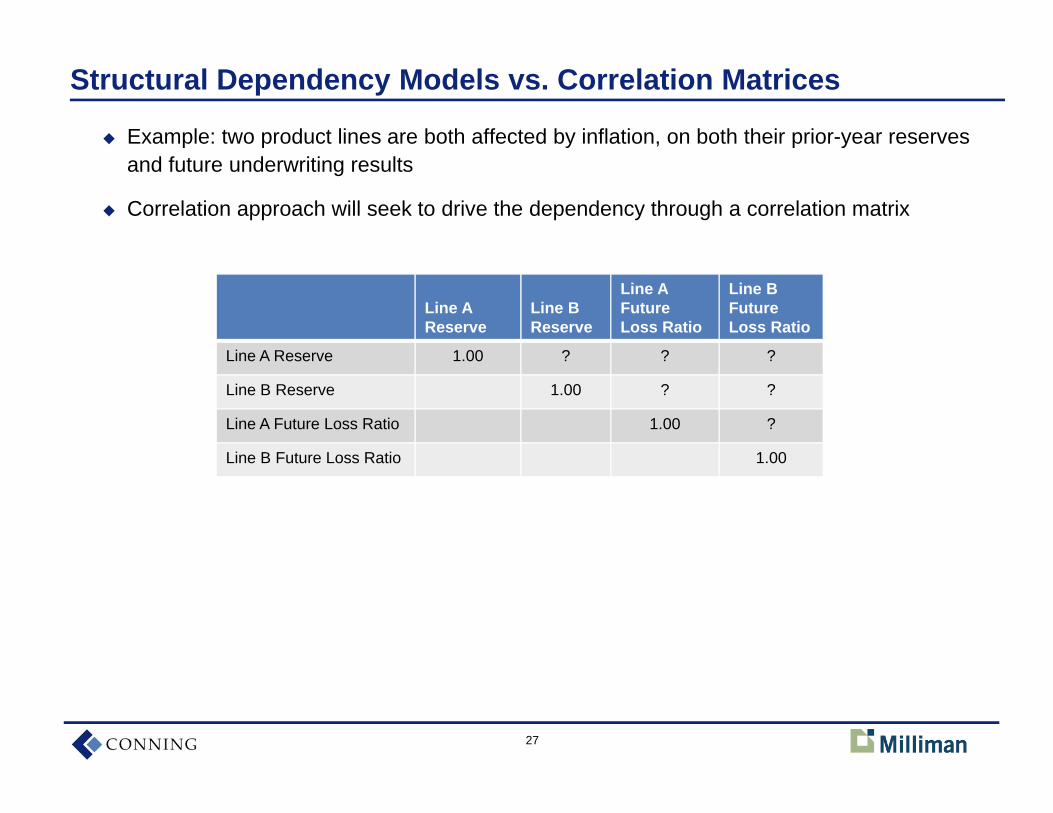
Structural Dependency Models vs. Correlation Matrices
Example: two product lines are both affected by inflation, on both their prior-year reserves and future underwriting results
Correlation approach will seek to drive the dependency through a correlation matrix
Line A Reserve
Line BReserve
Line A Future Loss Ratio
Line B FutureLoss Ratio
Line A Reserve 1.00 ? ? ?
Line B Reserve 1.00 ? ?
Line A Future Loss Ratio 1.00 ?
Line B Future Loss Ratio 1.00
28
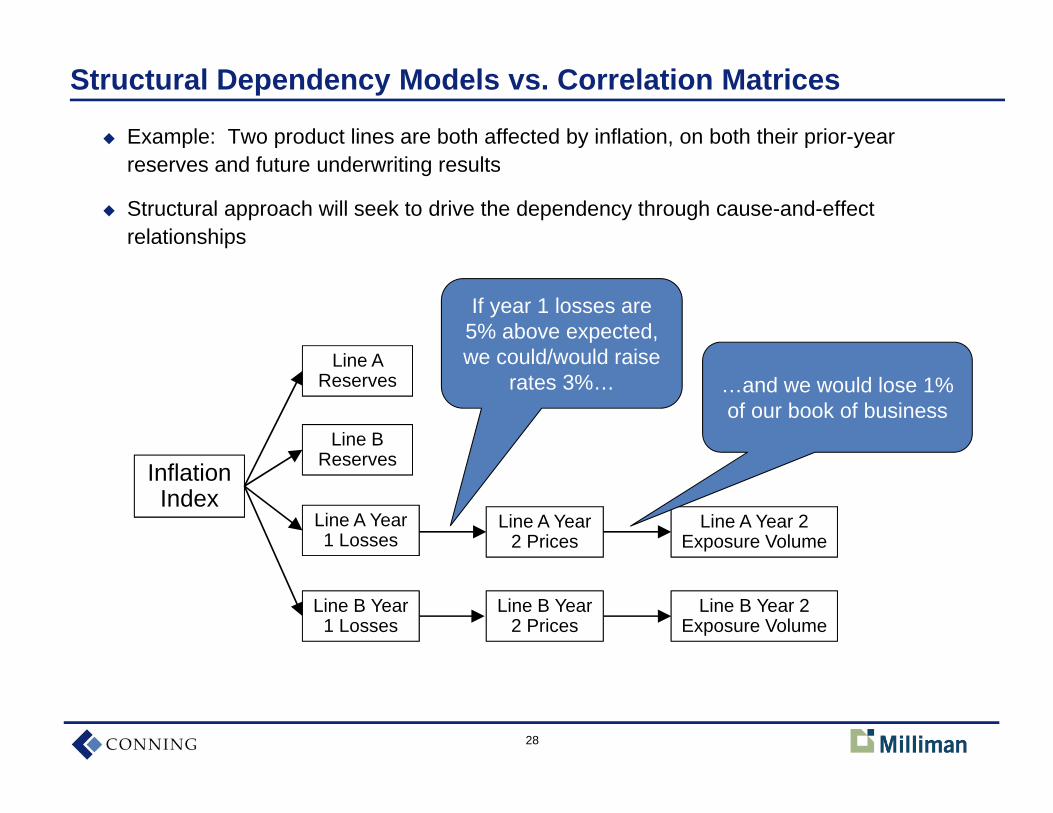
Structural Dependency Models vs. Correlation Matrices
Example: Two product lines are both affected by inflation, on both their prior-year reserves and future underwriting results
Structural approach will seek to drive the dependency through cause-and-effect relationships
Inflation Index
Line B Reserves
Line A Reserves
Line A Year 1 Losses
Line B Year 1 Losses
Line A Year 2 Prices
Line B Year 2 Prices
Line A Year 2 Exposure Volume
Line B Year 2 Exposure Volume
If year 1 losses are 5% above expected, we could/would raise
rates 3%… …and we would lose 1% of our book of business
29
Making Model Assumptions Accessible to Non-Modelers
Limitations of correlation/copula approaches
Assumes relationships go in one direction, continuous
Difficult to create sufficient joint tail outcomes for multiple risks
Difficult to interpret, discuss with business leaders, regulators, etc.
Benefits of structural dependency approaches
The model looks more like how the business works
Therefore, more straightforward for management to provide input in how the assumptions should be set
Similarly, easier to validate model results — the modeler can parse a downside scenario by drilling back through the structural relationships to explain the business outcomes that drove it — management can then evaluate whether that assumptions makes sense, and if so what to do about the exposure
Finally, easier to model potential changes to management action that could mitigate the risk
30
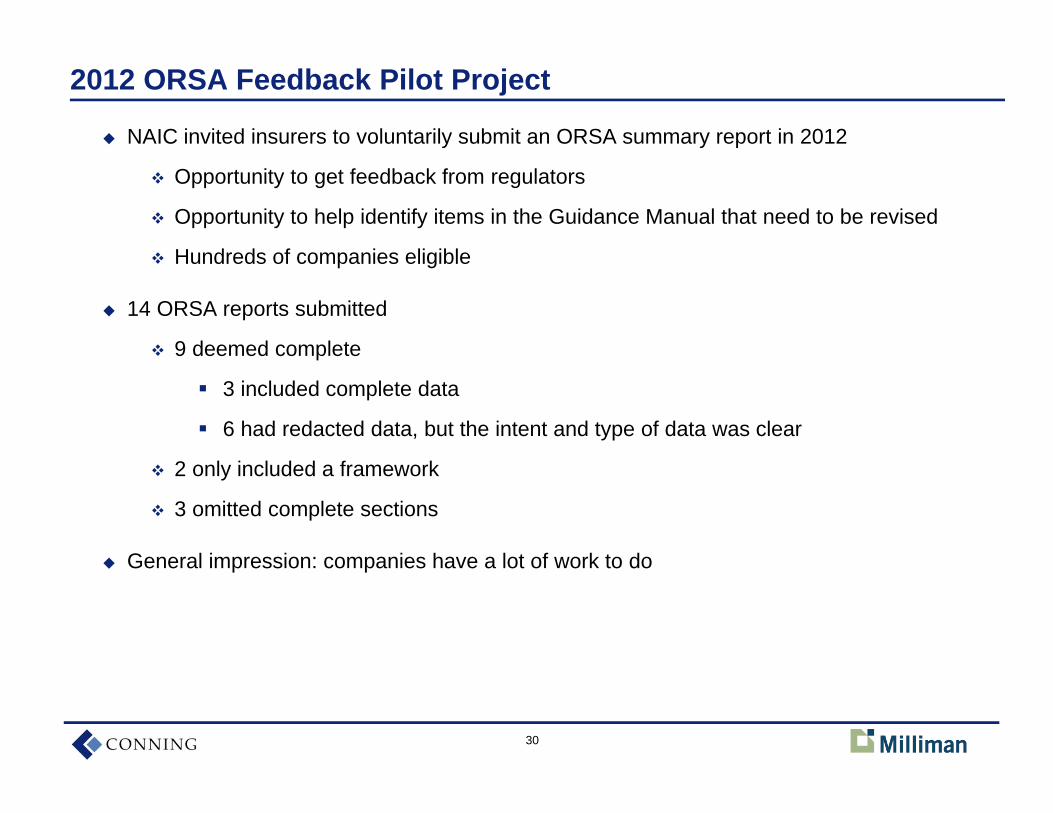
2012 ORSA Feedback Pilot Project
NAIC invited insurers to voluntarily submit an ORSA summary report in 2012
Opportunity to get feedback from regulators
Opportunity to help identify items in the Guidance Manual that need to be revised
Hundreds of companies eligible
14 ORSA reports submitted
9 deemed complete
3 included complete data
6 had redacted data, but the intent and type of data was clear
2 only included a framework
3 omitted complete sections
General impression: companies have a lot of work to do
31
Conclusion
ORSA model regulations provide considerable latitude for implementation approach
But overall requirements are beyond what most insurers are doing today, even those with relatively advanced ERM programs
Insurers must begin to act now in order to meet the expected timeline for reporting
A well-designed ERM program provides business benefits far beyond compliance
33
All rights reserved. This presentation is produced by Conning and may not be reproduced or disseminated in any form without theexpress permission of Conning. This presentation is intended only to inform readers about general developments of interest and does notconstitute investment advice. While every effort has been made to ensure the accuracy of the information contained herein, Conning doesnot guarantee such accuracy and cannot be held liable for any errors in or any reliance upon this information. Conning does notguarantee that this presentation is complete. Opinions expressed herein are subject to change without notice. Past performance is noindication of future results.For complete details regarding Conning, Inc. and its services, you should refer to our Form ADV Part 2 which may be obtained by calling us.
C11:1728908