Embed Size (px)
Citation preview
Plant community structure and soil properties along stream corridors of
cranberry bogs since discontinuation of agriculture.
Report on an Independent Project
Semester in Environmental Science
Marine Biological Laboratory
Fall, 2010
Melanie Poole
Connecticut College
270 Mohegan Avenue,
New London, Connecticut 06320
Advisor: Dr. Linda Deegan
Senior Scientist, Ecosystem Center
The Marine Biological Laboratory
7 MBL Street
Woods Hole, Massachusetts 02543
Poole 1
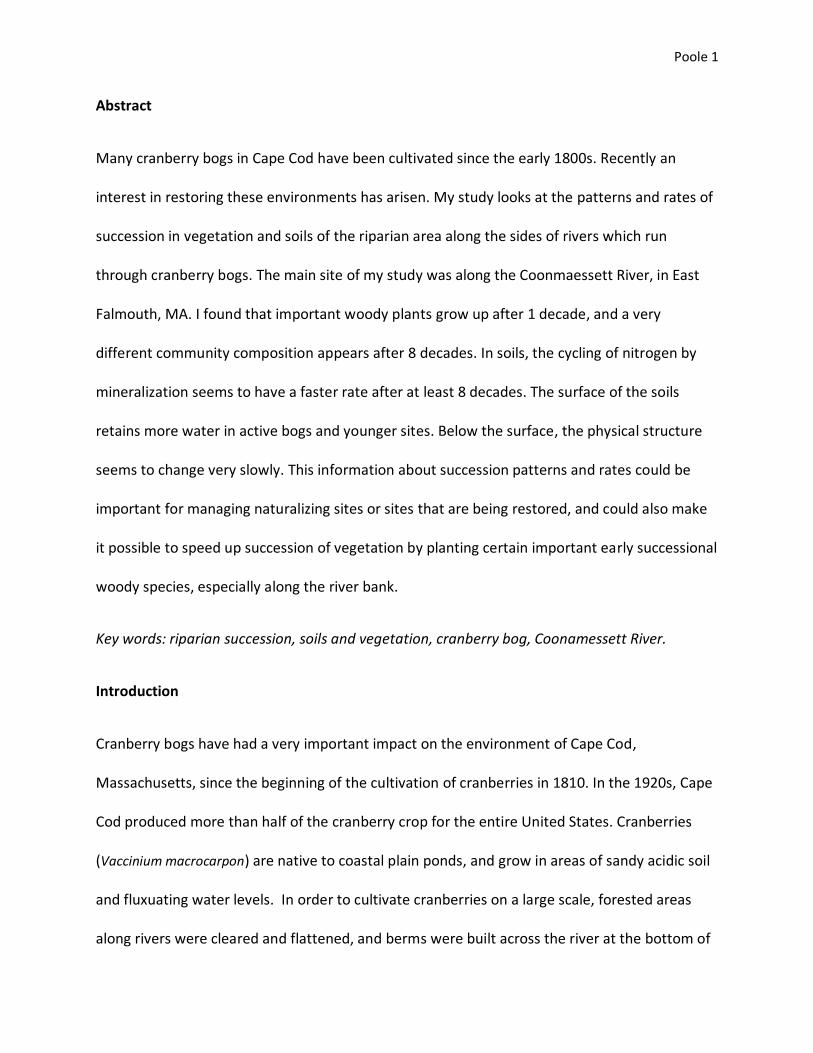
Abstract
Many cranberry bogs in Cape Cod have been cultivated since the early 1800s. Recently an
interest in restoring these environments has arisen. My study looks at the patterns and rates of
succession in vegetation and soils of the riparian area along the sides of rivers which run
through cranberry bogs. The main site of my study was along the Coonmaessett River, in East
Falmouth, MA. I found that important woody plants grow up after 1 decade, and a very
different community composition appears after 8 decades. In soils, the cycling of nitrogen by
mineralization seems to have a faster rate after at least 8 decades. The surface of the soils
retains more water in active bogs and younger sites. Below the surface, the physical structure
seems to change very slowly. This information about succession patterns and rates could be
important for managing naturalizing sites or sites that are being restored, and could also make
it possible to speed up succession of vegetation by planting certain important early successional
woody species, especially along the river bank.
Key words: riparian succession, soils and vegetation, cranberry bog, Coonamessett River.
Introduction
Cranberry bogs have had a very important impact on the environment of Cape Cod,
Massachusetts, since the beginning of the cultivation of cranberries in 1810. In the 1920s, Cape
Cod produced more than half of the cranberry crop for the entire United States. Cranberries
(Vaccinium macrocarpon) are native to coastal plain ponds, and grow in areas of sandy acidic soil
and fluxuating water levels. In order to cultivate cranberries on a large scale, forested areas
along rivers were cleared and flattened, and berms were built across the river at the bottom of
Poole 2
each bog in order to dam the rivers occasionally. Many areas of the Cape have been cultivated
for cranberries almost continuously since the 1800s, and although some practices have
changed, such as the introduction of fertilizer and insecticide, the basic structure of farming
remains the same. Cranberry bogs are flooded several times a year for harvest, and to protect
the crop from insects and the cold. Sand is also spread over the bogs about three to five times a
year to keep productivity high (Mason 1926).
The practice of cranberry cultivation is highly disruptive to this important riparian ecosystem in
the river corridors in several ways. The vegetation is highly disturbed by the original clear-
cutting and the artificial monoculture which is maintained there. Woody plants are excluded
from this area, and therefore the river is very exposed, and can reach higher summer
temperatures than normal. The soils of this area are also changed by the regular sanding and
flooding of the bog.
Cranberry bogs are very interesting sites because they exemplify two historical and cultural
ways in which humans have used the natural resources of Cape Cod, through the cranberry
industry and the anadromous herring (Alosa pseudoharengus and A. aestivalis) and brook trout
(Salvelinus fontinalis) fishery of the river. Both are natural resources which have been utilized
for over 100 years, but in recent times, things have begun to change.
As the population and development of Cape Cod continues to grow, maintaining and restoring
natural areas becomes more and more important. Essential environments, such as riparian
ecosystems, provide many ecosystem services which will become increasingly important with
higher populations (Kremen, 2005). Ecosystems provide important services to the natural world
Poole 3
when they are intact, rather than in the highly disturbed state of cranberry cultivation (Wilson
and Carpenter, 1999).
The health of the herring run in many Cape Cod rivers, especially the Coonamessett River, has
been declining, and there has been a trend of cranberry bogs being discontinued or bought by
conservation organizations. These areas are either naturalizing on their own, or in some cases,
are undergoing active restoration to return them to a more natural state (Neil, 2006). There are
hopes that restoring the riparian habitat surrounding the Coonamessett will improve the
herring run, lower summer river temperatures, and therefore provide higher value ecosystem
services (Pitcher, 2001). Since 2006, the Coonamessett River Trust has been working to return
the natural flow of the river in order to improve habitat and hopefully, increase the run of
herring in the spring (Neill, 2006).
My study describes the riparian ecological succession in cranberry bogs of Cape Cod, or how
cranberry bog stream banks are changing since the discontinuation of agriculture. I used space-
for-time substitution to look at ecological changes in two of the most disturbed aspects as a
result of cranberry cultivation, vegetation and soils. My study focuses of plants and soils
because these aspects are part of both the biological and physical aspects of the riparian
environment. Recently, plants have been recognized as potential autogenic ecosystem
engineers which are able to change the environment in which they grow, and modify the flow
of resources. Woody early succession plants are especially thought to be important in the
succession of riparian areas (Corenblit et al. 2009 and Lawton 1994). I look at the patterns and
rates at which the structure and composition of vegetation and soils change, in order to assess
Poole 4
whether these riparian areas will ever return to their natural pre-agricultural state, and how
they will get there.
This information will be helpful in guiding conservation organizations, such as the
Coonamessett River Trust, in how they decide to manage old cranberry bog areas in order for
them to reach the natural state desired.
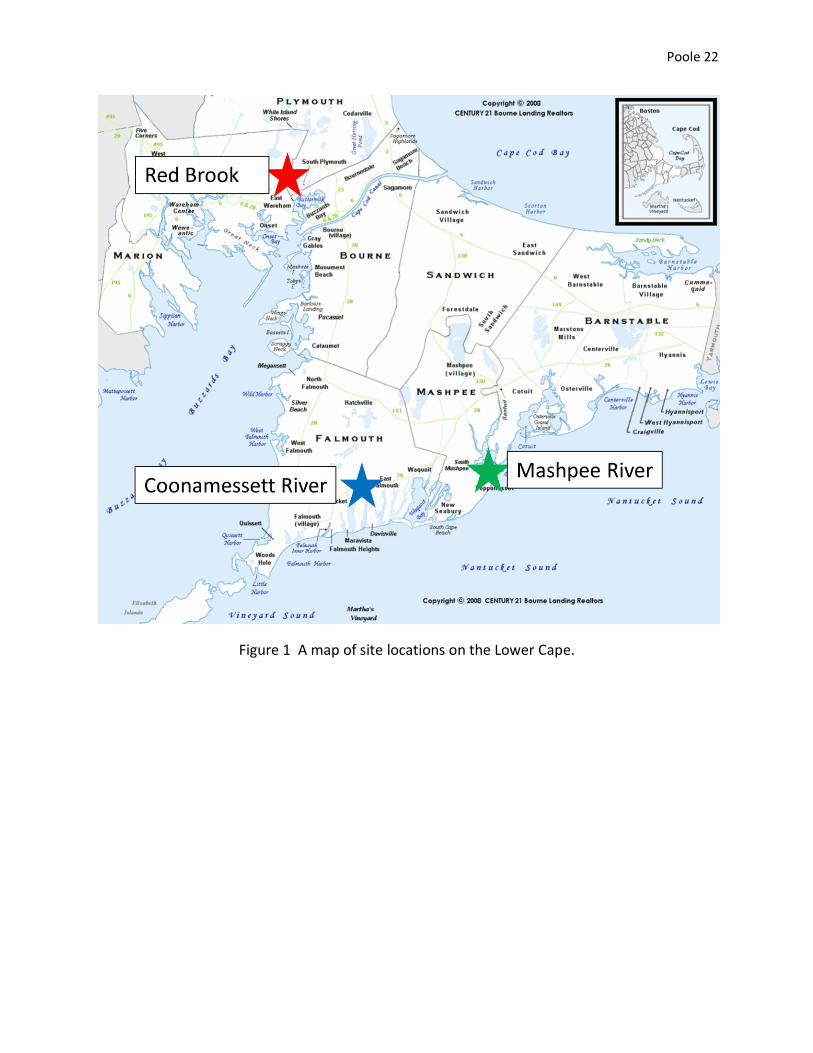
Sites
In this study I looked at eight riparian sites, six of which were once involved in cranberry
agriculture, and two which served as controls (Table 1). Each site is on the Lower Cape (Figure
1).
The first site is the along the Mashpee River (Mashpee, MA), which has never been used for
agriculture, but has similar morphology to areas which were cranberried. The river is shallow
and sandy, with a fairly flat but small floodplain. The second control site is the Forested Section
of the Connamessett River, in East Falmouth, MA, which has also never been a cranberry bog.
This section, however, was disturbed in the past as evidenced by the stone retaining wall along
the river. This area is also down-stream from currently active cranberry bogs.
The next two sites are also along the Coonamesset River. Flax II Bog and Lower Bog were both
discontinued in 2004, however, Lower Bog has been undergoing some light active restoration
by the Coonamessett River Trust, while Flax II has seen very little active maintenance. The
restoration has involved the removal of any invasive willow species (Salix atrocinera) on the bog
platform. Those growing along the river bank were left for improved stabilization. These two
Poole 5
bogs were grouped under the title “1 decade old bogs”. The next site is Red Brook, which was a
cranberry bog, but agriculture was discontinued about 100 years ago. This site is in Wareham,
Massachusetts. Zeke’s Way Forested Bog is back along the Coonnamesset River, and agriculture
was discontinued here about 80 years ago. These two sites, for simplicity’s sake, are grouped
under the title “8 decades old”. The last two bogs, Reservoir Bog and Middle Bog, are currently
active bogs on the Coonamessett River. These continue to be harvested and maintained by
farmers every year. Recently these bogs have switched from conventional farming to organic
farming.
Methods
Vegetation -- The vegetation data was comprised of three sub-sets: two 10x10 meter plots, six
2x2 meter plots, and three 30 meter point transects. Within each 10X10m plot, which had one
side directly along the river bank, I measured the diameter at breast height (DBH) of all the
trees larger than 3 cm, and identified them. Within the smaller plots, all plants were identified,
and percent cover was estimated, using size categories of <1%, 1-5%, 6-25%, 26-50%, 51-75%,
and 76-100%. The midpoints of these categories were used for their percent cover values.
Where possible, the plot sets were divided evenly between two sides of the river bank. The 30
meter point transects were laid out directly along the bank, alternating bank side for each
transect. At every meter, a box of 25 centimeters was estimated, with the meter mark in the
middle of the side closest to the river, and up to 5 of the most abundant plant species within
this box were identified and recorded. Later, this was simplified to label each point along the
Poole 6
bank as dominated by one of five categories of structure: Woody Vegetation, Roots,
Herbaceous Vegetation, Non-Living Structures, or Un-Vegetated bank.
Soils --I took two kinds of soil samples at each site. The first was a surface bulb core of about
the top 10.5 centimeters of soil, which was used to look at nitrogen pools (NH4 and NO3) and
mineralization rates at each site. Five replicates were taken from each site, from within 10
meters of the river bank spaced about 2 meters apart, and at least one meter away from any
lateral channels. Once back in lab, the nitrogen was extracted using the methods of Foreman, in
KCL extractions of soils for N Mineralization (2010). The solutions were filtered with Swinex
filters (Fisher Scientific, Fair Lawn, NJ), and analyzed for ammonium using the modified
technique of Strickland and Parsons (1972), and Solarzano (1969), as outlined by Foreman in
Ammonium Protocol (2010). The nitrate was analyzed using the methods outlined by Wood,
E.D et al (1967). After the first measurements were taken, the soils were incubated for 4 weeks
at a temperature of 20°C, and then the pools were measured again.
The second samples collected were soil cores of at least 30cm deep from each site, using the
AMS soil core sampler (American Falls, ID). I took two cores from the Forested Section, the second called
“Forested Platform”, which I took from up off of the floodplain. The cores were extruded and cut into
2 centimeter sections. Each section was homogenized, weighed, oven dried at 50°C, and
weighed again.
I then took samples of dry soil from each depth section, and extracted the lead using the nitric
acid filtration method. First I took 0.2 to 1.0 grams of the dry sediment, placed it in a centrifuge
tube, and added 10 mL of 1.6 Molar HNO3 . These tubes were shaken for 8-16 hours, 4 mL of
Poole 7
HNO3 was added, and then they were shaken for 3 hours. The sediment was then filtered
through a GF/F 47mm circle and 55mm filter paper (Fisher Scientific, Fair Lawn, NJ). The filtered
solution was placed in scintillation vials, and later analyzed using an Atomic Absorption
Spectophotometer. I took a second set of dry soil samples from the top 10cm, and analyzed
these for their carbon, nitrogen, and hydrogen (CHN) content, following methods of Foreman in
Preparing, Packing & Organizing CHN Samples (2010).
Results
Vegetation -- Much of the vegetation data from my study showed very clear composition and
structure trends of changes over time.
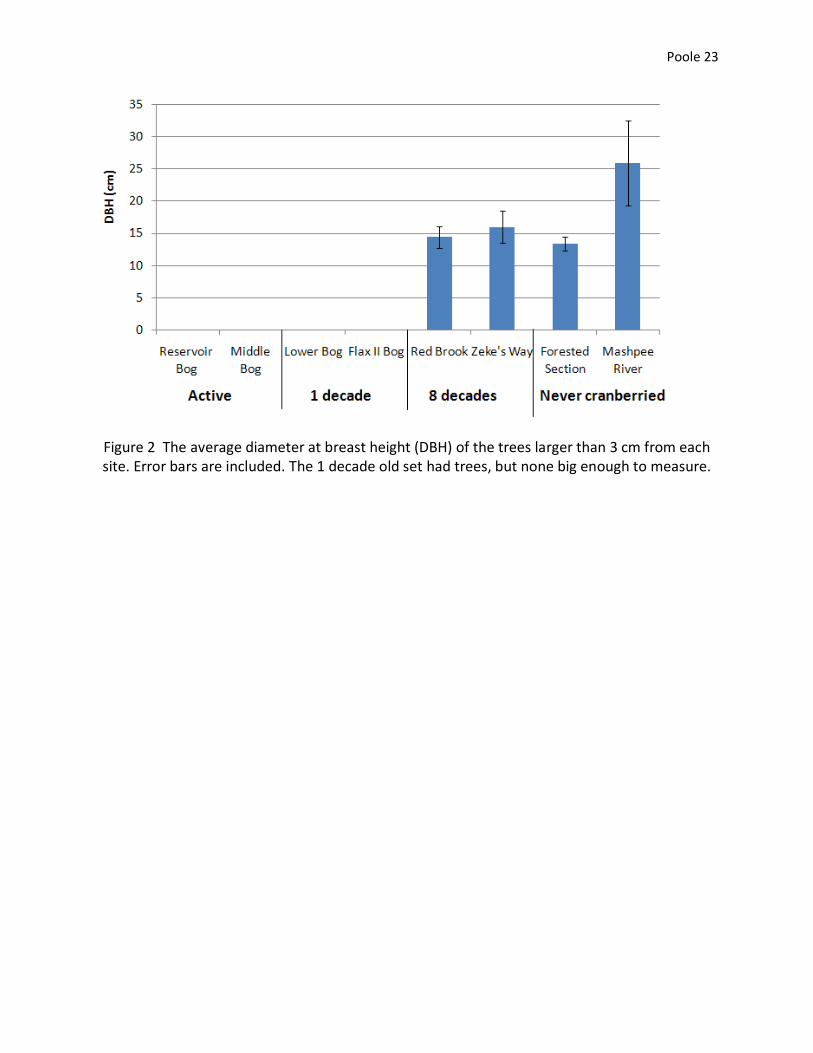
From the 10X10 meter plots, sites showed a trend of increasing DBH with increasing age (Figure
2). The sites which have not been farmed in many years have higher DBH values than the
recently discontinued bogs, and Mashpee River had an average DBH of 25.88 cm, the largest
average of all the sites. The youngest bog which had trees which were big enough to measure
DBH was Zeke’s Way, which had been discontinued for roughly 80 years. Flax II bog had 28
small saplings which were not even tall enough to measure, and Lower Bog had 7 saplings.
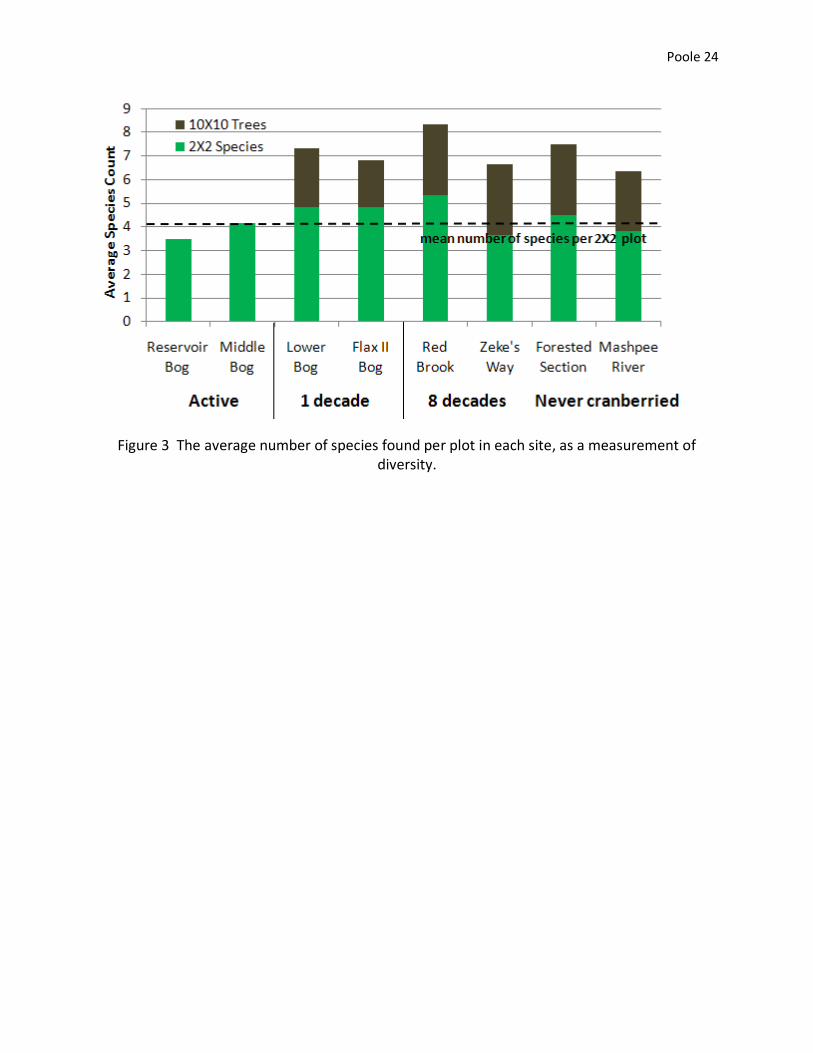
Although the average number of species per 2X2 meter plot remains somewhat constant in all
the sites, once the sites are old enough to have saplings or tree species, the number of species
in each overall plot is much higher (Figure 3). Reservoir Bog has an average species count of 3.5
species, and Red Brook has the highest average species count of 8.3 species. The number of
tree species found also grows from the 1 decade old site pair to the 8 decade old pair, and then
Poole 8
falls again. The site with the greatest overall species count is Red Brook, and the site with the
lowest species count is Reservoir Bog.
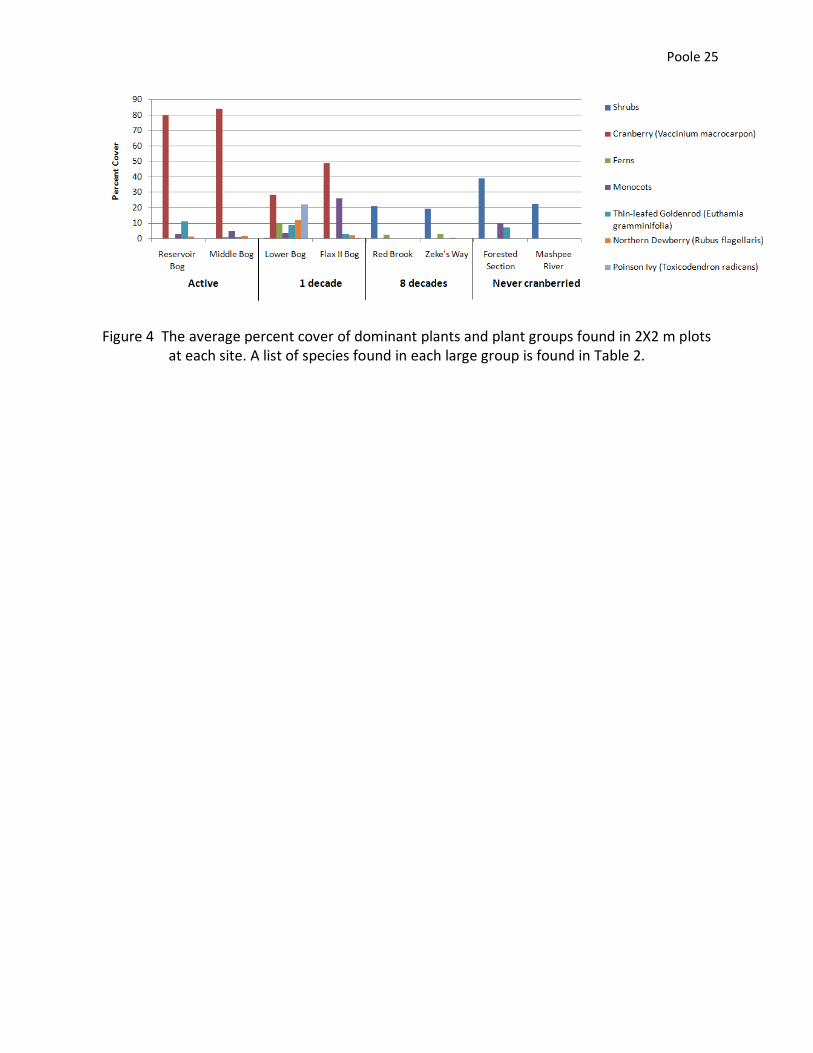
When looking at the herbaceous plant composition as measured by the 2X2 meter plots, there
is also a clear pattern of change over time (Figure 4, Table 2). The overall percent cover of the
dominant species and species groups falls from the active to the natural sites. Lower Bog has
the highest number of dominant species and species groups present in one site. As the percent
cover of cranberries (Vaccinium macrocarpon) falls from the active bogs to the 1 decade old
bogs, also many other species begin to appear, such as Northern Dewberry (Rubus flagellaris),
various monocots, and Poison Ivy (Toxicodendron radicans). Shrubs begin to appear. In the 8
decade old sites shrubs are the most dominant plant type, with ferns coming in second. In the
older sites, shrubs remain the most dominant plant by percent cover in the 2X2 plots, even in
the never cranberried sites (Forested Section and Mashpee River).
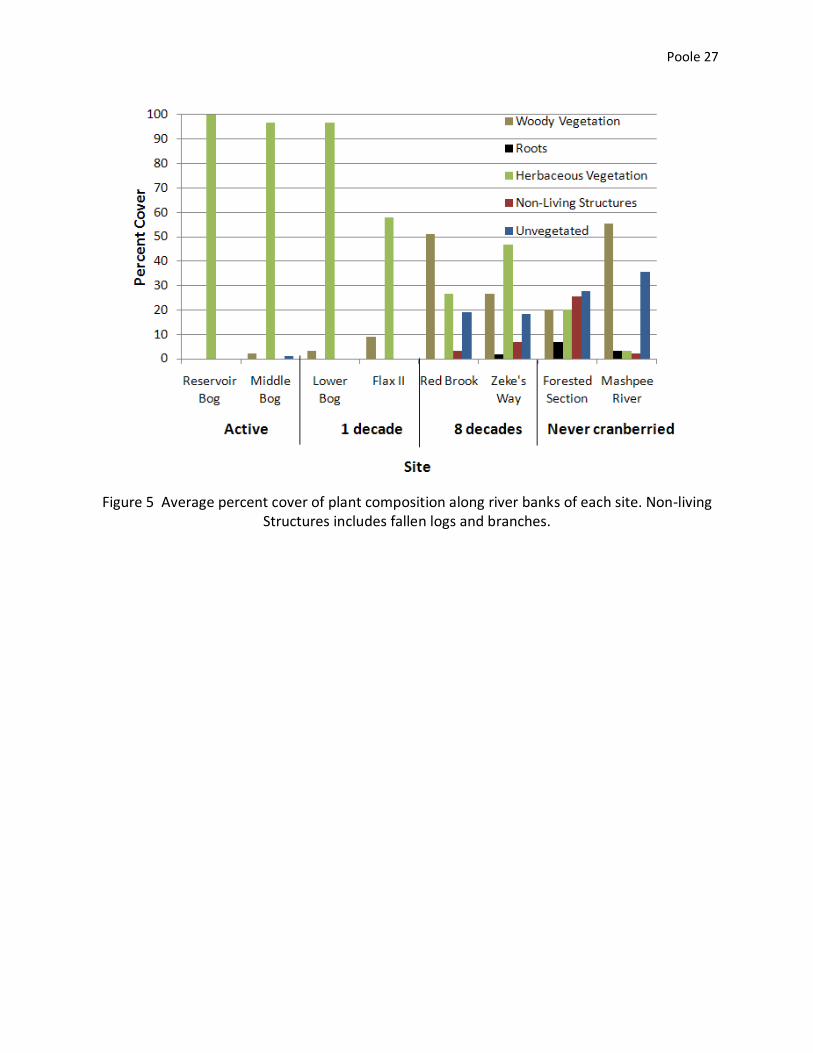
The plant composition of the river banks has very clear trends between the sites (Figure 5). The
active cranberry bogs have 100% and 96.7% herbaceous plant cover along the rivers in
Reservoir Bog and Middle Bog, respectively. The percent of the bank which is covered with
woody vegetation begins to grow in the 1 decade and 8 decade bogs. By 8 decades, it covers
more than 50% of the bank in Red Brook. As woody vegetation grows and herbaceous
vegetation shrinks, the percent cover of roots, non-living structures and un-vegetated areas
also grows.
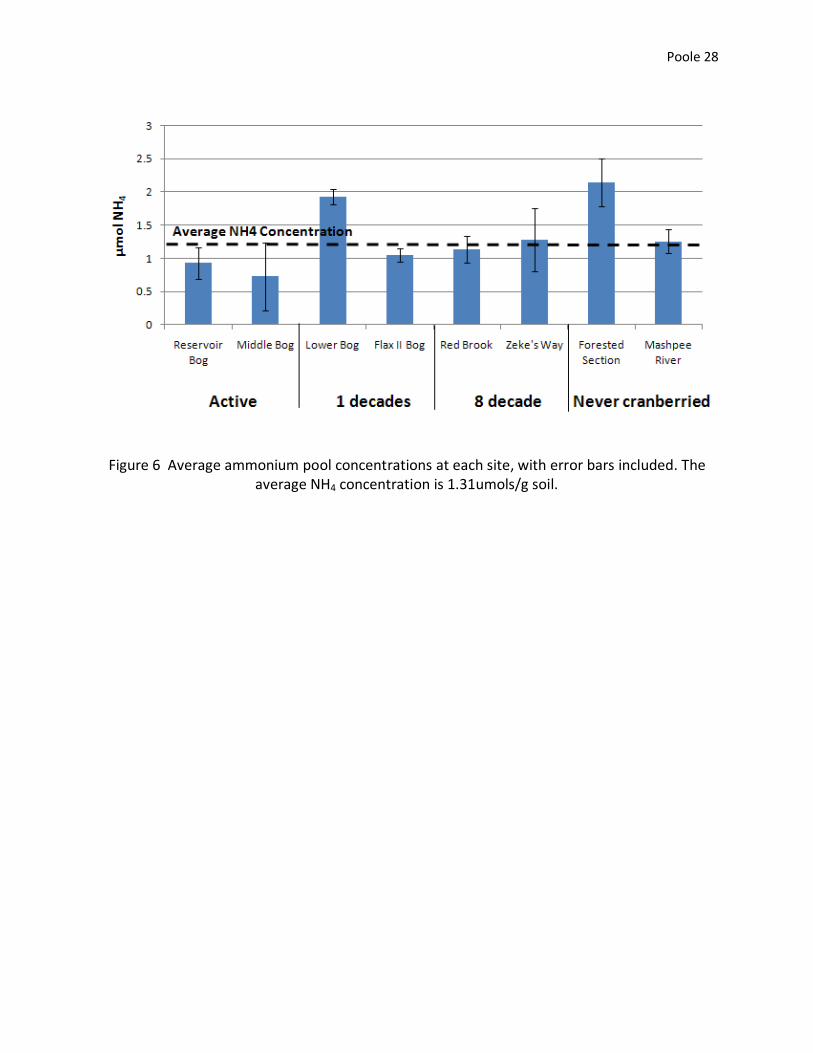
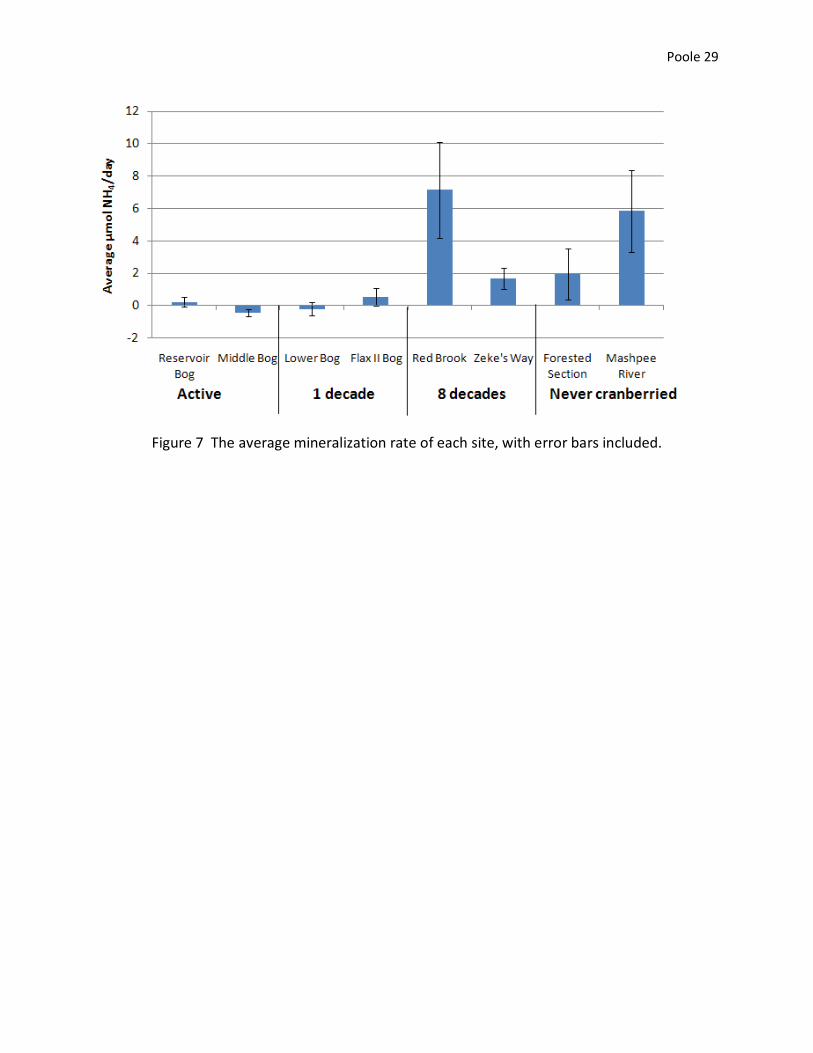
Soils -- The ammonium pools at all sites were fairly similar, having an average of 1.31 µmols of
NH4 (Figure 6). Excepting the mineralization rates at Red Book (7.14 µmol/day NH4), there is a
Poole 9
positive correlation between site ages and mineralization rates I observed (Figure 7).
Mineralization rates were highest in the Red Brook, followed by the pristine river site, Mashpee
River (5.84 µmol/day NH4).
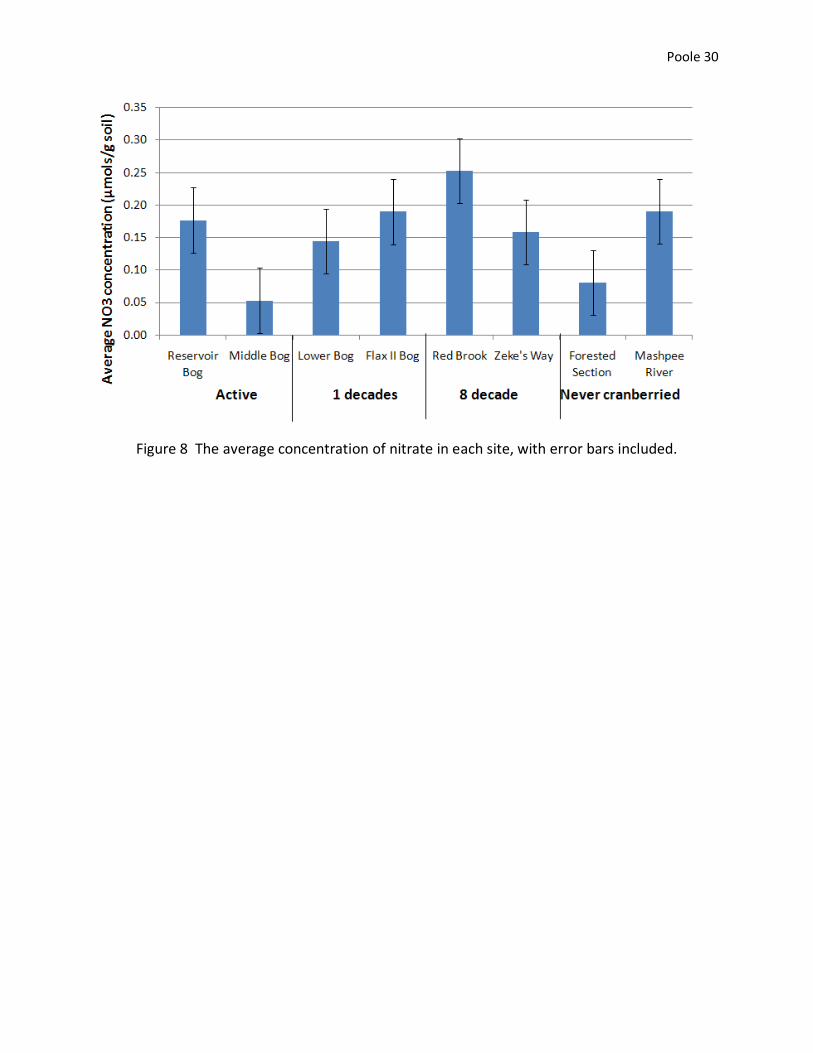
The pools of nitrate were also all relatively similar, excepting Middle Bog and the Forested
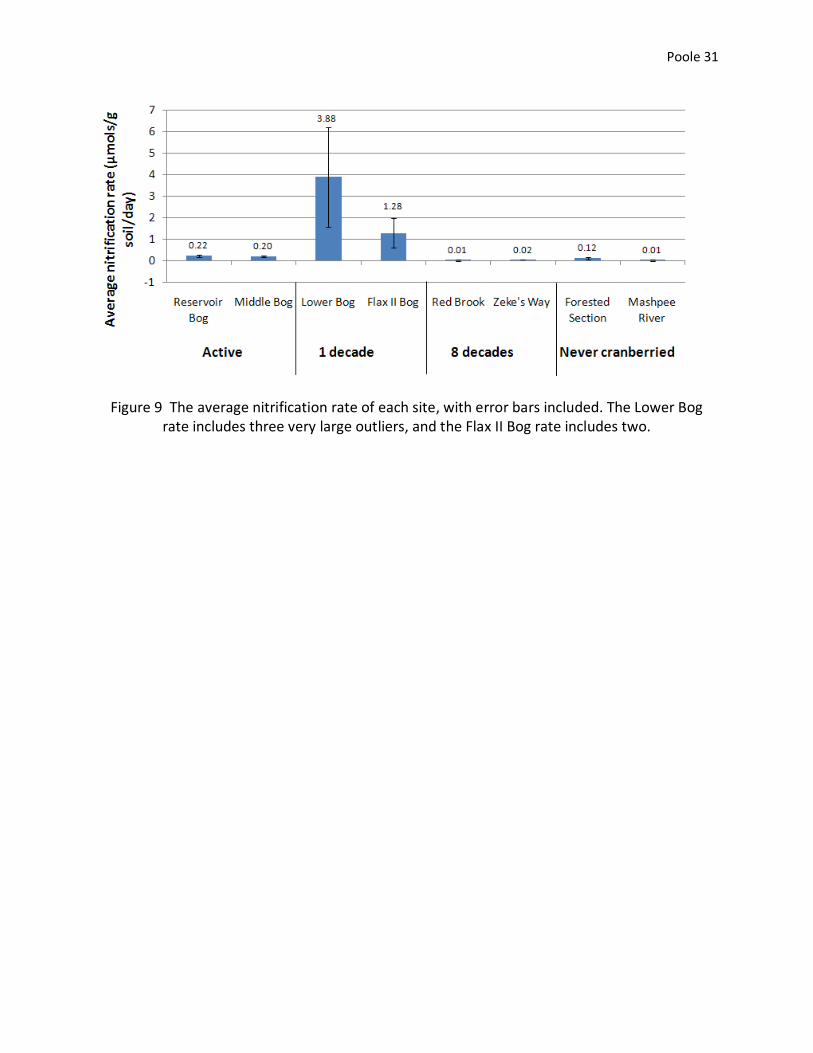
Section (0.05 µmols and 0.08µmols of NO3, respectively, Figure 8). Nitrification rates were also
similar, excluding Lower Bog and Flax II bog, which have 3.88 µmols and 1.28µmols of NO3,
respectively, compared to the average of the other 6 sites, which comes out to be 0.10 µmols
(Figure 9). After incubation of the soils, these two sites had two replications with
concentrations of nitrate one or two orders of magnitude greater than the other replications,
which caused high overall nitrification rate averages for the whole site.
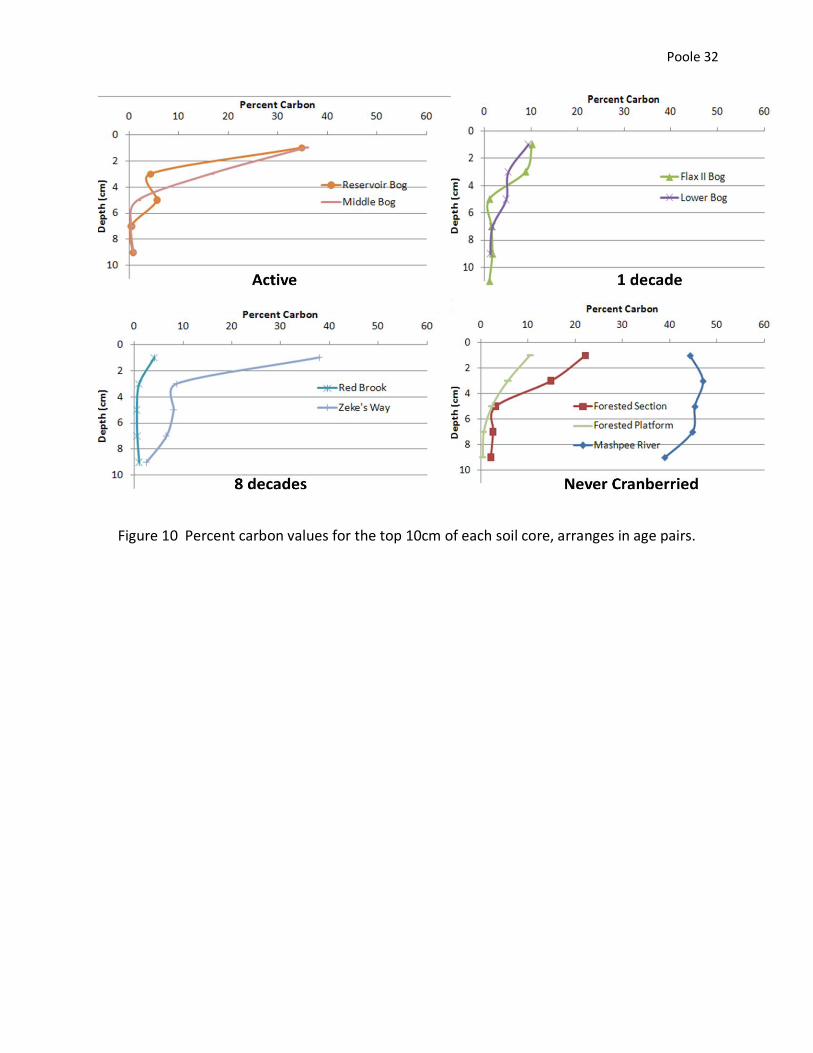
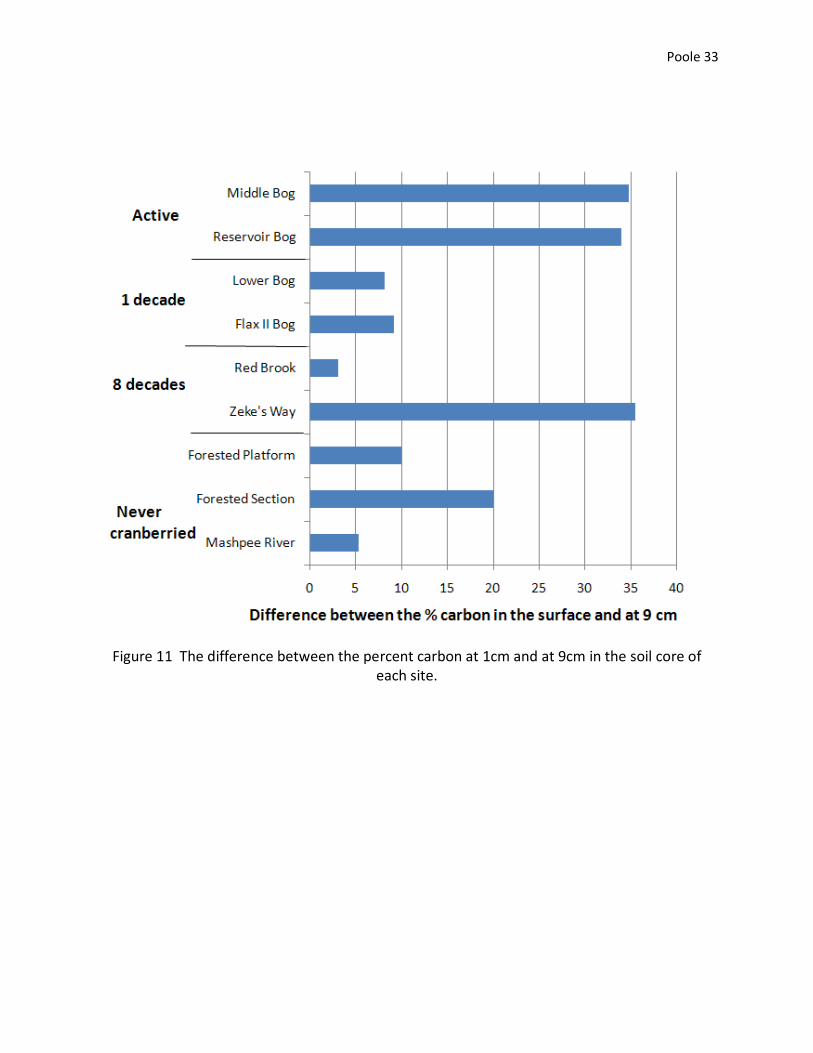
Most of the soil profiles showed higher percentages of carbon towards the top, which
experienced a sharp decline from 3-7 cm (Figure 10, 11). The active cranberry bogs both change
from about 35% carbon at 1 cm to about 0.8% carbon at 9 cm, a difference of about 34. The
other two sites which show the greatest change from the surface to 9cm are Zeke’s Way and
the Forested Section. There is a weak correlation (ignoring Zeke’s Way and the Forested
Section) of less change in percent carbon in older sites. The two profiles for the 8 decade old
bogs are very different from each other, Zeke’s Way having a very large difference between top
and bottom, similar to the active bogs, and Red Brook having a much smaller difference, similar
to the 1 decade old bogs (Figure 10). In the never cranberried set, the two cores from the
Forested Section are similar to the active bogs, with a sharp drop in percent carbon at 5cm,
while the Mashpee River core looks nothing like any of the other cores, beginning with the
Poole 10
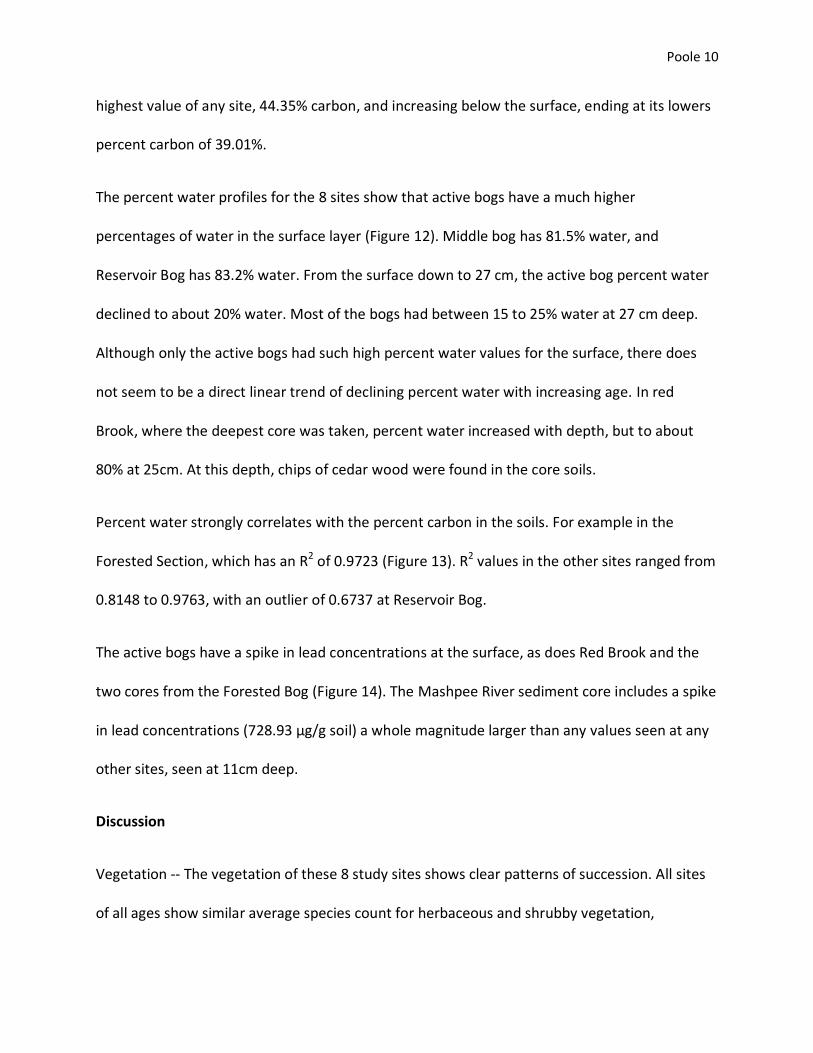
highest value of any site, 44.35% carbon, and increasing below the surface, ending at its lowers
percent carbon of 39.01%.
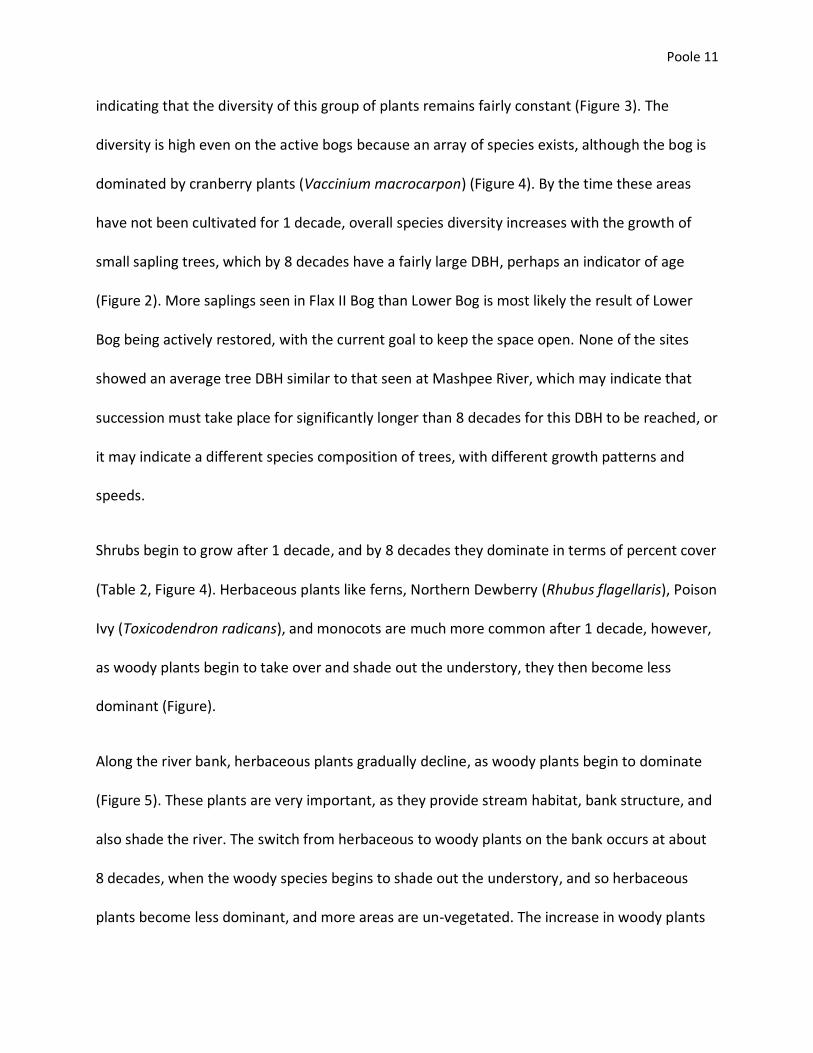
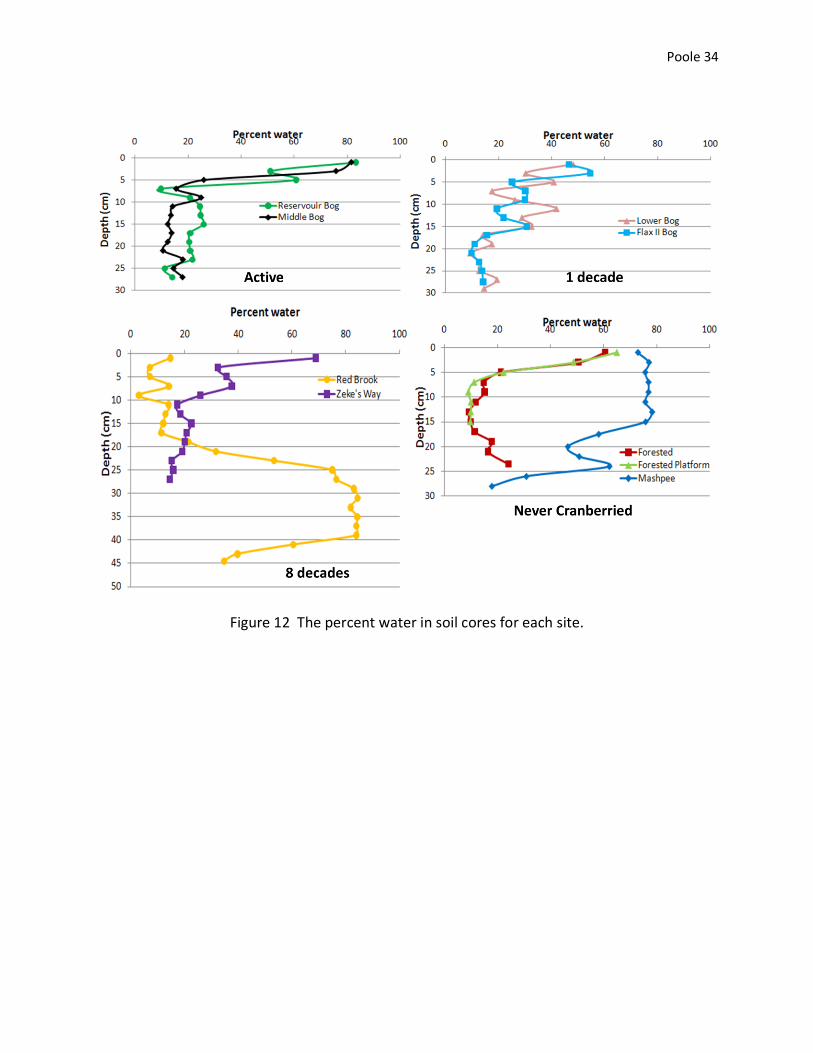
The percent water profiles for the 8 sites show that active bogs have a much higher
percentages of water in the surface layer (Figure 12). Middle bog has 81.5% water, and
Reservoir Bog has 83.2% water. From the surface down to 27 cm, the active bog percent water
declined to about 20% water. Most of the bogs had between 15 to 25% water at 27 cm deep.
Although only the active bogs had such high percent water values for the surface, there does
not seem to be a direct linear trend of declining percent water with increasing age. In red
Brook, where the deepest core was taken, percent water increased with depth, but to about
80% at 25cm. At this depth, chips of cedar wood were found in the core soils.
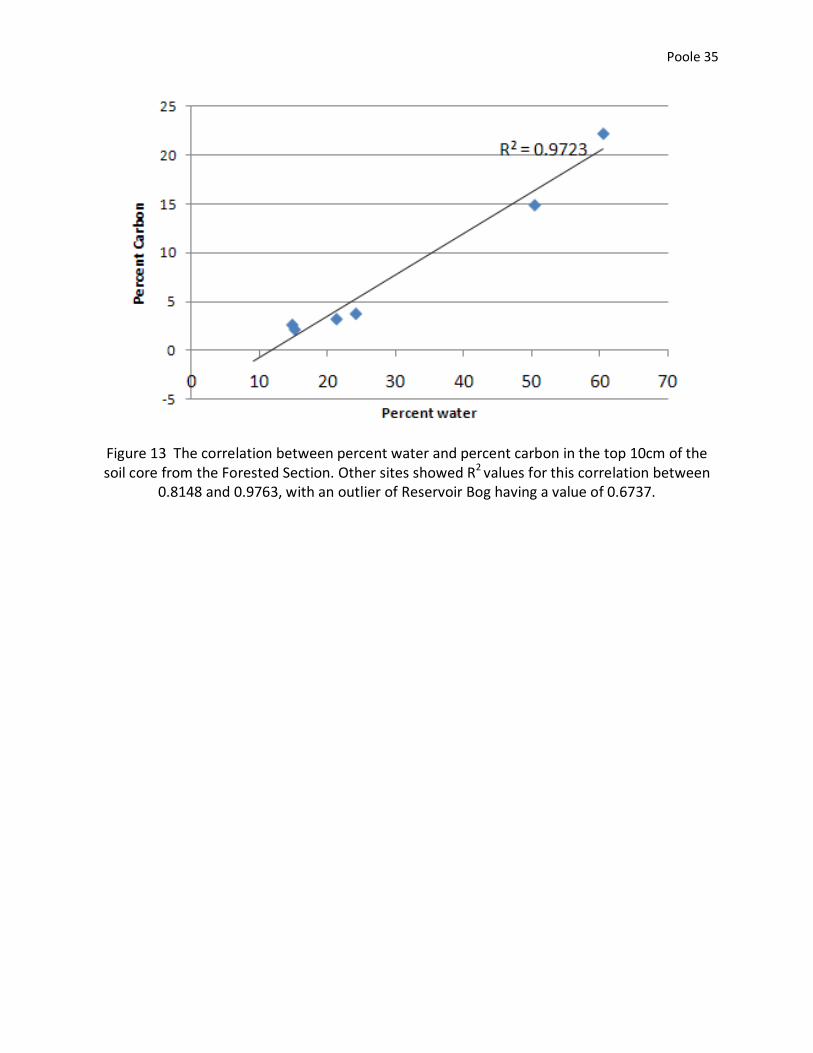
Percent water strongly correlates with the percent carbon in the soils. For example in the
Forested Section, which has an R2 of 0.9723 (Figure 13). R2 values in the other sites ranged from
0.8148 to 0.9763, with an outlier of 0.6737 at Reservoir Bog.
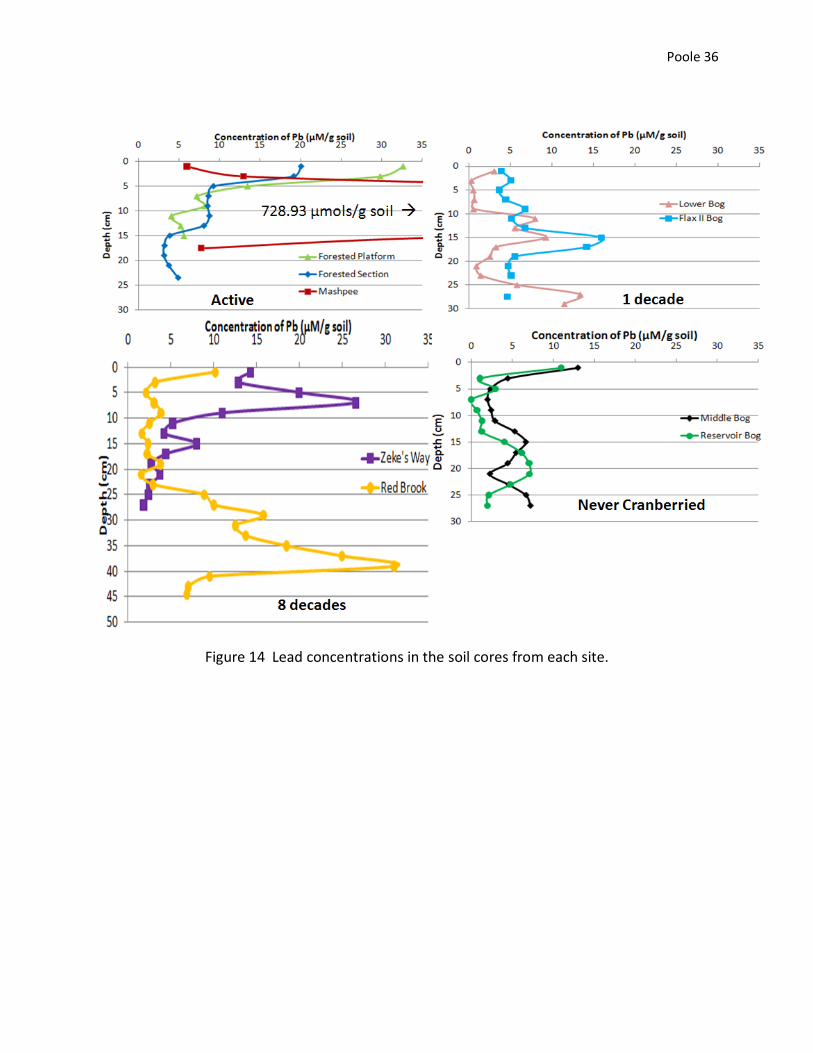
The active bogs have a spike in lead concentrations at the surface, as does Red Brook and the
two cores from the Forested Bog (Figure 14). The Mashpee River sediment core includes a spike
in lead concentrations (728.93 µg/g soil) a whole magnitude larger than any values seen at any
other sites, seen at 11cm deep.
Discussion
Vegetation -- The vegetation of these 8 study sites shows clear patterns of succession. All sites
of all ages show similar average species count for herbaceous and shrubby vegetation,
Poole 11
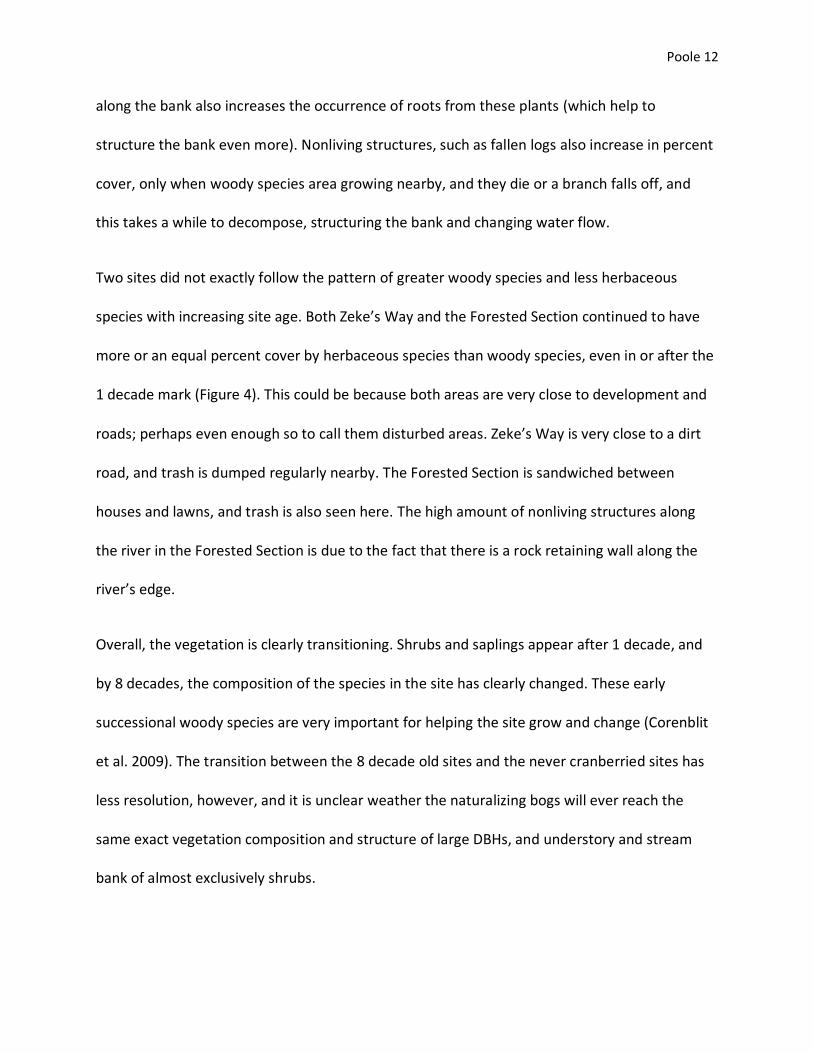
indicating that the diversity of this group of plants remains fairly constant (Figure 3). The
diversity is high even on the active bogs because an array of species exists, although the bog is
dominated by cranberry plants (Vaccinium macrocarpon) (Figure 4). By the time these areas
have not been cultivated for 1 decade, overall species diversity increases with the growth of
small sapling trees, which by 8 decades have a fairly large DBH, perhaps an indicator of age
(Figure 2). More saplings seen in Flax II Bog than Lower Bog is most likely the result of Lower
Bog being actively restored, with the current goal to keep the space open. None of the sites
showed an average tree DBH similar to that seen at Mashpee River, which may indicate that
succession must take place for significantly longer than 8 decades for this DBH to be reached, or
it may indicate a different species composition of trees, with different growth patterns and
speeds.
Shrubs begin to grow after 1 decade, and by 8 decades they dominate in terms of percent cover
(Table 2, Figure 4). Herbaceous plants like ferns, Northern Dewberry (Rhubus flagellaris), Poison
Ivy (Toxicodendron radicans), and monocots are much more common after 1 decade, however,
as woody plants begin to take over and shade out the understory, they then become less
dominant (Figure).
Along the river bank, herbaceous plants gradually decline, as woody plants begin to dominate
(Figure 5). These plants are very important, as they provide stream habitat, bank structure, and
also shade the river. The switch from herbaceous to woody plants on the bank occurs at about
8 decades, when the woody species begins to shade out the understory, and so herbaceous
plants become less dominant, and more areas are un-vegetated. The increase in woody plants
Poole 12
along the bank also increases the occurrence of roots from these plants (which help to
structure the bank even more). Nonliving structures, such as fallen logs also increase in percent
cover, only when woody species area growing nearby, and they die or a branch falls off, and
this takes a while to decompose, structuring the bank and changing water flow.
Two sites did not exactly follow the pattern of greater woody species and less herbaceous
species with increasing site age. Both Zeke’s Way and the Forested Section continued to have
more or an equal percent cover by herbaceous species than woody species, even in or after the
1 decade mark (Figure 4). This could be because both areas are very close to development and
roads; perhaps even enough so to call them disturbed areas. Zeke’s Way is very close to a dirt
road, and trash is dumped regularly nearby. The Forested Section is sandwiched between
houses and lawns, and trash is also seen here. The high amount of nonliving structures along
the river in the Forested Section is due to the fact that there is a rock retaining wall along the
river’s edge.
Overall, the vegetation is clearly transitioning. Shrubs and saplings appear after 1 decade, and
by 8 decades, the composition of the species in the site has clearly changed. These early
successional woody species are very important for helping the site grow and change (Corenblit
et al. 2009). The transition between the 8 decade old sites and the never cranberried sites has
less resolution, however, and it is unclear weather the naturalizing bogs will ever reach the
same exact vegetation composition and structure of large DBHs, and understory and stream
bank of almost exclusively shrubs.

Poole 13
Soils – The succession of soils in these sites is harder to see, perhaps because the soils change
on a longer timescale than the 4 time points my study used. All the sites showed similar size
ammonium pools, however, because there was slightly higher mineralization rates in older
sites, this means that the uptake by plants is also greater with age (or larger pools would build
up, Figure 6, 7). This makes sense because these sites have higher diversity and therefore
greater use of resources (Tilman, Wedin and Knops, 1996). The negative mineralization rates seen
in the active and 1 decade old bogs may indicate immobilization by microbes is taking place, or,
because at Lower Bog the error bar overlaps the x-axis, it could also indicate a very small
mineralization rate and poor resolution based on the method used to measure it. The two
largest mineralization rates are seen in the two least-disturbed sites, which may indicate that
not only age, but closeness to development, may have an effect on the nutrient cycling in
naturalizing bogs. If the two remaining sites for 8 decades and never cranberried were not in
developed areas, they might have shown higher mineralization (and therefore uptake) rates.
The nitrate pool size in each site was very close to each other, and showed no significant
differences between the sites based on age (Figure 8). The nitrification rates were all also very
close, not including the large outliers of Lower Bog and Flax II Bog (Figure 9). These sites were
thrown off by two samples from Flax II, and three samples from Lower Bog which had
extremely large nitrate values after incubation. If these outliers are excluded, nitrification rates
for all sites are very similar. Once again, however, Red Brook and the Mashpee River sites are
very similar, and have the lowest nitrification rates, at 0.01 µmoles/g soil/day. This may be an
indication of lower nitrification rates with increased naturalization and decreased disturbance,
but the trend is very small.
Poole 14
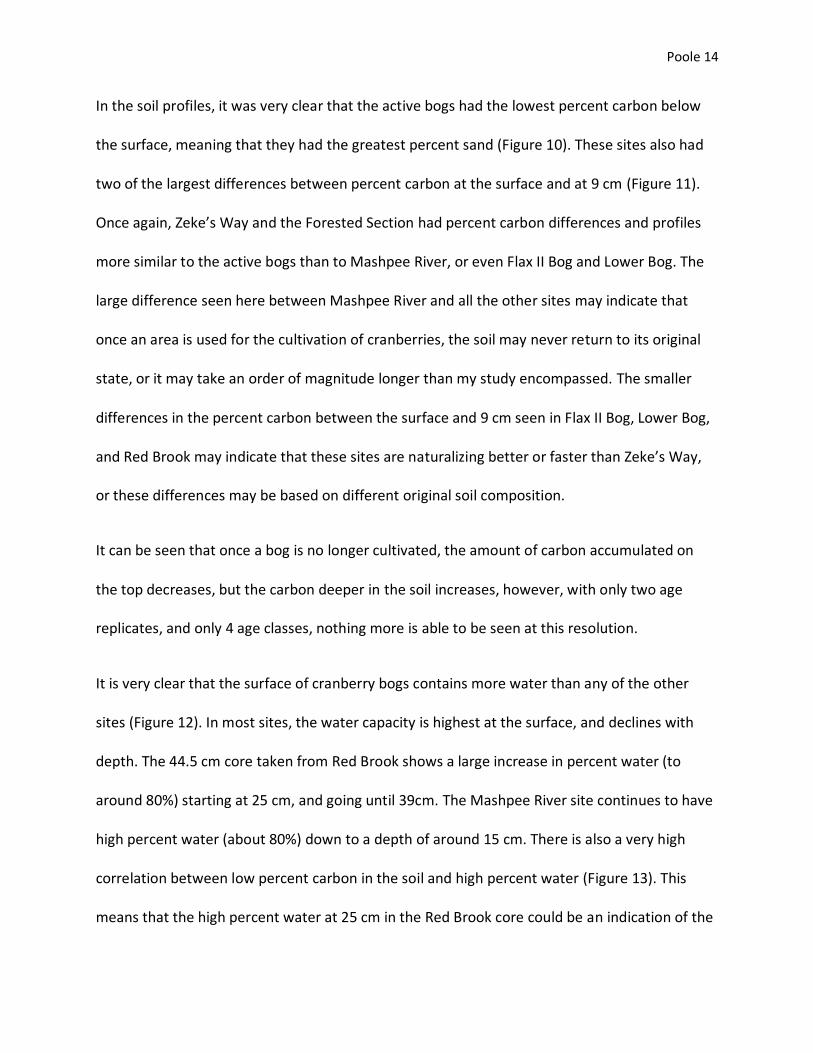
In the soil profiles, it was very clear that the active bogs had the lowest percent carbon below
the surface, meaning that they had the greatest percent sand (Figure 10). These sites also had
two of the largest differences between percent carbon at the surface and at 9 cm (Figure 11).
Once again, Zeke’s Way and the Forested Section had percent carbon differences and profiles
more similar to the active bogs than to Mashpee River, or even Flax II Bog and Lower Bog. The
large difference seen here between Mashpee River and all the other sites may indicate that
once an area is used for the cultivation of cranberries, the soil may never return to its original
state, or it may take an order of magnitude longer than my study encompassed. The smaller
differences in the percent carbon between the surface and 9 cm seen in Flax II Bog, Lower Bog,
and Red Brook may indicate that these sites are naturalizing better or faster than Zeke’s Way,
or these differences may be based on different original soil composition.
It can be seen that once a bog is no longer cultivated, the amount of carbon accumulated on
the top decreases, but the carbon deeper in the soil increases, however, with only two age
replicates, and only 4 age classes, nothing more is able to be seen at this resolution.
It is very clear that the surface of cranberry bogs contains more water than any of the other
sites (Figure 12). In most sites, the water capacity is highest at the surface, and declines with
depth. The 44.5 cm core taken from Red Brook shows a large increase in percent water (to
around 80%) starting at 25 cm, and going until 39cm. The Mashpee River site continues to have
high percent water (about 80%) down to a depth of around 15 cm. There is also a very high
correlation between low percent carbon in the soil and high percent water (Figure 13). This
means that the high percent water at 25 cm in the Red Brook core could be an indication of the
Poole 15
old sandy cranberry bog platform from about 8 decades ago. However, the soil at Mashpee
River had very high percent carbon values as well as high percent water values, and therefore
correlation between low percent carbon and high percent water does not necessarily imply
causation – high percent water doesn’t necessarily mean the soil is very sandy. Keeping this in
mind, and seeing that Mashpee River had high carbon and high water values, the section of the
red Brook core with high percent water may be an indication of the original soil before the area
was cultivated. The fact that cedar wood chips were found in this area indicates that the core
goes down to a depth from when the land was cleared. This supports both ideas –the large
percent water could be an indication of the original soil (Like Mashpee), or the cranberry bog
the was cultivated there after clearing (Like the active bogs).
The lead profiles taken from each site show very little patterns (Figure 14). The Mashpee River
site has a very large spike in lead, which may have been caused by lead shot from hunting in the
area. The higher percent lead seen at the surface of the cores may be more of an indication of
the percent carbon than the concentration of lead, as it is very difficult to get a consistent lead
profile from sandy soil – and all of the sites except for Mashpee River have very sandy soils(Van
Benschoten, 1994).
Conclusion
The vegetation of these sites is clearly undergoing succession. Active bogs, once discontinued,
transition to an environment shared more equally between several important species within
the 1st decade of naturalization. In this time, the species diversity goes up dramatically as trees
begin to grow. By 8 decades, although the species diversity remains similar, the site displays
Poole 16
fewer species that are very dominant. The shrub becomes a very dominant plant at this time.
The DBH of trees is large enough to be measured. Herbaceous vegetation along the river bank
begins to decline with increasing percent cover by woody species, and more areas are un-
vegetated, or covered with roots or nonliving structures, such as fallen logs.
The main transition period for the vegetation of cranberry bog riparian environments seems to
be at around 8 decades, although the early successional woody species that move in quickly are
very important, especially in preparing the area to change and grow.
Patterns in the succession of soils are much harder to see. There may be a trend of increasing
mineralization and pant uptake in older site, beginning around 8 decades. Smaller differences
between the percent carbon at the surface and at 9 cm seems to indicate a change since
cultivation, however, these changes of increased carbon and decreased sand content occur
very slowly, and there is hardly any difference between the active bogs and the 8 decade old
bogs. Even the Forested Section, which was never cranberried, shows a similar profile to the
active bogs. The percent water at the surface also may indicate the age of a site, however, rates
of change are hard to tell with only four time-points and two age replicates.
It is important to keep these two rates and patterns in mind when organizations restore
cranberry bogs. Vegetation changes and grows much more quickly than soil accretion can take
place and the structure can change. Some aspects of cranberry cultivation may never be
reversible, and the soil may never have the same content as the Mashpee River, but as plants
grow, they also change their own environment, leading to further succession both in the
riparian terrestrial area, and also in the river itself.
Poole 17
In the future it would be very interesting to do a similar study, but with many more time-points
and age replicates. The sites of Zeke’s Way and the Forested Section throughout my study
constantly showed data more similar to the active bogs than to any of the other sites, especially
Mashpee. Red Brook and Mashpee River sites both acted more similar to each other than to
their own age pairs of Zeke’s Way and the Forested Section. These two sets of two sites which
acted similar to each other may have been caused by the closeness of Zeke’s Way and the
Forested Section to development, and the relative isolation of Red Brook and Mashpee River. I
only had two age replicates, so when this happened, strong trends were hard to see. It would
be very helpful in future studies to choose more similar age pairs or have more age replicates.
The succession of plants in naturalizing cranberry bogs takes place at a rate that is recognizable
at about 1 decade increments, while it seems that changes in soil properties take at least 8
decades, but most likely much longer. In my study, the jump from 8 decades of naturalization to
never cultivated was very large, and it would be interesting to have more ages in between, to
see more resolution in the rates and patterns of vegetation, but especially soil succession.
Acknowledgements
I would like to thank Dr. Linda Deegan for her wonderful guidance and encouragement. I would
also like to thank Holly Engel, my great field partner, and Will Daniels and Stef Strebel for all
their help in the lab. Thank you to Pam Polloni for her botanical expertise, I had lots of fun
seeing the WHOI Herbarium and going out onto the bogs with you! Thank you so much to Rich
McHorney for his great wealth of knowledge. I really wouldn’t have been able to do the project
without him. Thank you also to Rio, for being cute and cuddly, and for the entire SES staff for

Poole 18
their inspiration and support. Thank you to all the SES students – I learned so much from every
single one of you this semester.
Poole 19
Literature Cited
Corenblit, Dov, Johannes Steiger, Angela M. Gurnell and Robert J. Naiman. 2009. Plants intertwine fluvial
landform dynamics with ecological succession and natural selection: a niche construction
perspective form riparian systems. Global Ecology and Biogeography. 18:507-520.
Foreman, K. 2010. Ammonium Protocol. Semester in Environmental Science Methods
Handbook. Marine Biological Laboratory.
Foreman, K. 2010. KCL Extraction of Soils for N Mineralization. Semester in Environmental
Science Methods Handbook. Marine Biological Laboratory.
Foreman, K. 2010. Preparing, Packing & Organizing CHN Samples. Semester in Environmental
Science Methods Handbook. Marine Biological Laboratory.
Krement, Claire. 2005. Managing ecosystem services: what do we need to know about their ecology?
Ecology Letters, 8:468-479.
Lawton, John H. 1994. What Do Species Do in Ecosystems? Okios. Vol. &1:367-374.
Mason, Carol Y. 1926. The Cranberry Industry in Massachusetts. Economic Geography. Vol. 2;159 - 69.
Neil, C. 2006. Coonamessett River Trust Newsletter. Coonamessett River Trust.
Neill, C. 2010. SES Terrestrial Laboratory, Week 5 & 6, 2010: Terrestrial Ecosystem Carbon and
Nitrogen Cycles. Semester in Environmental Science Lab. Semester in Environmental
Science Lab Handbook. Marine Biological Laboratory.
Pitcher, Tony J. 2001. Fisheries Managed to Rebuild Ecosystems? Reconstructing the Past to Salvage the
Future. Ecological Applications, Ecological Society of America, Vol. 11:2, 601 – 617.
Polloni, Pam and Donald Schall. Botanical Club of Cape Cod and the Islands Newsletter, March 2007 to
February 2008. BCCCI. Vol. 8, 1:5.
Shaver, Gus. 2010. SES Terrestrial Laboratory, Week 1, 2010: Biomass of Terrestrial Ecosystems.
Semester in Environmental Science Lab. Semester in Environmental Science Lab
Handbook. Marine Biological Laboratory.
Solarzano, L. 1969. Determinization of ammonium in natural waters by phenol hypochlorite
method. Limnol. Oceanogr., 14:799-800.
Strickland, J.D.H. and T.R. Parsons. 1972. A practical handbook of seawater Analysis. Ottawa,
Fisheries Research Board of Canada 2nd Ed.

Poole 20
Tilman, D., Wedin, D. & Knops, J. 1996. Productivity and sustainability influenced by biodiversity in
grassland ecosystems. Nature 379, 718-720.
Van Benschoten, John E. Brian E. Reed, Mark R. Matsumoto and P.J. McGarvey. 1994. Metal Removal by
Soil Washing for an Iron Oxide Coated Sandy Soil. Water Environment Research. Vol. 66, 2:168-
174.
Wood, E.D., F.A.G. Armstrong, and F.A. Richards. 1967. Determination of nitrate by cadmuun-
reduction to nitrate. J.Mar. Biol Assoc. U.K. 47:23.
Woods Hole Group. Environmental Management of the Coonamessett River and Preservation of its
Legacy of Cranberry Farming.
Zinovjev, Alexey, and Irina Kadis. 2008. European rusty willow S. atrocinera in eastern Massachusetts.
Saliciola.com
Poole 21
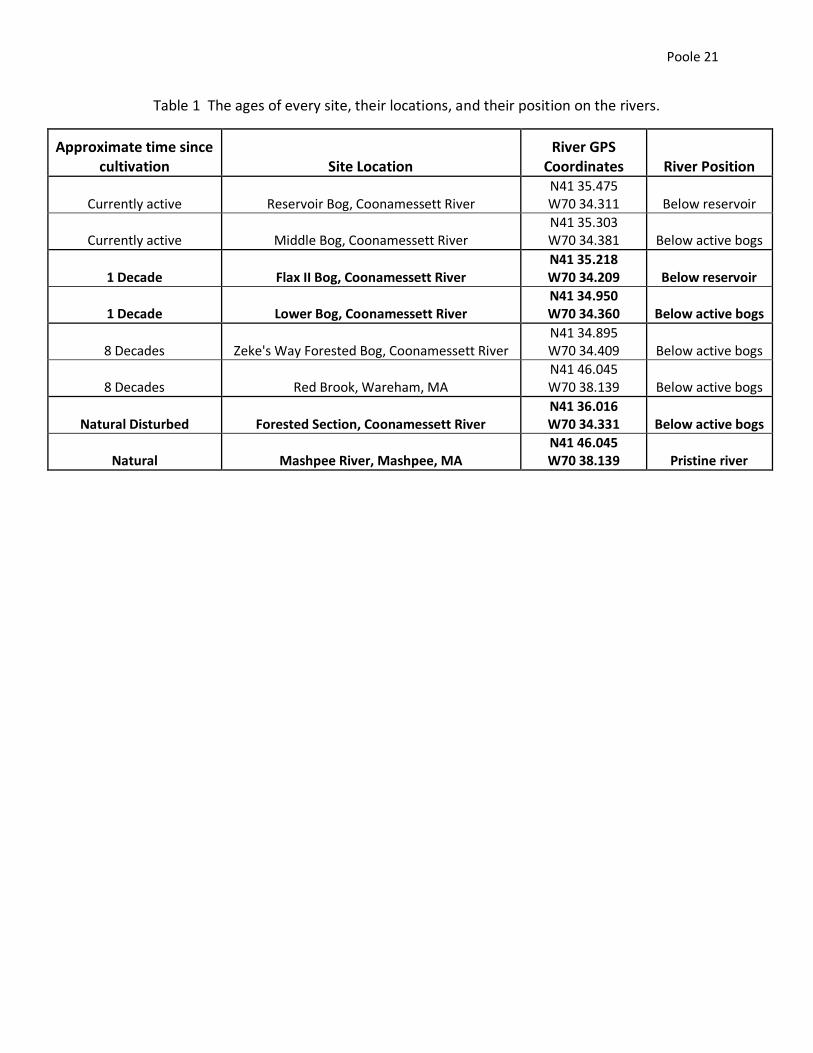
Table 1 The ages of every site, their locations, and their position on the rivers.
Approximate time since cultivation Site Location
River GPS Coordinates River Position
Currently active Reservoir Bog, Coonamessett River N41 35.475 W70 34.311 Below reservoir
Currently active Middle Bog, Coonamessett River N41 35.303 W70 34.381 Below active bogs
1 Decade Flax II Bog, Coonamessett River N41 35.218 W70 34.209 Below reservoir
1 Decade Lower Bog, Coonamessett River N41 34.950 W70 34.360 Below active bogs
8 Decades Zeke's Way Forested Bog, Coonamessett River N41 34.895 W70 34.409 Below active bogs
8 Decades Red Brook, Wareham, MA N41 46.045 W70 38.139 Below active bogs
Natural Disturbed Forested Section, Coonamessett River N41 36.016 W70 34.331 Below active bogs
Natural Mashpee River, Mashpee, MA N41 46.045 W70 38.139 Pristine river
Poole 22
Figure 1 A map of site locations on the Lower Cape.
Poole 23
Figure 2 The average diameter at breast height (DBH) of the trees larger than 3 cm from each site. Error bars are included. The 1 decade old set had trees, but none big enough to measure.
Poole 24
Figure 3 The average number of species found per plot in each site, as a measurement of diversity.
Poole 25
Figure 4 The average percent cover of dominant plants and plant groups found in 2X2 m plots at each site. A list of species found in each large group is found in Table 2.

Poole 26
Table 2 The species included in each dominant plant group found in Figure 4.
Common name Scientific name
Shrub Highbush Blueberry Vaccinium corymbosum
Sweet Pepper Bush Clethra alnifolia
Inkberry Ilex glabra
Swamp Azalea Rhododendron kaempferi
Witch Hazel Hamamelis virginiana
Eastern Teaberry Gaultheria procumbens
Maleberry Lyonia ligustrina
Arrowwood Viburnum dentatum
Ferns Brackenfern Pteridum aquilinum
Sensitive Fern Onoclea sensibis
Marsh Fern Thelypteris palustris
Monocots Soft Rush Juncus effusus
Sallow Sedge Carex lurida
Wool-grass Scirpus cyperinus
Common Grasses
Poole 27
Figure 5 Average percent cover of plant composition along river banks of each site. Non-living Structures includes fallen logs and branches.
Poole 28
Figure 6 Average ammonium pool concentrations at each site, with error bars included. The average NH4 concentration is 1.31umols/g soil.
Poole 29
Figure 7 The average mineralization rate of each site, with error bars included.
Poole 30
Figure 8 The average concentration of nitrate in each site, with error bars included.
Poole 31
Figure 9 The average nitrification rate of each site, with error bars included. The Lower Bog rate includes three very large outliers, and the Flax II Bog rate includes two.
Poole 32
Figure 10 Percent carbon values for the top 10cm of each soil core, arranges in age pairs.
Poole 33
Figure 11 The difference between the percent carbon at 1cm and at 9cm in the soil core of each site.
Poole 34
Figure 12 The percent water in soil cores for each site.
Poole 35
Figure 13 The correlation between percent water and percent carbon in the top 10cm of the soil core from the Forested Section. Other sites showed R2 values for this correlation between
0.8148 and 0.9763, with an outlier of Reservoir Bog having a value of 0.6737.
Poole 36
Figure 14 Lead concentrations in the soil cores from each site.