Embed Size (px)
Citation preview
PLASTIC DEFORMATION OF FOIL COPPER CRYSTALS-II
ELECTRON MICROSCOPICAL STUDY *
K. SUMINOtf, Y. KAWASAKI:, M. YAMAMOTOt and M. P. SUMINO§
In order to study the relation between work-hardening characteristics of 10.0 and 50.8 p copper foil crystals and dislocation phenomena occurring in them, the distribution patterns of residual dislocations in the crystals have been observed as a function of strain, orientation, and specimen thickness.
Dislocation tangles were found at an early stage in the deformation of a specimen that showed the lowest value of the work-hardening rate. Tangles developing only along one kind of slip planes were observed in specimens showing low work-hardening rates. On the other hand, in specimens with high hardening rates, the development of cell structure is found without exception. The structures of the cell boundaries become more complex and, at the same time, the sizes of cells decrease as the strain increases. Configurations which are thought to show the formation of sessile dislocations, and pile-ups against them were also observed.
It is suggested that the cell structure is formed because of irregular and complex motions of disloca- tions determined by the complex internal stress fields originating from dislocations accumulated during deformation.
DEFORMATION PLASTIQUE DE CRISTAUX DE CUIVRE PELLICULAIRES-II
ETUDE EN MICROSCOPIE ELECTRONIQUE
Dans le but d’&udier les relations entre les caractkristiques de consolidation des cristaux pelliculaires de cuivre de 10.0 et 50.8 p et les dbplacements des dislocations, les auteurs ont observe la distribution des dislocations r&iduelles dans ces cristaux en fonction de la dbformation, de I’orientation et de 1’8paisseur de 1’6chantillon.
Des 6cheveaux de dislocations ont &B observes tout au debut de la deformation dans un Bchantillon montrant unet&s faible taux de consolidation. Des Qcheveaux se dbveloppant uniquement le long d’une seule catbgorie de plans de glissement ont 8tB observes dans des Qchantillons montrant des taux de consolidation peu 81evBs. D’autre part, dans des Bchantillons p&sentant des taux de consolidat,ion Blev&, on trouve sans exception une structure cellulaire. La structure des limites de cellules devient plus complexe quand la deformation augmente, et simultanbment. la dimension des cellules diminue. Les auteurs ont observe des configurations qui sont vraisemblablement libes B la formation de dislocations sessiles, ainsi qua des empilements contre ces configurations.
Les auteurs suggirrent que la structure cellulaire se forme B la suite de mouvements irrbguliers et complexes de dislocations, mouvements d&ermin& par les champs de contraintes internes complexes provoqu& par les accumulations de dislocations qui se produisent pendant la d&formation.
PLASTISCHE VERFORMUNG VON FOLIENFORMIGEN KUPFERKRISTALLEN-‘II
ELEKTRONENMIKROSKOPISCHE UNTERSUCHUNG
Urn die Beziehungen zwischen den Verfestigungseigenschaften van folienfiirmigen Kupferkristallen mit 10.0 fi und 50.8 ,u Dicke und den in ihnen ablaufenden Versetzungsvorgiingen zu studieren, wurcle die Verteilung der Rest,versetzungen in den Kristallen als Funktion von Dehnung, Orientierung und Probendicke beobachtet.
Versetzungskn&uel fanden sich im friihen Stadium der Verformung einer Probe. die den geringsten Wert des Verfestigungsanstieges zeigte. Kniiuel, die sich nur auf einer Schar van Gleitlinien entwickelten, wurden bei Proben mit niedrigem Verfestigungsanstieg beobachtet. Andererseits wird bei Proben mit hohem Verfestigungsanstieg ohne Ausnahme die Entwickhmg einer Zellstruktur gefunden. Mit zuneh- mender Dehnung wird die Struktur der Zellgrenzen komplexer, gleichzeitig nimmt die GrGsse der Zellen ab. Es w&den Konfigurationen beobachtet, die nach unserer Meinung die Bildung van nioht gleitfiihigen Versetzungen zeigen, und ebenso Aufstauungen gegen diese.
Nach unserer Meinung bildet sich die Zellstruktur infolge unregelmiissiger und komplexer Versetzungs- bewegungen, die bestimmt sind durch die komplexen inneren Spannungsfelder, die von den wiihrend der Verformung angesammelten Versetzungen ausgehen.
1. INTRODUCTION
In a foil crystal, an active slip plane has only one
macroscopic dimension, so the motions of dislocations
* Received January 9, 1963; revised April 22, 1963.
IllLo: U.S.A. ow temporarily at,: University of Illinois, Urbana,
$ Tde Research Institute for Iron, Steel and Other Metals, Tohoku University, Sendai, Japan.
5 Department of Applied Science, Faculty of Engineering, Tohoku University, Sendai, Japan.
contributing to its deformation can be regarded as
nearly one-dimensional. This reduces the variety of
dislocations that move and also the kinds of dis-
location interactions. Hence, it becomes easier to
find relations between dislocation interactions and
macroscopic work-hardening characteristics in foils
than in bulk crystals. We previously investigated(l)
t’he plastic properties (especially the work-hardening
behavior) of recrystallized copper foil-crystals having
ACTA METALLURGICA, VOL. 11, NOVEMBER 1963 1235
1236 ACTA METALLURGICA, VOL. 11, 1963
various thicknesses and tension orientations, and ob-
tained fairly clear relations between theoretically ex-
pectable dislocation interactions and work-hardening
characteristics. However, no direct observations were
made of dislocation phenomena occurring in the speci-
mens. Hence, the interpretations given in the previous
paper remain speculative. In the present paper, trans-
mission electron microscopy has been used to observe
distributions of residual dislocations in foils after thin-
ning them by electrolytic polishiI~g. These data
together with those obtained in the previous work are
expected to be useful for revealing the mechanism of
work-hardening in f.c.c. crystals.
2. EXPERIMENTAL PROCEDURE
Tensile specimens were prepared as in I. Thin film
specimens for microscopic examination have been pre-
pared by the Bollman method’2) after various deforma-
tions in an Instron tension instrument. Observations
were made on 10.0 and 50.8 p specimens whose
orientation-dependent plastic properties have been
investigated in detail. Electrolytic polishing was
carried out in 33% nitric acid + 67 “/h methyl alcohol(a)
at 30~4O’C; the voltage and the current density
being 4 N 7 V and 1 - 3 A/cm2, respectively. Elec-
tron microscopy was done initially with a Japan
Electron Optics Laboratory JEM-5, and later with a
Hitachi HU-10 microscope.
It is most important in this work to observe patterns
of residual dislocations developing over large areas,
However, it is rather difficult to prepare suitable thin
film specimens from heavily deformed 50.8 p crystals.
Moreover, not all of the existing dislocations give con-
trast in the microscope. Also, the distribution of dis-
locations is not necessarily uniform throughout a
specimen. Therefore, one must be careful not to draw
an incorrect conclusion from observations of patterns
that exist only locally. By taking as many as 1500
electron mierographs with low magnification (5,000 x ) at an operating voltage of 100 kV, we have tried to
record the most general features of the patterns corre-
sponding to each stage of deformation.
Certain factors may prevent the observation of true
facts. For example, long-range stresses may be re-
lieved by the thinning process; and hence, dislocation
~nfigurat,ions dependent on them would disappear.
Thermal stresses induced by electron bombardment
might also affect the dislocation distribution. Finally,
new dislocations might be introduced duringhan~ing.
According to our observations, most of the observed
dislocations are in rather immobile forms consisting of
tangles or cell boundaries, and their characteristics are
shown to be closely reIated to the work-hardening
characteristics. In specimens that were not deformed
before thinning, the dislocations were found to be
quite few and to show no definite patterns; also, they
were moved easily by the action of the thermalstresses.
3. WORK-HARDENING CHARACTERISTICS OF COPPER FOIL CRYSTALS
The work-hardening characteristics of the foil
specimenso) are summarized in this section prior to the
description of the microscopic observations. Many of
the deformation characteristics of single crystals are
maintained in pseudo-single crystals.
The stress-strain curves of specimens thicker than
50 ,u (with favorable orienta,tions) show three deforma-
tion stagosas in bulk crystals, and the work-hardening
rate in stage II decreases with decreasing specimen
thickness, finally becoming indistinguishable from
that in stage I when the thickness is about 10 p.
Specimens thinner than this do not show stage II for
any tensile direction. The magnitude of the work-
hardening rate for 10.0 ,u specimens increases as the
orientation changes from Loll] to [OOl] becoming
fairly large near the [OOl] orientation. The work-
hardening rates for 50.8 ,u specimens in both stages I
and II show orientation dependences similar to those
of the 10.0 p specimens. It is noteworthy that the work-hardening rate in the well-developed stage II
for orientations near [Oil] is much smaller than for
those near [OOl]. Slip lines formed in the latter
specimens had a clustered distribution showing a
strong localization of deformation, whereas those ob-
served in the former were uniformly distributed.
4. EXPERIMENTAL RESULTS
(A) Distribution of residual dislocations
in the 10.0 p spepeeimerbs
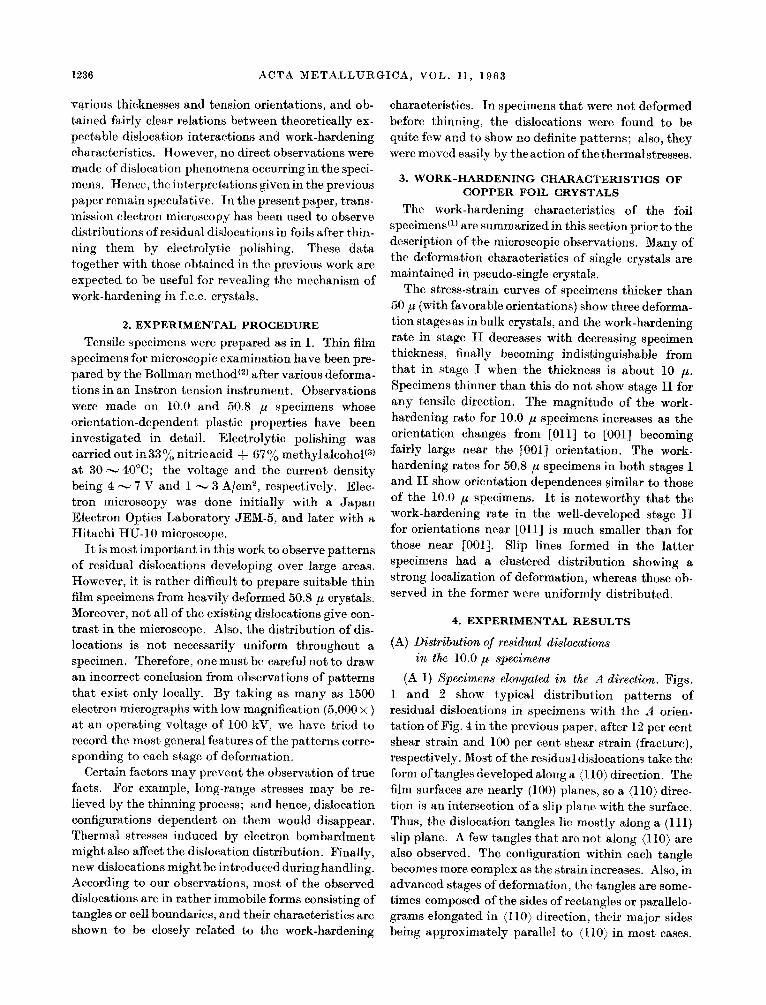
(A 1) Specimens elongated in the A direction. Figs.
1 and 2 show typical distribution patterns of
residual dislocations in specimens with the A orien-
tation of Fig. 4 in the previous paper, after 12 per cent
shear strain and 100 per cent shear strain (fracture),
respectively. Most of the residual dislocations take the
form of tangles developed along a (110) direction. The film surfaces are nearly (100) planes, so a (110) direc-
tion is an intersection of a slip plane with the surface.
Thus, the dislocation tangles lie mostly along a (111)
slip plane. A few tangles that are not along (110) are
also observed. The configuration within each tangle
becomes more complex as the strain increases. Also, in advanced stages of deformation, the tangles are some-
times composed of the sides of rectangles or parallelo-
grams elongated in (110) direction, their major sides
being approximately parallel to (110) in most eases.
SUMINO et&.: PLASTIC DEFORMATION OF FOIL COPPER CRYSTAL&-II 1237
FIG. 1. Typical pattern of residual dislocations in 10 y specimens elongated in the A direction (12% resolved
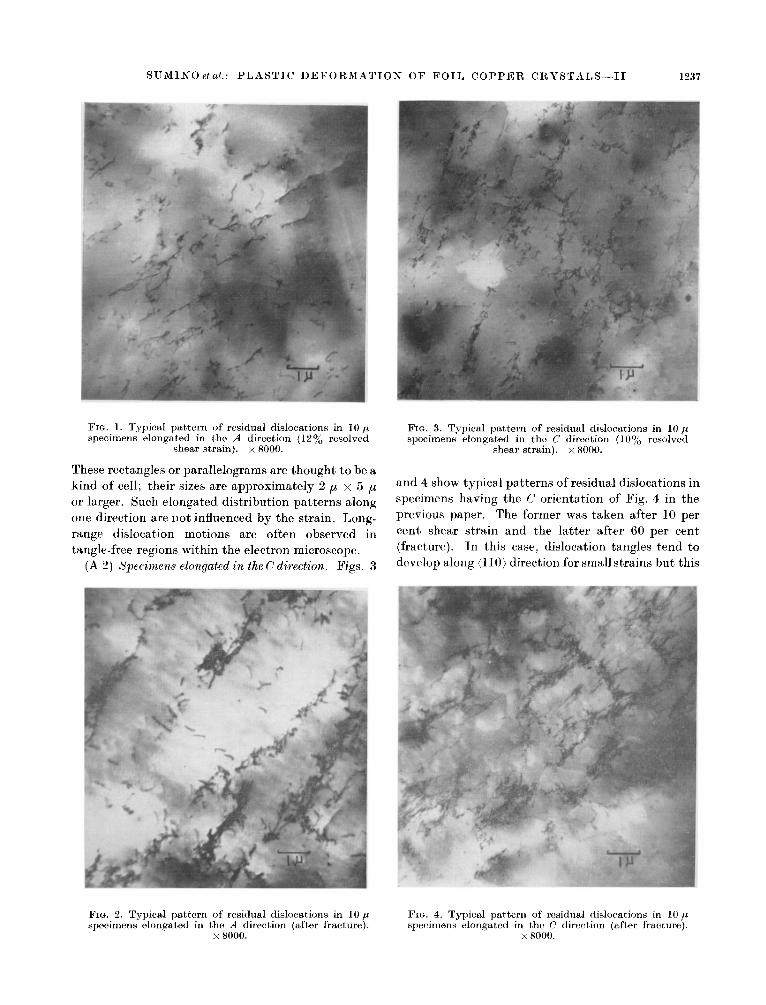
FIG. 3. Typical pattern of residual dislocations in 10 ,u
shear strain). x 8000. specimens elongated in the C direction (lOyO resolved
shear strain). x 8000.
These rectangles or parallelograms are thought’ to be a
kind of cell; their sizes are approximately 2 ,u x 5 ,u
or larger. Such elongated distribution patterns along
one direction are not influenced by the strain. Long-
range dislocation motions are often observed in
tangle-free regions within the electron microscope.
(A 2) Specimen~s elongated in the C direction. Figs. 3
and 4 show typical patterns of residual dislocations in
specimens having the C orientation of Fig. 4 in the
previous paper. The former was taken after 10 per
cent shear strain and the latter after 60 per cent
(fracture). In this case: dislocation tangles tend to
develop along (110) direction for small strains but this
FIG. 2. Typical pattern of residual dislocations in 10 p specimens elongated in the A direction (after fracture).
x 8000.
FIG. 4. Typical pattern of residual dislocations in 10 /J specimens elongat,ed in the C direction (after fracture).
x 8000.
1238 ACTA METALLURGICA, VOL. 11, 1963
tendency is not so marked as in (A 1). For larger deformations, cells of a square or rhombic form develop, one side of them tending to be composed of tangles developed along the (110) directions. The cells are about 1.5 ,u x I.5 p in size at smallest. Both the dislocation density, and the complexity of cell bonndaries increase with increasing strain.
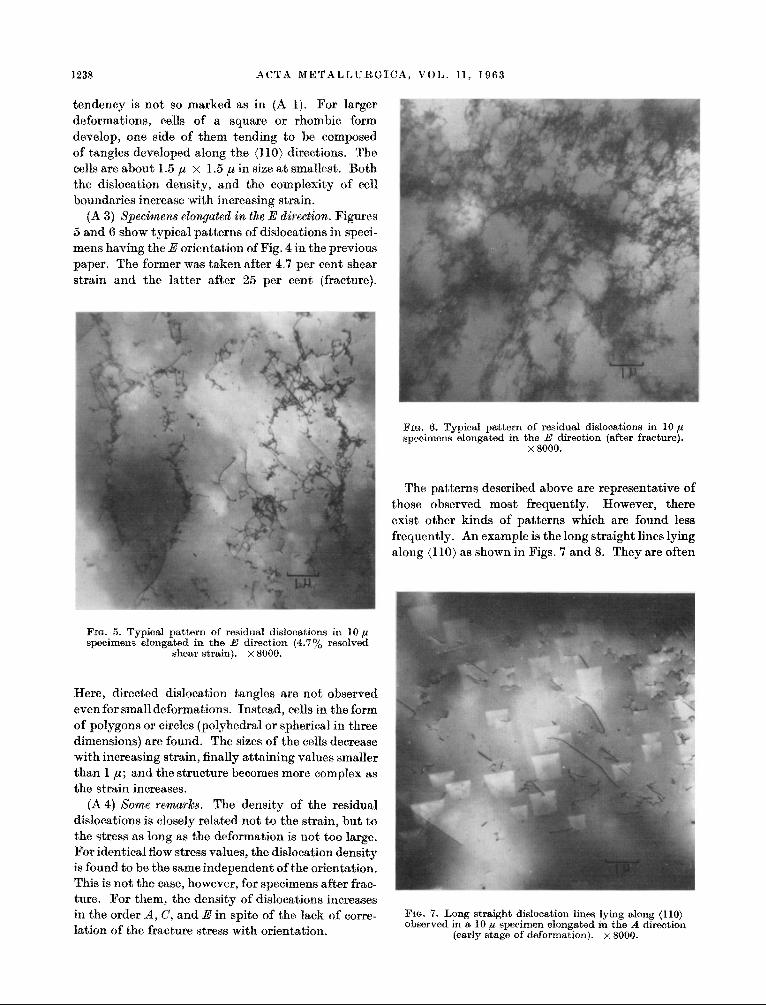
(A 3) Specimens elongated in the E direction. Figures 5 and 6 show typical patterns of dislocations in speei- mens having the E orientation of Fig. 4 in the previous paper. The former was taken after 4.7 per cent shear strain and the latter after 25 per cent (fracture).
FIG. 6. Typical pattern of residual dislocations in 10 p specimens elongated in the E direction (after fracture).
x 8000.
The patterns described above are representative of those observed most frequently. However, there exist other kinds of patterns which are found less frequently. An example is the long straight lines lying along (110) as shown in Figs. 7 and 8. They are often
Pm. 8. Typical pattern of residual dislocations in 10 y specimens elongated in the E direction (4.70/o resolved
shear strain). X 8000.
Here, directed dislocation tangles are not observed even for small defo~ations. Instead, cells in the form of polygons or circles (polyhe~al or spherical in three dimensions) are found. The sizes of the cells decrease with increasing strain, finally attaining values smaller than 1 p; and the structure becomes more complex as the strain increases.
(A 4) Some rema&. The density of the residual dislocations is closely related not to the strain, but to the stress as long as the deformation is not too large. For identical Aow stress values, the dislo~tion density is found to be the same independent of the orientation. This is not the oase, however, for specimens after frac- ture. For them, the density of dislocations increases in the order A, G, and E in spite of the lack of corre- lation of the fracture stress with orientation.
FIG. 7. Long straight dislocation lines lying along (110) observed in a 10 ,u specimen elongated in the A direction
(early stage of d0fo~ation). x 8000.
SUMINO et al.: PLASTIC DEFORMATION OF FOIL COPPER CRYSTALS-II 1239
observed clearly in specimens with the A and C orien-
tations at any stage of deformation* and always lie
along (110); i.e., on a slip plane. These long straight
dislocations appear to be immobile. They remain in
specimens even after thinning; also, they do not move
under the thermalstressesproducedby themicroscope.
The immobile dislocations may be (1) sessile dis-
locations(4-6) formed by the reaction of AB(d) dis-
locations with BD(a) or CD(a) (the meanings of these
notations are given in the previous paper), (2) disloca-
tion dipoles”) made by the motion of AB(d) disloca-
tions, or (3) screw parts of CB(d) dislocations which
have been immobilized by a high density of jogs formed
on them. It is not expected, however, that the CB(d)
dislocations would be activated at small strains in spe-
cimens with the A or C orientation, and probability (3)
is improbable. Those straight dislocations observed in
early stage of deformation (Fig. 7) may be dislocation
debris. Threefold nodes are found quite often on the
straight dislocations in Fig. 8 and it is thought that
sessile dislocations form by dislocationreactionsduring advanced stagesof deformation. Thereaction between
AB(d) and BD(a) leads to the formation of Lomer-
Cottrell sessiles, while that between AB(d) and CD(a)
leads to sessiles proposed by Hirthc6) BD(u) dislo-
cations become less active upon the orientation change
[Oll] -+ [OOl]. There observed, however, no evidence
* They are also found in specimens with the E orientation, but here they are not so clear because of masking by the cell boundaries.
FIG. 8. Long straight dislocation lines lying along (110) observed in a 10 ,G fractured specimen elongated in the C
direction. x 8000.
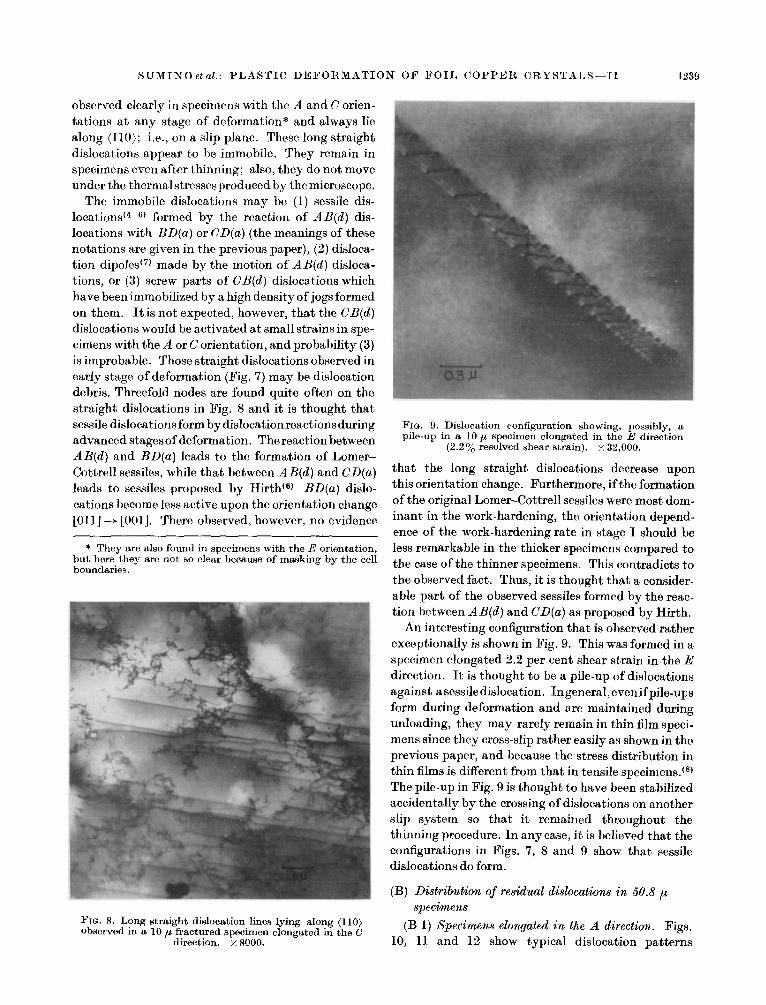
FIQ. 9. Dislocation configuration showing, possibly, a pile-up in a 10 ,u specimen elongated in the E direction
(2.2% resolved shear strain). x 32,000.
that the long straight dislocations decrease upon
this orientation change. Furthermore, if the formation
of the original Lomer-Cottrell sessiles were most dom-
inant in the work-hardening, the orientation depend-
ence of the work-hardening rate in stage I should be
less remarkable in the thicker specimens compared to
the case of the thinner specimens. This contradicts to
the observed fact. Thus, it is thought that a consider-
able part of the observed sessiles formed by the reac-
tion between AB(d) and CD(u) as proposed by Hirth.
An interesting configuration that is observed rather
exceptionally is shown in Fig. 9. This was formed in a
specimen elongated 2.2 per cent shear strain in the E
direction. It is thought to be a pile-up of dislocations
against a sessile dislocation. Ingeneral, even if pile-ups
form during deformation and are maintained during
unloading, they may rarely remain in thin film speci-
mens since they cross-slip rather easily as shown in the
previous paper, and because the stress distribution in
thin films is different from that in tensile specimens.‘*)
The pile-up in Fig. 9 is thought to have been stabilized
accidentally by the crossing of dislocations on another
slip system so that it remained throughout the
thinning procedure. In any case, it is believed that the
configurations in Figs. 7, 8 and 9 show that sessile
dislocations do form.
(B) Distribution of residual dislocations in 50.8 ,u
specimen8
(B 1) Specimens elongated in the A direction. Figs.
10, 11 and 12 show typical dislocation patterns
1240 ACTA METALLURGICA, VOL. 11, 1963
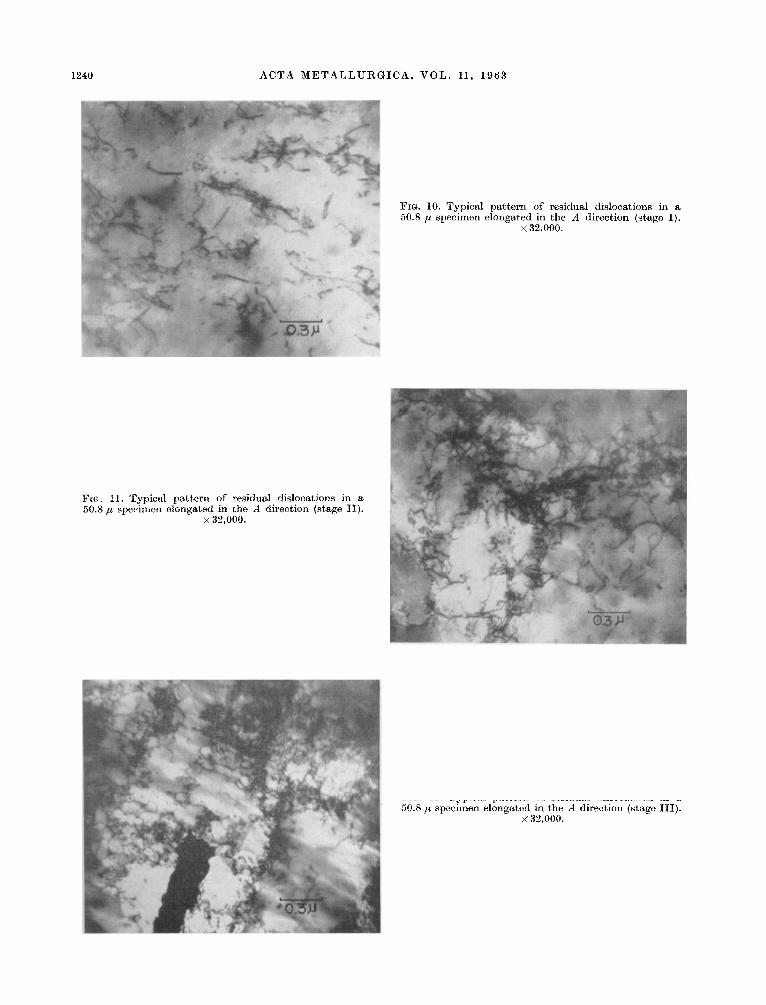
FIG. 10. Typical pattern of resi 50.8 ,u specimen elongated in the
x 32,000.
dual dislocat ions in a A direction (stage I).
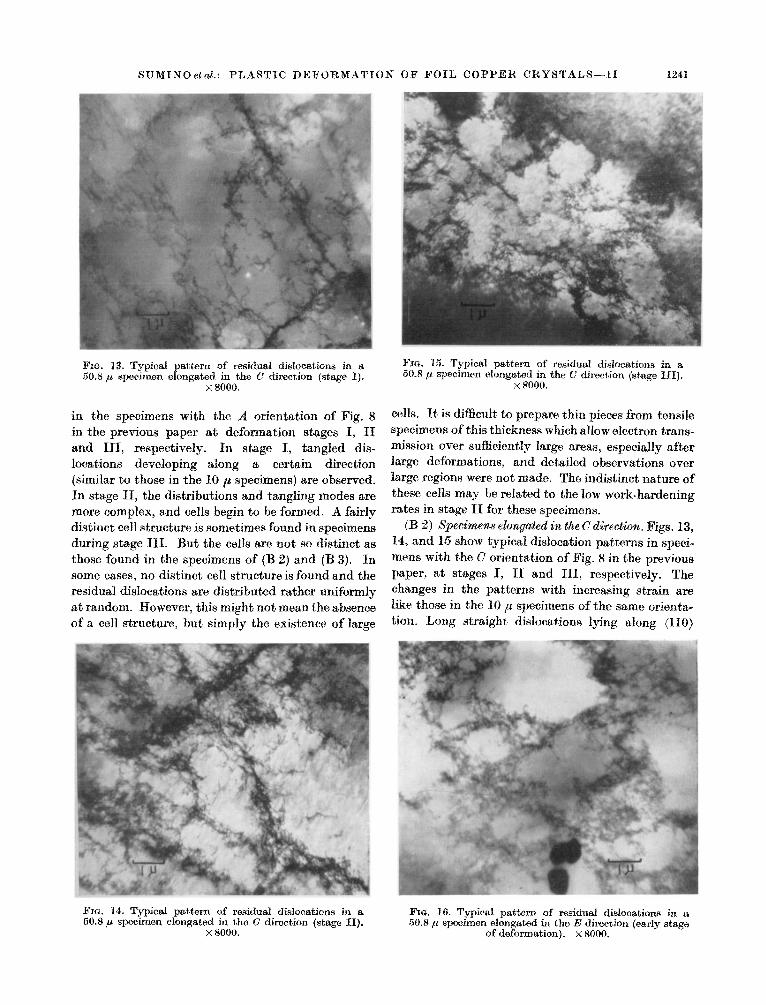
FIG. 11. Typical p&kern of residual dislocations in a 50.8 ,u specimen elongated in the A dire&ion (st,age II).
x 32,000.
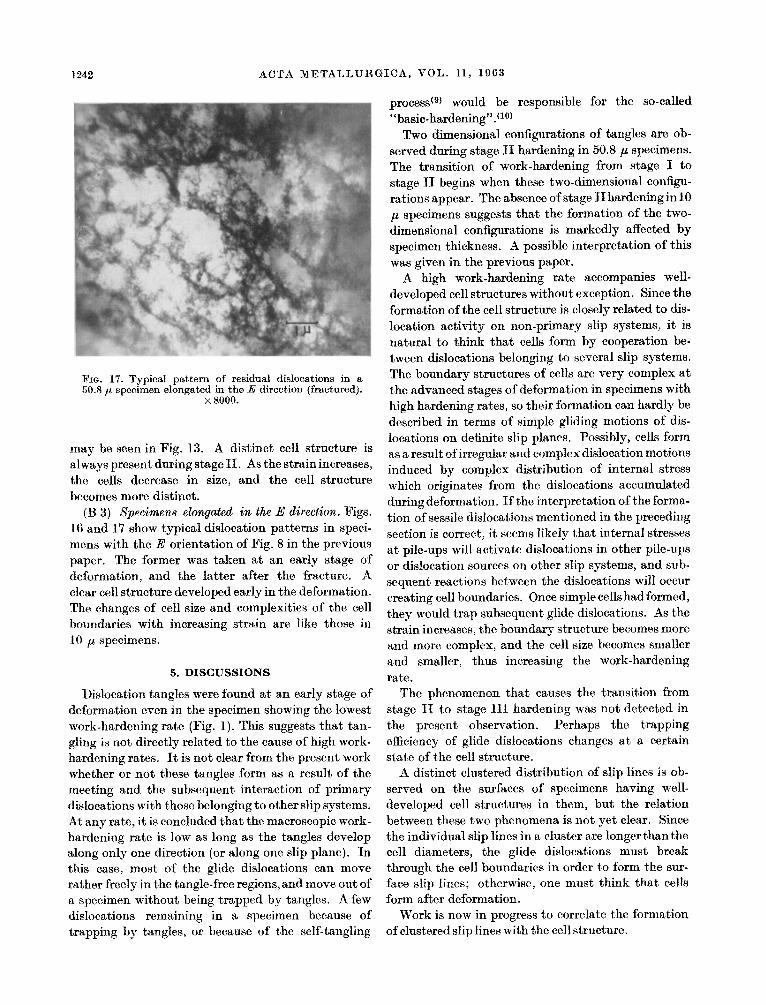
FIG. 12. Typical pattern of residual dislocations 50.8 ,u specimen elongated in the A direction (stage
x 32,000.
in a III).
SUMINO et cd.: PLASTIC DEFORMATION OF FOIL COPPER CRYSTALS--FI I241
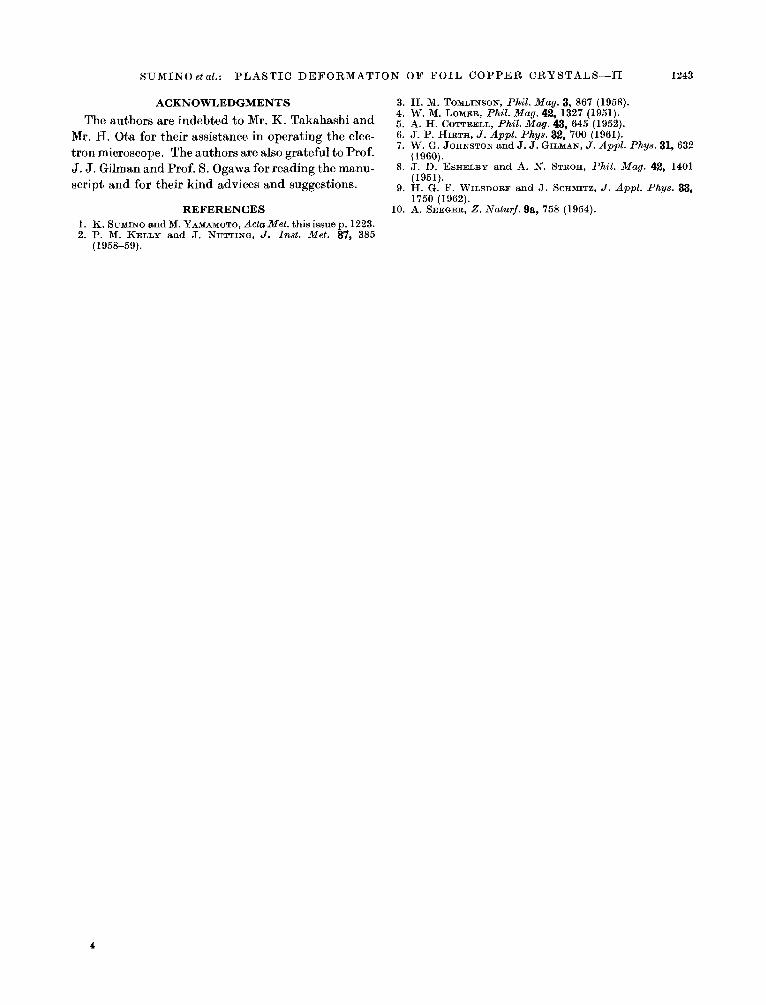
Fra. 13. Typical pattern of residual dislocations in a SO,% p specimen elongated in the C direction (stage I).
s x000.
in the specimens with the A orientation of Fig. 8 in the previous paper at deformation stages I, II and III, respectively. In stage I, tangled dis- locations developing along 8 certain direction (similar to those in the 10 y specimens) are observed. In stage II, the distributions and tangbng modes are more complex, and cells begin to be formed. A fairly distinct cell structure is sometimes found in specimens during stage III. But the cells are not so distinct its those found in the specimens of (B 2) and (B 3). In some cases, no distinct cell structure is found and the residual dislocations are distributed rather uniformly at random. However, this might not mean the absence of a cell structure, but simply the existence of large
Fra. 15. Typical pattern of residual dislooat~o~s in a 80.8 +u, specimen elongated in the C direction (stage III).
x SOOO.
cells. It is dif&ult to prepare thin pieces from tensile specimens of this thickness which allow electron trans- mission over sufficiently large areas, especially after large deformations~ and detailed observations over large regions were not made. The indistinct nature of these cells may be related to the low work-hardening rates in stage II for these specimens.
(B 2) ~~~~~~~~ ~~~~~~d in the C ~~r~~~o~. Figs. 13, 14, and 15 show typical d&&cation patterns in speci- mens with the C orientation of Fig. 8 in the previous paper, at stages I, 11 and III, respectively. The changes in the patterns with increasing strain are like those in the 10 p specimens of the same orienta- tion. Long straight dislocations lying along (110)
Fm. 14. Typical pattern of residual dislocations in 8 50.8 ,u specimen elongated in the C direction (stage II).
x 8000.
WC. 16. Typical pattern of residual dislocations in a 50.8 ,u specimen elongated in the E direction (early stage
of deformation). x 8000.
1242 ACTA METALLURGICA, VOL. 11, 1963
FIG. 17. Typical pattern of residual disloelutions in & 50.8 ,a specimen elongated in the E direction (fract,ured).
x 8000.
may be seen in Fig. 13. A distinct eel1 structure is always present during stage II. As the strain increases, the cells decrease in size, and the cell structure becomes more distinct.
(B 3) ~~~c~~~~ e~~ga~~~ in the E d~r~e~~o~. Figs. 16 and 17 show typical dislocation patterns in speci- mens with the E orientation of Fig. 8 in the previous paper. The former was taken at an early stage of deformation, and the latter after the fracture. A clear cell structure developed early in the deformation. The changes of cell size and complexities of the cell boundaries with increasing strain are like those in 10 j,4 specimens.
5. DISCUSSIONS
Dislocation tangles were found at an early sta*ge of deformation even in the specimen showing the lowest work-hardening rate (Fig. 1). This suggests that tan- gling is not directly related to the cause of high work- hardening rates. It is not clear from the present work whether or not these tangles form as a result of the meeting and the subsequent interaction of primary dislocations with those belonging to other slip systems. At any rate, it is concluded that the macroscopic work- hardening rate is low as long as the tangles develop along only one direction (or along one slip plane). In this case, most of the glide dislocaGons ean move rather freely in the tangle-free regions,and move out of a specimen without being trapped by tangles. A few dislocations remaining in a specimen because of tirapping by tangles, or because of the self-tangling
process(g) would be responsible for the so-called “basic-hardening”.(lo)
Two dimensional configurations of tangles are ob- served during stage II hardening in 50.8 ,H. specimens. The transition of work-hardening from stage I to stage II begins when these two-dimensional configu- rations appear. The absence of stage II hardening in 10 p specimens suggests that the formation of the two- dimensional configurations is markedly affected by specimen thickness. A possible interpretation of this was given in the previous paper.
A high work-hardening rate accompanies well- developed cell structures without exception. Since the formation of the cell structure is closely related to dis- location activity on non-primary slip systems, it is natural to think that cells form by cooperation be- tween dislocations belonging to several slip systems. The boundary structures of cells are very complex at the advanced stages of defo~ation in specimens with high hardening ra-tes, so their formation can hardly be described in terms of simple gliding motions of dis- locations on definite slip planes. Possibly, cells form as a result of irregular and complex dislocation motions induced by complex distribution of internal stress which originates from the dislocations accumulated during deformation. If the interpretation of the forma- tion of sessile dislo~tions mentioned in the preceding section is correct, it seems likely that internal stresses at pile-ups will activate dislocations in other pile-ups or dislocation sources on other slip systems, and sub- sequent reactions between the dislocations will occur creating cell boundaries. Once simple cells had formed, they would trap subsequent glide dislocations. As the strain increases, the boundary structure becomes more and more complex, and the cell size becomes smaller and smaller, thus increasing the work-hardening rate.
The phenomenon that causes the t,ransition from stage II to stage III hardening was not detected in the present observation. Perhaps the trapping efficiency of glide dislocations changes at a certain state of the cell structure.
A distinct clustered distribution of slip lines is ob- served on the surfaces of specimens having well- developed cell structures in them, but the relation between these two phenomena is not yet clear. Since the individual slip lines in a cluster are longer than the cell diameters, the glide dislocations must break through the cell boundaries in order to form the sur- face slip lines; otherwise, one must think that cells form after deformation.
Work is now in progress to correlate the formation of clustered slip lines with the cell structure.
SUMINO et al.: PLASTIC DEFORMATION OF FOIL COPPER CRYSTALS-II 1243
ACKNOWLEDGMENTS 3. H. M. TOMLINSON, Phil. Mag. 3, 867 (1958).
The authors are indebted to Mr. K. Takahashi and 4. W. M. LOMER, Phil. Mag. 42, 1327 (1951). 5. A. H. COTTRELL, Phil. Mag. 43, 645 (1952).
Mr. H. Ota for their assistance in operating the elec- 6. J. P. HIRTH, J. Appl. Phys. 32, 700 (1961).
tron microscope. The authors are also grateful to Prof. 7. W. G. JOHNSTON~~~J.J.GILMAN, J. Appl. Phya.31,632
(1960). J. J. Gilman and Prof. S. Ogawa for reading the manu- 8. J. D. ESHELBY snd A. N. STROR, Phil. Mug. 42, 1401
script and for their kind advices and suggestions. (1951).
9. H. G. F. WILSDORF and J. SGHMITZ, J. AppZ. Phys. 33, 1750 (1962).
REFERENCES 10. A. SEECER, 2. Naturf. 9a, 758 (1954).
1. K. SUMINO and M.Y~~~~0~0,Act~~et.thisissuep.1223. 2. P. M. KELLY and J. NUTTING, J. Inst. Met. 87, 385
(1958-59).
4