Embed Size (px)
Citation preview
Plastics Industry in India
British Plastics Federation
Stronger Together
Contents
Plastics Industry In India: A BPF Overview
Trade Magazines, Trade Associations, Trade Shows and Useful Links
Growth of the Plastic Industry in India (supplied by CIPET)
� New Machine Additions
� Growth Prospect 2014-2015
� Profile of Plastics Recycling Industry in India
� Polymer Demand in India
� Polymer Demand, Production, Imports and Exports
EUROMAP Data: Plastics Industry in India
� Production, import-export and consumption of plastic raw materials (total) - TON
� Plastics consumption by application markets (%)
� Plastic processing companies by size (%)
� Main processing technologies (%)
� Import/export of plastic products
Overview of the Indian Plastics Industry (Source: CIPET)
� Current Indian Petrochemicals Capacities (in KT)
� Typical Polymer consumption pattern of different polymers
� Statistics of Plastics Industries in India
Turnover of Indian plastic industry to touch Rs 1,000 bln in 2012
(Plastemart - 13-9-2011)
Plastics Industry Overview
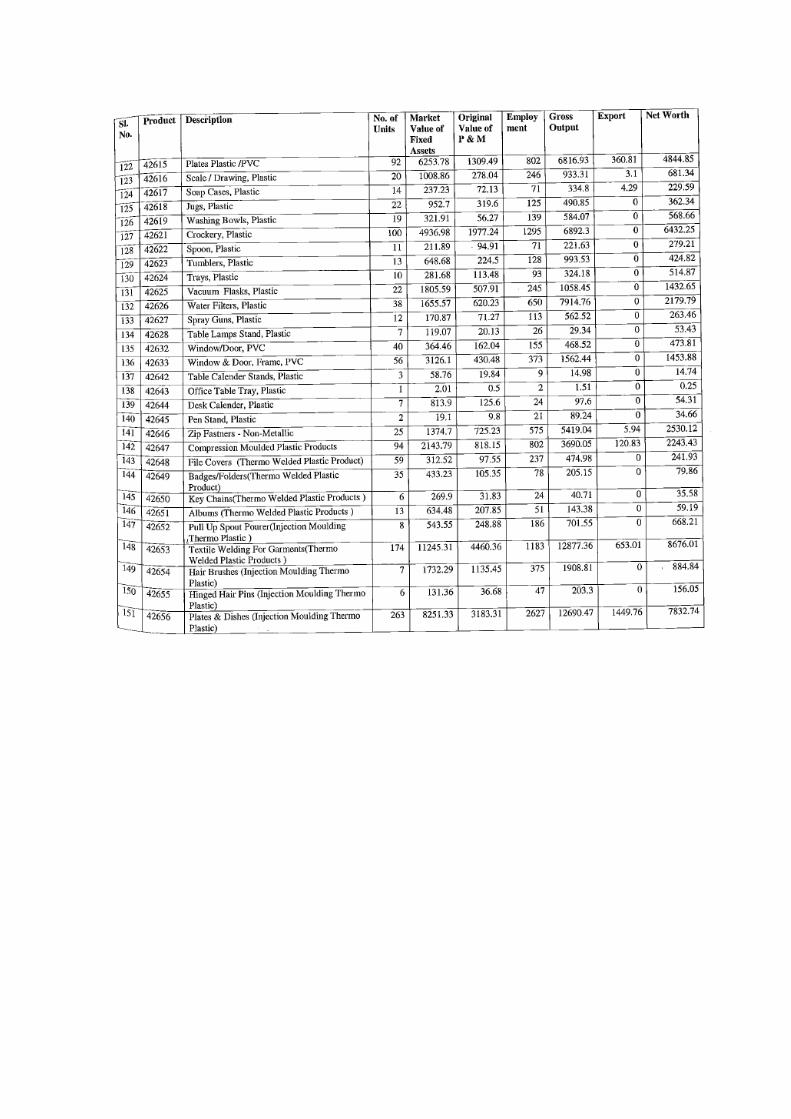
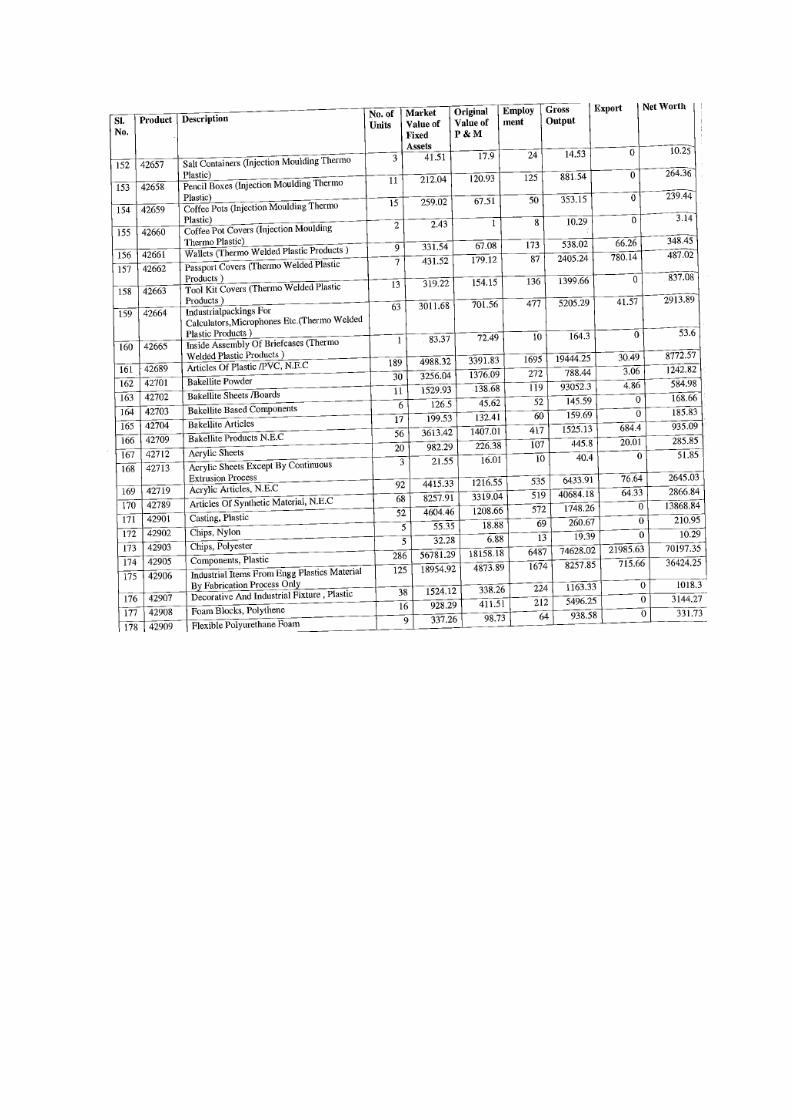
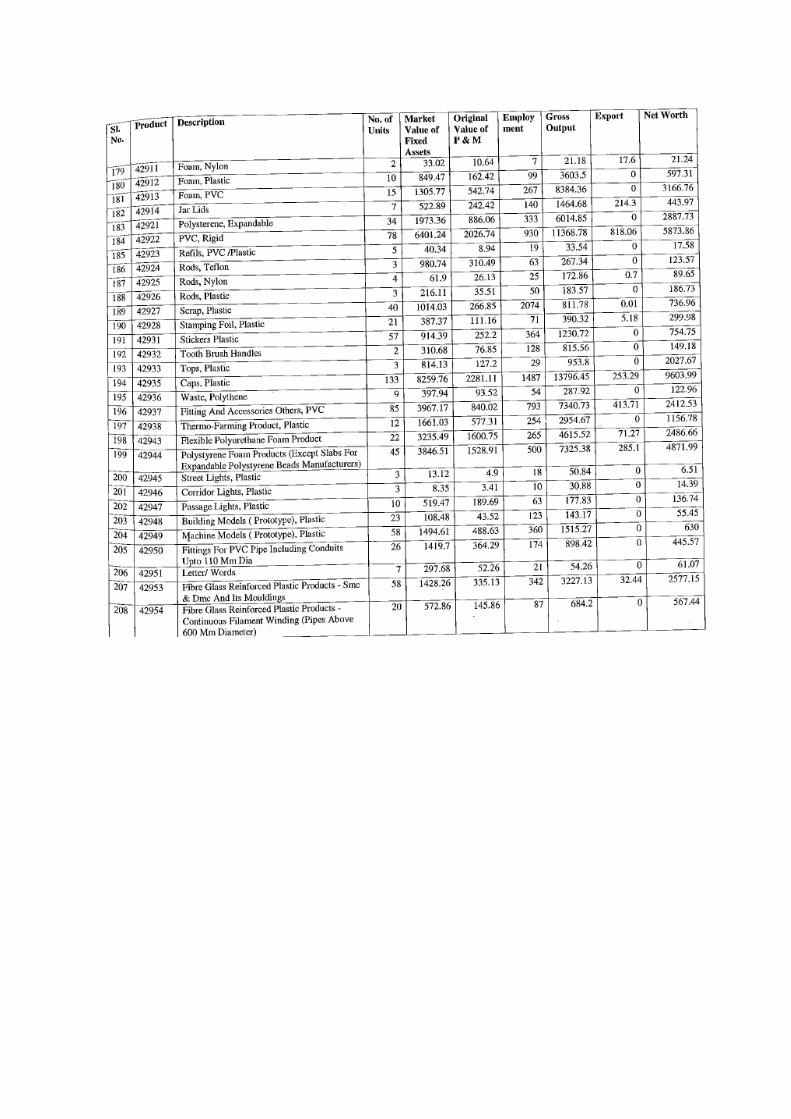
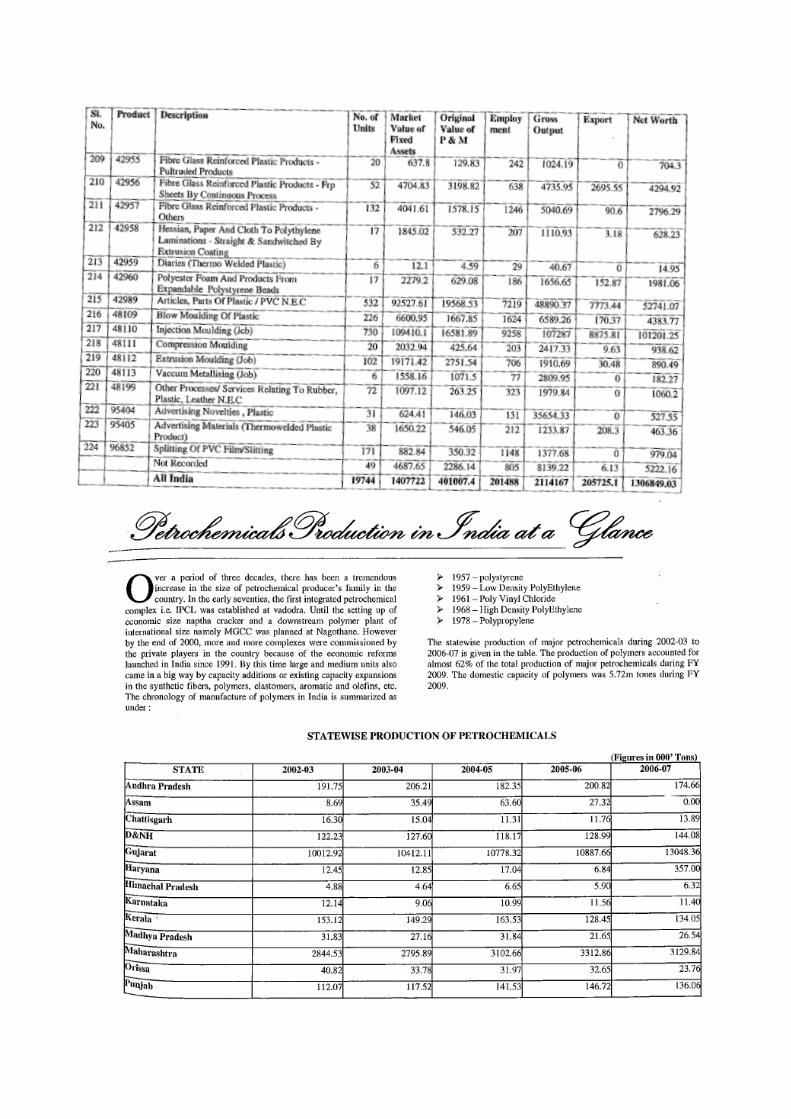
� State Distribution
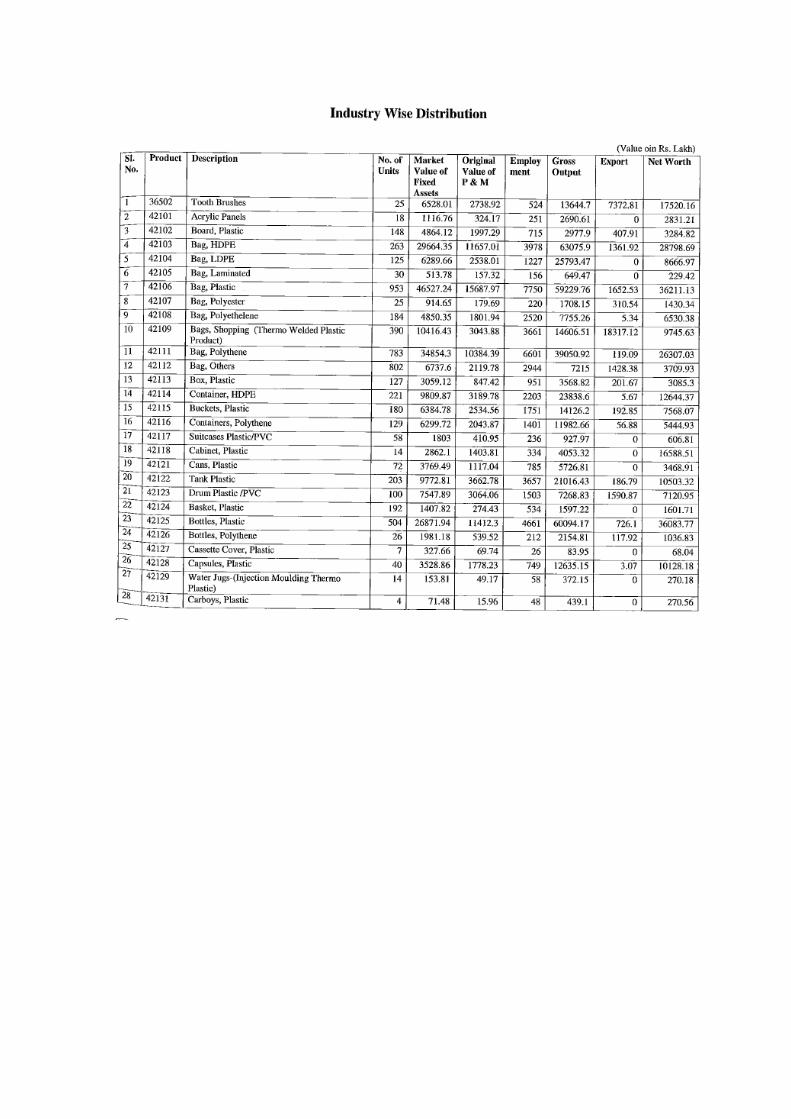
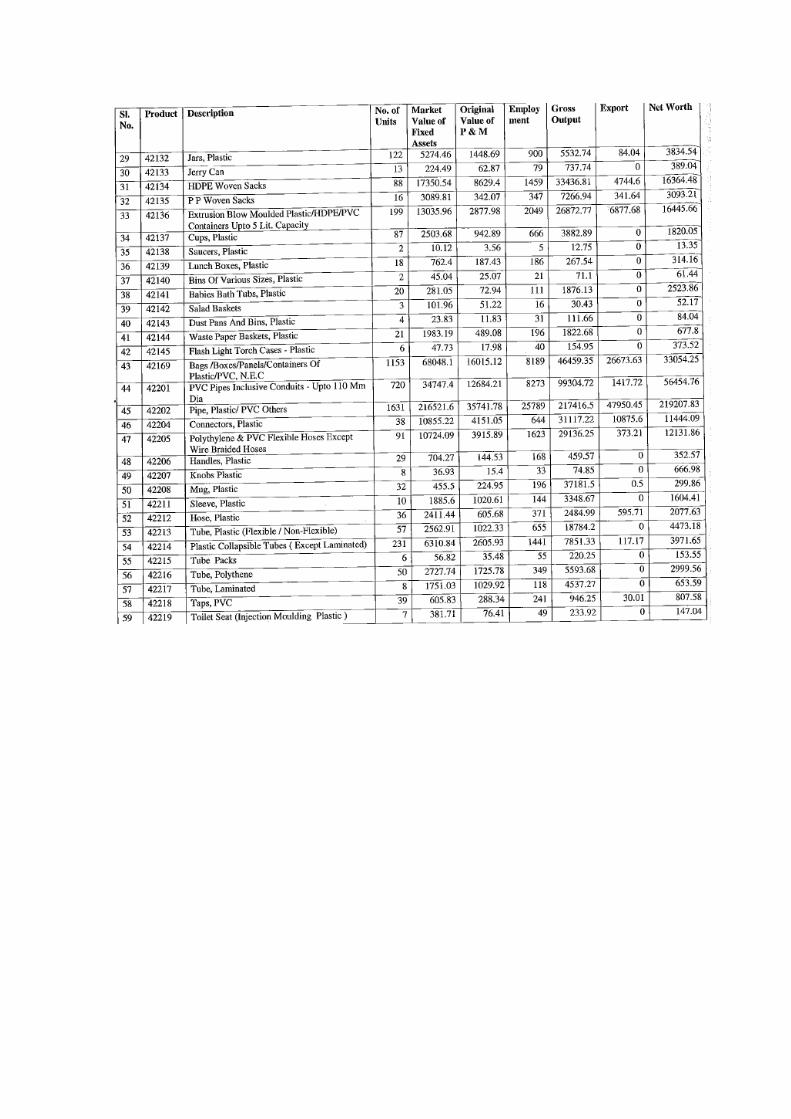
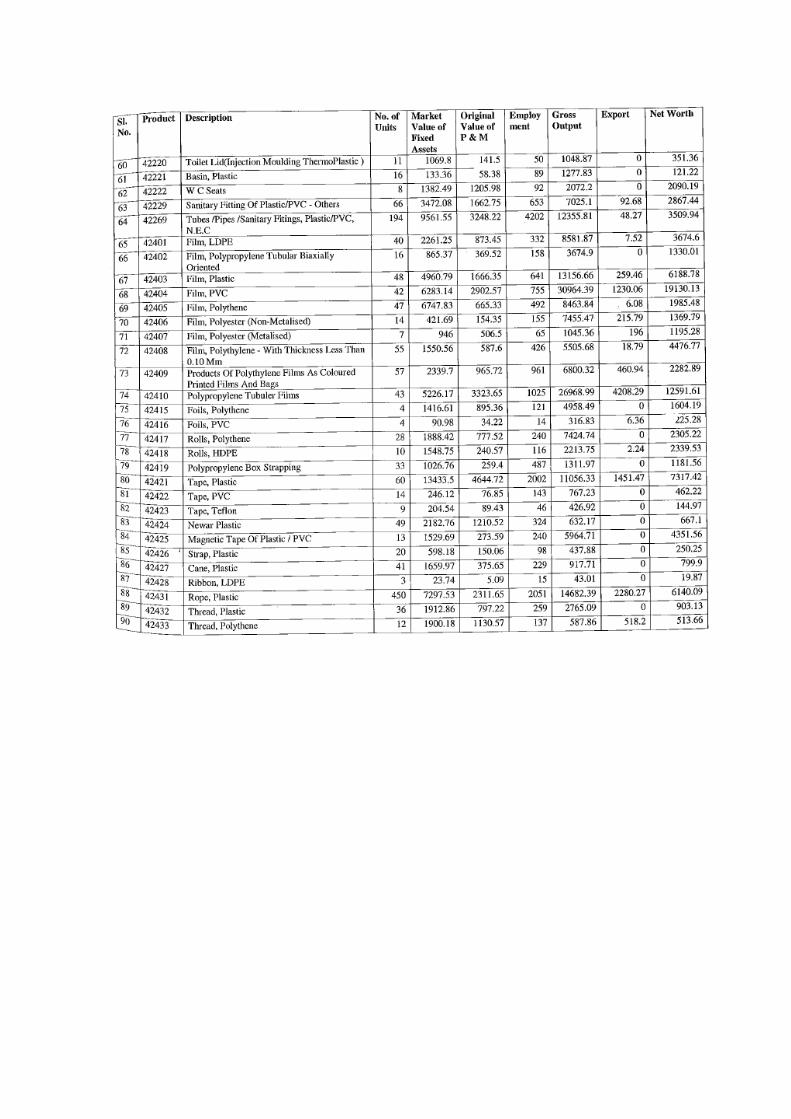
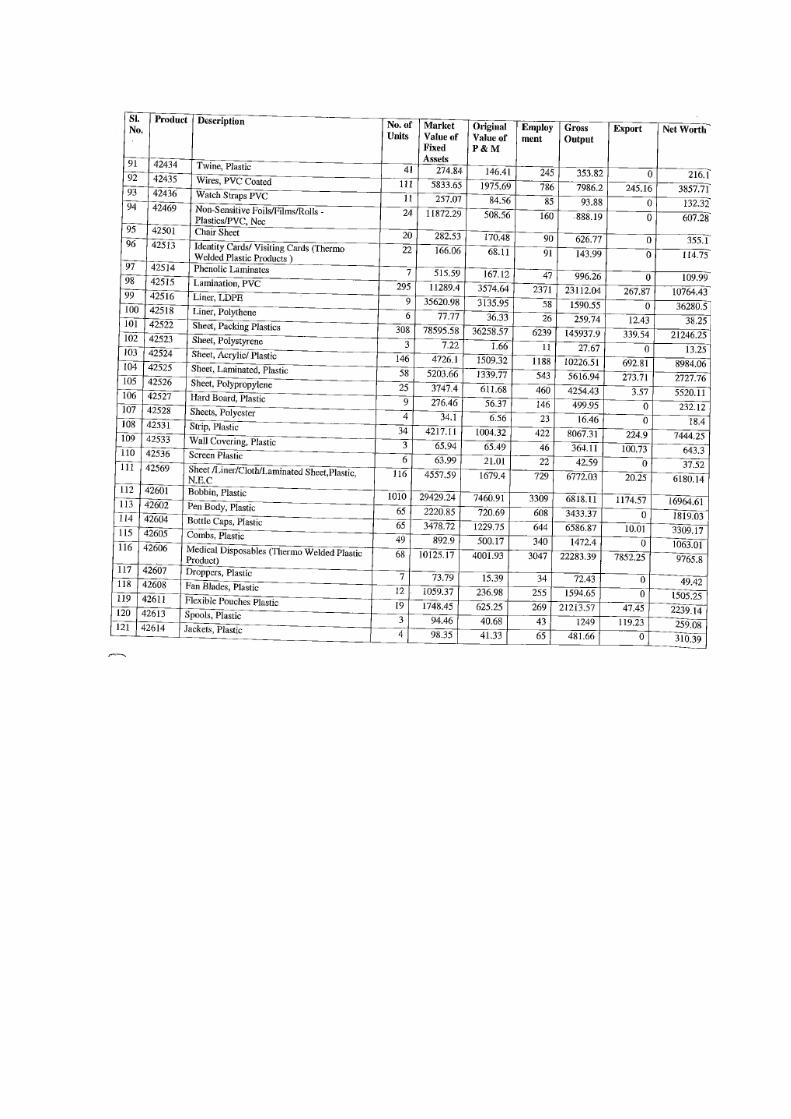
� Industry Distribution (by products)
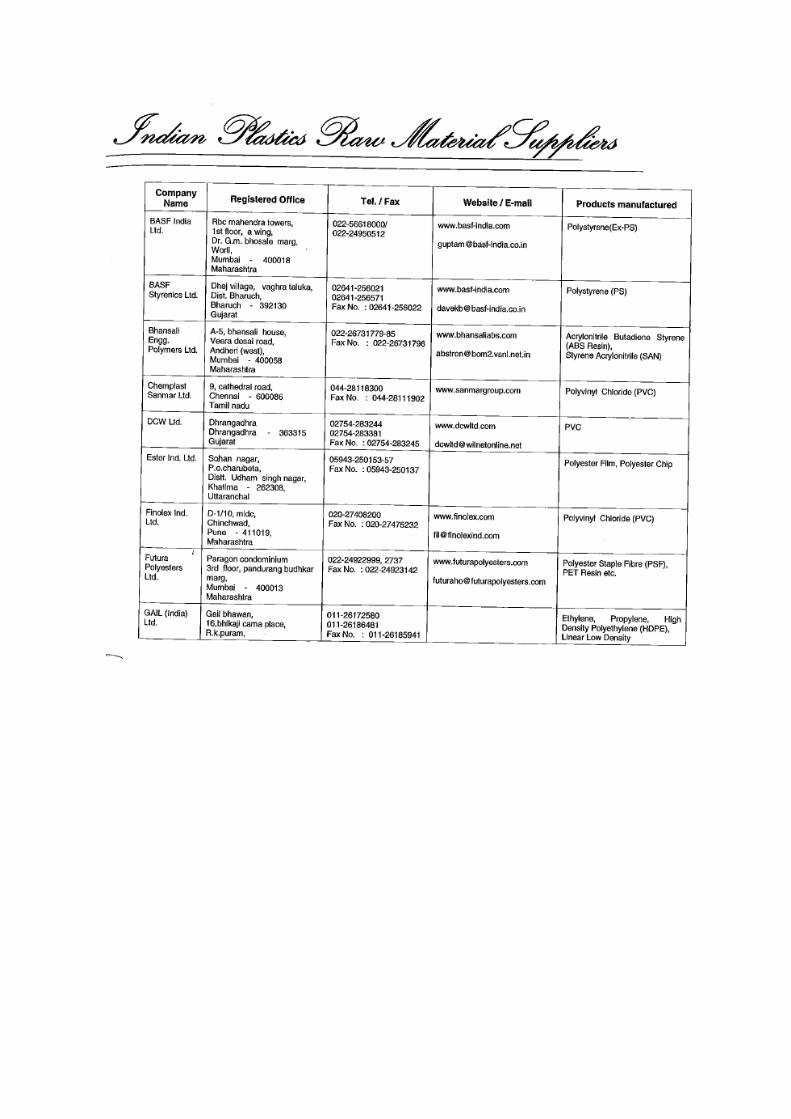
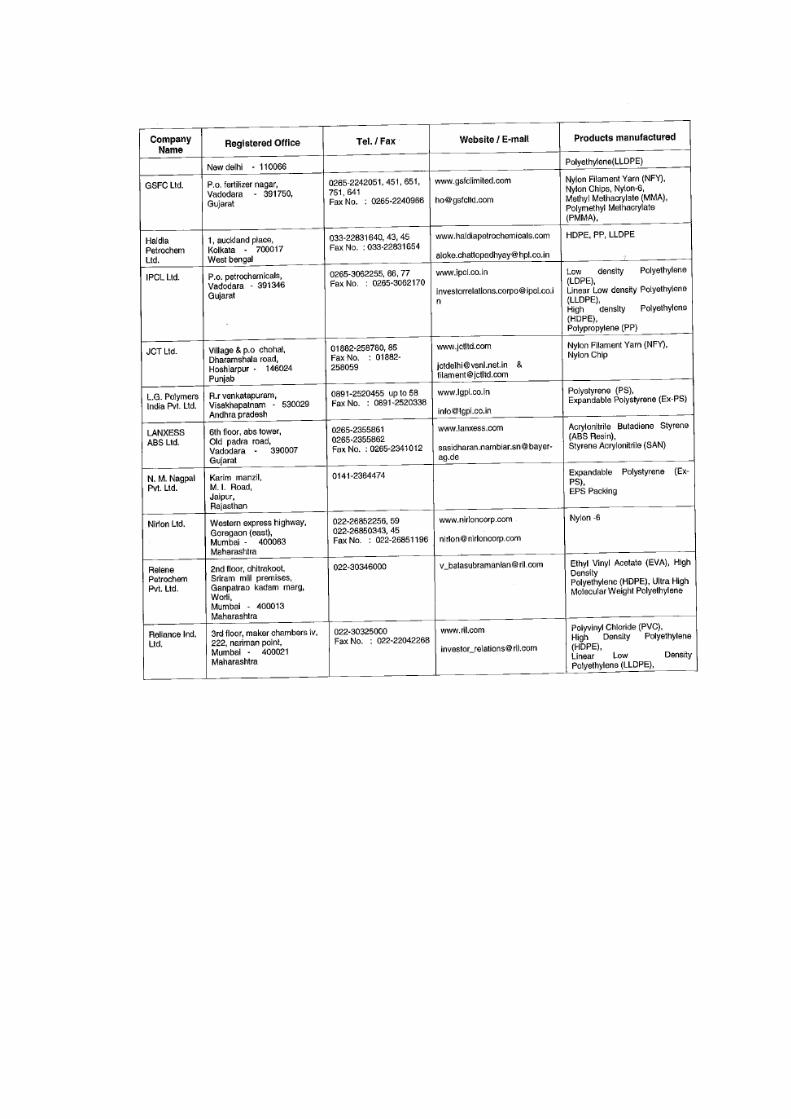
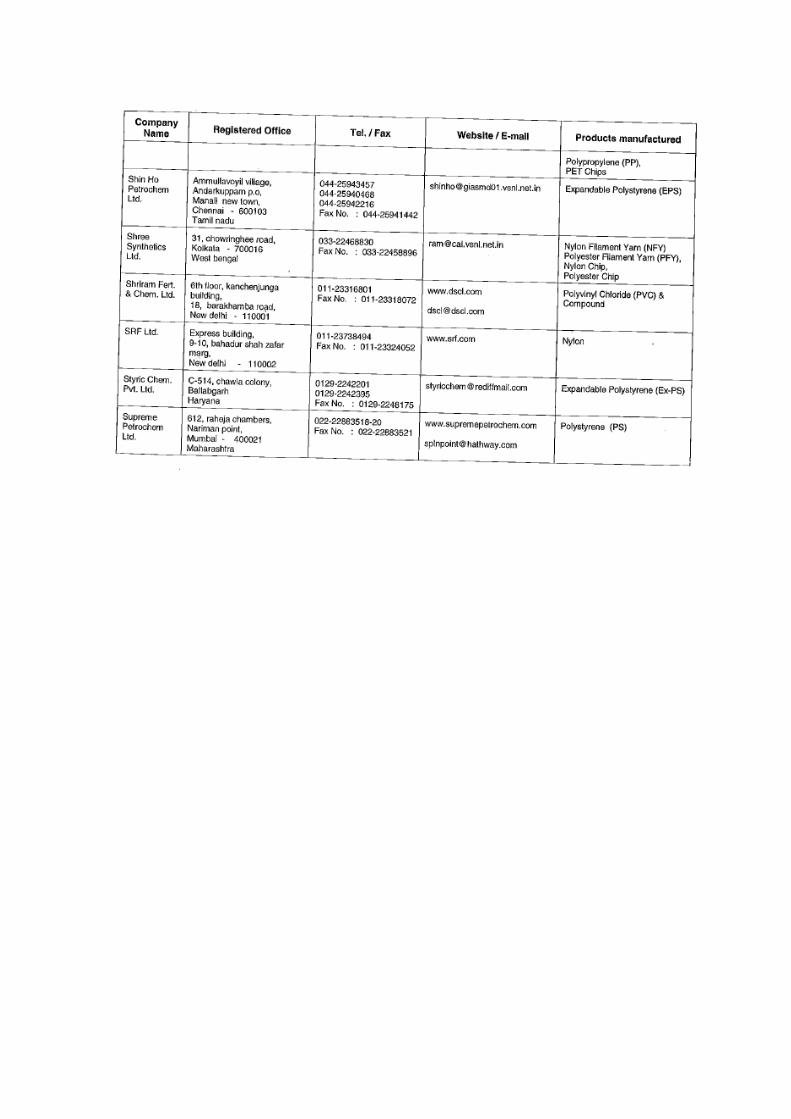
� Industry Plastics Raw Material Suppliers
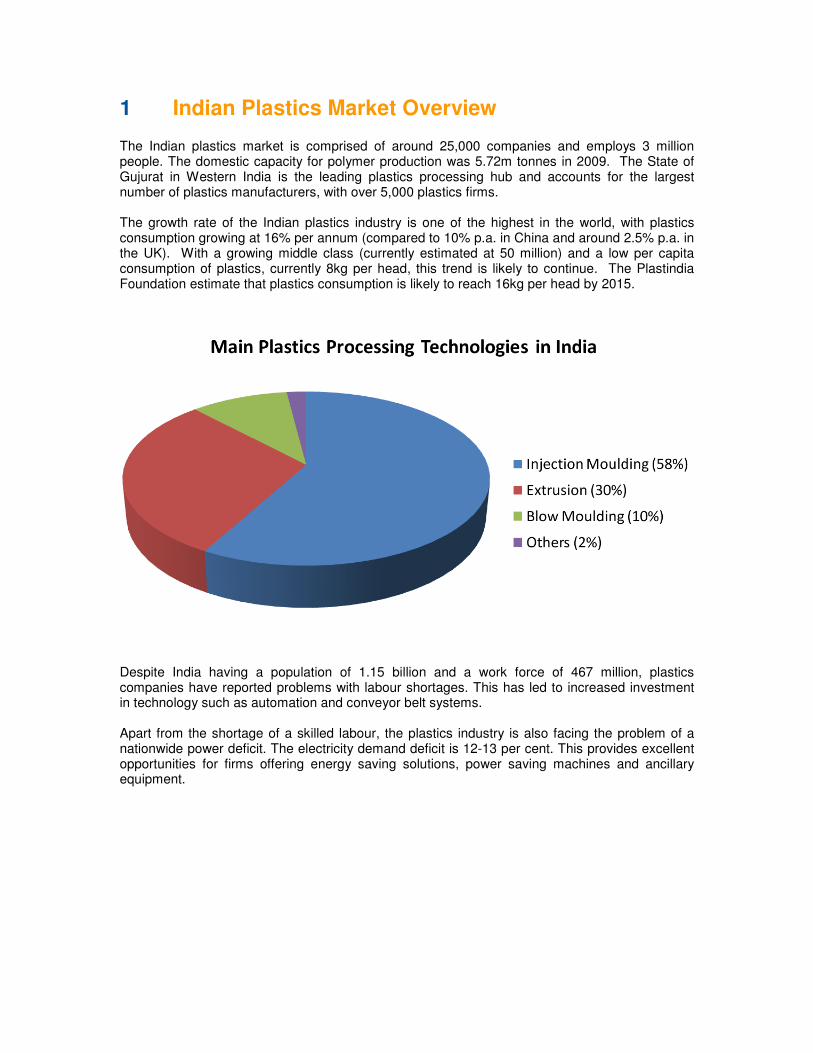
1 Indian Plastics Market Overview The Indian plastics market is comprised of around 25,000 companies and employs 3 million people. The domestic capacity for polymer production was 5.72m tonnes in 2009. The State of Gujurat in Western India is the leading plastics processing hub and accounts for the largest number of plastics manufacturers, with over 5,000 plastics firms. The growth rate of the Indian plastics industry is one of the highest in the world, with plastics consumption growing at 16% per annum (compared to 10% p.a. in China and around 2.5% p.a. in the UK). With a growing middle class (currently estimated at 50 million) and a low per capita consumption of plastics, currently 8kg per head, this trend is likely to continue. The Plastindia Foundation estimate that plastics consumption is likely to reach 16kg per head by 2015.
Despite India having a population of 1.15 billion and a work force of 467 million, plastics companies have reported problems with labour shortages. This has led to increased investment in technology such as automation and conveyor belt systems. Apart from the shortage of a skilled labour, the plastics industry is also facing the problem of a nationwide power deficit. The electricity demand deficit is 12-13 per cent. This provides excellent opportunities for firms offering energy saving solutions, power saving machines and ancillary equipment.
2 Raw Material Supply and Demand
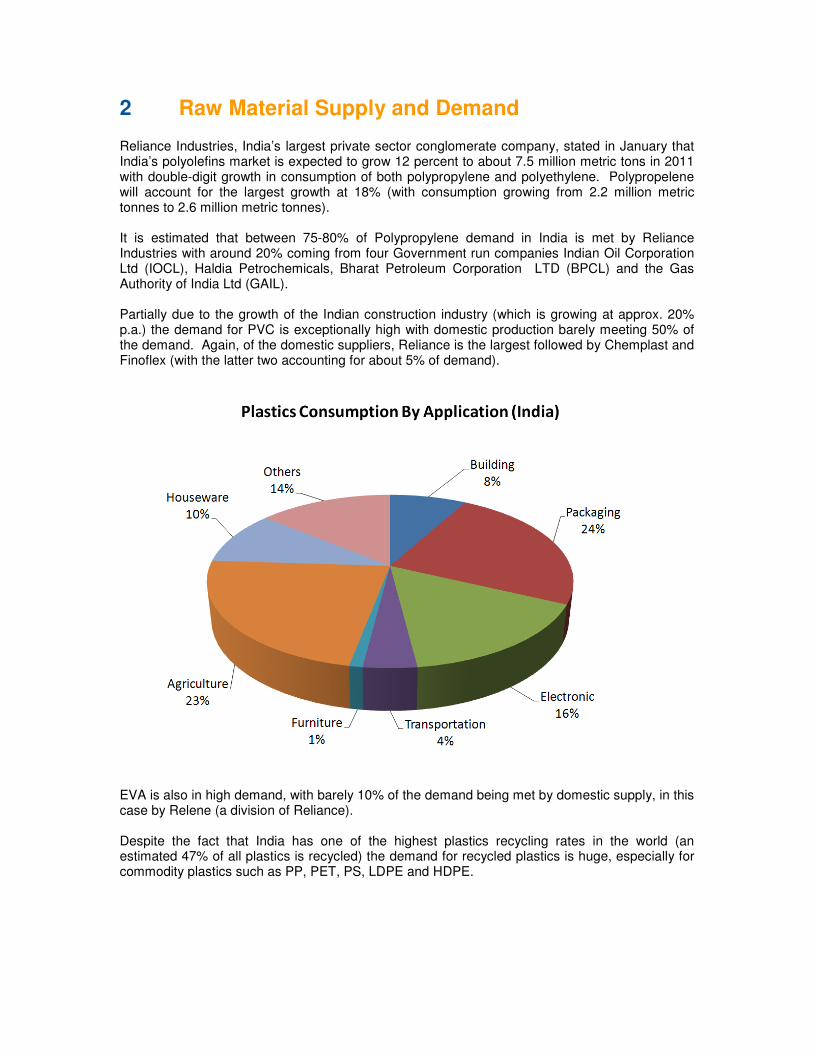
Reliance Industries, India’s largest private sector conglomerate company, stated in January that India’s polyolefins market is expected to grow 12 percent to about 7.5 million metric tons in 2011 with double-digit growth in consumption of both polypropylene and polyethylene. Polypropelene will account for the largest growth at 18% (with consumption growing from 2.2 million metric tonnes to 2.6 million metric tonnes). It is estimated that between 75-80% of Polypropylene demand in India is met by Reliance Industries with around 20% coming from four Government run companies Indian Oil Corporation Ltd (IOCL), Haldia Petrochemicals, Bharat Petroleum Corporation LTD (BPCL) and the Gas Authority of India Ltd (GAIL). Partially due to the growth of the Indian construction industry (which is growing at approx. 20% p.a.) the demand for PVC is exceptionally high with domestic production barely meeting 50% of the demand. Again, of the domestic suppliers, Reliance is the largest followed by Chemplast and Finoflex (with the latter two accounting for about 5% of demand).
EVA is also in high demand, with barely 10% of the demand being met by domestic supply, in this case by Relene (a division of Reliance). Despite the fact that India has one of the highest plastics recycling rates in the world (an estimated 47% of all plastics is recycled) the demand for recycled plastics is huge, especially for commodity plastics such as PP, PET, PS, LDPE and HDPE.
3 Automotive Market
India is the second fasted growing consumer market for Automobiles in the world (after China) and the seventh largest producer, with over 2.6 million motor vehicles being manufactured in India in 2009. According to forecasts, automobile manufacturing in India is set to raise 7% year on year until 2015. Car manufacturers in India have reported significant increases in output over the last 12 months, specifically Tata Motors reporting a 32% increase in sales, Toyota Kirloska Motor at 26% and Ford India, a staggering 220% - due, in large part to the highly successful Ford Figo model.
4 Packaging Industry
Packaging currently accounts for the largest consumption of plastics in India, at 24% of overall consumption. In January 2011 India’s Corporate Affairs Minister indicated that the country was set to lift foreign direct investment (FDI) restrictions for supermarket giants such as Tesco and Walmart (which currently has just six stores in India). The Indian Government has highlighted the need for foreign investment to bring in new technology such as cold chain logistics systems, warehousing facilities and packaging technology. This will assist in in improving the rate at which food perishes before it reaches market – currently at around 40% per annum. This issues offer huge opportunities for plastics packaging manufacturers wishing to enter the market.
5 Opportunities for UK Plastics Companies in India
5.1 Plastindia 2012
The BPF recognises the potential for UK plastics manufacturers and service providers and together with support from UK Trade & Investment is encouraging British firms to explore the Indian market through Plastindia 2012. Plastindia 2012 will take place between 1
st and 6
th February 2012 in New Delhi, India. The show
is the largest plastics trade fair in India and the second largest plastics event anywhere in the world. The show takes place once every three years and the previous edition attracted 1,518 exhibitors and 130,000 visitors. The BPF have secured a key location at the show for the British Pavilion however space is in great demand and the deadline for companies wishing to securea a stand booking is 2
nd
September 2011. Visit www.bpfevents.co.uk for more information on Plastindia and how your company can exhibit
as part of the British Pavilion.
5.2 Opportunities for UK Plastics Companies in India:
A BPF Seminar On the 20
th October 2011 in the BPF’s office in
London the BPF is holding a seminar looking in detail at the opportunities for UK plastics companies in India as well as practical advice from leading experts on doing business in India. The one day highly informative seminar will bring together experts who will deliver presentations covering the legal aspects of doing business in India, taxation, getting paid in India as well as the business culture. Thanks to the support of UK Trade & Investment the delegates rates are only £100 for non members and £75 for BPF member companies. Visit www.bpfevents.co.uk for more information on the seminar.
5.3 Trade Mission to India
In addition to organising a British Pavilion at the Plastindia show, the BPF is also inviting delegates from the UK who would like to visit the market to join a Trade Mission to India between the 1
st and 4
th February 2011.
Mission delegates will visit the Plastindia show as an organised group and will have an opportunity to take part in business to business meetings.
Companies wishing to exhibit as part of the British Pavilion, attend the seminar or join the trade mission should visit www.bpfevents.co.uk for more information or contact Justyna
Jaworska at the BPF by telephone on 0207 457 5001 or email [email protected]
Trade Magazines, Trade Associations, Trade Shows and Useful Links (India)
Trade Associations AIPMA - THE ALL INDIA PLASTICS MANUFACTURERS' ASSOCIATION AIPMA House, A-52, Street 1, MIDC, Marol, Andheri (E) - Mumbay 400 093 phone: +91 22 28217324 - fax: +91 22 28352511 - e.mail: [email protected] ALL INDIA PLASTICS INDUSTRIES ASSOCIATION 203 Hansa Tower, 25 Central Market Ashok Vihar - Delhi 110 052 phone: +91 11 27242826 - fax: +91 11 27412595 - e.mail: [email protected] ALL INDIA RUBBER INDUSTRIES ASSOCIATION 601 Pramukh Plaza, 485 Cardinal Gracious Road - Andheri, Mumbai 400 099 phone: +91 22 67103208 - fax: +91 22 67103211 - e.mail: [email protected] GSPMA - GUJARAT STATE PLASTIC MANUFACTURERS ASSOCIATION 7th Fl., Span Trade Center near Paldi Char Rasta, Ellisbridge - Ahmedabad 380 006 phone: +91 79 26578227 - fax: +91 79 26579204 - e.mail: [email protected] ORGANIZATION OF PLASTICS PROCESSORS OF INDIA 404/405 Golden Chambers, Andheri West - Mumbay 400 053 phone: +91 22 56923131 - fax: +91 22 26736736 - e.mail: [email protected] PLASTINDIA FOUNDATION INDIA 209A Suren Road, Off Andheri Kurla Road, Andheri (E) - Mumbay 400 093 phone: +91 22 26832911 - fax: +91 22 26832915/26845861 - [email protected] POLYURETHANE ASSOCIATION OF INDIA 7 Fl., Shakhti Mahal, New 24/Old 41 First Main Road, CIT Colony, Mylapore - Chennai 600 004 phone: +91 44 24995923 - fax: +91 44 24995923 - e.mail: [email protected]
Trade Shows PLASTINDIA February 1-6 2012 New Delhi organizer: PLASTINDIA FOUNDATION-401 Landmark B - Suren Road - Off Andheri Kurla Road - Andheri (E) - Mumbai 400 093 - tel +91 22 8302914 - fax +91 22 6845861 - [email protected] - www.plastindia.org co-organizer: MESSE DÜSSELDORF EUROMAP (European Committee of Machinery Manufacturers for the Plastics and Rubber Industries) Previous edition: February 4-9, 2009, 1.518 exhibitors, 100,000 visitors, 77,604 sqm exhibition area. DIEMOULD INDIA March 8-11 2012 Mumbai organizer: TAGMA - TOOL AND GAUGE MANUFACTURERS ASSOCIATION-A-33, NandJyot Industrial Estate Safed Pool, A.K. Road, Mumbai - 400 072 - [email protected] - www.tagmaindia.org price/sqm: Raw space 170 euro (36 sqm min) - shell scheme package 200 euro (9 sqm min) Previous edition: March 18-21, 2010, 330 exhibitors, 25,400 visitors, 17,500 sqm net exhibition area. INDIA RUBBER EXPO January 22-24 2013 Mumbai organizer: AIRIA - ALL INDIA RUBBER INDUSTRIES ASSOCIATION-No.37, First Floor, Pondicherry Road, Kottur, Chennai 600085 - Tel. +91 44 24474046 - Fax +91 44 24474047 - [email protected] - www.indiarubberexpo.in co-organizer: ALL INDIA RUBBER INDUSTRIES ASSOCIATION support: Reliance price/sqm: Raw space 300 US$ - shell scheme package 325 US$ Previous edition: January 12-22, 2011, 300 exhibitors, 12,000 sqm net exhibition area. TYREXPO INDIA July 9-11 2013 Chennai organizer: ECI INTERNATIONAL LTD.-Speldhurst Business Park, Langton Road, Speldhurst, Kent, TN3 ONR, England - tel +44 1892 863888 - fax +44 1892 863828 - [email protected] - www.eci -international.com Previous edition: July, 5-7, 2011, 80 exhibitors, 3,970 visitors
PLASTIVISION INDIA December 12-16 2013 Mumbai organizer: AIPMA ALL INDIA PLASTICS MANUFACTURERS'ASSOCIATION-AIPMA House - A/52 Street 1 - MIDC - Andheri (E) - Mumbay 400 093 - tel +91 22 28217324 - fax +91 22 28216390 - [email protected] - www.plastivision.org price/sqm: Raw space 250 USD (min 54 sqm) - shell scheme package 275-320 USD (min 9 sqm) note: Previous edition: January 20-24, 2011, 970 exhibitors, 73,000 visitors, 55,000 sqm. Concurrent with INDIAMOLD 2011.
Trade Magazines INDIAN RUBBER JOURNAL Rubber Publications PVT LTD - 53/B Mittal Tower - Nariman Point - Mumbai 400 021 phone: +91 22 22885355 - fax: +91 22 22813390 - e.mail: [email protected] INJECTION MOULDING WORLD C-17 Bhanu Park - J. Adukia Road - Kandivali (W) - 400067 Mumbai phone: +91 22 56072502 - fax: - - e.mail: [email protected] INTELPLAST 113 Sonal Link Industrial Estate - Bldg. 2 - Link Road - Malad (W) - Mumbai 400 064 phone: +91 22 28803977 - fax: +91 22 28819008 - e.mail: [email protected] MODERN PLASTICS & POLYMERS Ruby House - "A" Wing, J. K. Sawant Marg, Dadar West - 400028 Mumbai phone: +91 22 56666819 - fax: +91 22 24302707 - e.mail: [email protected] MODERN PLASTICS INDIA C-17 Bhanu Park - J. Adukia Road, Kandivali (W) - 400067 Mumbai phone: +91 22 56072502 - fax: - - e.mail: [email protected] PLASTIC SANDESH c/o GSPMA - Fl. 7 - Span Trade Center Near Paldi Char Rasta - Ellisbridge - 380006 Ahmedabad - Gujarat phone: +91 79 26578227 - fax: +91 79 26579204 - e.mail: [email protected] PLASTICS NEWS c/o AIPMA - A-52, Road 1, M.I.D.C. - Andheri (East) - 400093 Mumbai phone: +91 22 28217324 - fax: +91 22 28216399 - e.mail: [email protected] PLASTICS PLANET INTERNATIONAL C-17 Bhanu Park - J. Adukia Road, Kandivali (W) - 400067 Mumbai phone: +91 22 56072502 - fax: - - e.mail: [email protected]
PLASTINDIA FOUNDATION 401 Landmark B - Suren Road - Off Andheri - Kurla Road - 400093 Andheri - Mumbai phone: +91 22 26832911 - fax: +91 22 26845861 - e.mail: [email protected] POPULAR PLASTICS & PACKAGING Colour Publications PVT LTD - 126-A Dhuruwadi - A.V. Nagwekar Marg - Prabhadevi - Mumbay 400025 phone: +91 22 24306319 - fax: +91 22 24300601 - e.mail: [email protected] RUBBER ASIA Dhanam House - 29/609 Cheruparampath - P.O. Box 2006 - Kadavanthara - 682020 Cochin phone: +91 484 2315840 - fax: +91 484 2317872 - e.mail: [email protected] RUBBERCHEM REVIEW 700 F - Block P - 700 053 New Alipore - Kolkata phone: +91 33 24007552 - fax: +91 33 24753711 - e.mail: [email protected]
Useful Links Plastindia Foundation www.plastindia.org All India Plastics Manufacturers Association www.aipma.net Indian Plastic Federation www.plasticfederation.org Organization of Plastics Processors of India www.oppindia.org The Plastics Export Promotion Council www.plexconcil.org
GROWTH OF PLASTIC INDUSTRY IN THE COUNTRY
The economic reforms initiated in 1991 brought major changes in the structure of the
domestic petrochemical industry. De-licensing and deregulation allowed the market
forces to determine growth and investment. Liberalization of trade policies and lowering
of tariffs enabled the domestic industry to compete with the global Petrochemicals
industry.
Industrial Policy
The domestic plastic sector has been deregulated and delicensed. Compulsory
licensing is required for the following three items only viz. Hydrocyanic acid and its
derivatives, Isocyanates and Di-isocyanates and Phosgene and its derivatives, some of
which are used in the production of polymers.
100% Foreign Direct Investment (FDI) is allowed through the automatic route without
any sectoral cap. Specific approvals are required from Foreign Investment Promotion
Board (FIPB) in the following three cases:
a) proposals which require compulsory license,
b) when the proposed foreign investment is more than 25% in equity capital of a
company manufacturing items reserved for the small scale sector; and
c) proposals relating to the acquisition of existing shares in an Indian company.
Plastic raw materials products are imported freely under Open General Licence (OGL).
The prices of plastics are market determined without any regulatory control.
Structure of Plastic Industry
The entire chain in the Plastic industry can be classified into (A) manufacturing of
Polymers and is called “upstream” and (B) conversion of polymers into plastic articles
and is known as “downstream”. The upstream Polymer manufacturers have
commissioned globally competitive size plants with imported state-of-art technology
from the world leaders. The upstream petrochemicals industries have also witnessed
consolidation to remain globally competitive.
The downstream plastic processing industry is highly fragmented and consists of micro,
small and medium units. Presently there are about 26,000 registered plastic processing
units of which about 75% are in the small-scale sector. The small-scale sector,
however, accounts for only about 25% of polymer consumption. The industry also
consumes recycled plastic, which constitutes about 30% of total consumption. Plastic
processed articles which were earlier exclusively reserved for Small Scale sector has
now been de-reserved. The Micro Small and Medium Enterprise (MSME) Act 2006
increased the investment in plant and Machinery to Rs 5 crore and the current
exemption on Excise Duty is Rs 1 Crore. This initiative helped the industry to increase
competitiveness and meet the global challenges.
Notwithstanding plastic being one of the important foreign exchange earner for the
country (Exports - US$ 3.512 Billion during 2007-08 and 3.603 Billion in 2008-09), the
share of plastics exports remains at an abysmal 1.2% in the global export market.
Despite the industry’s high growth spanning over a period of over 2 decades and
crossing several milestones, Indian plastics industry is yet to realize its full potential.
The low level of per capita plastics consumption in India is indicative of the massive
growth potential of the plastic industry. Compared to per capita consumption of plastics
in USA at 109 Kg, China at 29 Kg and Brazil at 32 Kg. India at 5.8 Kg is still in nascent
stage. USA consumption has reached saturation level, while China’s higher levels of
consumption are primarily due to exports. India has the advantage of high population
and is expected to maintain high economic growth. This should propel India’s plastics
consumption to new levels in coming years.
The domestic downstream industry comprises of 3 broad segments viz. Injection
molding, Blow molding and Extrusion and caters to the requirements of a wide array of
applications like packaging, automobile, consumer durables, healthcare, etc.
The following table shows the augmentation of processing capacity by the domestic
downstream plastic processing industry during the decade between 2001-02 and 2009-
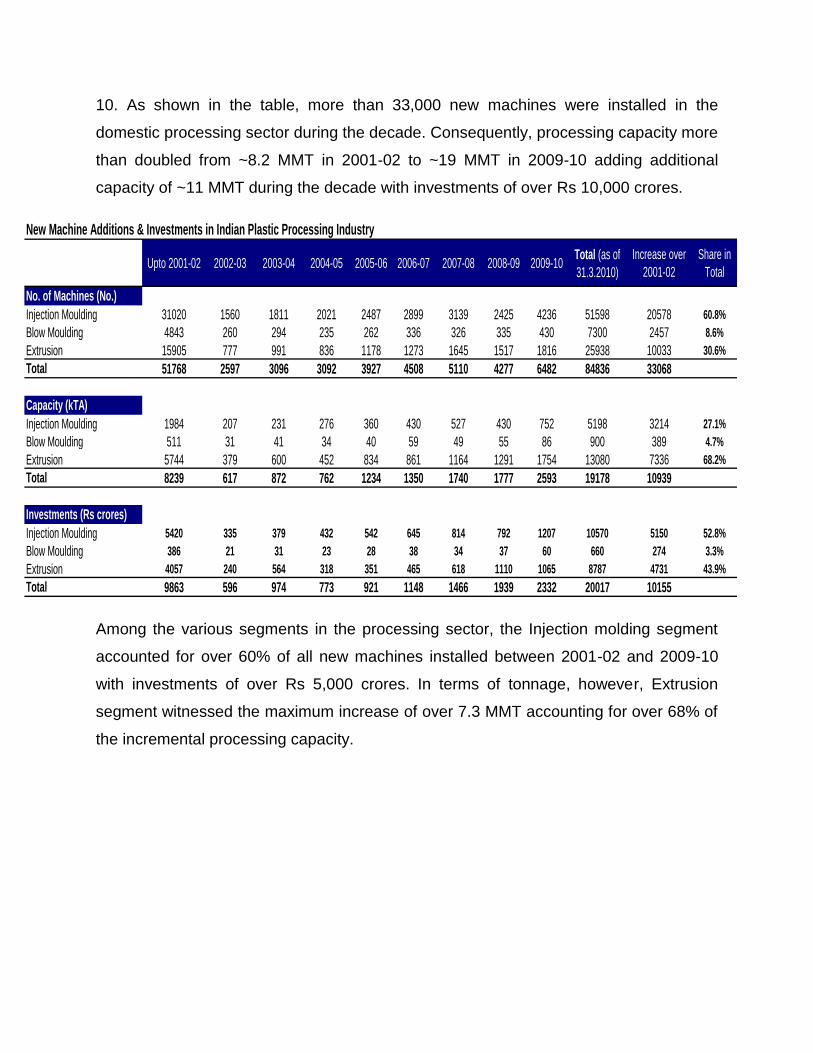
10. As shown in the table, more than 33,000 new machines were installed in the
domestic processing sector during the decade. Consequently, processing capacity more
than doubled from ~8.2 MMT in 2001-02 to ~19 MMT in 2009-10 adding additional
capacity of ~11 MMT during the decade with investments of over Rs 10,000 crores.
New Machine Additions & Investments in Indian Plastic Processing Industry
Upto 2001-02 2002-03 2003-04 2004-05 2005-06 2006-07 2007-08 2008-09 2009-10Total (as of 31.3.2010)
Increase over 2001-02
Share in Total
No. of Machines (No.)Injection Moulding 31020 1560 1811 2021 2487 2899 3139 2425 4236 51598 20578 60.8%Blow Moulding 4843 260 294 235 262 336 326 335 430 7300 2457 8.6%Extrusion 15905 777 991 836 1178 1273 1645 1517 1816 25938 10033 30.6%Total 51768 2597 3096 3092 3927 4508 5110 4277 6482 84836 33068
Capacity (kTA)Injection Moulding 1984 207 231 276 360 430 527 430 752 5198 3214 27.1%Blow Moulding 511 31 41 34 40 59 49 55 86 900 389 4.7%Extrusion 5744 379 600 452 834 861 1164 1291 1754 13080 7336 68.2%Total 8239 617 872 762 1234 1350 1740 1777 2593 19178 10939
Investments (Rs crores)Injection Moulding 5420 335 379 432 542 645 814 792 1207 10570 5150 52.8%Blow Moulding 386 21 31 23 28 38 34 37 60 660 274 3.3%Extrusion 4057 240 564 318 351 465 618 1110 1065 8787 4731 43.9%Total 9863 596 974 773 921 1148 1466 1939 2332 20017 10155
Among the various segments in the processing sector, the Injection molding segment
accounted for over 60% of all new machines installed between 2001-02 and 2009-10
with investments of over Rs 5,000 crores. In terms of tonnage, however, Extrusion
segment witnessed the maximum increase of over 7.3 MMT accounting for over 68% of
the incremental processing capacity.
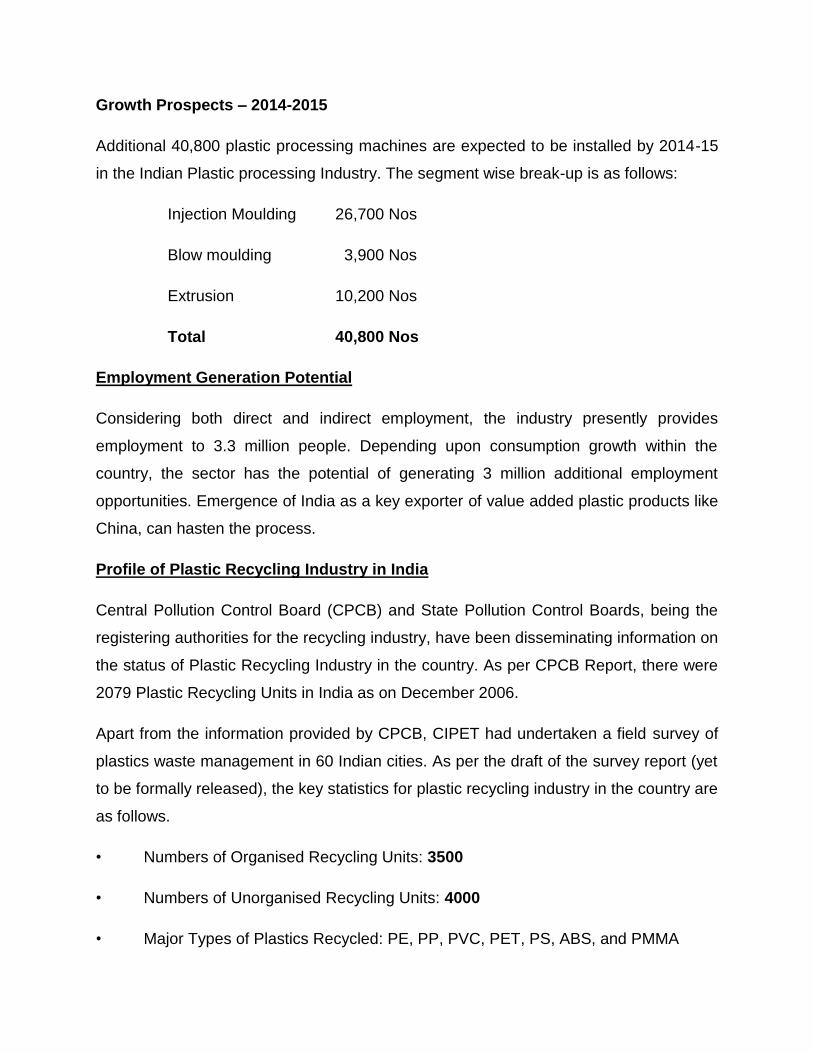
Growth Prospects – 2014-2015
Additional 40,800 plastic processing machines are expected to be installed by 2014-15
in the Indian Plastic processing Industry. The segment wise break-up is as follows:
Injection Moulding 26,700 Nos
Blow moulding 3,900 Nos
Extrusion 10,200 Nos
Total 40,800 Nos
Employment Generation Potential
Considering both direct and indirect employment, the industry presently provides
employment to 3.3 million people. Depending upon consumption growth within the
country, the sector has the potential of generating 3 million additional employment
opportunities. Emergence of India as a key exporter of value added plastic products like
China, can hasten the process.
Profile of Plastic Recycling Industry in India
Central Pollution Control Board (CPCB) and State Pollution Control Boards, being the
registering authorities for the recycling industry, have been disseminating information on
the status of Plastic Recycling Industry in the country. As per CPCB Report, there were
2079 Plastic Recycling Units in India as on December 2006.
Apart from the information provided by CPCB, CIPET had undertaken a field survey of
plastics waste management in 60 Indian cities. As per the draft of the survey report (yet
to be formally released), the key statistics for plastic recycling industry in the country are
as follows.
• Numbers of Organised Recycling Units: 3500
• Numbers of Unorganised Recycling Units: 4000
• Major Types of Plastics Recycled: PE, PP, PVC, PET, PS, ABS, and PMMA
• Manpower directly involved in Plastics Recycling: around 6,00,000
• Manpower indirectly involved in Plastics Recycling: around 10,00,000
• Quantum of Plastics Recycled per annum: 36,00,000 Tons (3.6 Million Tons)
• Estimated Investment in indigenous Plant & Machinery for Recycling Industries
(Mostly Tier – I): about Rs. 150.00 Crores.
• Future growth Trends in Recycling Technology for Plastics:
i) PET Bottle Recycling (Conversion in Flake, Pellets and products like box
strapping, Fibre, injection moulded products, Extruded sheets, etc.
ii) Recycling of Automotive parts and reuse as blend with virgin material.
iii) Recycling of E-Waste (Electrical / Electronic / Computers parts.
iv) Recycling route for Plastics Waste to Fuel.
v) Energy recovery route from plastics waste (incineration).
vi) Mixed waste recycling.
vii) Use of PE&PP waste for Road construction (Concept of bitumen
modification by Polymer)
Status of Polymer (Plastic) Industry
Polymers (Plastic) Demand growth in India
Polymers registered rapid growth in 1970s, 1980s and 1990s growing at the rate of 2-
2.5 times the GDP growth. The huge demand attracted investment, which led to
massive increase in the capacity within the country and thus progressively reduced our
dependence on imports.
In the first decade of the 21st Century (i.e. between 2000-01 and 2009-10), the demand
for plastic raw material got more than doubled from 3.3 Million Metric Ton to 6.8 Million
Metric Tons. The demand witnessed (CARG of 13 %) during 1995-96 to 2000-01could
not be sustained in the first five years of the current decade and the CARG went down
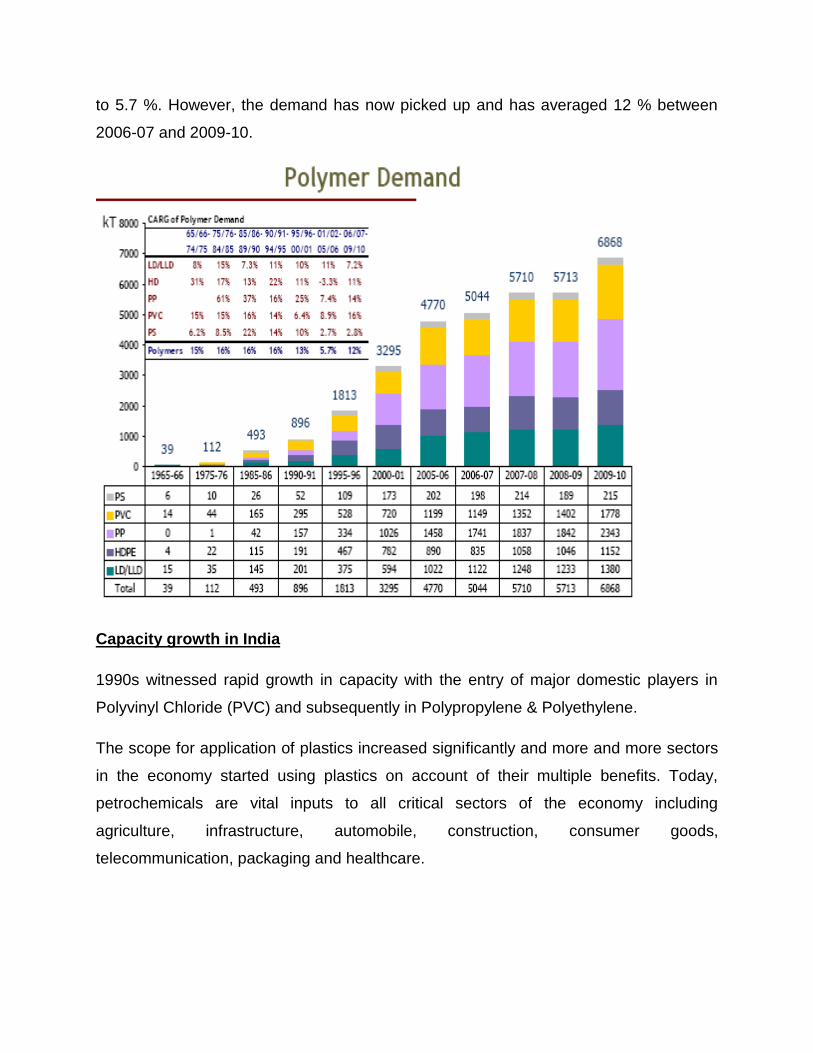
to 5.7 %. However, the demand has now picked up and has averaged 12 % between
2006-07 and 2009-10.
Capacity growth in India
1990s witnessed rapid growth in capacity with the entry of major domestic players in
Polyvinyl Chloride (PVC) and subsequently in Polypropylene & Polyethylene.
The scope for application of plastics increased significantly and more and more sectors
in the economy started using plastics on account of their multiple benefits. Today,
petrochemicals are vital inputs to all critical sectors of the economy including
agriculture, infrastructure, automobile, construction, consumer goods,
telecommunication, packaging and healthcare.
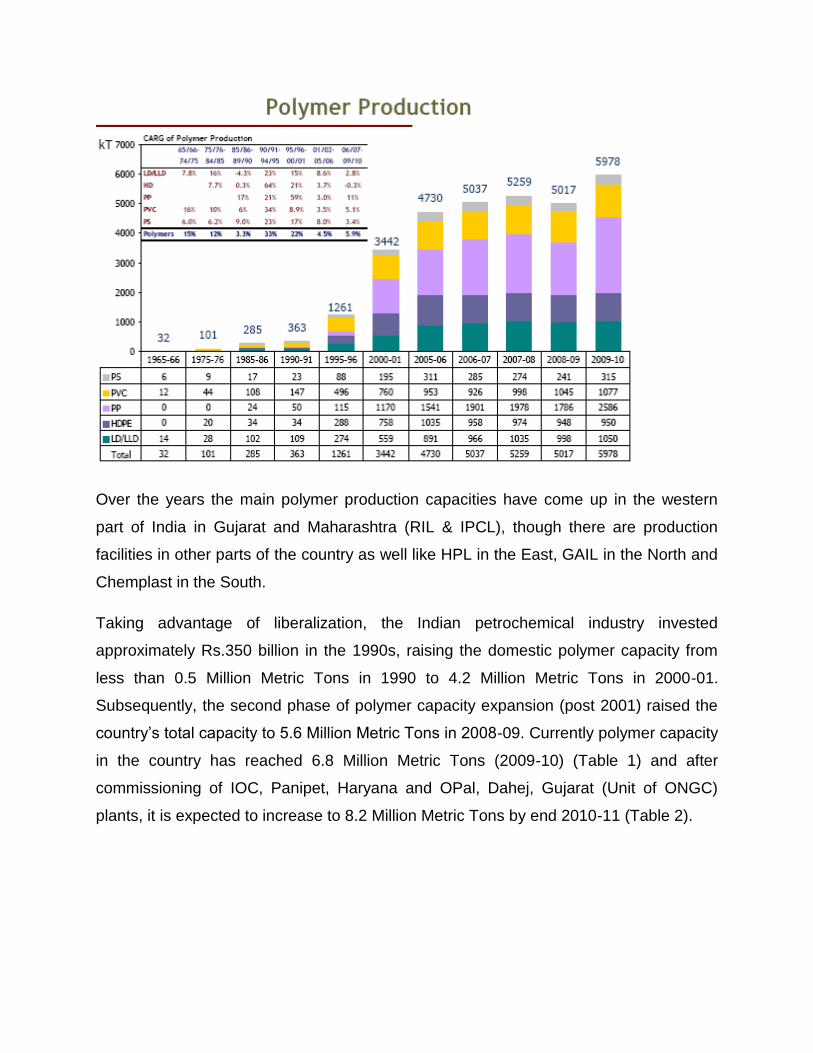
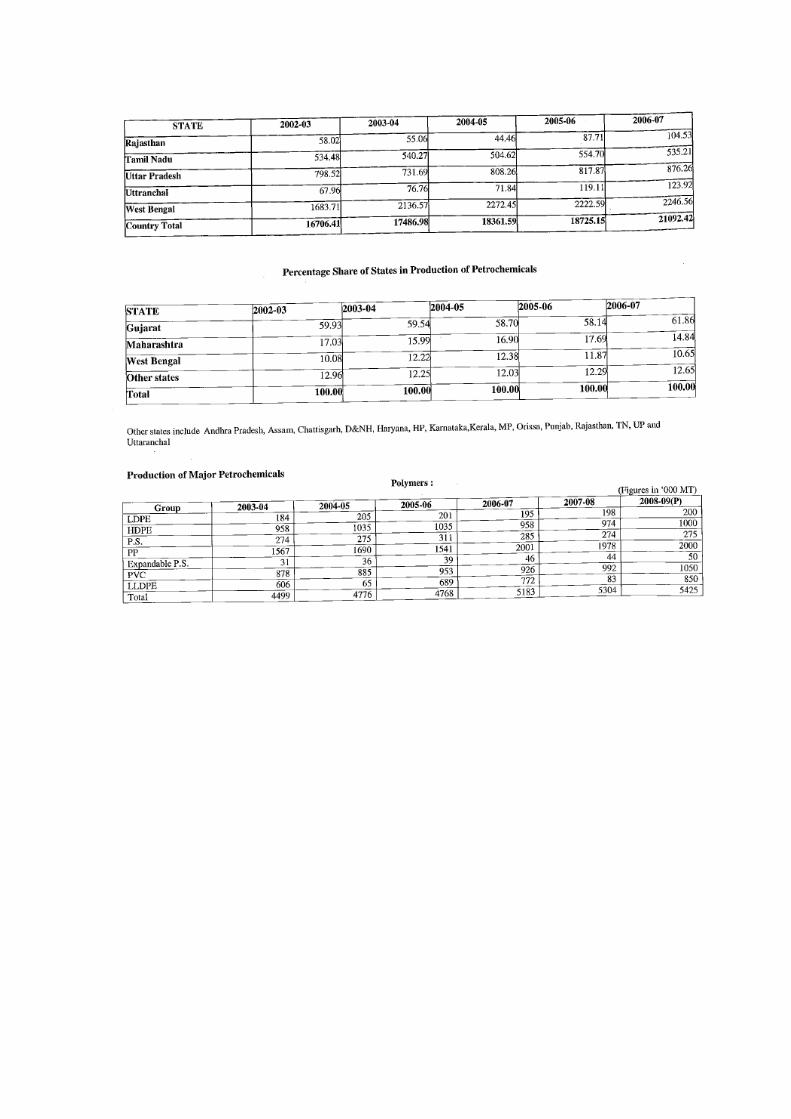
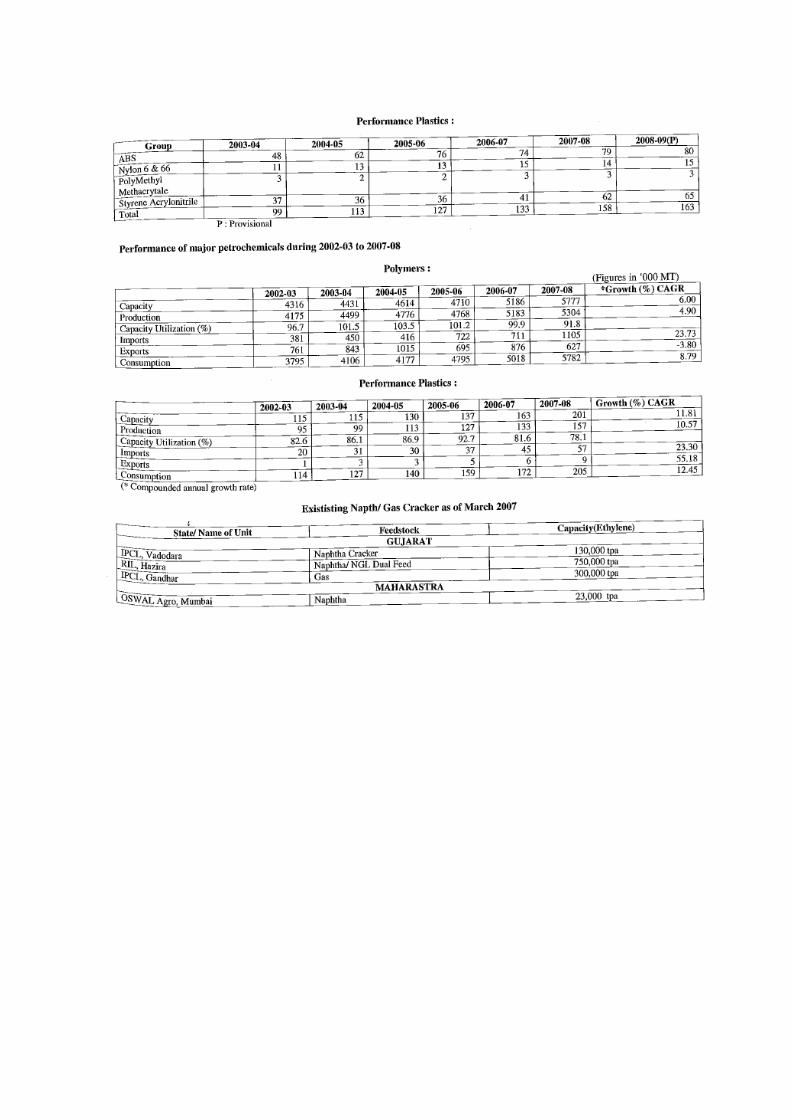
Over the years the main polymer production capacities have come up in the western
part of India in Gujarat and Maharashtra (RIL & IPCL), though there are production
facilities in other parts of the country as well like HPL in the East, GAIL in the North and
Chemplast in the South.
Taking advantage of liberalization, the Indian petrochemical industry invested
approximately Rs.350 billion in the 1990s, raising the domestic polymer capacity from
less than 0.5 Million Metric Tons in 1990 to 4.2 Million Metric Tons in 2000-01.
Subsequently, the second phase of polymer capacity expansion (post 2001) raised the
country’s total capacity to 5.6 Million Metric Tons in 2008-09. Currently polymer capacity
in the country has reached 6.8 Million Metric Tons (2009-10) (Table 1) and after
commissioning of IOC, Panipet, Haryana and OPal, Dahej, Gujarat (Unit of ONGC)
plants, it is expected to increase to 8.2 Million Metric Tons by end 2010-11 (Table 2).
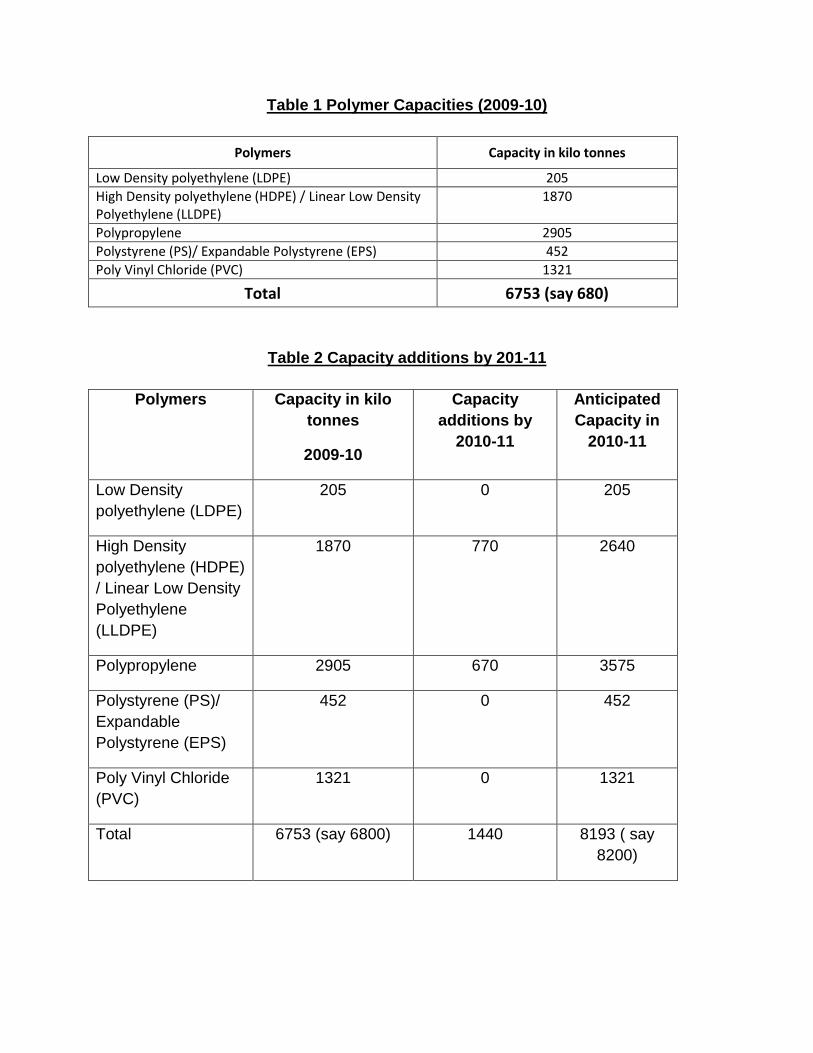
Table 1 Polymer Capacities (2009-10)
Polymers Capacity in kilo tonnes
Low Density polyethylene (LDPE) 205
High Density polyethylene (HDPE) / Linear Low Density Polyethylene (LLDPE)
1870
Polypropylene 2905
Polystyrene (PS)/ Expandable Polystyrene (EPS) 452
Poly Vinyl Chloride (PVC) 1321
Total 6753 (say 680)
Table 2 Capacity additions by 201-11
Polymers Capacity in kilo tonnes
2009-10
Capacity additions by
2010-11
Anticipated Capacity in
2010-11
Low Density polyethylene (LDPE)
205 0 205
High Density polyethylene (HDPE) / Linear Low Density Polyethylene (LLDPE)
1870 770 2640
Polypropylene 2905 670 3575
Polystyrene (PS)/ Expandable Polystyrene (EPS)
452 0 452
Poly Vinyl Chloride (PVC)
1321 0 1321
Total 6753 (say 6800) 1440 8193 ( say 8200)
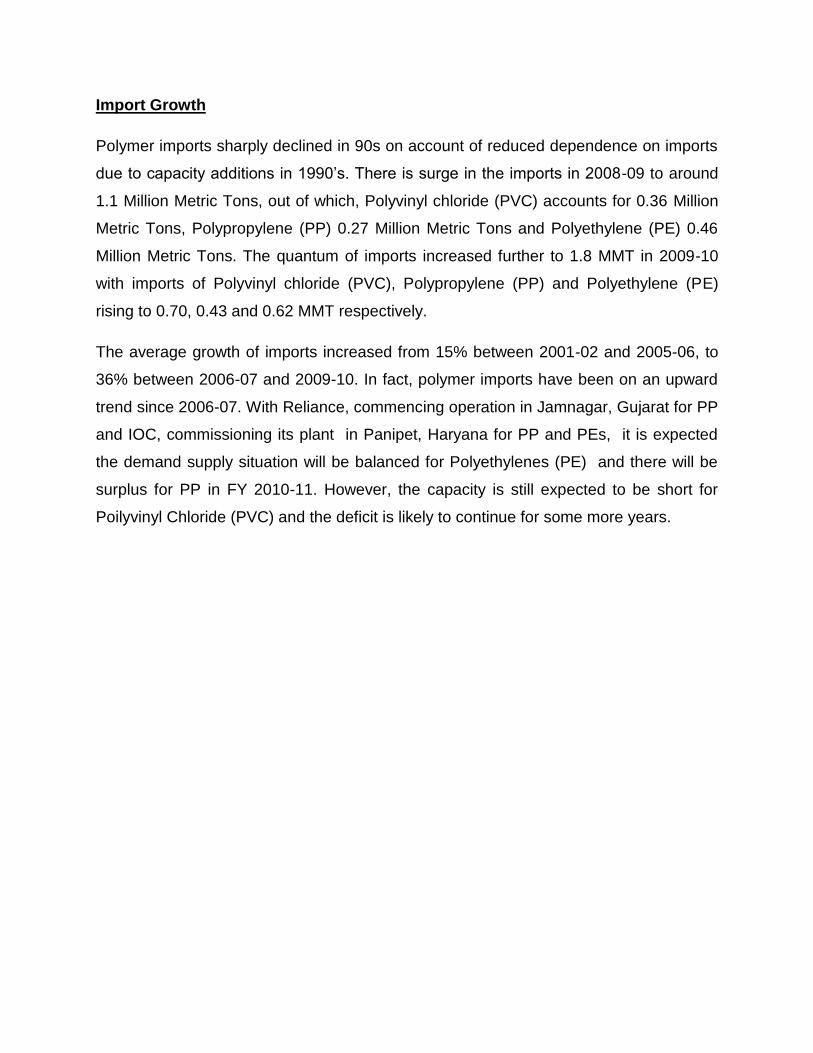
Import Growth
Polymer imports sharply declined in 90s on account of reduced dependence on imports
due to capacity additions in 1990’s. There is surge in the imports in 2008-09 to around
1.1 Million Metric Tons, out of which, Polyvinyl chloride (PVC) accounts for 0.36 Million
Metric Tons, Polypropylene (PP) 0.27 Million Metric Tons and Polyethylene (PE) 0.46
Million Metric Tons. The quantum of imports increased further to 1.8 MMT in 2009-10
with imports of Polyvinyl chloride (PVC), Polypropylene (PP) and Polyethylene (PE)
rising to 0.70, 0.43 and 0.62 MMT respectively.
The average growth of imports increased from 15% between 2001-02 and 2005-06, to
36% between 2006-07 and 2009-10. In fact, polymer imports have been on an upward
trend since 2006-07. With Reliance, commencing operation in Jamnagar, Gujarat for PP
and IOC, commissioning its plant in Panipet, Haryana for PP and PEs, it is expected
the demand supply situation will be balanced for Polyethylenes (PE) and there will be
surplus for PP in FY 2010-11. However, the capacity is still expected to be short for
Poilyvinyl Chloride (PVC) and the deficit is likely to continue for some more years.
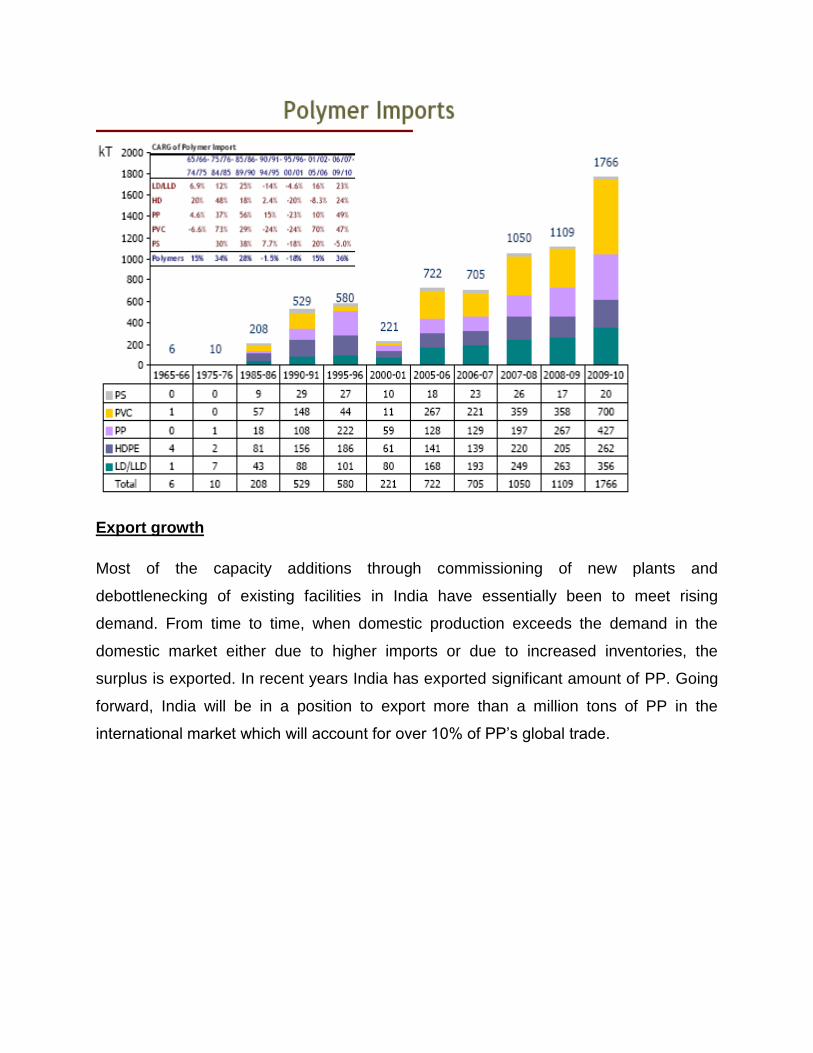
Export growth
Most of the capacity additions through commissioning of new plants and
debottlenecking of existing facilities in India have essentially been to meet rising
demand. From time to time, when domestic production exceeds the demand in the
domestic market either due to higher imports or due to increased inventories, the
surplus is exported. In recent years India has exported significant amount of PP. Going
forward, India will be in a position to export more than a million tons of PP in the
international market which will account for over 10% of PP’s global trade.
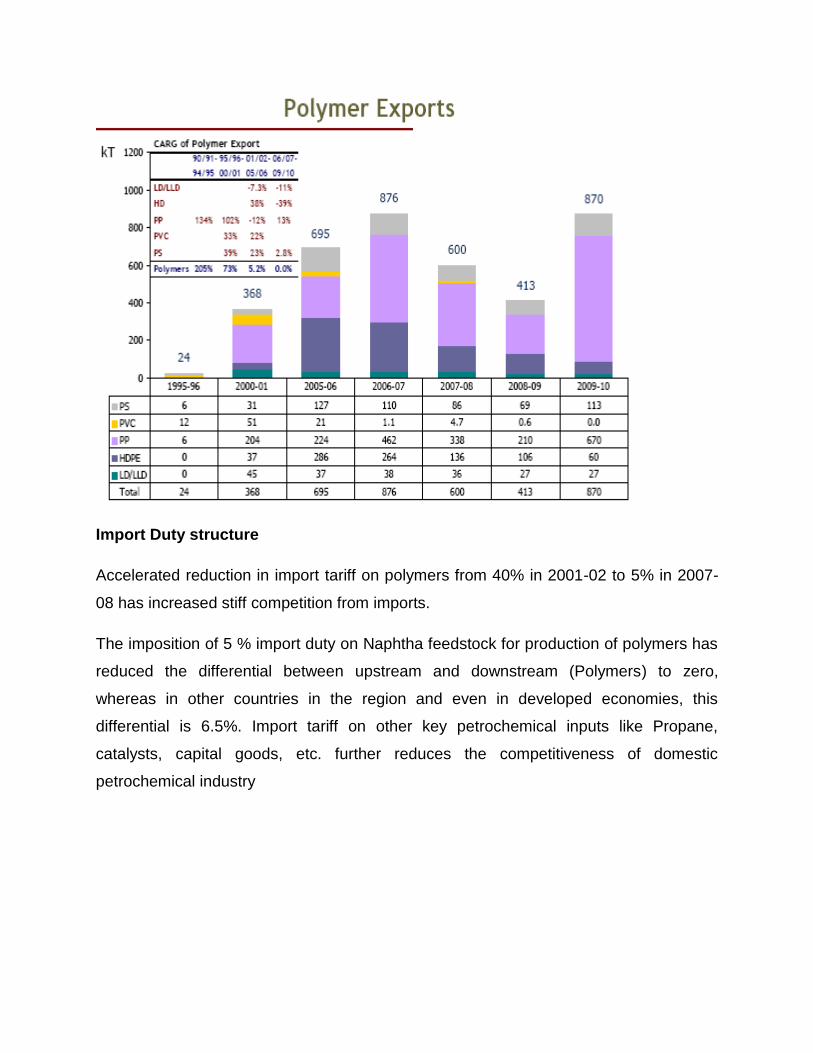
Import Duty structure
Accelerated reduction in import tariff on polymers from 40% in 2001-02 to 5% in 2007-
08 has increased stiff competition from imports.
The imposition of 5 % import duty on Naphtha feedstock for production of polymers has
reduced the differential between upstream and downstream (Polymers) to zero,
whereas in other countries in the region and even in developed economies, this
differential is 6.5%. Import tariff on other key petrochemical inputs like Propane,
catalysts, capital goods, etc. further reduces the competitiveness of domestic
petrochemical industry
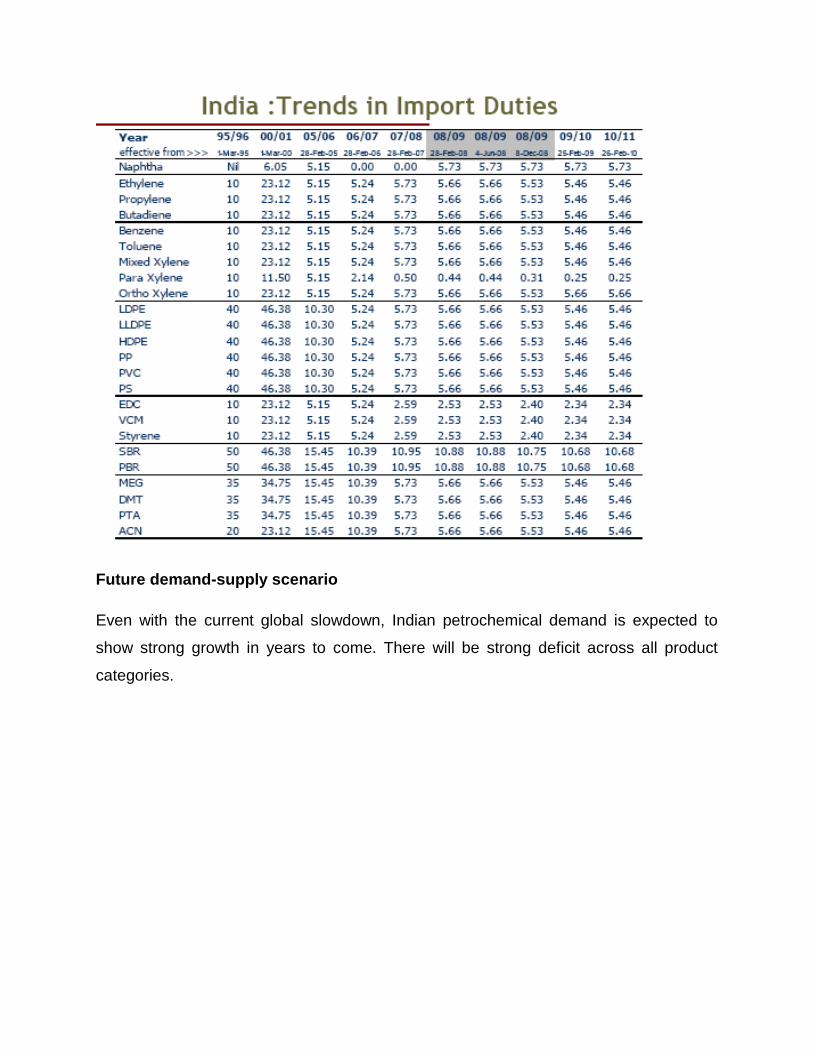
Future demand-supply scenario
Even with the current global slowdown, Indian petrochemical demand is expected to
show strong growth in years to come. There will be strong deficit across all product
categories.
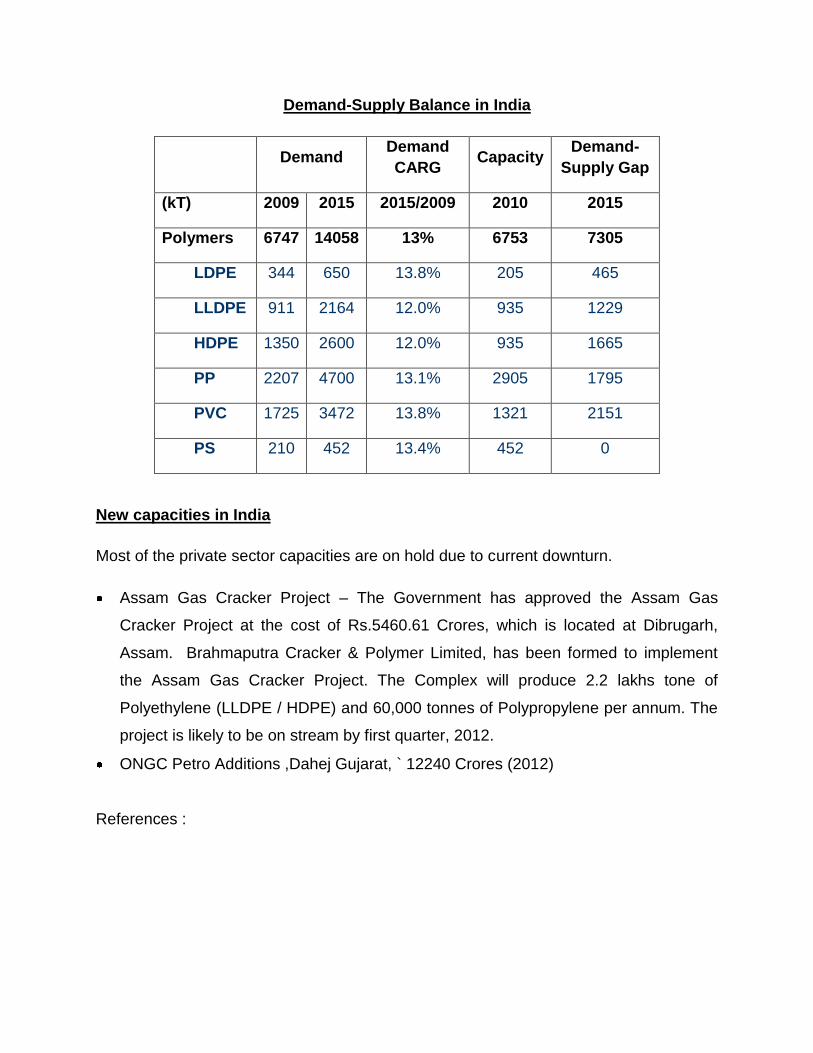
Demand-Supply Balance in India
Demand Demand CARG
Capacity Demand-
Supply Gap
(kT) 2009 2015 2015/2009 2010 2015
Polymers 6747 14058 13% 6753 7305
LDPE 344 650 13.8% 205 465
LLDPE 911 2164 12.0% 935 1229
HDPE 1350 2600 12.0% 935 1665
PP 2207 4700 13.1% 2905 1795
PVC 1725 3472 13.8% 1321 2151
PS 210 452 13.4% 452 0
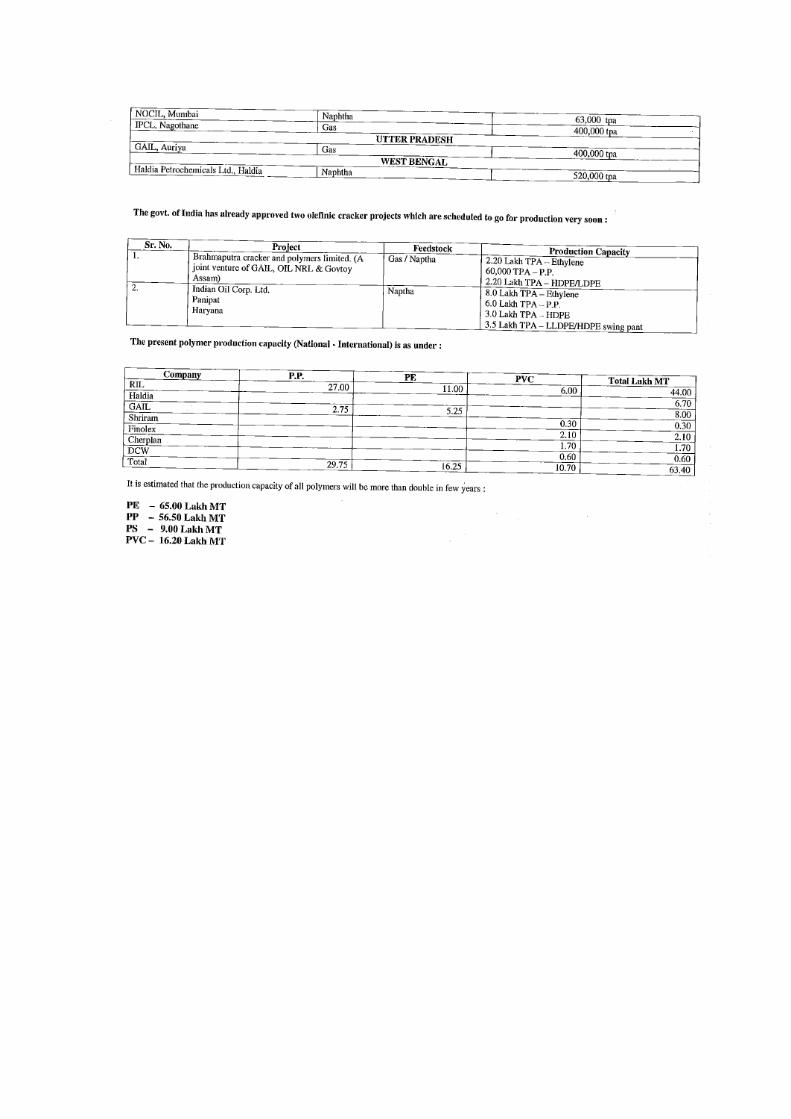
New capacities in India
Most of the private sector capacities are on hold due to current downturn.
Assam Gas Cracker Project – The Government has approved the Assam Gas
Cracker Project at the cost of Rs.5460.61 Crores, which is located at Dibrugarh,
Assam. Brahmaputra Cracker & Polymer Limited, has been formed to implement
the Assam Gas Cracker Project. The Complex will produce 2.2 lakhs tone of
Polyethylene (LLDPE / HDPE) and 60,000 tonnes of Polypropylene per annum. The
project is likely to be on stream by first quarter, 2012.
ONGC Petro Additions ,Dahej Gujarat, ` 12240 Crores (2012)
References :
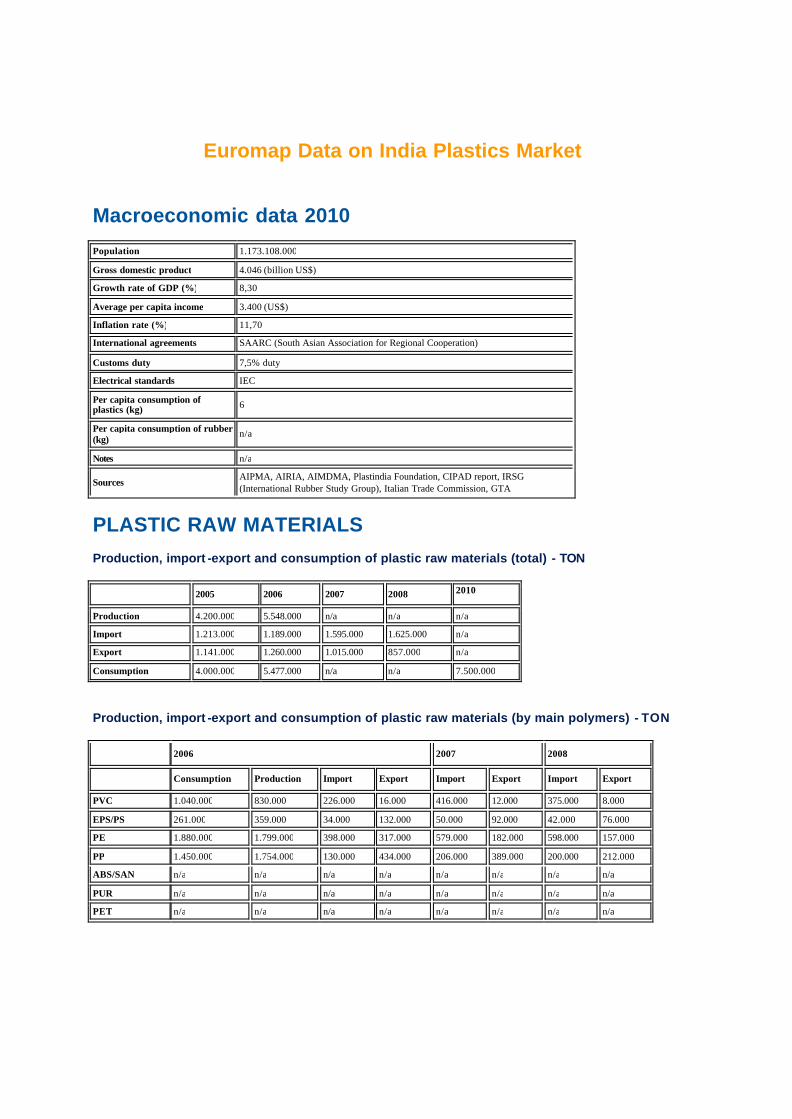
Euromap Data on India Plastics Market
Macroeconomic data 2010
Population 1.173.108.000 Gross domestic product 4.046 (billion US$) Growth rate of GDP (%) 8,30 Average per capita income 3.400 (US$) Inflation rate (%) 11,70 International agreements SAARC (South Asian Association for Regional Cooperation) Customs duty 7,5% duty Electrical standards IEC Per capita consumption of plastics (kg) 6
Per capita consumption of rubber (kg) n/a
Notes n/a
Sources AIPMA, AIRIA, AIMDMA, Plastindia Foundation, CIPAD report, IRSG (International Rubber Study Group), Italian Trade Commission, GTA
PLASTIC RAW MATERIALS Production, import -export and consumption of plastic raw materials (total) - TON
2005 2006 2007 2008 2010
Production 4.200.000 5.548.000 n/a n/a n/a Import 1.213.000 1.189.000 1.595.000 1.625.000 n/a Export 1.141.000 1.260.000 1.015.000 857.000 n/a Consumption 4.000.000 5.477.000 n/a n/a 7.500.000 Production, import -export and consumption of plastic raw materials (by main polymers) - TON
2006 2007 2008
Consumption Production Import Export Import Export Import Export PVC 1.040.000 830.000 226.000 16.000 416.000 12.000 375.000 8.000 EPS/PS 261.000 359.000 34.000 132.000 50.000 92.000 42.000 76.000 PE 1.880.000 1.799.000 398.000 317.000 579.000 182.000 598.000 157.000 PP 1.450.000 1.754.000 130.000 434.000 206.000 389.000 200.000 212.000 ABS/SAN n/a n/a n/a n/a n/a n/a n/a n/a PUR n/a n/a n/a n/a n/a n/a n/a n/a PET n/a n/a n/a n/a n/a n/a n/a n/a
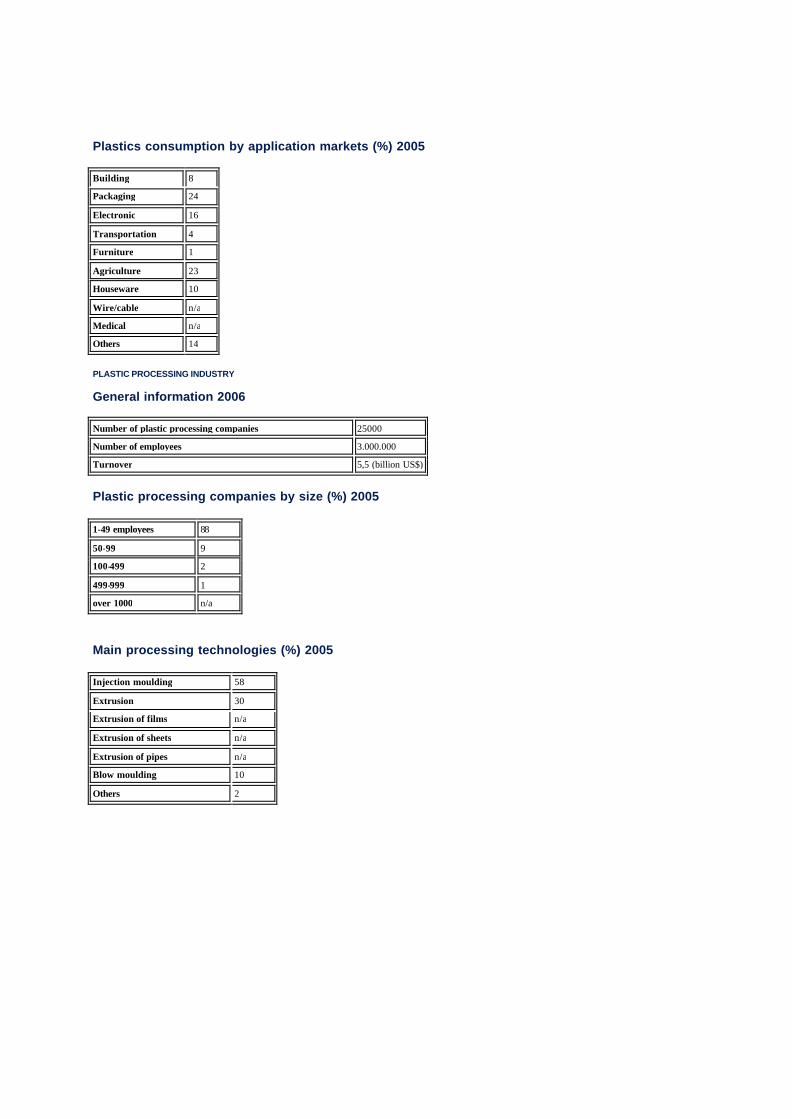
Plastics consumption by application markets (%) 2005
Building 8 Packaging 24 Electronic 16 Transportation 4 Furniture 1 Agriculture 23 Houseware 10 Wire/cable n/a Medical n/a Others 14 PLASTIC PROCESSING INDUSTRY
General information 2006
Number of plastic processing companies 25000 Number of employees 3.000.000 Turnover 5,5 (billion US$) Plastic processing companies by size (%) 2005
1-49 employees 88 50-99 9 100-499 2 499-999 1 over 1000 n/a Main processing technologies (%) 2005
Injection moulding 58 Extrusion 30 Extrusion of films n/a Extrusion of sheets n/a Extrusion of pipes n/a Blow moulding 10 Others 2
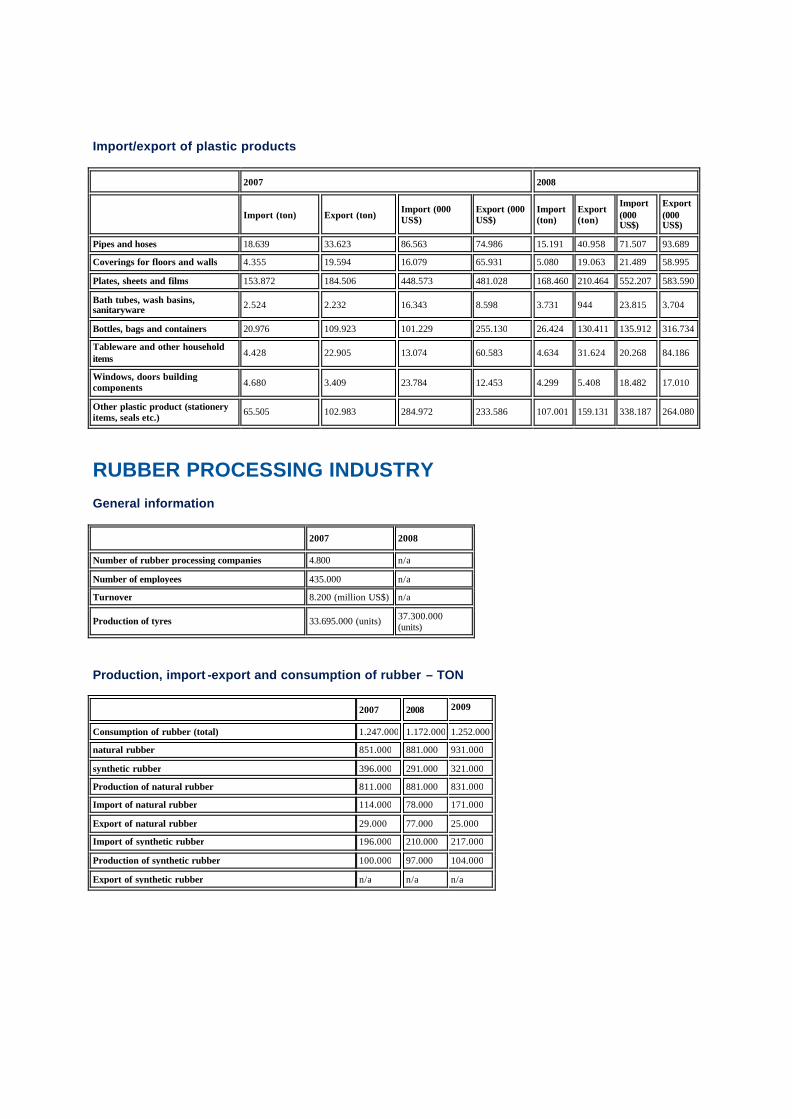
Import/export of plastic products
2007 2008
Import (ton) Export (ton) Import (000 US$)
Export (000 US$)
Import (ton)
Export (ton)
Import (000 US$)
Export (000 US$)
Pipes and hoses 18.639 33.623 86.563 74.986 15.191 40.958 71.507 93.689 Coverings for floors and walls 4.355 19.594 16.079 65.931 5.080 19.063 21.489 58.995 Plates, sheets and films 153.872 184.506 448.573 481.028 168.460 210.464 552.207 583.590 Bath tubes, wash basins, sanitaryware 2.524 2.232 16.343 8.598 3.731 944 23.815 3.704
Bottles, bags and containers 20.976 109.923 101.229 255.130 26.424 130.411 135.912 316.734 Tableware and other household items 4.428 22.905 13.074 60.583 4.634 31.624 20.268 84.186
Windows, doors building components 4.680 3.409 23.784 12.453 4.299 5.408 18.482 17.010
Other plastic product (stationery items, seals etc.) 65.505 102.983 284.972 233.586 107.001 159.131 338.187 264.080
RUBBER PROCESSING INDUSTRY General information
2007 2008 Number of rubber processing companies 4.800 n/a Number of employees 435.000 n/a Turnover 8.200 (million US$) n/a
Production of tyres 33.695.000 (units) 37.300.000 (units)
Production, import -export and consumption of rubber – TON
2007 2008 2009
Consumption of rubber (total) 1.247.000 1.172.000 1.252.000 natural rubber 851.000 881.000 931.000 synthetic rubber 396.000 291.000 321.000 Production of natural rubber 811.000 881.000 831.000 Import of natural rubber 114.000 78.000 171.000 Export of natural rubber 29.000 77.000 25.000 Import of synthetic rubber 196.000 210.000 217.000 Production of synthetic rubber 100.000 97.000 104.000 Export of synthetic rubber n/a n/a n/a
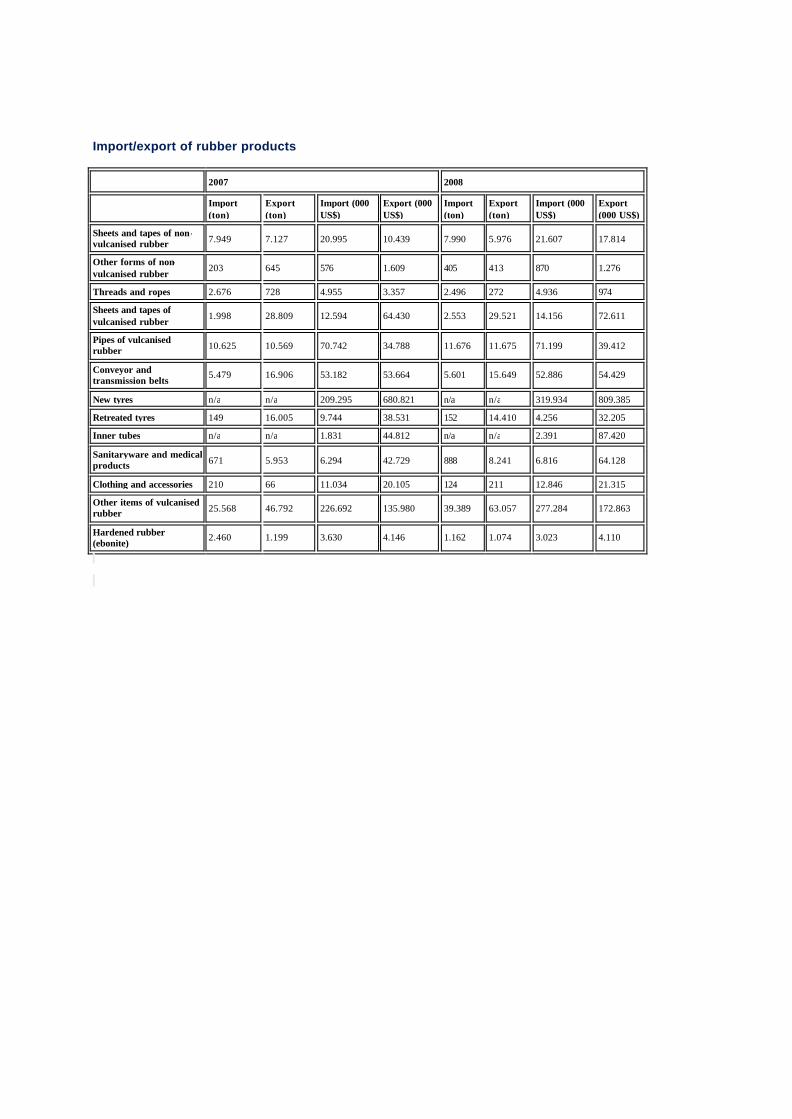
Import/export of rubber products
2007 2008
Import (ton)
Export (ton)
Import (000 US$)
Export (000 US$)
Import (ton)
Export (ton)
Import (000 US$)
Export (000 US$)
Sheets and tapes of non-vulcanised rubber 7.949 7.127 20.995 10.439 7.990 5.976 21.607 17.814 Other forms of non-vulcanised rubber 203 645 576 1.609 405 413 870 1.276
Threads and ropes 2.676 728 4.955 3.357 2.496 272 4.936 974 Sheets and tapes of vulcanised rubber 1.998 28.809 12.594 64.430 2.553 29.521 14.156 72.611
Pipes of vulcanised rubber 10.625 10.569 70.742 34.788 11.676 11.675 71.199 39.412
Conveyor and transmission belts 5.479 16.906 53.182 53.664 5.601 15.649 52.886 54.429
New tyres n/a n/a 209.295 680.821 n/a n/a 319.934 809.385 Retreated tyres 149 16.005 9.744 38.531 152 14.410 4.256 32.205 Inner tubes n/a n/a 1.831 44.812 n/a n/a 2.391 87.420 Sanitaryware and medical products 671 5.953 6.294 42.729 888 8.241 6.816 64.128
Clothing and accessories 210 66 11.034 20.105 124 211 12.846 21.315 Other items of vulcanised rubber 25.568 46.792 226.692 135.980 39.389 63.057 277.284 172.863
Hardened rubber (ebonite) 2.460 1.199 3.630 4.146 1.162 1.074 3.023 4.110
Overview of the Indian Plastics Industry (Source: CIPET)
Over the years, India has made significant progress in the industrial world with healthy economic growth. On purchase power parity basis, it is one of the top five global economics and is expected to be the third largest by the turn of this decade. Plastics, one of the fastest growing industries in India, have a vital role to play. Indian Plastics Industry is expanding at a phenomenal pace. Major international companies from various sectors such as automobiles, electronics, telecommunications, food processing, packing, healthcare etc. have set-up large manufacturing bases in India. Therefore, demand for plastics is rapidly increasing and soon India will emerge as one of the fastest growing markets in the world.
The next two decades are expected to offe r unprecedented opportunities for the plastic industry in India. This would necessitate industry initiatives to foster investments, grow the market, upgrade quality standards, enhance global participation, encourage Indian industry, to adopt and adapt to world class technology and manufacturing practices
Despite instability in International prices of polymer materials in 2006 - 07, plastics industry in the country has consolidated its performance by consuming about 5.0 million tonnes of polymers, as compared to Chinese consumption of about 30 million tonnes in 2007. Indian plastics industries are enthusiastic about the acceleration of the growth engine in the next 3 to 5 years due to capacity expansion of existing petrochemical complexes and setting up of new crackers in the country currently. Reliance Industries Ltd., (RIL) has about 75% share of Indian Petrochemical Cracker capacity, followed by medium sized capacity of Gas Authority of India Ltd. (GAIL) and Haldia Petrochemicals Ltd., (HPL). RIL has ambitious plan of augmenting its PP capacity from 1010 KT to 2600 KT by the year 2010. Indian Oil Corporation (IOC) has also planned an 800 K tonnes naphtha cracker at Panipat at an investment of Rs.6300 crores to produce 800 KT of PE and PP each at Panipat. IOC would also be setting up a production capacity 150 KT PP at Chennai by year 2009 as well as styrene, which is not being produced in India. These positive factors of availability of polymeric materials would infallibly be harbinger in accelerating the growth of plastics sector in the near future. The capacities of current petrochemicals producers are given in Table – 1
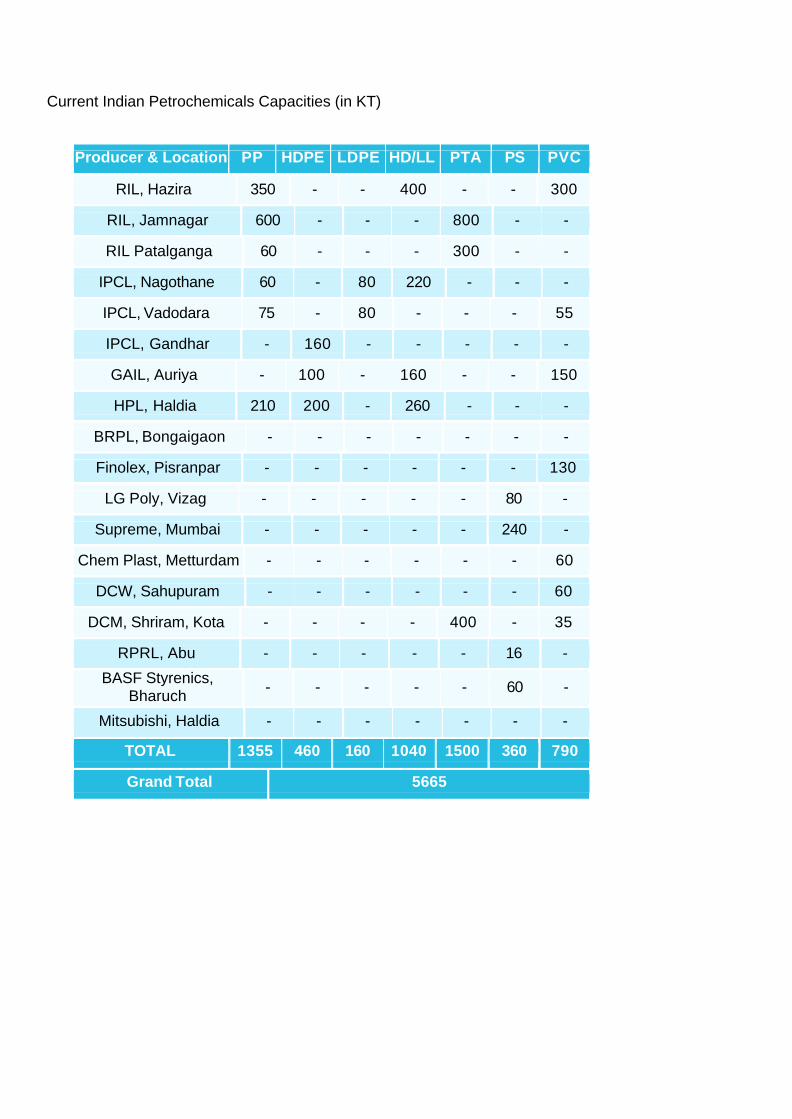
Current Indian Petrochemicals Capacities (in KT)
Producer & Location PP HDPE
LDPE
HD/LL
PTA
PS
PVC
RIL, Hazira 350 - - 400 - - 300
RIL, Jamnagar 600 - - - 800 - -
RIL Patalganga 60 - - - 300 - -
IPCL, Nagothane 60 - 80 220 - - -
IPCL, Vadodara 75 - 80 - - - 55
IPCL, Gandhar - 160 - - - - -
GAIL, Auriya - 100 - 160 - - 150
HPL, Haldia 210 200 - 260 - - -
BRPL, Bongaigaon - - - - - - -
Finolex, Pisranpar - - - - - - 130
LG Poly, Vizag - - - - - 80 -
Supreme, Mumbai - - - - - 240 -
Chem Plast, Metturdam - - - - - - 60
DCW, Sahupuram - - - - - - 60
DCM, Shriram, Kota - - - - 400 - 35
RPRL, Abu - - - - - 16 -
BASF Styrenics, Bharuch - - - - - 60 -
Mitsubishi, Haldia
- -
- - - - -
TOTAL 1355 460
160 1040
1500
360
790
Grand Total
5665
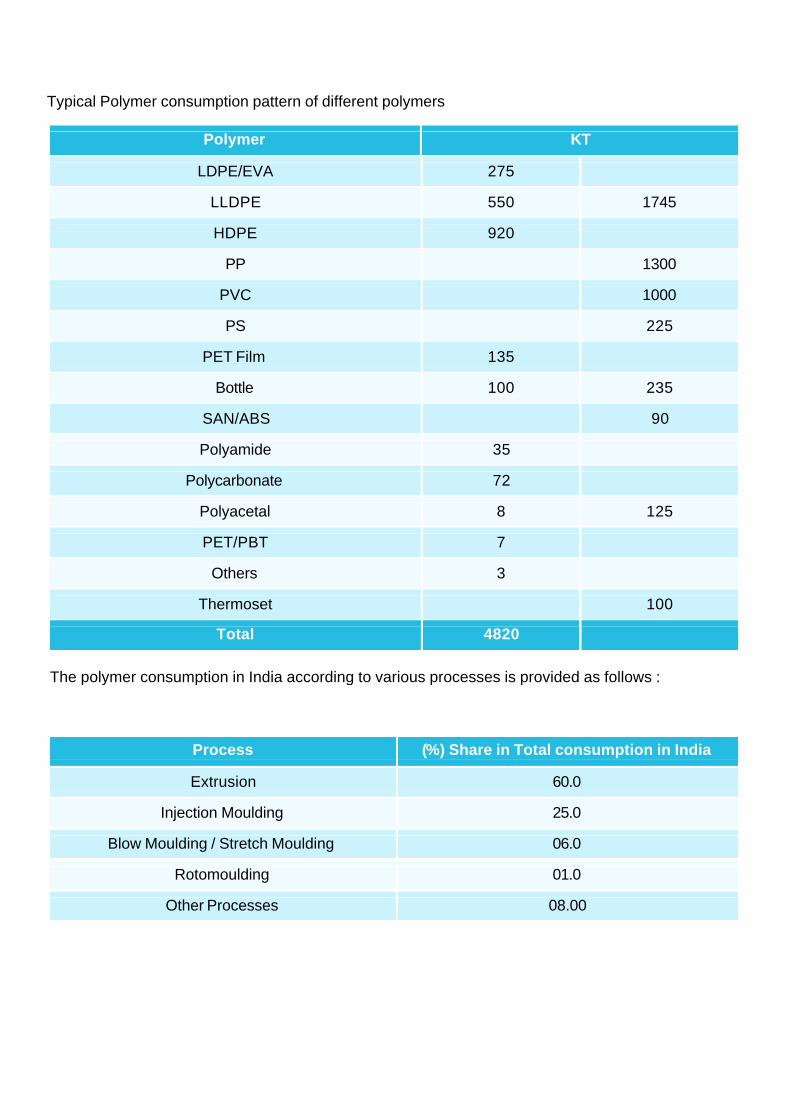
Typical Polymer consumption pattern of different polymers
Polymer
KT
LDPE/EVA 275
LLDPE 550 1745
HDPE 920
PP
1300
PVC
1000
PS
225
PET Film 135
Bottle 100 235
SAN/ABS
90
Polyamide 35
Polycarbonate 72
Polyacetal 8 125
PET/PBT 7
Others 3
Thermoset
100
Total
4820
The polymer consumption in India according to various processes is provided as follows :
Process
(%) Share in Total consumption in India
Extrusion 60.0
Injection Moulding 25.0
Blow Moulding / Stretch Moulding 06.0
Rotomoulding 01.0
Other Processes 08.00
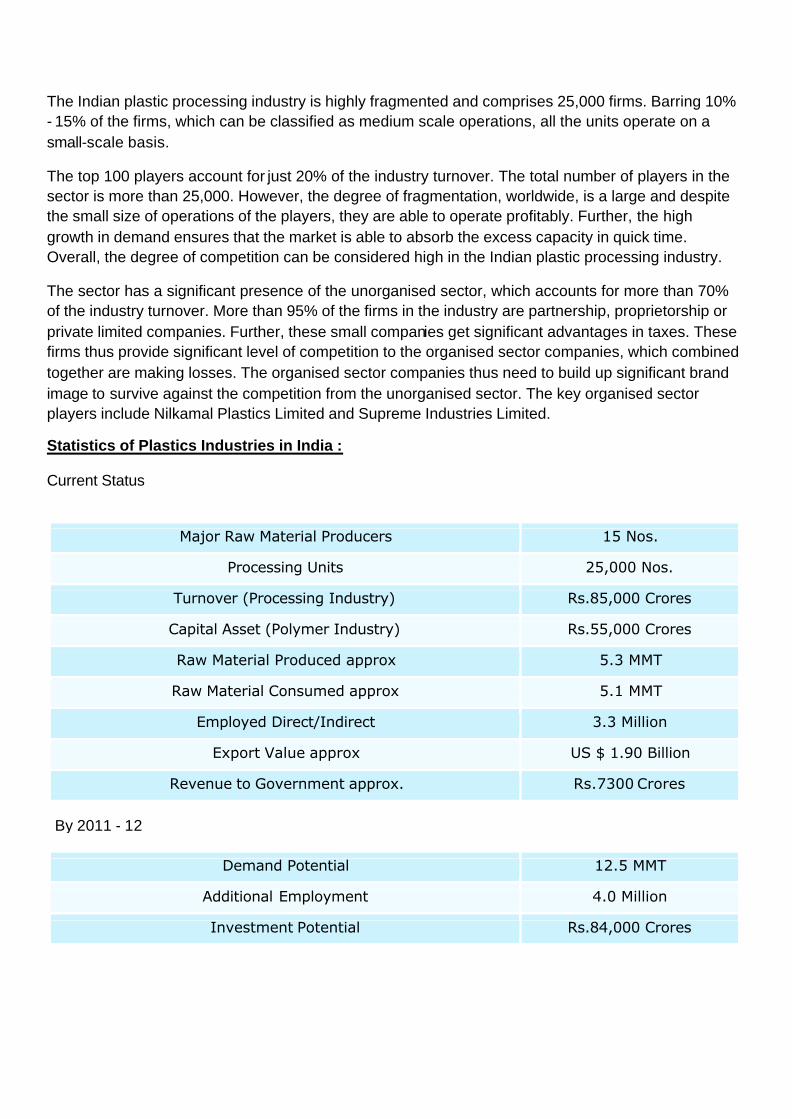
The Indian plastic processing industry is highly fragmented and comprises 25,000 firms. Barring 10% - 15% of the firms, which can be classified as medium scale operations, all the units operate on a small-scale basis.
The top 100 players account for just 20% of the industry turnover. The total number of players in the sector is more than 25,000. However, the degree of fragmentation, worldwide, is a large and despite the small size of operations of the players, they are able to operate profitably. Further, the high growth in demand ensures that the market is able to absorb the excess capacity in quick time. Overall, the degree of competition can be considered high in the Indian plastic processing industry.
The sector has a significant presence of the unorganised sector, which accounts for more than 70% of the industry turnover. More than 95% of the firms in the industry are partnership, proprietorship or private limited companies. Further, these small companies get significant advantages in taxes. These firms thus provide significant level of competition to the organised sector companies, which combined together are making losses. The organised sector companies thus need to build up significant brand image to survive against the competition from the unorganised sector. The key organised sector players include Nilkamal Plastics Limited and Supreme Industries Limited.
Statistics of Plastics Industries in India :
Current Status
Major Raw Material Producers 15 Nos.
Processing Units 25,000 Nos.
Turnover (Processing Industry) Rs.85,000 Crores
Capital Asset (Polymer Industry) Rs.55,000 Crores
Raw Material Produced approx 5.3 MMT
Raw Material Consumed approx 5.1 MMT
Employed Direct/Indirect 3.3 Million
Export Value approx US $ 1.90 Billion
Revenue to Government approx. Rs.7300 Crores
By 2011 - 12 Demand Potential 12.5 MMT
Additional Employment 4.0 Million
Investment Potential Rs.84,000 Crores
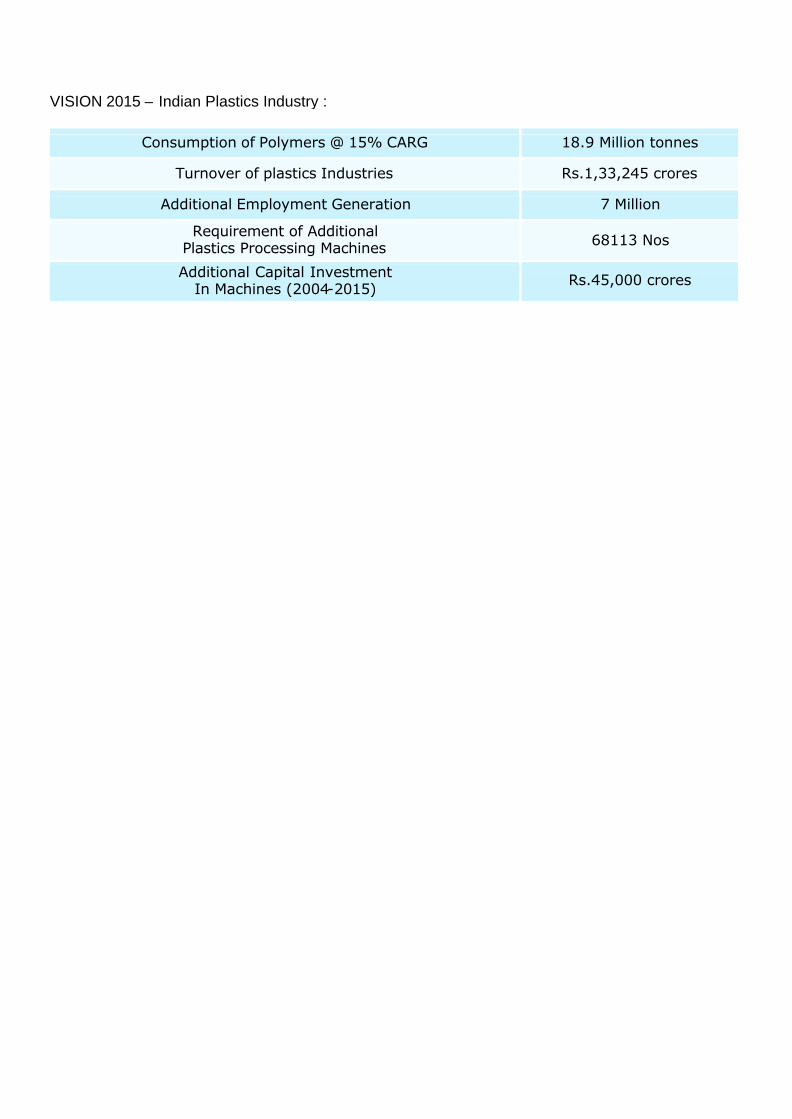
VISION 2015 – Indian Plastics Industry :
Consumption of Polymers @ 15% CARG 18.9 Million tonnes
Turnover of plastics Industries Rs.1,33,245 crores
Additional Employment Generation 7 Million
Requirement of Additional Plastics Processing Machines 68113 Nos
Additional Capital Investment In Machines (2004-2015) Rs.45,000 crores
Turnover of Indian plastic industry to
touch Rs 1,000 bln in 2012 (Taken From Plastemart - 13-9-2011)
The Plastic industry in India symbolizes a promising industry and is creating new employment opportunities for the people of India. The per capita consumption of plastic products in India is growing and is moving towards 2.5 times GDP growth. This potentiality of the market will surely actuate the entrepreneurs to invest in this industry. The Government of India is trying to set up the economic reforms to elevate and boost the plastic industry by joint venturing, foreign investments and entrepreneurs are trying to provide high quality plastic products, so that it becomes a booming industry. The overall turnover of the plastics processing industry that currently stands at Rs.85,000 crore is expected to touch Rs. 100,000 crore in the year 2012 on the basis of the expected growth of the demand potential to 12.50 mln tons from the current 9 mln tons. The number of processing units from the current 30,000 is expected to increased to 40,000, a 33% growth which will in-turn also increase the employment potential of the sector. Independent studies show that the industry that currently hires more than 3 mln people, directly and indirectly, is expected to employ close to 4 mln people in 2012 and 7 mln people by the year 2015. Ashok Goel, President - Plastindia Foundation said, "The Indian plastic processing sector needs to consolidate, reap economies of scale and become competitive. The key to achieve this is modernising processing facilities, improving labour productivity and enhancing exports. On the other hand, the industry also needs to pull up its socks where recycling of plastics is concerned - quality standards need to be laid down for the recycling sector in India and compliance needs to be ensured. The growth of the plastics industry has seen the number of processing units grow from 25,000 in the year to 2010 to 30,000 units in 2011. The exponential growth anticipated over the next three years will see this number go up to 40,000 units. As of today, just about 10-15% of these units can be classified as medium scale operations and the rest all operate on a small scale basis. Over 70% of the industry is in the unorganized sector. The Plastic industry chain can be classified into two primary segments, viz., the Upstream which is the manufacturing of polymers and the Downstream which is the conversion of polymers into plastic articles. The upstream Polymer manufacturers have commissioned globally competitive size plants with imported state-of-art technology from the world leaders. The upstream petrochemicals industries have also witnessed consolidation to remain globally competitive.The downstream plastic processing industry is highly fragmented and consists of micro, small and medium units. Presently, 75% are in the small-scale sector. The small-scale sector, however, accounts for only about 25% of polymer consumption. The industry also consumes recycled plastic, which constitutes about 30% of total consumption. Despite the industry's high growth spanning over a period of over 2 decades and
crossing several milestones, Indian plastics industry is yet to realize its full potential. The per capita consumption of plastics in India, at 5 kgs, is the lowest in the world. The average global per capita consumption is 26 kgs. The low level of per capita plastics consumption in India is indicative of the massive growth potential of the plastic industry. India has the advantage of high population and is expected to maintain high economic growth. This should propel India's plastics consumption to new levels in coming years. The next two decades are expected to offer unprecedented opportunities for the plastic industry in India. According to a CRISIL Report, the world trade in Plastics is expected to reach 140 mln tons in 2012 and provides a lucrative opportunity for India, but with just a 1.5% share in world export volumes, India is not in a position to capture this opportunity. The Indian Plastic Industry, going forward, needs to consolidate and enhance capacity, upgrade facilities and improve productivity and increase utilisation of critical plastic applications. The one critical factor that plagues the Indian Plastic industry is the common perception that plastic is not environmentally friendly. This primarily is due to the low awareness about the energy saving property of plastics and the benefits to industries that utilise plastics. It is a little known fact that, while India has the lowest per capita consumption in the world, it is the highest recycler of plastics. In India, we recycle 60% from both industry and urban waste as compared to the world average of 20-25%. Last but not the least, the various associations need to come together and put in a concerted effort to join hands to enhance the image and the growth of the Indian Plastic industry, create opportunities to demonstrate the industry's capabilities, educate all segments of the society about the benefits of plastics. The associations need to create a positive policy framework with all statutory entities and increase per capita consumption of plastics, encourage exports thereby significantly contributing to national growth.


The British Plastics Federation 5 - 6 Bath Place Rivington Street London EC2A 3JE Tel: 0207457 5000 Fax: 020 7457 5045 Web: www.bpf.co.uk