Embed Size (px)
Citation preview

SHALE GAS TO POLYETHYLENEGlobal outlook to 2023
PLATTS PETROCHEMICAL ANALYTICS
Featuring Bentek Energy’s 10-year Price Forecast
For more information visit:www.platts.com/ppa
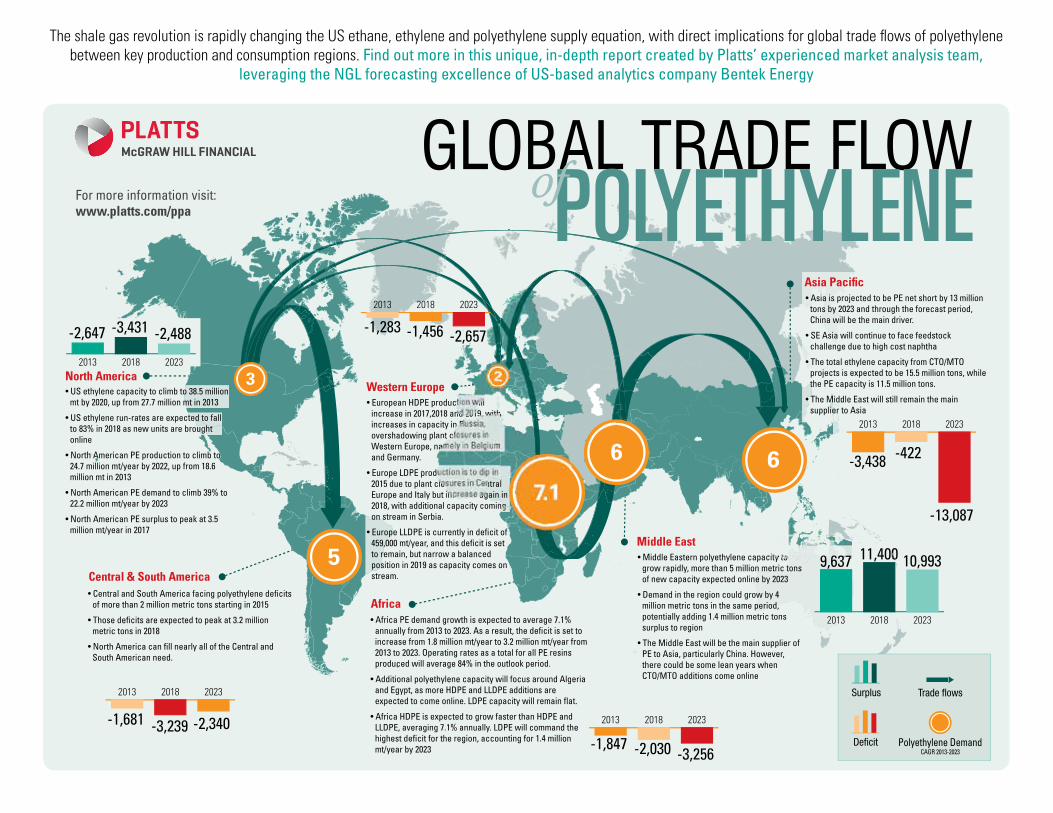
• US ethylene capacity to climb to 38.5 million mt by 2020, up from 27.7 million mt in 2013
• US ethylene run-rates are expected to fall to 83% in 2018 as new units are brought online
• North American PE production to climb to 24.7 million mt/year by 2022, up from 18.6 million mt in 2013
• North American PE demand to climb 39% to 22.2 million mt/year by 2023
• North American PE surplus to peak at 3.5 million mt/year in 2017
• Central and South America facing polyethylene deficits of more than 2 million metric tons starting in 2015
• Those deficits are expected to peak at 3.2 million metric tons in 2018
• North America can fill nearly all of the Central and South American need.
• Africa PE demand growth is expected to average 7.1% annually from 2013 to 2023. As a result, the deficit is set to increase from 1.8 million mt/year to 3.2 million mt/year from 2013 to 2023. Operating rates as a total for all PE resins produced will average 84% in the outlook period.
• Additional polyethylene capacity will focus around Algeria and Egypt, as more HDPE and LLDPE additions are expected to come online. LDPE capacity will remain flat.
• Africa HDPE is expected to grow faster than HDPE and LLDPE, averaging 7.1% annually. LDPE will command the highest deficit for the region, accounting for 1.4 million mt/year by 2023
• European HDPE production will increase in 2017,2018 and 2019, with increases in capacity in Russia, overshadowing plant closures in Western Europe, namely in Belgium and Germany.
• Europe LDPE production is to dip in 2015 due to plant closures in Central Europe and Italy but increase again in 2018, with additional capacity coming on stream in Serbia.
• Europe LLDPE is currently in deficit of 459,000 mt/year, and this deficit is set to remain, but narrow a balanced position in 2019 as capacity comes on stream.
• Asia is projected to be PE net short by 13 million tons by 2023 and through the forecast period, China will be the main driver.
• SE Asia will continue to face feedstock challenge due to high cost naphtha
• The total ethylene capacity from CTO/MTO projects is expected to be 15.5 million tons, while the PE capacity is 11.5 million tons.
• The Middle East will still remain the main supplier to Asia
• Middle Eastern polyethylene capacity to grow rapidly, more than 5 million metric tons of new capacity expected online by 2023
• Demand in the region could grow by 4 million metric tons in the same period, potentially adding 1.4 million metric tons surplus to region
• The Middle East will be the main supplier of PE to Asia, particularly China. However, there could be some lean years when CTO/MTO additions come online
Middle East
Asia Pacific
5
7.1
6 6
3 2202320182013
202320182013
202320182013
202320182013
202320182013
202320182013
-13,087
-422-3,438
10,99311,4009,637
-3,256-2,030-1,847-2,340-3,239-1,681
-2,488-3,431-2,647 -2,657-1,456-1,283
Polyethylene Demand CAGR 2013-2023
The shale gas revolution is rapidly changing the US ethane, ethylene and polyethylene supply equation, with direct implications for global trade fl ows of polyethylene between key production and consumption regions. Find out more in this unique, in-depth report created by Platts’ experienced market analysis team,
leveraging the NGL forecasting excellence of US-based analytics company Bentek Energy
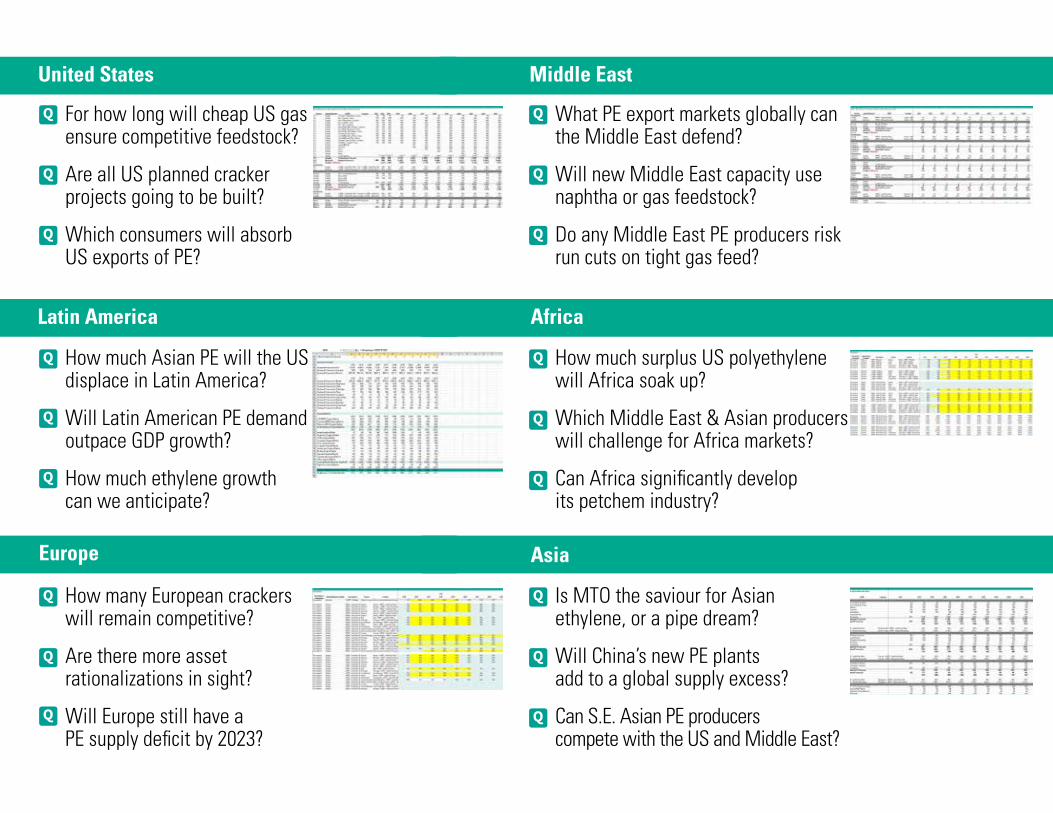
What PE export markets globally can the Middle East defend?
Will new Middle East capacity use naphtha or gas feedstock?
Do any Middle East PE producers risk run cuts on tight gas feed?
Middle East
Africa
How much surplus US polyethylene will Africa soak up?
Which Middle East & Asian producers will challenge for Africa markets?
Can Africa significantly develop its petchem industry?
Is MTO the saviour for Asian ethylene, or a pipe dream?
Will China’s new PE plants add to a global supply excess?
Can S.E. Asian PE producers compete with the US and Middle East?
Asia
Q
Q
Q
Q
Q
Q
Q
Q
Q
For how long will cheap US gas ensure competitive feedstock?
Are all US planned cracker projects going to be built?
Which consumers will absorb US exports of PE?
United States
Latin America
How much Asian PE will the US displace in Latin America?
Will Latin American PE demand outpace GDP growth?
How much ethylene growth can we anticipate?
How many European crackers will remain competitive?
Are there more asset rationalizations in sight?
Will Europe still have a PE supply deficit by 2023?
Europe
Q
Q
Q
Q
Q
Q
Q
Q
Q
8Copyright © 2014, McGraw Hill Financial
SHALE GAS TO POLYETHYLENE MARCH 2014
Assessed basins with resource estimate
Assessed basins without resource estimate
Additions off track
Additions – delay risk
Additions on track
Base capacity (million mt)
Project on track
Project with delay risk
Project off track
Asia
Middle East
26
29
32
35
38
202320182013 27
31
35
39
43
202320182013
50
60
70
80
202320182013
USAUSA
Global Ethylene Cracker Projects
Source: EIA, Platts
13Copyright © 2014, McGraw Hill Financial
MARCH 2014SHALE GAS TO POLYETHYLENE
OxyChem, Ingleside554,000 mt/yearQ2 2016
Formosa Plastics, Point Comfort800,000 mt/yearQ3 2017
Dow Chemical, Freeport1,500,000 mt/yrQ2 2017
ExxonMobil, Baytown1,500,000 mt/yrQ2 2017
Sasol, Lake Charles1,500,000 mt/yearQ3 2017
LyondellBasel, Corpus Christi363,000 mt/yearQ4 2016
LyondellBasel, Channel View113,000 mt/yearQ1 2015
ChevronPhillips, Cedar Bayou1,500,000 mt/yrQ2 2016
Aither Bayer, Kanawha Valley700,000 mt/yrQ4 2016
Appalachian Resins, West Virginia230,000 mt/yrQ3 2017
Shell, Western Pennsylvania1,500,000 mt/yrQ3 2019
Shale gas basins
Current plays
Prospective plays
Project – on track
Project – delay risk
US ethylene cracker projects
Source: EIA, Platts
9Copyright © 2014, McGraw Hill Financial
SHALE GAS TO POLYETHYLENE MARCH 2014
Global variable cost curveThe US can be derived as the dying patient being revived due to shale as the cost curve, as cheap ethane has moved it right down the cost curve, which has sparked a major investment curve. However, the Middle East still holds the advantage in terms of being the cheapest producer of ethylene, with investment in the region continuing. However, investments in the US are expected to outweigh additions in the Middle East over the next ten years.
High cost Western European and NE Asian naphtha producers will see no capacity additions and will likely face closures. However, China could potentially around 10 million mt/year of naphtha based capacity over the forecast period. The main driver for these additions is due to high demand growth, adequate naphtha from refineries and China’s ever driving ambition of becoming self-sufficient. These additions are expected to compliment the potential CTO/MTO based capacity coming on stream.
SE Asia will see some additions are consumption increases and these will be naphtha based, due to limitations in obtaining secure supply of other gas based feedstocks.
Summary• US ethane crackers have moved right down the cost
curve due to cheap shale based derived ethane. In 2004, the variable cost for an ethane cracker was $335/mt and this continued to rise to peak in 2008, following US natural gas prices
• As of 2013, the variable cost for US ethane crackers has moved around $80/ton and in terms of a global perspective has shifted from being the highest cost producer, to the third lowest cost producer, and much closer to US ethane/propane and Middle East ethane crackers.
• Notably, due to value of higher co product yield when processing propane, the US E/P cracker is second in cost compared to the Middle East ethane cracker.
• The Middle East still remains the lowest cost producer of ethylene globally due to low cost ethane, derived from cheap and abundant natural gas, with the variable cash cost at around $10/ton as of 2013. With co product values increasing and a regional average ethane price of around $2/mmbtu, production costs have reduced over time.
• Naphtha based ethylene crackers are currently at the top of the cost curve, with US naphtha crackers
bearing the brunt of the high cost, with variable unit costs of $614/mt.
• These economics indicate that naphtha crackers in the US are under heavy pressure and have either closed down, running at very low rates, or the ones capable of switching have moved to the cheap ethane feed.
• Whereas, in Europe and Asia, were the flexibility and alternative cheap feedstock options are limited, overall they remain the highest cost producing regions. Despite the higher co product yields naphtha crackers can produce, this has not had a major impact on variable cost.
• Europe and NE Asia, particularly Japan are the least dynamic in terms of demand growth and are suffering the most. Unit variable cost of production for ethylene are $567/mt and $585/mt for Europe and NE Asia respectively.
Ethylene variable cost curve and cumulative capacity addition
Source: Platts*No capacity additions; **All additional Chinese capacity projects Cumulative ethylene capacity additions (’000 mt)
($/mt)
0
100
200
300
400
500
600
700
5000 10000 15000 20000 25000 30000 35000 40000
Middle East ethaneUS E/PUS ethaneWE naphtha*SE Asia naphthaNE Asia naphtha**US full range naphtha*
10Copyright © 2014, McGraw Hill Financial
SHALE GAS TO POLYETHYLENE MARCH 2014
Regional Demand SummaryThe major growth centres for polyethylene over the forecast period are projected to be Asia, especially China and India, Central and South America, Eastern Europe, Africa and the Middle East. These regions are expected to show the strongest growth over the next few years, following a sustained level of healthy GDP growth, as they follow a path towards further economic and social development. These regions still have further to progress, as plastics penetration into traditional material based goods is still taking place as per capita use is relatively low compared to demand size. Per capita is still growing and has a long way to go, especially as populations grow and individuals have more disposable income.
Whereas, further developed regions and countries are characterised by slow demand growth but higher use per capita of polyethylene, signalling the saturation and maturity of these markets. These regions are further down the cycle of plastics penetration and individuals on average have a greater disposable income. NE Asia, particularly Japan, Western Europe and North America are symptomatic of these symptoms.
Summary• High projected demand growth in Asia, focusing around
China and India. China is the biggest volume market.• Asian demand growth is projected be around 6%
annually over the forecast period, with China and India being the main drivers
• Indian demand growth is expected to be higher than China’s between 2013 and 2023, as the World’s largest democracy plays catch up to China.
• PE growth in India is forecast to be 9% per annum, whereas Chinese demand growth will be 7%, over the forecast period.
• The potential for growth in Asia is strong, however as economies and industries develop, per capita consumption is still very low compared to other more developed regions.
• Central and South America is another key PE polymer growth regions with similar potential to
Asia. Growth is expected to average 5% year on year throughout the outlook.
• Eastern and Central Europe is the major growth centre for Europe.
• The Middle East is a major supply centre, but projected demand growth is expected to be strong as population grows and development and industrial employment centres increase.
• Western Europe, Japan and North America are more mature, saturated markets, characterised by lacklustre demand growth but higher consumption per capita.
Polyethylene demand per capita
Source: Platts
0 5 10 15 20 25 30 35 400
2
4
6
8
10Projected % CAGR (2013-2023)
Polyethylene consumption (2013) kg/capita
India
Africa
Asia Central andSouth America
Eastern Europe
Middle EastJapan
China
Western Europe
North America
Size of bubble indicates 2013 market size in million tons
35
20
5 5
3
4
6
3
12
16
7Copyright © 2014, McGraw Hill Financial
SHALE GAS TO POLYETHYLENE MARCH 2014
2004 2005 2006 2007 2008 2009 2010 2011 2012 20202016201520142013 2017 2018 2019Project Location Capacity (’000 mt/year) Status
Gantt chart
FEED stage year Original announced completion Estimated EPC stage year Estimated year of completionDelay risk Off trackOn trackSource: Platts, 2B1st
Socar Baku Oil and Gas Processing and Petrochemical Complex Azerbaijan, Baku 2000PetroChina Sichuan Petrochemical Co., Ltd China, Sichuan, Chengdu 800Echem Alexandria Ethylene and Derivatives Egypt, Alexandria 400Reliance Jamnagar Refinery Expansion Ethylene Package India, Jamnagar 950KPI Atyrau Petrochemical Complex Kazakhstan, Atyrau 840Braskem Idesa Veracruz Ethylene XXI (Mexico) Mexico, Veracruz 1000SABIC Geleen Naphtha Cracker Revamping Netherlands, Geleen n/aIneos Rafnes Ethylene Expansion Norway, Bamble 70Shell Al Karaana Petrochemical EPC-1 Cracker Qatar, Al Karaana 1100QP - Qapco Ras Laffan Al-Sejeel Petrochemical Ethylene Qatar, Ras Laffan 1280Sadara Saudi Arabia, Al Jubail 1500Saudi Aramco Petro Rabigh Phase 2 Ethylene Saudi Arabia, Rabigh 600Shell Singapore SEPC Expansion Singapore, Pulau Bukom 200Borouge UAE, Ruwais 1430ExxonMobil Baytown USA, Baytown 1500ChevronPhillips Cedar Bayou USA, Cedar, Bayou, Tx 1500LyondellBasel Channel view Ethylene Expansion USA, Channel View, Tx 113Dow Freeport USA, Freeport, Tx 1500Oxychem Ingleside USA, Ingleside 544Aither Bayer Kanawha Valley USA, Kanawha Valley 700Sasol Louisiana Lake Charles USA, Lake Charles, Louisiana 1500Shell Appalachia Ethane Cracker USA, Western Pennsylvania 1500Uz-Kor Gas Chemical Uzbekistan, Karakalpakstan 400Sinochem Quanzhou Petrochemical Co., Ltd China, Fujian, Quanzhou 1000Fujian ethylene project Ligure China, Fujian, Zhanzhou 1200CNOOC Huizhou ethylene project China, Guangdong, Huizhou 1000Zhanjiang Branch of joint integration projects China, Guangdong, Zhanjiang 1000Formosa Plastics Gulei-Fujian Naphtha Cracker China, Gulei- Fujian n/aSinopec Hainan Refining & Chemical (HRCC) China, Hainan 1000CNOOC Hainan ethylene project China, Hainan, Haikou 1500Sinopec China, Jiangsu, Lianyungang 2000Sinopec Yangzi ethylene III transformation China, Jiangsu, Nanjing 800Dalian Shide Group China, Liaoning, Dalian 1300Formosa Plastics Ningbo Ethylene Cracker China, Ningbo 1200Sinopec Qingdao Refining & Chemical Co., Ltd China, Shandong, Qiangdao 1000Shanghai Gaoqiao ethylene relocation project to Caojing China, Shanghai 1000Rosneft & CNPC Tianjin Refinery & Chemicals China, Tianjin 1200ONGC Naheij OPAL Ethylene India, Dahej 1050BPCL Kochi Petrochemical Complex with Ethylene cracker India, Kochi 220PTTGC Pertamina Java PetroChemical Complex Indonesia, Java 1000ChevronPhillips Basrah Chemical Iraq, Basrah n/aPIC Al-Zour Olefins-III Ethylene Kuwait, Al- Zour 1400Petronas Rapid Petrochemical Complex Ethane Cracker Malaysia, Johor 1000Orpic Sohar Liwa Plastic Oman, Liwa 800Sibur Gazprom Belororsk Petrochemical Complex Russia, Belogorsk n/aRosneft Mitsui Nakhodka Fepco Petrochemical Complex Russia, Nakhodka 1400Gazprom Neftekhim Salavat (GNS) All-Russia Gas Chemistry Center Russia, Salvat 380Nizhnekamskneftekhim Ethylene Complex Russia, Tatarstan 1000Sibur ZapSibNeftekhim Ethylene Russia, Tobolsk 1500PTTGC Map Ta Phut Debottlenecking Thailand, Map Ta Phut 52LyondellBasell Corpus Christi Ethylene Expansion USA, Corpus Christi, Tx 363Formosa Plastics Point Comfort USA, Point Comfort, Tx 800Appalachian Resins (AR) Wheeling West Virginia Ethylene & Polyethylene USA, West Virginia 230PTT Binh Dinh Petrochemical Complex Vietnam, Binh Dinh n/aPetrolimex Nam Van Phong Petrochemicals Vietnam, Nam Van Phong n/aSonatrach - Total Arzew Petrochemical Complex Algeria, Arzew 1400China oil refinery project in Jieyang China, Guangdong, Jieyang n/aCNPC Taizhou Refinery & Petrochemical Complex China, Taizhou 1200PetroChina oil refinery project in Yunnan China, Yunnan, Kunming 1000Carbon Holding Tahrir Petrochemicals Egypt, Tahrir 1350National Petrochemical Company (NPC) Olefins 11 Iran, Assaluyeh 1000National Petrochemical Company (NPC) Olefins 12 Iran, Assaluyeh 1000Gachsaran Petrochemical Iran, Gachsaran 1000Ilam Petrochemical Phase-2 Iran, Ilam 450Braskem PetroPeru Quillabamba Ethylene Peru, Quillabamba 1200
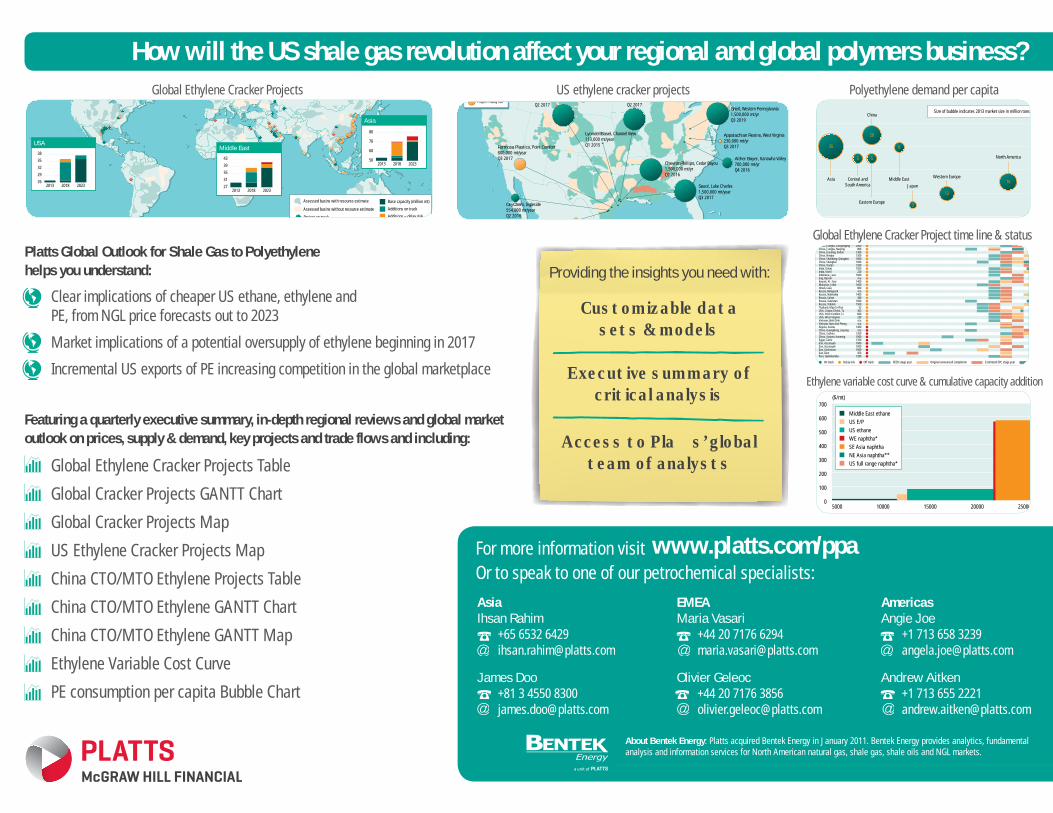
Platts Global Outlook for Shale Gas to Polyethylene helps you understand:
Clear implications of cheaper US ethane, ethylene and PE, from NGL price forecasts out to 2023
Market implications of a potential oversupply of ethylene beginning in 2017
Incremental US exports of PE increasing competition in the global marketplace
Global Ethylene Cracker Projects US ethylene cracker projects Polyethylene demand per capita
Global Ethylene Cracker Project time line & status
Ethylene variable cost curve & cumulative capacity addition
Featuring a quarterly executive summary, in-depth regional reviews and global market outlook on prices, supply & demand, key projects and trade flows and including:
Global Ethylene Cracker Projects Table
Global Cracker Projects GANTT Chart
Global Cracker Projects Map
US Ethylene Cracker Projects Map
China CTO/MTO Ethylene Projects Table
China CTO/MTO Ethylene GANTT Chart
China CTO/MTO Ethylene GANTT Map
Ethylene Variable Cost Curve
PE consumption per capita Bubble Chart
How will the US shale gas revolution affect your regional and global polymers business?
EMEAMaria Vasari
+44 20 7176 [email protected]
Olivier Geleoc +44 20 7176 [email protected]
AsiaIhsan Rahim
+65 6532 [email protected]
James Doo+81 3 4550 8300 [email protected]
For more information visit www.platts.com/ppaOr to speak to one of our petrochemical specialists:
AmericasAngie Joe
+1 713 658 [email protected]
Andrew Aitken+1 713 655 [email protected]
About Bentek Energy: Platts acquired Bentek Energy in January 2011. Bentek Energy provides analytics, fundamental analysis and information services for North American natural gas, shale gas, shale oils and NGL markets.
Providing the insights you need with:
Customizable datasets & models
Executive summary of critical analysis
Access to Pla� s’ global team of analysts