Embed Size (px)
Citation preview
877
PLCs and Other Logic Devices
5
5.1BINARY LOGIC DIAGRAMS FOR PROCESS OPERATIONS 880
1. Purpose 8802. Scope 8803. Use of Symbols 8804. Symbols 881Appendix A: General Application Example 888
A1. Introduction 888A2. Simplified Flow Diagram 888A3. Word Description 888A4. Logic Diagram 890
Appendix B: Complex Time-Element Example 891B.1 Word Description 891
Appendix C: Loss of Power Supplyfor Memory 891
Bibliography 892
5.2LADDER DIAGRAMS 893
Introduction 893Ladder Diagram Symbols 893Developing a Ladder Diagram 894
Automatic Mode of Operation 895Summary 895Ladder Diagram Analysis 895Start-Up and Shutdown 896
Dynamic Breaking of a Motor 896Fail-Safe Design 897Documentation 897Conclusions 897Bibliography 897
5.3OPTIMIZATION OF LOGIC CIRCUITS 898
Optimization Building Blocks 898Graphic Logic Functions 900Ladder Diagrams from Logic Diagrams 901
Optimized Logic Circuit Construction 901Logic Circuit Synthesis 902Logic Simplification with Boolean Algebra 903Logic Simplification through Logic Maps 903
Negative vs. Positive Logic Usage 904Summary 904Bibliography 905
5.4PLCs: PROGRAMMABLE LOGIC CONTROLLERS 906
Introduction 907History 907PLC Sizes 909
Nano PLCs 909Basic PLC Components 909
Central Processor Unit (Real Time) 910Memory Unit 910I/O Systems 912PLC Power Supply 915
Additional PLC Components 915Communications Modules 915Remote I/O 915Peer-to-Peer Communications 916Peripheral Devices 917Local Operator Interface 917Human-Machine Interface 918Printers 919
© 2006 by Béla Lipták
878 PLCs and Other Logic Devices
Programmers and Workstations 919Justification for the Use of PLCs 920
PLCs vs. Relays and Stand-Alone Controllers 920
PLC vs. DCS 921PLC vs. Personal Computers 922
Summary 922Project Execution 923
Systems Analysis 923Open Systems 925PLC Hardware, System Sizing,
and Selection 926PLC Installation and Panel Design 928Software (Program) Development 932Software/Hardware Integration 938System Checkout and Start-Up 939After Start-Up 939
Conclusion 940References 940Bibliography 941
5.5PLC PROGRAMMING 944
Introduction 944What Is a PLC? 944
System Hardware and Operation 944Programming Languages 946
Instruction List 946Structured Text 946Sequential Function Charts 946Function Block Diagrams 947
Ladder Logic Programming 947Ladder Logic Structure 947Ladder Logic Programming Basic
Instructions 948Memory Structure 952Ladder Logic Programming Devices 953Programming Considerations 953Program Documentation 954PLC Hardware Configuration 954
Ladder Program Structure 955Typical GE Fanuc PLC 955Typical Allen-Bradley PLCs 956Typical Modicon PLC 984 958Access and Programming Modes 958Developing the PLC Program Logic 960
Testing and Simulation 962Advances in Programming 964Reference 965Bibliography 965
5.6PLC SOFTWARE ADVANCES 966
Introduction 966Graphic Description of Control Requirements 966
Ladder Logic Advances 968Program Flow Modification 968Indirect Addressing 969Assembly Language-Like Extensions 971Communication with Intelligent Devices 971Fast I/O Updating Methods 972
Graphic, Flowchart-Like Languages 972IEC 61131-3 PLC Language Standard 973Conclusion 974References 974Bibliography 975
5.7PRACTICAL LOGIC DESIGN 976
Design Philosophy 976Open/Close Valves 976
Definitions 976Auto Mode 978Motor-Operated Valves 979Failure Logic 979Solenoid Valves 981
Pumps 981Definitions 981Auto Mode 983Pump Fail 984Other Common Problems with Pump Logic
Design 984Pumps with Two Outputs 984Controlling Two Pumps Together 984
Breakers 986Analog Controls 986
Switchover 986Pop Open/Clamp Closed 986Override Open and Close 988Feedforward 988Cascade 989Three-Transmitter Select 989Switch to Manual Mode 990Changing the Set Point with Changes in
the Number of Pumps Running 990Start-Up and Shutdown Sequences 990Operation and Customization 992A Note on Safety 992Bibliography 992
5.8PROGRAMMABLE SAFETY SYSTEMS 993
Introduction 993Risk Reduction 994History 994
Safety Standards 996IEC 61508: General Safety Standard 996IEC 61511: Safety Standard for Process
Industries 996
© 2006 by Béla Lipták
Contents of Chapter 5 879
ANSI/ISA-84.01 Standard 997Management Considerations 999Hazard and Risk Analysis 999
As Low as Reasonably Practicable (ALARP) 999
Required Safety Integrity Level 999Semi-Quantitative Risk Analysis Techniques 1001Risk Graphs 1001
Safety System Certification 1001Major Trends 1003
Overall Safety 1003Separation from the Control System 1003Flexibility and Scalability 1003Function Blocks 1004
Safety System Selection 1004Acknowledgments 1004Acronyms 1004References 1005Bibliography 1005
5.9RELAYS 1006
Introduction 1007Relay Types and Features 1007
Special Relays 1007Relay Characteristics 1008Rating, Size, and Other Selection Criteria 1008Contact Configurations 1008Mechanical Structures 1009Contact Materials 1010Contact Shape and Mounting 1011
Selection and Application 1011Selection 1011
Relative Costs 1012Relays vs. Solid-State Devices 1012Electromechanical Advantages 1012Solid-State Advantages 1013
Conclusions 1013Bibliography 1013
5.10SOLID-STATE LOGIC ELEMENTS 1015
Introduction 1015Analog Circuit Elements 1016
Transistor Switch 1016Diodes and Their Switching 1017Transistors 1017
Integrated Circuit Elements 1018Families of IC Switching 1018
Applications 1020Merging Human and Instrument Inputs 1020Time Synchronization 1020
Implementation Options 1021Solid-State Logic Options 1021
Bibliography 1022
5.11SYSTEM INTEGRATION: COMPUTERSWITH PLCS 1023
Introduction 1023PCs for Programming the PLC 1024PCs for Monitoring and Supervising
the PLC 1024SCADA System 1024Handling of Tasks 1025
Implementation 1025Serial Link 1025Communication Networks 1025
Performance 1027Generation Time (Tg) 1027Transmission Time (Tt ) 1027Te, Tr, and Trd 1028
Conclusions 1028References 1028Bibliography 1028
5.12TIME DELAY RELAYS 1030
General Characteristics 1031Timer Modes and Characteristics 1031Types of Time Delays 1032Types of Designs 1033
Bibliography 1035
5.13TIMERS AND PROGRAMMING TIMERS 1036
Introduction 1036Mechanical Timers and Sequencers 1036
Cam Timers 1036Band or Drum Programmers 1037Punched-Card Programmers 1037
Timers 1037One-Shot Timers 1037Monostable and Astable Designs 1037Delay on Break 1038555 Devices 1039Hybrid Timing Circuits 1039
Digital Sequencers 1040Asynchronous Sequencers 1041
Electronic Sequencers 1042Conclusions 1042Bibliography 1042
© 2006 by Béla Lipták
880
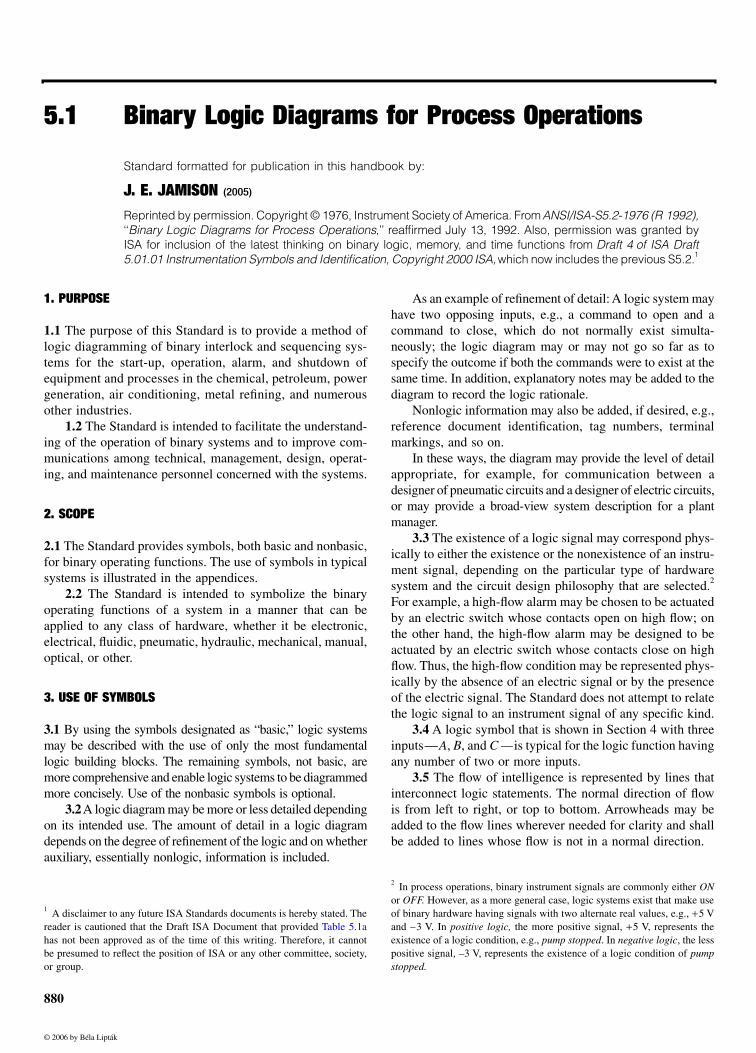
5.1 Binary Logic Diagrams for Process Operations
Standard formatted for publication in this handbook by:
J. E. JAMISON (2005)
Reprinted by permission. Copyright © 1976, Instrument Society of America. From ANSI/ISA-S5.2-1976 (R 1992),‘‘Binary Logic Diagrams for Process Operations,’’ reaffirmed July 13, 1992. Also, permission was granted byISA for inclusion of the latest thinking on binary logic, memory, and time functions from Draft 4 of ISA Draft5.01.01 Instrumentation Symbols and Identification, Copyright 2000 ISA, which now includes the previous S5.2.1
1. PURPOSE
1.1 The purpose of this Standard is to provide a method oflogic diagramming of binary interlock and sequencing sys-tems for the start-up, operation, alarm, and shutdown ofequipment and processes in the chemical, petroleum, powergeneration, air conditioning, metal refining, and numerousother industries.
1.2 The Standard is intended to facilitate the understand-ing of the operation of binary systems and to improve com-munications among technical, management, design, operat-ing, and maintenance personnel concerned with the systems.
2. SCOPE
2.1 The Standard provides symbols, both basic and nonbasic,for binary operating functions. The use of symbols in typicalsystems is illustrated in the appendices.
2.2 The Standard is intended to symbolize the binaryoperating functions of a system in a manner that can beapplied to any class of hardware, whether it be electronic,electrical, fluidic, pneumatic, hydraulic, mechanical, manual,optical, or other.
3. USE OF SYMBOLS
3.1 By using the symbols designated as “basic,” logic systemsmay be described with the use of only the most fundamentallogic building blocks. The remaining symbols, not basic, aremore comprehensive and enable logic systems to be diagrammedmore concisely. Use of the nonbasic symbols is optional.
3.2 A logic diagram may be more or less detailed dependingon its intended use. The amount of detail in a logic diagramdepends on the degree of refinement of the logic and on whetherauxiliary, essentially nonlogic, information is included.
As an example of refinement of detail: A logic system mayhave two opposing inputs, e.g., a command to open and acommand to close, which do not normally exist simulta-neously; the logic diagram may or may not go so far as tospecify the outcome if both the commands were to exist at thesame time. In addition, explanatory notes may be added to thediagram to record the logic rationale.
Nonlogic information may also be added, if desired, e.g.,reference document identification, tag numbers, terminalmarkings, and so on.
In these ways, the diagram may provide the level of detailappropriate, for example, for communication between adesigner of pneumatic circuits and a designer of electric circuits,or may provide a broad-view system description for a plantmanager.
3.3 The existence of a logic signal may correspond phys-ically to either the existence or the nonexistence of an instru-ment signal, depending on the particular type of hardwaresystem and the circuit design philosophy that are selected.2
For example, a high-flow alarm may be chosen to be actuatedby an electric switch whose contacts open on high flow; onthe other hand, the high-flow alarm may be designed to beactuated by an electric switch whose contacts close on highflow. Thus, the high-flow condition may be represented phys-ically by the absence of an electric signal or by the presenceof the electric signal. The Standard does not attempt to relatethe logic signal to an instrument signal of any specific kind.
3.4 A logic symbol that is shown in Section 4 with threeinputs—A, B, and C —is typical for the logic function havingany number of two or more inputs.
3.5 The flow of intelligence is represented by lines thatinterconnect logic statements. The normal direction of flowis from left to right, or top to bottom. Arrowheads may beadded to the flow lines wherever needed for clarity and shallbe added to lines whose flow is not in a normal direction.
1 A disclaimer to any future ISA Standards documents is hereby stated. Thereader is cautioned that the Draft ISA Document that provided Table 5.1ahas not been approved as of the time of this writing. Therefore, it cannotbe presumed to reflect the position of ISA or any other committee, society,or group.
2 In process operations, binary instrument signals are commonly either ONor OFF. However, as a more general case, logic systems exist that make useof binary hardware having signals with two alternate real values, e.g., +5 Vand –3 V. In positive logic, the more positive signal, +5 V, represents theexistence of a logic condition, e.g., pump stopped. In negative logic, the lesspositive signal, –3 V, represents the existence of a logic condition of pumpstopped.
© 2006 by Béla Lipták
5.1 Binary Logic Diagrams for Process Operations 881
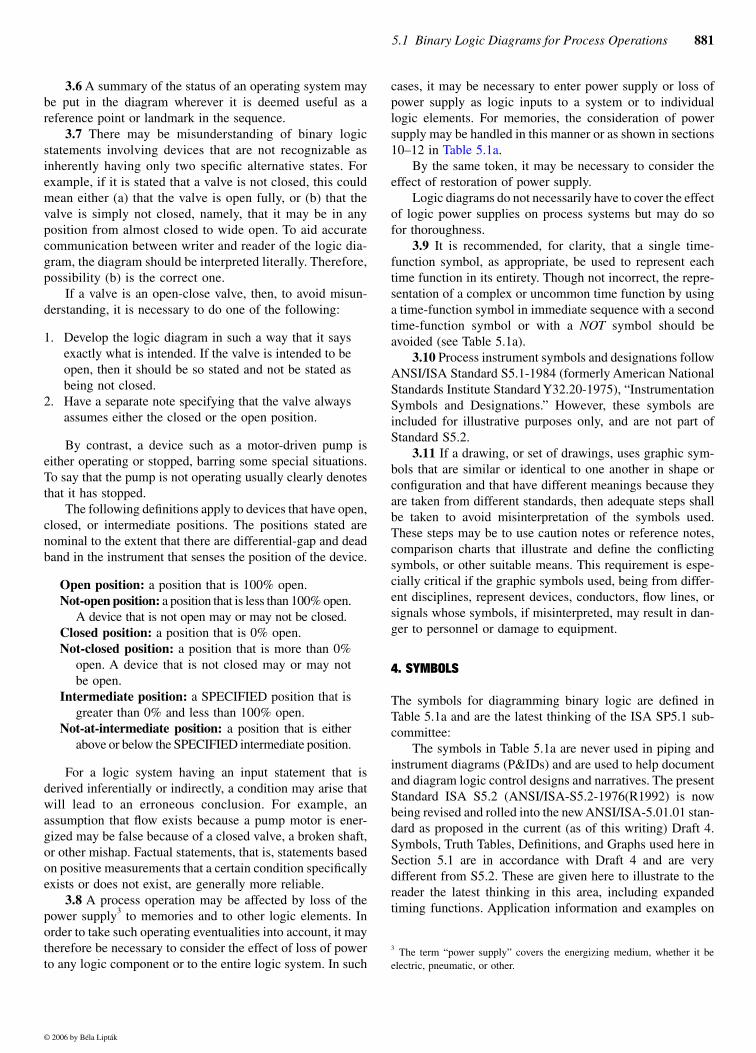
3.6 A summary of the status of an operating system maybe put in the diagram wherever it is deemed useful as areference point or landmark in the sequence.
3.7 There may be misunderstanding of binary logicstatements involving devices that are not recognizable asinherently having only two specific alternative states. Forexample, if it is stated that a valve is not closed, this couldmean either (a) that the valve is open fully, or (b) that thevalve is simply not closed, namely, that it may be in anyposition from almost closed to wide open. To aid accuratecommunication between writer and reader of the logic dia-gram, the diagram should be interpreted literally. Therefore,possibility (b) is the correct one.
If a valve is an open-close valve, then, to avoid misun-derstanding, it is necessary to do one of the following:
1. Develop the logic diagram in such a way that it saysexactly what is intended. If the valve is intended to beopen, then it should be so stated and not be stated asbeing not closed.
2. Have a separate note specifying that the valve alwaysassumes either the closed or the open position.
By contrast, a device such as a motor-driven pump iseither operating or stopped, barring some special situations.To say that the pump is not operating usually clearly denotesthat it has stopped.
The following definitions apply to devices that have open,closed, or intermediate positions. The positions stated arenominal to the extent that there are differential-gap and deadband in the instrument that senses the position of the device.
Open position: a position that is 100% open.Not-open position: a position that is less than 100% open.
A device that is not open may or may not be closed.Closed position: a position that is 0% open.Not-closed position: a position that is more than 0%
open. A device that is not closed may or may notbe open.
Intermediate position: a SPECIFIED position that isgreater than 0% and less than 100% open.
Not-at-intermediate position: a position that is eitherabove or below the SPECIFIED intermediate position.
For a logic system having an input statement that isderived inferentially or indirectly, a condition may arise thatwill lead to an erroneous conclusion. For example, anassumption that flow exists because a pump motor is ener-gized may be false because of a closed valve, a broken shaft,or other mishap. Factual statements, that is, statements basedon positive measurements that a certain condition specificallyexists or does not exist, are generally more reliable.
3.8 A process operation may be affected by loss of thepower supply3 to memories and to other logic elements. Inorder to take such operating eventualities into account, it maytherefore be necessary to consider the effect of loss of powerto any logic component or to the entire logic system. In such
cases, it may be necessary to enter power supply or loss ofpower supply as logic inputs to a system or to individuallogic elements. For memories, the consideration of powersupply may be handled in this manner or as shown in sections10–12 in Table 5.1a.
By the same token, it may be necessary to consider theeffect of restoration of power supply.
Logic diagrams do not necessarily have to cover the effectof logic power supplies on process systems but may do sofor thoroughness.
3.9 It is recommended, for clarity, that a single time-function symbol, as appropriate, be used to represent eachtime function in its entirety. Though not incorrect, the repre-sentation of a complex or uncommon time function by usinga time-function symbol in immediate sequence with a secondtime-function symbol or with a NOT symbol should beavoided (see Table 5.1a).
3.10 Process instrument symbols and designations followANSI/ISA Standard S5.1-1984 (formerly American NationalStandards Institute Standard Y32.20-1975), “InstrumentationSymbols and Designations.” However, these symbols areincluded for illustrative purposes only, and are not part ofStandard S5.2.
3.11 If a drawing, or set of drawings, uses graphic sym-bols that are similar or identical to one another in shape orconfiguration and that have different meanings because theyare taken from different standards, then adequate steps shallbe taken to avoid misinterpretation of the symbols used.These steps may be to use caution notes or reference notes,comparison charts that illustrate and define the conflictingsymbols, or other suitable means. This requirement is espe-cially critical if the graphic symbols used, being from differ-ent disciplines, represent devices, conductors, flow lines, orsignals whose symbols, if misinterpreted, may result in dan-ger to personnel or damage to equipment.
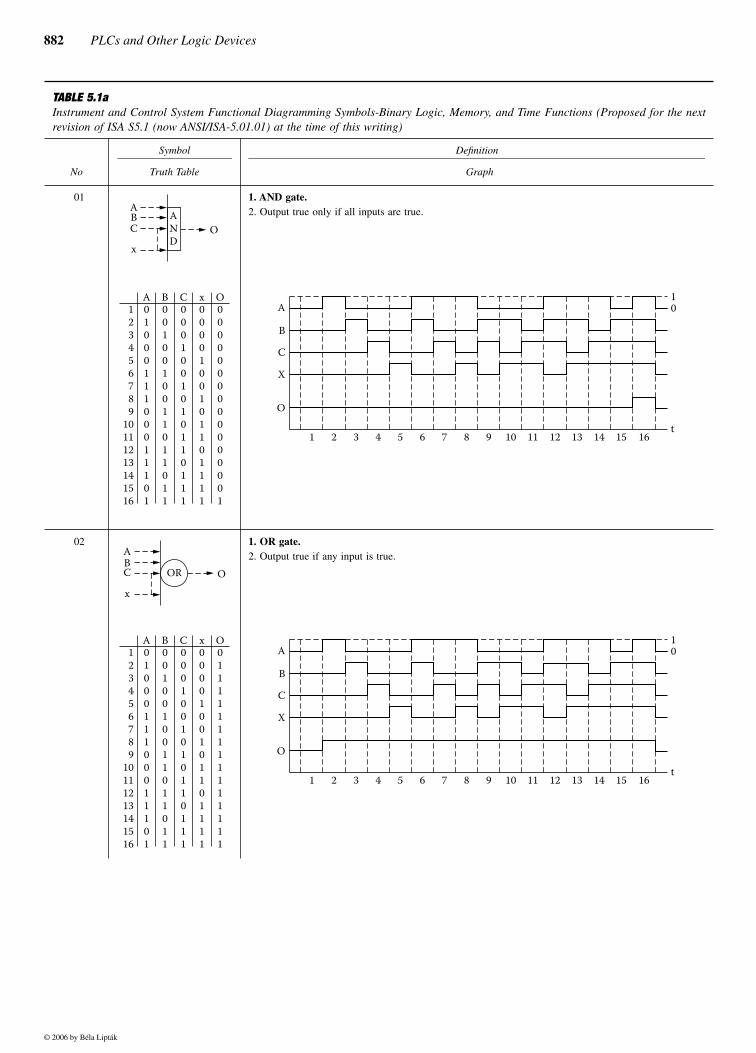
4. SYMBOLS
The symbols for diagramming binary logic are defined inTable 5.1a and are the latest thinking of the ISA SP5.1 sub-committee:
The symbols in Table 5.1a are never used in piping andinstrument diagrams (P&IDs) and are used to help documentand diagram logic control designs and narratives. The presentStandard ISA S5.2 (ANSI/ISA-S5.2-1976(R1992) is nowbeing revised and rolled into the new ANSI/ISA-5.01.01 stan-dard as proposed in the current (as of this writing) Draft 4.Symbols, Truth Tables, Definitions, and Graphs used here inSection 5.1 are in accordance with Draft 4 and are verydifferent from S5.2. These are given here to illustrate to thereader the latest thinking in this area, including expandedtiming functions. Application information and examples on
3 The term “power supply” covers the energizing medium, whether it beelectric, pneumatic, or other.
© 2006 by Béla Lipták
882 PLCs and Other Logic Devices
TABLE 5.1aInstrument and Control System Functional Diagramming Symbols-Binary Logic, Memory, and Time Functions (Proposed for the nextrevision of ISA S5.1 (now ANSI/ISA-5.01.01) at the time of this writing)
Symbol Definition
No Truth Table Graph
01 1. AND gate.2. Output true only if all inputs are true.
02 1. OR gate.2. Output true if any input is true.
ABC
x
AND
O
123456789
10111213141516
0100011100011101
0010010011011011
0001001010110111
0000100101101111
0000000000000001
A B C x OA
B
C
X
O
1 2 3 4 5 6 7 8 9 10 11 12 13 14 15 16t
01
ABC
x
OOR
123456789
10111213141516
0100011100011101
0010010011011011
0001001010110111
0000100101101111
0111111111111111
A B C x OA
B
C
X
O
1 2 3 4 5 6 7 8 9 10 11 12 13 14 15 16t
01
© 2006 by Béla Lipták
5.1 Binary Logic Diagrams for Process Operations 883
TABLE 5.1a (continued)Instrument and Control System Functional Diagramming Symbols-Binary Logic, Memory, and Time Functions (Proposed for the nextrevision of ISA S5.1 (now ANSI/ISA-5.01.01) at the time of this writing)
Symbol Definition
No Truth Table Graph
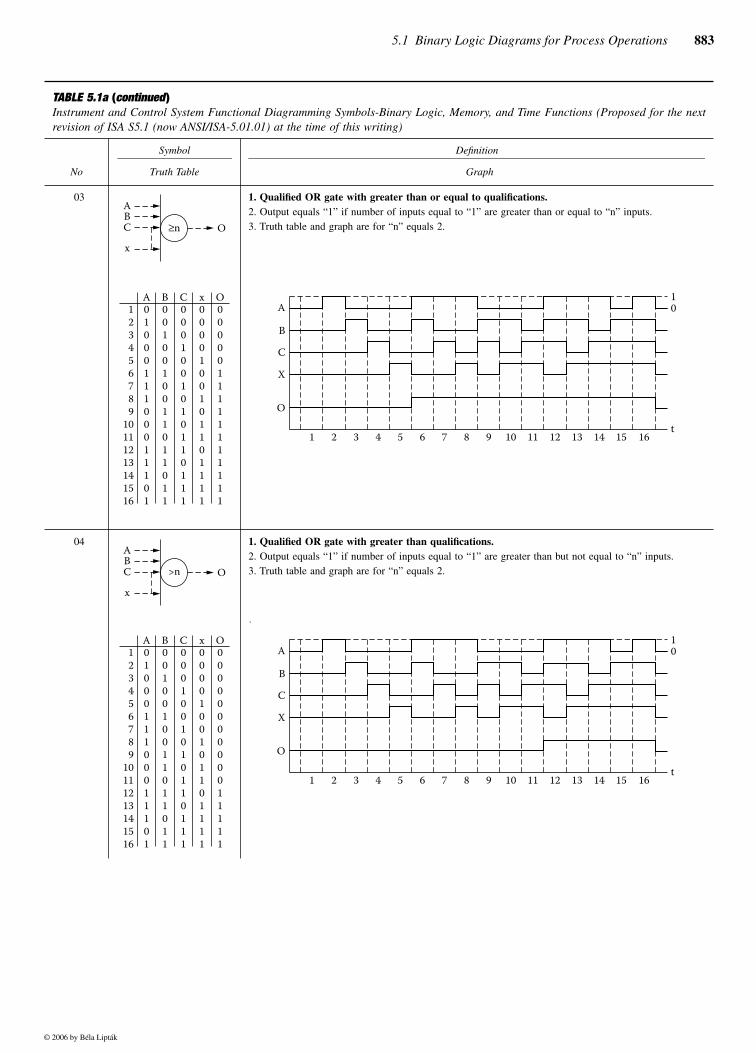
03 1. Qualified OR gate with greater than or equal to qualifications.2. Output equals “1” if number of inputs equal to “1” are greater than or equal to “n” inputs.3. Truth table and graph are for “n” equals 2.
04 1. Qualified OR gate with greater than qualifications.2. Output equals “1” if number of inputs equal to “1” are greater than but not equal to “n” inputs.3. Truth table and graph are for “n” equals 2.
˙
ABC
x
O≥n
123456789
10111213141516
0100011100011101
0010010011011011
0001001010110111
0000100101101111
0000011111111111
A B C x OA
B
C
X
O
1 2 3 4 5 6 7 8 9 10 11 12 13 14 15 16t
01
ABC
x
O>n
123456789
10111213141516
0100011100011101
0010010011011011
0001001010110111
0000100101101111
0000000000011111
A B C x OA
B
C
X
O
1 2 3 4 5 6 7 8 9 10 11 12 13 14 15 16t
01
© 2006 by Béla Lipták
884 PLCs and Other Logic Devices
TABLE 5.1a (continued)Instrument and Control System Functional Diagramming Symbols-Binary Logic, Memory, and Time Functions (Proposed for the nextrevision of ISA S5.1 (now ANSI/ISA-5.01.01) at the time of this writing)
Symbol Definition
No Truth Table Graph
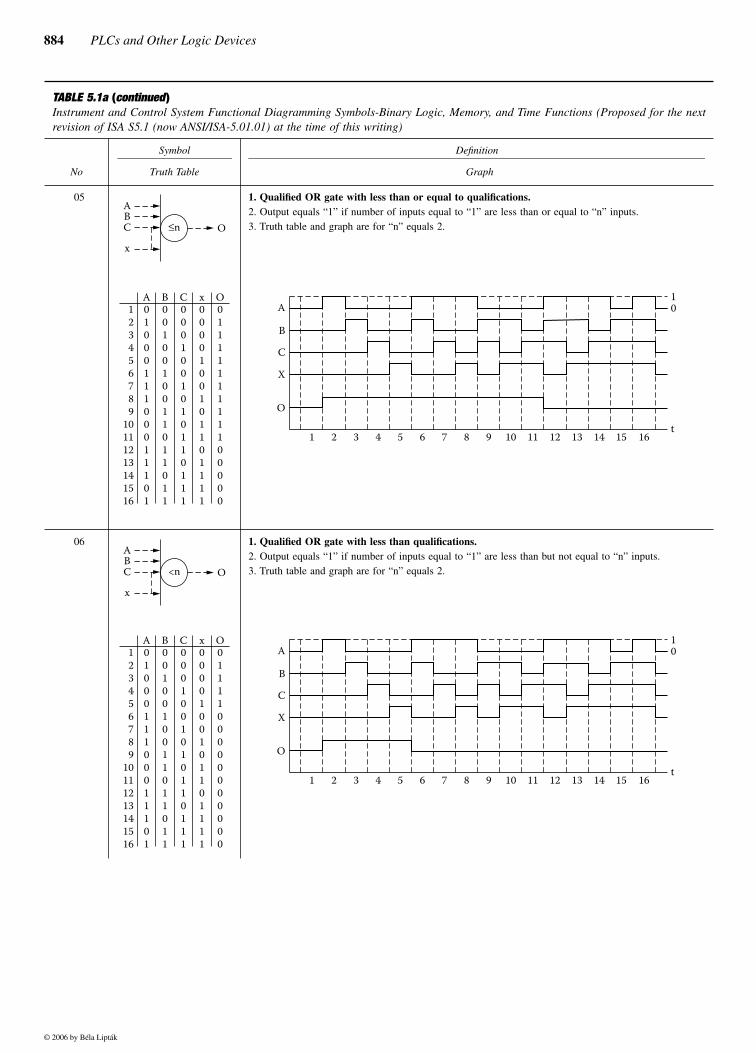
05 1. Qualified OR gate with less than or equal to qualifications.2. Output equals “1” if number of inputs equal to “1” are less than or equal to “n” inputs.3. Truth table and graph are for “n” equals 2.
06 1. Qualified OR gate with less than qualifications.2. Output equals “1” if number of inputs equal to “1” are less than but not equal to “n” inputs.3. Truth table and graph are for “n” equals 2.
ABC
x
O≤n
123456789
10111213141516
0100011100011101
0010010011011011
0001001010110111
0000100101101111
0111111111100000
A B C x OA
B
C
X
O
1 2 3 4 5 6 7 8 9 10 11 12 13 14 15 16t
01
ABC
x
O<n
123456789
10111213141516
0100011100011101
0010010011011011
0001001010110111
0000100101101111
0111100000000000
A B C x OA
B
C
X
O
1 2 3 4 5 6 7 8 9 10 11 12 13 14 15 16t
01
© 2006 by Béla Lipták

5.1 Binary Logic Diagrams for Process Operations 885
TABLE 5.1a (continued)Instrument and Control System Functional Diagramming Symbols-Binary Logic, Memory, and Time Functions (Proposed for the nextrevision of ISA S5.1 (now ANSI/ISA-5.01.01) at the time of this writing)
Symbol Definition
No Truth Table Graph
07 1. Qualified OR gate with equal to qualifications.2. Output equals “1” if inputs equal to “1” are equal to “n” inputs.3. Truth table and graph are for “n” equals 2.
08 1. Qualified OR gate with not equal to qualifications.2. Output equals “1” if inputs equal to “1” are not equal to “n” inputs.3. Truth table and graph are for “n” equals 2.
ABC
x
O=n
123456789
10111213141516
0100011100011101
0010010011011011
0001001010110111
0000100101101111
0000011111100000
A B C x OA
B
C
X
O
1 2 3 4 5 6 7 8 9 10 11 12 13 14 15 16t
01
ABC
x
O≠n
123456789
10111213141516
0100011100011101
0010010011011011
0001001010110111
0000100101101111
0111100000011111
A B C x OA
B
C
X
O
1 2 3 4 5 6 7 8 9 10 11 12 13 14 15 16t
01
© 2006 by Béla Lipták
886 PLCs and Other Logic Devices
TABLE 5.1a (continued)Instrument and Control System Functional Diagramming Symbols-Binary Logic, Memory, and Time Functions (Proposed for the nextrevision of ISA S5.1 (now ANSI/ISA-5.01.01) at the time of this writing)
Symbol Definition
No Truth Table Graph
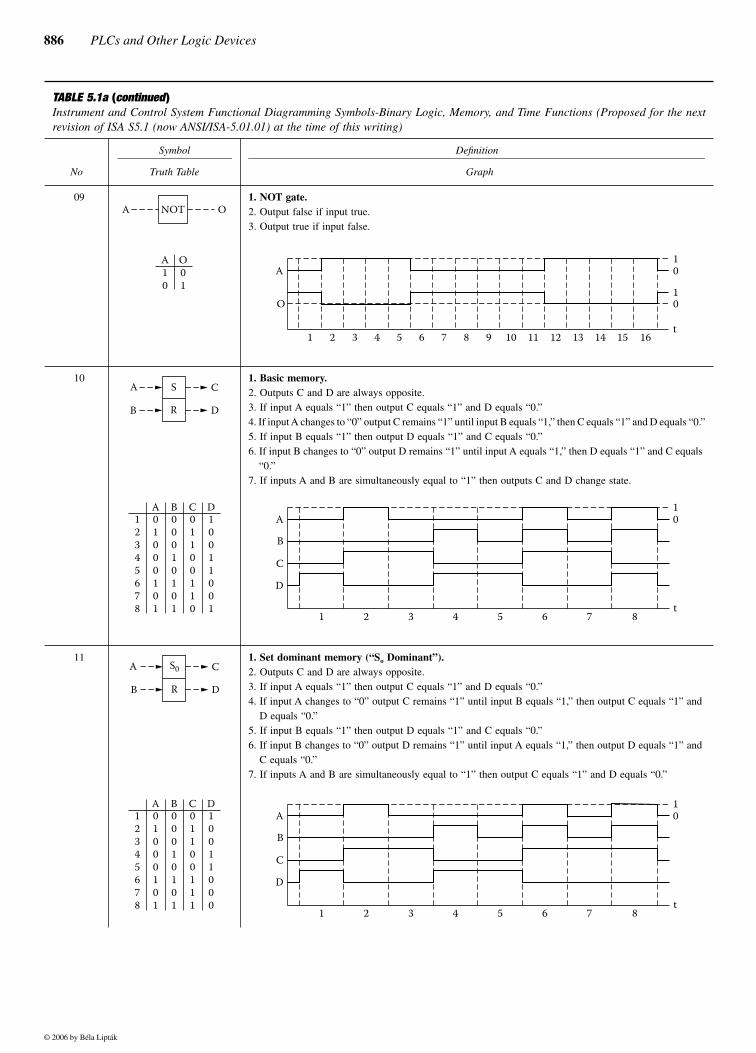
09 1. NOT gate.2. Output false if input true.3. Output true if input false.
10 1. Basic memory.2. Outputs C and D are always opposite.3. If input A equals “1” then output C equals “1” and D equals “0.”4. If input A changes to “0” output C remains “1” until input B equals “1,” then C equals “1” and D equals “0.”5. If input B equals “1” then output D equals “1” and C equals “0.”6. If input B changes to “0” output D remains “1” until input A equals “1,” then D equals “1” and C equals
“0.”7. If inputs A and B are simultaneously equal to “1” then outputs C and D change state.
11 1. Set dominant memory (“So Dominant”).2. Outputs C and D are always opposite.3. If input A equals “1” then output C equals “1” and D equals “0.”4. If input A changes to “0” output C remains “1” until input B equals “1,” then output C equals “1” and
D equals “0.”5. If input B equals “1” then output D equals “1” and C equals “0.”6. If input B changes to “0” output D remains “1” until input A equals “1,” then output D equals “1” and
C equals “0.”7. If inputs A and B are simultaneously equal to “1” then output C equals “1” and D equals “0.”
NOTA O
A10
O01
A
O
1 2 3 4 5 6 7 8 9 10 11 12 13 14 15 16t
01
01
SA
B D
C
R
12345678
01000101
A00010101
B01100110
C10011001
DA
B
C
D
1 2 3 4 5 6 7 8t
01
S0A
B D
C
R
12345678
01000101
A00010101
B01100111
C10011000
DA
B
C
D
1 2 3 4 5 6 7 8t
01
© 2006 by Béla Lipták
5.1 Binary Logic Diagrams for Process Operations 887
TABLE 5.1a (continued)Instrument and Control System Functional Diagramming Symbols-Binary Logic, Memory, and Time Functions (Proposed for the nextrevision of ISA S5.1 (now ANSI/ISA-5.01.01) at the time of this writing)
Symbol Definition
No Truth Table Graph
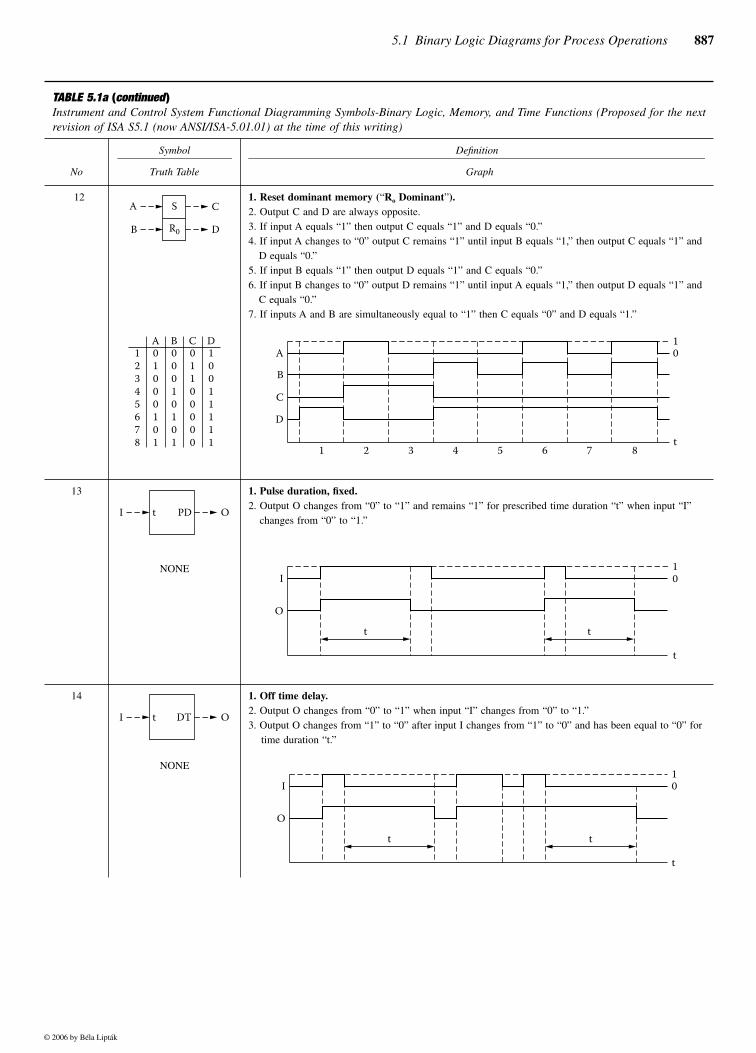
12 1. Reset dominant memory (“Ro Dominant”).2. Output C and D are always opposite.3. If input A equals “1” then output C equals “1” and D equals “0.”4. If input A changes to “0” output C remains “1” until input B equals “1,” then output C equals “1” and
D equals “0.”5. If input B equals “1” then output D equals “1” and C equals “0.”6. If input B changes to “0” output D remains “1” until input A equals “1,” then output D equals “1” and
C equals “0.”7. If inputs A and B are simultaneously equal to “1” then C equals “0” and D equals “1.”
13 1. Pulse duration, fixed.2. Output O changes from “0” to “1” and remains “1” for prescribed time duration “t” when input “I”
changes from “0” to “1.”
NONE
14 1. Off time delay.2. Output O changes from “0” to “1” when input “I” changes from “0” to “1.”3. Output O changes from “1” to “0” after input I changes from “1” to “0” and has been equal to “0” for
time duration “t.”
NONE
SA
B D
C
R0
12345678
01000101
A00010101
B01100000
C10011111
DA
B
C
D
1 2 3 4 5 6 7 8t
01
I t PD O
I
O
t
tt
01
I t DT O
I
O
t
tt
01
© 2006 by Béla Lipták
888 PLCs and Other Logic Devices
the use of the binary symbols given in Appendices A, B, andC are direct extracts from and utilize the current StandardANSI/ISA-S5.2-1976(R1992).
Binary logic switching and memory functions are usedin analog or sequential control schemes. In truth tables andgraphs, Logic One (“1”) is “true” and Logic Zero (“0”) is“false.”
APPENDIX A: GENERAL APPLICATION EXAMPLE
A1. Introduction
This example uses a representative process whose instru-ments are denoted by the symbols of ANSI/ISA-S5.1-1984(R 1992) (ANSI Y32.20-1975). The process equipmentsymbols are included only to illustrate applications ofinstrumentation symbol. The example is not a part ofStandard S5.2.
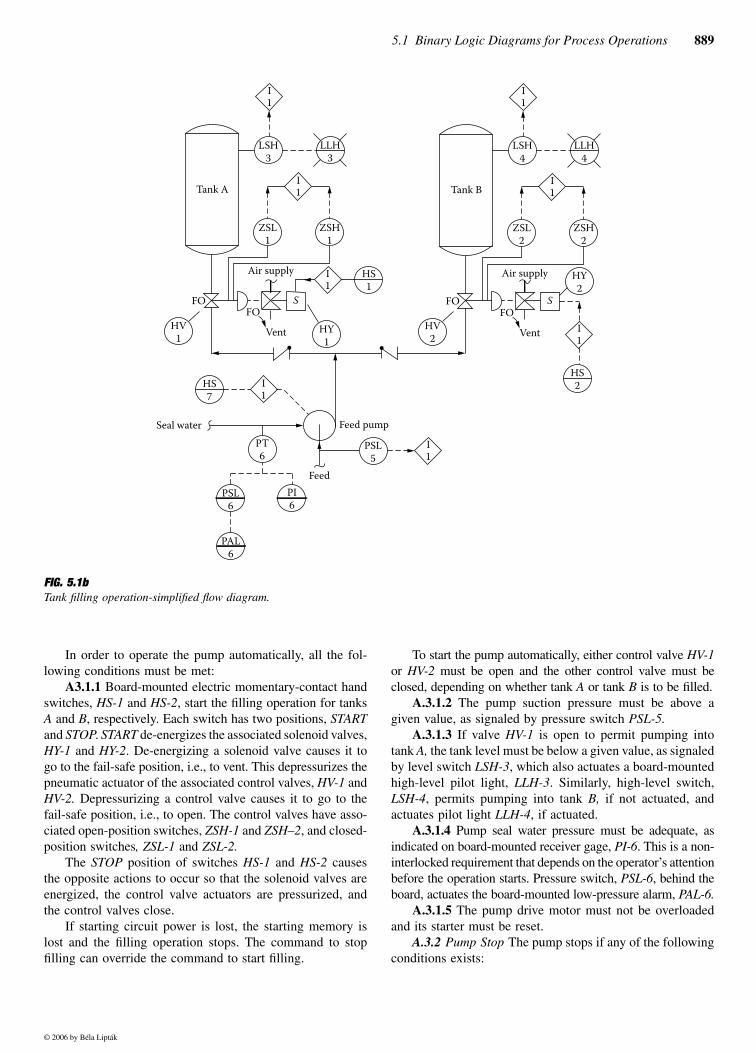
A2. Simplified Flow Diagram
Figure 5.1b provides the flow sheet representation of the logicinvolved in a tank filling operation. A written explanation ofthe various symbols follows:
A3. Word Description
A3.1 Pump Start Feed is pumped into either tank A or tankB. The pump may be operated manually or automatically,selected manually on a local maintained output select switch,HS-7, which has three positions: ON, OFF, and AUTO. Whenthe pump is operating, red pilot light L-8A is on; when notoperating, green pilot light L-8B is on. Once started, the pumpcontinues to operate until a stopping command exists or untilthe control power supply is lost.
The pump may be operated manually at any time providedthat no trouble condition exists: The suction pressure must notbe low; the seal water pressure must not be low; and the pumpmotor must not be overloaded and its starter must be reset.
TABLE 5.1a (continued)Instrument and Control System Functional Diagramming Symbols-Binary Logic, Memory, and Time Functions (Proposed for the nextrevision of ISA S5.1 (now ANSI/ISA-5.01.01) at the time of this writing)
Symbol Definition
No Truth Table Graph
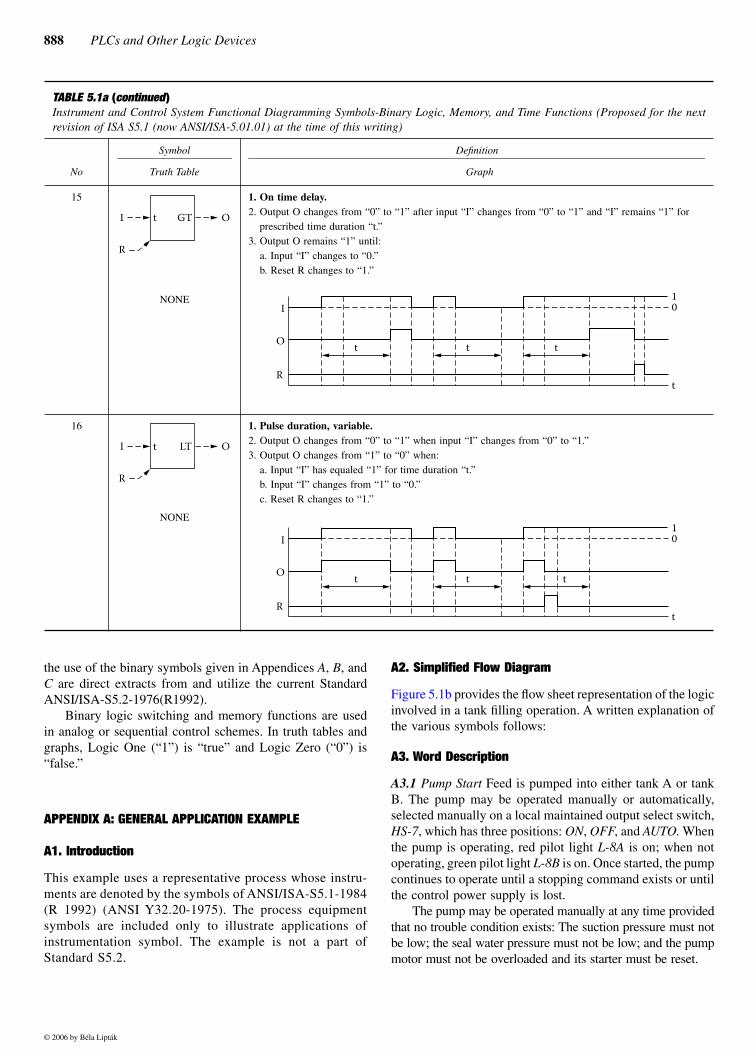
15 1. On time delay.2. Output O changes from “0” to “1” after input “I” changes from “0” to “1” and “I” remains “1” for
prescribed time duration “t.”3. Output O remains “1” until:
a. Input “I” changes to “0.”b. Reset R changes to “1.”
NONE
16 1. Pulse duration, variable.2. Output O changes from “0” to “1” when input “I” changes from “0” to “1.”3. Output O changes from “1” to “0” when:
a. Input “I” has equaled “1” for time duration “t.”b. Input “I” changes from “1” to “0.”c. Reset R changes to “1.”
NONE
I
R
t GT O
I
O
Rt
t
01
t t
I
R
t LT O
I
O
Rt
t
01
t t
© 2006 by Béla Lipták
5.1 Binary Logic Diagrams for Process Operations 889
In order to operate the pump automatically, all the fol-lowing conditions must be met:
A3.1.1 Board-mounted electric momentary-contact handswitches, HS-1 and HS-2, start the filling operation for tanksA and B, respectively. Each switch has two positions, STARTand STOP. START de-energizes the associated solenoid valves,HY-1 and HY-2. De-energizing a solenoid valve causes it togo to the fail-safe position, i.e., to vent. This depressurizes thepneumatic actuator of the associated control valves, HV-1 andHV-2. Depressurizing a control valve causes it to go to thefail-safe position, i.e., to open. The control valves have asso-ciated open-position switches, ZSH-1 and ZSH–2, and closed-position switches, ZSL-1 and ZSL-2.
The STOP position of switches HS-1 and HS-2 causesthe opposite actions to occur so that the solenoid valves areenergized, the control valve actuators are pressurized, andthe control valves close.
If starting circuit power is lost, the starting memory islost and the filling operation stops. The command to stopfilling can override the command to start filling.
To start the pump automatically, either control valve HV-1or HV-2 must be open and the other control valve must beclosed, depending on whether tank A or tank B is to be filled.
A.3.1.2 The pump suction pressure must be above agiven value, as signaled by pressure switch PSL-5.
A.3.1.3 If valve HV-1 is open to permit pumping intotank A, the tank level must be below a given value, as signaledby level switch LSH-3, which also actuates a board-mountedhigh-level pilot light, LLH-3. Similarly, high-level switch,LSH-4, permits pumping into tank B, if not actuated, andactuates pilot light LLH-4, if actuated.
A.3.1.4 Pump seal water pressure must be adequate, asindicated on board-mounted receiver gage, PI-6. This is a non-interlocked requirement that depends on the operator’s attentionbefore the operation starts. Pressure switch, PSL-6, behind theboard, actuates the board-mounted low-pressure alarm, PAL-6.
A.3.1.5 The pump drive motor must not be overloadedand its starter must be reset.
A.3.2 Pump Stop The pump stops if any of the followingconditions exists:
FIG. 5.1bTank filling operation-simplified flow diagram.
LLH3
ZSL1
ZSH1
HS1
HY1
S
Tank A
PT6
PSL5
Feed
PAL6
PSL6
PI6
Feed pump
HS7
HV1
FOFO
Vent
FO
Air supply Air supply
Seal water
LLH4
ZSL2
ZSH2
HY2
S
Tank B
HV2
FO
HS2
I1
I1
I1
I1
I1
Vent
LSH3
LSH4
I1
I1
I1
© 2006 by Béla Lipták
890 PLCs and Other Logic Devices
A.3.2.1 While pumping into a tank, its control valveleaves the fully open position, or the valve of the other tankleaves its fully closed position, provided that the pump is onautomatic control.
A.3.2.2 The tank selected for filling becomes full, pro-vided that the pump is on automatic control.
A.3.2.3 The pump suction pressure is continuously lowfor 5 seconds.
A.3.2.4 The pump drive motor is overloaded. It is imma-terial to the process logic whether or not the memory of thepump motor overload is retained on loss of power in thissystem because the maintained memory that operates the pumpis defined as losing memory on loss of power, and this by itselfwill cause the pump to stop. However, an existing motor-overload condition prevents the motor starter from being reset.
A.3.2.5 The sequence is stopped manually through HS-1or HS-2. If stop and start commands for pump operation existsimultaneously, then the stop command overrides the operatecommand.
A.3.2.6 The pump is stopped manually by HS-7.A.3.2.7 The pump seal water pressure is low. This con-
dition is not interlocked and requires manual intervention tostop the pump.
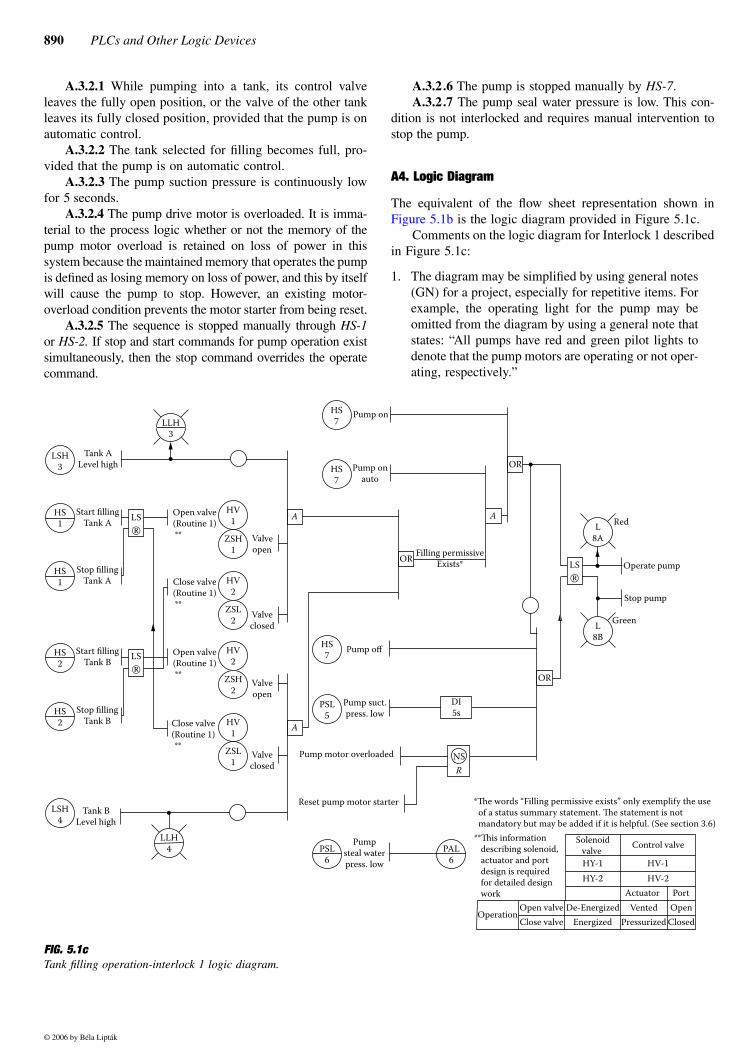
A4. Logic Diagram
The equivalent of the flow sheet representation shown inFigure 5.1b is the logic diagram provided in Figure 5.1c.
Comments on the logic diagram for Interlock 1 describedin Figure 5.1c:
1. The diagram may be simplified by using general notes(GN) for a project, especially for repetitive items. Forexample, the operating light for the pump may beomitted from the diagram by using a general note thatstates: “All pumps have red and green pilot lights todenote that the pump motors are operating or not oper-ating, respectively.”
FIG. 5.1cTank filling operation-interlock 1 logic diagram.
LLH3
LSH3
LSH4
HS1
HS1
HS2
HS2
HV1
ZSH1
HV2
ZSH2
HV2
ZSL2
HV1
ZSL1
LS
LS
A
LLH4
HS7
HS7
HS7
PSL5
PAL6
L8A
L8B
Pump on
Pump onauto
LS
PSL6
DI5s
Pump off
Tank ALevel high
Tank BLevel high
NSR
Start fillingTank A
Start fillingTank B
Stop fillingTank A
Stop fillingTank B
Open valve(Routine 1)**
Close valve(Routine 1)**
Open valve(Routine 1)**
Close valve(Routine 1)**
Valveopen
Valveopen
Valveclosed
Valveclosed
A
Pump motor overloaded
Reset pump motor starter
Pumpsteal waterpress. low
Pump suct.press. low
A
OR Filling permissiveExists*
OR
OR
Operate pump
Stop pump
Green
Red
*�e words “Filling permissive exists” only exemplify the use of a status summary statement. �e statement is not mandatory but may be added if it is helpful. (See section 3.6)**�is information describing solenoid, actuator and port design is required for detailed design work
Solenoidvalve Control valve
HY-1 HV-1HY-2 HV-2
Actuator Port
OperationOpen valveClose valve
OpenClosedEnergized
De-EnergizedPressurized
Vented
© 2006 by Béla Lipták
5.1 Binary Logic Diagrams for Process Operations 891
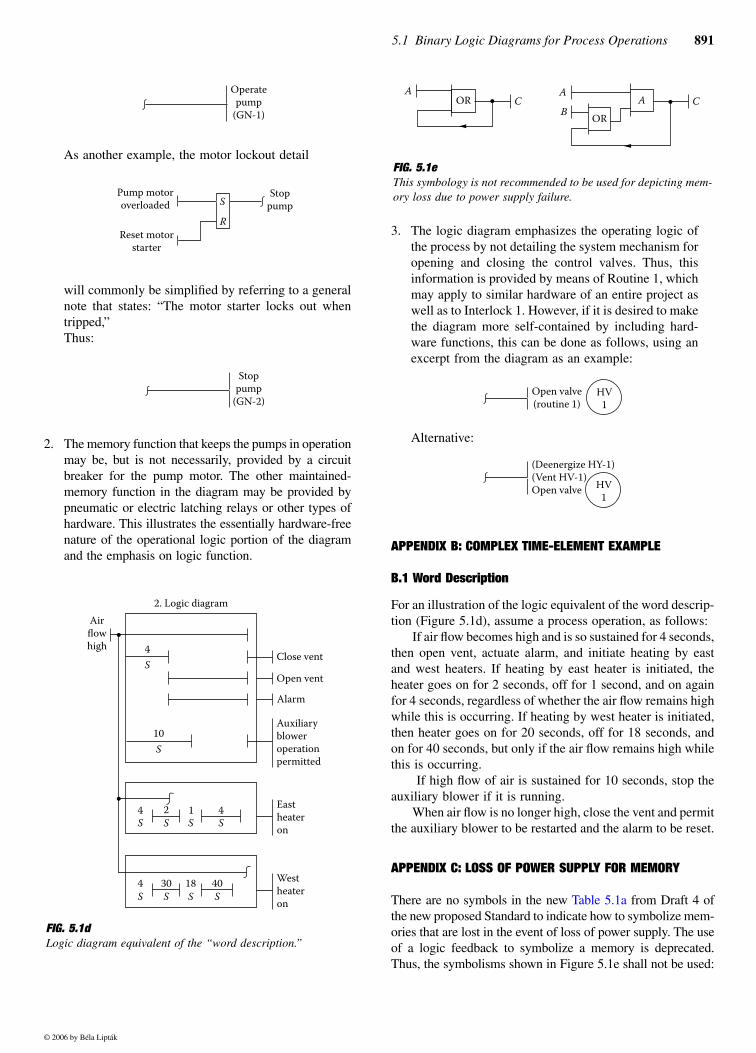
As another example, the motor lockout detail
will commonly be simplified by referring to a generalnote that states: “The motor starter locks out whentripped,”Thus:
2. The memory function that keeps the pumps in operationmay be, but is not necessarily, provided by a circuitbreaker for the pump motor. The other maintained-memory function in the diagram may be provided bypneumatic or electric latching relays or other types ofhardware. This illustrates the essentially hardware-freenature of the operational logic portion of the diagramand the emphasis on logic function.
3. The logic diagram emphasizes the operating logic ofthe process by not detailing the system mechanism foropening and closing the control valves. Thus, thisinformation is provided by means of Routine 1, whichmay apply to similar hardware of an entire project aswell as to Interlock 1. However, if it is desired to makethe diagram more self-contained by including hard-ware functions, this can be done as follows, using anexcerpt from the diagram as an example:
Alternative:
APPENDIX B: COMPLEX TIME-ELEMENT EXAMPLE
B.1 Word Description
For an illustration of the logic equivalent of the word descrip-tion (Figure 5.1d), assume a process operation, as follows:
If air flow becomes high and is so sustained for 4 seconds,then open vent, actuate alarm, and initiate heating by eastand west heaters. If heating by east heater is initiated, theheater goes on for 2 seconds, off for 1 second, and on againfor 4 seconds, regardless of whether the air flow remains highwhile this is occurring. If heating by west heater is initiated,then heater goes on for 20 seconds, off for 18 seconds, andon for 40 seconds, but only if the air flow remains high whilethis is occurring.
If high flow of air is sustained for 10 seconds, stop theauxiliary blower if it is running.
When air flow is no longer high, close the vent and permitthe auxiliary blower to be restarted and the alarm to be reset.
APPENDIX C: LOSS OF POWER SUPPLY FOR MEMORY
There are no symbols in the new Table 5.1a from Draft 4 ofthe new proposed Standard to indicate how to symbolize mem-ories that are lost in the event of loss of power supply. The useof a logic feedback to symbolize a memory is deprecated.Thus, the symbolisms shown in Figure 5.1e shall not be used:
FIG. 5.1dLogic diagram equivalent of the “word description.”
Operatepump
(GN-1)
S
R
Stoppump
Pump motoroverloaded
Reset motorstarter
Stoppump
(GN-2)
4S
4S
4S
1S
2S
30S
4S
18S
40S
Close vent
Open vent
Alarm
Auxiliarybloweroperationpermitted
Eastheateron
Westheateron
10S
Airflowhigh
2. Logic diagram
FIG. 5.1eThis symbology is not recommended to be used for depicting mem-ory loss due to power supply failure.
OR C CA A
AB OR
HV1
Open valve(routine 1)
HV1
(Deenergize HY-1)(Vent HV-1)Open valve
© 2006 by Béla Lipták

892 PLCs and Other Logic Devices
Bibliography
American National Standards Institute Standard Y32.14-1973, ‘‘GraphicSymbols for Logic Diagrams (Two-State Devices),’’ 1973.
American National Standards Institute Standard X3.5-1970, ‘‘FlowchartSymbols and Their Usage in Information Processing,’’ 1970.
ANSI/ISA-S5.2-1976 (R 1992), ‘‘Binary Logic Diagrams for Process Oper-ations,’’ reaffirmed July 13, 1992.
Draft 4 of ISA Draft 5.01.01, ‘‘Instrumentation Symbols and Identification,’’Research Triangle Park, NC: ISA, 2000.
International Electrotechnical Commission Recommendation, Publication117-15, ‘‘Binary Logic Elements,’’ 1972.
National Electric Manufacturers Association Standard ICS 1-103, ‘‘StaticSwitching Control Devices.’’
National Fluid Power Association Standard T.3.7.68.2, ‘‘Graphic Symbolsfor Fluidic Devices and Circuits.’’
© 2006 by Béla Lipták