Embed Size (px)
Citation preview
Proboscidean Mitogenomics: Chronologyand Mode of Elephant EvolutionUsing Mastodon as OutgroupNadin Rohland
1[, Anna-Sapfo Malaspinas
2,3[, Joshua L. Pollack
2, Montgomery Slatkin
2, Paul Matheus
4,
Michael Hofreiter1*
1 Max Planck Institute for Evolutionary Anthropology, Leipzig, Germany, 2 Department of Integrative Biology, University of California Berkeley, Berkeley, California, United
States of America, 3 Department of Zoology and Animal Biology, University of Geneva, Geneva, Switzerland, 4 Alaska Quaternary Center, University of Alaska Fairbanks,
Fairbanks, Alaska, United States of America
We have sequenced the complete mitochondrial genome of the extinct American mastodon (Mammut americanum)from an Alaskan fossil that is between 50,000 and 130,000 y old, extending the age range of genomic analyses byalmost a complete glacial cycle. The sequence we obtained is substantially different from previously reported partialmastodon mitochondrial DNA sequences. By comparing those partial sequences to other proboscidean sequences, weconclude that we have obtained the first sequence of mastodon DNA ever reported. Using the sequence of themastodon, which diverged 24–28 million years ago (mya) from the Elephantidae lineage, as an outgroup, we infer thatthe ancestors of African elephants diverged from the lineage leading to mammoths and Asian elephantsapproximately 7.6 mya and that mammoths and Asian elephants diverged approximately 6.7 mya. We also concludethat the nuclear genomes of the African savannah and forest elephants diverged approximately 4.0 mya, supportingthe view that these two groups represent different species. Finally, we found the mitochondrial mutation rate ofproboscideans to be roughly half of the rate in primates during at least the last 24 million years.
Citation: Rohland N, Malaspinas AS, Pollack JL, Slatkin M, Matheus P, et al. (2007) Proboscidean mitogenomics: Chronology and mode of elephant evolution using mastodonas outgroup. PLoS Biol 5(8): e207. doi:10.1371/journal.pbio.0050207
Introduction
An accurate and well-supported phylogeny is the basis forunderstanding the evolution of species. With the appropriateand adequate amount of data, it is possible not only todetermine relationships among species, but also to datedivergence events between lineages. In turn, divergenceevents can be correlated to environmental changes recordedin the fossil record to help understand mechanisms drivingevolution. The power of these correlations, and argumentsfor particular environmental mechanisms driving evolu-tionary change, increases when the pattern is repeated acrossmultiple taxa.
Sequencing complete mitochondrial genomes has becomea powerful tool in the investigation of phylogenetic relation-ships among animal groups, principally mammals, birds, andfishes. Despite this potential, and the proliferation of ancientmitochondrial DNA (mtDNA) research, geneticists so far havesucceeded in sequencing complete mitochondrial genomesfrom ancient DNA for only a few extinct species of moas [1,2]and the woolly mammoth [3,4]. For both groups, the completesequences resolved long-standing evolutionary questions,which argues for an extension of such analyses to otherspecies.
The living elephants comprise the last survivors of theElephantidae, a once-flourishing sub-group of the OrderProboscidea that lived throughout much of Africa, Eurasia,and the Americas [5]. The evolution of Elephantidae, whichincludes the recently extinct mammoths, has been extensivelystudied in recent years using both modern and ancientsequences of mtDNA and nuclear DNA (nuDNA). For
example, nuDNA sequences have been used to argue thatthe African forest elephant is a valid species (Loxodontacyclotis), distinct from the African savannah elephant (L.africana) [6], with the two species having diverged by 2.6million years ago (mya), though this view is disputed [7].Two recent studies reported complete mtDNA genomes
from the woolly mammoth (Mammuthus primigenius) [3,4] thatprovided strong evidence that mammoths were more closelyrelated to Asian elephants than to African elephants.However, another study analyzing several nuDNA segmentscautioned that the lack of a closely related outgroup is aproblem in phylogenetic analyses of Elephantidae and arguedthat the relationship between mammoth and the livingelephants is still unresolved [8]. To date, all genetically basedanalyses of elephant phylogenies have used dugong (Dugongdugon) and hyrax (Procavia capensis) as outgroups. These are thenearest living relatives of elephants, but they diverged fromproboscideans some 65 mya [5,9], which severely limits their
Academic Editor: David Penny, Massey University, New Zealand
Received January 19, 2007; Accepted May 24, 2007; Published July 24, 2007
Copyright: � 2007 Rohland et al. This is an open-access article distributed underthe terms of the Creative Commons Attribution License, which permits unrestricteduse, distribution, and reproduction in any medium, provided the original authorand source are credited.
Abbreviations: BP, before present; CI, credibility interval; ML, maximum likelihood;mtDNA, mitochondrial DNA; mya, million years ago; NJ, neighbor joining; nuDNA,nuclear DNA
* To whom correspondence should be addressed. E-mail: [email protected]
[ These authors contributed equally to this work.
PLoS Biology | www.plosbiology.org August 2007 | Volume 5 | Issue 8 | e2071663
PLoS BIOLOGY
power as effective outgroups for assessing elephant geneticdata.
In contrast, ancestors of the American mastodon, Mammutamericanum, diverged from the Elephantidae lineage no earlierthan 28.3 mya [10], which would make mastodon a muchmore appropriate outgroup for the Elephantidae. Moreover,mastodon fossils preserved in permafrost and dating to thelate Pleistocene have been recovered in eastern Beringia(Alaska and Yukon). Their young age and preservation inpermafrost means Beringian mastodon are excellent candi-dates for ancient DNA analyses [11,12]. The good biochemicalpreservation of mastodon samples was appreciated early inthe study of ancient DNA. In 1985, Shoshani and colleaguesdetermined the immunological distances of albumins amongmammoth, mastodon, and African and Asian elephant [13].
We report here what is to our knowledge the first completemitochondrial genome for mastodon. The sequence wasderived from a tooth collected in northern Alaska, wherePleistocene bones are well-preserved in permafrost. Collagenfrom the root of the tooth was radiocarbon-dated to morethan 50,000 y before present (BP), but the geologicalprovenance suggests it is not older than 130,000 y (seeMaterials and Methods). This extremely old and completesequence is of interest in its own right, but it also can be usedto help resolve existing debates concerning the phylogeny ofthe Elephantidae and allows us to evaluate rates of molecularevolution within the Proboscidea, because it finally providesan appropriate outgroup for such analyses. Here, we use themastodon mtDNA sequence to resolve relationships amongAfrican elephants, Asian elephants, and mammoths and tomore accurately date their divergence times.
Results/Discussion
Sequence Determination and CharacteristicsTo determine the mastodon mtDNA genome sequence, we
used 78 primer pairs, separated into two sets of 39 pairs each,on DNA extract from a mastodon molar originating from
northern Alaska (Figure 1) and performed quadruplicateamplifications for each primer pair. In the first round ofamplification, 48 primer pairs yielded at least one positiveresult, and for 36 primer pairs all four attempts were positive.To obtain the remaining fragments, we used four consecutiverounds of redesigning primers (see Protocol S1 for details). Ineach round, whenever possible, we used the mastodonsequences from flanking fragments as the basis for primerdesign. With three primer pairs, PCR controls or extractioncontrols yielded products of the correct size. All three cases ofcontamination occurred with primers for which it was notpossible to design the primers in a way that they selectedagainst the amplification of human DNA. The resultingproducts were cloned and sequenced and turned out to beexclusively of human origin. Two out of six clones obtainedfrom a single amplification from mastodon extract using oneof these primer pairs were also of human origin. We did notreplicate part of the mastodon sequence in an independentlaboratory, following the argument we have made previously[14], and in contrast to Cooper and Poinar [15], who arguedthat this is necessary in all ancient DNA studies. None of thedetermined sequence fragments was identical to any knownsequence either from GenBank or determined previously inour laboratory. Moreover, to ensure authenticity of eachindividual fragment, apart from extensive internal replica-tion, we compared each PCR fragment individually to allpublished sequences from GenBank and noted the similarityto both Elephantidae and hyrax and dugong mtDNAsequences. All amplified fragments showed between 78.1%and 98.6% identity to Elephantidae sequences and between45.9% and 92.6% identity to hyrax and dugong sequences.Moreover, for individual fragments, the average identity toElephantidae was 6.2% to 40% higher than that to hyrax anddugong. These results are consistent with the phylogeneticposition of the mastodon and difficult—if not impossible—toexplain by contamination. Therefore, we conclude that ourresults indeed represent authentic mastodon sequences.The length of the mastodon mitochondrial genome is
16,469 bp. Thus, it is about 300–400 bp smaller than themitochondrial sequences of the other proboscideans pub-lished to date. This difference in length is most likely anartifact due to the failure to obtain an amplification productthat covers the complete tandem repeat in the control region.The mastodon mitochondrial genome contains 13 proteincoding genes, 22 tRNA genes, two rRNA genes, and thecontrol region, as expected for a placental mammal. Stop andstart codons are shared with at least one of the otherproboscideans for each of the protein coding genes, exceptND3, ND4, and ND6. For these three genes, the mastodonsequences start with ATT, ATG, and GTG, whereas thecorresponding genes of all other proboscideans start withATC or ATA, GTG, and ATG, respectively. Differences in theannotation were observed in the other sequences notablybecause of stop codons being created by polyadenylation, aphenomenon widely present in mitochondrial genomes ofother vertebrates [16]. The early stop of ND4 of the woollymammoth sequences was not observed, and none of theproteins of the mastodon seems to be truncated. With adivergence time of at least 24 million years from any livingrelative, the mastodon sequence shows that the multiplexPCR approach can also be applied to taxa without sequenceinformation from closely related species.
PLoS Biology | www.plosbiology.org August 2007 | Volume 5 | Issue 8 | e2071664
Complete Mastodon mtDNA Sequence
Author Summary
We determined the complete mitochondrial genome of themastodon (Mammut americanum), a recently extinct relative of theliving elephants that diverged about 26 million years ago. Weobtained the sequence from a tooth dated to 50,000–130,000 yearsago, increasing the specimen age for which such palaeogenomicanalyses have been done by almost a complete glacial cycle. Usingthis sequence, together with mitochondrial genome sequences fromtwo African elephants, two Asian elephants, and two woollymammoths (all of which have been previously sequenced), weshow that mammoths are more closely related to Asian than toAfrican elephants. Moreover, we used a calibration point lyingoutside the Elephantidae radiation (elephants and mammoths),which enabled us to estimate accurately the time of divergence ofAfrican elephants from Asian elephants and mammoths (about 7.6million years ago) and the time of divergence between mammothsand Asian elephants (about 6.7 million years ago). These dates arestrikingly similar to the divergence time for humans, chimpanzees,and gorillas, and raise the possibility that the speciation ofmammoth and elephants and of humans and African great apeshad a common cause. Despite the similarity in divergence times, thesubstitution rate within primates is more than twice as high as inproboscideans.
Comparison with Previously Published MastodonSequences
Partial DNA sequences that are claimed to be derived frommastodon are available from four studies. The sequences ofYang et al. [17] (228 bp of CYTB) and Joger et al. [18] (294 bpof CYTB) show substantially less divergence from mammothand elephants than our sequence. The numbers of substitu-tions between their mastodon sequences and the Elephanti-dae are comparable to differences within the Elephantidae(results not shown). In contrast, our sequence clearly differsfrom the elephantid sequences. The results of Yang et al. havebeen recently questioned [19,20]. Debruyne et al. [19]concluded that Yang et al.’s mammoth sequence is a probablechimera of African and Asian elephant. Our study also rejectsthe results of Yang et al. for mastodon because the fragmentof their CYTB mastodon sequence clusters closely withinElephantidae (see Figure S1A), as expected by the number ofsubstitutions. For the same reason, the partial sequence ofJoger et al. also seems to be derived from an Asian/Africanelephant contaminant (see Figure S1B). Finally, the unpub-lished 16S rDNA sequences obtained by Park et al. andGoldstein et al. (GenBank accession numbers AF279699 andAY028924, respectively) show 97% and 99% identity toprimates using Blastn [21], which shows that these twosequences also were very likely derived from contamination.
Phylogenetic ResultsIn order to further investigate proboscidean evolution, we
used the six existing whole mitochondrial genomes ofElephantidae (two African elephants, L. africana; two Asianelephants, Elephas maximus; and two woolly mammoths,Mammuthus primigenius) together with our newly obtainedMammut americanum sequence. As the mastodon lineage isevolutionarily much closer to Elephantidae than to extantoutgroup species such as dugong or hyrax, multiple sub-stitutions should not represent such a pronounced problemas is the case with the latter species. A comparison of theseven proboscidean mitochondrial genomes to those fromhyrax and dugong shows that the number of substitutionsseparating mastodon from the Elephantidae is less than halfthat separating either hyrax or dugong from the Elephantidae(Table S1). Consistent with this result, the rates of synon-ymous (ds) and nonsynonymous (dn) substitutions are muchlower when using mastodon as the outgroup (ds ¼ 0.4; dn ¼0.05). Using dugong or hyrax as the outgroup, ds is 1.2,showing substitution saturation [4], and dn is still 0.15. Thetransition/transversion ratio can also be used as a measure ofsubstitution saturation [3,22]. Including the whole mitochon-drial genome of the cow (Bos taurus) and the ostrich (Struthiocamelus) reveals that dugong and hyrax have reached a plateaufor both number of substitutions and transition/transversion
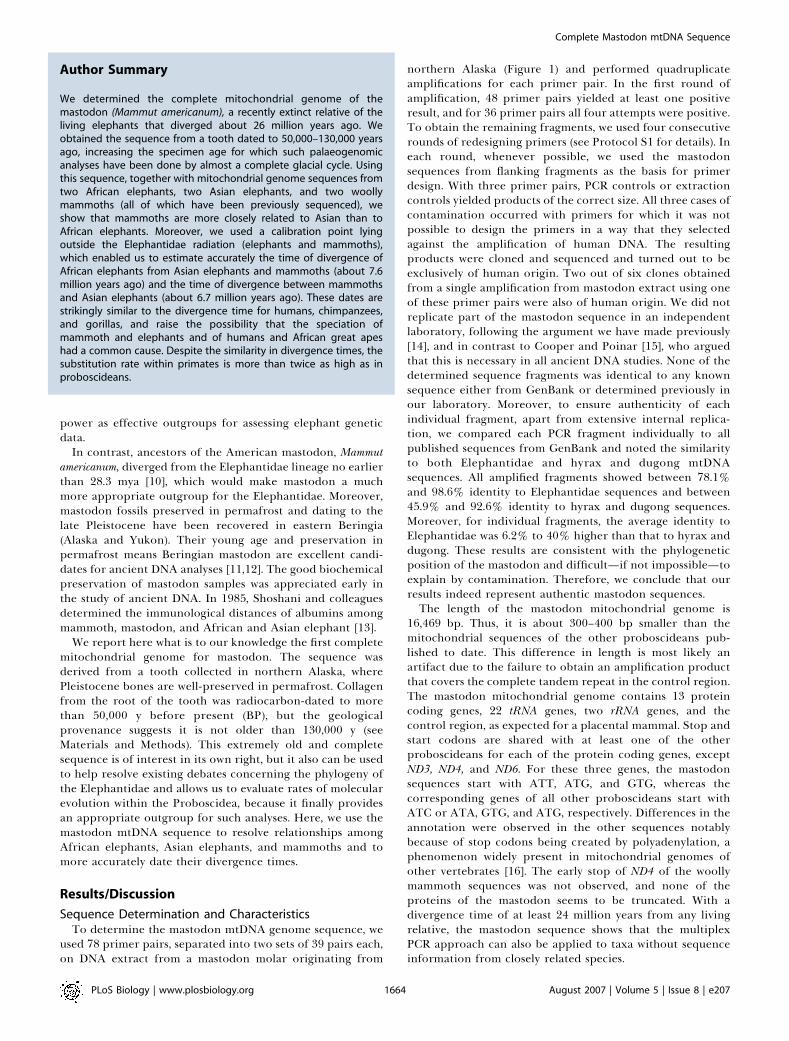
Figure 1. Appearance and Location of Origin of the Mastodon Tooth (IK-99–237) Used for Sequencing of the mtDNA Genome
The scale bar shows centimeters.doi:10.1371/journal.pbio.0050207.g001
PLoS Biology | www.plosbiology.org August 2007 | Volume 5 | Issue 8 | e2071665
Complete Mastodon mtDNA Sequence
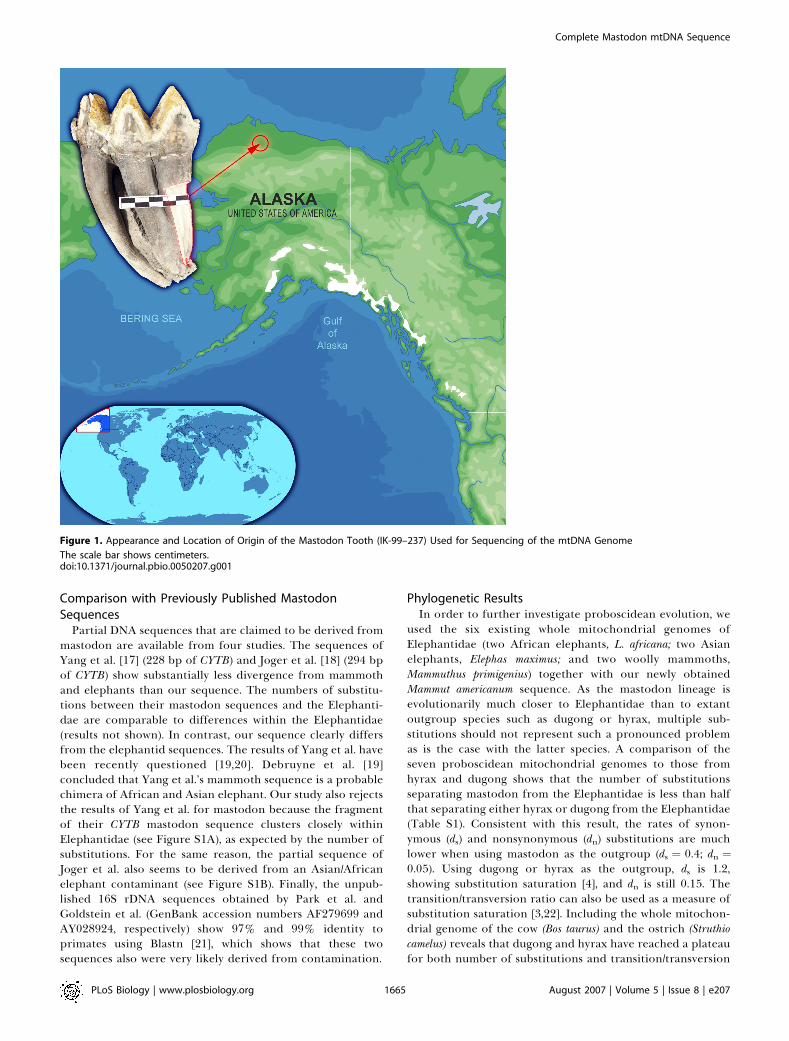
ratio when compared to Elephantidae, whereas the mastodonhas not (Figure 2). Thus, as previously noted [23], themastodon represents a much better outgroup for inferringElephantidae evolution than either dugong or hyrax.
The greater suitability of mastodon as an outgroup to theElephantidae is further demonstrated by the results of thephylogenetic analyses. Using the mastodon sequence as anoutgroup, we obtained higher support values for a sistergroup relationship of mammoth and Asian elephant thanprevious studies [3,4] and obtained the same tree topologyfrom different methods of phylogenetic inference (Table 1).The bootstrap values for this relationship were between 94%(neighbor joining [NJ]) and 99% (maximum likelihood [ML])with a Bayesian posterior probability of 1.00 (Table 1). Thesebootstrap values do not vary significantly among substitutionmodels and are not dependent on whether the data arepartitioned or unpartitioned (results not shown). Thus, atleast with regard to mtDNA sequences, the relationshipamong mammoth and the living elephant species can nolonger be seen as equivocal, as argued by some authors [8].This result indicates that mastodon would also provide anexcellent outgroup for phylogenetic analyses of Elephantidaeusing nuclear sequences [8] if it became possible to recovernuclear mastodon DNA sequences.
Using our complete mtDNA mastodon sequence, we wereable to employ gene-by-gene phylogenetic analyses to explainwhy several earlier studies found a sister group relationshipbetween African elephants and mammoths. The recon-structed phylogeny of the Elephantidae varied widely whenwe used each of the 13 protein coding genes and the tworRNAs individually. We recovered the mammoth–Asianelephant topology for the majority of the genes, but withlower support values (44%–90% for bootstraps and 0.42–1.00for posterior probabilities). Other genes supported differenttree topologies, sometimes with high bootstrap values orBayesian posterior probabilities (up to 90% or 1.00; see
Figure 3 and Table S2). In fact, when considering NJ treesalone, the majority (eight of 15) of the single-gene analyses infact supported an incorrect topology. Some single-geneanalyses resulted in different, yet well supported topologieswhen hyrax and dugong were used as the outgroup instead ofmastodon [4]. These results indicate that studies based on asingle gene can be misleading, and long sequences may oftenbe necessary to obtain correct phylogenies (Figures 3 and S2;Protocol S3; see also, e.g., [24–27]).
Dating of Elephantidae Divergence EventsUnlike the sequences of the nearest living outgroups of the
Elephantidae, the dugong and the hyrax, the mastodonsequence has not yet reached substitution saturation (FigureS3). Consequently, the mastodon mtDNA sequence providesbetter estimates of the dates of divergence within theElephantidae. Moreover, fossil evidence constrains thedivergence of hyrax and dugong from proboscideans toearlier than ;60 mya, the date for the oldest proboscideanfossil genus, Phosphatherium [28]. Previous attempts to date theElephantidae divergence either used the two very distantoutgroups, with limited success because the sequencesviolated the molecular clock assumption [4], or used thedivergence of African elephant as calibration point [3], whichyields more reliable relative divergence dates within Ele-phantidae, but does not provide independent estimates ofdivergence times within this group. Thus, the mastodonsequence allows independent dating of Elephantidae diver-gence times based on the sequence of a well-calibratedoutgroup.Using the best-fitting topology, we found the TN93 [29]
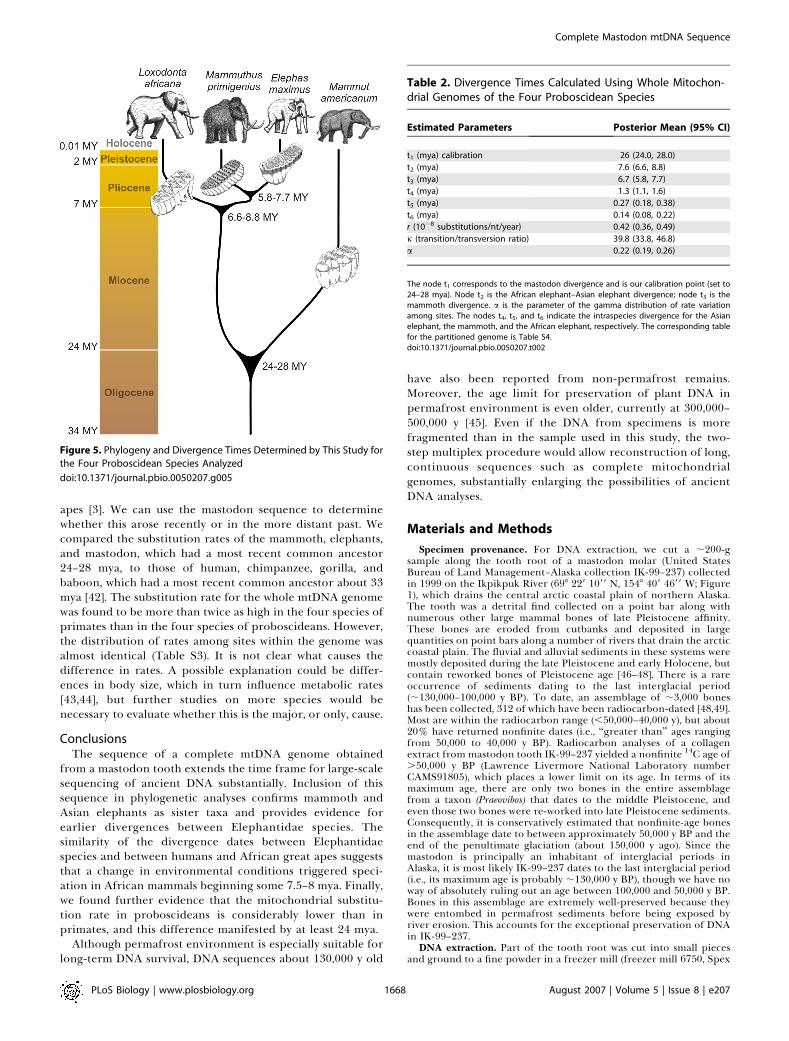
model of substitution to be the simplest that fitted the data(results not shown). Using this substitution model, we werenot able to reject the assumption of a molecular clock for thewhole mtDNA genome sequences of the mastodon and thethree Elephantidae species (2D‘ ¼ 6.8; p ¼ 0.24). Using theBayesian approach of Yang and Rannala [30], we evaluatedthe saturation level of our data by plotting the posteriormeans versus the width of the 95% credibility intervals (CIs)of the divergence times. The relationship is almost linear, andthe coefficient of correlation of the linear regression has avalue of 0.85 (Figure 4). Although a correlation of 0.85suggests that the sequence data are highly informative it isstill possible that the accuracy of divergence time estimatescould be further improved by additional sequence data.When we used the paleontologically determined divergencedate of 24–28 mya for mastodon [10,31], the divergence timeof the African elephant turned out to be older than the 6 myapreviously assumed [32]. In fact, we calculated it to have aposterior mean of 7.6 mya (95% CI 6.6 to 8.8 mya) when usingthe whole mitochondrial genome. The divergence betweenmammoth and Asian elephant also moves back in time to 6.7mya (CI 5.8 to 7.7 mya; Figure 5; Table 2). Both dates areconcordant with the presence of African elephant and Asianelephant fossils by 5.4–7.3 and 5.2–6.7 mya [33], respectively.Only about a million years separates the two divergenceevents, which is less than in humans, chimpanzees, andgorillas [34], for which extensive lineage sorting has beenfound [35,36]. Hence, we expect lineage sorting for thenuclear genome to also be problematic for Elephantidae, asclaimed by Capelli et al. [8].Our new estimates make the divergence of mammoth and
Figure 2. Ratio of the Number of Transitions to the Number of
Transversions
The six points correspond to the ratio between species of Elephantidae(first two points), between Elephantidae and Mammut, betweenProboscidea and (Dugong, Procavia), between Uranotheria and Bos,and between Mammalia and Struthio. The corresponding divergencetimes for proboscideans are given in Table 2. Dugong and hyraxdiverged from Proboscidea 65 mya [5,9]. We used 105 mya for theUranotheria–ruminant split ([9] and citations therein). The mammalian–bird divergence was set to 313 mya (the mean value of the confidenceinterval of [62]; but see also [63,65]). The arrows indicate the points ofinterest. The uncertainty of the divergence times is not taken intoaccount because the goal was to show the general trend.doi:10.1371/journal.pbio.0050207.g002
PLoS Biology | www.plosbiology.org August 2007 | Volume 5 | Issue 8 | e2071666
Complete Mastodon mtDNA Sequence
African and Asian elephants even closer in time to thedivergence of humans, chimpanzees, and gorillas, and othermammalian taxa. A number of environmental changes wereoccurring globally at that time, including the spread ofgrasslands and an increase in C4 plant biomass [37,38].Further efforts should be given to studying the relationshipbetween environmental changes and these phylogeneticevents during the late Miocene.
Finally, our revised divergence dates also have bearing onthe status of the African forest elephant. Based on nuDNAsequences, Roca et al. [6] argued that the African forestelephant represents its own species, L. cyclotis, distinct fromthe savannah elephant, L. africana. Using nuDNA sequencedata and a divergence time between African and Asianelephants of 5 mya, they estimated the divergence betweenthe nuDNA sequences from African savannah and forestelephants to be 2.63 6 0.94 mya, and argued that both thedeep divergence and the reciprocal monophyly betweenforest elephants and savannah elephants with regard tonuDNA support the distinction of the two forms as differentspecies, a view also supported by microsatellite analyses [39].However, based on extensive mtDNA analyses, both Eggert etal. [40] and Debruyne [7] disputed this view, as they found
forest and savannah elephants being polyphyletic withrespect to mtDNA sequences. In an extension of their earlieranalysis, using both X and Y chromosomal and mtDNAsequences, Roca et al. [41] confirmed their view of adistinction on the species level and argued for unidirectionalgene flow of mtDNA from forest elephants to savannahelephants. Although, complete mtDNA sequences for the twoAfrican elephant are not available, we can use our results torecalculate the divergence time between forest and savannahelephant inferred from the nuclear sequences. Using ourestimate of 7.6 mya for the initial Loxodonta divergenceincreases the estimated divergence time to 4.0 mya. This dateis older than the divergence times of many species pairs andhence supports the classification of African savannah andforest elephants as different species as proposed by Roca et al.[6,41].
mtDNA Substitution RateThe initial sequencing of the mammoth mitochondrial
genome indicated that the substitution rate within Elephan-tidae is much lower than in humans and the African great
Table 1. Increase of the Support (Bootstrap or Posterior Probability) When Using the Mastodon as Outgroup to Reconstruct theElephantidae Phylogeny
Study Outgroup(s) NJ Maximum Parsimony ML Bayesian
[4] Dugong and hyrax 82 (M–E) 95 (M–E) — (M–E) 1.00 (M–E)
[3] Dugong and hyrax 87 (M–E) 90 (M–E) 54 (M–L) 1.00 (M–E)
[3] Dugong 73 (M–L) 62 (M–E) 56 (M–L) 0.97 (M–L)
[3] Hyrax 83 (M–E) 93 (M–E) 79 (M–E) 0.91 (M–E)
This study Mastodon 94 (M–E) 98 (M–E) 99 (M–E) 1.00 (M–E)
The sister group relationships are indicated by (M–E) for mammoth and Asian elephant as sister taxa and (M–L) for mammoth and African elephant as sister taxa. Note that for all treereconstruction methods we recover the same topology when using the mastodon as outgroup. The ML method used by Rogaev et al. [4] is based on a likelihood ratio test and hence nobootstrap value is computed, but rather a p-value (p , 0.01).doi:10.1371/journal.pbio.0050207.t001
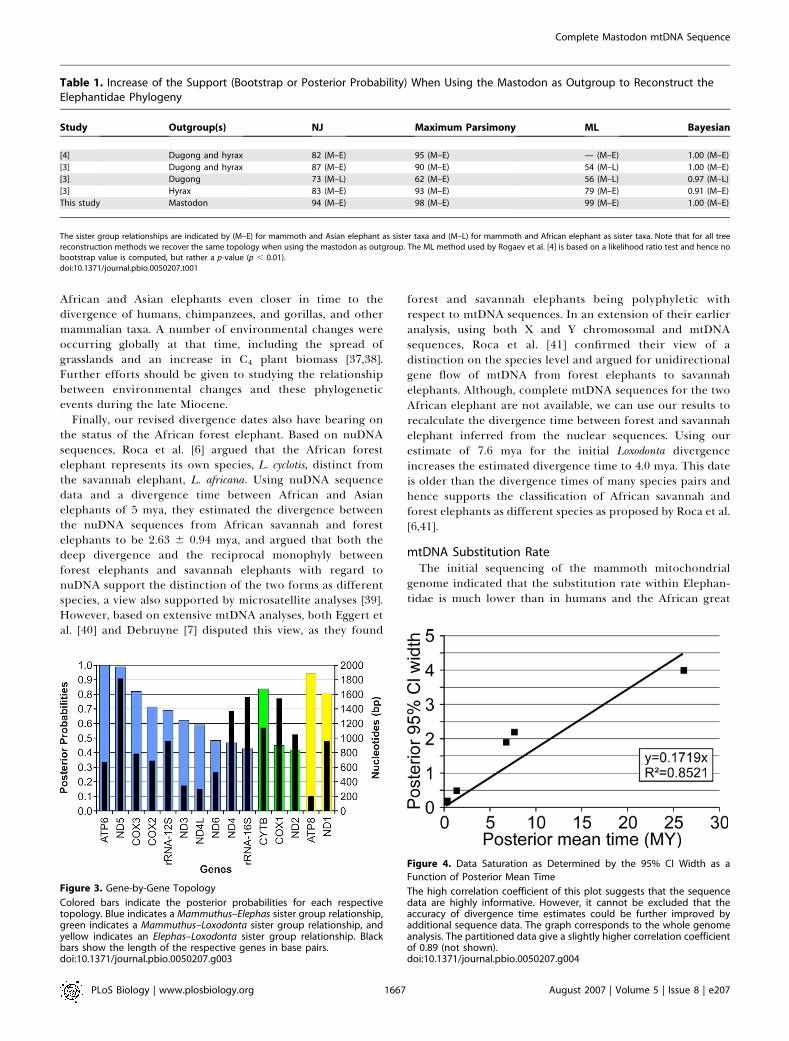
Figure 3. Gene-by-Gene Topology
Colored bars indicate the posterior probabilities for each respectivetopology. Blue indicates a Mammuthus–Elephas sister group relationship,green indicates a Mammuthus–Loxodonta sister group relationship, andyellow indicates an Elephas–Loxodonta sister group relationship. Blackbars show the length of the respective genes in base pairs.doi:10.1371/journal.pbio.0050207.g003
Figure 4. Data Saturation as Determined by the 95% CI Width as a
Function of Posterior Mean Time
The high correlation coefficient of this plot suggests that the sequencedata are highly informative. However, it cannot be excluded that theaccuracy of divergence time estimates could be further improved byadditional sequence data. The graph corresponds to the whole genomeanalysis. The partitioned data give a slightly higher correlation coefficientof 0.89 (not shown).doi:10.1371/journal.pbio.0050207.g004
PLoS Biology | www.plosbiology.org August 2007 | Volume 5 | Issue 8 | e2071667
Complete Mastodon mtDNA Sequence
apes [3]. We can use the mastodon sequence to determinewhether this arose recently or in the more distant past. Wecompared the substitution rates of the mammoth, elephants,and mastodon, which had a most recent common ancestor24–28 mya, to those of human, chimpanzee, gorilla, andbaboon, which had a most recent common ancestor about 33mya [42]. The substitution rate for the whole mtDNA genomewas found to be more than twice as high in the four species ofprimates than in the four species of proboscideans. However,the distribution of rates among sites within the genome wasalmost identical (Table S3). It is not clear what causes thedifference in rates. A possible explanation could be differ-ences in body size, which in turn influence metabolic rates[43,44], but further studies on more species would benecessary to evaluate whether this is the major, or only, cause.
ConclusionsThe sequence of a complete mtDNA genome obtained
from a mastodon tooth extends the time frame for large-scalesequencing of ancient DNA substantially. Inclusion of thissequence in phylogenetic analyses confirms mammoth andAsian elephants as sister taxa and provides evidence forearlier divergences between Elephantidae species. Thesimilarity of the divergence dates between Elephantidaespecies and between humans and African great apes suggeststhat a change in environmental conditions triggered speci-ation in African mammals beginning some 7.5–8 mya. Finally,we found further evidence that the mitochondrial substitu-tion rate in proboscideans is considerably lower than inprimates, and this difference manifested by at least 24 mya.
Although permafrost environment is especially suitable forlong-term DNA survival, DNA sequences about 130,000 y old
have also been reported from non-permafrost remains.Moreover, the age limit for preservation of plant DNA inpermafrost environment is even older, currently at 300,000–500,000 y [45]. Even if the DNA from specimens is morefragmented than in the sample used in this study, the two-step multiplex procedure would allow reconstruction of long,continuous sequences such as complete mitochondrialgenomes, substantially enlarging the possibilities of ancientDNA analyses.
Materials and Methods
Specimen provenance. For DNA extraction, we cut a ;200-gsample along the tooth root of a mastodon molar (United StatesBureau of Land Management–Alaska collection IK-99–237) collectedin 1999 on the Ikpikpuk River (698 229 1099 N, 1548 409 4699 W; Figure1), which drains the central arctic coastal plain of northern Alaska.The tooth was a detrital find collected on a point bar along withnumerous other large mammal bones of late Pleistocene affinity.These bones are eroded from cutbanks and deposited in largequantities on point bars along a number of rivers that drain the arcticcoastal plain. The fluvial and alluvial sediments in these systems weremostly deposited during the late Pleistocene and early Holocene, butcontain reworked bones of Pleistocene age [46–48]. There is a rareoccurrence of sediments dating to the last interglacial period(;130,000–100,000 y BP). To date, an assemblage of ;3,000 boneshas been collected, 312 of which have been radiocarbon-dated [48,49].Most are within the radiocarbon range (,50,000–40,000 y), but about20% have returned nonfinite dates (i.e., ‘‘greater than’’ ages rangingfrom 50,000 to 40,000 y BP). Radiocarbon analyses of a collagenextract from mastodon tooth IK-99–237 yielded a nonfinite 14C age of.50,000 y BP (Lawrence Livermore National Laboratory numberCAMS91805), which places a lower limit on its age. In terms of itsmaximum age, there are only two bones in the entire assemblagefrom a taxon (Praeovibos) that dates to the middle Pleistocene, andeven those two bones were re-worked into late Pleistocene sediments.Consequently, it is conservatively estimated that nonfinite-age bonesin the assemblage date to between approximately 50,000 y BP and theend of the penultimate glaciation (about 150,000 y ago). Since themastodon is principally an inhabitant of interglacial periods inAlaska, it is most likely IK-99–237 dates to the last interglacial period(i.e., its maximum age is probably ;130,000 y BP), though we have noway of absolutely ruling out an age between 100,000 and 50,000 y BP.Bones in this assemblage are extremely well-preserved because theywere entombed in permafrost sediments before being exposed byriver erosion. This accounts for the exceptional preservation of DNAin IK-99–237.
DNA extraction. Part of the tooth root was cut into small piecesand ground to a fine powder in a freezer mill (freezer mill 6750, Spex
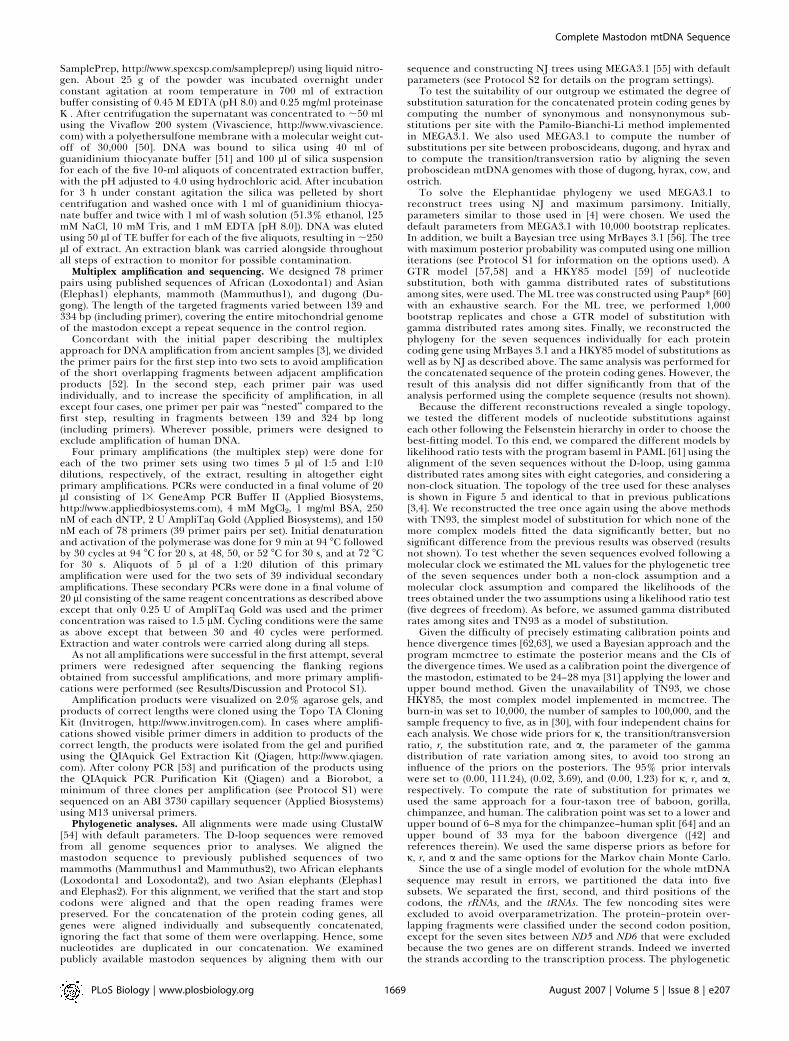
Table 2. Divergence Times Calculated Using Whole Mitochon-drial Genomes of the Four Proboscidean Species
Estimated Parameters Posterior Mean (95% CI)
t1 (mya) calibration 26 (24.0, 28.0)
t2 (mya) 7.6 (6.6, 8.8)
t3 (mya) 6.7 (5.8, 7.7)
t4 (mya) 1.3 (1.1, 1.6)
t5 (mya) 0.27 (0.18, 0.38)
t6 (mya) 0.14 (0.08, 0.22)
r (10�8 substitutions/nt/year) 0.42 (0.36, 0.49)
j (transition/transversion ratio) 39.8 (33.8, 46.8)
a 0.22 (0.19, 0.26)
The node t1 corresponds to the mastodon divergence and is our calibration point (set to24–28 mya). Node t2 is the African elephant–Asian elephant divergence; node t3 is themammoth divergence. a is the parameter of the gamma distribution of rate variationamong sites. The nodes t4, t5, and t6 indicate the intraspecies divergence for the Asianelephant, the mammoth, and the African elephant, respectively. The corresponding tablefor the partitioned genome is Table S4.doi:10.1371/journal.pbio.0050207.t002
Figure 5. Phylogeny and Divergence Times Determined by This Study for
the Four Proboscidean Species Analyzed
doi:10.1371/journal.pbio.0050207.g005
PLoS Biology | www.plosbiology.org August 2007 | Volume 5 | Issue 8 | e2071668
Complete Mastodon mtDNA Sequence
SamplePrep, http://www.spexcsp.com/sampleprep/) using liquid nitro-gen. About 25 g of the powder was incubated overnight underconstant agitation at room temperature in 700 ml of extractionbuffer consisting of 0.45 M EDTA (pH 8.0) and 0.25 mg/ml proteinaseK . After centrifugation the supernatant was concentrated to ;50 mlusing the Vivaflow 200 system (Vivascience, http://www.vivascience.com) with a polyethersulfone membrane with a molecular weight cut-off of 30,000 [50]. DNA was bound to silica using 40 ml ofguanidinium thiocyanate buffer [51] and 100 ll of silica suspensionfor each of the five 10-ml aliquots of concentrated extraction buffer,with the pH adjusted to 4.0 using hydrochloric acid. After incubationfor 3 h under constant agitation the silica was pelleted by shortcentrifugation and washed once with 1 ml of guanidinium thiocya-nate buffer and twice with 1 ml of wash solution (51.3% ethanol, 125mM NaCl, 10 mM Tris, and 1 mM EDTA [pH 8.0]). DNA was elutedusing 50 ll of TE buffer for each of the five aliquots, resulting in ;250ll of extract. An extraction blank was carried alongside throughoutall steps of extraction to monitor for possible contamination.
Multiplex amplification and sequencing. We designed 78 primerpairs using published sequences of African (Loxodonta1) and Asian(Elephas1) elephants, mammoth (Mammuthus1), and dugong (Du-gong). The length of the targeted fragments varied between 139 and334 bp (including primer), covering the entire mitochondrial genomeof the mastodon except a repeat sequence in the control region.
Concordant with the initial paper describing the multiplexapproach for DNA amplification from ancient samples [3], we dividedthe primer pairs for the first step into two sets to avoid amplificationof the short overlapping fragments between adjacent amplificationproducts [52]. In the second step, each primer pair was usedindividually, and to increase the specificity of amplification, in allexcept four cases, one primer per pair was ‘‘nested’’ compared to thefirst step, resulting in fragments between 139 and 324 bp long(including primers). Wherever possible, primers were designed toexclude amplification of human DNA.
Four primary amplifications (the multiplex step) were done foreach of the two primer sets using two times 5 ll of 1:5 and 1:10dilutions, respectively, of the extract, resulting in altogether eightprimary amplifications. PCRs were conducted in a final volume of 20ll consisting of 13 GeneAmp PCR Buffer II (Applied Biosystems,http://www.appliedbiosystems.com), 4 mM MgCl2, 1 mg/ml BSA, 250nM of each dNTP, 2 U AmpliTaq Gold (Applied Biosystems), and 150nM each of 78 primers (39 primer pairs per set). Initial denaturationand activation of the polymerase was done for 9 min at 94 8C followedby 30 cycles at 94 8C for 20 s, at 48, 50, or 52 8C for 30 s, and at 72 8Cfor 30 s. Aliquots of 5 ll of a 1:20 dilution of this primaryamplification were used for the two sets of 39 individual secondaryamplifications. These secondary PCRs were done in a final volume of20 ll consisting of the same reagent concentrations as described aboveexcept that only 0.25 U of AmpliTaq Gold was used and the primerconcentration was raised to 1.5 lM. Cycling conditions were the sameas above except that between 30 and 40 cycles were performed.Extraction and water controls were carried along during all steps.
As not all amplifications were successful in the first attempt, severalprimers were redesigned after sequencing the flanking regionsobtained from successful amplifications, and more primary amplifi-cations were performed (see Results/Discussion and Protocol S1).
Amplification products were visualized on 2.0% agarose gels, andproducts of correct lengths were cloned using the Topo TA CloningKit (Invitrogen, http://www.invitrogen.com). In cases where amplifi-cations showed visible primer dimers in addition to products of thecorrect length, the products were isolated from the gel and purifiedusing the QIAquick Gel Extraction Kit (Qiagen, http://www.qiagen.com). After colony PCR [53] and purification of the products usingthe QIAquick PCR Purification Kit (Qiagen) and a Biorobot, aminimum of three clones per amplification (see Protocol S1) weresequenced on an ABI 3730 capillary sequencer (Applied Biosystems)using M13 universal primers.
Phylogenetic analyses. All alignments were made using ClustalW[54] with default parameters. The D-loop sequences were removedfrom all genome sequences prior to analyses. We aligned themastodon sequence to previously published sequences of twomammoths (Mammuthus1 and Mammuthus2), two African elephants(Loxodonta1 and Loxodonta2), and two Asian elephants (Elephas1and Elephas2). For this alignment, we verified that the start and stopcodons were aligned and that the open reading frames werepreserved. For the concatenation of the protein coding genes, allgenes were aligned individually and subsequently concatenated,ignoring the fact that some of them were overlapping. Hence, somenucleotides are duplicated in our concatenation. We examinedpublicly available mastodon sequences by aligning them with our
sequence and constructing NJ trees using MEGA3.1 [55] with defaultparameters (see Protocol S2 for details on the program settings).
To test the suitability of our outgroup we estimated the degree ofsubstitution saturation for the concatenated protein coding genes bycomputing the number of synonymous and nonsynonymous sub-stitutions per site with the Pamilo-Bianchi-Li method implementedin MEGA3.1. We also used MEGA3.1 to compute the number ofsubstitutions per site between proboscideans, dugong, and hyrax andto compute the transition/transversion ratio by aligning the sevenproboscidean mtDNA genomes with those of dugong, hyrax, cow, andostrich.
To solve the Elephantidae phylogeny we used MEGA3.1 toreconstruct trees using NJ and maximum parsimony. Initially,parameters similar to those used in [4] were chosen. We used thedefault parameters from MEGA3.1 with 10,000 bootstrap replicates.In addition, we built a Bayesian tree using MrBayes 3.1 [56]. The treewith maximum posterior probability was computed using one millioniterations (see Protocol S1 for information on the options used). AGTR model [57,58] and a HKY85 model [59] of nucleotidesubstitution, both with gamma distributed rates of substitutionsamong sites, were used. The ML tree was constructed using Paup* [60]with an exhaustive search. For the ML tree, we performed 1,000bootstrap replicates and chose a GTR model of substitution withgamma distributed rates among sites. Finally, we reconstructed thephylogeny for the seven sequences individually for each proteincoding gene using MrBayes 3.1 and a HKY85 model of substitutions aswell as by NJ as described above. The same analysis was performed forthe concatenated sequence of the protein coding genes. However, theresult of this analysis did not differ significantly from that of theanalysis performed using the complete sequence (results not shown).
Because the different reconstructions revealed a single topology,we tested the different models of nucleotide substitutions againsteach other following the Felsenstein hierarchy in order to choose thebest-fitting model. To this end, we compared the different models bylikelihood ratio tests with the program baseml in PAML [61] using thealignment of the seven sequences without the D-loop, using gammadistributed rates among sites with eight categories, and considering anon-clock situation. The topology of the tree used for these analysesis shown in Figure 5 and identical to that in previous publications[3,4]. We reconstructed the tree once again using the above methodswith TN93, the simplest model of substitution for which none of themore complex models fitted the data significantly better, but nosignificant difference from the previous results was observed (resultsnot shown). To test whether the seven sequences evolved following amolecular clock we estimated the ML values for the phylogenetic treeof the seven sequences under both a non-clock assumption and amolecular clock assumption and compared the likelihoods of thetrees obtained under the two assumptions using a likelihood ratio test(five degrees of freedom). As before, we assumed gamma distributedrates among sites and TN93 as a model of substitution.
Given the difficulty of precisely estimating calibration points andhence divergence times [62,63], we used a Bayesian approach and theprogram mcmctree to estimate the posterior means and the CIs ofthe divergence times. We used as a calibration point the divergence ofthe mastodon, estimated to be 24–28 mya [31] applying the lower andupper bound method. Given the unavailability of TN93, we choseHKY85, the most complex model implemented in mcmctree. Theburn-in was set to 10,000, the number of samples to 100,000, and thesample frequency to five, as in [30], with four independent chains foreach analysis. We chose wide priors for j, the transition/transversionratio, r, the substitution rate, and a, the parameter of the gammadistribution of rate variation among sites, to avoid too strong aninfluence of the priors on the posteriors. The 95% prior intervalswere set to (0.00, 111.24), (0.02, 3.69), and (0.00, 1.23) for j, r, and a,respectively. To compute the rate of substitution for primates weused the same approach for a four-taxon tree of baboon, gorilla,chimpanzee, and human. The calibration point was set to a lower andupper bound of 6–8 mya for the chimpanzee–human split [64] and anupper bound of 33 mya for the baboon divergence ([42] andreferences therein). We used the same disperse priors as before forj, r, and a and the same options for the Markov chain Monte Carlo.
Since the use of a single model of evolution for the whole mtDNAsequence may result in errors, we partitioned the data into fivesubsets. We separated the first, second, and third positions of thecodons, the rRNAs, and the tRNAs. The few noncoding sites wereexcluded to avoid overparametrization. The protein–protein over-lapping fragments were classified under the second codon position,except for the seven sites between ND5 and ND6 that were excludedbecause the two genes are on different strands. Indeed we invertedthe strands according to the transcription process. The phylogenetic
PLoS Biology | www.plosbiology.org August 2007 | Volume 5 | Issue 8 | e2071669
Complete Mastodon mtDNA Sequence
tree was constructed using MrBayes 3.1 with a GTR model ofsubstitution and one million iterations with unlinked partitions. Wealso allowed the partitions to have different rates. The divergencetimes using the partitions were computed using mcmctree with theoptions described above.
Supporting Information
Figure S1. Trees Including Previously Published Mastodon Sequences
(A) NJ tree (MEGA3.1 default parameters; 10,000 replicates for thebootstrap) for the fragments of 228 bp. The sequences starting with‘‘CYTB’’ are the usual sequences used in this study.(B) NJ tree (MEGA3.1 default parameters; 10,000 replicates for thebootstrap) for the fragment of 294 bp. The sequences starting with‘‘CYTB’’ are the usual sequences used in this study.
Found at doi:10.1371/journal.pbio.0050207.sg001 (924 KB TIF).
Figure S2. Sampling Properties of the Whole Genome on the InferredPhylogeny(A) Results for sliding window analyses. The different trees are colorcoded, and the bootstrap support (10,000 replicates) is indicated on they-axes (for the unresolved topology we assigned a value of 50). Position1 on the x-axis corresponds to the first base pair of tRNA-Phe. As canbe seen from the results, up to a window size of 3,000 bp, topologiesthat differ from the whole genome tree are obtained, and even with5,000 bp, the topology of the tree is often unresolved. We used onlyone sequence per species for this analysis (i.e., Elephas1, Loxodonta1,Mammuthus1, and the mastodon sequence). The total length of thealignment is 15,431 bp because the D-loop region has been removed.(B) Proportion of phylogenetic trees that yield the whole genome treetopology (y-axis) for contiguous sequences and for random sampling.
Found at doi:10.1371/journal.pbio.0050207.sg002 (390 KB TIF).
Figure S3. Saturation of the Number of Substitutions When Using theHyrax and Dugong as Outgroups
Found at doi:10.1371/journal.pbio.0050207.sg003 (3.4 MB TIF).
Protocol S1. Sequence Determination
Found at doi:10.1371/journal.pbio.0050207.sd001 (35 KB DOC).
Protocol S2 Sampling Properties of the Whole Genome on theInferred Phylogeny
Found at doi:10.1371/journal.pbio.0050207.sd002 (25 KB DOC).
Protocol S3 Supporting Methods for the Phylogenetic Analyses:Options for the Programs Used: MrBayes 3.1, Paup*, and PAML
Found at doi:10.1371/journal.pbio.0050207.sd003 (43 KB DOC).
Table S1. Pairwise Number of Substitutions for Whole MitochondrialGenomes without D-Loop for Asian Elephant, African Elephant,Mammoth, Mastodon, Dugong, and Hyrax
Found at doi:10.1371/journal.pbio.0050207.st001 (32 KB DOC).
Table S2. Gene Trees: Phylogeny Gene by Gene of the ElephantidsUsing Bayesian Inference (HKY85) or NJ (K80)
Found at doi:10.1371/journal.pbio.0050207.st002 (39 KB DOC).
Table S3. Difference in Rates of Substitution between Four Species ofPrimates and Four Species of Proboscideans
Found at doi:10.1371/journal.pbio.0050207.st003 (33 KB DOC).
Table S4. Posterior Probabilities and CIs of the Divergence Times forthe Partitioned Data
Found at doi:10.1371/journal.pbio.0050207.st004 (35 KB DOC).
Accession Numbers
The GenBank (http://www.ncbi.nlm.nih.gov) accession numbers forthe complete mitochondrial genome sequences of E. maximus, L.africana, and Mammuthus primigenius are NC_005129.1 for Elephas1and NC_005129.2 for Elephas2, NC_000934.1 for Loxodonta1 andDQ316069.1 for Loxodonta2, and NC_007596.2 for Mammuthus1and DQ316067.1 for Mammuthus2. For the partial sequences ofMammut americanum the GenBank accession numbers are U23737.1(denoted Yang Mastodon), AY028924.1, and AF279699.1; for thepartial sequences of Mammuthus primigenius the GenBank accessionnumbers are U23738.1 (denoted Yang Mammuthus1) and U23739.1(denoted Yang Mammuthus2). The accession number for the wholemitochondrial genome of Mammut americanum determined in thisstudy is EF632344. For the non-proboscideans, the GenBankaccession numbers for the whole genomes used in this study areNC_003314.1 for D. dugon (Dugong), NC_004919.1 for P. capensis(Procavia), NC_006853.1 for B. taurus (Bos), Y12025.1 for S. camelus(Struthio), NC_001992.1 for Papio hamadryas (Baboon), NC_001645.1for Gorilla gorilla (Gorilla), NC_001643.1 for Pan troglodytes (Chim-panzee), and NC_001807.4 for Homo sapiens (Human).
Acknowledgments
We would like to thank Philip Johnson, Owen Solberg, Weiwei Zhai,and Jan Pawlowski for very helpful discussions and Sergios-OrestisKolokotronis for many constructive comments on a previous versionof this manuscript. We are also grateful to Bruce Rannala for his helpwith mcmctree and Pascal Tassy who kindly directed us to valuablereferences. Michael Kunz facilitated the field work that led to thediscovery of the mastodon fossil. John Dube discovered the fossilwhile working with PM. Knut Finstermeier helped with the figuredesign.
Author contributions. NR and MH conceived and designed theexperiments. NR performed the experiments. PM collected data.ASM, JLP, and MS analyzed the data. NR, ASM, MS, PM, and MHcontributed to writing the paper.
Funding. NR and MH are supported by the Max Planck Society.ASM, JLP, and MS are supported by a US National Institutes ofHealth grant (to MS). ASM is also supported by the Maria Stepanoff-Ogankoff grant and by the Ernst and Lucie Schmidheiny Foundation.Field work by PM that led to the discovery of the fossil and theradiocarbon analyses were funded by the Northern Field Office,Bureau of Land Management, US Department of Agriculture, inFairbanks, Alaska, United States of America.
Competing interests. The authors have declared that no competinginterests exist.
References1. Cooper A, Lalueza-Fox C, Anderson S, Rambaut A, Austin J, et al. (2001)
Complete mitochondrial genome sequences of two extinct moas clarifyratite evolution. Nature 409: 704–707.
2. Haddrath O, Baker AJ (2001) Complete mitochondrial DNA genomesequences of extinct birds: Ratite phylogenetics and the vicariancebiogeography hypothesis. Proc Biol Sci 268: 939–945.
3. Krause J, Dear PH, Pollack JL, Slatkin M, Spriggs H, et al. (2006) Multiplexamplification of the mammoth mitochondrial genome and the evolution ofElephantidae. Nature 439: 724–727.
4. Rogaev EI, Moliaka YK, Malyarchuk BA, Kondrashov FA, Derenko MV, et al.(2006) Complete mitochondrial genome and phylogeny of Pleistocenemammoth Mammuthus primigenius. PLoS Biol 4: e73. doi:10.1371/journal.pbio.0040073
5. Shoshani J (1998) Understanding proboscidean evolution: A formidabletask. Trends Ecol Evol 13: 480–487.
6. Roca AL, Georgiadis N, Pecon-Slattery J, O’Brien SJ (2001) Geneticevidence for two species of elephant in Africa. Science 293: 1473–1477.
7. Debruyne R (2005) A case study of apparent conflict between molecularphylogenies: The interrelationships of African elephants. Cladistics 21: 31–50.
8. Capelli C, MacPhee RDE, Roca AL, Brisighelli F, Georgiadis N, et al. (2006)A nuclear DNA phylogeny of the woolly mammoth (Mammuthus primigenius).Mol Phylogenet Evol 40: 620–627.
9. Springer MS, Murphy WJ, Eizirik E, O’Brien SJ (2003) Placental mammaldiversification and the Cretaceous-Tertiary boundary. Proc Natl Acad SciU S A 100: 1056–1061.
10. Shoshani J, Walter RC, Abraha M, Berhe S, Tassy P, et al. (2006) Aproboscidean from the late Oligocene of Eritrea, a ‘‘missing link’’ betweenearly Elephantiformes and Elephantimorpha, and biogeographic implica-tions. Proc Natl Acad Sci U S A 103: 17296–17301.
11. Smith CI, Chamberlain AT, Riley MS, Cooper A, Stringer CB, et al. (2001)Neanderthal DNA. Not just old but old and cold? Nature 410: 771–772.
12. Smith CI, Chamberlain AT, Riley MS, Stringer C, Collins MJ (2003) Thethermal history of human fossils and the likelihood of successful DNAamplification. J Hum Evol 45: 203–217.
13. Shoshani J, Walz DA, Goodman JM, Lowenstein JM, Prychodko W (1985)Protein and anatomical evidence of the phylogenetic position ofMammuthus primigenius within Elephantidae. Acta Zool Fenn 170: 237–240.
14. Gilbert MTP, Bandelt HJ, Hofreiter M, Barnes I (2005) Assessing ancientDNA studies. Trends Ecol Evol 20: 541–544.
PLoS Biology | www.plosbiology.org August 2007 | Volume 5 | Issue 8 | e2071670
Complete Mastodon mtDNA Sequence
15. Cooper A, Poinar HN (2000) Ancient DNA: Do it right or not at all. Science289: 1139.
16. Ojala D, Montoya J, Attardi G (1981) tRNA punctuation model of RNAprocessing in human mitochondria. Nature 290: 470–474.
17. Yang H, Golenberg EM, Shoshani J (1996) Phylogenetic resolution withinthe Elephantidae using fossil DNA sequence from the American mastodon(Mammut americanum) as an outgroup. Proc Natl Acad Sci U S A 93: 1190–1194.
18. Joger U, Garrido G, Hauf J, Tikhonov A, Vartanyan S (2003) Geneticinvestigations on mammoth (Mammuthus primigenius). Deinsea 9: 205–220.
19. Debruyne R, Barriel V, Tassy P (2003) Mitochondrial cytochrome b of theLyakhov mammoth (Proboscidea, Mammalia): New data and phylogeneticanalyses of Elephantidae. Mol Phylogenet Evol 26: 421–434.
20. Thomas MG, Hagelberg E, Jone HB, Yang Z, Lister AM (2000) Molecularand morphological evidence on the phylogeny of the Elephantidae. ProcBiol Sci 267: 2493–2500.
21. Altschul SF, Gish W, Miller W, Myers EW, Lipman DJ (1990) Basic localalignment search tool. J Mol Biol 215: 403–410.
22. Felsenstein J (2004) Inferring phylogenies. Sunderland (Massachusetts):Sinauer Associates. 664 p.
23. Cooper A (2006) The year of the mammoth. PLoS Biol 4: e78. doi:10.1371/journal.pbio.0040078
24. Cao Y, Janke A, Waddell PJ, Westerman M, Takenaka O, et al. (1998)Conflict among individual mitochondrial proteins in resolving thephylogeny of eutherian orders. J Mol Evol 47: 307–322.
25. Maddison WP (1997) Gene trees in species trees. Syst Biol 46: 523–536.26. Rokas A, Williams BL, King N, Carroll SB (2003) Genome-scale approaches
to resolving incongruence in molecular phylogenies. Nature 425: 798–803.27. Tajima F (1983) Evolutionary relationship of DNA sequences in finite
populations. Genetics 105: 437–460.28. Gheerbrant E, Sudre J, Cappetta H (1996) A Palaeocene proboscidean from
Morocco. Nature 383: 68–70.29. Tamura K, Nei M (1993) Estimation of the number of nucleotide
substitutions in the control region of mitochondrial DNA in humans andchimpanzees. Mol Biol Evol 10: 512–526.
30. Yang Z, Rannala B (2006) Bayesian estimation of species divergence timesunder a molecular clock using multiple fossil calibrations with soft bounds.Mol Biol Evol 23: 212–226.
31. Shoshani J, Golenberg EM, Yang H (1998) Elephantidae phylogeny:Morphological versus molecular results. Acta Theriol Suppl 5: 89–122.
32. Vignaud P, Duringer P, Mackaye HT, Likius A, Blondel C, et al. (2002)Geology and palaeontology of the Upper Miocene Toros-Menalla hominidlocality, Chad. Nature 418: 152–155.
33. Shoshani J, Tassy P (2005) Advances in proboscidean taxonomy &classification, anatomy & physiology, and ecology & behavior. QuaternaryInt 126–128: 5–20.
34. Glazko GV, Nei M (2003) Estimation of divergence times for major lineagesof primate species. Mol Biol Evol 20: 424–434.
35. Hobolth A, Christensen OF, Mailund T, Schierup MH (2007) Genomicrelationships and speciation times of human, chimpanzee, and gorillainferred from a coalescent hidden Markov model. PLoS Genet 3: e7. doi:10.1371/journal.pgen.0030007
36. Patterson N, Richter DJ, Gnerre S, Lander ES, Reich D (2006) Geneticevidence for complex speciation of humans and chimpanzees. Nature 441:1103–1108.
37. Cerling TE, Ehleringer JR, Harris JM (1998) Carbon dioxide starvation, thedevelopment of C4 ecosystems, and mammalian evolution. Philos Trans RSoc Lond B Biol Sci 353: 159–171.
38. Cerling TE, Harris JM, MacFadden BJ, Leakey MG, Quade J, et al. (1997)Global vegetation change through the Miocene/Pliocene boundary. Nature389: 153–158.
39. Comstock KE, Georgiadis N, Pecon-Slattery J, Roca AL, Ostrander EA, et al.(2002) Patterns of molecular genetic variation among African elephantpopulations. Mol Ecol 11: 2489–2498.
40. Eggert LS, Rasner CA, Woodruff DS (2002) The evolution and phylogeog-
raphy of the African elephant inferred from mitochondrial DNA sequenceand nuclear microsatellite markers. Proc Biol Sci 269: 1993–2006.
41. Roca AL, Georgiadis N, O’Brien SJ (2005) Cytonuclear genomic dissocia-tion in African elephant species. Nat Genet 37: 96–100.
42. Steiper ME, Young NM, Sukarna TY (2004) Genomic data support thehominoid slowdown and an Early Oligocene estimate for the hominoid-cercopithecoid divergence. Proc Natl Acad Sci U S A 101: 17021–17026.
43. Gillooly JF, Allen AP, West GB, Brown JH (2005) The rate of DNAevolution: Effects of body size and temperature on the molecular clock.Proc Natl Acad Sci U S A 102: 140–145.
44. Martin AP, Palumbi SR (1993) Body size, metabolic rate, generation time,and the molecular clock. Proc Natl Acad Sci U S A 90: 4087–4091.
45. Willerslev E, Hansen AJ, Binladen J, Brand TB, Gilbert MT, et al. (2003)Diverse plant and animal genetic records from Holocene and Pleistocenesediments. Science 300: 791–795.
46. Kunz ML, Mann DH, Matheus PE, Groves P (1999) The life and times ofPaleoindians in arctic Alaska. Arct Res US 13: 33–39.
47. Mann DH, Peteet DM, Reanier RE, Kunz ML (2002) Responses of an arcticlandscape to late glacial and early Holocene climate changes: Theimportance of moisture. Quaternary Sci Rev 21: 997–1021.
48. Matheus P, Kunz M, Guthrie RD (2003) Using frequency distributions ofradiocarbon dates to detect relative changes in Pleistocene mammalpopulations—A test from northern Alaska [abstract]. 3rd InternationalMammoth Conference; 26–28 May 2003. Occas Pap Earth Sci 5: 83–85.
49. Rasic J, Matheus PE (2007) A reconsideration of purported Holocene bisonin northern Alaska. Arctic. In press.
50. Noonan JP, Hofreiter M, Smith D, Priest JR, Rohland N, et al. (2005)Genomic sequencing of Pleistocene cave bears. Science 309: 597–599.
51. Boom R, Sol CJ, Salimans MM, Jansen CL, Wertheim-van Dillen PM, et al.(1990) Rapid and simple method for purification of nucleic acids. J ClinMicrobiol 28: 495–503.
52. Rompler H, Dear PH, Krause J, Meyer M, Rohland N, et al. (2006) Multiplexamplification of ancient DNA. Nat Protocols 1: 720–728.
53. Kilger C, Krings M, Poinar H, Paabo S (1997) ‘‘Colony sequencing’’: Directsequencing of plasmid DNA from bacterial colonies. Biotechniques 22:412–414, 416, 418.
54. Thompson JD, Higgins DG, Gibson TJ (1994) CLUSTAL W: Improving thesensitivity of progressive multiple sequence alignment through sequenceweighting, position-specific gap penalties and weight matrix choice.Nucleic Acids Res 22: 4673–4680.
55. Kumar S, Tamura K, Nei M (2004) MEGA3: Integrated software forMolecular Evolutionary Genetics Analysis and sequence alignment. BriefBioinform 5: 150–163.
56. Ronquist F, Huelsenbeck JP (2003) MrBayes 3: Bayesian phylogeneticinference under mixed models. Bioinformatics 19: 1572–1574.
57. Lanave C, Preparata G, Saccone C, Serio G (1984) A new method forcalculating evolutionary substitution rates. J Mol Evol 20: 86–93.
58. Tavare S (1986) Some probabilistic and statistical problems in the analysisof DNA sequences. Lect Math Life Sci 17: 57–86.
59. Hasegawa M, Kishino H, Yano T (1985) Dating of the human-ape splittingby a molecular clock of mitochondrial DNA. J Mol Evol 22: 160–174.
60. Swofford DL (2002) Paup* 4.0. Phylogenetic Analysis Using Parsimony(*and other methods) [computer program]. Sunderland (Massachusetts):Sinauer Associates.
61. Yang Z (1997) PAML: A program package for phylogenetic analysis bymaximum likelihood. Comput Appl Biosci 13: 555–556.
62. Graur D, Martin W (2004) Reading the entrails of chickens: Moleculartimescales of evolution and the illusion of precision. Trends Genet 20: 80–86.
63. Hedges SB, Kumar S (2004) Precision of molecular time estimates. TrendsGenet 20: 242–247.
64. Brunet M, Guy F, Pilbeam D, Mackaye HT, Likius A, et al. (2002) A newhominid from the Upper Miocene of Chad, Central Africa. Nature 418:145–151.
65. Reisz RR, Muller J (2004) Molecular timescales and the fossil record: Apaleontological perspective. Trends Genet 20: 237–241.
PLoS Biology | www.plosbiology.org August 2007 | Volume 5 | Issue 8 | e2071671
Complete Mastodon mtDNA Sequence