Embed Size (px)
Citation preview
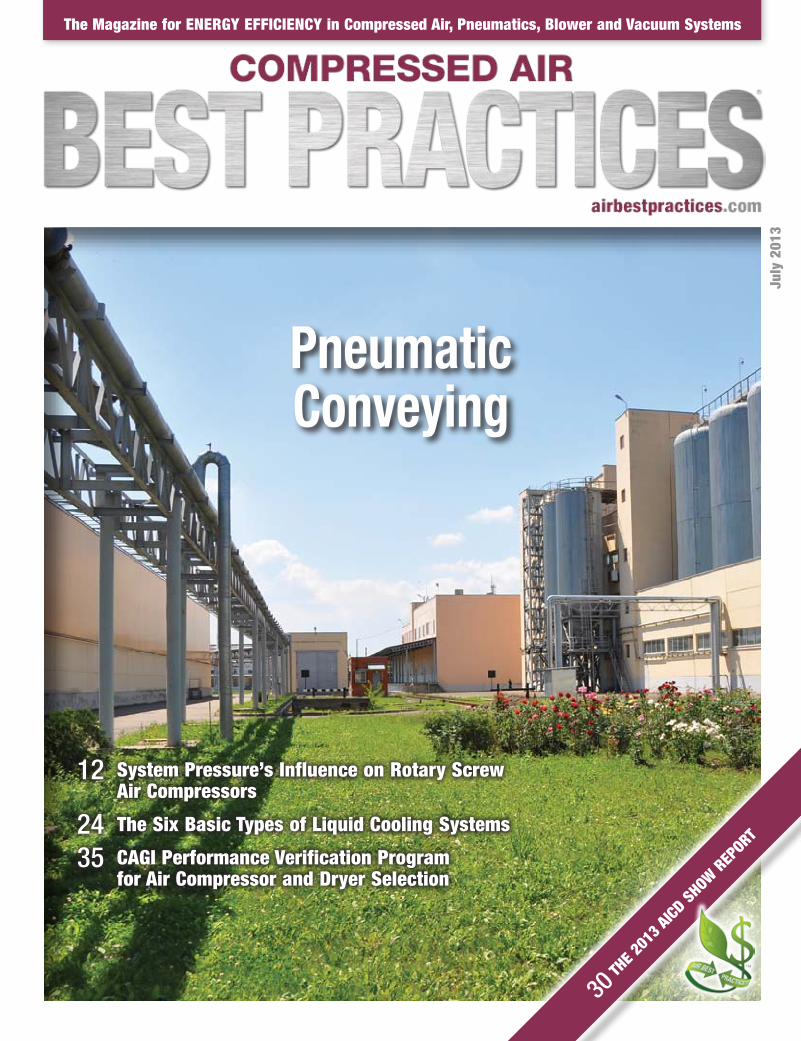
The Magazine for ENERGY EFFICIENCY in Compressed Air, Pneumatics, Blower and Vacuum Systems
Pneumatic Conveying
July
201
3
30 THE 2
013 A
ICD SH
OW REP
ORT
12 System Pressure’s Influence on Rotary Screw Air Compressors
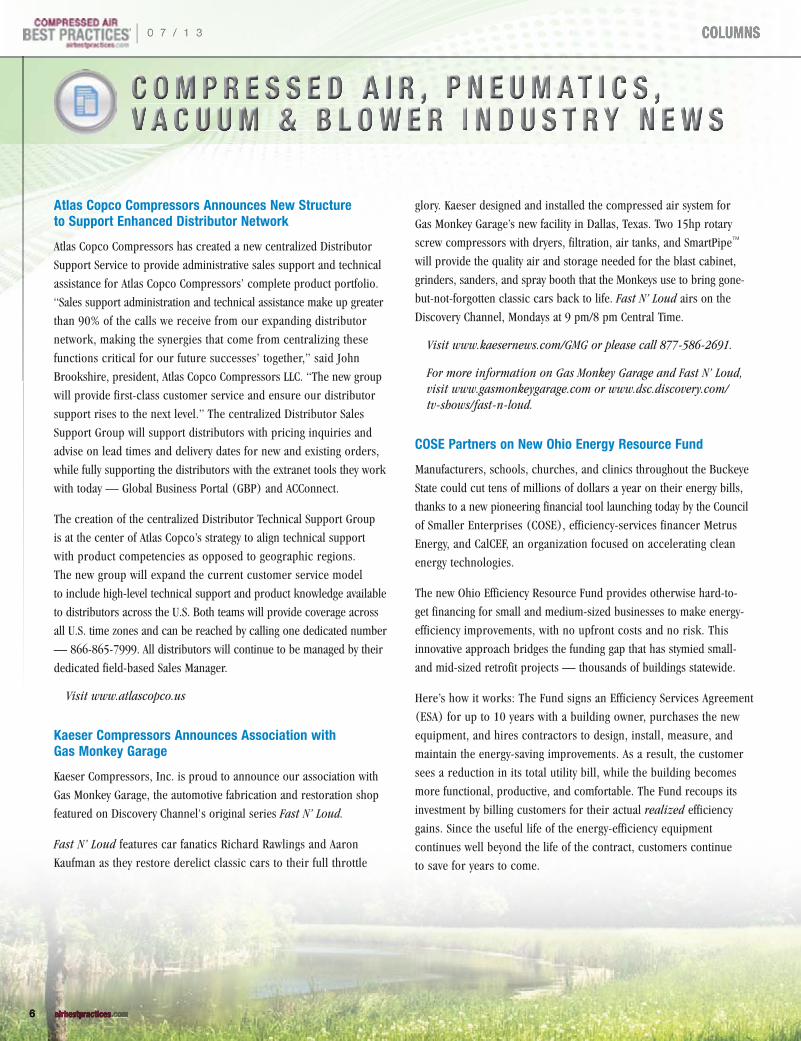
24 The Six Basic Types of Liquid Cooling Systems
35 CAGI Performance Verification Program for Air Compressor and Dryer Selection

Can you find the right balance?
© Copyright 2013 Atlas Copco Compressors LLC. All rights reserved.
Take that first step towardsustainable productivity.Using less energy and boosting productivity may seem like opposing goals, but Atlas Copcocan show you how to make them work together. And it won’t require you to walk a tightrope.With 14 production facilities in the United States and dozens more globally, we never stoplooking for ways to help our manufacturing teams – and more importantly yours – innovatefor sustainable productivity.
In 2013, Atlas Copco celebrates our 140th anniversary. To celebrate we are giving ourcustomers game-changing energy-saving solutions, including a remote monitoring systemthat has simplified and changed compressor maintenance forever, and arguably the mostrevolutionary new air compressor to ever hit the market.
Let Atlas Copco demonstrate to you just why, year after year, we have been listed as oneof the top 20 most sustainable companies in the world. Call 866-688-9611.
Atlas - Tightrope Ad 8.375 x 10.875:Layout 2 5/7/13 4:27 PM Page 1
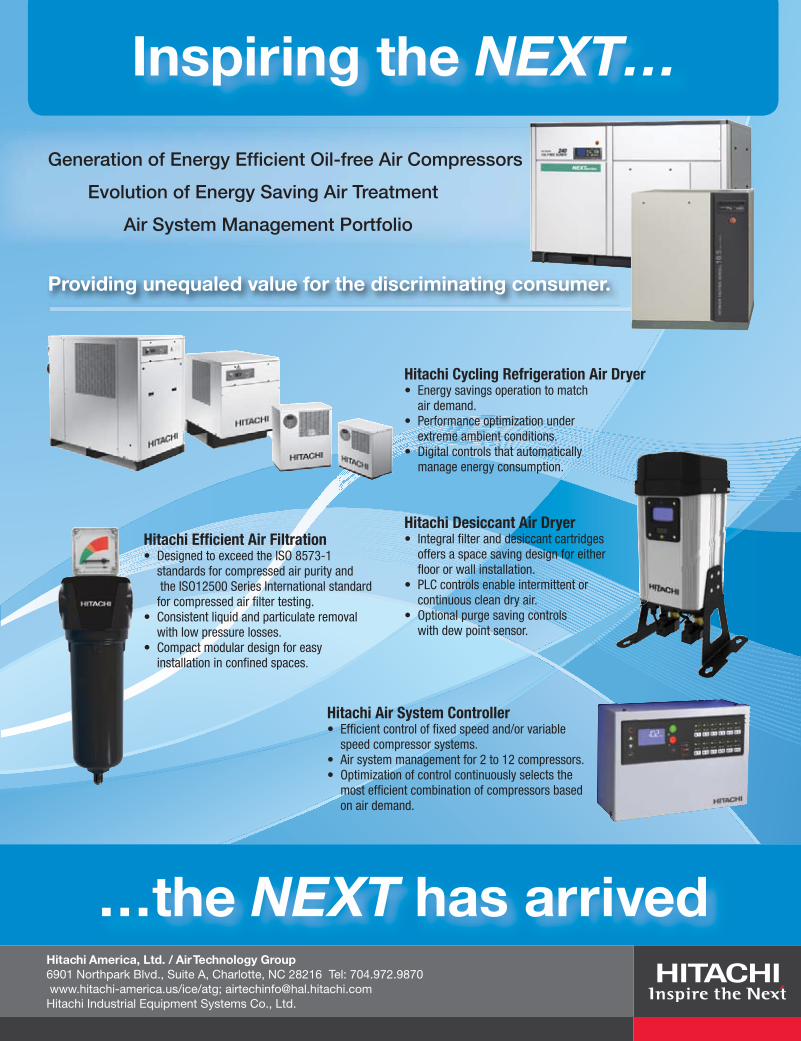
Hitachi Cycling Refrigeration Air Dryer• Energysavingsoperationtomatch
airdemand.•Performanceoptimizationunder
extremeambientconditions.• Digitalcontrolsthatautomatically
manageenergyconsumption.
Hitachi Desiccant Air Dryer• Integralfilteranddesiccantcartridges
offersaspacesavingdesignforeitherfloororwallinstallation.
• PLCcontrolsenableintermittentorcontinuouscleandryair.
• Optionalpurgesavingcontrolswithdewpointsensor.
Hitachi Efficient Air Filtration• DesignedtoexceedtheISO8573-1
standardsforcompressedairpurityandtheISO12500SeriesInternationalstandardforcompressedairfiltertesting.
• Consistentliquidandparticulateremovalwithlowpressurelosses.
• Compactmodulardesignforeasyinstallationinconfinedspaces.
…the NEXT has arrived
Hitachi Air System Controller• Efficientcontroloffixedspeedand/orvariable
speedcompressorsystems.• Airsystemmanagementfor2to12compressors.• Optimizationofcontrolcontinuouslyselectsthe
mostefficientcombinationofcompressorsbasedonairdemand.
Inspiring the NEXT…
Hitachi America, Ltd. / Air Technology Group 6901 Northpark Blvd., Suite A, Charlotte, NC 28216 Tel: 704.972.9870 www.hitachi-america.us/ice/atg; [email protected] Hitachi Industrial Equipment Systems Co., Ltd.
Generation of Energy Efficient Oil-free Air Compressors
Evolution of Energy Saving Air Treatment
Air System Management Portfolio
Providing unequaled value for the discriminating consumer.
COLUMNS
5 From the Editor
6 Compressed Air, Pneumatics, Vacuum & Blower Industry News
44 Resources for Energy Engineers Technology Picks
47 Advertiser Index
49 The Marketplace Jobs and Technology
12 Air System Pressure Influences Compressor Power Part 1: System Pressure’s Influence on Rotary Screw Air Compressors By Mark Krisa, Ingersoll Rand
18 The Compressed Air System Assessment Pneumatic Conveying Energy Assessment Saves $321,000 By Don van Ormer, Air Power USA
24 The Six Basic Types of Liquid Cooling Systems By Bruce Williams, Hydrothrift Corporation
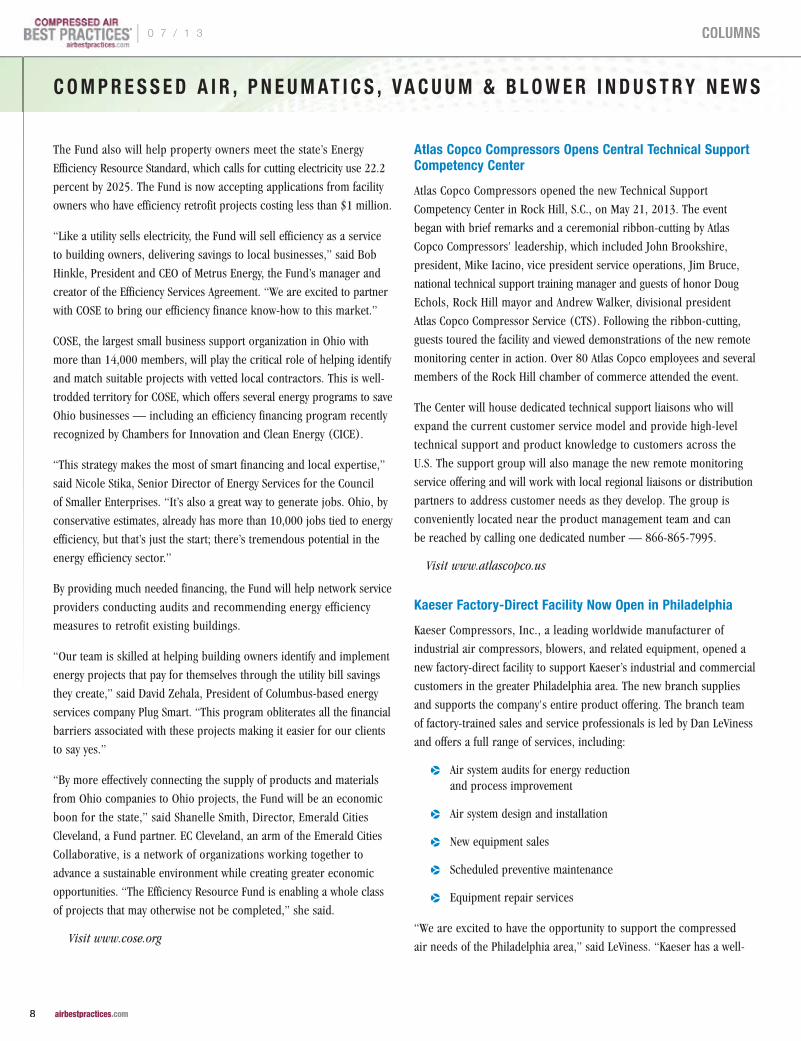
30 The 2013 AICD Conference and Exposition By Compressed Air Best Practices® Magazine
35 CAGI Performance Verification Program for Air Compressor and Dryer Selection By the Compressed Air & Gas Institute
38 Using KPI’s for Peak Efficiency By Ron Marshall for the Compressed Air Challenge®
SUSTAINABLE MANUFACTURING FEATURES
24
30
12
| 0 7 / 1 3
4 airbestpractices.com
Columns
supports the following organizations:
The U.S, Department of Energy has posted a Docket on Federal Register
to determine if commercial and industrial compressors should be
“covered equipment” under Part A-1 of Title III of the Energy Policy &
Conservation Act (EPCA). The DoE proposes that classifying equipment
of such type, as covered equipment under Part A-1 of EPCA, would
require manufacturers to improve the efficiency of electric motors,
pumps, and compressors to conserve the energy resources within the nation.
While this is just the first step, it has the attention of the members of the air compressor
industry. As our magazine title suggests, real energy savings come from matching the supply
side (compressor room) to the demand side (the plant floor). With the (DoE supported)
Compressed Air Challenge® publishing widely-confirmed data stating that most plants waste
fifty percent of their compressed air, shouldn’t the focus be on conducting demand-side
system assessments? We will continue to monitor this situation which could require air
compressor manufacturers to conduct additional testing, potentially require labeling
or even mandate efficiency improvements over time.
When I speak to energy-saving, system assessment experts, they say the number one
obstacle, to getting projects done, is the initial cost of a system assessment. They would
like to see more utilities help factories with this initial system assessment cost by deploying
retrocommissioning incentives (also called RcX programs) to complement their portfolio
of energy conservation incentives. According to Don van Ormer of Air Power USA, “RcX
programs help plants return both the supply and demand side of the system back to their
original optimal working conditions. They provide funds to troubleshoot current air system
problems and bottlenecks while reducing air demand and pressure.”
Subscriptions continue to grow for our publication from new subscribers who drop me notes
reading, “We manufacture automotive components and compressed air represents 33% of
our total energy costs. We look forward to learning Compressed Air Best Practices.” It’s for
these readers that we publish this magazine. Thanks go to the authors and auditors who share
their knowledge with our readers and who are “making a difference” daily in helping factories
profitably reduce the energy consumption related to their compressed air systems.
Thank you for your support and for investing in Compressed Air Best Practices®.
ROD SMITH Editor tel: 412-980-9901, [email protected]
From the From the From the eeeditorditorditor Retrocommissioning Incentives
COMPRESSED AIR BEST PRACTICES® EDITORIAL ADVISORy BOARD
Indus
trial
Ener
gy M
anag
ers
Thomas Mort Global Program Manager, Energy Efficiency
Archer Daniels Midlands
Richard Feustel Corporate Energy Services Manager Briggs & Stratton
Brad Runda Manager, Energy Saint Gobain
Eric Battino Environmental Sustainability Manager PepsiCo
Doug Barndt Manager, Demand Side Energy-Sustainability Ball Corporation
Jennifer Meier Global EH&S/ Plant Engineering Manager
Varroc Lighting Systems
Mike Seiter Engineering Coordinator, Equip. Reliability Group Honda of America
William Jerald Energy Manager CalPortland
Tech
nolog
y/Sy
stem
Ass
essm
ents
Nate Altfeather Engineering Professional Development
University of Wisconsin
Ron Marshall Customer Engineering Services Compressed Air Challenge®
Bill Scales CEO Scales Industrial Technologies
Ted Clayton Energy and Power Management Services
KAMAN Industrial Technologies
Paul Humphreys
Vice President Communications Atlas Copco
Wayne Perry Technical Director Kaeser Compressors
David Brittain Director of Engineering & Marketing Becker Pumps
Jay Francis Vice President Marketing SPX Flow Technology
Jon Jensen Energy Conservation Manager SMC Corp. of America
Hank Van Ormer President Air Power USA
Les Ottinger President/CEO THP Inc.
Nitin Shanbhag Senior Manager, Industrial Division Hitachi America
Mike Gembala Vice President Blake & Pendleton, Inc.
Pierre Noack President Aerzen USA
Clint Hodge National Accounts Manager ASCO Numatics
Peter Stern PrincipalQuality Maintenance Services
0 7 / 1 3 |
5 airbestpractices.com
Columns
C o m p r e s s e d A i r , C o m p r e s s e d A i r , C o m p r e s s e d A i r , ppp n e u mn e u mn e u m AAA t it it i CCC s , s , s , VVV A CA CA C u u m & B l o w e r u u m & B l o w e r u u m & B l o w e r iii n d u s t r y n d u s t r y n d u s t r y nnn e w se w se w s
Atlas Copco Compressors Announces New Structure to Support Enhanced Distributor Network
Atlas Copco Compressors has created a new centralized Distributor
Support Service to provide administrative sales support and technical
assistance for Atlas Copco Compressors’ complete product portfolio.
“Sales support administration and technical assistance make up greater
than 90% of the calls we receive from our expanding distributor
network, making the synergies that come from centralizing these
functions critical for our future successes’ together,” said John
Brookshire, president, Atlas Copco Compressors LLC. “The new group
will provide first-class customer service and ensure our distributor
support rises to the next level.” The centralized Distributor Sales
Support Group will support distributors with pricing inquiries and
advise on lead times and delivery dates for new and existing orders,
while fully supporting the distributors with the extranet tools they work
with today — Global Business Portal (GBP) and ACConnect.
The creation of the centralized Distributor Technical Support Group
is at the center of Atlas Copco’s strategy to align technical support
with product competencies as opposed to geographic regions.
The new group will expand the current customer service model
to include high-level technical support and product knowledge available
to distributors across the U.S. Both teams will provide coverage across
all U.S. time zones and can be reached by calling one dedicated number
— 866-865-7999. All distributors will continue to be managed by their
dedicated field-based Sales Manager.
Visit www.atlascopco.us
Kaeser Compressors Announces Association with Gas Monkey Garage
Kaeser Compressors, Inc. is proud to announce our association with
Gas Monkey Garage, the automotive fabrication and restoration shop
featured on Discovery Channel's original series Fast N’ Loud.
Fast N’ Loud features car fanatics Richard Rawlings and Aaron
Kaufman as they restore derelict classic cars to their full throttle
glory. Kaeser designed and installed the compressed air system for
Gas Monkey Garage’s new facility in Dallas, Texas. Two 15hp rotary
screw compressors with dryers, filtration, air tanks, and SmartPipe™
will provide the quality air and storage needed for the blast cabinet,
grinders, sanders, and spray booth that the Monkeys use to bring gone-
but-not-forgotten classic cars back to life. Fast N’ Loud airs on the
Discovery Channel, Mondays at 9 pm/8 pm Central Time.
Visit www.kaesernews.com/GMG or please call 877-586-2691.
For more information on Gas Monkey Garage and Fast N’ Loud, visit www.gasmonkeygarage.com or www.dsc.discovery.com/tv-shows/fast-n-loud.
COSE Partners on New Ohio Energy Resource Fund
Manufacturers, schools, churches, and clinics throughout the Buckeye
State could cut tens of millions of dollars a year on their energy bills,
thanks to a new pioneering financial tool launching today by the Council
of Smaller Enterprises (COSE), efficiency-services financer Metrus
Energy, and CalCEF, an organization focused on accelerating clean
energy technologies.
The new Ohio Efficiency Resource Fund provides otherwise hard-to-
get financing for small and medium-sized businesses to make energy-
efficiency improvements, with no upfront costs and no risk. This
innovative approach bridges the funding gap that has stymied small-
and mid-sized retrofit projects — thousands of buildings statewide.
Here’s how it works: The Fund signs an Efficiency Services Agreement
(ESA) for up to 10 years with a building owner, purchases the new
equipment, and hires contractors to design, install, measure, and
maintain the energy-saving improvements. As a result, the customer
sees a reduction in its total utility bill, while the building becomes
more functional, productive, and comfortable. The Fund recoups its
investment by billing customers for their actual realized efficiency
gains. Since the useful life of the energy-efficiency equipment
continues well beyond the life of the contract, customers continue
to save for years to come.
| 0 7 / 1 3
6 airbestpractices.com
Columns

Converting Knowledge Into Solutions
Since 1948, SPX has provided innovative air treatment products for
critical applications. Our new product development initiatives are driven
by customer INSIGHT meeting the challenges of today and anticipated
opportunities of tomorrow. Through precise EXECUTION, ideas are
transformed into powerful solutions that bring value and a competitive
advantage to our customers.
Getting It Done
Our commitment to innovation is realized with the development of the
new HES series high capacity refrigerated air dryer and HCD Series heat
of compression desiccant air dryer. The designs are inspired by market
demand for sustainable energy savings, fault-tolerant operation and ISO
quality class performance.
Come join us to learn more. Visit us at www.spx.com.
724.745.1555
Meet Us At the Corner of InsIght & exeCUtIon...for new IdeAs set Into ACtIon
C O M P R E S S E D A I R , P N E U M AT I C S , V A C U U M & B L O w E R I N D U S T R y N E w S
The Fund also will help property owners meet the state’s Energy
Efficiency Resource Standard, which calls for cutting electricity use 22.2
percent by 2025. The Fund is now accepting applications from facility
owners who have efficiency retrofit projects costing less than $1 million.
“Like a utility sells electricity, the Fund will sell efficiency as a service
to building owners, delivering savings to local businesses,” said Bob
Hinkle, President and CEO of Metrus Energy, the Fund’s manager and
creator of the Efficiency Services Agreement. “We are excited to partner
with COSE to bring our efficiency finance know-how to this market.”
COSE, the largest small business support organization in Ohio with
more than 14,000 members, will play the critical role of helping identify
and match suitable projects with vetted local contractors. This is well-
trodded territory for COSE, which offers several energy programs to save
Ohio businesses — including an efficiency financing program recently
recognized by Chambers for Innovation and Clean Energy (CICE).
“This strategy makes the most of smart financing and local expertise,”
said Nicole Stika, Senior Director of Energy Services for the Council
of Smaller Enterprises. “It’s also a great way to generate jobs. Ohio, by
conservative estimates, already has more than 10,000 jobs tied to energy
efficiency, but that’s just the start; there’s tremendous potential in the
energy efficiency sector.”
By providing much needed financing, the Fund will help network service
providers conducting audits and recommending energy efficiency
measures to retrofit existing buildings.
“Our team is skilled at helping building owners identify and implement
energy projects that pay for themselves through the utility bill savings
they create,” said David Zehala, President of Columbus-based energy
services company Plug Smart. “This program obliterates all the financial
barriers associated with these projects making it easier for our clients
to say yes.”
“By more effectively connecting the supply of products and materials
from Ohio companies to Ohio projects, the Fund will be an economic
boon for the state,” said Shanelle Smith, Director, Emerald Cities
Cleveland, a Fund partner. EC Cleveland, an arm of the Emerald Cities
Collaborative, is a network of organizations working together to
advance a sustainable environment while creating greater economic
opportunities. “The Efficiency Resource Fund is enabling a whole class
of projects that may otherwise not be completed,” she said.
Visit www.cose.org
Atlas Copco Compressors Opens Central Technical Support Competency Center
Atlas Copco Compressors opened the new Technical Support
Competency Center in Rock Hill, S.C., on May 21, 2013. The event
began with brief remarks and a ceremonial ribbon-cutting by Atlas
Copco Compressors' leadership, which included John Brookshire,
president, Mike Iacino, vice president service operations, Jim Bruce,
national technical support training manager and guests of honor Doug
Echols, Rock Hill mayor and Andrew Walker, divisional president
Atlas Copco Compressor Service (CTS). Following the ribbon-cutting,
guests toured the facility and viewed demonstrations of the new remote
monitoring center in action. Over 80 Atlas Copco employees and several
members of the Rock Hill chamber of commerce attended the event.
The Center will house dedicated technical support liaisons who will
expand the current customer service model and provide high-level
technical support and product knowledge to customers across the
U.S. The support group will also manage the new remote monitoring
service offering and will work with local regional liaisons or distribution
partners to address customer needs as they develop. The group is
conveniently located near the product management team and can
be reached by calling one dedicated number — 866-865-7995.
Visit www.atlascopco.us
Kaeser Factory-Direct Facility Now Open in Philadelphia
Kaeser Compressors, Inc., a leading worldwide manufacturer of
industrial air compressors, blowers, and related equipment, opened a
new factory-direct facility to support Kaeser’s industrial and commercial
customers in the greater Philadelphia area. The new branch supplies
and supports the company's entire product offering. The branch team
of factory-trained sales and service professionals is led by Dan LeViness
and offers a full range of services, including:
pp Air system audits for energy reduction and process improvement
pp Air system design and installation
pp New equipment sales
pp Scheduled preventive maintenance
pp Equipment repair services
“We are excited to have the opportunity to support the compressed
air needs of the Philadelphia area,” said LeViness. “Kaeser has a well-
| 0 7 / 1 3
8 airbestpractices.com
Columns
Advanced hydrocarbon monitoring systems for compressed air
Advanced hydrocarbon removal systems for compressed air
Each technology featured above is unique and exclusive to BEKO worldwide.
earned reputation for providing superior service and energy efficient
compressed air solutions. We are confident that area businesses
will quickly understand why Kaeser is the best choice.” For more
information about the facilities or to discuss air system needs,
call 888-684-9533.
Visit www.kaeser.com/cabp
California Energy Commission Keeps State on Track to Reach Clean Transportation Goals
The California Energy Commission unanimously adopted the 2013-
2014 Investment Plan Update to support the development and use of
green vehicles and alternative fuels. The update sets funding priorities
for the approximately $100 million in annual state funds under the
Commission’s Alternative and Renewable Fuels and Vehicle Technology
(ARFVT) Program, created by Assembly Bill 118.
“This investment plan provides a solid foundation for the continued
transformation of California’s transportation sector,” said Energy
Commission Chair Robert B. Weisenmiller. “The plan will guide
the Commission in supporting projects that reduce greenhouse gas
emissions, improve air quality, increase fuel diversity to reduce reliance
on petroleum, and help create jobs. These efforts benefit all Californians
by protecting the environment and public health, and ensuring the state
continues to be a leader in green technology.”
Funding priorities through the ARFVT Program support fuel and
vehicle development to help attain the state's climate change policies.
In addition, the program funds projects that assist in fulfilling Governor
Brown’s Zero Emission Vehicles (ZEV) Action Plan, with a target
of installing enough infrastructure to support 1 million ZEVs by 2020,
and a 2025 target of having 1.5 million ZEVs on the state’s roads.
Investments made through the program’s competitive solicitation
process provide a crucial jump-start in funding to overcome market
barriers for new fuels and technology, while leveraging additional
investment from federal agencies, research institutions, private
investors and other stakeholders.
0 7 / 1 3 |
9 airbestpractices.com
Columns
airbestpractices.com
ENERGY KAIZEN EVENTS
Get your FREE Subscription to Compressed Air Best Practices® Magazine to learn how to save energy.
Subscribe at
p Food Packaging Plant Saves $70,000 or 1.1 Million kWh per year. p Paper Mill Saves $207,000 or 4.5 Million kWh per year.
C O M P R E S S E D A I R , P N E U M AT I C S , V A C U U M & B L O w E R I N D U S T R y N E w S
“We provide needed funding to cutting edge technologies. Using public
money to supplement private sector investments and hedge financial
risk is critical to getting new technology cars, trucks and fuels into
our California markets,” Chair Weisenmiller said.
The program funds projects to encourage the development and use
of new technologies and alternative and renewable fuels, including
electricity, natural gas, biomethane, hydrogen, and gasoline and diesel
substitutes, such as cellulosic ethanol (derived from woody materials,
including agricultural waste), and biodiesel from waste grease. Funding
sources include small surcharges on vehicle and vessel registrations,
and license plate and smog abatement fees.
The program is essential to California’s efforts to reduce greenhouse gas
emissions to 80 percent below 1990 levels by 2050, as required by AB
32; decrease petroleum fuel use to 15 percent below 2003 levels by 2020;
increase the use of alternative fuels to 26 percent of all fuel consumed
by 2022; and reduce emissions of nitrogen oxides to 80 percent of 2010
levels by 2023 to help meet federal ozone standards in areas of California
such as the San Joaquin Valley and South Coast air basins.
Currently, the state’s transportation sector accounts for nearly 40
percent of the state’s greenhouse gas emissions, and more than
95 percent of all transportation energy consumed in California
is petroleum-based.
The 2013-2014 plan update allocates $100 million to projects
in the following areas:
pp $23 million for biofuels production and supply, with an emphasis on fuels made from waste-based and other low-carbon, sustainable materials.
pp $20 million for hydrogen fueling infrastructure. An estimated 68 stations are needed to support the anticipated rollout of these vehicles in 2015-2017. Roughly 24 stations are built or in development.
pp $15 million for medium- and heavy-duty electric truck and hybrid vehicle demonstration projects.
pp $12 million for natural gas vehicle incentives. These incentives help to pay the difference between the cost
| 0 7 / 1 3
10 airbestpractices.com
Columns
COMPRESSED AIR ALSO PRODUCES OILY CONDENSATE*
Help ensure it doesn’t impact ourENVIRONMENT.
JORC Zero Air-Loss Condensate Drains and Oil/Water Separators provide
SUSTAINABLE CONDENSATE MANAGEMENT
Zero Air-Loss Condensate Drains
Lock-Down Air Leaks
JORC Industrial LLC. • 1146 River Road • New Castle, DE 19720Phone: 302-395-0310 • Fax: 302-395-0312 • [email protected] • www.jorc.com
*A 250 hp compressor can produce 40,515 gallons of oily condensate per year.
Sepremium Oil/Water Separator
Air-Saver G2
Smart Guard Ultra
Electronic
No Electricity Required
Mag-11 - 230 psi POD-DC Non-Electric
Smart Guard
To read more To read more To read more Industry NewsIndustry NewsIndustry News articles, articles, articles,Industry News articles,Industry NewsIndustry NewsIndustry News articles,Industry News articles,Industry News articles,Industry NewsIndustry NewsIndustry News articles,Industry Newsvisit www.airbestpractices.comvisit www.airbestpractices.comvisit www.airbestpractices.com
of alternative-fuel vehicles and conventional vehicles. Buyers must agree to register and operate the vehicles in California at least 90 percent of the time for three years.
pp $7 million for electric vehicle charging infrastructure, coordinated to fulfill the Governor’s ZEV Action Plan. Workplace, fleet and multi-unit dwelling projects will be given priority.
pp $5 million for light-duty plug-in electric vehicle rebates to meet high demand for the Clean Vehicle Rebate Program, administered by the California Air Resources Board.
pp $5 million for manufacturing projects, supporting economic development and clean transportation technology.
pp $4 million to emerging opportunities. This allocation is not specifically tied to any single fuel or technology type, with a priority for projects that can leverage federal funding.
pp $3.5 million for regional alternative fuel readiness and planning, building on previous projects supporting these efforts.
pp $2 million for centers for alternative fuels and advanced vehicles to support collaborative efforts that promote innovation, demonstrate new technologies, leverage venture capital and federal funds, and provide workforce training.
pp $2 million to workforce training and development.
pp $1.5 million for natural gas fueling infrastructure to support growing use of these alternative fuel vehicles by many entities, including school districts.
Visit www.energy.ca.gov/releases/
0 7 / 1 3 |
11 airbestpractices.com
Columns
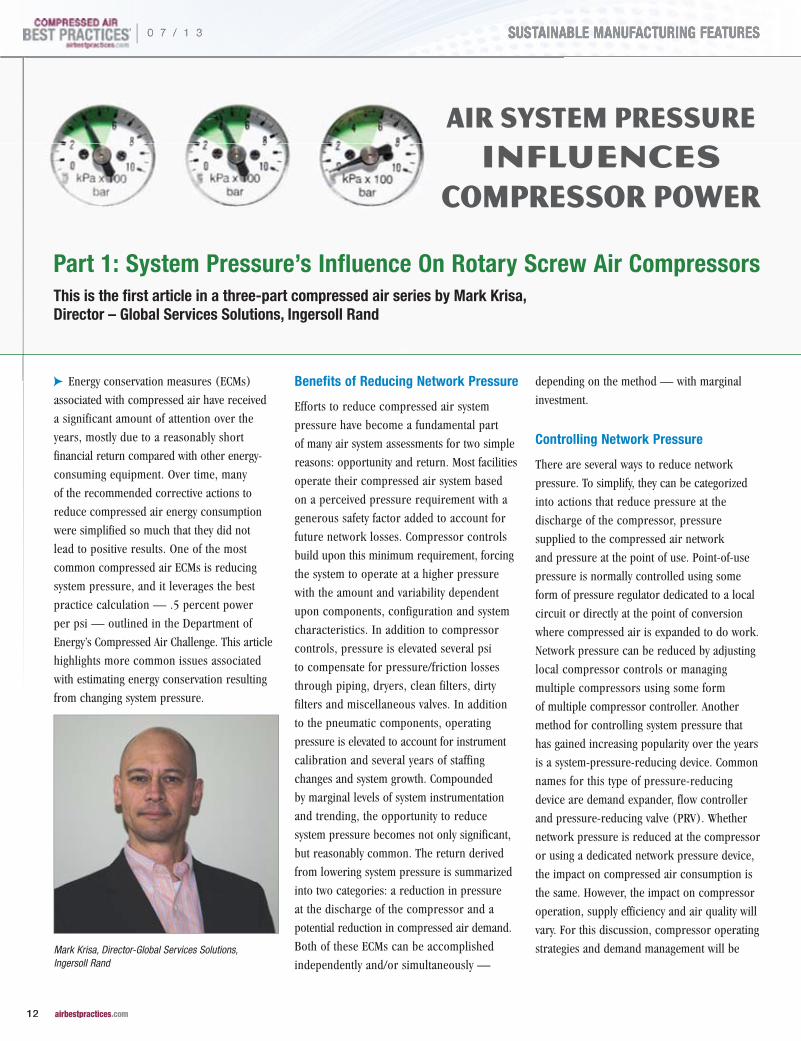
Part 1: System Pressure’s Influence On Rotary Screw Air CompressorsThis is the first article in a three-part compressed air series by Mark Krisa, Director – Global Services Solutions, Ingersoll Rand
Air System PressureInfluences
Compressor Power
cpEnergy conservation measures (ECMs)
associated with compressed air have received
a significant amount of attention over the
years, mostly due to a reasonably short
financial return compared with other energy-
consuming equipment. Over time, many
of the recommended corrective actions to
reduce compressed air energy consumption
were simplified so much that they did not
lead to positive results. One of the most
common compressed air ECMs is reducing
system pressure, and it leverages the best
practice calculation — .5 percent power
per psi — outlined in the Department of
Energy’s Compressed Air Challenge. This article
highlights more common issues associated
with estimating energy conservation resulting
from changing system pressure.
Benefits of Reducing Network Pressure
Efforts to reduce compressed air system
pressure have become a fundamental part
of many air system assessments for two simple
reasons: opportunity and return. Most facilities
operate their compressed air system based
on a perceived pressure requirement with a
generous safety factor added to account for
future network losses. Compressor controls
build upon this minimum requirement, forcing
the system to operate at a higher pressure
with the amount and variability dependent
upon components, configuration and system
characteristics. In addition to compressor
controls, pressure is elevated several psi
to compensate for pressure/friction losses
through piping, dryers, clean filters, dirty
filters and miscellaneous valves. In addition
to the pneumatic components, operating
pressure is elevated to account for instrument
calibration and several years of staffing
changes and system growth. Compounded
by marginal levels of system instrumentation
and trending, the opportunity to reduce
system pressure becomes not only significant,
but reasonably common. The return derived
from lowering system pressure is summarized
into two categories: a reduction in pressure
at the discharge of the compressor and a
potential reduction in compressed air demand.
Both of these ECMs can be accomplished
independently and/or simultaneously —
depending on the method — with marginal
investment.
Controlling Network Pressure
There are several ways to reduce network
pressure. To simplify, they can be categorized
into actions that reduce pressure at the
discharge of the compressor, pressure
supplied to the compressed air network
and pressure at the point of use. Point-of-use
pressure is normally controlled using some
form of pressure regulator dedicated to a local
circuit or directly at the point of conversion
where compressed air is expanded to do work.
Network pressure can be reduced by adjusting
local compressor controls or managing
multiple compressors using some form
of multiple compressor controller. Another
method for controlling system pressure that
has gained increasing popularity over the years
is a system-pressure-reducing device. Common
names for this type of pressure-reducing
device are demand expander, flow controller
and pressure-reducing valve (PRV). Whether
network pressure is reduced at the compressor
or using a dedicated network pressure device,
the impact on compressed air consumption is
the same. However, the impact on compressor
operation, supply efficiency and air quality will
vary. For this discussion, compressor operating
strategies and demand management will be Mark Krisa, Director-Global Services Solutions, Ingersoll Rand
| 0 7 / 1 3
12 airbestpractices.com
SUSTAINABLE MANUFACTURING FEATURESSUSTAINABLE MANUFACTURING FEATURES
Our R-Series Rotary Screw Compressors prove
that R stands for rugged reliability. Designed for
virtual 24/7 operation, the R-Series line offers
advanced features like Progressive Adaptive
Control™ (PAC™) protection, V-Shield™
technology, a sequential cooling system and
state-of-the-art Xe-Series controls for effi cient
operation and reduced cost of ownership.
Innovative designs backed by a century of
service. Dependability for decades. That’s
Ingersoll Rand.
www.ingersollrandproducts.com
Everything Running Smoothly,
Every Day (after day, after day)
21873.indd 1 12/11/12 10:39 AM
excluded, limiting scope to the influence
of pressure on compressed air consumption
and compressor power.
Strategies for Reducing Network Pressure
Before attempting to calculate energy savings
associated with reducing compressed air
pressure, operations must be willing to
support change. In most facilities, people on
the plant floor typically believe more pressure
is better and anything that reduces the current
network pressure causes issues. To overcome
perceived requirements, facility managers can
dictate a change and force operations to adapt.
For some organizations this is an effective
strategy, but it can often create an adversarial
environment where operations associate
production issues with insufficient pressure,
quickly allocating blame to recent changes
in network pressure. When this occurs, raising
the pressure can seem like the ideal solution
to problems believed to be associated with the
recent reduction in system pressure, and this
negatively impacts energy savings over time.
Ideally, a collaborative approach that engages
operations in the project delivers the best
returns and sustainable results. This approach
requires an understanding of current and
historic issues that helped define the perceived
compressed air system pressure requirements.
As an organization that has successfully
implemented thousands of compressed air
audits over the years, Ingersoll Rand has found
that it is best to start with how pressure is
supplied. Using pressure recording devices
helps accurately define what pressure is
delivered with respect to time. For many
systems, pressure varies throughout the day
and week, frequently falling below perceived
requirements. Provided no production issues
occurred, the data helps educate operations
regarding how the system currently functions
and how minimizing pressure variance reduces
average pressure without reducing pressure
below their current state. This also assists in
defining pressure goals based on quantified
data, independent of operator perception or
anecdotal beliefs.
Pressure at the discharge of the compressor
can be reduced independently of changing
network pressure by minimizing pressure
losses across piping and air treatment
equipment. In this situation, it is important
to measure pressure accurately across
components at various supply loads. These
corrective actions can be costly and intrusive,
so accuracy of current and proposed state
is essential to ensure corrective actions will
deliver defined returns.
Estimating Energy Reduction for a Sample System
Reducing system pressure can potentially
lower compressed air consumption and
compressor power. The balance of this
article reviews the influence of pressure on
compressor power. Compressor power savings
are typically estimated using the industry-
recognized rule of thumb where power is
assumed to decrease 0.5 percent for every 1
psi reduction in pressure.
This example is based on a simple system with
four identical 100 hp compressors operating
using loaded/unloaded local controls, and a
simple pressure cascade between compressor
control settings. Compressors are rated for
400 scfm at site conditions, consuming 100 hp
at 115 psig and 70 hp at 50 percent load. Each
compressor has a 20-second start-permissive
(off to full-load). Total system storage is 660
U.S. gallons. For simplicity, the system has no
filters or dryers and total ∆P from compressor
package discharge to furthest point in the
0 7 / 1 3 |
13 airbestpractices.com
SUSTAINABLE MANUFACTURING FEATURESSUSTAINABLE MANUFACTURING FEATURES
AIR SySTEM PRESSURE INFLUENCES COMPRESSOR POwER
network is <0.4 psi. After recording pressure, amps and flow
for a seven-day period, four distinct load conditions were identified
in this system.
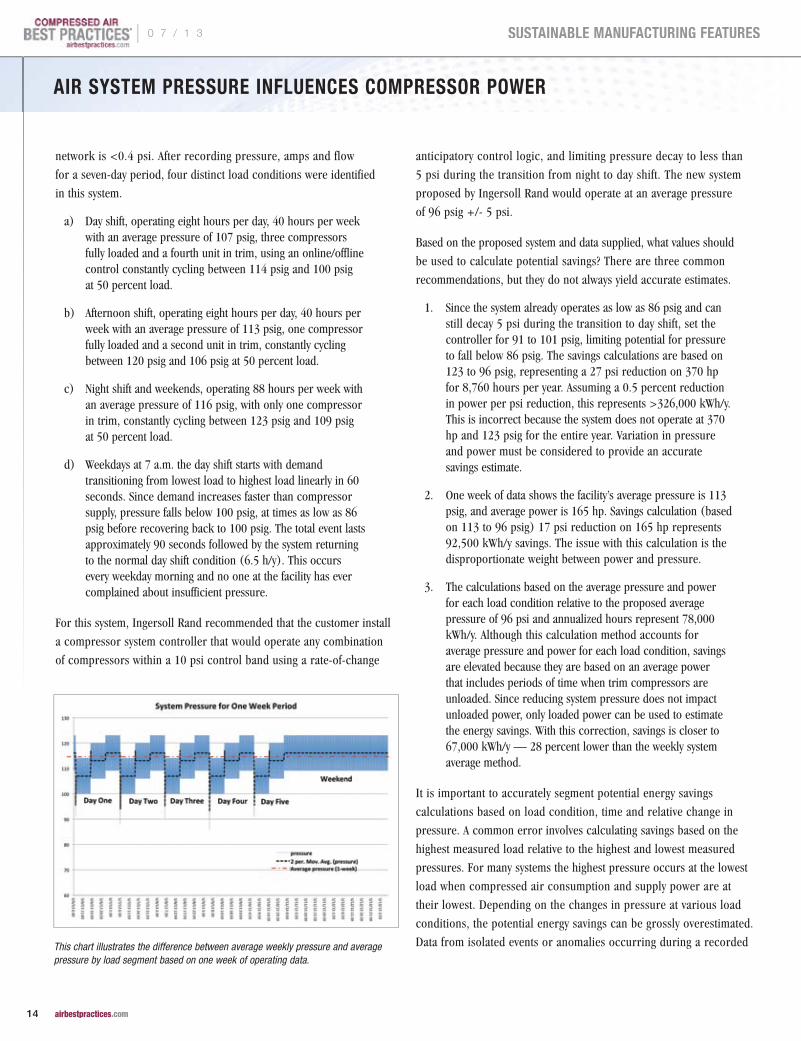
a) Day shift, operating eight hours per day, 40 hours per week with an average pressure of 107 psig, three compressors fully loaded and a fourth unit in trim, using an online/offline control constantly cycling between 114 psig and 100 psig at 50 percent load.
b) Afternoon shift, operating eight hours per day, 40 hours per week with an average pressure of 113 psig, one compressor fully loaded and a second unit in trim, constantly cycling between 120 psig and 106 psig at 50 percent load.
c) Night shift and weekends, operating 88 hours per week with an average pressure of 116 psig, with only one compressor in trim, constantly cycling between 123 psig and 109 psig at 50 percent load.
d) Weekdays at 7 a.m. the day shift starts with demand transitioning from lowest load to highest load linearly in 60 seconds. Since demand increases faster than compressor supply, pressure falls below 100 psig, at times as low as 86 psig before recovering back to 100 psig. The total event lasts approximately 90 seconds followed by the system returning to the normal day shift condition (6.5 h/y). This occurs every weekday morning and no one at the facility has ever complained about insufficient pressure.
For this system, Ingersoll Rand recommended that the customer install
a compressor system controller that would operate any combination
of compressors within a 10 psi control band using a rate-of-change
anticipatory control logic, and limiting pressure decay to less than
5 psi during the transition from night to day shift. The new system
proposed by Ingersoll Rand would operate at an average pressure
of 96 psig +/- 5 psi.
Based on the proposed system and data supplied, what values should
be used to calculate potential savings? There are three common
recommendations, but they do not always yield accurate estimates.
1. Since the system already operates as low as 86 psig and can still decay 5 psi during the transition to day shift, set the controller for 91 to 101 psig, limiting potential for pressure to fall below 86 psig. The savings calculations are based on 123 to 96 psig, representing a 27 psi reduction on 370 hp for 8,760 hours per year. Assuming a 0.5 percent reduction in power per psi reduction, this represents >326,000 kWh/y. This is incorrect because the system does not operate at 370 hp and 123 psig for the entire year. Variation in pressure and power must be considered to provide an accurate savings estimate.
2. One week of data shows the facility’s average pressure is 113 psig, and average power is 165 hp. Savings calculation (based on 113 to 96 psig) 17 psi reduction on 165 hp represents 92,500 kWh/y savings. The issue with this calculation is the disproportionate weight between power and pressure.
3. The calculations based on the average pressure and power for each load condition relative to the proposed average pressure of 96 psi and annualized hours represent 78,000 kWh/y. Although this calculation method accounts for average pressure and power for each load condition, savings are elevated because they are based on an average power that includes periods of time when trim compressors are unloaded. Since reducing system pressure does not impact unloaded power, only loaded power can be used to estimate the energy savings. With this correction, savings is closer to 67,000 kWh/y — 28 percent lower than the weekly system average method.
It is important to accurately segment potential energy savings
calculations based on load condition, time and relative change in
pressure. A common error involves calculating savings based on the
highest measured load relative to the highest and lowest measured
pressures. For many systems the highest pressure occurs at the lowest
load when compressed air consumption and supply power are at
their lowest. Depending on the changes in pressure at various load
conditions, the potential energy savings can be grossly overestimated.
Data from isolated events or anomalies occurring during a recorded This chart illustrates the difference between average weekly pressure and average pressure by load segment based on one week of operating data.
| 0 7 / 1 3
14 airbestpractices.com
SUSTAINABLE MANUFACTURING FEATURES
AIR SySTEM PRESSURE INFLUENCES COMPRESSOR POwER
To learn more, visit www.aerzenusa.com108 Independence Way • Coatesville, PA 19320
(610) 380-0244 • [email protected]
Learn how to save energy andincrease operating efficiencieswith the Aerzen Delta Hybrid
Rotary Lobe Compressor.
A New Twist in Energy-Efficient Air
• Substantial energy savings
• Reliable and durable
• Space saving, easy handling
• Reduction of maintenance costs
• Simple operation up to +22psig / -21”Hg
Aerzen Compressed Air Ad RND2_Aerzen Compressed Air Ad 8/15/11 3:47 P
period of time must be applied with caution. Referring back to the
previous example, operating the system at a pressure below 100 psig is
a risky assumption because the pressure is only below 100 psig for <90
seconds per day at the start of a shift. For a few seconds at the start of
a shift, any potential issues associated with insufficient pressure could
easily be ignored or blamed on equipment start-up. A more detailed
investigation of the production equipment needs to be done next
to confirm required pressure and the ability to operate at a reduced
value without issue.
Compressor Power Savings from Pressure Reduction
To describe the benefits of lower pressure at the discharge of a
compressor, it is best to differentiate between positive displacement
and dynamic compressors. How air is compressed and the influence
of air pressure is very different for these two technologies. This article
focuses on positive displacement air compressors, more specifically
rotary screw type compressors.
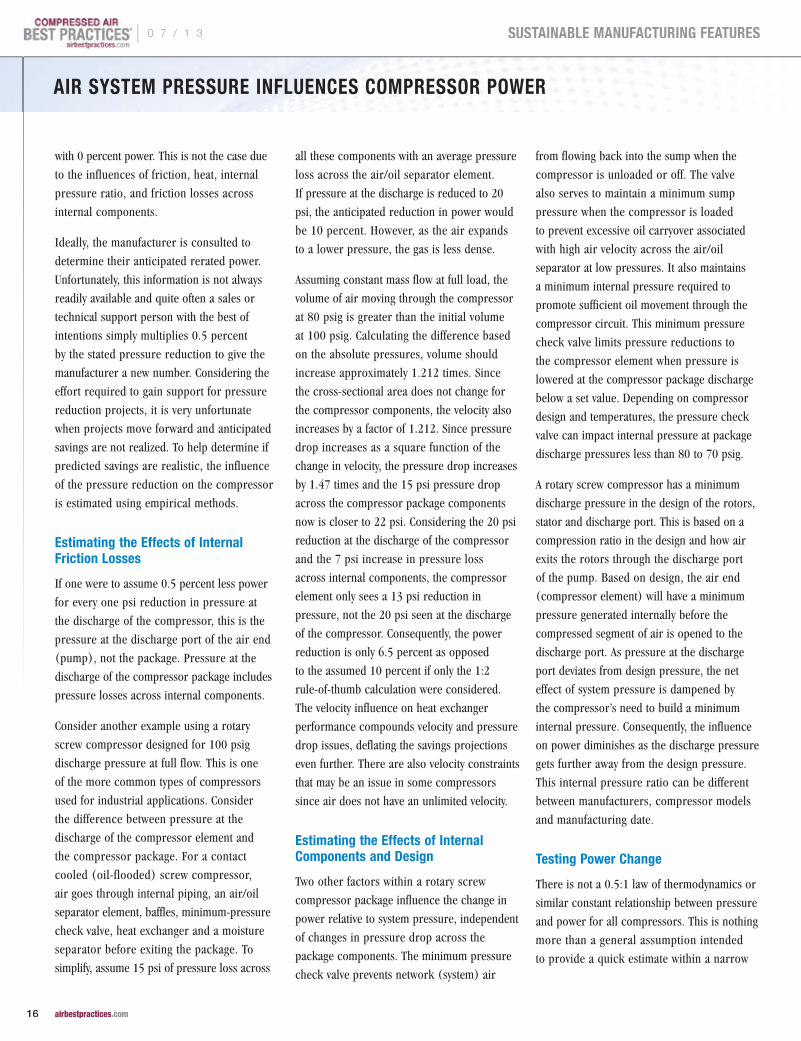
Estimating the Effect on Positive Displacement Compressors
The best way to describe a positive displacement compressor is to give
the example of an old-fashioned bicycle pump. At first, the pressure is
low, and moving the handle up and down is easy. As pressure increases,
it becomes more difficult to push on the handle. If the pump has a 2"
diameter piston, one would need to put all of his or her weight on the
handle to push 60 psi of pressure into the tire. This is because work
is done as a function of the piston area and the air pressure within the
pump. With a 2" piston and a surface area of 3.14 in2, the force acting
against the piston is in excess of 188 lbf.
A positive displacement rotary screw compressor is very similar
because the torque required to turn the rotors is a function of the
pressure pushing against the rotors. Considering this fact, the torque
required to move a given volume of air through the compressor
is reduced as the discharge pressure is reduced. For a positive
displacement compressor, like a rotary screw compressor or a
reciprocating (piston) compressor, this change in pressure is generally
assumed within the industry to represent approximately 0.5 percent
drop in power for every 1 psi reduction at the discharge. Although this
rule of thumb has been embraced as a scientific fact by many in the
industry, it only serves to provide an estimated change in power for
positive displacement compressors and should not be considered an
accurate calculation. If the 0.5 percent theory held true, manufacturers
would design compressors for 300 psig and then run them at 100 psig
0 7 / 1 3 |
15 airbestpractices.com
SUSTAINABLE MANUFACTURING FEATURES
AIR SySTEM PRESSURE INFLUENCES COMPRESSOR POwER
with 0 percent power. This is not the case due
to the influences of friction, heat, internal
pressure ratio, and friction losses across
internal components.
Ideally, the manufacturer is consulted to
determine their anticipated rerated power.
Unfortunately, this information is not always
readily available and quite often a sales or
technical support person with the best of
intentions simply multiplies 0.5 percent
by the stated pressure reduction to give the
manufacturer a new number. Considering the
effort required to gain support for pressure
reduction projects, it is very unfortunate
when projects move forward and anticipated
savings are not realized. To help determine if
predicted savings are realistic, the influence
of the pressure reduction on the compressor
is estimated using empirical methods.
Estimating the Effects of Internal Friction Losses
If one were to assume 0.5 percent less power
for every one psi reduction in pressure at
the discharge of the compressor, this is the
pressure at the discharge port of the air end
(pump), not the package. Pressure at the
discharge of the compressor package includes
pressure losses across internal components.
Consider another example using a rotary
screw compressor designed for 100 psig
discharge pressure at full flow. This is one
of the more common types of compressors
used for industrial applications. Consider
the difference between pressure at the
discharge of the compressor element and
the compressor package. For a contact
cooled (oil-flooded) screw compressor,
air goes through internal piping, an air/oil
separator element, baffles, minimum-pressure
check valve, heat exchanger and a moisture
separator before exiting the package. To
simplify, assume 15 psi of pressure loss across
all these components with an average pressure
loss across the air/oil separator element.
If pressure at the discharge is reduced to 20
psi, the anticipated reduction in power would
be 10 percent. However, as the air expands
to a lower pressure, the gas is less dense.
Assuming constant mass flow at full load, the
volume of air moving through the compressor
at 80 psig is greater than the initial volume
at 100 psig. Calculating the difference based
on the absolute pressures, volume should
increase approximately 1.212 times. Since
the cross-sectional area does not change for
the compressor components, the velocity also
increases by a factor of 1.212. Since pressure
drop increases as a square function of the
change in velocity, the pressure drop increases
by 1.47 times and the 15 psi pressure drop
across the compressor package components
now is closer to 22 psi. Considering the 20 psi
reduction at the discharge of the compressor
and the 7 psi increase in pressure loss
across internal components, the compressor
element only sees a 13 psi reduction in
pressure, not the 20 psi seen at the discharge
of the compressor. Consequently, the power
reduction is only 6.5 percent as opposed
to the assumed 10 percent if only the 1:2
rule-of-thumb calculation were considered.
The velocity influence on heat exchanger
performance compounds velocity and pressure
drop issues, deflating the savings projections
even further. There are also velocity constraints
that may be an issue in some compressors
since air does not have an unlimited velocity.
Estimating the Effects of Internal Components and Design
Two other factors within a rotary screw
compressor package influence the change in
power relative to system pressure, independent
of changes in pressure drop across the
package components. The minimum pressure
check valve prevents network (system) air
from flowing back into the sump when the
compressor is unloaded or off. The valve
also serves to maintain a minimum sump
pressure when the compressor is loaded
to prevent excessive oil carryover associated
with high air velocity across the air/oil
separator at low pressures. It also maintains
a minimum internal pressure required to
promote sufficient oil movement through the
compressor circuit. This minimum pressure
check valve limits pressure reductions to
the compressor element when pressure is
lowered at the compressor package discharge
below a set value. Depending on compressor
design and temperatures, the pressure check
valve can impact internal pressure at package
discharge pressures less than 80 to 70 psig.
A rotary screw compressor has a minimum
discharge pressure in the design of the rotors,
stator and discharge port. This is based on a
compression ratio in the design and how air
exits the rotors through the discharge port
of the pump. Based on design, the air end
(compressor element) will have a minimum
pressure generated internally before the
compressed segment of air is opened to the
discharge port. As pressure at the discharge
port deviates from design pressure, the net
effect of system pressure is dampened by
the compressor’s need to build a minimum
internal pressure. Consequently, the influence
on power diminishes as the discharge pressure
gets further away from the design pressure.
This internal pressure ratio can be different
between manufacturers, compressor models
and manufacturing date.
Testing Power Change
There is not a 0.5:1 law of thermodynamics or
similar constant relationship between pressure
and power for all compressors. This is nothing
more than a general assumption intended
to provide a quick estimate within a narrow
| 0 7 / 1 3
16 airbestpractices.com
SUSTAINABLE MANUFACTURING FEATURES
AIR SySTEM PRESSURE INFLUENCES COMPRESSOR POwER
range of pressure deviation from design.
Unfortunately the truth is not well-known,
and the math required for calculating power
relative to discharge pressure for a specific
compressor package is very complex.
The most accurate method of confirming the
change in power associated with a reduction in
pressure is to measure it. Run the compressor
during a night or weekend shift when demand
is lower and system pressure can be reduced.
If this is not possible, drop system pressure
carefully during normal production and note
the change in power. Ideally, actual power
(kW) is measured, not apparent power
(kVA). Apparent power is normally calculated
by measuring amperage and voltage. Utility
companies charge based on actual power
in kW so appropriate testing equipment is
essential. The need for kW meters is due
to the change in power factor associated
with a reduction in motor load. The power
factor is also influenced by loads placed
on the electrical system, independent of
the compressor. As the power factor value
becomes lower, the amperage will increase,
which misrepresents the actual power.
Since power factor and voltage can change
independent of the compressor operation,
measuring amperage only and applying
a constant to calculate compressor power
can be misleading and lead to incorrect
assumptions associated with compressor
operation and estimated energy savings.
Final Savings Estimate for the Sample Problem
Referring back to the first example
introduced in this article, savings ranged
from a grossly overestimated 326,000
kWh/y to 67,000 kWh/y after considering
details associated with pressure acting on
the compressor package and the different
load conditions. Ignoring any potential
changes associated with pressure loss across
piping, dryers and filters, the influence of
changes on internal pressure loss and a
measured 0.3 percent change in power per
psi change at the air-end discharge results
in a savings estimate of 23,000 kWh/y. The
most common assessment practices are based
on averaging seven days of recorded data
and then calculating savings relative to some
proposed state. For the sample system used
in this article, the common approach estimates
savings at 92,500 kWh/y. Consequently
potential savings could be inadvertently inflated
four times greater than the actual savings. This
illustrates the importance of employing more
detailed analysis and testing methods when
attempting to develop energy conservation
projects with verifiable results.
Read Part 2: The influence of system pressure on centrifugal compressors in the August issue of Compressed Air Best Practices
ABOUT THE AUTHOR
Mark Krisa is Director — Global Services Solutions at Ingersoll Rand, and leads the company’s compressed air audit program. This program is designed to deliver customer value by leveraging engineering and compressed air science to improve system reliability, quality and efficiency.
Krisa graduated from the University of Western Ontario in Canada with a degree in engineering science, and has worked in the compressed air industry for more than 20 years. His experience in the industry is diverse, ranging from compressor service technician to engineering and compressed air system auditor. Krisa authored several papers and speaks regularly at conferences and training events across the Americas.
To read more To read more To read more System AssessmentSystem AssessmentSystem Assessment articles, articles, articles, System Assessment articles, System AssessmentSystem AssessmentSystem Assessment articles, System Assessment articles, System Assessment articles, System AssessmentSystem AssessmentSystem Assessment articles, System Assessmentvisit www.airbestpractices.com/system-visit www.airbestpractices.com/system-visit www.airbestpractices.com/system-
assessmentsassessmentsassessments
COMPRESSED AIR IS ENERGYDon’t let it go to waste
Our low-cost, easily-installed flowmeters are changing
the way people manage their compressed air systems.
Metering branch lines reveals dramatic savings opportuni-
ties and ensures that once savings are achieved, they are
maintained.
www.cdimeters.com
Phone: 781-935-9600 • Toll free (US and Canada): 866-885-2462
0 7 / 1 3 |
17 airbestpractices.com
SUSTAINABLE MANUFACTURING FEATURES
The Compressed Air The Compressed Air The Compressed Air sssysysysTTTem Assessmenem Assessmenem AssessmenTTT
Pneumatic Conveying Energy Assessment Saves $321,000By Don van Ormer, Air Power USA
cpIntroduction
This factory, located in the U.S. northeast,
spent an estimated $890,205 annually on
energy to operate the compressed air system.
The group of projects recommended below
reduced these energy costs by $321,000 or
36% of current use. These estimates are based
upon a blended electric rate of $0.118/kWh.
Estimated costs for completing the
recommended projects total $625,500 —
providing a simple payback period of 48
months. This does not take into account the
real possibility of energy incentives of up to
$250,000 being awarded to this project. Due
to article length constraints, only selected
energy-efficiency projects will be reviewed.
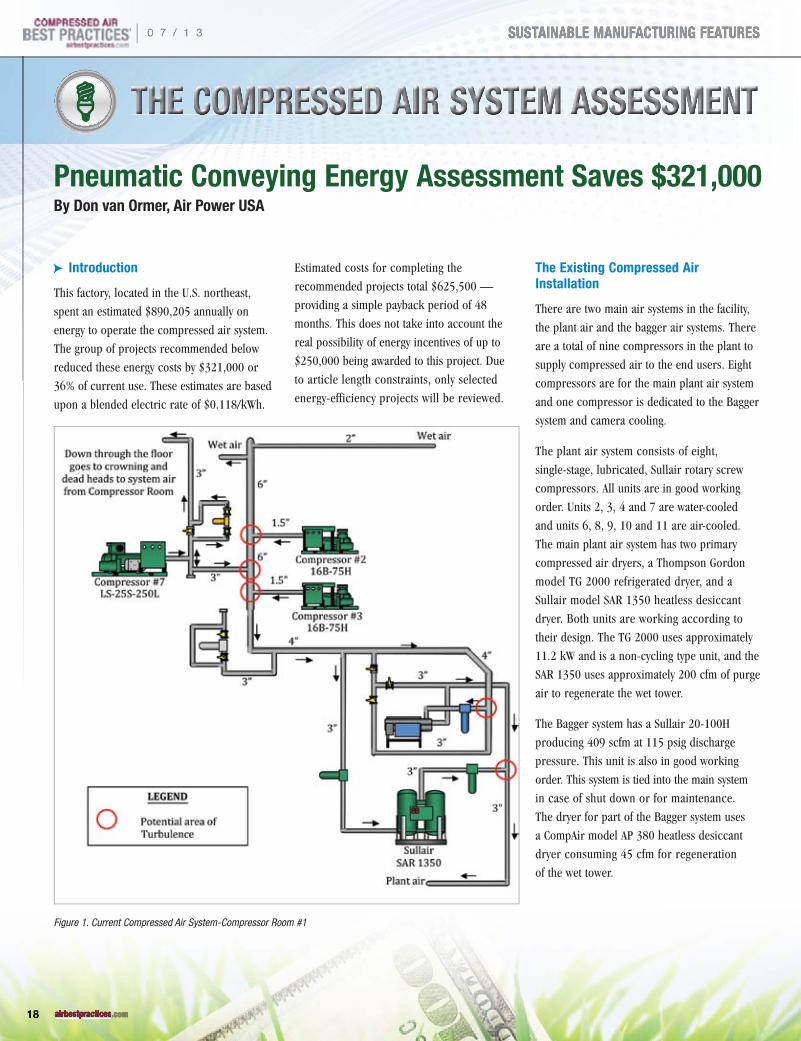
The Existing Compressed Air Installation
There are two main air systems in the facility,
the plant air and the bagger air systems. There
are a total of nine compressors in the plant to
supply compressed air to the end users. Eight
compressors are for the main plant air system
and one compressor is dedicated to the Bagger
system and camera cooling.
The plant air system consists of eight,
single-stage, lubricated, Sullair rotary screw
compressors. All units are in good working
order. Units 2, 3, 4 and 7 are water-cooled
and units 6, 8, 9, 10 and 11 are air-cooled.
The main plant air system has two primary
compressed air dryers, a Thompson Gordon
model TG 2000 refrigerated dryer, and a
Sullair model SAR 1350 heatless desiccant
dryer. Both units are working according to
their design. The TG 2000 uses approximately
11.2 kW and is a non-cycling type unit, and the
SAR 1350 uses approximately 200 cfm of purge
air to regenerate the wet tower.
The Bagger system has a Sullair 20-100H
producing 409 scfm at 115 psig discharge
pressure. This unit is also in good working
order. This system is tied into the main system
in case of shut down or for maintenance.
The dryer for part of the Bagger system uses
a CompAir model AP 380 heatless desiccant
dryer consuming 45 cfm for regeneration
of the wet tower.
Figure 1. Current Compressed Air System-Compressor Room #1
| 0 7 / 1 3
18 airbestpractices.com
SUSTAINABLE MANUFACTURING FEATURESSUSTAINABLE MANUFACTURING FEATURES
Pneumatic Conveying Energy Assessment Saves $321,000By Don van Ormer, Air Power USA
Aside from reliably and effi ciently generating high quality oil free
compressed air, our SO 270 has more to offer than meets the eye:
e.g., for further effi ciency improvement, the option to use an
external HOC adsorption dryer which uses the existing heat of the
compressed air to dry it entirely without any additional energy
supply. Another option is heat recovery. Highest energy effi ciency
for extreme applications – the water cooled SO 270, with or
without frequency control, is ready to provide your company
with the necessary air to work.
To learn more about BOGE, the SO product range, or our other products phone 770-874-1570 or visit www.boge.com/us
Thomas Lalk, Product Developer Oil free Screw Compressors, BOGE
B O G E A I R . T H E A I R T O W O R K .
True greatness comes from within: This is where oil free compressed air is generated
with low energy consumption.”
”
”
The air compressors are located in basically
two rooms. Compressor room #1 has Units
2 and 3, with 7 outside the wall connected
to the 6" header in the room. Compressor
room #2 has Units 4, 6, 8, 9, 10, and outside
is compressor 11 feeding the Bagger line and
camera cooling.
Main End Users of Compressed Air
One significant end user of compressed
air is the Bagger on Line 3, operating the
large cylinders for filling the bags with loose
material. Not all of the air for the Bagger is
dried meaning saturated and oily compressed
air is going into this process. This system also
supplies the Crown Blowing camera coolers
allowing operation personnel to monitor
the process.
The Blowing Crown air, which is regulated
down to between 40 and 60 psig, is fed
from the main plant air system. According
to plant personnel, each Crown blow uses
280 to 340 cfm, with a total of nine for the
three production lines. There are also seven
atomizers for each Crown Blowing on Lines
1 and 2, using 45 to 70 cfm each at 25
to 45 psig.
The other main user is the raw material
transport system, which according to plant
personnel uses between 700 to 800 cfm for
up to six minutes for each transport session.
This system is regulated down to 45 psig from
the main plant air system. Plant personnel
are interested in separating the Crown blow
and the transport air system air off of the
main plant air system. For this report we will
identify the cost savings of running dedicated
low-pressure systems for these two identified
high use demands.
0 7 / 1 3 |
19 airbestpractices.com
SUSTAINABLE MANUFACTURING FEATURESSUSTAINABLE MANUFACTURING FEATURES
Establishing the Energy Baseline
Annual plant electric costs for compressed air
production, as operating today, are $878,628
per year. If the electric costs of $11,577
associated with operating ancillary equipment
such as dryers are included the total electric
costs for operating the air system are $890,205
per year. These estimates are based upon
a blended electric rate of $0.118 /kWh.
The system assessment focused on air-flow
reduction opportunities, installing a separate,
dedicated low-pressure air system to supply the
Crown Blowing air, and to supply the Bagger
from the main plant air system.
Air Flow Reduction Projects
The system assessment revealed air flow
reduction projects totaling 750 cfm. The
projects included replacing timer drains
with zero air-loss condensate drains (36 cfm),
replacing open blows with Venturi nozzles
(370 cfm), repairing identified air leaks
(106 cfm), and replacing heatless desiccant air
dryers with a refrigerated air dryer (247 cfm).
Due to article space constraints, we will only
show the detail on the Venturi nozzle project.
We replaced high pressure air blow offs with
Venturi nozzles as listed below. It’s a “best
practice” to use Venturi air amplifier nozzles
whenever and wherever possible — properly
selected and applied for needed thrust and
volume, this will usually reduce blow-off air
at least 50%, freeing up more air flow for
other more valuable applications.
Number of blow offs 98
Estimated high pressure air used currently
590 cfm
Estimated high pressure air used after installation of Venturi nozzles
220 cfm
Estimated compressed air savings with Venturi nozzles
370 cfm
Value of air reduction $215.18/cfm yr
Total electrical energy cost recovery by installing Venturi nozzles to reduce blow
$79,618/yr
Cost of nozzles and installation ($35 per nozzle plus $65 per installation)
$10,000
The Crown Blowing System
In this manufacturing operation, a significant
volume of 100 psi compressed air is being
regulated down to the 40 psi application of
the crown blowing system. This is a savings
opportunity. In general terms, let’s take a look
a what is the relative electrical energy cost
to produce 1,000 cfm of compressed air at
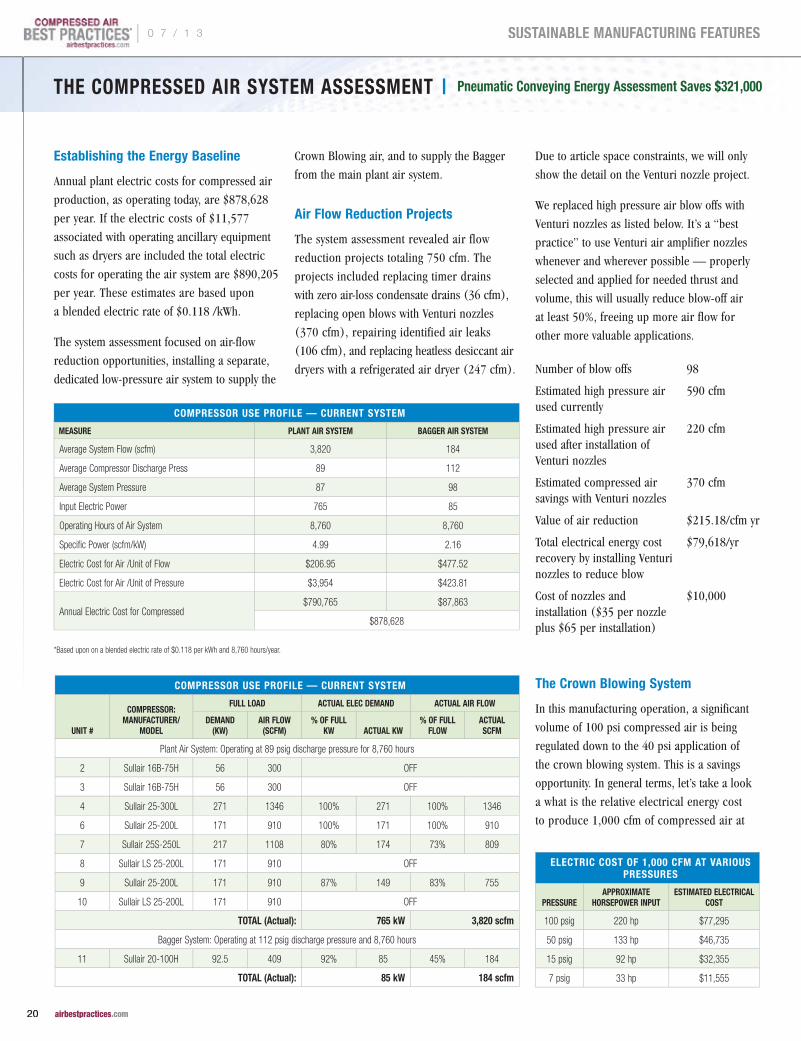
COMPRESSOR USE PROFILE — CURRENT SySTEM
MEASURE PLANT AIR SySTEM BAGGER AIR SySTEM
Average System Flow (scfm) 3,820 184
Average Compressor Discharge Press 89 112
Average System Pressure 87 98
Input Electric Power 765 85
Operating Hours of Air System 8,760 8,760
Specific Power (scfm/kW) 4.99 2.16
Electric Cost for Air /Unit of Flow $206.95 $477.52
Electric Cost for Air /Unit of Pressure $3,954 $423.81
Annual Electric Cost for Compressed$790,765 $87,863
$878,628
*Based upon on a blended electric rate of $0.118 per kWh and 8,760 hours/year.
COMPRESSOR USE PROFILE — CURRENT SySTEM
UNIT #
COMPRESSOR: MANUFACTURER/
MODEL
FULL LOAD ACTUAL ELEC DEMAND ACTUAL AIR FLOw
DEMAND (Kw)
AIR FLOw (SCFM)
% OF FULL Kw ACTUAL Kw
% OF FULL FLOw
ACTUAL SCFM
Plant Air System: Operating at 89 psig discharge pressure for 8,760 hours
2 Sullair 16B-75H 56 300 OFF
3 Sullair 16B-75H 56 300 OFF
4 Sullair 25-300L 271 1346 100% 271 100% 1346
6 Sullair 25-200L 171 910 100% 171 100% 910
7 Sullair 25S-250L 217 1108 80% 174 73% 809
8 Sullair LS 25-200L 171 910 OFF
9 Sullair 25-200L 171 910 87% 149 83% 755
10 Sullair LS 25-200L 171 910 OFF
TOTAL (Actual): 765 kw 3,820 scfm
Bagger System: Operating at 112 psig discharge pressure and 8,760 hours
11 Sullair 20-100H 92.5 409 92% 85 45% 184
TOTAL (Actual): 85 kw 184 scfm
ELECTRIC COST OF 1,000 CFM AT VARIOUS PRESSURES
PRESSUREAPPROxIMATE
HORSEPOwER INPUTESTIMATED ELECTRICAL
COST
100 psig 220 hp $77,295
50 psig 133 hp $46,735
15 psig 92 hp $32,355
7 psig 33 hp $11,555
THE COMPRESSED AIR SySTEM ASSESSMENT | Pneumatic Conveying Energy Assessment Saves $321,000
| 0 7 / 1 3
20 airbestpractices.com
SUSTAINABLE MANUFACTURING FEATURES
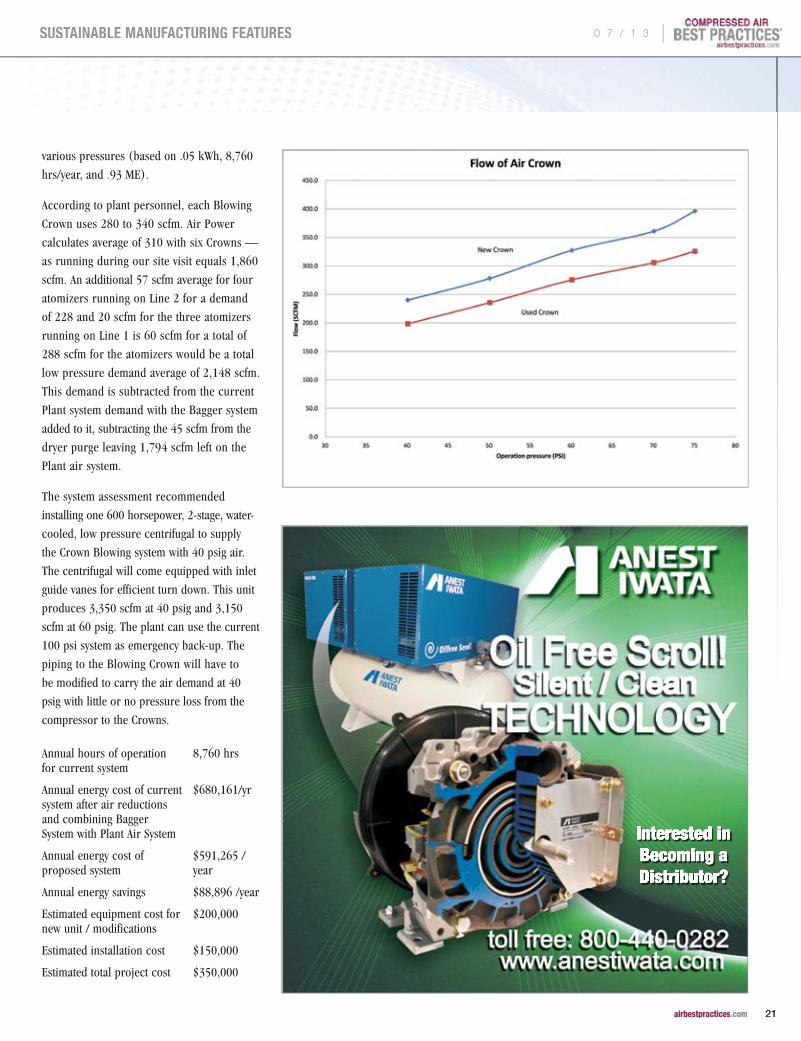
various pressures (based on .05 kWh, 8,760
hrs/year, and .93 ME).
According to plant personnel, each Blowing
Crown uses 280 to 340 scfm. Air Power
calculates average of 310 with six Crowns —
as running during our site visit equals 1,860
scfm. An additional 57 scfm average for four
atomizers running on Line 2 for a demand
of 228 and 20 scfm for the three atomizers
running on Line 1 is 60 scfm for a total of
288 scfm for the atomizers would be a total
low pressure demand average of 2,148 scfm.
This demand is subtracted from the current
Plant system demand with the Bagger system
added to it, subtracting the 45 scfm from the
dryer purge leaving 1,794 scfm left on the
Plant air system.
The system assessment recommended
installing one 600 horsepower, 2-stage, water-
cooled, low pressure centrifugal to supply
the Crown Blowing system with 40 psig air.
The centrifugal will come equipped with inlet
guide vanes for efficient turn down. This unit
produces 3,350 scfm at 40 psig and 3,150
scfm at 60 psig. The plant can use the current
100 psi system as emergency back-up. The
piping to the Blowing Crown will have to
be modified to carry the air demand at 40
psig with little or no pressure loss from the
compressor to the Crowns.
Annual hours of operation for current system
8,760 hrs
Annual energy cost of current system after air reductions and combining Bagger System with Plant Air System
$680,161/yr
Annual energy cost of proposed system
$591,265 /year
Annual energy savings $88,896 /year
Estimated equipment cost for new unit / modifications
$200,000
Estimated installation cost $150,000
Estimated total project cost $350,000
Interested in Becoming a Distributor?
THE COMPRESSED AIR SySTEM ASSESSMENT | Pneumatic Conveying Energy Assessment Saves $321,000
0 7 / 1 3 |
21 airbestpractices.com
SUSTAINABLE MANUFACTURING FEATURES
THE COMPRESSED AIR SySTEM ASSESSMENT | Pneumatic Conveying Energy Assessment Saves $321,000
Pneumatic Conveying Application
The current application is using the main
plant air system to provide the transport air
for the raw material. There are three different
transporters: mixed material to feed furnace,
glass powder and minor ingredient. According
to plant personnel the transport system
consumes between 700 to 800 scfm for around
six minutes for mixed material per transport
and operates approximately 60% of the time.
This equates to a 480 scfm average demand
on the system. The glass powder transport
operates two to three hours per day while the
minor ingredient operates the same time frame
as mixed material.
The configuration and transport demands are:
Worst Case product bulk density
1.20 MT/m3
Length of Run 150 feet
Number of Elbows 5 x 90° Elbows pocket elbow, short radius
Line Size 4" #80 Black Pipe
Convey Rate 400-600 lbs. per minute
COMPRESSOR USE PROFILE — PROPOSED SySTEM
UNIT #COMPRESSOR:
MANUFACTURER/MODEL
FULL LOAD ACTUAL ELEC DEMAND ACTUAL AIR FLOw
DEMAND (Kw)
AIR FLOw (SCFM)
% OF FULL Kw
ACTUAL Kw
% OF FULL FLOw
ACTUAL SCFM
Plant Air: Operating at 90 psig discharge pressure for 8,760 hours
2 Sullair 16B-75H 57 300 OFF
3 Sullair 16B-75H 57 300 OFF
4 Sullair 25-300L 274 1347 94% 258 81% 1,097
6 Sullair 25-200L 172 910 OFF
7 Sullair 25S-250L 219 1108 OFF
8 Sullair LS 25-200L 172 910 OFF
9 Sullair 25-200L 172 910 OFF
10 Sullair LS 25-200L 172 910 OFF
11 Sullair 20-100H 93 409 OFF
TOTAL (Actual): 258 kw 1,097 scfm
Low Pressure System Blowing Crown Air: Operating at 40 psig discharge pressure for 8,760 hours
1 600hp 2-Stage Centrifugal 408 3,350 77 314 64 2,148
TOTAL (Actual): 314 kw 2,148 scfm
1 Single Stage Oil Free 150hp 116 880 67 77 60 480
TOTAL (Actual): 46 kw 1,140 scfm
CURRENT SySTEM PROPOSED SySTEM
SySTEM COMPARISON PLANT AIR
SySTEM BAGGER AIR
SySTEM PLANT AIR wITH BAGGER SySTEM
NEw LOw PRESSURE 40 PSI SySTEM
DENSE PHASE TRANSPORT 50 PSI SySTEM
Average Flow (scfm) 3,820 184 617 2,148 480
Compressor Discharge Pressure (psig)
89 112 90 40 50
Average kW 765 85 155 322 77
Average System Pressure (psig)
87 98 90 40 45
Electric Cost per cfm $206.95 $472.55 $259.68 $154.95 $165.82
Electric Cost per psig $3,954 $423.81 $801.10 N/A N/A
VENTURI INDUCER NOzzLES IN PLACE OF OPEN BLOw
LOCATION QTy TyPE / SIzE ESTIMATED CURRENT
CFM USAGE UTILIzATION % NET AVG
CFM RECOMMEND VENTURI
NOzzLE NEw AVG NET
CFM EACH NET AVG CFM
USAGE EST NET AVG CFM SAVED
Bagger line Plenum * 1 8"x1" x10 nozzles 10@40psy 100% 100 40008SS 10@6=60 60 40
Bagger Tower 4 1/4" Copper 15 100% 60 Use existing blower –
repair ducting — — 60
Line 1 Drum Roller 1 8'x2"x20 nozzles 10@40psi 50% 100 40008SS 10@6=60 40 60
Line 1 Puffer Bar 1 8'x2"x20 nozzles 10@40psi 50% 100 40008SS 10@6=60 40 60
Line 2 Drum Roller 1 8'x2"x20 nozzles 10@40psi 50% 100 40008SS 10@6=60 40 60
Line 2 Puffer Bar 1 8'x2"x20 nozzles 10@40psi 50% 100 40008SS 10@6=60 40 60
Line 2 Convey 4 Silvent 9005W 15@40psi 50% 30 Remove — — 30
Total 98 nozzles 590 Proposed Usage 220 370
*Estimated could not see inside to view nozzles.
Note: there are several Guard Air Force 5 blow guns located in the plant. These blow guns use 185 cfm at 90 psig.
| 0 7 / 1 3
22 airbestpractices.com
SUSTAINABLE MANUFACTURING FEATURES
THE COMPRESSED AIR SySTEM ASSESSMENT | Pneumatic Conveying Energy Assessment Saves $321,000INNOVATION
n-psi.com
The transport system has a very detrimental
effect on the main plant air system, when it
operates it draws the plant system air pressure
to unacceptable levels. The plant air is regulated
down from plant pressure to 45 psig at the
transport system feed.
The system was set up for dense phase
transport and over the years has been
converted to dilute phase. On a typical dilute
phase system with the maximum pressure
being 15 psi, running at 14 psi doesn’t allow
any room to account for pressure spikes
or other possible upset conditions. Most
systems run at no higher than 12 psi, allowing
3 psi to account for the spikes and other
unforeseeable issues.
Ideally, it would be best to change the system
to a 6" line, and then the following could
be accomplished:
400 ppm in a 6” line = approximately 1135 cfm at 6.9 psi
500 ppm in a 6” line = approximately 1140 cfm at 8.2 psi
600 ppm in a 6” line = approximately 1150 cfm at 9.5 psi
We nevertheless recommend returning the
system back to Dense Phase with a dedicated
low pressure (50 psi) compressor to replace
the high-pressure plant air now being used.
We recommend installing a 150 horsepower
oil-free rotary screw compressor to provide
the 800 scfm peak flow to properly operate
the transport system
Conclusion
This system assessment case study is
interesting in that many plants use 100 psi
compressed air and regulate it down for
applications ranging in the 15 to 40 psi range.
Particularly plants deploying dilute or dense
phase transport systems need to take a good
look at the energy efficiency of their supply-
side compressed air system. This plant was
able to realize $321,000 in yearly energy
savings by identifying this opportunity.
For more information contact Don van Ormer, Air Power USA, tel: 740-862-4112, email: [email protected], www.airpowerusainc.com
PROJECTED ENERGy COST SAVINGS FOR PROPOSED SySTEM
AIR SySTEM COMPONENT
ANNUAL ELECTRIC COST OF CURRENT
SySTEM
ANNUAL ELECTRIC COST PROPOSED
SySTEM ANTICIPATED
ANNUAL SAVINGSESTIMATED
PROJECT COST
NET PROJECT COST AFTER
REBATES
Compressor System Operations
$878,628 $564,389 $314,239 $475,500
Potentially down to $375,500
Ancillary Air Equipment (dryers, etc.)
$11,577 $4,755 $6,822 $150,000
Total Compressed Air System
$890,205 $569,144 $321,061 $625,500
To read more To read more To read more To read more To read more To read more System AssessmentSystem AssessmentSystem AssessmentSystem AssessmentSystem AssessmentSystem Assessment articles, articles, articles, articles, articles, articles, System Assessment articles, System AssessmentSystem AssessmentSystem Assessment articles, System Assessment articles, System Assessment articles, System AssessmentSystem AssessmentSystem Assessment articles, System AssessmentSystem Assessment articles, System AssessmentSystem AssessmentSystem Assessment articles, System Assessment articles, System Assessment articles, System AssessmentSystem AssessmentSystem Assessment articles, System Assessmentvisit www.airbestpractices.com/system-visit www.airbestpractices.com/system-visit www.airbestpractices.com/system-
assessmentsassessmentsassessments
0 7 / 1 3 |
23 airbestpractices.com
SUSTAINABLE MANUFACTURING FEATURES
The Six Basic Types of Liquid Cooling SystemsBy Bruce williams, Regional Sales Manager, Hydrothrift Corporation
cpThere are six basic types of cooling systems that you can choose from
to meet the cooling needs of your load. Each one has its strengths and
weaknesses. This article was written to identify the different types of
cooling systems and identify their strengths and weaknesses so that you
can make an informed choice based on your needs.
There are six basic types of liquid cooling systems:
1. Liquid-to-liquid
2. Closed-loop dry system
3. Closed-loop dry system with trim cooling
4. Open-loop evaporative system
5. Closed-loop evaporative system
6. Chilled water system
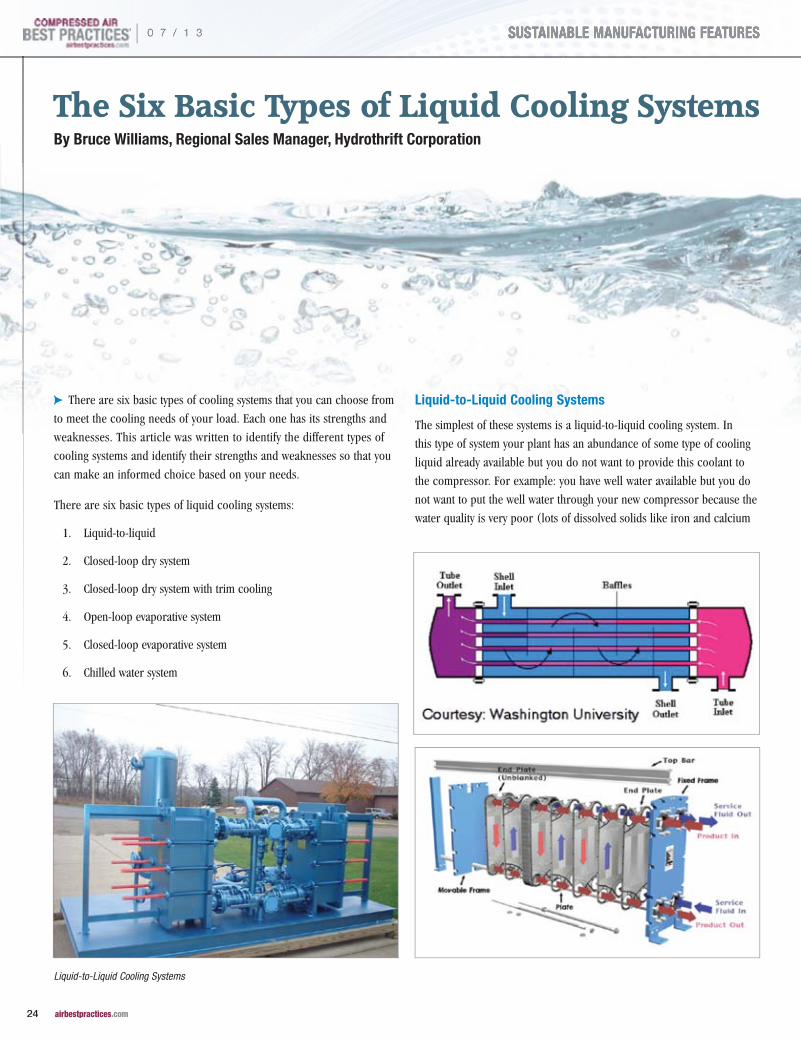
Liquid-to-Liquid Cooling Systems
The simplest of these systems is a liquid-to-liquid cooling system. In
this type of system your plant has an abundance of some type of cooling
liquid already available but you do not want to provide this coolant to
the compressor. For example: you have well water available but you do
not want to put the well water through your new compressor because the
water quality is very poor (lots of dissolved solids like iron and calcium
Liquid-to-Liquid Cooling Systems
| 0 7 / 1 3
24 airbestpractices.com
SUSTAINABLE MANUFACTURING FEATURESSUSTAINABLE MANUFACTURING FEATURES
etc.), and you have had trouble with the well
water fouling your heat exchanger/s in the past.
A liquid-to-liquid cooling system is an ideal
fit for this situation. It uses the well water
on one side of an intermediate heat exchanger
and a coolant such as glycol and water on the
other side of the intermediate heat exchanger
in a closed loop to cool the compressor. The
heat is exchanged through the intermediate
heat exchanger without fouling the heat
exchanger/s. Fouling of the intermediate heat
exchanger will likely happen on the well-
water side, however, if the intermediate heat
exchanger is selected properly it can be taken
apart easily and cleaned. The most common
intermediate heat exchangers are either plate
and frame or shell and tube type. Coolant
temperatures of 5 degrees above the plant
cooling “water” are possible with a liquid-to-
liquid type system. In the well water example
above if the well water is available at 55 ˚F
the liquid to liquid cooling system is capable
of supplying 60 ˚F coolant to the load.
The strength of a liquid-to-liquid cooling
system is that it is relatively inexpensive to
purchase and install. The components can
be installed inside or outside. The system is
inexpensive to operate with only the closed
loop pump using any additional energy.
Maintenance is relatively simple demanding
only a periodic inspection, lubrication, and
cleaning of the heat exchanger as necessary.
Weaknesses of the liquid-to-liquid cooling
system include periodic downtime of the
cooling system for cleaning. This can be
offset by installing a standby intermediate
heat exchanger that is put into service while
the primary intermediate heat exchanger
is cleaned. A standby heat exchanger adds
additional cost but allows for continuous
operation of the cooled load while cleaning is
accomplished. This system requires a regulated
supply of plant coolant like the well water
example above for proper cooling of the load.
There can be times that the cooled load does
not operate at maximum capacity and the plant
primary cooling “water” must be regulated
to insure the load is not over or under cooled.
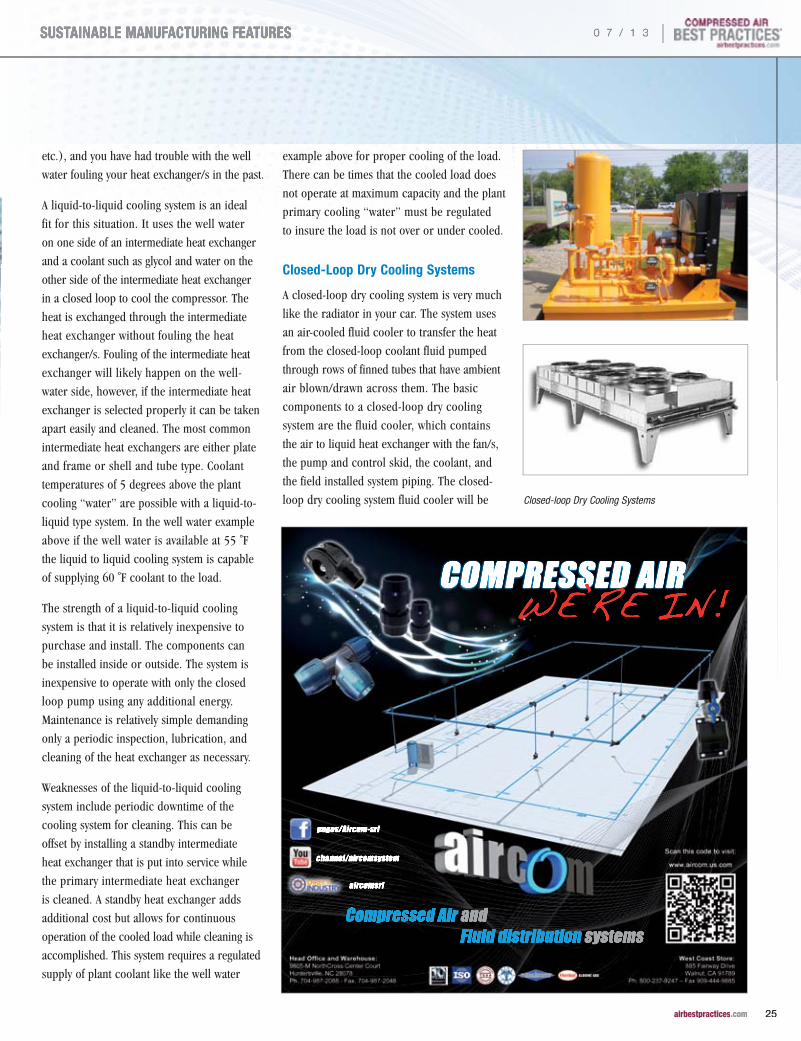
Closed-Loop Dry Cooling Systems
A closed-loop dry cooling system is very much
like the radiator in your car. The system uses
an air-cooled fluid cooler to transfer the heat
from the closed-loop coolant fluid pumped
through rows of finned tubes that have ambient
air blown/drawn across them. The basic
components to a closed-loop dry cooling
system are the fluid cooler, which contains
the air to liquid heat exchanger with the fan/s,
the pump and control skid, the coolant, and
the field installed system piping. The closed-
loop dry cooling system fluid cooler will be
WE’RE IN!
Closed-loop Dry Cooling Systems
0 7 / 1 3 |
25 airbestpractices.com
SUSTAINABLE MANUFACTURING FEATURESSUSTAINABLE MANUFACTURING FEATURES
located outside and use the ambient air to
reject the heat. Coolant temperatures of 5 to
10 ˚F above the ambient dry bulb temperature
are possible with a closed-loop dry cooling
system. The system is relatively inexpensive
to operate with only the coolant pump and
the fluid cooler fan/s using energy. The fan/s
are thermostatically controlled to regulate the
temperature of the cooling fluid so that the
load is not over or under-cooled. Periodic
cleaning of the fluid cooler may be necessary
due to dirty atmospheric conditions at the site
location. Fouling of the fluid cooler is typically
caused by dirt, leaves, cotton-wood seeds, etc.
The strength of a closed-loop dry cooling
system is that the unit is very simple
and relatively easy to install. The energy
requirements are relatively low and it is easily
controlled. Maintenance is normally low
requiring only periodic inspection, lubrication,
and testing of the fluid.
The weakness of a closed-loop dry cooling
system is that it is dependent on the
atmospheric dry bulb. For example, if your
location’s design dry bulb is 100 ˚F in the
summer and your equipment requires 90 ˚F
coolant; at best the system can only supply
around 105 to 110 ˚F coolant to the load. In
this case you would need supplemental cooling
to get the coolant temperatures down to 90 ˚F.
The closed-loop dry cooling system also
requires free clear air to work efficiently.
This means that the fluid cooler must be
placed in a location that is not affected by the
prevailing winds, not too close to a building
that will allow the warm exhaust air from the
fluid cooler to be recirculated back to the
fluid cooler, and finally not in a location that
has heavy concentrations of dust, dirt, leaves,
seeds, etc.
Many times the best location for the fluid
cooler is on the roof. Since the fluid cooler
is located outside the coolant must also have
a concentration of some type of glycol to
prevent freezing if your location has a design
dry bulb in the winter that dips below freezing.
If the location is very cold, the concentration
of glycol may need to be significant to prevent
freezing. Glycol concentrations as they increase
begin to reduce the rate of heat transfer. For
example, if you need 50% ethylene glycol
concentration with water the heat exchanger
equipment and the flow/pressure of the coolant
will need to increase to adjust for the glycol
F R E E S U B S C R I P T I O NDIGITAL EDITION FREE wORLDwIDE | PRINT EDITION FREE TO U.S. SUBSCRIBERS
Subscribe at airbestpractices.com
THE SIx BASIC TyPES OF LIQUID COOLING SySTEMS
| 0 7 / 1 3
26 airbestpractices.com
SUSTAINABLE MANUFACTURING FEATURES
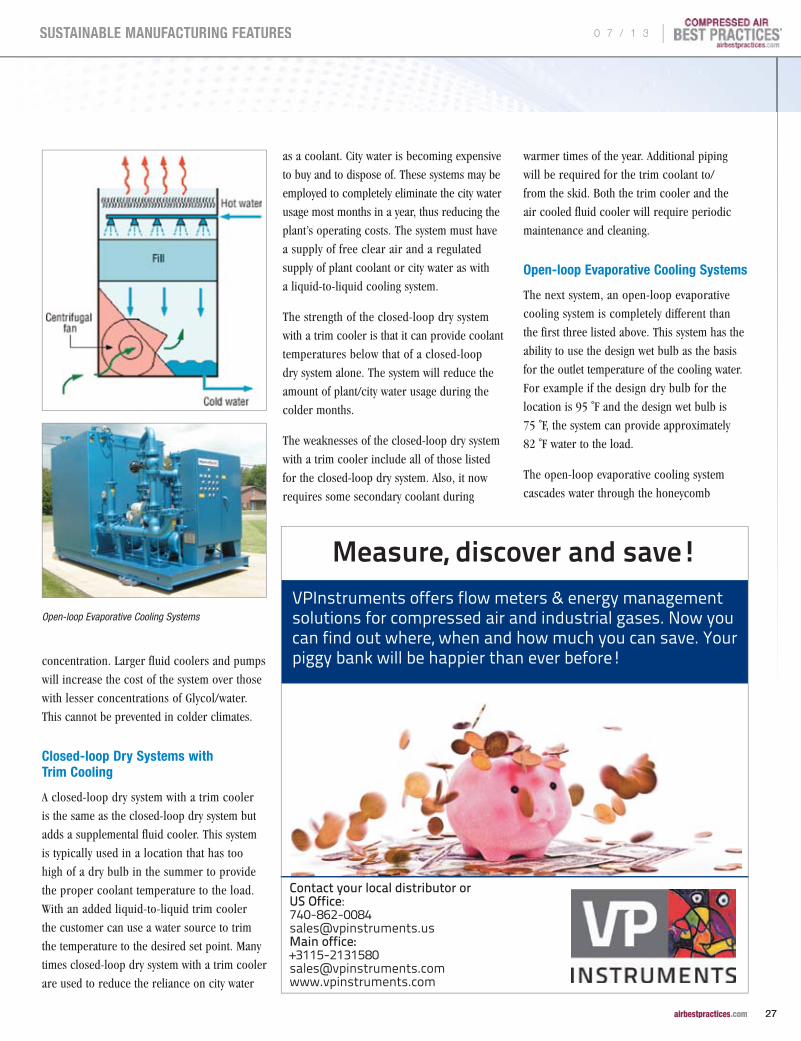
concentration. Larger fluid coolers and pumps
will increase the cost of the system over those
with lesser concentrations of Glycol/water.
This cannot be prevented in colder climates.
Closed-loop Dry Systems with Trim Cooling
A closed-loop dry system with a trim cooler
is the same as the closed-loop dry system but
adds a supplemental fluid cooler. This system
is typically used in a location that has too
high of a dry bulb in the summer to provide
the proper coolant temperature to the load.
With an added liquid-to-liquid trim cooler
the customer can use a water source to trim
the temperature to the desired set point. Many
times closed-loop dry system with a trim cooler
are used to reduce the reliance on city water
as a coolant. City water is becoming expensive
to buy and to dispose of. These systems may be
employed to completely eliminate the city water
usage most months in a year, thus reducing the
plant’s operating costs. The system must have
a supply of free clear air and a regulated
supply of plant coolant or city water as with
a liquid-to-liquid cooling system.
The strength of the closed-loop dry system
with a trim cooler is that it can provide coolant
temperatures below that of a closed-loop
dry system alone. The system will reduce the
amount of plant/city water usage during the
colder months.
The weaknesses of the closed-loop dry system
with a trim cooler include all of those listed
for the closed-loop dry system. Also, it now
requires some secondary coolant during
warmer times of the year. Additional piping
will be required for the trim coolant to/
from the skid. Both the trim cooler and the
air cooled fluid cooler will require periodic
maintenance and cleaning.
Open-loop Evaporative Cooling Systems
The next system, an open-loop evaporative
cooling system is completely different than
the first three listed above. This system has the
ability to use the design wet bulb as the basis
for the outlet temperature of the cooling water.
For example if the design dry bulb for the
location is 95 ˚F and the design wet bulb is
75 ˚F, the system can provide approximately
82 ˚F water to the load.
The open-loop evaporative cooling system
cascades water through the honeycomb
Open-loop Evaporative Cooling Systems
THE SIx BASIC TyPES OF LIQUID COOLING SySTEMS
0 7 / 1 3 |
27 airbestpractices.com
SUSTAINABLE MANUFACTURING FEATURES
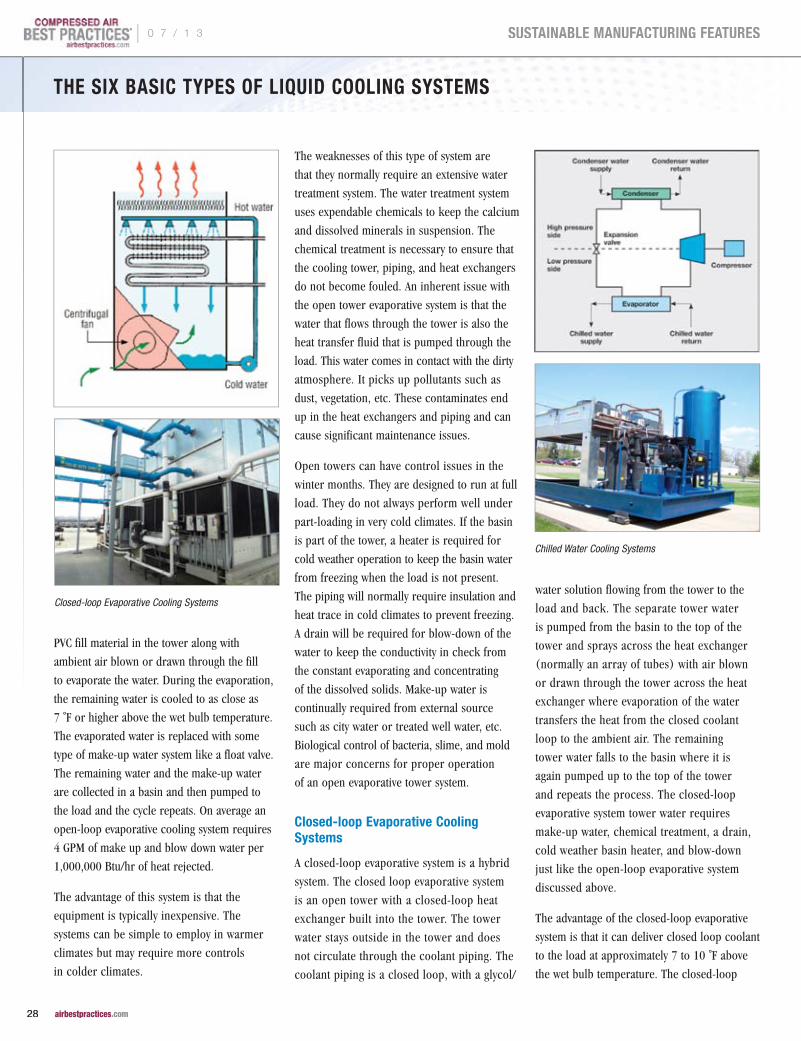
PVC fill material in the tower along with
ambient air blown or drawn through the fill
to evaporate the water. During the evaporation,
the remaining water is cooled to as close as
7 ˚F or higher above the wet bulb temperature.
The evaporated water is replaced with some
type of make-up water system like a float valve.
The remaining water and the make-up water
are collected in a basin and then pumped to
the load and the cycle repeats. On average an
open-loop evaporative cooling system requires
4 GPM of make up and blow down water per
1,000,000 Btu/hr of heat rejected.
The advantage of this system is that the
equipment is typically inexpensive. The
systems can be simple to employ in warmer
climates but may require more controls
in colder climates.
The weaknesses of this type of system are
that they normally require an extensive water
treatment system. The water treatment system
uses expendable chemicals to keep the calcium
and dissolved minerals in suspension. The
chemical treatment is necessary to ensure that
the cooling tower, piping, and heat exchangers
do not become fouled. An inherent issue with
the open tower evaporative system is that the
water that flows through the tower is also the
heat transfer fluid that is pumped through the
load. This water comes in contact with the dirty
atmosphere. It picks up pollutants such as
dust, vegetation, etc. These contaminates end
up in the heat exchangers and piping and can
cause significant maintenance issues.
Open towers can have control issues in the
winter months. They are designed to run at full
load. They do not always perform well under
part-loading in very cold climates. If the basin
is part of the tower, a heater is required for
cold weather operation to keep the basin water
from freezing when the load is not present.
The piping will normally require insulation and
heat trace in cold climates to prevent freezing.
A drain will be required for blow-down of the
water to keep the conductivity in check from
the constant evaporating and concentrating
of the dissolved solids. Make-up water is
continually required from external source
such as city water or treated well water, etc.
Biological control of bacteria, slime, and mold
are major concerns for proper operation
of an open evaporative tower system.
Closed-loop Evaporative Cooling Systems
A closed-loop evaporative system is a hybrid
system. The closed loop evaporative system
is an open tower with a closed-loop heat
exchanger built into the tower. The tower
water stays outside in the tower and does
not circulate through the coolant piping. The
coolant piping is a closed loop, with a glycol/
water solution flowing from the tower to the
load and back. The separate tower water
is pumped from the basin to the top of the
tower and sprays across the heat exchanger
(normally an array of tubes) with air blown
or drawn through the tower across the heat
exchanger where evaporation of the water
transfers the heat from the closed coolant
loop to the ambient air. The remaining
tower water falls to the basin where it is
again pumped up to the top of the tower
and repeats the process. The closed-loop
evaporative system tower water requires
make-up water, chemical treatment, a drain,
cold weather basin heater, and blow-down
just like the open-loop evaporative system
discussed above.
The advantage of the closed-loop evaporative
system is that it can deliver closed loop coolant
to the load at approximately 7 to 10 ˚F above
the wet bulb temperature. The closed-loop
Closed-loop Evaporative Cooling Systems
Chilled Water Cooling Systems
THE SIx BASIC TyPES OF LIQUID COOLING SySTEMS
| 0 7 / 1 3
28 airbestpractices.com
SUSTAINABLE MANUFACTURING FEATURES
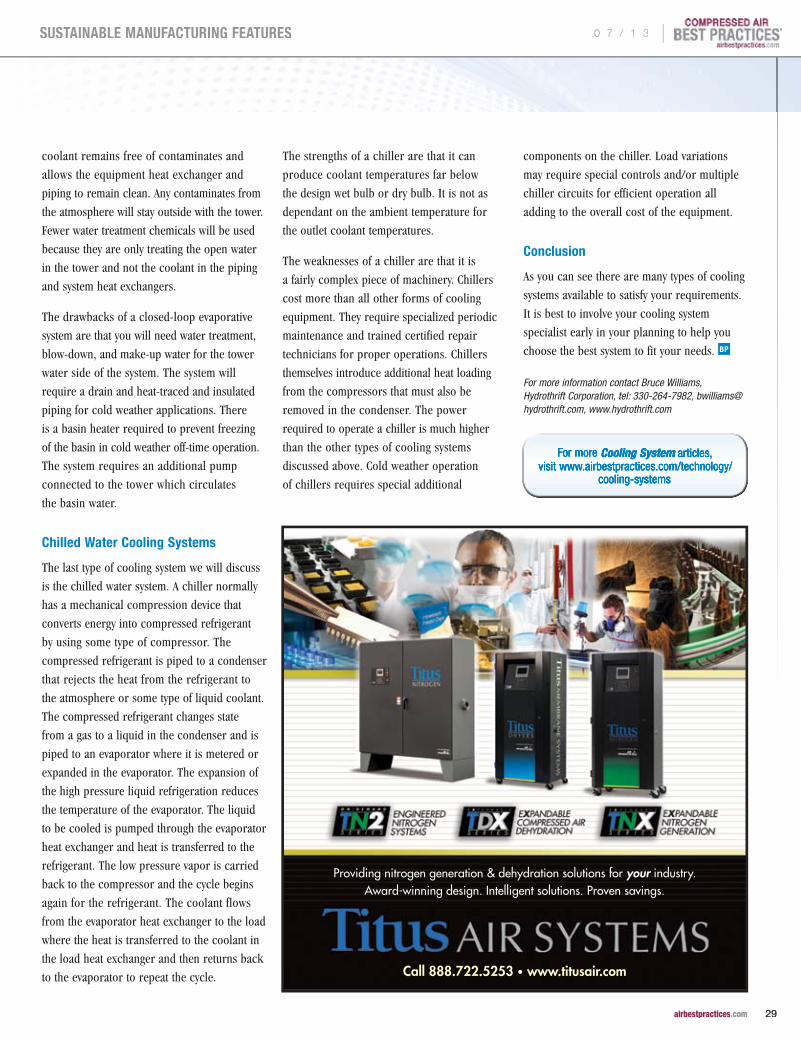
coolant remains free of contaminates and
allows the equipment heat exchanger and
piping to remain clean. Any contaminates from
the atmosphere will stay outside with the tower.
Fewer water treatment chemicals will be used
because they are only treating the open water
in the tower and not the coolant in the piping
and system heat exchangers.
The drawbacks of a closed-loop evaporative
system are that you will need water treatment,
blow-down, and make-up water for the tower
water side of the system. The system will
require a drain and heat-traced and insulated
piping for cold weather applications. There
is a basin heater required to prevent freezing
of the basin in cold weather off-time operation.
The system requires an additional pump
connected to the tower which circulates
the basin water.
Chilled water Cooling Systems
The last type of cooling system we will discuss
is the chilled water system. A chiller normally
has a mechanical compression device that
converts energy into compressed refrigerant
by using some type of compressor. The
compressed refrigerant is piped to a condenser
that rejects the heat from the refrigerant to
the atmosphere or some type of liquid coolant.
The compressed refrigerant changes state
from a gas to a liquid in the condenser and is
piped to an evaporator where it is metered or
expanded in the evaporator. The expansion of
the high pressure liquid refrigeration reduces
the temperature of the evaporator. The liquid
to be cooled is pumped through the evaporator
heat exchanger and heat is transferred to the
refrigerant. The low pressure vapor is carried
back to the compressor and the cycle begins
again for the refrigerant. The coolant flows
from the evaporator heat exchanger to the load
where the heat is transferred to the coolant in
the load heat exchanger and then returns back
to the evaporator to repeat the cycle.
The strengths of a chiller are that it can
produce coolant temperatures far below
the design wet bulb or dry bulb. It is not as
dependant on the ambient temperature for
the outlet coolant temperatures.
The weaknesses of a chiller are that it is
a fairly complex piece of machinery. Chillers
cost more than all other forms of cooling
equipment. They require specialized periodic
maintenance and trained certified repair
technicians for proper operations. Chillers
themselves introduce additional heat loading
from the compressors that must also be
removed in the condenser. The power
required to operate a chiller is much higher
than the other types of cooling systems
discussed above. Cold weather operation
of chillers requires special additional
components on the chiller. Load variations
may require special controls and/or multiple
chiller circuits for efficient operation all
adding to the overall cost of the equipment.
Conclusion
As you can see there are many types of cooling
systems available to satisfy your requirements.
It is best to involve your cooling system
specialist early in your planning to help you
choose the best system to fit your needs.
For more information contact Bruce Williams, Hydrothrift Corporation, tel: 330-264-7982, [email protected], www.hydrothrift.com
For more For more For more Cooling SystemCooling SystemCooling System articles, articles, articles, Cooling System articles, Cooling SystemCooling SystemCooling System articles, Cooling System articles, Cooling System articles, Cooling SystemCooling SystemCooling System articles, Cooling Systemvisit www.airbestpractices.com/technology/visit www.airbestpractices.com/technology/visit www.airbestpractices.com/technology/
cooling-systemscooling-systemscooling-systems
Providing nitrogen generation & dehydration solutions for your industry. Award-winning design. Intelligent solutions. Proven savings.
Call 888.722.5253 • www.titusair.com
THE SIx BASIC TyPES OF LIQUID COOLING SySTEMS
0 7 / 1 3 |
29 airbestpractices.com
SUSTAINABLE MANUFACTURING FEATURES
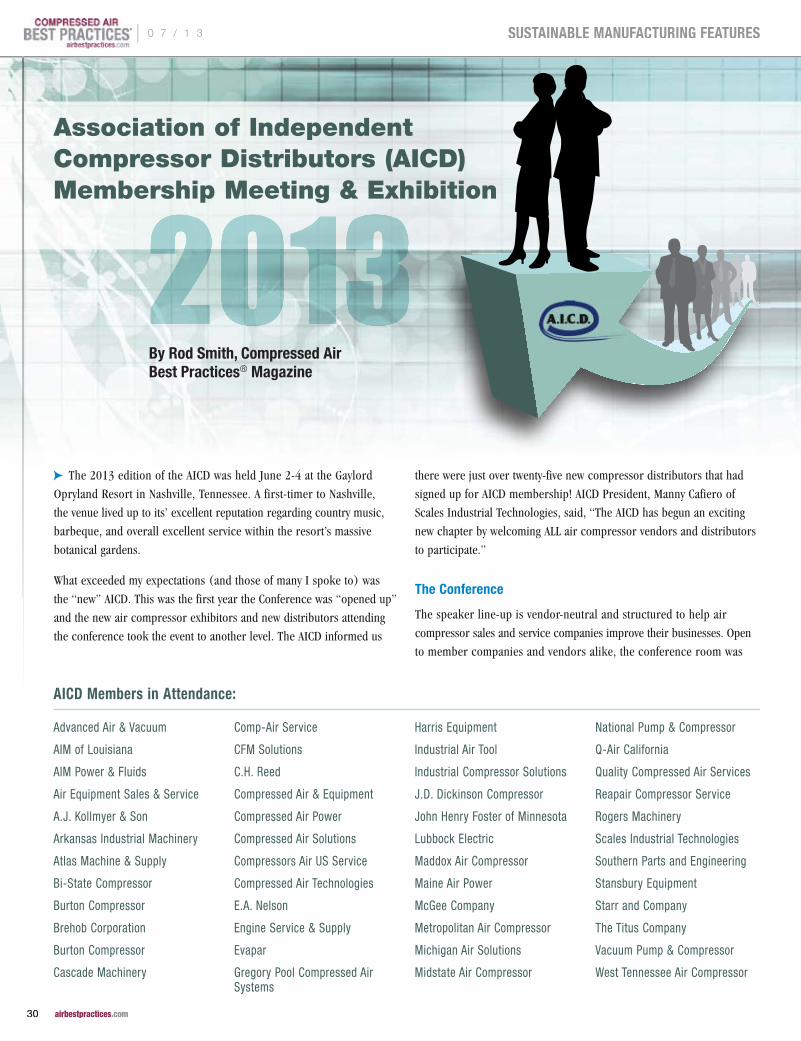
20132013Association of Independent Compressor Distributors (AICD) Membership Meeting & Exhibition
cpThe 2013 edition of the AICD was held June 2-4 at the Gaylord
Opryland Resort in Nashville, Tennessee. A first-timer to Nashville,
the venue lived up to its’ excellent reputation regarding country music,
barbeque, and overall excellent service within the resort’s massive
botanical gardens.
What exceeded my expectations (and those of many I spoke to) was
the “new” AICD. This was the first year the Conference was “opened up”
and the new air compressor exhibitors and new distributors attending
the conference took the event to another level. The AICD informed us
there were just over twenty-five new compressor distributors that had
signed up for AICD membership! AICD President, Manny Cafiero of
Scales Industrial Technologies, said, “The AICD has begun an exciting
new chapter by welcoming ALL air compressor vendors and distributors
to participate.”
The Conference
The speaker line-up is vendor-neutral and structured to help air
compressor sales and service companies improve their businesses. Open
to member companies and vendors alike, the conference room was
By Rod Smith, Compressed Air Best Practices® Magazine
AICD Members in Attendance:
Advanced Air & Vacuum
AIM of Louisiana
AIM Power & Fluids
Air Equipment Sales & Service
A.J. Kollmyer & Son
Arkansas Industrial Machinery
Atlas Machine & Supply
Bi-State Compressor
Burton Compressor
Brehob Corporation
Burton Compressor
Cascade Machinery
Comp-Air Service
CFM Solutions
C.H. Reed
Compressed Air & Equipment
Compressed Air Power
Compressed Air Solutions
Compressors Air US Service
Compressed Air Technologies
E.A. Nelson
Engine Service & Supply
Evapar
Gregory Pool Compressed Air Systems
Harris Equipment
Industrial Air Tool
Industrial Compressor Solutions
J.D. Dickinson Compressor
John Henry Foster of Minnesota
Lubbock Electric
Maddox Air Compressor
Maine Air Power
McGee Company
Metropolitan Air Compressor
Michigan Air Solutions
Midstate Air Compressor
National Pump & Compressor
Q-Air California
Quality Compressed Air Services
Reapair Compressor Service
Rogers Machinery
Scales Industrial Technologies
Southern Parts and Engineering
Stansbury Equipment
Starr and Company
The Titus Company
Vacuum Pump & Compressor
West Tennessee Air Compressor
| 0 7 / 1 3
30 airbestpractices.com
SUSTAINABLE MANUFACTURING FEATURES
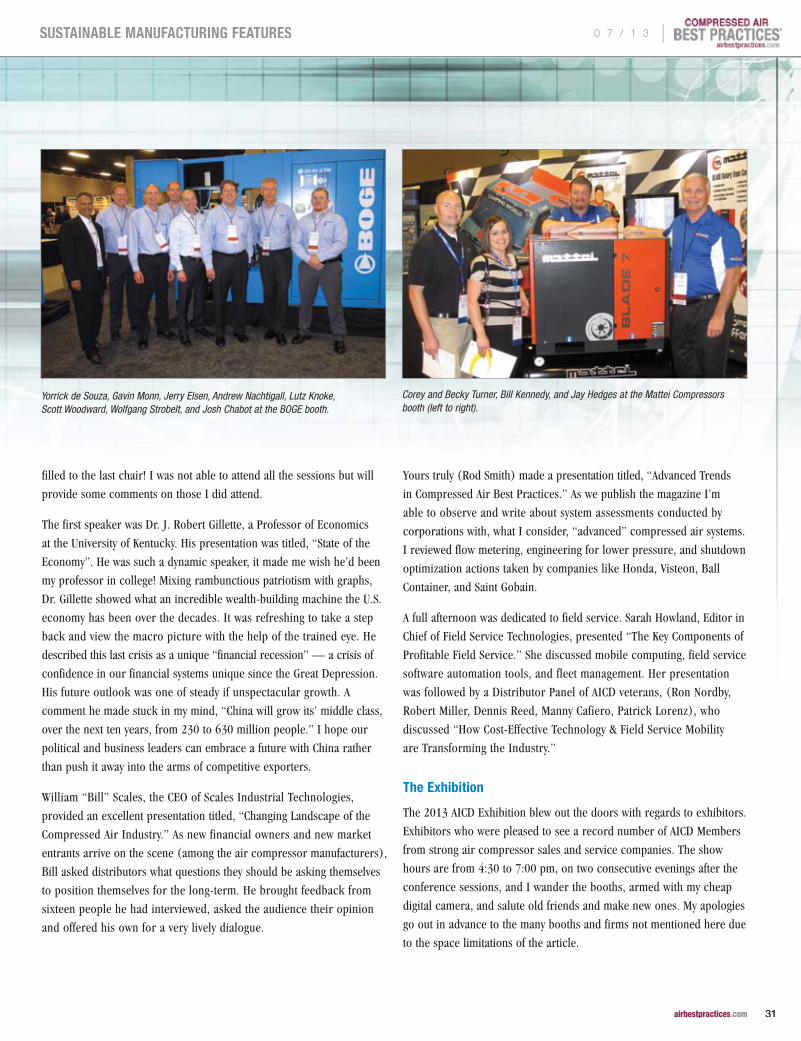
filled to the last chair! I was not able to attend all the sessions but will
provide some comments on those I did attend.
The first speaker was Dr. J. Robert Gillette, a Professor of Economics
at the University of Kentucky. His presentation was titled, “State of the
Economy”. He was such a dynamic speaker, it made me wish he’d been
my professor in college! Mixing rambunctious patriotism with graphs,
Dr. Gillette showed what an incredible wealth-building machine the U.S.
economy has been over the decades. It was refreshing to take a step
back and view the macro picture with the help of the trained eye. He
described this last crisis as a unique “financial recession” — a crisis of
confidence in our financial systems unique since the Great Depression.
His future outlook was one of steady if unspectacular growth. A
comment he made stuck in my mind, “China will grow its’ middle class,
over the next ten years, from 230 to 630 million people.” I hope our
political and business leaders can embrace a future with China rather
than push it away into the arms of competitive exporters.
William “Bill” Scales, the CEO of Scales Industrial Technologies,
provided an excellent presentation titled, “Changing Landscape of the
Compressed Air Industry.” As new financial owners and new market
entrants arrive on the scene (among the air compressor manufacturers),
Bill asked distributors what questions they should be asking themselves
to position themselves for the long-term. He brought feedback from
sixteen people he had interviewed, asked the audience their opinion
and offered his own for a very lively dialogue.
Yours truly (Rod Smith) made a presentation titled, “Advanced Trends
in Compressed Air Best Practices.” As we publish the magazine I’m
able to observe and write about system assessments conducted by
corporations with, what I consider, “advanced” compressed air systems.
I reviewed flow metering, engineering for lower pressure, and shutdown
optimization actions taken by companies like Honda, Visteon, Ball
Container, and Saint Gobain.
A full afternoon was dedicated to field service. Sarah Howland, Editor in
Chief of Field Service Technologies, presented “The Key Components of
Profitable Field Service.” She discussed mobile computing, field service
software automation tools, and fleet management. Her presentation
was followed by a Distributor Panel of AICD veterans, (Ron Nordby,
Robert Miller, Dennis Reed, Manny Cafiero, Patrick Lorenz), who
discussed “How Cost-Effective Technology & Field Service Mobility
are Transforming the Industry.”
The Exhibition
The 2013 AICD Exhibition blew out the doors with regards to exhibitors.
Exhibitors who were pleased to see a record number of AICD Members
from strong air compressor sales and service companies. The show
hours are from 4:30 to 7:00 pm, on two consecutive evenings after the
conference sessions, and I wander the booths, armed with my cheap
digital camera, and salute old friends and make new ones. My apologies
go out in advance to the many booths and firms not mentioned here due
to the space limitations of the article.
Yorrick de Souza, Gavin Monn, Jerry Elsen, Andrew Nachtigall, Lutz Knoke, Scott Woodward, Wolfgang Strobelt, and Josh Chabot at the BOGE booth.
Corey and Becky Turner, Bill Kennedy, and Jay Hedges at the Mattei Compressors booth (left to right).
0 7 / 1 3 |
31 airbestpractices.com
SUSTAINABLE MANUFACTURING FEATURES
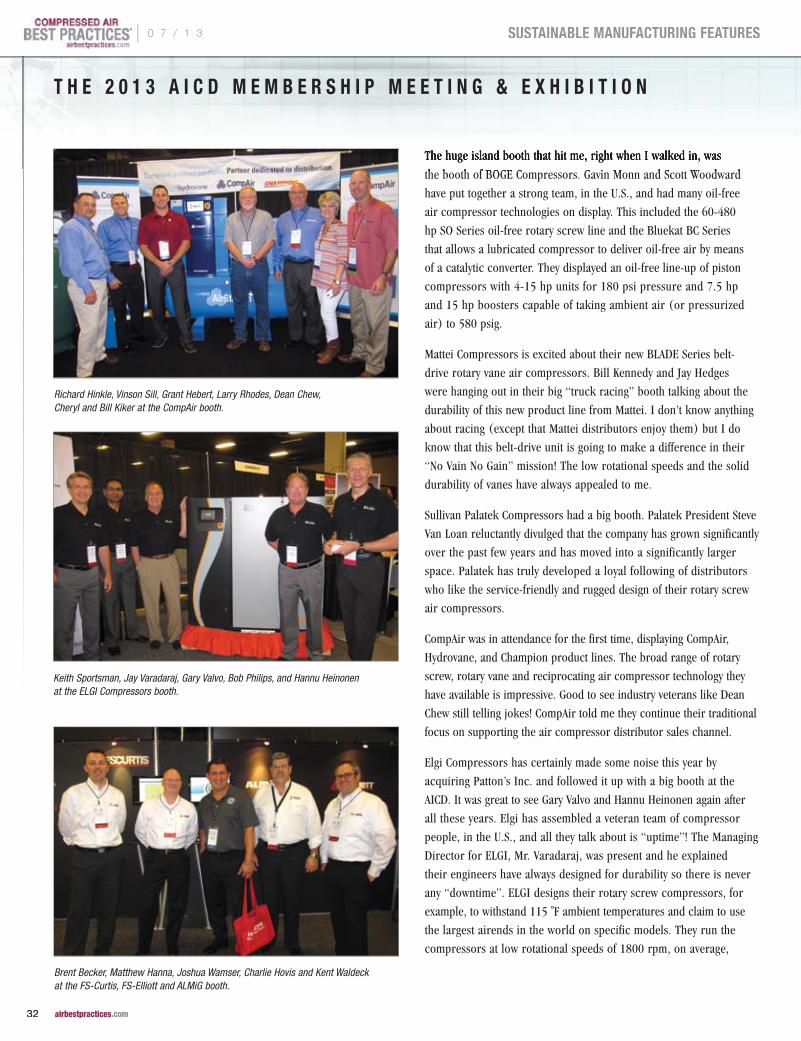
The huge island booth that hit me, right when I walked in, was
the booth of BOGE Compressors. Gavin Monn and Scott Woodward
have put together a strong team, in the U.S., and had many oil-free
air compressor technologies on display. This included the 60-480
hp SO Series oil-free rotary screw line and the Bluekat BC Series
that allows a lubricated compressor to deliver oil-free air by means
of a catalytic converter. They displayed an oil-free line-up of piston
compressors with 4-15 hp units for 180 psi pressure and 7.5 hp
and 15 hp boosters capable of taking ambient air (or pressurized
air) to 580 psig.
Mattei Compressors is excited about their new BLADE Series belt-
drive rotary vane air compressors. Bill Kennedy and Jay Hedges
were hanging out in their big “truck racing” booth talking about the
durability of this new product line from Mattei. I don’t know anything
about racing (except that Mattei distributors enjoy them) but I do
know that this belt-drive unit is going to make a difference in their
“No Vain No Gain” mission! The low rotational speeds and the solid
durability of vanes have always appealed to me.
Sullivan Palatek Compressors had a big booth. Palatek President Steve
Van Loan reluctantly divulged that the company has grown significantly
over the past few years and has moved into a significantly larger
space. Palatek has truly developed a loyal following of distributors
who like the service-friendly and rugged design of their rotary screw
air compressors.
CompAir was in attendance for the first time, displaying CompAir,
Hydrovane, and Champion product lines. The broad range of rotary
screw, rotary vane and reciprocating air compressor technology they
have available is impressive. Good to see industry veterans like Dean
Chew still telling jokes! CompAir told me they continue their traditional
focus on supporting the air compressor distributor sales channel.
Elgi Compressors has certainly made some noise this year by
acquiring Patton’s Inc. and followed it up with a big booth at the
AICD. It was great to see Gary Valvo and Hannu Heinonen again after
all these years. Elgi has assembled a veteran team of compressor
people, in the U.S., and all they talk about is “uptime”! The Managing
Director for ELGI, Mr. Varadaraj, was present and he explained
their engineers have always designed for durability so there is never
any “downtime”. ELGI designs their rotary screw compressors, for
example, to withstand 115 ˚F ambient temperatures and claim to use
the largest airends in the world on specific models. They run the
compressors at low rotational speeds of 1800 rpm, on average,
The huge island booth that hit me, right when I walked in, was
the booth of BOGE Compressors. Gavin Monn and Scott Woodward
T H E 2 0 1 3 A I C D M E M B E R S H I P M E E T I N G & E x H I B I T I O N
Brent Becker, Matthew Hanna, Joshua Wamser, Charlie Hovis and Kent Waldeck at the FS-Curtis, FS-Elliott and ALMiG booth.
Keith Sportsman, Jay Varadaraj, Gary Valvo, Bob Philips, and Hannu Heinonen at the ELGI Compressors booth.
Richard Hinkle, Vinson Sill, Grant Hebert, Larry Rhodes, Dean Chew, Cheryl and Bill Kiker at the CompAir booth.
| 0 7 / 1 3
32 airbestpractices.com
SUSTAINABLE MANUFACTURING FEATURES
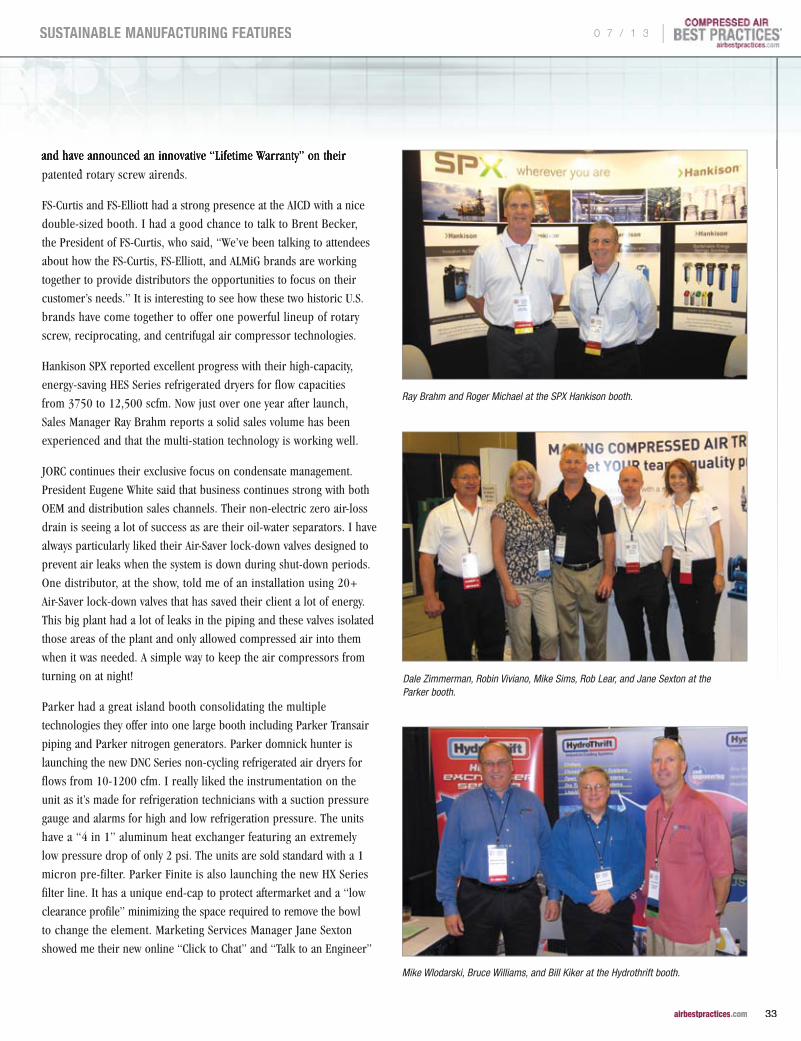
and have announced an innovative “Lifetime Warranty” on their
patented rotary screw airends.
FS-Curtis and FS-Elliott had a strong presence at the AICD with a nice
double-sized booth. I had a good chance to talk to Brent Becker,
the President of FS-Curtis, who said, “We’ve been talking to attendees
about how the FS-Curtis, FS-Elliott, and ALMiG brands are working
together to provide distributors the opportunities to focus on their
customer’s needs.” It is interesting to see how these two historic U.S.
brands have come together to offer one powerful lineup of rotary
screw, reciprocating, and centrifugal air compressor technologies.
Hankison SPX reported excellent progress with their high-capacity,
energy-saving HES Series refrigerated dryers for flow capacities
from 3750 to 12,500 scfm. Now just over one year after launch,
Sales Manager Ray Brahm reports a solid sales volume has been
experienced and that the multi-station technology is working well.
JORC continues their exclusive focus on condensate management.
President Eugene White said that business continues strong with both
OEM and distribution sales channels. Their non-electric zero air-loss
drain is seeing a lot of success as are their oil-water separators. I have
always particularly liked their Air-Saver lock-down valves designed to
prevent air leaks when the system is down during shut-down periods.
One distributor, at the show, told me of an installation using 20+
Air-Saver lock-down valves that has saved their client a lot of energy.
This big plant had a lot of leaks in the piping and these valves isolated
those areas of the plant and only allowed compressed air into them
when it was needed. A simple way to keep the air compressors from
turning on at night!
Parker had a great island booth consolidating the multiple
technologies they offer into one large booth including Parker Transair
piping and Parker nitrogen generators. Parker domnick hunter is
launching the new DNC Series non-cycling refrigerated air dryers for
flows from 10-1200 cfm. I really liked the instrumentation on the
unit as it’s made for refrigeration technicians with a suction pressure
gauge and alarms for high and low refrigeration pressure. The units
have a “4 in 1” aluminum heat exchanger featuring an extremely
low pressure drop of only 2 psi. The units are sold standard with a 1
micron pre-filter. Parker Finite is also launching the new HX Series
filter line. It has a unique end-cap to protect aftermarket and a “low
clearance profile” minimizing the space required to remove the bowl
to change the element. Marketing Services Manager Jane Sexton
showed me their new online “Click to Chat” and “Talk to an Engineer”
Dale Zimmerman, Robin Viviano, Mike Sims, Rob Lear, and Jane Sexton at the Parker booth.
Mike Wlodarski, Bruce Williams, and Bill Kiker at the Hydrothrift booth.
and have announced an innovative “Lifetime Warranty” on their
patented rotary screw airends.
Ray Brahm and Roger Michael at the SPX Hankison booth.
0 7 / 1 3 |
33 airbestpractices.com
SUSTAINABLE MANUFACTURING FEATURES
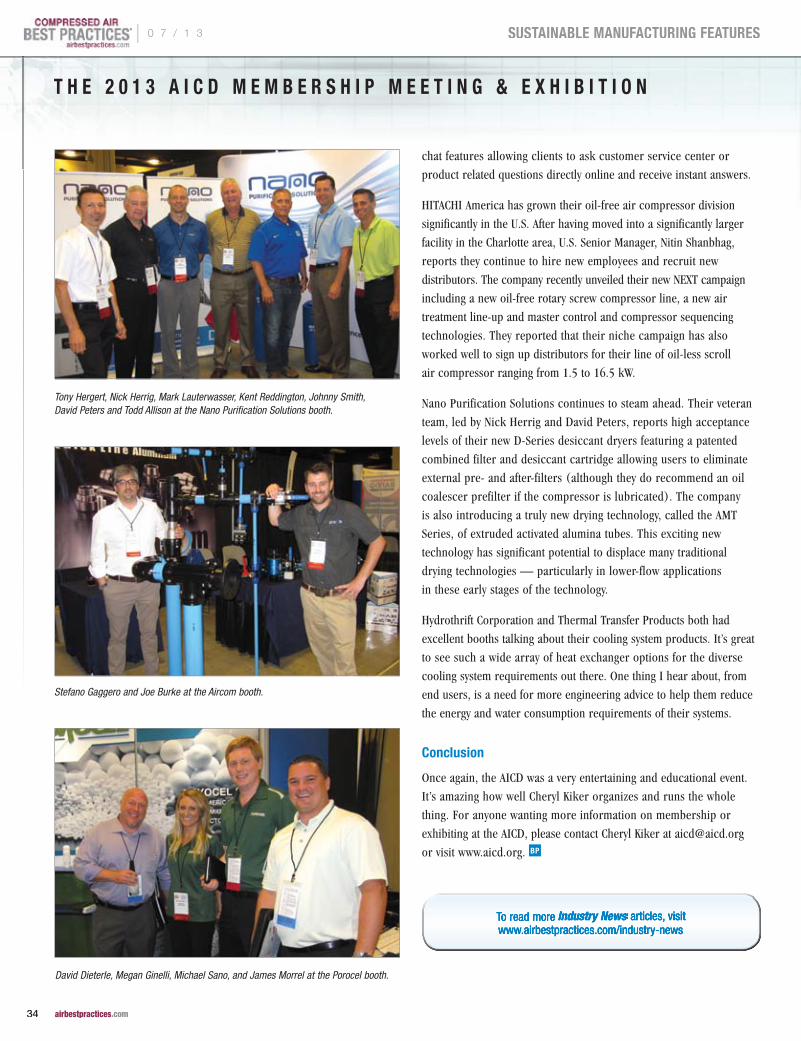
T H E 2 0 1 3 A I C D M E M B E R S H I P M E E T I N G & E x H I B I T I O N
chat features allowing clients to ask customer service center or
product related questions directly online and receive instant answers.
HITACHI America has grown their oil-free air compressor division
significantly in the U.S. After having moved into a significantly larger
facility in the Charlotte area, U.S. Senior Manager, Nitin Shanbhag,
reports they continue to hire new employees and recruit new
distributors. The company recently unveiled their new NEXT campaign
including a new oil-free rotary screw compressor line, a new air
treatment line-up and master control and compressor sequencing
technologies. They reported that their niche campaign has also
worked well to sign up distributors for their line of oil-less scroll
air compressor ranging from 1.5 to 16.5 kW.
Nano Purification Solutions continues to steam ahead. Their veteran
team, led by Nick Herrig and David Peters, reports high acceptance
levels of their new D-Series desiccant dryers featuring a patented
combined filter and desiccant cartridge allowing users to eliminate
external pre- and after-filters (although they do recommend an oil
coalescer prefilter if the compressor is lubricated). The company
is also introducing a truly new drying technology, called the AMT
Series, of extruded activated alumina tubes. This exciting new
technology has significant potential to displace many traditional
drying technologies — particularly in lower-flow applications
in these early stages of the technology.
Hydrothrift Corporation and Thermal Transfer Products both had
excellent booths talking about their cooling system products. It’s great
to see such a wide array of heat exchanger options for the diverse
cooling system requirements out there. One thing I hear about, from
end users, is a need for more engineering advice to help them reduce
the energy and water consumption requirements of their systems.
Conclusion
Once again, the AICD was a very entertaining and educational event.
It’s amazing how well Cheryl Kiker organizes and runs the whole
thing. For anyone wanting more information on membership or
exhibiting at the AICD, please contact Cheryl Kiker at [email protected]
or visit www.aicd.org.
To read more To read more To read more Industry NewsIndustry NewsIndustry News articles, visit articles, visit articles, visit Industry News articles, visit Industry NewsIndustry NewsIndustry News articles, visit Industry News articles, visit Industry News articles, visit Industry NewsIndustry NewsIndustry News articles, visit Industry Newswww.airbestpractices.com/industry-newswww.airbestpractices.com/industry-newswww.airbestpractices.com/industry-news
Stefano Gaggero and Joe Burke at the Aircom booth.
David Dieterle, Megan Ginelli, Michael Sano, and James Morrel at the Porocel booth.
Tony Hergert, Nick Herrig, Mark Lauterwasser, Kent Reddington, Johnny Smith, David Peters and Todd Allison at the Nano Purification Solutions booth.
| 0 7 / 1 3
34 airbestpractices.com
SUSTAINABLE MANUFACTURING FEATURES
By the Compressed Air & Gas Institute
CAGI PERFORMANCE VERIFICATION PROGRAM FOR AIR COMPRESSOR AND DRYER SELECTIONCAGI PERFORMANCE ERIFICATION ROGRAMFOR COMPRESSOR SELECTIONCAGI PERFORMANCE VERIFICATION PROGRAMFOR AIR COMPRESSOR AND DRYER SELECTION
cpIntroduction
Plant engineers do not purchase air
compressors or compressed air dryers on a
regular basis. There may be decades between
purchases, and with today’s more reliable
and durable compressed air equipment, the
interval between purchasing decisions grows
ever longer. This lack of purchasing frequency,
coupled with the significant investment in
productivity that compressors and dryers
represent, means it is important to make
the right decision.
Compressed air system equipment
manufacturers offer a wide variety of
equipment and features to meet every need.
Purchasers must weigh the costs and benefits
of different options while evaluating the
many variables that must be considered
when purchasing a compressor or dryer. The
following list starts to scratch the surface:
current system layout (if there is one), end
use requirements, control strategies, future
expansion plans, available resources (power,
water, financial, infrastructure, etc.), site
conditions, intermittent end uses, available
storage, etc.
The Performance Verification Program
The Compressed Air & Gas Institute (CAGI)
has developed a Performance Verification
Program for rotary compressors and
refrigerated air dryers to help purchasers
address one key decision: which equipment
will provide the compressed air needed to
meet demand in the most efficient way. CAGI
and its members have devoted great effort
to establish the Performance Verification
Program. Development of well accepted
international standards for measuring
performance, ISO 1217 for compressors
and ISO 7183 for dryers, and adoption of
a common, standardized means of reporting
performance, the CAGI datasheets, took many
years of hard work.
Performance standards and standardized
datasheets are critical decision making
tools. They offer key points of comparison
for purchasers, but is the data reliable? The
manufacturers provide the performance data.
Can purchasers trust the data?
To ease possible concerns about the reliability
of stated performance data, CAGI members
that manufacture rotary compressors and
refrigerated air dryers took an additional step.
They contracted with an independent third
party to verify their stated performance data.
The third party administrator of the program
is Intertek Testing Services, a respected
127 year-old testing company. Intertek first
determines a participating manufacturer's
stated performance by obtaining datasheets
on the participant's public website. Intertek
then selects a sample for testing, ships it to
the Intertek lab, and tests the equipment to
the relevant standard test procedure. The
outcome of the Intertek test is compared to the
participant's stated performance claims, and
The Compressed Air & Gas Institute (CAGI) is an association of manufacturers of
compressed air system equipment: compressors, blowers, air drying and filtration, and
pneumatic tools. Links to member websites are provided on the CAGI site. The members’
representatives are readily available to assist users in recommending the proper equipment
to meet your compressed air needs. CAGI’s mission is to be the united voice of the
compressed air industry, serving as the unbiased authority on technical, educational,
promotional, and other matters that affect the compressed air and gas industry.
Currently, the Performance Verification Program covers lubricated rotary compressors from
5 to 200 horsepower and dryers from 200 to 1000 scfm, CAGI has expanded the scope
of the program since its inception, and future expansion is expected.
The CAGI Performance Verification Program for Rotary Compressors and Refrigerated Air
Dryers is based on ISO standards and CAGI Datasheets. For further information about the
standards, the datasheets, and the program, visit the CAGI website: http://www.cagi.org/
performance-verification/. In addition to the Performance Verification Program, there are
additional resources, including e-learning coursework on the SmartSite, selection guides
and data sheets, videos and CDs, and the Compressed Air & Gas Handbook available
through CAGI.
®
0 7 / 1 3 |
35 airbestpractices.com
SUSTAINABLE MANUFACTURING FEATURES
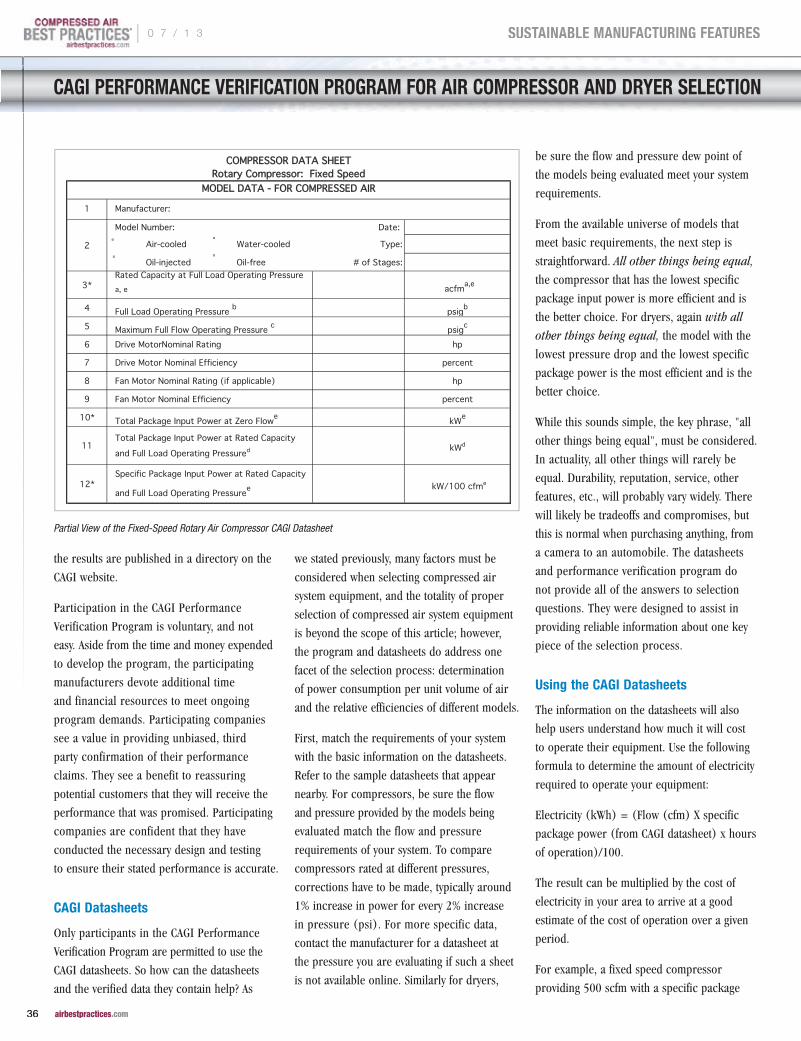
CAGI PERFORMANCE VERIFICATION PROGRAM FOR AIR COMPRESSOR AND DRyER SELECTION
the results are published in a directory on the
CAGI website.
Participation in the CAGI Performance
Verification Program is voluntary, and not
easy. Aside from the time and money expended
to develop the program, the participating
manufacturers devote additional time
and financial resources to meet ongoing
program demands. Participating companies
see a value in providing unbiased, third
party confirmation of their performance
claims. They see a benefit to reassuring
potential customers that they will receive the
performance that was promised. Participating
companies are confident that they have
conducted the necessary design and testing
to ensure their stated performance is accurate.
CAGI Datasheets
Only participants in the CAGI Performance
Verification Program are permitted to use the
CAGI datasheets. So how can the datasheets
and the verified data they contain help? As
we stated previously, many factors must be
considered when selecting compressed air
system equipment, and the totality of proper
selection of compressed air system equipment
is beyond the scope of this article; however,
the program and datasheets do address one
facet of the selection process: determination
of power consumption per unit volume of air
and the relative efficiencies of different models.
First, match the requirements of your system
with the basic information on the datasheets.
Refer to the sample datasheets that appear
nearby. For compressors, be sure the flow
and pressure provided by the models being
evaluated match the flow and pressure
requirements of your system. To compare
compressors rated at different pressures,
corrections have to be made, typically around
1% increase in power for every 2% increase
in pressure (psi). For more specific data,
contact the manufacturer for a datasheet at
the pressure you are evaluating if such a sheet
is not available online. Similarly for dryers,
be sure the flow and pressure dew point of
the models being evaluated meet your system
requirements.
From the available universe of models that
meet basic requirements, the next step is
straightforward. All other things being equal,
the compressor that has the lowest specific
package input power is more efficient and is
the better choice. For dryers, again with all
other things being equal, the model with the
lowest pressure drop and the lowest specific
package power is the most efficient and is the
better choice.
While this sounds simple, the key phrase, "all
other things being equal", must be considered.
In actuality, all other things will rarely be
equal. Durability, reputation, service, other
features, etc., will probably vary widely. There
will likely be tradeoffs and compromises, but
this is normal when purchasing anything, from
a camera to an automobile. The datasheets
and performance verification program do
not provide all of the answers to selection
questions. They were designed to assist in
providing reliable information about one key
piece of the selection process.
Using the CAGI Datasheets
The information on the datasheets will also
help users understand how much it will cost
to operate their equipment. Use the following
formula to determine the amount of electricity
required to operate your equipment:
Electricity (kWh) = (Flow (cfm) X specific
package power (from CAGI datasheet) x hours
of operation)/100.
The result can be multiplied by the cost of
electricity in your area to arrive at a good
estimate of the cost of operation over a given
period.
For example, a fixed speed compressor
providing 500 scfm with a specific package
1
Date:
Air-cooled Water-cooled Type:
Oil-injected Oil-free # of Stages:
3* acfma,e
4 Full Load Operating Pressure b psigb
5 Maximum Full Flow Operating Pressure c psigc
6 Drive MotorNominal Rating hp
7 Drive Motor Nominal Efficiency percent
8 Fan Motor Nominal Rating (if applicable) hp
9 Fan Motor Nominal Efficiency percent
10* Total Package Input Power at Zero Flowe kWe
11 kWd
12* kW/100 cfme
*For models that are tested in the CAGI Performance Verification Program, these items are verified by the third party administrator. Consult CAGI websitefor a list of participants in the third party verification program: www.cagi.org
NOTES: a. Measured at the discharge terminal point of the compressor package in accordance with ISO 1217, Annex C; ACFM is actual cubic feet per minute at inlet conditions.
b. The operating pressure at which the Capacity (Item 3) and Electrical Consumption (Item 11) were measured Member for this data sheet.
c. Maximum pressure attainable at full flow, usually the unload pressure setting for load/no load control or the maximum pressure attainable before capacity control begins. May require additional power.
d. Total package input power at other than reported operating points will vary with control strategy.e. Tolerance is specified in ISO 1217, Annex C, as shown in table below:
Specific EnergyConsumption
m3 / min % %Below 0.5 +/- 7 +/- 80.5 to 1.5 +/- 6 +/- 71.5 to 15 +/- 5 +/- 6
ROT 030 Above 15 +/- 4 +/- 5
10/11 R8 This form was developed by the Compressed Air and Gas Institute for the use of its members. CAGI has not independently verified the reported data.
MODEL DATA - FOR COMPRESSED AIR
Volume Flow RateVolume Flow Rate
at specified conditions
COMPRESSOR DATA SHEETRotary Compressor: Fixed Speed
Manufacturer:
Model Number:
Total Package Input Power at Rated Capacity and Full Load Operating Pressured
2
Rated Capacity at Full Load Operating Pressure a, e
15 to 5050 to 500Above 500
Below 15
Specific Package Input Power at Rated Capacity
and Full Load Operating Pressuree
ft3 / min
Partial View of the Fixed-Speed Rotary Air Compressor CAGI Datasheet
| 0 7 / 1 3
36 airbestpractices.com
SUSTAINABLE MANUFACTURING FEATURES
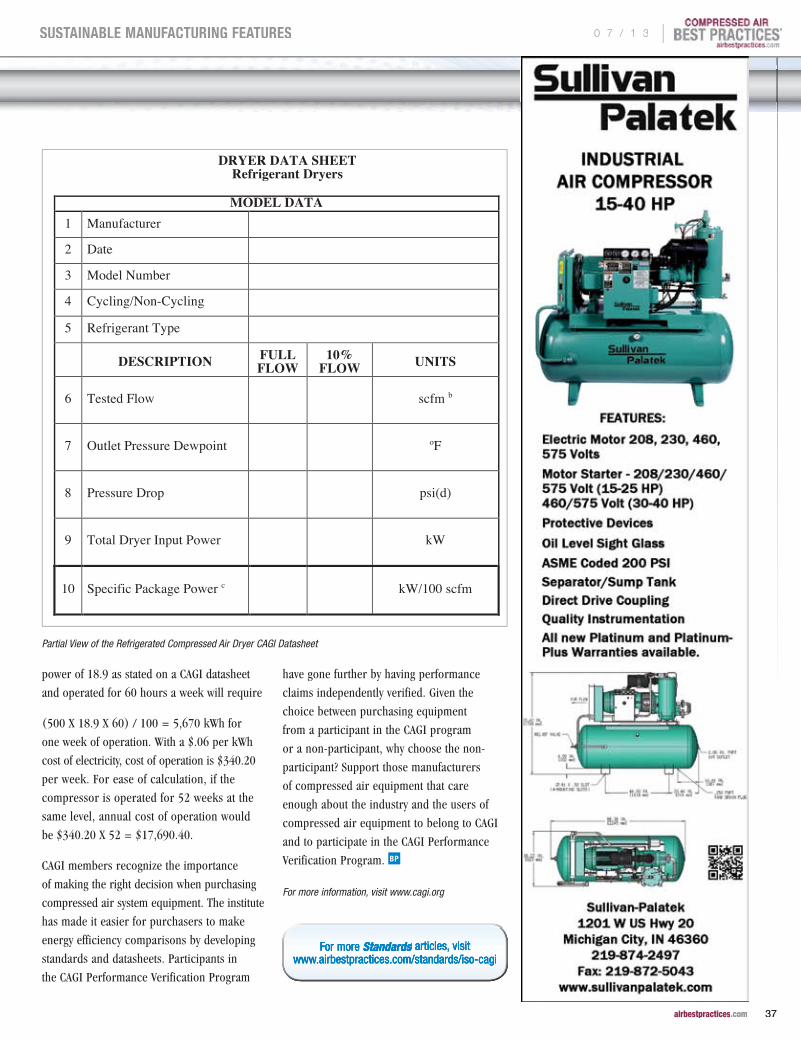
power of 18.9 as stated on a CAGI datasheet
and operated for 60 hours a week will require
(500 X 18.9 X 60) / 100 = 5,670 kWh for
one week of operation. With a $.06 per kWh
cost of electricity, cost of operation is $340.20
per week. For ease of calculation, if the
compressor is operated for 52 weeks at the
same level, annual cost of operation would
be $340.20 X 52 = $17,690.40.
CAGI members recognize the importance
of making the right decision when purchasing
compressed air system equipment. The institute
has made it easier for purchasers to make
energy efficiency comparisons by developing
standards and datasheets. Participants in
the CAGI Performance Verification Program
have gone further by having performance
claims independently verified. Given the
choice between purchasing equipment
from a participant in the CAGI program
or a non-participant, why choose the non-
participant? Support those manufacturers
of compressed air equipment that care
enough about the industry and the users of
compressed air equipment to belong to CAGI
and to participate in the CAGI Performance
Verification Program.
For more information, visit www.cagi.org
For more For more For more StandardsStandardsStandards articles, visit articles, visit articles, visit Standards articles, visit StandardsStandardsStandards articles, visit Standards articles, visit Standards articles, visit StandardsStandardsStandards articles, visit Standardswww.airbestpractices.com/standards/iso-cagiwww.airbestpractices.com/standards/iso-cagiwww.airbestpractices.com/standards/iso-cagi
Form Number REF 010 Rev 7 5-12
Member
DRYER DATA SHEET Refrigerant Dryers
MODEL DATA
1 Manufacturer
2 Date
3 Model Number
4 Cycling/Non-Cycling
5 Refrigerant Type
DESCRIPTION FULL FLOW
10% FLOW UNITS
6 Tested Flow
scfm b
7 Outlet Pressure Dewpoint
oF
8 Pressure Drop
psi(d)
9 Total Dryer Input Power
kW
10 Specific Package Power c
kW/100 scfm
Notes: a. Dryer ratings at the following inlet conditions to the dryer (as per ISO 7183, Table 2, Option A2):
• Inlet Compressed Air Temperature: 100oF (38oC) • Inlet Compressed Air Pressure: 100 psig (7 Bar) • Max. Ambient Air Temperature: 100oF (38oC) • Inlet Compressed Air Relative Humidity 100% (Saturated)
b. SCFM defined as the volume of free air in cubic feet per minute measured at 14.5 psia (1.0 Bar), 68oF (20oC)
temperature and 0% R.H. (0 WVP).
c. (Total Dryer Input Power/tested flow) x 100
This form was developed by the Compressed Air and Gas Institute for the use of its members. CAGI has not independently verified the reported data. Consult the CAGI website, www.cagi.org, for a list of participants in the third party verification program.
Partial View of the Refrigerated Compressed Air Dryer CAGI Datasheet
0 7 / 1 3 |
37 airbestpractices.com
SUSTAINABLE MANUFACTURING FEATURES
USING KPI’S FOR PEAK EFFICIENCY
By Ron Marshall for the Compressed Air Challenge®
cpFor many industrial sites the only indicator of compressed air
performance is the big old pressure gauge right outside the maintenance
manager’s office. Over the years someone may have penciled a red line
on the gauge, and if the pressure falls below the line the manager will
start shouting. This is an example of the saying “What gets measured,
gets managed”, definitely the plant pressure in a facility is a very
important indicator of adequate compressed air system operation, but
is it the only parameter that needs to be monitored? This article explores
some important compressed air KPI’s and provides some examples
of how they can be collected and used.
what are KPI’s
Key Performance Indicators are widely used in business and finance
to track important aspects of the performance of something. They
can be defined as “A set of quantifiable measures that a company or
industry uses to gauge or compare performance in terms of meeting
their strategic and operational goals. KPIs vary between companies
and industries, depending on their priorities or performance criteria.”
(Source Investopedia.com). As business processes get leaner and input
costs get higher it has become more and more important to keep track
of how important parts of your business are performing.
A compressed air system is no different than any other cost center in
an organization, its performance has an impact on production quality,
plant efficiency, operating costs and ultimately profitability. Proper
attention to the key aspects of the compressed air system can go a
long way in solving production problems and reducing waste. Recent
advances in the quality, availability and affordability of data collection
equipment has made the monitoring of key compressed air performance
indicators (KPI’s) even more possible now than ever before.
How KPI’s can be used
The collection and analysis of key performance indicators is important
to ensuring efficient and effective performance of a system. Some uses
of KPI’s with regard to energy and system performance:
pp Determining system efficiency and setting a baseline before improvement projects are started
pp Helping justify improvement projects and providing data to receive utility incentives
pp Proving the results of improvement projects
pp Ensuring the savings gained from projects are maintained
pp Monitoring the levels of waste and triggering corrective actions
pp Detecting impending operational and equipment performance problems
Compressed Air KPI’s
With regard to the performance of compressed air powered compressed
air equipment the most important indicator is definitely system pressure.
But other aspects of the system are important as well. Knowing the
cost of producing the air is important too, especially with rising
electricity rates. This means the power consumption of compressors and
associated equipment is an important factor. So too is a measurement
of the compressed air flow produced by the air production equipment.
| 0 7 / 1 3
38 airbestpractices.com
SUSTAINABLE MANUFACTURING FEATURESSUSTAINABLE MANUFACTURING FEATURES
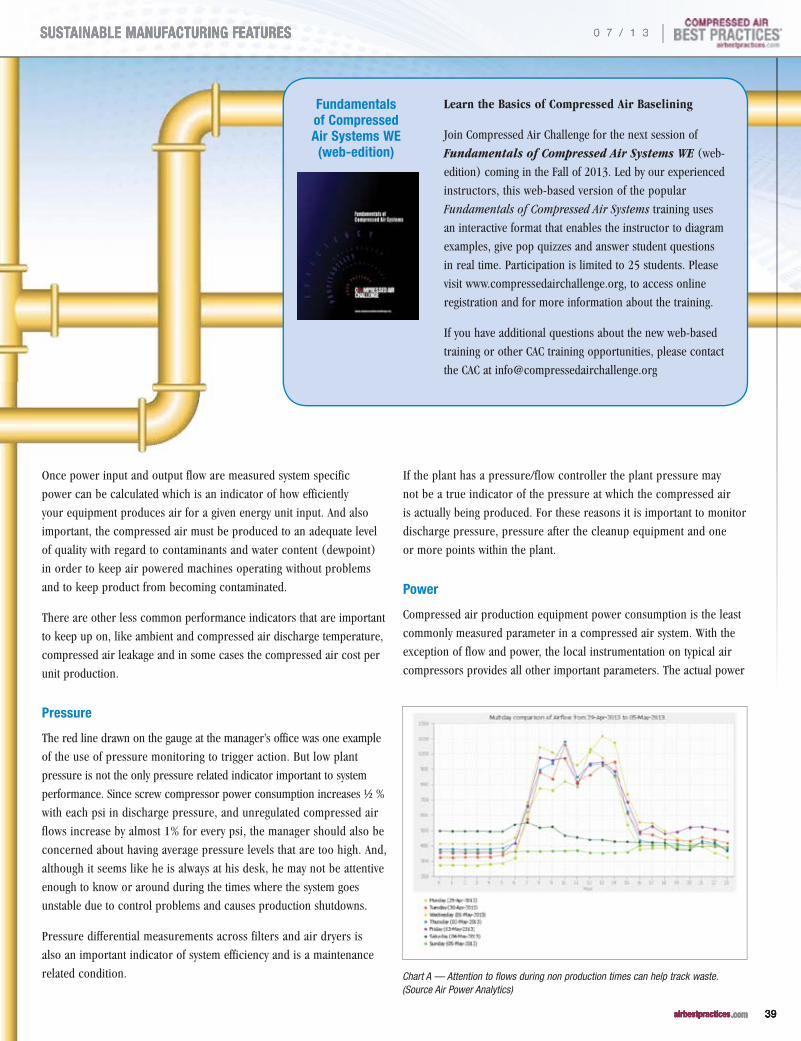
Learn the Basics of Compressed Air Baselining
Join Compressed Air Challenge for the next session of
Fundamentals of Compressed Air Systems WE (web-
edition) coming in the Fall of 2013. Led by our experienced
instructors, this web-based version of the popular
Fundamentals of Compressed Air Systems training uses
an interactive format that enables the instructor to diagram
examples, give pop quizzes and answer student questions
in real time. Participation is limited to 25 students. Please
visit www.compressedairchallenge.org, to access online
registration and for more information about the training.
If you have additional questions about the new web-based
training or other CAC training opportunities, please contact
the CAC at [email protected]
Fundamentals of Compressed Air Systems wE (web-edition)
Once power input and output flow are measured system specific
power can be calculated which is an indicator of how efficiently
your equipment produces air for a given energy unit input. And also
important, the compressed air must be produced to an adequate level
of quality with regard to contaminants and water content (dewpoint)
in order to keep air powered machines operating without problems
and to keep product from becoming contaminated.
There are other less common performance indicators that are important
to keep up on, like ambient and compressed air discharge temperature,
compressed air leakage and in some cases the compressed air cost per
unit production.
Pressure
The red line drawn on the gauge at the manager’s office was one example
of the use of pressure monitoring to trigger action. But low plant
pressure is not the only pressure related indicator important to system
performance. Since screw compressor power consumption increases ½ %
with each psi in discharge pressure, and unregulated compressed air
flows increase by almost 1% for every psi, the manager should also be
concerned about having average pressure levels that are too high. And,
although it seems like he is always at his desk, he may not be attentive
enough to know or around during the times where the system goes
unstable due to control problems and causes production shutdowns.
Pressure differential measurements across filters and air dryers is
also an important indicator of system efficiency and is a maintenance
related condition.
If the plant has a pressure/flow controller the plant pressure may
not be a true indicator of the pressure at which the compressed air
is actually being produced. For these reasons it is important to monitor
discharge pressure, pressure after the cleanup equipment and one
or more points within the plant.
Power
Compressed air production equipment power consumption is the least
commonly measured parameter in a compressed air system. With the
exception of flow and power, the local instrumentation on typical air
compressors provides all other important parameters. The actual power
Chart A — Attention to flows during non production times can help track waste. (Source Air Power Analytics)
0 7 / 1 3 |
39 airbestpractices.com
SUSTAINABLE MANUFACTURING FEATURESSUSTAINABLE MANUFACTURING FEATURES
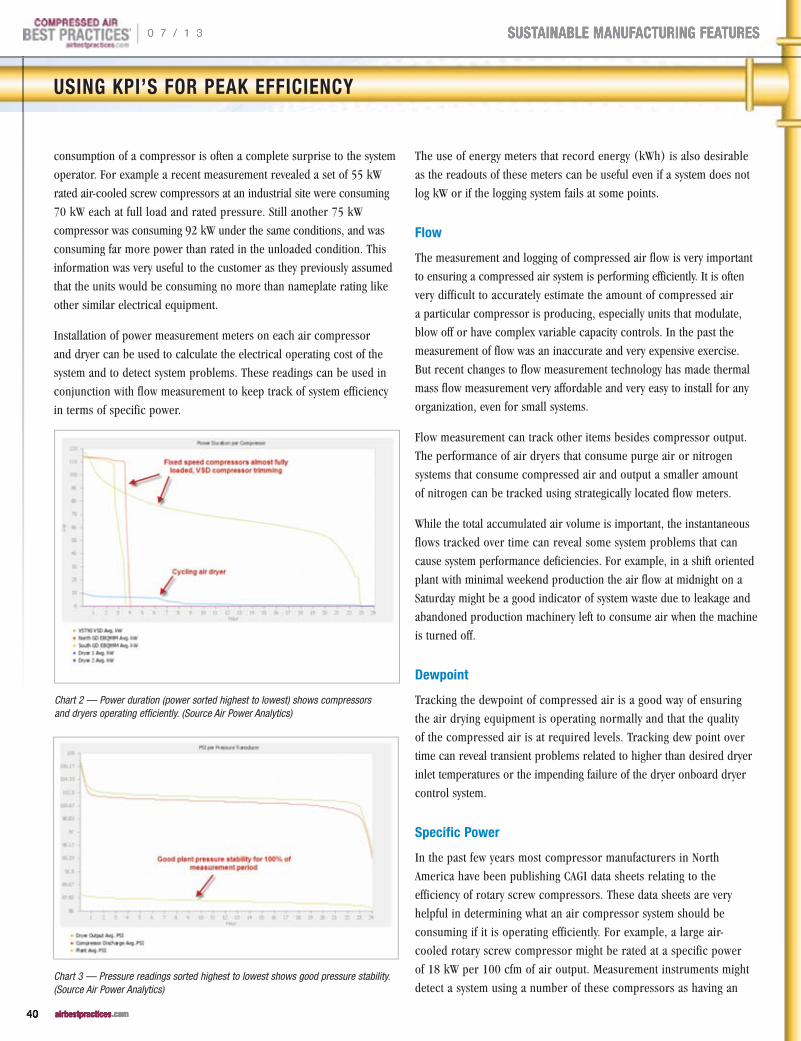
USING KPI’S FOR PEAK EFFICIENCy
consumption of a compressor is often a complete surprise to the system
operator. For example a recent measurement revealed a set of 55 kW
rated air-cooled screw compressors at an industrial site were consuming
70 kW each at full load and rated pressure. Still another 75 kW
compressor was consuming 92 kW under the same conditions, and was
consuming far more power than rated in the unloaded condition. This
information was very useful to the customer as they previously assumed
that the units would be consuming no more than nameplate rating like
other similar electrical equipment.
Installation of power measurement meters on each air compressor
and dryer can be used to calculate the electrical operating cost of the
system and to detect system problems. These readings can be used in
conjunction with flow measurement to keep track of system efficiency
in terms of specific power.
The use of energy meters that record energy (kWh) is also desirable
as the readouts of these meters can be useful even if a system does not
log kW or if the logging system fails at some points.
Flow
The measurement and logging of compressed air flow is very important
to ensuring a compressed air system is performing efficiently. It is often
very difficult to accurately estimate the amount of compressed air
a particular compressor is producing, especially units that modulate,
blow off or have complex variable capacity controls. In the past the
measurement of flow was an inaccurate and very expensive exercise.
But recent changes to flow measurement technology has made thermal
mass flow measurement very affordable and very easy to install for any
organization, even for small systems.
Flow measurement can track other items besides compressor output.
The performance of air dryers that consume purge air or nitrogen
systems that consume compressed air and output a smaller amount
of nitrogen can be tracked using strategically located flow meters.
While the total accumulated air volume is important, the instantaneous
flows tracked over time can reveal some system problems that can
cause system performance deficiencies. For example, in a shift oriented
plant with minimal weekend production the air flow at midnight on a
Saturday might be a good indicator of system waste due to leakage and
abandoned production machinery left to consume air when the machine
is turned off.
Dewpoint
Tracking the dewpoint of compressed air is a good way of ensuring
the air drying equipment is operating normally and that the quality
of the compressed air is at required levels. Tracking dew point over
time can reveal transient problems related to higher than desired dryer
inlet temperatures or the impending failure of the dryer onboard dryer
control system.
Specific Power
In the past few years most compressor manufacturers in North
America have been publishing CAGI data sheets relating to the
efficiency of rotary screw compressors. These data sheets are very
helpful in determining what an air compressor system should be
consuming if it is operating efficiently. For example, a large air-
cooled rotary screw compressor might be rated at a specific power
of 18 kW per 100 cfm of air output. Measurement instruments might
detect a system using a number of these compressors as having an
Chart 2 — Power duration (power sorted highest to lowest) shows compressors and dryers operating efficiently. (Source Air Power Analytics)
Chart 3 — Pressure readings sorted highest to lowest shows good pressure stability. (Source Air Power Analytics)
| 0 7 / 1 3
40 airbestpractices.com
SUSTAINABLE MANUFACTURING FEATURES
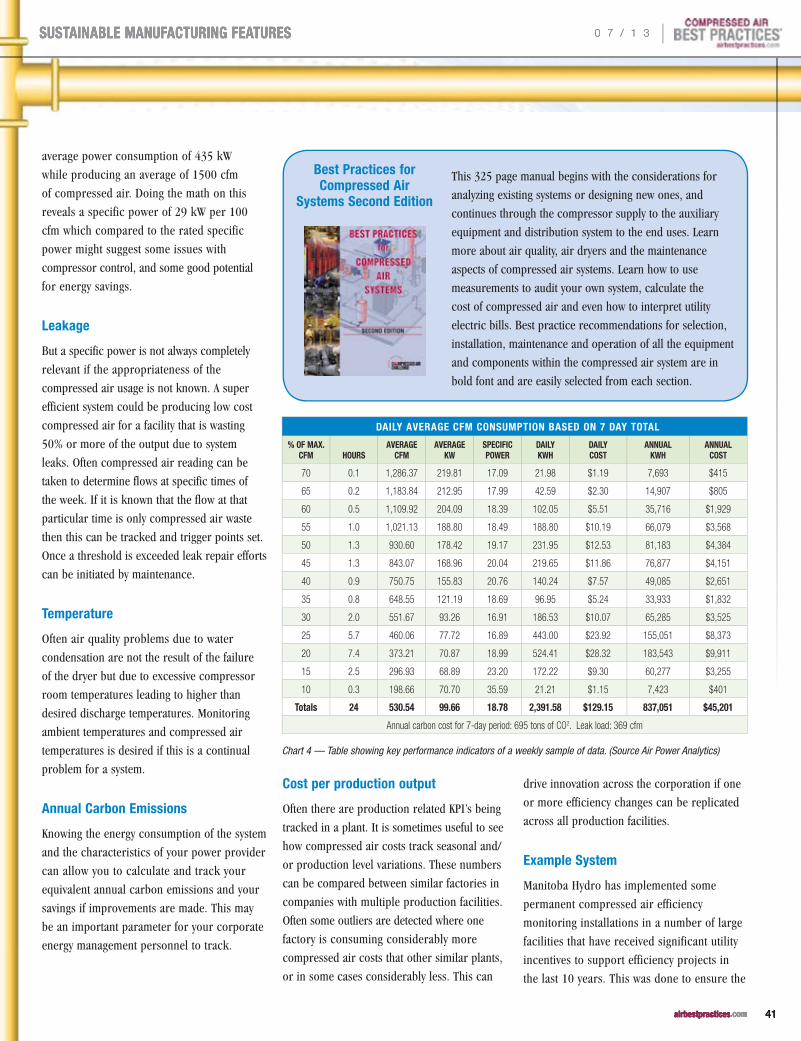
average power consumption of 435 kW
while producing an average of 1500 cfm
of compressed air. Doing the math on this
reveals a specific power of 29 kW per 100
cfm which compared to the rated specific
power might suggest some issues with
compressor control, and some good potential
for energy savings.
Leakage
But a specific power is not always completely
relevant if the appropriateness of the
compressed air usage is not known. A super
efficient system could be producing low cost
compressed air for a facility that is wasting
50% or more of the output due to system
leaks. Often compressed air reading can be
taken to determine flows at specific times of
the week. If it is known that the flow at that
particular time is only compressed air waste
then this can be tracked and trigger points set.
Once a threshold is exceeded leak repair efforts
can be initiated by maintenance.
Temperature
Often air quality problems due to water
condensation are not the result of the failure
of the dryer but due to excessive compressor
room temperatures leading to higher than
desired discharge temperatures. Monitoring
ambient temperatures and compressed air
temperatures is desired if this is a continual
problem for a system.
Annual Carbon Emissions
Knowing the energy consumption of the system
and the characteristics of your power provider
can allow you to calculate and track your
equivalent annual carbon emissions and your
savings if improvements are made. This may
be an important parameter for your corporate
energy management personnel to track.
Cost per production output
Often there are production related KPI’s being
tracked in a plant. It is sometimes useful to see
how compressed air costs track seasonal and/
or production level variations. These numbers
can be compared between similar factories in
companies with multiple production facilities.
Often some outliers are detected where one
factory is consuming considerably more
compressed air costs that other similar plants,
or in some cases considerably less. This can
drive innovation across the corporation if one
or more efficiency changes can be replicated
across all production facilities.
Example System
Manitoba Hydro has implemented some
permanent compressed air efficiency
monitoring installations in a number of large
facilities that have received significant utility
incentives to support efficiency projects in
the last 10 years. This was done to ensure the
Chart 4 — Table showing key performance indicators of a weekly sample of data. (Source Air Power Analytics)
DAILy AVERAGE CFM CONSUMPTION BASED ON 7 DAy TOTAL
% OF MAx. CFM HOURS
AVERAGE CFM
AVERAGE Kw
SPECIFIC POwER
DAILy KwH
DAILy COST
ANNUAL KwH
ANNUAL COST
70 0.1 1,286.37 219.81 17.09 21.98 $1.19 7,693 $415
65 0.2 1,183.84 212.95 17.99 42.59 $2.30 14,907 $805
60 0.5 1,109.92 204.09 18.39 102.05 $5.51 35,716 $1,929
55 1.0 1,021.13 188.80 18.49 188.80 $10.19 66,079 $3,568
50 1.3 930.60 178.42 19.17 231.95 $12.53 81,183 $4,384
45 1.3 843.07 168.96 20.04 219.65 $11.86 76,877 $4,151
40 0.9 750.75 155.83 20.76 140.24 $7.57 49,085 $2,651
35 0.8 648.55 121.19 18.69 96.95 $5.24 33,933 $1,832
30 2.0 551.67 93.26 16.91 186.53 $10.07 65,285 $3,525
25 5.7 460.06 77.72 16.89 443.00 $23.92 155,051 $8,373
20 7.4 373.21 70.87 18.99 524.41 $28.32 183,543 $9,911
15 2.5 296.93 68.89 23.20 172.22 $9.30 60,277 $3,255
10 0.3 198.66 70.70 35.59 21.21 $1.15 7,423 $401
Totals 24 530.54 99.66 18.78 2,391.58 $129.15 837,051 $45,201
Annual carbon cost for 7-day period: 695 tons of CO2. Leak load: 369 cfm
This 325 page manual begins with the considerations for
analyzing existing systems or designing new ones, and
continues through the compressor supply to the auxiliary
equipment and distribution system to the end uses. Learn
more about air quality, air dryers and the maintenance
aspects of compressed air systems. Learn how to use
measurements to audit your own system, calculate the
cost of compressed air and even how to interpret utility
electric bills. Best practice recommendations for selection,
installation, maintenance and operation of all the equipment
and components within the compressed air system are in
bold font and are easily selected from each section.
Best Practices for Compressed Air
Systems Second Edition
0 7 / 1 3 |
41 airbestpractices.com
SUSTAINABLE MANUFACTURING FEATURES
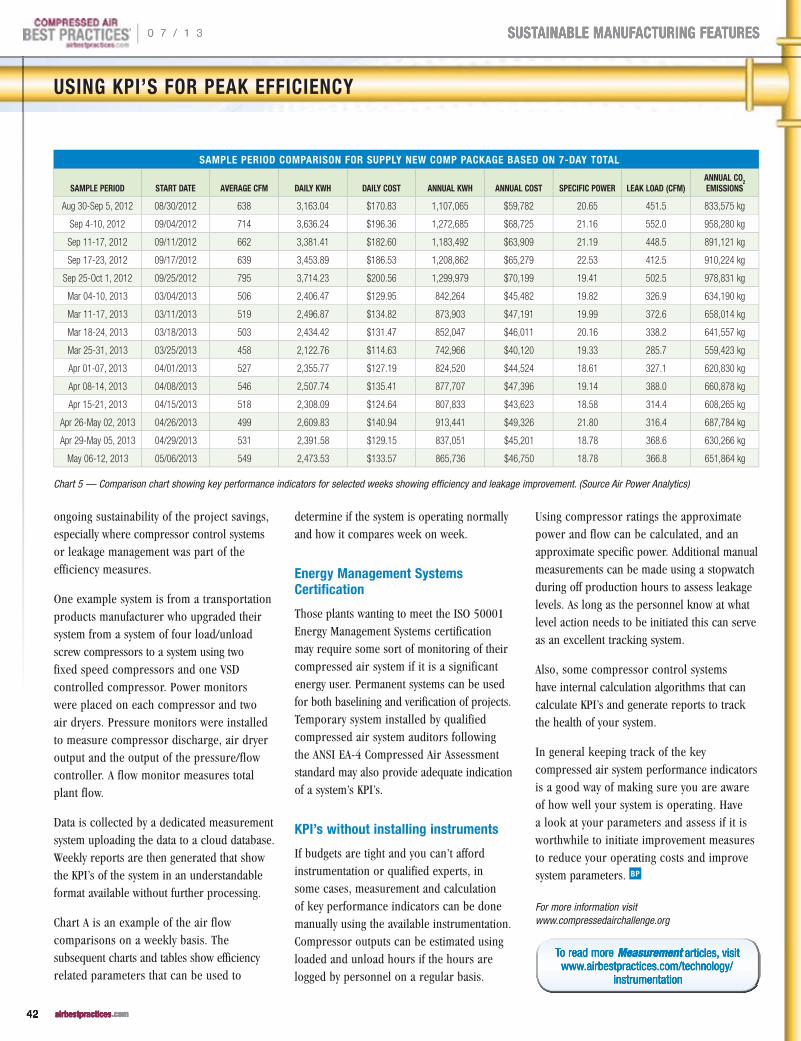
USING KPI’S FOR PEAK EFFICIENCy
ongoing sustainability of the project savings, especially where compressor control systems or leakage management was part of the efficiency measures.
One example system is from a transportation products manufacturer who upgraded their system from a system of four load/unload screw compressors to a system using two fixed speed compressors and one VSD controlled compressor. Power monitors were placed on each compressor and two air dryers. Pressure monitors were installed to measure compressor discharge, air dryer output and the output of the pressure/flow controller. A flow monitor measures total plant flow.
Data is collected by a dedicated measurement system uploading the data to a cloud database. Weekly reports are then generated that show the KPI’s of the system in an understandable format available without further processing.
Chart A is an example of the air flow comparisons on a weekly basis. The subsequent charts and tables show efficiency related parameters that can be used to
determine if the system is operating normally and how it compares week on week.
Energy Management Systems Certification
Those plants wanting to meet the ISO 50001 Energy Management Systems certification may require some sort of monitoring of their compressed air system if it is a significant energy user. Permanent systems can be used for both baselining and verification of projects. Temporary system installed by qualified compressed air system auditors following the ANSI EA-4 Compressed Air Assessment standard may also provide adequate indication of a system’s KPI’s.
KPI’s without installing instruments
If budgets are tight and you can’t afford instrumentation or qualified experts, in some cases, measurement and calculation of key performance indicators can be done manually using the available instrumentation. Compressor outputs can be estimated using loaded and unload hours if the hours are logged by personnel on a regular basis.
Using compressor ratings the approximate power and flow can be calculated, and an approximate specific power. Additional manual measurements can be made using a stopwatch during off production hours to assess leakage levels. As long as the personnel know at what level action needs to be initiated this can serve as an excellent tracking system.
Also, some compressor control systems have internal calculation algorithms that can calculate KPI’s and generate reports to track the health of your system.
In general keeping track of the key compressed air system performance indicators is a good way of making sure you are aware of how well your system is operating. Have a look at your parameters and assess if it is worthwhile to initiate improvement measures to reduce your operating costs and improve system parameters.
For more information visit www.compressedairchallenge.org
To read moreTo read moreTo read more Measurement Measurement Measurement articles, visit articles, visit articles, visit www.airbestpractices.com/technology/www.airbestpractices.com/technology/www.airbestpractices.com/technology/
instrumentationinstrumentationinstrumentation
SAMPLE PERIOD COMPARISON FOR SUPPLy NEw COMP PACKAGE BASED ON 7-DAy TOTAL
SAMPLE PERIOD START DATE AVERAGE CFM DAILy KwH DAILy COST ANNUAL KwH ANNUAL COST SPECIFIC POwER LEAK LOAD (CFM) ANNUAL CO2 EMISSIONS
Aug 30-Sep 5, 2012 08/30/2012 638 3,163.04 $170.83 1,107,065 $59,782 20.65 451.5 833,575 kg
Sep 4-10, 2012 09/04/2012 714 3,636.24 $196.36 1,272,685 $68,725 21.16 552.0 958,280 kg
Sep 11-17, 2012 09/11/2012 662 3,381.41 $182.60 1,183,492 $63,909 21.19 448.5 891,121 kg
Sep 17-23, 2012 09/17/2012 639 3,453.89 $186.53 1,208,862 $65,279 22.53 412.5 910,224 kg
Sep 25-Oct 1, 2012 09/25/2012 795 3,714.23 $200.56 1,299,979 $70,199 19.41 502.5 978,831 kg
Mar 04-10, 2013 03/04/2013 506 2,406.47 $129.95 842,264 $45,482 19.82 326.9 634,190 kg
Mar 11-17, 2013 03/11/2013 519 2,496.87 $134.82 873,903 $47,191 19.99 372.6 658,014 kg
Mar 18-24, 2013 03/18/2013 503 2,434.42 $131.47 852,047 $46,011 20.16 338.2 641,557 kg
Mar 25-31, 2013 03/25/2013 458 2,122.76 $114.63 742,966 $40,120 19.33 285.7 559,423 kg
Apr 01-07, 2013 04/01/2013 527 2,355.77 $127.19 824,520 $44,524 18.61 327.1 620,830 kg
Apr 08-14, 2013 04/08/2013 546 2,507.74 $135.41 877,707 $47,396 19.14 388.0 660,878 kg
Apr 15-21, 2013 04/15/2013 518 2,308.09 $124.64 807,833 $43,623 18.58 314.4 608,265 kg
Apr 26-May 02, 2013 04/26/2013 499 2,609.83 $140.94 913,441 $49,326 21.80 316.4 687,784 kg
Apr 29-May 05, 2013 04/29/2013 531 2,391.58 $129.15 837,051 $45,201 18.78 368.6 630,266 kg
May 06-12, 2013 05/06/2013 549 2,473.53 $133.57 865,736 $46,750 18.78 366.8 651,864 kg
Chart 5 — Comparison chart showing key performance indicators for selected weeks showing efficiency and leakage improvement. (Source Air Power Analytics)
| 0 7 / 1 3
42 airbestpractices.com
SUSTAINABLE MANUFACTURING FEATURES

©2013 FPSA
When you make the effort to travel to a show, you’re looking for concentrated information from suppliers to your industry.
Food ProcessingSuppliers Association
NOVEMBER 3 - 6
2013 | CHICAGO
McCormick Place
South Hall/North Hall
REGISTER NOWwww.myprocessexpo.com
No other North American show can match PROCESS EXPO’s fixed focus on food & beverage processing and packaging.
You’ll see over 500 industry-focused exhibitors − including top equipment manufacturers. Learn from industry and academic experts in timely, educational sessions. Watch solutions at work on the show floor.
Food & beverage solutions. Straight up.
Food & Beverage.Full-Strength.
FPSA_Best Air Practices.Jul13.indd 1 5/17/13 11:43 AM
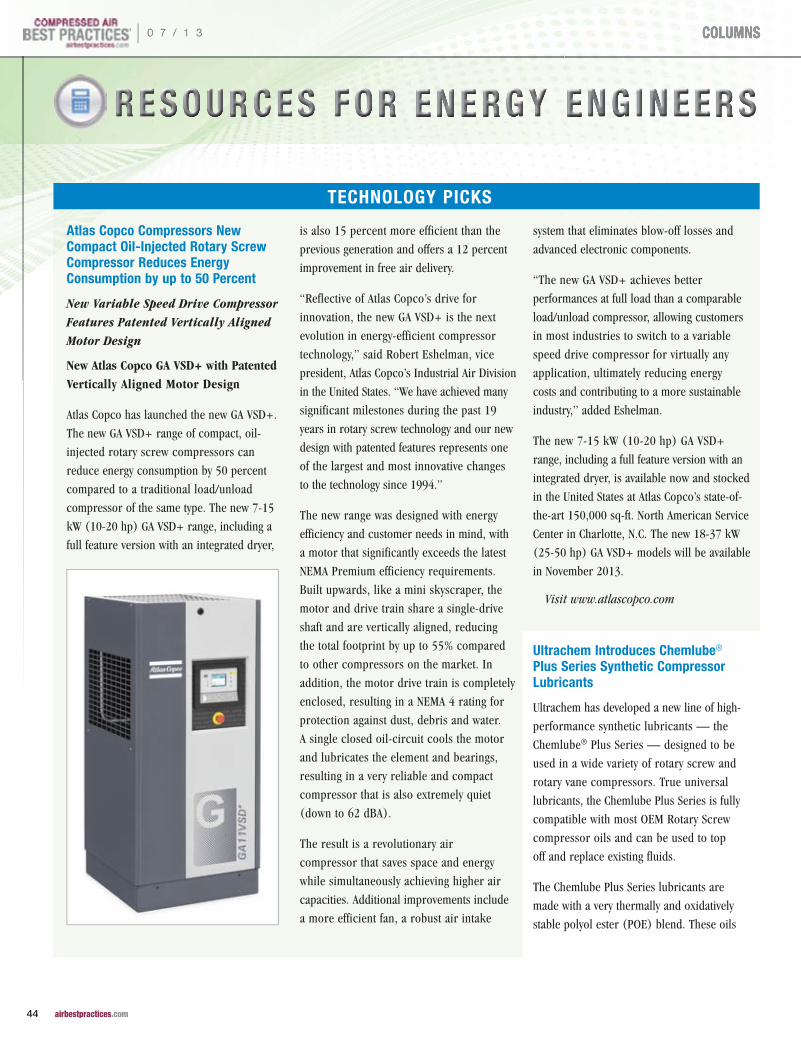
R e s o uR e s o uR e s o u RRR c e s f oc e s f oc e s f o RRR eee n en en e RRR g y g y g y eee n g i n e en g i n e en g i n e e RRR sss
TECHNOLOGy PICKS
Atlas Copco Compressors New Compact Oil-Injected Rotary Screw Compressor Reduces Energy Consumption by up to 50 Percent
New Variable Speed Drive Compressor Features Patented Vertically Aligned Motor Design
New Atlas Copco GA VSD+ with Patented Vertically Aligned Motor Design
Atlas Copco has launched the new GA VSD+.
The new GA VSD+ range of compact, oil-
injected rotary screw compressors can
reduce energy consumption by 50 percent
compared to a traditional load/unload
compressor of the same type. The new 7-15
kW (10-20 hp) GA VSD+ range, including a
full feature version with an integrated dryer,
is also 15 percent more efficient than the
previous generation and offers a 12 percent
improvement in free air delivery.
“Reflective of Atlas Copco’s drive for
innovation, the new GA VSD+ is the next
evolution in energy-efficient compressor
technology,” said Robert Eshelman, vice
president, Atlas Copco’s Industrial Air Division
in the United States. “We have achieved many
significant milestones during the past 19
years in rotary screw technology and our new
design with patented features represents one
of the largest and most innovative changes
to the technology since 1994.”
The new range was designed with energy
efficiency and customer needs in mind, with
a motor that significantly exceeds the latest
NEMA Premium efficiency requirements.
Built upwards, like a mini skyscraper, the
motor and drive train share a single-drive
shaft and are vertically aligned, reducing
the total footprint by up to 55% compared
to other compressors on the market. In
addition, the motor drive train is completely
enclosed, resulting in a NEMA 4 rating for
protection against dust, debris and water.
A single closed oil-circuit cools the motor
and lubricates the element and bearings,
resulting in a very reliable and compact
compressor that is also extremely quiet
(down to 62 dBA).
The result is a revolutionary air
compressor that saves space and energy
while simultaneously achieving higher air
capacities. Additional improvements include
a more efficient fan, a robust air intake
system that eliminates blow-off losses and
advanced electronic components.
“The new GA VSD+ achieves better
performances at full load than a comparable
load/unload compressor, allowing customers
in most industries to switch to a variable
speed drive compressor for virtually any
application, ultimately reducing energy
costs and contributing to a more sustainable
industry,” added Eshelman.
The new 7-15 kW (10-20 hp) GA VSD+
range, including a full feature version with an
integrated dryer, is available now and stocked
in the United States at Atlas Copco’s state-of-
the-art 150,000 sq-ft. North American Service
Center in Charlotte, N.C. The new 18-37 kW
(25-50 hp) GA VSD+ models will be available
in November 2013.
Visit www.atlascopco.com
Ultrachem Introduces Chemlube® Plus Series Synthetic Compressor Lubricants
Ultrachem has developed a new line of high-
performance synthetic lubricants — the
Chemlube® Plus Series — designed to be
used in a wide variety of rotary screw and
rotary vane compressors. True universal
lubricants, the Chemlube Plus Series is fully
compatible with most OEM Rotary Screw
compressor oils and can be used to top
off and replace existing fluids.
The Chemlube Plus Series lubricants are
made with a very thermally and oxidatively
stable polyol ester (POE) blend. These oils
| 0 7 / 1 3
44 airbestpractices.com
Columns
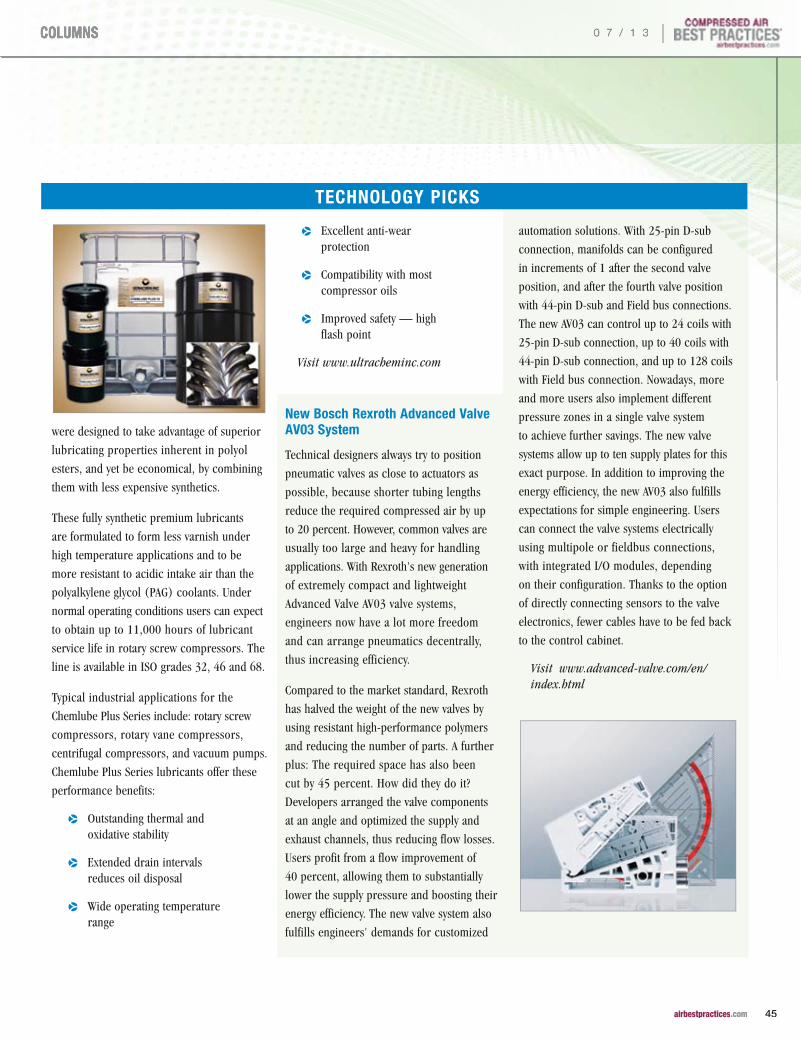
TECHNOLOGy PICKS
were designed to take advantage of superior
lubricating properties inherent in polyol
esters, and yet be economical, by combining
them with less expensive synthetics.
These fully synthetic premium lubricants
are formulated to form less varnish under
high temperature applications and to be
more resistant to acidic intake air than the
polyalkylene glycol (PAG) coolants. Under
normal operating conditions users can expect
to obtain up to 11,000 hours of lubricant
service life in rotary screw compressors. The
line is available in ISO grades 32, 46 and 68.
Typical industrial applications for the
Chemlube Plus Series include: rotary screw
compressors, rotary vane compressors,
centrifugal compressors, and vacuum pumps.
Chemlube Plus Series lubricants offer these
performance benefits:
pp Outstanding thermal and oxidative stability
pp Extended drain intervals reduces oil disposal
pp Wide operating temperature range
pp Excellent anti-wear protection
pp Compatibility with most compressor oils
pp Improved safety — high flash point
Visit www.ultracheminc.com
New Bosch Rexroth Advanced Valve AV03 System
Technical designers always try to position
pneumatic valves as close to actuators as
possible, because shorter tubing lengths
reduce the required compressed air by up
to 20 percent. However, common valves are
usually too large and heavy for handling
applications. With Rexroth's new generation
of extremely compact and lightweight
Advanced Valve AV03 valve systems,
engineers now have a lot more freedom
and can arrange pneumatics decentrally,
thus increasing efficiency.
Compared to the market standard, Rexroth
has halved the weight of the new valves by
using resistant high-performance polymers
and reducing the number of parts. A further
plus: The required space has also been
cut by 45 percent. How did they do it?
Developers arranged the valve components
at an angle and optimized the supply and
exhaust channels, thus reducing flow losses.
Users profit from a flow improvement of
40 percent, allowing them to substantially
lower the supply pressure and boosting their
energy efficiency. The new valve system also
fulfills engineers' demands for customized
automation solutions. With 25-pin D-sub
connection, manifolds can be configured
in increments of 1 after the second valve
position, and after the fourth valve position
with 44-pin D-sub and Field bus connections.
The new AV03 can control up to 24 coils with
25-pin D-sub connection, up to 40 coils with
44-pin D-sub connection, and up to 128 coils
with Field bus connection. Nowadays, more
and more users also implement different
pressure zones in a single valve system
to achieve further savings. The new valve
systems allow up to ten supply plates for this
exact purpose. In addition to improving the
energy efficiency, the new AV03 also fulfills
expectations for simple engineering. Users
can connect the valve systems electrically
using multipole or fieldbus connections,
with integrated I/O modules, depending
on their configuration. Thanks to the option
of directly connecting sensors to the valve
electronics, fewer cables have to be fed back
to the control cabinet.
Visit www.advanced-valve.com/en/index.html
0 7 / 1 3 |
45 airbestpractices.com
Columns
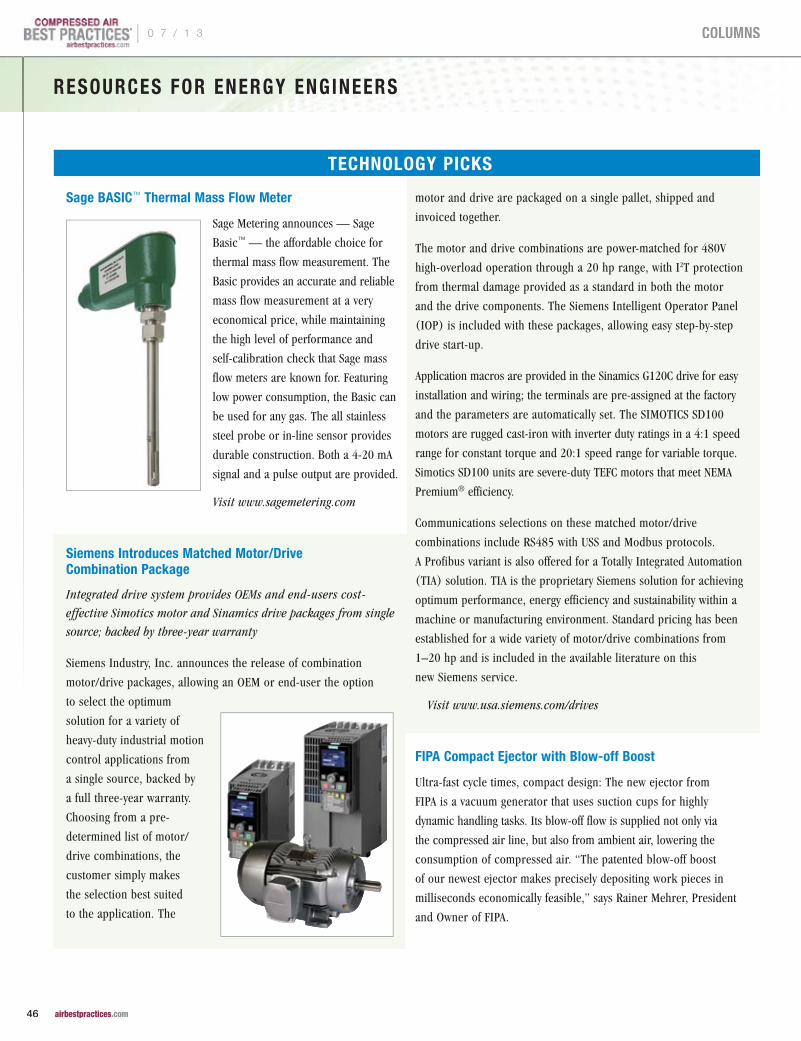
RESOURCES FOR ENERGy ENGINEERS
TECHNOLOGy PICKS
Sage BASIC™ Thermal Mass Flow Meter
Sage Metering announces — Sage
Basic™ — the affordable choice for
thermal mass flow measurement. The
Basic provides an accurate and reliable
mass flow measurement at a very
economical price, while maintaining
the high level of performance and
self-calibration check that Sage mass
flow meters are known for. Featuring
low power consumption, the Basic can
be used for any gas. The all stainless
steel probe or in-line sensor provides
durable construction. Both a 4-20 mA
signal and a pulse output are provided.
Visit www.sagemetering.com
Siemens Introduces Matched Motor/Drive Combination Package
Integrated drive system provides OEMs and end-users cost-
effective Simotics motor and Sinamics drive packages from single
source; backed by three-year warranty
Siemens Industry, Inc. announces the release of combination
motor/drive packages, allowing an OEM or end-user the option
to select the optimum
solution for a variety of
heavy-duty industrial motion
control applications from
a single source, backed by
a full three-year warranty.
Choosing from a pre-
determined list of motor/
drive combinations, the
customer simply makes
the selection best suited
to the application. The
motor and drive are packaged on a single pallet, shipped and
invoiced together.
The motor and drive combinations are power-matched for 480V
high-overload operation through a 20 hp range, with I2T protection
from thermal damage provided as a standard in both the motor
and the drive components. The Siemens Intelligent Operator Panel
(IOP) is included with these packages, allowing easy step-by-step
drive start-up.
Application macros are provided in the Sinamics G120C drive for easy
installation and wiring; the terminals are pre-assigned at the factory
and the parameters are automatically set. The SIMOTICS SD100
motors are rugged cast-iron with inverter duty ratings in a 4:1 speed
range for constant torque and 20:1 speed range for variable torque.
Simotics SD100 units are severe-duty TEFC motors that meet NEMA
Premium® efficiency.
Communications selections on these matched motor/drive
combinations include RS485 with USS and Modbus protocols.
A Profibus variant is also offered for a Totally Integrated Automation
(TIA) solution. TIA is the proprietary Siemens solution for achieving
optimum performance, energy efficiency and sustainability within a
machine or manufacturing environment. Standard pricing has been
established for a wide variety of motor/drive combinations from
1–20 hp and is included in the available literature on this
new Siemens service.
Visit www.usa.siemens.com/drives
FIPA Compact Ejector with Blow-off Boost
Ultra-fast cycle times, compact design: The new ejector from
FIPA is a vacuum generator that uses suction cups for highly
dynamic handling tasks. Its blow-off flow is supplied not only via
the compressed air line, but also from ambient air, lowering the
consumption of compressed air. “The patented blow-off boost
of our newest ejector makes precisely depositing work pieces in
milliseconds economically feasible,” says Rainer Mehrer, President
and Owner of FIPA.
| 0 7 / 1 3
46 airbestpractices.com
Columns
Common fields of application include Delta robots in the
packaging industry, electronics production or micro assembly.
The new ejector with blow-off boost at a glance:
pp Fast Blow-off: Work pieces are placed precisely and cautiously
pp High Process Dynamics: Lightweight and very fast vacuum build up and dissipation allow quick gripping and placing
pp Compact Design: Each suction cup can be supplied with its own ejector, even in large gripper systems
pp Robust & Durable: Solenoid valve withstands over 100 million switching operations
pp Extremely Short Cycle Time: Ideal for robotic applications, such as Delta robots
pp High Precision: Grippers with one ejector per suction cup prevent lateral work piece swinging due to different blow-off speeds
Visit www.FIPA.com
TECHNOLOGy PICKSCOMPRESSED AIR BEST PRACTICES®
w w w . a i r b e s t p r a c t i c e s . c o m
ADVERTISER INDEx
Company Page web Site
Kaeser Compressors Outside Back Cover
www.kaeser.com/CABP
Association of Energy Engineers
Inside Back Cover
www.energycongress.com
Atlas Copco Inside Front Cover
www.atlascopco.com
Hitachi 3 www.hitachi-america.us/ice/airtech
SPX Hankisoon 7 www.spx.com
BEKO Technologies 9 www.bekousa.com
JORC Industrial 11 www.jorc.com
Ingersoll Rand 13 www.ingersollrandproducts.com
Aerzen 15 www.aerzenusa.com
CDI Meters 17 www.cdimeters.com
BOGE Compressors 19 www.boge.com/us
Anest Iwata 21 www.anestiwata.com
Nano 23 n-psi.com
Aircom 25 www.aircom.us.com
VP Instruments 27 www.vpinstruments.com
Titus Air Systems 29 www.titusair.com
Sullivan Palatek 37 www.sullivanpalatek.com
Process Expo 43 www.myprocessexpo.com
0 7 / 1 3 |
47 airbestpractices.com
Columns

Subscribe at airbestpractices.com
2013 FOCUS INDUSTRIES:pp Energy: Biogas
pp Food Packaging & Containers
pp Plastic Blow Molding
pp System Assessments
pp Energy: Compressed Natural Gas
pp Pneumatic Conveying
pp Compressed Air System Automation
pp Wastewater Treatment
pp Food Processing
pp Metal Fabrication & Machining
pp Air Compressor Controls
F R E E S U B S C R I P T I O NDIGITAL EDITION FREE WORLDWIDE | PRINT EDITION FREE TO U.S. SUBSCRIBERS
Learn How To Save Energy & Improve Productivity In YOUR Industry!
T H E M A R K E T P L A C ET H E M A R K E T P L A C ET H E M A R K E T P L A C E
SaleS RepReSentative Dallas, TX
This position is responsible for driving market share growth of compressed air systems within key industries/markets in the North Texas and West Texas area with a large Dealer in West Texas. This includes quoting and strategizing, prospecting and developing relationships with key accounts to achieve revenue targets.
• Successfulcompressorsalesexperience is a must
• BachelorsDegreepreferred
• Fiveyearssalesexperience
• Excellentrelationship-buildingskills
http://careers.ingersollrand.com/
aiR CompReSSoR teChniCian
Field Service Air Compressor Tech for the Houston, Texas market.
Must be experienced and willing to travel including overseas.
Send resumes to Dennis DePauw, Danmar Industries,
email: [email protected], www.danmarind.com
Product Manager - Compressed Air Dryers
Parker Hannifi n Finite Airtek Filtration Division is inviting qualifi ed candidates to apply for the position of Product Manager-Air Dryers. Product Lines man-aged are sold under brands including Airtek, domnick hunter, Finite and Zander.This position is responsible for developing strategies to increase Division sales and profi ts while providing premier customer service to customers, distributors and fi eld sales people. Responsibilities include product development, competitor and market analysis, training, managing target market and account programs and strategic pricing.Qualifi cations: 4 year college degree, preferably in Engineering, Engineering Technology, Business or Related Business Management• 5+ years of experience in engineering or fi eld sales in related industry• Strong computer skills (Lotus Notes, Microsoft Offi ce Applications)• Strong verbal and written communication skills• Strong analytical skills Parker is an Equal Opportunity Employer (M/F/D/V)Please apply online at: https://parker.tms.hrdepartment.com/jobs/15005/Product-Sales-Manager-Compressed-Air-Dryers Lancaster-NY
JOBS
Contact Rod Smith for ad rates: [email protected], Tel: 412-980-9901
Compressed Air Best Practices® is published monthly by Smith Onandia Communications LLC., 217 Deer Meadow Drive, Pittsburgh, PA 15241. Phone 412-980-9902, email [email protected]. Compressed Air Best Practices® is a trademark of Smith Onandia Communications, LLC. Publisher cannot be held liable for non-delivery due to circumstances beyond its control. No refunds. Standard postage is paid at 233 Jefferson Street, Greenfield, Ohio 45123. Canadian and international distribution: IMEX International Mail Express, 1842 Brummel Drive, Elk Grove Village, IL 60007. POSTMASTER: Send address changes to Compressed Air Best Practices,® 217 Deer Meadow Drive, Pittsburgh, PA 15241. SUBSCRIPTIONS: Qualified reader subscriptions are accepted from compressed air professionals, plant managers, plant engineers, service and maintenance managers, operations managers, auditors, and energy engineers in manufacturing plants and engineering/consulting firms in the U.S. To apply for qualified reader subscriptions, please fill in the reader response cards herein and mail or fax or go to www.airbestpractices.com. To non-qualified subscribers subscriptions are $65 in Canada and $95 for other countries. When available, extra copies of back issues are $4 plus shipping. Contact Patricia Smith for subscription information at Tel: 412-980-9902 or email: [email protected]. REPRINTS: Reprints are available on a custom basis, contact Patricia Smith for a price quotation at Tel: 412-980-9902 or email: [email protected]. All rights are reserved. The contents of this publication may not be reproduced in whole or in part without consent of Smith Onandia Communications LLC. Smith Onandia Communications LLC. does not assume and hereby disclaims any liability to any person for any loss or damage caused by errors or omissions in the material contained herein, regardless of whether such errors result from negligence, accident, or any other cause whatsoever. Printed in the U.S.A.
COMPRESSED AIR BEST PRACTICES® w w w . a i r b e s t p r a c t i c e s . c o m
Advertising & : Editorial
Rod Smith [email protected] Tel: 412-980-9901
Subscriptions & : Administration
Patricia Smith [email protected] Tel: 412-980-9902
A Publication of : Smith Onandia Communications LLC 217 Deer Meadow Drive Pittsburgh, PA 15241
0 7 / 1 3 |
49 airbestpractices.com
Columns
T H E M A R K E T P L A C ET H E M A R K E T P L A C ET H E M A R K E T P L A C E
Rebuild all brands, makes, models of Air Ends, Blowers
and Gear Boxes
Sample of The PROS Company work.
Before & After
The PROS Company 601 Texas Avenue
Lubbock, Texas 79401 806-749-7761 (PRO1) www.thePROSco.com
• Dealdirectwiththemanufacturer
• ASMEcertified• Internalliners&externalfinishes
• Inventoryofpopularsizes
• Shipsfromourcentrallocation
1-800-925-0011www.TIGGtanks.com
high efficiency Compressor ControllersControl Rotary Screw, Vane, Scroll or Recip Compressors
Save Energy controlling up to FOUR compressors and qualify for Utility Rebates.
• Automatic Lead/Lag Control-up to FOUR Compressors
Accurate Pressure Control with Pressure Transducers
Compressors and Vacuum Pumps from 1 to 250 hp
Thousands of Installations Worldwide. Call for Application Engineering.
Standard Pneumatic Products, Inc. Tel: 203-270-1400 • Toll free: 800-979-9156 Email: [email protected]
www.stdpneumatics.com
www.n-psi.comExperience. Customer. Service... n-psi
“No other company would have taken the time you did to make it happen for me. You impressed me and my customer...thanks!”
– A new distributor in the Northeast
TECHNOLOGy
| 0 7 / 1 3
50 airbestpractices.com
Columns

presented by
white star corporate energy leaders
silver sponsor
bronze sponsors
green star corporate energy leader
blue star corporate energy leader
featuring
september 25 - 27, 2013 | washington convention center | washington, dc
WEEC celebrating its 36th year....The Association of Energy Engineers (AEE) is pleased to bring the World Energy Engineering Congress (WEEC) once again to Washington, DC for 2013. Now in its 36th year, the WEEC is well-recognized as the most important energy event of national and international scope for end users and energy professionals in all areas of the energy field. It is the one truly comprehensive forum where you can fully assess the “big picture” and see exactly how the economic and market forces, new technologies, regulatory developments and industry trends all merge to shape your critical decisions on your organization’s energy and economic future.
PROGRAM HIGHLIGHTS- 13 Track Conference Program- Expo Featuring New Technologies- Networking Reception - Awards Banquet - Legends in Energy Dinner Cruise- Seminars & Certifications- New Technologies Breakfast- Women in Energy Breakfast- Chapter Luncheon Networking- Keynote Luncheon- FREE Exhibit Hall Workshops- FREE Poster Sessions
w w w . e n e r g y c o n g r e s s . c o m | 7 7 0 . 4 4 7 . 5 0 8 3
“The buck stops here.”
COMPRESSORSka
eser
.co
m When it comes to service, Kaeser doesn’t pass the buck.
Everyone appreciates a company that stands behind its products – no matter what. That’s Kaeser.
We don’t just sell equipment. We help you design your system, install it, and service it. We can even monitor it for you. Our goals are the same as yours: effi cient compressed air systems you can rely on.
Innovative technology … ultra-reliable products … outstanding service. It’s no wonder Kaeser delivers the best value for the price! Contact us today to learn more about the powerful benefi ts of owning a Kaeser compressed air system.
— Harry S. Truman
Kaeser Compressors, Inc. • 866-516-6888 • kaeser.com/CABPBuilt for a lifetime is a trademark of Kaeser Compressors, Inc. ©2013 Kaeser Compressors, Inc. [email protected]
KCI 0142 Truman(CABP_4_2012.indd 1 5/30/2013 4:14:12 PM