Embed Size (px)
Citation preview
Renewable and Sustainable Energy Reviews 24 (2013) 473–482
Contents lists available at SciVerse ScienceDirect
Renewable and Sustainable Energy Reviews
1364-03http://d
n CorrE-m1 Te
journal homepage: www.elsevier.com/locate/rser
Policies to accelerate the growth of offshore wind energy sector in India
Swaminathan Mani n, Tarun Dhingra 1
University of Petroleum and Energy Studies (UPES), College of Management and Economics Studies, Energy Acres, PO Bidoli, Via Prem Nagar, Dehradun 248007, Uttarakhand, India
a r t i c l e i n f o
Article history:Received 20 June 2012Received in revised form5 March 2013Accepted 15 March 2013Available online 25 April 2013
Keywords:Offshore wind energy policy IndiaRenewable energy IndiaWind energy India
21/$ - see front matter & 2013 Elsevier Ltd. Ax.doi.org/10.1016/j.rser.2013.03.065
esponding author. Tel.: +91 998 904 7746; faxail addresses: [email protected],l.: +91 9837321447.
a b s t r a c t
India's power generation capacity needs to be augmented to, support the growing demands forelectricity. India, which has predominantly used fossil fuels to power its generators need to make aswitch to clean energy fuels. But renewable sources form a miniscule portion (26 GW,�12%) of India'soverall installed power capacity (210 GW). There is no contribution from offshore wind farms to theenergy basket for India, as there is no policy framework to encourage the development of offshore windfarms. Several European countries have tapped the offshore wind energy potential to reduce theirdependence on adopted by these countries to identify the core components (21 of them) of robust policyintervention. A detailed questionnaire was administered to 181 stakeholders of wind energy in India toseek their feedback on these building blocks. These core components (variables in research parlance) arethen subjected to factor analysis to understand the underlying structure of the variables. The factoranalysis logically reduces these 21 variables into five factors (Government support, fiscal and quota basedincentives, availability of local expertise, capital for investments and building an enabling R&Decosystem), which are then fed into a logistic regression model as ‘independent variables’ to predictthe probability of growth of offshore wind energy (dependent variable) in the country. The logisticregression model gives the weight (the impact) of these independent variables in influencing the growthof offshore wind energy in India. It emerges that government support, fiscal and quota based incentivesand building an enabling R&D ecosystem have a much higher impact on the growth of offshore windenergy for India. This paper fills the gap of absence of an empirically tested framework on offshore windenergy policy for India.
& 2013 Elsevier Ltd. All rights reserved.
Contents
1. Introduction . . . . . . . . . . . . . . . . . . . . . . . . . . . . . . . . . . . . . . . . . . . . . . . . . . . . . . . . . . . . . . . . . . . . . . . . . . . . . . . . . . . . . . . . . . . . . . . . . . . . . . . . 4741.1. Projections for power requirement for India . . . . . . . . . . . . . . . . . . . . . . . . . . . . . . . . . . . . . . . . . . . . . . . . . . . . . . . . . . . . . . . . . . . . . . . . 4741.2. Renewable scenario in India . . . . . . . . . . . . . . . . . . . . . . . . . . . . . . . . . . . . . . . . . . . . . . . . . . . . . . . . . . . . . . . . . . . . . . . . . . . . . . . . . . . . . 474
2. Review of literature . . . . . . . . . . . . . . . . . . . . . . . . . . . . . . . . . . . . . . . . . . . . . . . . . . . . . . . . . . . . . . . . . . . . . . . . . . . . . . . . . . . . . . . . . . . . . . . . . . 4752.1. Variables found from literature survey. . . . . . . . . . . . . . . . . . . . . . . . . . . . . . . . . . . . . . . . . . . . . . . . . . . . . . . . . . . . . . . . . . . . . . . . . . . . . 475
3. Methodology, data analysis and discussions . . . . . . . . . . . . . . . . . . . . . . . . . . . . . . . . . . . . . . . . . . . . . . . . . . . . . . . . . . . . . . . . . . . . . . . . . . . . . . 4763.1. Objectives of the study . . . . . . . . . . . . . . . . . . . . . . . . . . . . . . . . . . . . . . . . . . . . . . . . . . . . . . . . . . . . . . . . . . . . . . . . . . . . . . . . . . . . . . . . . 4763.2. Research question . . . . . . . . . . . . . . . . . . . . . . . . . . . . . . . . . . . . . . . . . . . . . . . . . . . . . . . . . . . . . . . . . . . . . . . . . . . . . . . . . . . . . . . . . . . . . 4763.3. Research model . . . . . . . . . . . . . . . . . . . . . . . . . . . . . . . . . . . . . . . . . . . . . . . . . . . . . . . . . . . . . . . . . . . . . . . . . . . . . . . . . . . . . . . . . . . . . . . 4763.4. Research methodology . . . . . . . . . . . . . . . . . . . . . . . . . . . . . . . . . . . . . . . . . . . . . . . . . . . . . . . . . . . . . . . . . . . . . . . . . . . . . . . . . . . . . . . . . 4763.5. Sampling . . . . . . . . . . . . . . . . . . . . . . . . . . . . . . . . . . . . . . . . . . . . . . . . . . . . . . . . . . . . . . . . . . . . . . . . . . . . . . . . . . . . . . . . . . . . . . . . . . . . 4763.6. Data collection . . . . . . . . . . . . . . . . . . . . . . . . . . . . . . . . . . . . . . . . . . . . . . . . . . . . . . . . . . . . . . . . . . . . . . . . . . . . . . . . . . . . . . . . . . . . . . . . 4763.7. Model for data analysis . . . . . . . . . . . . . . . . . . . . . . . . . . . . . . . . . . . . . . . . . . . . . . . . . . . . . . . . . . . . . . . . . . . . . . . . . . . . . . . . . . . . . . . . . 477
4. Conclusions . . . . . . . . . . . . . . . . . . . . . . . . . . . . . . . . . . . . . . . . . . . . . . . . . . . . . . . . . . . . . . . . . . . . . . . . . . . . . . . . . . . . . . . . . . . . . . . . . . . . . . . . 4804.1. Government support . . . . . . . . . . . . . . . . . . . . . . . . . . . . . . . . . . . . . . . . . . . . . . . . . . . . . . . . . . . . . . . . . . . . . . . . . . . . . . . . . . . . . . . . . . . 480
4.1.1. Faster approvals and single window clearance mechanisms for offshore wind energy projects . . . . . . . . . . . . . . . . . . . . . . . . . 4804.1.2. Sustainability of policies environment for longer term (10 years or more) . . . . . . . . . . . . . . . . . . . . . . . . . . . . . . . . . . . . . . . . . 4804.1.3. Constructing evacuation Infrastructure from the seas to the land . . . . . . . . . . . . . . . . . . . . . . . . . . . . . . . . . . . . . . . . . . . . . . . . 480
ll rights reserved.
: +91 135 [email protected] (S. Mani), [email protected] (T. Dhingra).
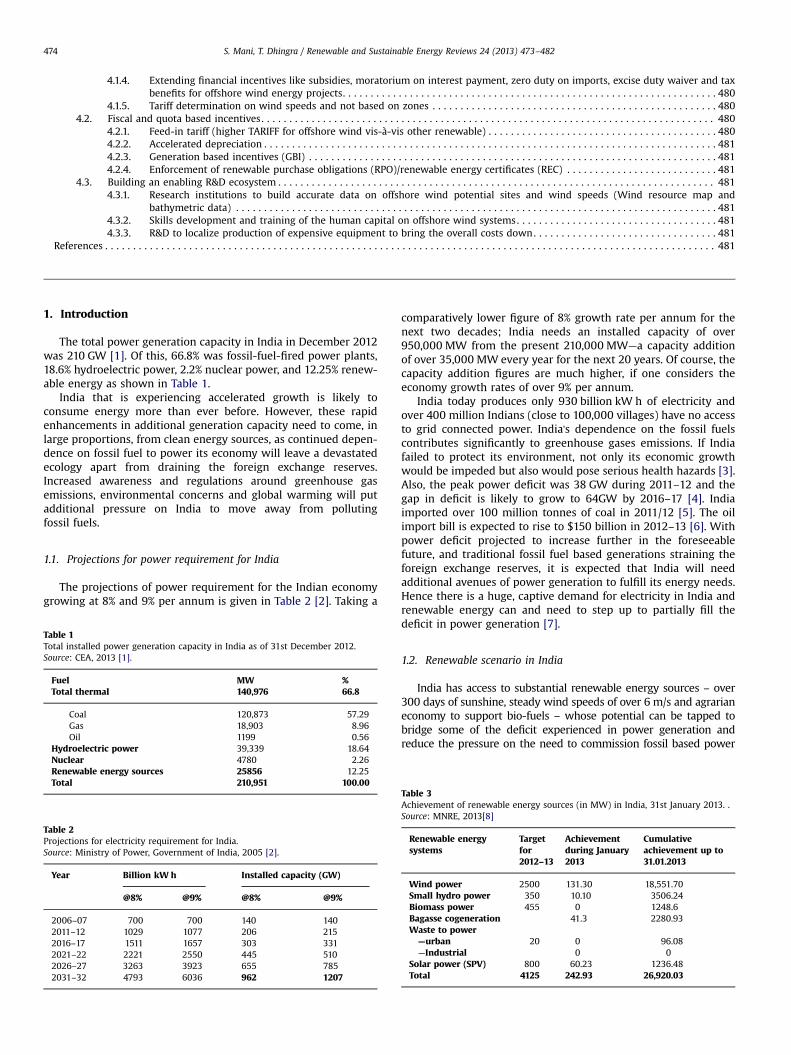
Table 1Total installed pSource: CEA, 20
FuelTotal therma
CoalGasOil
HydroelectriNuclearRenewable eTotal
Table 2Projections forSource: Ministr
Year
2006–072011–122016–172021–222026–272031–32
S. Mani, T. Dhingra / Renewable and Sustainable Energy Reviews 24 (2013) 473–482474
4.1.4. Extending financial incentives like subsidies, moratorium on interest payment, zero duty on imports, excise duty waiver and taxbenefits for offshore wind energy projects. . . . . . . . . . . . . . . . . . . . . . . . . . . . . . . . . . . . . . . . . . . . . . . . . . . . . . . . . . . . . . . . . . . 480
4.1.5. Tariff determination on wind speeds and not based on zones . . . . . . . . . . . . . . . . . . . . . . . . . . . . . . . . . . . . . . . . . . . . . . . . . . . 480
4.2. Fiscal and quota based incentives. . . . . . . . . . . . . . . . . . . . . . . . . . . . . . . . . . . . . . . . . . . . . . . . . . . . . . . . . . . . . . . . . . . . . . . . . . . . . . . . . 4804.2.1. Feed-in tariff (higher TARIFF for offshore wind vis-à-vis other renewable) . . . . . . . . . . . . . . . . . . . . . . . . . . . . . . . . . . . . . . . . . 4804.2.2. Accelerated depreciation . . . . . . . . . . . . . . . . . . . . . . . . . . . . . . . . . . . . . . . . . . . . . . . . . . . . . . . . . . . . . . . . . . . . . . . . . . . . . . . . . 4814.2.3. Generation based incentives (GBI) . . . . . . . . . . . . . . . . . . . . . . . . . . . . . . . . . . . . . . . . . . . . . . . . . . . . . . . . . . . . . . . . . . . . . . . . . 4814.2.4. Enforcement of renewable purchase obligations (RPO)/renewable energy certificates (REC) . . . . . . . . . . . . . . . . . . . . . . . . . . . 481
4.3. Building an enabling R&D ecosystem . . . . . . . . . . . . . . . . . . . . . . . . . . . . . . . . . . . . . . . . . . . . . . . . . . . . . . . . . . . . . . . . . . . . . . . . . . . . . . 481
4.3.1. Research institutions to build accurate data on offshore wind potential sites and wind speeds (Wind resource map andbathymetric data) . . . . . . . . . . . . . . . . . . . . . . . . . . . . . . . . . . . . . . . . . . . . . . . . . . . . . . . . . . . . . . . . . . . . . . . . . . . . . . . . . . . . . . 4814.3.2. Skills development and training of the human capital on offshore wind systems. . . . . . . . . . . . . . . . . . . . . . . . . . . . . . . . . . . . 4814.3.3. R&D to localize production of expensive equipment to bring the overall costs down. . . . . . . . . . . . . . . . . . . . . . . . . . . . . . . . . 481
References . . . . . . . . . . . . . . . . . . . . . . . . . . . . . . . . . . . . . . . . . . . . . . . . . . . . . . . . . . . . . . . . . . . . . . . . . . . . . . . . . . . . . . . . . . . . . . . . . . . . . . . . . . . . . 481
1. Introduction
The total power generation capacity in India in December 2012was 210 GW [1]. Of this, 66.8% was fossil-fuel-fired power plants,18.6% hydroelectric power, 2.2% nuclear power, and 12.25% renew-able energy as shown in Table 1.
India that is experiencing accelerated growth is likely toconsume energy more than ever before. However, these rapidenhancements in additional generation capacity need to come, inlarge proportions, from clean energy sources, as continued depen-dence on fossil fuel to power its economy will leave a devastatedecology apart from draining the foreign exchange reserves.Increased awareness and regulations around greenhouse gasemissions, environmental concerns and global warming will putadditional pressure on India to move away from pollutingfossil fuels.
1.1. Projections for power requirement for India
The projections of power requirement for the Indian economygrowing at 8% and 9% per annum is given in Table 2 [2]. Taking a
ower generation capacity in India as of 31st December 2012.13 [1].
MW %l 140,976 66.8
120,873 57.2918,903 8.961199 0.56
c power 39,339 18.644780 2.26
nergy sources 25856 12.25210,951 100.00
electricity requirement for India.y of Power, Government of India, 2005 [2].
Billion kW h Installed capacity (GW)
@8% @9% @8% @9%
700 700 140 1401029 1077 206 2151511 1657 303 3312221 2550 445 5103263 3923 655 7854793 6036 962 1207
comparatively lower figure of 8% growth rate per annum for thenext two decades; India needs an installed capacity of over950,000 MW from the present 210,000 MW—a capacity additionof over 35,000 MW every year for the next 20 years. Of course, thecapacity addition figures are much higher, if one considers theeconomy growth rates of over 9% per annum.
India today produces only 930 billion kW h of electricity andover 400 million Indians (close to 100,000 villages) have no accessto grid connected power. India's dependence on the fossil fuelscontributes significantly to greenhouse gases emissions. If Indiafailed to protect its environment, not only its economic growthwould be impeded but also would pose serious health hazards [3].Also, the peak power deficit was 38 GW during 2011–12 and thegap in deficit is likely to grow to 64GW by 2016–17 [4]. Indiaimported over 100 million tonnes of coal in 2011/12 [5]. The oilimport bill is expected to rise to $150 billion in 2012–13 [6]. Withpower deficit projected to increase further in the foreseeablefuture, and traditional fossil fuel based generations straining theforeign exchange reserves, it is expected that India will needadditional avenues of power generation to fulfill its energy needs.Hence there is a huge, captive demand for electricity in India andrenewable energy can and need to step up to partially fill thedeficit in power generation [7].
1.2. Renewable scenario in India
India has access to substantial renewable energy sources – over300 days of sunshine, steady wind speeds of over 6 m/s and agrarianeconomy to support bio-fuels – whose potential can be tapped tobridge some of the deficit experienced in power generation andreduce the pressure on the need to commission fossil based power
Table 3Achievement of renewable energy sources (in MW) in India, 31st January 2013. .Source: MNRE, 2013[8]
Renewable energysystems
Targetfor2012–13
Achievementduring January2013
Cumulativeachievement up to31.01.2013
Wind power 2500 131.30 18,551.70Small hydro power 350 10.10 3506.24Biomass power 455 0 1248.6Bagasse cogeneration 41.3 2280.93Waste to power
—urban 20 0 96.08—Industrial 0 0
Solar power (SPV) 800 60.23 1236.48Total 4125 242.93 26,920.03
Nomenclature
AD Accelerated depreciationCEA Central Electricity Authority, IndiaCERC Central Electricity Regulatory CommissionEPC Engineering, Procurement and ConstructionEU European UnionFiT Feed in tariffGBI Generation based incentiveGW giga watt (¼1000 mega watt)KMO Kaiser-Meyer-Olkin test
KW kilo wattKw h kilo-watt hour (1 unit of electricity)MNRE Ministry of New and Renewable Energy, Government
of IndiaMW mega watt (¼1000 kilo watt)REC Renewable energy certificatesR&D Research and developmentRPO Renewable purchase obligationSPSS Statistical package for the social sciences
(Software tool)TWhr terra-watt hour (Billion units of power)
S. Mani, T. Dhingra / Renewable and Sustainable Energy Reviews 24 (2013) 473–482 475
plants. Several proactive initiatives from the ministry, researchinstitutions, academia, private investments, thought leaders, financialinstitutions and project developers have resulted in India installingover 26,000 MW from clean energy sources in the overall powerinstalled capacity of 210,000 MW as of January 2013, which hascontributed to India becoming number 5 in the world, in terms ofinstalled wind energy capacity (Table 3) [8].
While, India has tapped most of the renewables sources forgenerating power, offshore wind energy has remained unexploitedas a potential avenue for power generation. India has over7000 Km of coastline, access to funds, technological knowhow,project management capabilities, economic need, captive marketand ecological compulsions to adopt offshore wind energy in anaccelerated manner [9].
Today, Europe is a world leader in adoption of offshore windenergy, which was due to several investor friendly policiesformulated by individual countries in Europe. India has similarexperience of proactive policies driving the growth ofonshore wind energy sector in the country. India has to build onthe success of its onshore wind energy experiences, while drawingthe right lessons from Europe, to grow its offshore wind energysector.
2. Review of literature
To power its impressive economic growth, India will need toincrease its generating capacity to over 300 GW by 2017 [10].Fossil fuel in the world is limited but most of the electrical energyhas been derived from fossil fuel and in the future world will facethe fuel crisis [11]. Sooner India moves into a renewables leadenergy generation economy; the better it would be for the overalldevelopment [12]. Meeting the growing energy demand based onthe current pattern of energy supply will become increasinglydifficult in view of the needs to keep emissions and crude oilimport bill low [13]. One of the reasons for the impressive growthof onshore wind energy is due to the proactive policies adopted bythe Government of India [14].
Haas et al. compare different promotion schemes for RES-Eworld-wide [15]. Huber et al. give a concise summary of differentdesign elements of renewable energy policy instruments forEurope [16]. Van der Linden et al. discuss the success of renewableenergy obligation support mechanisms in Europe and in the U.S[17]. Green and Vasilakos compare the policy support that existsfor offshore wind energy among a few European countries [18].Menanteau et al. have shown that a number of renewable energytechnologies have benefited, to varying degrees, from support ofincentive programs introduced [19]. Toke assesses the effective-ness of the UK's renewable obligation (RO) [20]. Cost reductionsand thereby greater adoption for offshore wind energy cannotmaterialize in the absence of any policy intervention [21]. Boyle
mentions that uncertainty of policy environment was one of thedeterrents to offshore wind development in the UK [22]. As perGutermuth the feed-in tariffs in operation in Germany, Denmarkand Spain have led to sustained development of wind power [23].Dinica examines the diffusion of renewable energy technologiesand the role of investors [24]. Mitchell compares the UK quotaobligation system with the German FIT system for policyeffectiveness [25]. Held and Ragwitz analyze the success ofpolicy strategies for the promotion renewable energy sources inthe EU [26].
Meyer analyses the major lessons learned from wind energypolicy in the EU [27]. Key drivers for the success of wind energyare various policy schemes that promote technology developmentand diffusion in countries such as Denmark, Germany and the UK[28]. As per Luthi and Prassler wind energy has achieved gridparity in locations with consistently strong winds, its growth hasbeen, due to supportive policies [29]. Esteban et al. gave adetailed comparison between the advantages and disadvantagesof onshore and offshore wind farms and concluded that offshorewind farms have immense potential for growth [30]. Toke dis-cusses about how British planning policy on offshore wind isunique vis-a-vis those adopted by other countries in Europe,which helped offshore growth in the UK [31]. Prassler andSchaechtele have shown how policy support instruments deter-mine the financial attractiveness of offshore wind farms in severalEuropean countries [32].
Usha Rao and Kishore revealed a strong correlation betweenthe diffusion parameters and the composite policy index forrenewable energy sources in India [33]. As per Goyal onshorewind power grew over 27% in India, when dedicated policies forrenewable energy were declared [34]. Schmid discusses about thepolicies that have been effective in the growth of renewableenergy power in India in nine states that were identified [35].Similar views on policies helping to accelerate the growth ofonshore wind energy in India have been made by Pillai andBanerjee [36] and Srinivasan S [37]. Hossain et al. have arguedthat the wind energy potential in India is considerably higher thanwhat was understood till now [38].
It is apparent from existing literature that offshore wind energysector grew when there were enabling policy environment. How-ever, there is no available literature on what could be the buildingblocks or basic elements of offshore wind energy policy for India.Also, no model is available for policy makers to empirically test theimpact of these policies on the growth of offshore wind energysector in India. This paper attempts to bridge this research gap.
2.1. Variables found from literature survey
The following superset of variables, as shown in Table 4, wasestablished from the literature survey that formed the buildingblocks of policy roadmap adopted by these countries [39].
Table 4Operating definitions of variables identified through literature survey [39].
S no. Components/Building blocks/Variables
1 Feed in tariffs (FiT): Feed in tariff is the rate at which the renewable energy developer will be paid by the utilities/distribution companies for every unit ofelectricity fed into the grid.
2 Accelerated depreciation (AD): Companies that are setting up a renewable energy projects can avail depreciation at higher rates (80% in the case of wind farms)in the first year of operation.
3 Generation based incentives (GBI): GBI is a bonus payment given per unit of power injected into the grid to the renewable energy generator, over and above theFiT system.
4 Legally enforceable RPO/REC: Renewable purchase obligation (RPO) mandates the distribution utilities to source a pre-decided quantity of electricity, usually aproportion of their supply, from renewable energy sources. Making this RPOs/REC legally enforceable will make it attractive for investors.
5 Faster approvals/Single window clearance: Providing single window clearances for setting up offshore wind energy projects will reduce the gestation period forproject go-live and also enhance the ease of doing business.
6 Continuity of policies for long term (more than 10 years): Continuity of policies for a long term (10 years or more) for predictability and stability in the policyenvironment.
7 Adequate evacuation infrastructure to transmit power from high seas: Availability of and access to transmission infrastructure/grid connectivity from theoffshore wind parks to onshore substations.
8 Tariff determination on wind speeds and not on zones: Specific tariff rates based on speed of the winds will help development of low wind speeds areas.9 Financial incentives like zero import duty, excise duty waiver: Offering financial incentives like waiver of custom duty, import duties exemptions, tax related
schemes for setting up of offshore wind parks.10 Availability of expert EPC contractors: Shortage of skilled resources to install offshore wind farms will invariably delays the commissioning of these farms
which then has an impact on cash flows and profitability.11 Availability of local manufacturing expertise for wind turbine: It is relatively inexpensive to source from domestic manufacturers compared to imports and it
also reduces the supply chain wait- time dependencies.12 Growth of ancillary units (eg Gear box): Similar to the availability of wind turbines locally, growth of ancillary units that are locally present will accelerate
reduction in costs of components thereby increasing adoption.13 Superior program execution skills of the developer: High quality program managers to supervise the installation and commissioning of offshore wind parks.14 Accurate data on offshore wind potential sites and wind speeds: The power output from a wind farm varies directly to the cube of the wind speeds and hence
impacts profitability. Hence, accurate data on offshore wind speeds is important to judge the financial attractiveness of the project.15 Skills development and training of human resources: Offshore wind energy project needs 20 people for every MW of capacity installed to manage the project.
Skills development and training of these resources is important to ensure smooth functioning of these offshore wind farms.16 Active research institutions working on offshore wind energy: Research institutions that focus on innovation and technology advancement of the offshore
wind sector components, research on advances in foundation engineering etc. are vital to accelerate the growth of the offshore sector.17 R&D facilities to localize production of expensive equipment: Growth of R&D facilities that work on finding ways to localize production of all components of
offshore wind equipment to reduce the overall costs of offshore wind farms.18 ‘Priority sector’ tag to offshore wind energy sector: Declaring offshore wind as a priority sector will help the sector access funds from banks at attractive rates
thereby increasing the attractiveness of the investments in offshore wind projects.19 Availability of capital at attractive rates of interest: If capital is made available at attractive rates, in the absence of priority sector tag - that would help reduce
the overall debt servicing burden for the offshore wind energy project developers.20 Creation of offshore wind energy fund to reduce cost of capital: Creation of offshore wind energy fund, using the cess levied on coal and other fossil fuels, and
using the accrual to lend to offshore wind energy projects will ease the burden on the developers.21 Moratorium on interest payments for the first 5 years of project go-live: The offshore wind project developers being offered a 5 year moratorium on interest
payment after the project goes-live will help in de-risking the investment from the vagaries of learning curve, which is inevitable in any project with large capitalinvestments.
S. Mani, T. Dhingra / Renewable and Sustainable Energy Reviews 24 (2013) 473–482476
3. Methodology, data analysis and discussions
3.1. Objectives of the study
To develop and empirically test a model of constituents ofeffective offshore wind energy policy for India.
3.2. Research question
What are the factors that can contribute to the growth ofoffshore wind energy sector in India?
3.3. Research model
The research model used in the analysis is quantitative model, asthe nature of the study and the audience of the study, requires the useof an objective, experimental research model. In this study, data iscollected quantitatively using instrument (questionnaire), analyzedusing statistical procedures to understand the relationship among thevariables to judge the impact of independent variables on the depen-dent variable. Hence quantitative research model is used in this study.
3.4. Research methodology
As the present research work involved identifying vari-ables of the study, framing of research model, testing of
hypotheses, validity and reliability of the instrument apartfrom extensive use of statistical tools to arrive at the conclu-sion, quantitative approach to research design and methodswas concluded as the appropriate methodology to adopt forthis research.
3.5. Sampling
Proportionate stratified sampling was used during the datacollection process. The population was divided into different strata(policymakers, academia, wind turbine manufacturers, associationmembers) and number of elements from each stratum, in relationto its proposition in the total population, was selected as shown inFig. 1. [40]
Sample size—the questionnaire was administered to 240respondents but some of the responses received were incomplete.So, those who submitted incomplete questionnaire were removedfrom the list. Finally, 181 respondents were found to have sub-mitted their responses that were complete in all respects—aresponse rate of 60% were achieved which is acceptable [41].
3.6. Data collection
Data collection from primary sources was predominantlyconducted through structured interview method using a ques-tionnaire. The validity and reliability of the questionnaire was
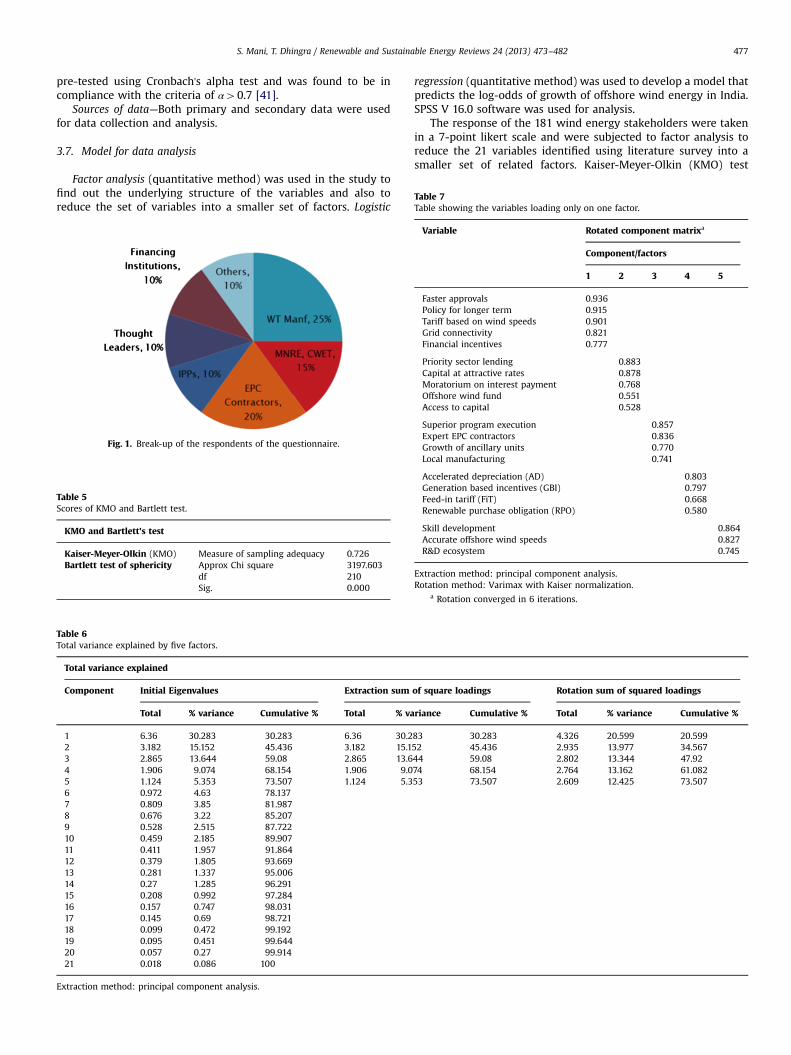
Table 7Table showing the variables loading only on one factor.
S. Mani, T. Dhingra / Renewable and Sustainable Energy Reviews 24 (2013) 473–482 477
pre-tested using Cronbach's alpha test and was found to be incompliance with the criteria of α40.7 [41].
Sources of data—Both primary and secondary data were usedfor data collection and analysis.
3.7. Model for data analysis
Factor analysis (quantitative method) was used in the study tofind out the underlying structure of the variables and also toreduce the set of variables into a smaller set of factors. Logistic
Fig. 1. Break-up of the respondents of the questionnaire.
Table 5Scores of KMO and Bartlett test.
KMO and Bartlett's test
Kaiser-Meyer-Olkin (KMO) Measure of sampling adequacy 0.726Bartlett test of sphericity Approx Chi square 3197.603
df 210Sig. 0.000
Table 6Total variance explained by five factors.
Total variance explained
Component Initial Eigenvalues Extraction sum
Total % variance Cumulative % Total % va
1 6.36 30.283 30.283 6.36 30.22 3.182 15.152 45.436 3.182 15.13 2.865 13.644 59.08 2.865 13.64 1.906 9.074 68.154 1.906 9.05 1.124 5.353 73.507 1.124 5.36 0.972 4.63 78.1377 0.809 3.85 81.9878 0.676 3.22 85.2079 0.528 2.515 87.72210 0.459 2.185 89.90711 0.411 1.957 91.86412 0.379 1.805 93.66913 0.281 1.337 95.00614 0.27 1.285 96.29115 0.208 0.992 97.28416 0.157 0.747 98.03117 0.145 0.69 98.72118 0.099 0.472 99.19219 0.095 0.451 99.64420 0.057 0.27 99.91421 0.018 0.086 100
Extraction method: principal component analysis.
regression (quantitative method) was used to develop a model thatpredicts the log-odds of growth of offshore wind energy in India.SPSS V 16.0 software was used for analysis.
The response of the 181 wind energy stakeholders were takenin a 7-point likert scale and were subjected to factor analysis toreduce the 21 variables identified using literature survey into asmaller set of related factors. Kaiser-Meyer-Olkin (KMO) test
of square loadings Rotation sum of squared loadings
riance Cumulative % Total % variance Cumulative %
83 30.283 4.326 20.599 20.59952 45.436 2.935 13.977 34.56744 59.08 2.802 13.344 47.9274 68.154 2.764 13.162 61.08253 73.507 2.609 12.425 73.507
Variable Rotated component matrixa
Component/factors
1 2 3 4 5
Faster approvals 0.936Policy for longer term 0.915Tariff based on wind speeds 0.901Grid connectivity 0.821Financial incentives 0.777
Priority sector lending 0.883Capital at attractive rates 0.878Moratorium on interest payment 0.768Offshore wind fund 0.551Access to capital 0.528
Superior program execution 0.857Expert EPC contractors 0.836Growth of ancillary units 0.770Local manufacturing 0.741
Accelerated depreciation (AD) 0.803Generation based incentives (GBI) 0.797Feed-in tariff (FiT) 0.668Renewable purchase obligation (RPO) 0.580
Skill development 0.864Accurate offshore wind speeds 0.827R&D ecosystem 0.745
Extraction method: principal component analysis.Rotation method: Varimax with Kaiser normalization.
a Rotation converged in 6 iterations.
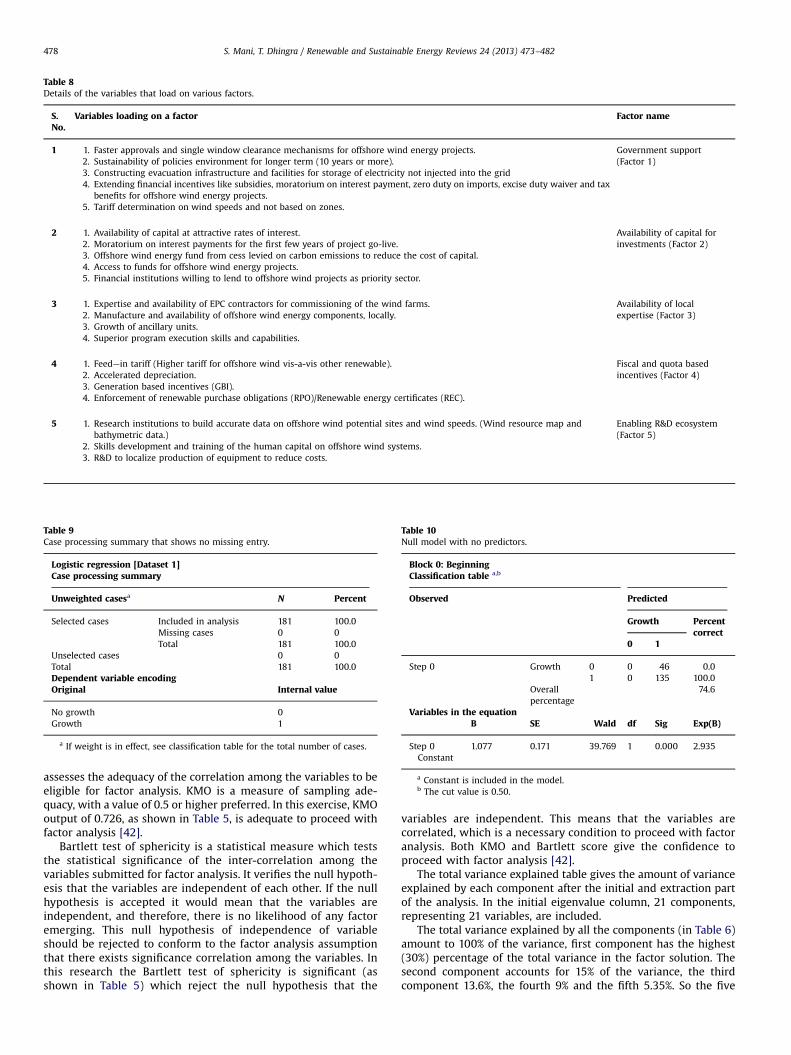
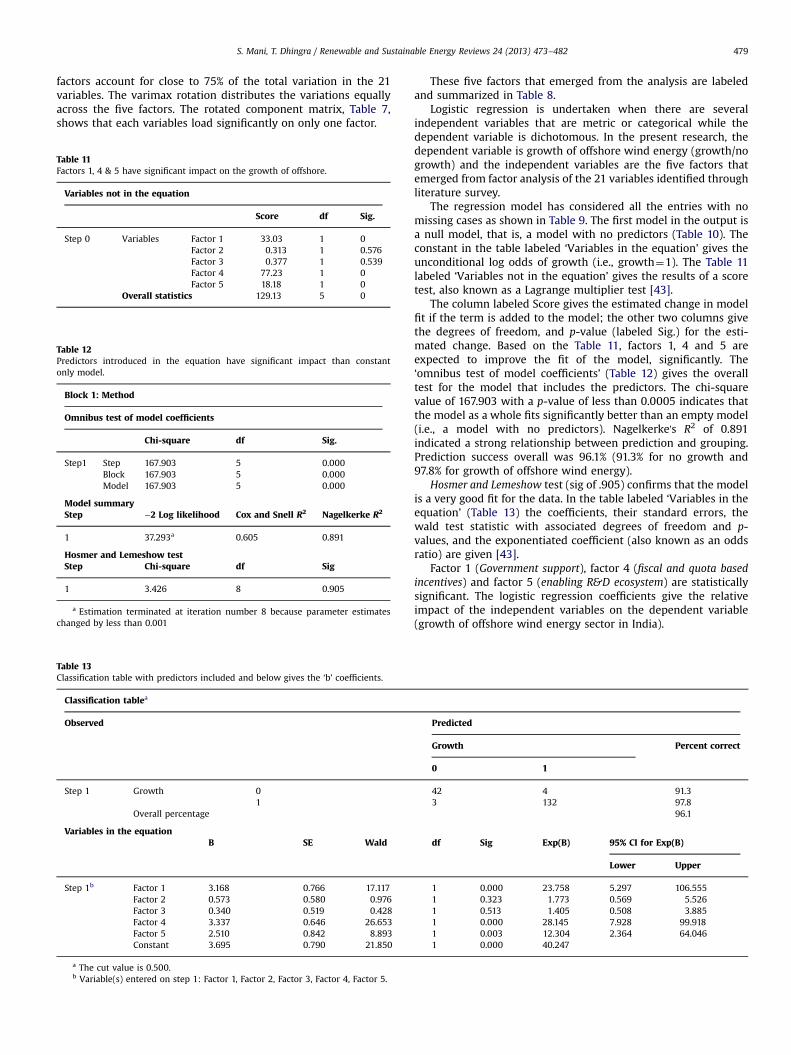
Table 8Details of the variables that load on various factors.
S.No.
Variables loading on a factor Factor name
1 1. Faster approvals and single window clearance mechanisms for offshore wind energy projects.2. Sustainability of policies environment for longer term (10 years or more).3. Constructing evacuation infrastructure and facilities for storage of electricity not injected into the grid4. Extending financial incentives like subsidies, moratorium on interest payment, zero duty on imports, excise duty waiver and tax
benefits for offshore wind energy projects.5. Tariff determination on wind speeds and not based on zones.
Government support(Factor 1)
2 1. Availability of capital at attractive rates of interest.2. Moratorium on interest payments for the first few years of project go-live.3. Offshore wind energy fund from cess levied on carbon emissions to reduce the cost of capital.4. Access to funds for offshore wind energy projects.5. Financial institutions willing to lend to offshore wind projects as priority sector.
Availability of capital forinvestments (Factor 2)
3 1. Expertise and availability of EPC contractors for commissioning of the wind farms.2. Manufacture and availability of offshore wind energy components, locally.3. Growth of ancillary units.4. Superior program execution skills and capabilities.
Availability of localexpertise (Factor 3)
4 1. Feed—in tariff (Higher tariff for offshore wind vis-a-vis other renewable).2. Accelerated depreciation.3. Generation based incentives (GBI).4. Enforcement of renewable purchase obligations (RPO)/Renewable energy certificates (REC).
Fiscal and quota basedincentives (Factor 4)
5 1. Research institutions to build accurate data on offshore wind potential sites and wind speeds. (Wind resource map andbathymetric data.)
2. Skills development and training of the human capital on offshore wind systems.3. R&D to localize production of equipment to reduce costs.
Enabling R&D ecosystem(Factor 5)
Table 9Case processing summary that shows no missing entry.
Logistic regression [Dataset 1]Case processing summary
Unweighted casesa N Percent
Selected cases Included in analysis 181 100.0Missing cases 0 0Total 181 100.0
Unselected cases 0 0Total 181 100.0Dependent variable encodingOriginal Internal value
No growth 0Growth 1
a If weight is in effect, see classification table for the total number of cases.
Table 10Null model with no predictors.
Block 0: BeginningClassification table a,b
Observed Predicted
Growth Percentcorrect
0 1
Step 0 Growth 0 0 46 0.01 0 135 100.0
Overallpercentage
74.6
Variables in the equationB SE Wald df Sig Exp(B)
Step 0Constant
1.077 0.171 39.769 1 0.000 2.935
a Constant is included in the model.b The cut value is 0.50.
S. Mani, T. Dhingra / Renewable and Sustainable Energy Reviews 24 (2013) 473–482478
assesses the adequacy of the correlation among the variables to beeligible for factor analysis. KMO is a measure of sampling ade-quacy, with a value of 0.5 or higher preferred. In this exercise, KMOoutput of 0.726, as shown in Table 5, is adequate to proceed withfactor analysis [42].
Bartlett test of sphericity is a statistical measure which teststhe statistical significance of the inter-correlation among thevariables submitted for factor analysis. It verifies the null hypoth-esis that the variables are independent of each other. If the nullhypothesis is accepted it would mean that the variables areindependent, and therefore, there is no likelihood of any factoremerging. This null hypothesis of independence of variableshould be rejected to conform to the factor analysis assumptionthat there exists significance correlation among the variables. Inthis research the Bartlett test of sphericity is significant (asshown in Table 5) which reject the null hypothesis that the
variables are independent. This means that the variables arecorrelated, which is a necessary condition to proceed with factoranalysis. Both KMO and Bartlett score give the confidence toproceed with factor analysis [42].
The total variance explained table gives the amount of varianceexplained by each component after the initial and extraction partof the analysis. In the initial eigenvalue column, 21 components,representing 21 variables, are included.
The total variance explained by all the components (in Table 6)amount to 100% of the variance, first component has the highest(30%) percentage of the total variance in the factor solution. Thesecond component accounts for 15% of the variance, the thirdcomponent 13.6%, the fourth 9% and the fifth 5.35%. So the five
S. Mani, T. Dhingra / Renewable and Sustainable Energy Reviews 24 (2013) 473–482 479
factors account for close to 75% of the total variation in the 21variables. The varimax rotation distributes the variations equallyacross the five factors. The rotated component matrix, Table 7,shows that each variables load significantly on only one factor.
Table 11Factors 1, 4 & 5 have significant impact on the growth of offshore.
Variables not in the equation
Score df Sig.
Step 0 Variables Factor 1 33.03 1 0Factor 2 0.313 1 0.576Factor 3 0.377 1 0.539Factor 4 77.23 1 0Factor 5 18.18 1 0
Overall statistics 129.13 5 0
Table 12Predictors introduced in the equation have significant impact than constantonly model.
Block 1: Method
Omnibus test of model coefficients
Chi-square df Sig.
Step1 Step 167.903 5 0.000Block 167.903 5 0.000Model 167.903 5 0.000
Model summaryStep −2 Log likelihood Cox and Snell R2 Nagelkerke R2
1 37.293a 0.605 0.891
Hosmer and Lemeshow testStep Chi-square df Sig
1 3.426 8 0.905
a Estimation terminated at iteration number 8 because parameter estimateschanged by less than 0.001
Table 13Classification table with predictors included and below gives the ‘b’ coefficients.
Classification tablea
Observed
Step 1 Growth 01
Overall percentage
Variables in the equationB SE Wald
Step 1b Factor 1 3.168 0.766 17.117Factor 2 0.573 0.580 0.976Factor 3 0.340 0.519 0.428Factor 4 3.337 0.646 26.653Factor 5 2.510 0.842 8.893Constant 3.695 0.790 21.850
a The cut value is 0.500.b Variable(s) entered on step 1: Factor 1, Factor 2, Factor 3, Factor 4, Factor 5.
These five factors that emerged from the analysis are labeledand summarized in Table 8.
Logistic regression is undertaken when there are severalindependent variables that are metric or categorical while thedependent variable is dichotomous. In the present research, thedependent variable is growth of offshore wind energy (growth/nogrowth) and the independent variables are the five factors thatemerged from factor analysis of the 21 variables identified throughliterature survey.
The regression model has considered all the entries with nomissing cases as shown in Table 9. The first model in the output isa null model, that is, a model with no predictors (Table 10). Theconstant in the table labeled ‘Variables in the equation’ gives theunconditional log odds of growth (i.e., growth¼1). The Table 11labeled ‘Variables not in the equation’ gives the results of a scoretest, also known as a Lagrange multiplier test [43].
The column labeled Score gives the estimated change in modelfit if the term is added to the model; the other two columns givethe degrees of freedom, and p-value (labeled Sig.) for the esti-mated change. Based on the Table 11, factors 1, 4 and 5 areexpected to improve the fit of the model, significantly. The‘omnibus test of model coefficients’ (Table 12) gives the overalltest for the model that includes the predictors. The chi-squarevalue of 167.903 with a p-value of less than 0.0005 indicates thatthe model as a whole fits significantly better than an empty model(i.e., a model with no predictors). Nagelkerke's R2 of 0.891indicated a strong relationship between prediction and grouping.Prediction success overall was 96.1% (91.3% for no growth and97.8% for growth of offshore wind energy).
Hosmer and Lemeshow test (sig of .905) confirms that the modelis a very good fit for the data. In the table labeled ‘Variables in theequation’ (Table 13) the coefficients, their standard errors, thewald test statistic with associated degrees of freedom and p-values, and the exponentiated coefficient (also known as an oddsratio) are given [43].
Factor 1 (Government support), factor 4 (fiscal and quota basedincentives) and factor 5 (enabling R&D ecosystem) are statisticallysignificant. The logistic regression coefficients give the relativeimpact of the independent variables on the dependent variable(growth of offshore wind energy sector in India).
Predicted
Growth Percent correct
0 1
42 4 91.33 132 97.8
96.1
df Sig Exp(B) 95% CI for Exp(B)
Lower Upper
1 0.000 23.758 5.297 106.5551 0.323 1.773 0.569 5.5261 0.513 1.405 0.508 3.8851 0.000 28.145 7.928 99.9181 0.003 12.304 2.364 64.0461 0.000 40.247
S. Mani, T. Dhingra / Renewable and Sustainable Energy Reviews 24 (2013) 473–482480
Logistic regression equation that gives the growth of offshorewind energy in India will be
Logðp=1−pÞ ¼ 3:695þ 3:168F1 þ 0:573F2 þ 0:340F33 þ 3:337F4þ2:510F5
Government support (F1), fiscal and quota based incentives (F4)and enabling R&D ecosystem (F5) have high impact on the growthof offshore wind energy in India.
Probability of growth of offshore Wind energy in India
¼ ef3:695þ 3:168F1 þ 0:573F2 þ 0:340F3 þ 3:337F4 þ 2:510F5g1þ ef3:695þ 3:168F1 þ 0:573F2 þ 0:340F3 þ 3:337F4 þ 2:510F5g
Thus, the logistic regression analysis conducted to predict thegrowth of offshore wind energy in India using Governmentsupport, fiscal and quota based incentives, availability of localexpertise, enabling R&D ecosystem and availability of capital forinvestments as predictors shows significant contribution fromGovernment support, fiscal incentives and R&D ecosystem towardthe growth of offshore wind energy sector in India. These threelevers should be the focus of policy makers in India to proliferatethe growth of offshore wind farms in the country.
4. Conclusions
India needs every avenue of energy source to power itseconomy. Offshore wind energy is an untapped source. The factorsthat impact the growth of offshore wind energy in India broadlycover Government support, fiscal and quota based incentives, avail-ability of local expertise, capital for investments and building anenabling R&D ecosystem (the various factors that emerged from theanalysis). However, three among the five; Government support,fiscal and quota based incentives and building an enabling R&Decosystem have a much higher impact on the growth of offshorewind energy for India and hence needs to be the area of focus.
4.1. Government support
The following variables loaded on the factor called Governmentsupport. Policy makers need to focus on
4.1.1. Faster approvals and single window clearance mechanisms foroffshore wind energy projects
There are several ministries or departments in India that needsto be approached to obtain consent by the developers of offshorewind energy projects. Such cumbersome procedures will delay thecommissioning of these projects, resulting in substantial cost andtime overruns, which could not be afforded by developers.Expecting a project developer to obtain these approvals frommultiple agencies will be a daunting, show-stopper experience.Hence, it is important to provide a single window clearance foroffshore wind energy projects. Similar facilities are available tooffshore wind energy developers in Europe, which has signifi-cantly benefitted the project developers.
4.1.2. Sustainability of policies environment for longer term (10 yearsor more)
Policy continuity for long term gives the investors assurance ofsupport from the government for the sector; thereby reducingthe risk of future cash flows. Uncertainties in continuation ofbenefits have slowed down investments in several countries likeNetherlands in Europe. Even in India, when accelerated deprecia-tion (AD) for onshore wind energy projects was withdrawn,investments have slowed down. Now project developers in Indianot only want accelerated depreciation to be re-introduced butalso want an assurance from the government that such fiscal
benefits will continue for long term; to make further investmentsin the onshore wind energy sector.
4.1.3. Constructing evacuation Infrastructure from the seas to theland
Several research papers have concluded that availability ofevacuation infrastructure is one of the most important criteriafor growth of offshore wind energy in any country. Also, transmis-sion infrastructure costs are quite high for offshore wind farms, assub-sea cabling requires superior engineering skills. Researchconducted by independent agencies suggest that investors preferthe Denmark model of, government fully contributing to thebuilding of transmission infrastructure while recovering the costsfrom the public via a small increase in tariff. Similar model(‘Socialising the costs’) can be thought of in India, as the capitalinvestments needed for setting up offshore wind energy farms areprohibitive vis-à-vis other renewable energy technologies. So, aproject developer will not be able to bear the additional costs ofbuilding the evacuation system as well.
4.1.4. Extending financial incentives like subsidies, moratorium oninterest payment, zero duty on imports, excise duty waiver and taxbenefits for offshore wind energy projects
Offshore wind energy sector in India can be declared as a‘priority sector’ by the Government to help developers' accessinexpensive bank loans. A priority sector tag, similar to what isgiven to agriculture, will entail an interest rate of 2% for loans fromthe banks. Presently, the interest rates are around 12% on the sumadvanced for renewable energy projects in the country. As 1 MWof offshore wind farm is likely to cost US$ 3 Million, projectdevelopers will find it hard-pressed to service loans at higherrates of interest. Hence, declaring offshore wind as a priority sectorwill ease a huge amount of burden on project developers andencourage them to take debt on their balance sheets. Cost ofcapital can also be reduced by levying a cess on fossil fuels andusing the sum collected to partly fund offshore wind energyprojects in India. Moratorium on interest payments for a periodof minimum 5 years was another expectation from the projectdevelopers to invest in offshore wind sector in India. Apart fromthese the Government needs to extend the same benefits given toonshore wind energy sector; to offshore wind sector as well – interms of zero import duty on equipment and excise duty waiversto kick start the growth of the sector.
4.1.5. Tariff determination on wind speeds and not based on zonesIf tariffs are determined on wind speeds – regions with lower
wind speeds getting a higher tariff for electricity generated fromthat area vis-à-vis tariffs from higher wind speed regions – thensites with low wind speeds will also witness investments fromproject developers, resulting in a secular development of thesector as a whole. Else, one may witness a rush of investmentsto regions with higher wind speeds and none for those with lowwind speeds.
4.2. Fiscal and quota based incentives
The following variables load on the factor called fiscal andquota based incentive. Policy makers need to focus on.
4.2.1. Feed-in tariff (higher TARIFF for offshore wind vis-à-vis otherrenewable)
All the project developers surveyed for this research haveexpressed their views that offshore wind energy in India wouldneed a higher incentive (higher Feed-in tariff vis-à-vis otherrenewable as adopted by Germany), higher renewable obligation
S. Mani, T. Dhingra / Renewable and Sustainable Energy Reviews 24 (2013) 473–482 481
certificates (for example 2 ROCs for every 1 MW h of offshore windenergy as adopted by the UK) at least in the initial few years to beestablished as another avenue for electricity generation.
4.2.2. Accelerated depreciationCompanies that are setting up a renewable energy projects in
India can avail depreciation at higher rates (80% in the case ofwind farms) during the first year of operation. This policy has beendiscontinued recently for onshore wind farms in India, whichresulted in reduced flow of investments to the sector. Accelerateddepreciation can be re-introduced to promote the growth ofoffshore wind energy sector in the country.
4.2.3. Generation based incentives (GBI)GBI is a bonus payment given per KW h of power injected into
the grid to the renewable energy generator, over and above theFeed-in-tariff (FiT) system. GBI with a generous cap of (10% thecost of project) over the life of project can be considered.
4.2.4. Enforcement of renewable purchase obligations (RPO)/renewable energy certificates (REC)
RPO and REC mechanism are market based mechanisms thatgive superior returns to the project developers, as these certifi-cates are traded in the power exchanges. However, in India theseRPO obligations are not mandatory to be met by the distributioncompanies. So, utilities find ways to circumvent the RPO rules.Enforcement of RPO/REC mechanism will give offshore windenergy project developers the required confidence that theirinvestments are safe.
4.3. Building an enabling R&D ecosystem
The following variables load on the factor called building anenabling R&D ecosystem. Policy makers need to focus on
4.3.1. Research institutions to build accurate data on offshore windpotential sites and wind speeds (Wind resource map and bathymetricdata)
India needs research institutions to build bankable data onwind speeds at the seas, to predict the exact potential of offshorewind energy. Wind speeds are very critical to estimate the poweroutput of the offshore wind farms, which decides the cash flowsand hence the viability of the project. As the power output variesdirectly to the cube of the wind speeds, even a minor variation inestimating the wind speeds may results in huge deviation in thepower output of the offshore wind farms and hence the cash flows.
4.3.2. Skills development and training of the human capital onoffshore wind systems
Offshore wind energy projects generate much needed employ-ment opportunities for the people. Research suggests that offshorewind energy projects can generate an average of 20 jobs per MWincluding both direct and indirect jobs. Almost 1 million jobs canbe created through offshore wind farms in the next few years—assuming a target of 50,000 MW of power generation from off-shore wind farms. Indian policy makers need to build the ecosys-tems of institutions to impart skill training to the people to enablethem to be employable in the offshore wind energy sector.
4.3.3. R&D to localize production of expensive equipment to bringthe overall costs down
India needs to encourage R&D efforts to accelerate learning,bring down the costs of components, build knowledge base,develop skills in offshore wind farms and localize production ofwind turbines. Detailed policies to encourage R&D are needed.
To conclude, five levers were identified that enable the growthof offshore wind energy in India. Out of these five, three levers;government support, fiscal and quota based incentives and enablingR&D ecosystem were recognized as the key components to besupported, as they had the highest impact on the growth ofoffshore wind energy in the country. However, the other twolevers; availability of local expertise and capital for investments alsopositively impact the growth of offshore wind energy in thecountry and hence cannot be ignored. But if the policy makersfocus on the three factors and their sub-elements, it will ensurethat offshore wind farms takes off in a substantial manner in India.This sector will be an additional power generation avenue for Indiawhich has been hitherto untapped. If done judiciously, offshorewind energy will go a long way to satiate the ever growingdemand for energy from an emergent India. The core objectiveof this research was to develop and empirically test a model ofconstituents of effective offshore wind energy policy for India,apart from identifying the factors that can contribute to thegrowth of offshore wind energy sector in India. Both theseobjectives have been discussed in detail in this paper.
References
[1] Central Electricity Authority (CEA), Government of India reports; 2013. ⟨http://www.cea.nic.in/⟩ [Last accessed January 2013].
[2] Ministry of Power, Government of India (GoI). Annual reports 2000–2010.India, New Delhi; 2013. ⟨http://powermin.nic.in/⟩ [Last accessed January 2013].
[3] Pode R. Addressing India's energy security and options for decreasing energydependency. Renewable and Sustainable Energy Reviews 2010;14(9):3014–22.
[4] Central Electricity Regulatory Commission (CERC), Government of India; 2013.⟨http://www.cercind.gov.in⟩ [Last accessed January 2013].
[5] Ministry of Coal, Government of India; 2012. ⟨http://www.coal.nic.in/⟩ [Lastaccessed December 2012].
[6] Ministry of Petroleum and Natural Gases, Government of India; 2012 ⟨http://petroleum.nic.in/⟩ [Last accessed December 2012].
[7] Mani S, Dhingra T. Offshore wind energy policy for India. Paper presented atDoctoral colloquium. Indian Institute of Management (IIM) Ahmedabad; 2012.
[8] Ministry of New and Renewable Energy (MNRE) , Government of India; 2010,2011, 2012. ⟨http://mnre.gov.in/⟩.
[9] Mani S, Dhingra T. Building blocks of the Offshore Wind Energy Policy forIndia. Renewable Energy world, International conference, New Delhi; 2012.
[10] Planning Commission of India. Government of India. Annual Reports; 2010–2009. ⟨http://planningcommission.nic.in/⟩.
[11] Saidur R, Islam NR, Rahim NA, Solangi. KH. A review on global wind energypolicy. Renewable and Sustainable Energy Reviews 2010;14(7):1744–62.
[12] Mani S, Dhingra T. Core components of offshore wind energy policy for India.Reaction 2012. International conference by Energy Alternatives India, Chen-nai; 2012.
[13] National Action Plan for Climate Change (NAPCC); 2012. www.indiaclimateportal.org/ [Last Accessed November 2012].
[14] World Bank Report : Energy Poverty in Rural and Urban India – Are the EnergyPoor Also Income Poor? – Policy Research Working Paper 5463; 2010.
[15] Haas R, Meyer NI, Held A, Finon D, Lorenzoni A, Wiser R, et al. Promotingelectricity from renewable energy sources—lessons learned from the EU, U.S.and Japan. In: Sioshansi FP, editor. Electricity market reforms. ElsevierPublishers; 2007.
[16] Huber C, Faber T, Haas R, Resch G, Green J, Ölz S., et al. Action plan for derivingdynamic RES-E policies—report of the project Green-X; 2004.
[17] Van der Linden NH, Uyterlinde MA, Vrolijk L, Nilsson J, Khan K, Astrand K.,et al. Review of international experience with renewable energy obligationsupport mechanisms. Netherlands: Petten; 2005. ECN-C-05-025.
[18] Green Richard, Vasilakos Nicholas. The economics of offshore wind. EnergyPolicy 2011;39(2):496–502.
[19] Menanteau Philippe, Finon Dominique, Lamy Marie-Laure. Prices versusquantities: choosing policies for promoting the development of renewableenergy. Energy Policy 2003;31(8):799–812.
[20] Toke, Politics by heuristics—policy networks with a focus on actor resources,as illustrated by the case of renewable energy policy under New Labour, PublicAdministration; 2010.
[21] Kolev, A, Riess, A, 2007.Environmental and technology externalities: policyand investment implications, European Investment Bank (EIB),An efficient,sustainable and secure supply of energy for Europe. Meeting the challenge, EIBPapers, vol.12 (2), p.135–162.
[22] Boyle G. Offshore Wind: the Potential to Contribute a Quarter of UK Electricityby 2024. Wind Engineering 2007;31(2):65–74.
[23] Gutermuth P-G. Regulatory and institutional measures by the state to enhancethe deployment of renewable energies: German experiences. Solar Energy2000;69(3):205–13.
S. Mani, T. Dhingra / Renewable and Sustainable Energy Reviews 24 (2013) 473–482482
[24] Dinica V. Support systems for the diffusion of renewable energy technologies—an investor perspective. Energy Policy 2006;34(4):461–80.
[25] Mitchell C, Bauknecht D, Connor PM. Effectiveness through risk reduction: acomparison of the renewable obligation in England and Wales and the feed-insystem in Germany. Energy Policy 2006;34(3):297–305.
[26] Held A, Haas R, Ragwitz M. On the success of policy strategies for thepromotion of electricity from renewable energy sources in the EU. Energyand Environment 2006;17(6):849–68.
[27] Meyer NI. Learning fromwind energy policy in the EU: lessons from Denmark,Sweden and Spain. European Environment; forthcoming.
[28] Lewis Joanna, Wiser Ryan. Fostering a renewable energy technology industry:an international comparison of wind industry policy support mechanisms.Energy Policy 2007;35(3):1844–57.
[29] Luthi Sonja, Prassler Thomas. Analyzing policy support instruments andregulatory risk factors for wind energy deployment—A developers' perspec-tive. Energy Policy 2011;39(9):4876–92.
[30] Esteban MDolores, Diez J, Javier López, Jose S, Negro Vicente. Why offshorewind energy? Renewable Energy 2011;36(2):444–50.
[31] Toke D. The UK offshore wind power programme: a sea-change in UK energypolicy? Energy Policy 2011;39(2):526–34.
[32] Prassler T, Schaechtele J. Comparison of the financial attractiveness amongprospective offshore wind parks in selected European countries. Energy Policy2012. http://dx.doi.org/10.1016/j.enpol.2012.01.062.
[33] Usha Rao K, Kishore VVN. Wind power technology diffusion analysis inselected states of India. Renewable Energy 2008.
[34] Goyal Mohit. Repowering—next big thing in India. Renewable and SustainableEnergy Reviews 2009:1400–9.
[35] Schmid Gisèle. The development of renewable energy power in India: whichpolicies have been effective? Energy Policy 2012;45:317–26.
[36] Pillai IR, Banerjee R. Renewable energy in India: status and potential. Energy2009;34:970–80.
[37] Srinivasan S. Subsidy policy and the enlargement of choice. Renewable andSustainable Energy Reviews 2009;13:2728–33.
[38] Hossain J, et al. A GIS based assessment of potential for wind farms in India.Renewable Energy 2011:1–11.
[39] Mani S, Dhingra T. Offshore wind energy policy for India—key factors to beconsidered. Energy Policy 2013 2013.01.031ihttp://dx.doi.org/10.1016/j.enpol.
[40] Kothari CR. Research methodology—methods and techniques. New Delhi: NewAge; 2010.
[41] Malhotra Naresh K, Dash Satyabhusan. Marketing research—an applied orien-tation. 6th ed. New Delhi: Pearson; 2011.
[42] Churchill Jr. AGilbert, Iacobucci Dawn, Israel D. Marketing research—a south-asian perspective. New Delhi: Cengage; 2010.
[43] Hair F.Jr., Black C. William, Barry Babin J, Rolph Anderson E, Ronald Tatham L.Multivariate data analysis. 6th ed. New Delhi: Pearson; 2009.