Embed Size (px)
Citation preview

Poliquin, Renée (BAPE)
De: Envoyé: À: Cc:
Objet:
Pièces jointes:
Bonjour Madame Poliquin,
[email protected] 4 août 2016 11:12 Poliquin, Renée (BAPE) [email protected]; [email protected]; Marie
[email protected]; [email protected]; Jean[email protected]; [email protected] RE: Demande d'information de la commission du BAPE concernant le projet de stabilisation de berge et de réparation de structures de soutènement en bordure du fleuve Saint-Laurent par la Ville de Boucherville Kloosteretal_2013_ash dynamics.pdf
Veuillez trouver ci-après la réponse du MFFP à la question DQ7, reçue le 2 août 2016, en regard du projet cité en
objet. L'article joint et cité ci-après fait également partie de la réponse .
Selon Klooster WS, Herms DA, Knight KS, Herms CP, McCullough DG, et al. 2013. Ash (Fraxinus spp.) mortality,
regeneration, and seed bank dynamics in mixed hardwood forests following invasion by emerald
ash borer (Agrilus planipennis). Biol. lnvas. Doi:10.1007/s10530-013-0543-7 45 . Knight KS, Brown JP, Long RP. 201]..
Factors affecting the survival of ash, à la page 10 :
« The pattern of mortality was similar for all three ash species and across soil hydre-classes, suggesting that eastern
North American forests containing white, green, and black ash trees are equally vulnerable ta nearly complete EAB
[Emerald Ash Borer]-induced ash mortality. »
(Traduction libre) Le patron de mortalité est semblable pour les trois espèces de frêne, quelle que soit la classe de
drainage du sol, ce qui laisse croire que les forêts du Nord-est américain qui recèlent des frênes blanc, vert ou noir
sont toutes aussi vulnérables à une mortalité associée à l'agrile du frêne.
Ainsi, les frênes ayant« les pieds dans l'eau » ne seraient pas p,lus résistants que les autres.
En espérant le tout satisfaisant, le Ministère se montre disponible pour répondre à tout complément d'information
ou autre question.
Cordiales salutations,
Marie-Hélène Grignon Agente de secrétariat Direction de la gestion de la faune de l'Estrie, de Montréal, de la Montérégie et de Laval lvii111stere des Forêts, de la Faune et des Parcs . J 1 çiiace Charles-Le Moyne. bureau 4 05 : l-'19UPL il (Québec) J4K 2T5 Telephone 450 928-7608. poste 300
1
ORIGINAL PAPER
Ash (Fraxinus spp.) mortality, regeneration, and seed bankdynamics in mixed hardwood forests following invasionby emerald ash borer (Agrilus planipennis)
Wendy S. Klooster • Daniel A. Herms • Kathleen S. Knight •
Catherine P. Herms • Deborah G. McCullough • Annemarie Smith •
Kamal J. K. Gandhi • John Cardina
Received: 21 December 2012 / Accepted: 20 August 2013
� Springer Science+Business Media Dordrecht 2013
Abstract Emerald ash borer (EAB; Agrilus plani-
pennis) has killed millions of ash trees and threatens ash
throughout North America, and long-term persistence
of ash will depend on the potential for regeneration. We
quantified ash demography, including mortality and
regeneration, of Fraxinus americana (white ash),
Fraxinus pennsylvanica (green ash), and Fraxinus
nigra (black ash) in mixed hardwood forests near the
epicenter of the EAB invasion in southeastern Mich-
igan and throughout Ohio. Plots were established across
a gradient of ash densities. Ash was the most important
species in hydric sites, and ranked second among all
species in mesic and xeric sites. In sites nearest the
epicenter in Michigan, ash mortality exceeded 99 % by
2009, and few or no newly germinated ash seedlings
were observed, leaving only an ‘‘orphaned cohort’’ of
established ash seedlings and saplings. As ash mortality
increased, the number of viable ash seeds in soil
samples decreased sharply, and no viable seeds were
collected in 2007 or 2008. In Ohio sites farther from the
epicenter, densities of new ash seedlings were much
higher in plots with healthy ash trees compared to plots
where trees had died. EAB was still present in low
densities in Michigan and Ohio stands in 2012 where
average mortality of ash was nearly 100 %. The future
of ash at these sites will depend on the outcome of the
dynamic interaction between the orphaned cohort of
previously established ash seedlings and saplings and
low density EAB populations.
Keywords Ash regeneration � Demography �Invasive forest pest � Seedlings
W. S. Klooster (&) � C. P. Herms � J. Cardina
Department of Horticulture and Crop Science, Ohio
Agricultural Research and Development Center, The Ohio
State University, 1680 Madison Avenue, Wooster,
OH 44691, USA
e-mail: [email protected]
D. A. Herms � A. Smith � K. J. K. Gandhi
Department of Entomology, Ohio Agricultural Research
and Development Center, The Ohio State University,
1680 Madison Avenue, Wooster, OH 44691, USA
K. S. Knight
Forestry Sciences Laboratory, Northern Research Station,
USDA Forest Service, 359 Main Road, Delaware,
OH 43015, USA
D. G. McCullough
Departments of Entomology and Forestry, Michigan State
University, 243 Natural Science Building, East Lansing,
MI 48824, USA
Present Address:
K. J. K. Gandhi
Daniel B. Warnell School of Forestry and Natural
Resources, The University of Georgia, Athens, GA 30602,
USA
123
Biol Invasions
DOI 10.1007/s10530-013-0543-7
Introduction
North American forests have experienced multiple
invasions by devastating alien pathogens and insects
including chestnut blight (Cryphonectria parasitica
(Murrill) Barr), Dutch elm disease (Ophiostoma ulmi
(Buism.) Nannf. and O. novo-ulmi Brasier), beech
bark disease (Cryptococcus fagisuga Lind. and its
fungal associates), hemlock woolly adelgid (Adelges
tsugae Annand), and gypsy moth (Lymantria dispar
L.), all of which have altered forest community
composition, structure, and successional trajectories
(Orwig 2002; Lovett et al. 2006; Gandhi and Herms
2010a). Effects of invasive organisms on the demog-
raphy of dominant species can result in a cascade of
direct and indirect ecological impacts (Gandhi and
Herms 2010a). For example, changes in vertebrate and
invertebrate communities (Martin et al. 1951; Faanes
1984; Gandhi and Herms 2010b), and facilitation of
invasive plant species (Eschtruth et al. 2006) may
occur following extensive tree mortality.
In recent years, emerald ash borer (EAB, Agrilus
planipennis Fairmaire) has killed tens of millions of
ash trees in the north central United States and
neighboring Canada since its introduction from Asia,
and threatens ash throughout North America as it
continues to spread (Cappaert et al. 2005; Poland and
McCullough 2006). White (Fraxinus americana L.),
green (Fraxinus pennsylvanica Marsh.), and black
(Fraxinus nigra Marsh.) ash are widely distributed
throughout eastern North America and are highly
susceptible to EAB (Poland and McCullough 2006;
Smith 2006; Anulewicz et al. 2007; Whitehill et al.
2009). Widespread EAB-induced ash mortality threat-
ens a variety of ecosystems since these tree species
occur and are often abundant in diverse habitats
(MacFarlane and Meyer 2005). EAB is representative
of many invasive species that exhibit stratified
dispersal. Infestations in southeastern Michigan near
the invasion epicenter where EAB has been estab-
lished longest are largely representative of natural
spread; in contrast, sites in Ohio are largely outlier
infestations resulting from human assisted dispersal
(Cappaert et al. 2005).
Long-term persistence of ash in forests invaded by
EAB will depend on the potential for regeneration.
Ash trees reproduce from seeds that are shed in the fall
(Griffith 1991; Gucker 2005a). Trees of some species
can take up to 60 years to reach reproductive maturity
[20–25 cm diameter at breast height (dbh)] (Kurmis
and Kim 1989). Earliest flowering in ash occurs when
the trees are 8–10 cm dbh (Kennedy 1990; Schlesinger
1990), whereas EAB can colonize and kill trees as
small as 2.5 cm dbh (McCullough et al. 2008; Rebek
et al. 2008), which eliminates individuals from the
population before they reach reproductive maturity.
Seed production varies from year to year, and
occasional mast years greatly increase the reproduc-
tive potential (Boerner and Brinkman 1996). On the
forest floor, the majority of seeds are thought to
germinate 2–3 years after seed rain (Clark 1962; Leak
1963), whereas in laboratory collections, seeds have
remained viable for 7 years (Kennedy 1990; Bonner
2008). Ash seedlings are moderately shade-tolerant.
The potential for ash regeneration will be determined
by whether an ash seed bank persists longer than EAB
in the forest communities, and/or if populations of
seedlings and saplings reach reproductive maturity as
EAB populations collapse following elimination of
their host plants.
The objective of this study was to quantify ash
demography, including mortality and regeneration, in
mixed hardwood forests that varied in their degree of
ash mortality. Specifically, we (1) documented ash
mortality over time; (2) characterized the ash seed
bank in relation to ash decline; and (3) quantified
density of newly germinated ash seedlings, established
ash seedlings, and ash saplings within EAB-impacted
forests. Ash monitoring plots were established near the
epicenter of the EAB invasion in the Upper Huron
River Watershed in southeast Michigan where ash
mortality was high, and across Ohio where EAB
outlier populations of different ages had resulted in
varying levels of ash mortality. This allowed us to
characterize ash demography and regeneration
dynamics across a gradient of EAB-induced ash
mortality ranging from zero to 100 %.
Methods
Michigan sites
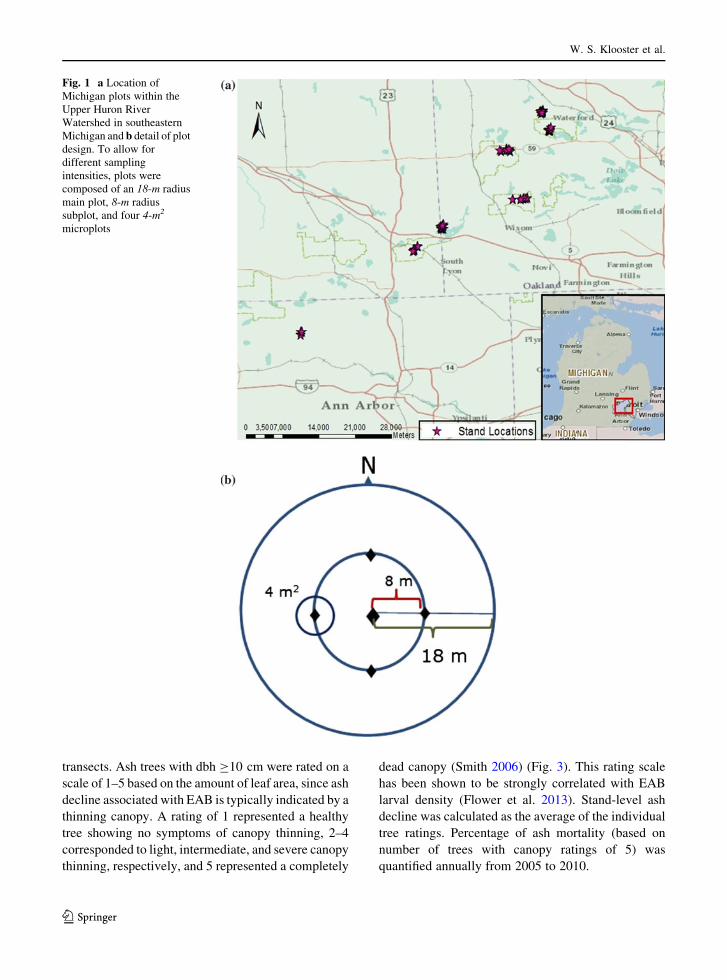
Beginning in 2004, transects were established through
38 forested stands on public land (Huron River
MetroParks and Michigan State Recreation Areas)
within the Upper Huron River Watershed in south-
eastern Michigan (Fig. 1a). Transects were located
W. S. Klooster et al.
123
28–45 km from the epicenter of the EAB invasion
near Westland, Michigan (Siegert et al. 2008), and
have experienced the longest duration of EAB infes-
tation in North America. During the initial stages of
the study, transects encompassed a gradient of EAB-
induced ash mortality ranging from very low to nearly
100 % (Smith 2006). To compare transects with
different environmental characteristics, transects were
classified according to edaphic conditions and the
dominant ash species present. Transects in well-
drained upland sites with white ash as the most
common ash species were classified as xeric. Tran-
sects in sites that were moderately well-drained but
with seasonal standing water and green or black ash as
the most common ash species were classified as mesic.
Transects in marshes or along riparian floodplains,
frequently containing standing water and mostly black
or green ash, were classified as hydric.
Each transect consisted of three replicate circular
plots, each with a radius of 18 m. Within each main
plot was a centrally located subplot (8 m radius)
surrounded by four microplots (4 m2) placed 8 m from
the plot center in each cardinal direction (Fig. 1b). Plot
centers were separated by an average of 77 m. All
plots contained at least two mature ash trees C10 cm
dbh and were established across a gradient of ash
densities to encompass a range from low to high
(10–413 trees per ha). See Smith (2006) for a detailed
description of plot establishment, characterization,
and maps.
Ohio sites
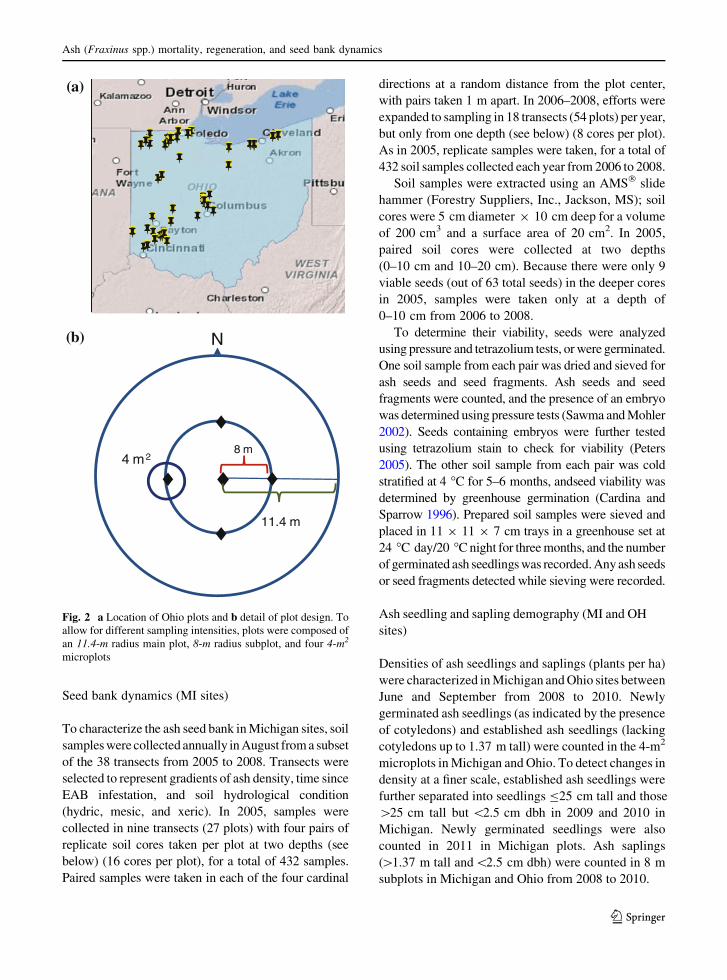
Ohio sites included non-infested sites and sites with
outlier satellite EAB populations that varied in time
since infestation, thus providing a gradient of EAB-
induced ash mortality from none to high that can serve
as a frame of reference for comparing regeneration
with the severely impacted sites in Michigan. Between
2005 and 2008, 62 forested transects were located on
public and private lands in 20 counties throughout
Ohio (Fig. 2a). Plot design followed that for Michigan
except that plots were smaller. Each transect contained
three plots, with individual plots separated by C20 m.
Plots were circular, with an 11.4-m radius main plot,
an 8-m radius subplot, and four 4-m2 microplots 6 m
from the plot center in each cardinal direction
(Fig. 2b). Plots contained a minimum of two ash trees
with dbh C10 cm.
Stand characterization (MI sites)
The density of ash in Michigan sites prior to EAB
impact was calculated from the living and dead
(standing or fallen) ash trees using a modification of
the Forest Inventory and Analysis technique (i.e. US
Forest Service 2007). Because EAB was already
killing ash trees at the beginning of the study, both
living and dead ash trees were included to document
the pre-invasion state of the community when nearly
all ash trees were alive. Total ash density (trees per ha)
was calculated for each plot, and then relative density
of ash was calculated by dividing the density of ash
trees by the densities of all trees in the plot, then
multiplying by 100. Relative ash density for each
transect was calculated by averaging the relative
densities of each of the three replicated plots. Total ash
basal area was calculated by summing the basal area
(calculated from dbh measurements) of all ash trees
per plot. Relative dominance of ash was calculated for
each plot by dividing the total basal area of all ash trees
by the sum of the basal areas of all trees, then
multiplying by 100. Transect-level relative ash dom-
inance was calculated by averaging the three replicate
plots within each transect. Transect-level relative
frequency of ash was calculated by dividing the
absolute frequency of ash (percentage of plots within
each transect that contained ash) by the sum of the
absolute frequencies of all overstory trees, and mul-
tiplying by 100. Relative importance values were
calculated for all ash trees C12.5 cm dbh by transect
by adding together the density, dominance, and
frequency of ash relative to all overstory species.
The maximum theoretical relative importance value
for a single taxa, or the sum of the importance values
for all taxa, was 300 for each stand.
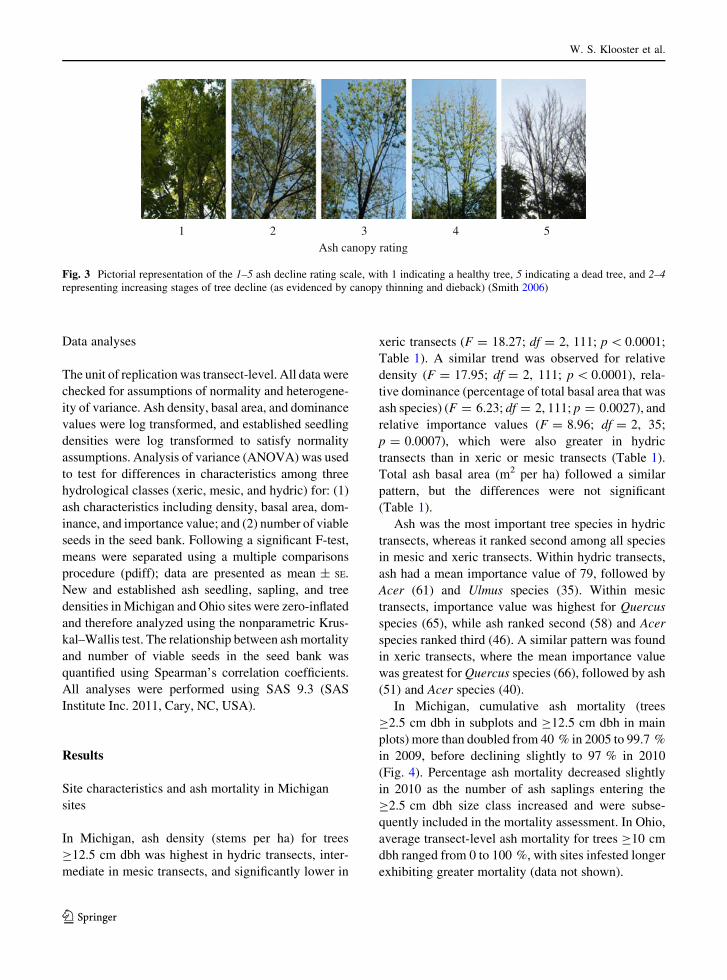
Ash decline and mortality (MI and OH sites)
In Michigan, percentage ash mortality at the transect
level was quantified annually from 2004 to 2010. Ash
trees with dbh C2.5 cm were surveyed within the 8-m
subplots, and ash C12.5 cm dbh were surveyed in the
entire 18-m radius main plots, with trees classified as
either living or dead. Any root sprouts present were
recorded along with their number and condition.
In Ohio, transect-level ash decline was character-
ized by rating the degree of canopy decline of
individual ash trees in plots, and averaging across
Ash (Fraxinus spp.) mortality, regeneration, and seed bank dynamics
123
transects. Ash trees with dbh C10 cm were rated on a
scale of 1–5 based on the amount of leaf area, since ash
decline associated with EAB is typically indicated by a
thinning canopy. A rating of 1 represented a healthy
tree showing no symptoms of canopy thinning, 2–4
corresponded to light, intermediate, and severe canopy
thinning, respectively, and 5 represented a completely
dead canopy (Smith 2006) (Fig. 3). This rating scale
has been shown to be strongly correlated with EAB
larval density (Flower et al. 2013). Stand-level ash
decline was calculated as the average of the individual
tree ratings. Percentage of ash mortality (based on
number of trees with canopy ratings of 5) was
quantified annually from 2005 to 2010.
Fig. 1 a Location of
Michigan plots within the
Upper Huron River
Watershed in southeastern
Michigan and b detail of plot
design. To allow for
different sampling
intensities, plots were
composed of an 18-m radius
main plot, 8-m radius
subplot, and four 4-m2
microplots
W. S. Klooster et al.
123
Seed bank dynamics (MI sites)
To characterize the ash seed bank in Michigan sites, soil
samples were collected annually in August from a subset
of the 38 transects from 2005 to 2008. Transects were
selected to represent gradients of ash density, time since
EAB infestation, and soil hydrological condition
(hydric, mesic, and xeric). In 2005, samples were
collected in nine transects (27 plots) with four pairs of
replicate soil cores taken per plot at two depths (see
below) (16 cores per plot), for a total of 432 samples.
Paired samples were taken in each of the four cardinal
directions at a random distance from the plot center,
with pairs taken 1 m apart. In 2006–2008, efforts were
expanded to sampling in 18 transects (54 plots) per year,
but only from one depth (see below) (8 cores per plot).
As in 2005, replicate samples were taken, for a total of
432 soil samples collected each year from 2006 to 2008.
Soil samples were extracted using an AMS� slide
hammer (Forestry Suppliers, Inc., Jackson, MS); soil
cores were 5 cm diameter 9 10 cm deep for a volume
of 200 cm3 and a surface area of 20 cm2. In 2005,
paired soil cores were collected at two depths
(0–10 cm and 10–20 cm). Because there were only 9
viable seeds (out of 63 total seeds) in the deeper cores
in 2005, samples were taken only at a depth of
0–10 cm from 2006 to 2008.
To determine their viability, seeds were analyzed
using pressure and tetrazolium tests, or were germinated.
One soil sample from each pair was dried and sieved for
ash seeds and seed fragments. Ash seeds and seed
fragments were counted, and the presence of an embryo
was determined using pressure tests (Sawma and Mohler
2002). Seeds containing embryos were further tested
using tetrazolium stain to check for viability (Peters
2005). The other soil sample from each pair was cold
stratified at 4 �C for 5–6 months, andseed viability was
determined by greenhouse germination (Cardina and
Sparrow 1996). Prepared soil samples were sieved and
placed in 11 9 11 9 7 cm trays in a greenhouse set at
24 �C day/20 �C night for three months, and the number
of germinated ash seedlings was recorded. Any ash seeds
or seed fragments detected while sieving were recorded.
Ash seedling and sapling demography (MI and OH
sites)
Densities of ash seedlings and saplings (plants per ha)
were characterized in Michigan and Ohio sites between
June and September from 2008 to 2010. Newly
germinated ash seedlings (as indicated by the presence
of cotyledons) and established ash seedlings (lacking
cotyledons up to 1.37 m tall) were counted in the 4-m2
microplots in Michigan and Ohio. To detect changes in
density at a finer scale, established ash seedlings were
further separated into seedlings B25 cm tall and those
[25 cm tall but \2.5 cm dbh in 2009 and 2010 in
Michigan. Newly germinated seedlings were also
counted in 2011 in Michigan plots. Ash saplings
([1.37 m tall and\2.5 cm dbh) were counted in 8 m
subplots in Michigan and Ohio from 2008 to 2010.
11.4 m
♦8 m
N
♦ ♦
♦
♦
4 m2
(b)
(a)
Fig. 2 a Location of Ohio plots and b detail of plot design. To
allow for different sampling intensities, plots were composed of
an 11.4-m radius main plot, 8-m radius subplot, and four 4-m2
microplots
Ash (Fraxinus spp.) mortality, regeneration, and seed bank dynamics
123
Data analyses
The unit of replication was transect-level. All data were
checked for assumptions of normality and heterogene-
ity of variance. Ash density, basal area, and dominance
values were log transformed, and established seedling
densities were log transformed to satisfy normality
assumptions. Analysis of variance (ANOVA) was used
to test for differences in characteristics among three
hydrological classes (xeric, mesic, and hydric) for: (1)
ash characteristics including density, basal area, dom-
inance, and importance value; and (2) number of viable
seeds in the seed bank. Following a significant F-test,
means were separated using a multiple comparisons
procedure (pdiff); data are presented as mean ± SE.
New and established ash seedling, sapling, and tree
densities in Michigan and Ohio sites were zero-inflated
and therefore analyzed using the nonparametric Krus-
kal–Wallis test. The relationship between ash mortality
and number of viable seeds in the seed bank was
quantified using Spearman’s correlation coefficients.
All analyses were performed using SAS 9.3 (SAS
Institute Inc. 2011, Cary, NC, USA).
Results
Site characteristics and ash mortality in Michigan
sites
In Michigan, ash density (stems per ha) for trees
C12.5 cm dbh was highest in hydric transects, inter-
mediate in mesic transects, and significantly lower in
xeric transects (F = 18.27; df = 2, 111; p \ 0.0001;
Table 1). A similar trend was observed for relative
density (F = 17.95; df = 2, 111; p \ 0.0001), rela-
tive dominance (percentage of total basal area that was
ash species) (F = 6.23; df = 2, 111; p = 0.0027), and
relative importance values (F = 8.96; df = 2, 35;
p = 0.0007), which were also greater in hydric
transects than in xeric or mesic transects (Table 1).
Total ash basal area (m2 per ha) followed a similar
pattern, but the differences were not significant
(Table 1).
Ash was the most important tree species in hydric
transects, whereas it ranked second among all species
in mesic and xeric transects. Within hydric transects,
ash had a mean importance value of 79, followed by
Acer (61) and Ulmus species (35). Within mesic
transects, importance value was highest for Quercus
species (65), while ash ranked second (58) and Acer
species ranked third (46). A similar pattern was found
in xeric transects, where the mean importance value
was greatest for Quercus species (66), followed by ash
(51) and Acer species (40).
In Michigan, cumulative ash mortality (trees
C2.5 cm dbh in subplots and C12.5 cm dbh in main
plots) more than doubled from 40 % in 2005 to 99.7 %
in 2009, before declining slightly to 97 % in 2010
(Fig. 4). Percentage ash mortality decreased slightly
in 2010 as the number of ash saplings entering the
C2.5 cm dbh size class increased and were subse-
quently included in the mortality assessment. In Ohio,
average transect-level ash mortality for trees C10 cm
dbh ranged from 0 to 100 %, with sites infested longer
exhibiting greater mortality (data not shown).
Ash canopy rating1 2 3 4 5
Fig. 3 Pictorial representation of the 1–5 ash decline rating scale, with 1 indicating a healthy tree, 5 indicating a dead tree, and 2–4
representing increasing stages of tree decline (as evidenced by canopy thinning and dieback) (Smith 2006)
W. S. Klooster et al.
123
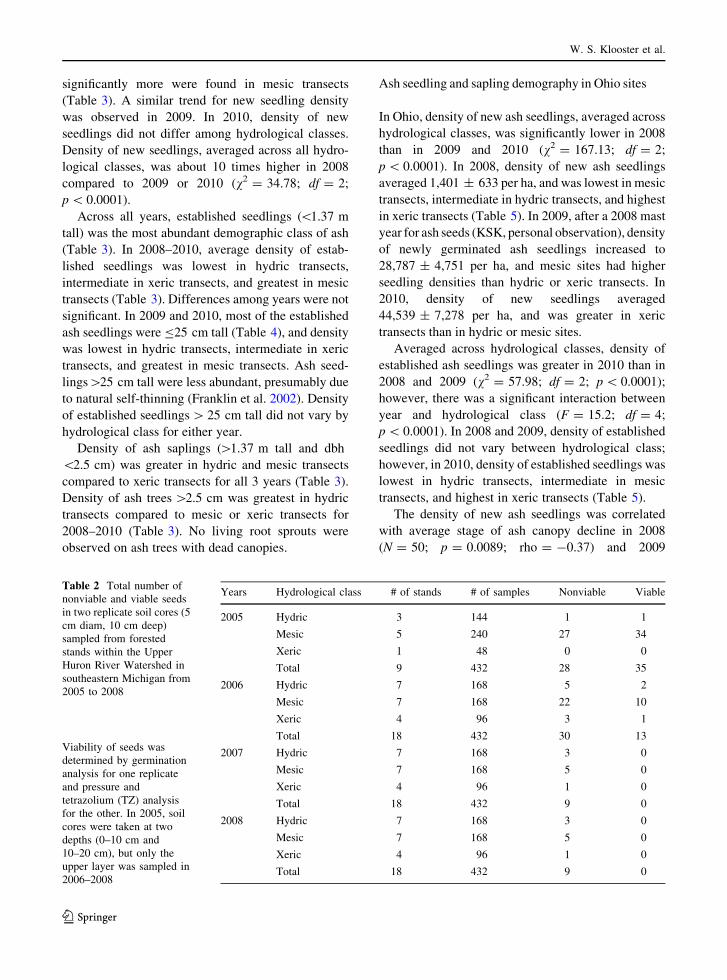
Seed bank dynamics in Michigan sites
Total number of viable ash seeds in the soil samples
declined from 2005 to 2008, and no viable seeds were
collected in 2007 or 2008 in any of the hydrological
classes (Fig. 5; Table 2). In 2005 and 2006, the
majority (88 %) of seeds collected (n = 106) were
from mesic transects with about equal numbers in
xeric and hydric transects (Table 2). In 2005, 56 % of
the seeds found were viable (11 of 11 seeds germi-
nated, and 24 of 52 seeds were found chemically
viable). The main cause of non-viability was lack of an
embryo, although some seeds were non-viable due to
insect or fungal damage. In 2005, most seeds (73 %;
n = 63) were found within 10 cm of the soil surface
(data not shown), leading to the decision to sample
only this layer in subsequent years. Although we
doubled the number of transects sampled in 2006,
fewer seeds were collected than in 2005, and only
30 % were viable (2 of 3 seeds germinated, and 11 of
40 seeds were found chemically viable). Density of
viable seeds declined by more than an order of
magnitude from 2005 to 2006 in mesic sites (Fig. 5);
ash seed density was much lower in hydric and xeric
transects compared to mesic transects in 2005 and
2006.
Ash seedling and sapling demography in Michigan
sites
In 2008, no new ash seedlings were found in hydric
transects, only a few were found in xeric transects, and
Table 1 Density (stems per ha), relative density (% ash stems
per ha), total basal area (BA; m2 per ha), relative dominance
(% ash BA per ha), and importance value for all ash species
(white, green, and black) in xeric, mesic, and hydric stands
within the Upper Huron River Watershed in southeastern
Michigan
Ash characteristic Xeric Mesic Hydric
N = 45 N = 36 N = 33
Density (stems ha-1) 77.1 ± 7.6 b 124.7 ± 9.6 a 174.5 ± 17.1 a
Relative density (% ash stems ha-1) 18.6 ± 1.6 c 25.3 ± 1.9 b 36.5 ± 2.6 a
Total BA (m2 ha-1) 5.3 ± 0.5 a 6.3 ± 0.6 a 7.5 ± 0.8 a
Relative dominance (% ash BA ha-1) 19.4 ± 1.8 22.7 ± 2.1 b 30.7 ± 2.8 a
Importance value 54.2 ± 4.8 b 62.5 ± 5.1 b 85.8 ± 6.3 a
Values (given as lsmeans ± se) represent all living and dead ash trees C12.5 cm dbh identified during plot establishment. Means
within a row followed by different letters are significantly different (ANOVA, p = 0.05)
Year
2005 2006 2007 2008 2009 2010
Per
cent
age
Mor
talit
y
0
20
40
60
80
100
Fig. 4 Percentage ash mortality of trees C2.5 cm dbh in
subplots and C12.5 cm dbh in main plots from 2005 to 2010
in 38 forested stands within the Huron River Watershed in
southeastern Michigan
Year2005 2006 2007 2008
Ash
see
d de
nsity
(x10
00)
0
500
1000
1500
2000XericMesicHydric
Fig. 5 Density of viable ash seeds in 18 forested stands across
three hydrological classes within the Upper Huron River
Watershed in southeastern Michigan
Ash (Fraxinus spp.) mortality, regeneration, and seed bank dynamics
123
significantly more were found in mesic transects
(Table 3). A similar trend for new seedling density
was observed in 2009. In 2010, density of new
seedlings did not differ among hydrological classes.
Density of new seedlings, averaged across all hydro-
logical classes, was about 10 times higher in 2008
compared to 2009 or 2010 (v2 = 34.78; df = 2;
p \ 0.0001).
Across all years, established seedlings (\1.37 m
tall) was the most abundant demographic class of ash
(Table 3). In 2008–2010, average density of estab-
lished seedlings was lowest in hydric transects,
intermediate in xeric transects, and greatest in mesic
transects (Table 3). Differences among years were not
significant. In 2009 and 2010, most of the established
ash seedlings were B25 cm tall (Table 4), and density
was lowest in hydric transects, intermediate in xeric
transects, and greatest in mesic transects. Ash seed-
lings[25 cm tall were less abundant, presumably due
to natural self-thinning (Franklin et al. 2002). Density
of established seedlings [ 25 cm tall did not vary by
hydrological class for either year.
Density of ash saplings ([1.37 m tall and dbh
\2.5 cm) was greater in hydric and mesic transects
compared to xeric transects for all 3 years (Table 3).
Density of ash trees [2.5 cm was greatest in hydric
transects compared to mesic or xeric transects for
2008–2010 (Table 3). No living root sprouts were
observed on ash trees with dead canopies.
Ash seedling and sapling demography in Ohio sites
In Ohio, density of new ash seedlings, averaged across
hydrological classes, was significantly lower in 2008
than in 2009 and 2010 (v2 = 167.13; df = 2;
p \ 0.0001). In 2008, density of new ash seedlings
averaged 1,401 ± 633 per ha, and was lowest in mesic
transects, intermediate in hydric transects, and highest
in xeric transects (Table 5). In 2009, after a 2008 mast
year for ash seeds (KSK, personal observation), density
of newly germinated ash seedlings increased to
28,787 ± 4,751 per ha, and mesic sites had higher
seedling densities than hydric or xeric transects. In
2010, density of new seedlings averaged
44,539 ± 7,278 per ha, and was greater in xeric
transects than in hydric or mesic sites.
Averaged across hydrological classes, density of
established ash seedlings was greater in 2010 than in
2008 and 2009 (v2 = 57.98; df = 2; p \ 0.0001);
however, there was a significant interaction between
year and hydrological class (F = 15.2; df = 4;
p \ 0.0001). In 2008 and 2009, density of established
seedlings did not vary between hydrological class;
however, in 2010, density of established seedlings was
lowest in hydric transects, intermediate in mesic
transects, and highest in xeric transects (Table 5).
The density of new ash seedlings was correlated
with average stage of ash canopy decline in 2008
(N = 50; p = 0.0089; rho = -0.37) and 2009
Table 2 Total number of
nonviable and viable seeds
in two replicate soil cores (5
cm diam, 10 cm deep)
sampled from forested
stands within the Upper
Huron River Watershed in
southeastern Michigan from
2005 to 2008
Viability of seeds was
determined by germination
analysis for one replicate
and pressure and
tetrazolium (TZ) analysis
for the other. In 2005, soil
cores were taken at two
depths (0–10 cm and
10–20 cm), but only the
upper layer was sampled in
2006–2008
Years Hydrological class # of stands # of samples Nonviable Viable
2005 Hydric 3 144 1 1
Mesic 5 240 27 34
Xeric 1 48 0 0
Total 9 432 28 35
2006 Hydric 7 168 5 2
Mesic 7 168 22 10
Xeric 4 96 3 1
Total 18 432 30 13
2007 Hydric 7 168 3 0
Mesic 7 168 5 0
Xeric 4 96 1 0
Total 18 432 9 0
2008 Hydric 7 168 3 0
Mesic 7 168 5 0
Xeric 4 96 1 0
Total 18 432 9 0
W. S. Klooster et al.
123
(N = 50; p = 0.0002; rho = -0.50). In 2008, density
of newly germinated ash seedlings ranged from 3,000
per ha in sites with an average ash canopy rating of 1
(healthy canopy), to zero in sites with average canopy
ratings of 4 (severe dieback) and 5 (dead) (Fig. 6). In
2009, following a mast year, density of new ash
seedlings increased dramatically in all plots with
living ash trees (average ash canopy ratings of
1–4),with density ranging from 24,000 to 40,000
seedlings per ha. In comparison, plots in which all ash
trees had died (average canopy rating of 5) had just
over 1,300 new ash seedlings per ha in 2009. Density
of ash saplings was relatively consistent across all
years and did not vary by hydrological class (Table 5).
Table 3 Density of living ash seedlings, saplings, and trees per ha (±SE) within the Upper Huron River Watershed in southeastern
Michigan from 2008 to 2010, organized by size and hydrological class
Size class Hydrological class 2008 2009 2010
Ash ha-1 Ash ha-1 Ash ha-1
New seedlings Hydric 0 ± 0 b 21 ± 21 b 21 ± 21 a
Mesic 2,266 ± 869 a 143 ± 43 a 0 ± 0 a
Xeric 57 ± 57 b 0 ± 0 b 0 ± 0 a
Kruskal–Wallis test v2 = 12.19; p = 0.0023 v2 = 11.42; p = 0.0033 v2 = 2.70; p = 0.2592
Established seedlings Hydric 18,229 ± 8,069 b 11,354 ± 3,333 c 9,250 ± 2,783 c
Mesic 272,500 ± 40,744 a 239,857 ± 31,023 a 202,370 ± 26,559 a
Xeric 102,102 ± 40,551.4 b 65,928 ± 15,885 b 43,542 ± 10,785 b
Kruskal–Wallis test v2 = 16.32; p = 0.0003 v2 = 54.42; p \ 0.0001 v2 = 57.58; p \ 0.0001
Saplings \2.5 cm dbh Hydric 357 ± 147 a 458 ± 159 a 486 ± 180 a
Mesic 75 ± 31 a 287 ± 164 a 274 ± 139 a
Xeric 9 ± 9 b 72 ± 57 b 133 ± 109 b
Kruskal–Wallis test v2 = 7.99; p = 0.0184 v2 = 11.74; p = 0.0028 v2 = 7.67; p = 0.0216
Trees C2.5 cm dbh Hydric 11.1 ± 3.5 a 11.8 ± 6.0 a 16.7 ± 6.0 a
Mesic 3.1 ± 1.4 b 1.6 ± 0.8 b 1.4 ± 0.9 b
Xeric 3.6 ± 2.3 b 0.6 ± 0.4 b 2.7 ± 1.7 b
Kruskal–Wallis test v2 = 12.95; p = 0.0015 v2 = 9.60; p = 0.0082 v2 = 14.29; p = 0.0008
Size classifications: new (first-year seedlings with cotyledons) and established seedlings (\1.37 m tall) counted in four 4-m2
microplots per plot; saplings (C1.37 m tall,\2.5 cm dbh) counted in each 8-m radius subplot; and trees C2.5 cm dbh counted in each
8-m radius subplot and C12.5 cm dbh counted in each 18-m radius main plot
Means within year and size class followed by different letters are significantly different (ANOVA, p = 0.05)
Table 4 Density of established ash seedlings per ha (±SE) in
forested stands within the Upper Huron River Watershed in
southeastern Michigan in 2009 and 2010, classified into two
size classes: established seedlings B25 cm tall, and established
seedlings [25 cm tall
Size class Hydrological class 2009 2010
Ash ha-1 Ash ha-1
B25 cm tall Hydric 8,229 ± 2,976 c 6,813 ± 2,467 c
Mesic 235,104 ± 31,038 a 197,787 ± 26,515 a
Xeric 62,614 ± 15,928 b 40,019 ± 10,689 b
Kruskal–Wallis test v2 = 57.22; p \ 0.0001 v2 = 58.89; p \ 0.0001
[25 cm tall Hydric 3,125 ± 832 a 2,438 ± 603 a
Mesic 4,753 ± 1,031 a 4,583 ± 873 a
Xeric 3,314 ± 923 a 3,523 ± 935 a
Kruskal–Wallis test v2 = 2.65; p = 0.2653 v2 = 2.13; p = 0.3440
Means within year and size class followed by different letters are significantly different (ANOVA, p = 0.05)
Ash (Fraxinus spp.) mortality, regeneration, and seed bank dynamics
123
Discussion
Analysis of patterns of EAB-induced ash mortality,
ash seed bank dynamics, and seedling and sapling
demography revealed that new ash regeneration
ceased as ash mortality approached 100 %, suggesting
that the future of ash at these sites will depend on
survival and reproduction of an ‘‘orphaned cohort’’ of
previously established ash seedlings and saplings. As
mortality of ash trees greater than 2.5 cm dbh
exceeded 90 % by 2007 in Michigan, the ash seed
bank was rapidly depleted. By 2009 in the Michigan
sites, ash mortality exceeded 99 % and no newly
germinated ash seedlings were observed, leaving only
previously established ash seedlings and saplings.
This sharp decline in ash density in southeast Mich-
igan in response to the EAB invasion stands in stark
contrast to increased ash density observed throughout
much of the rest of its range (Pugh et al. 2011). Similar
patterns were observed in Ohio, with ash regeneration
decreasing sharply as EAB-induced ash mortality
increased.
The pattern of mortality was similar for all three ash
species and across soil hydro-classes, suggesting that
eastern North American forests containing white,
green, and black ash trees are equally vulnerable to
nearly complete EAB-induced ash mortality. Density
of ash seeds in the soil seed bank was initially highest
in mesic sites, as was density of ash seedlings and
saplings. However, since ash was more dominant in
Table 5 Density of ash seedlings and saplings per ha (±SE) in Ohio from 2008 to 2010 according to size and hydrological class
Size class Hydrological class 2008 2009 2010
Ash ha-1 Ash ha-1 Ash ha-1
New Hydric 1,354 ± 1,101 ab 23,998 ± 5,572 b 8,495 ± 2,117 b
Mesic 85 ± 44 b 40,818 ± 17,970 a 20,767 ± 6,964 b
Xeric 2,050 ± 1,130 a 28,286 ± 3,771 b 76,714 ± 13,787 a
Kruskal–Wallis test v2 = 10.25; p = 0.0059 v2 = 7.29; p = 0.0261 v2 = 52.39; p \ 0.0001
Established Hydric 6,111 ± 1,547 a 3,840 ± 854 a 6,736 ± 1,140 c
Mesic 5,298 ± 1,422 a 3,253 ± 968 a 10,639 ± 4,471 b
Xeric 6,801 ± 1,960 a 3,999 ± 754 a 19,120 ± 2,260 a
Kruskal–Wallis test v2 = 0.62; p = 0.7338 v2 = 2.60; p = 0.2719 v2 = 38.83; p \ 0.0001
Saplings Hydric 39 ± 15 a 36 ± 16 a 32 ± 16 a
Mesic 54 ± 28 a 45 ± 24 a 40 ± 21 a
Xeric 81 ± 45 a 77 ± 41 a 80 ± 43 a
Kruskal–Wallis test v2 = 2.33; p = 0.3118 v2 = 1.44; p = 0.4867 v2 = 0.22; p = 0.8961
Size classifications: new (first-year seedlings with cotyledons), established seedlings (\1.37 m tall), and saplings (C1.37 m tall and
\2.5 cm dbh). Values are averaged across all percent mortality levels within each hydrological class
Means within year and size class followed by different letters are significantly different (ANOVA, p = 0.05)
Mean ash canopy rating1 2 3 4 5
seed
ling
s p
er h
ecta
re
0
10000
20000
30000
40000
5000020082009
Fig. 6 Density of newly germinated ash seedlings (as indicated
by the presence of cotyledons) in ash stands in varying degrees
of EAB-induced decline in Ohio. Mean ash canopy condition for
each site was calculated in 2008 from individual tree ratings of
canopy decline on a scale of 1–5, with 1 representing a healthy
tree, 5 representing a completely dead tree, and 2–4 representing
increasing levels of thinning and dieback
W. S. Klooster et al.
123
hydric than in mesic or xeric stands, the impacts of
EAB-induced ash mortality on successional trajecto-
ries will ultimately be most dramatic in hydric stands
(D’Amato 2010). Whereas white ash may comprise
only 3–4 % of stand volume in xeric sites, black ash
can form pure stands in swamps and hydric sites, and is
even considered a climax species in sites with poorly
drained peat or muck soil (MacFarlane and Meyer
2005). Black ash stands, which often form in standing
water, may have low densities of other canopy-
replacing tree species (Klooster 2012; Palik et al.
2012), suggesting the possibility for major shifts in
stand structure and composition.
In Michigan sites, percentage mortality of ash trees
greater than 2.5 cm dbh decreased slightly in 2010 to
about 97 % as smaller saplings grew enough to reach
that size class. As we and others (Rebek et al. 2008;
McCullough et al. 2008) have observed, once saplings
reach 2.5 cm dbh, they can be readily colonized and
killed by EAB. This is much smaller than the size at
which ash generally reaches reproductive maturity
(20–25 cm dbh) (Kurmis and Kim 1989), which
further contributes to the precarious future of ash.
This finding is contrary to the assumption of the EAB
spread models of BenDor et al. (2006) that trees do not
become susceptible to EAB until they reach 5 cm dbh.
Previous studies have found root sprouting to be a
significant source of ash regeneration, even affecting
gap dynamics (Dietze and Clark 2008). Additionally,
ash growing in open and urban environments have
been observed to sprout vigorously in response to EAB
infestation (Poland and McCullough 2006). However,
ash killed by EAB in the forest stands we studied did
not exhibit that response as we observed sprouting to
be uncommon. Sprouts that were present exhibited
low vigor and died with the canopy. We observed no
trees killed by EAB in which root sprouts served as a
viable mechanism for regeneration.
The ash seed bank was depleted rapidly as ash
mortality increased. In 2005, when only 42 % of ash
trees were dead, the density of viable ash seeds in soil
samples was about 500,000 per ha. However, by 2006,
as ash mortality reached 77 %, the density of viable
seeds dropped to about 130,000 per ha, and by 2007,
no viable ash seeds were found.
The lack of viable ash seeds after 2006 in Michigan
sites indicates that ash species do not form a persistent
and viable seed bank. In Pennsylvania, white ash seed
density ranged from 0 to 9,000 per ha (Marquis 1975),
which was substantially less than we observed in the
present study. However, by design, our sampling
protocol probably overestimated the density of ash
seeds at the scale of the entire forest since we
specifically selected our plots based on the presence
of living ash trees, the density of which ranged initially
from 10 to 413 trees per ha.
The Oleaceae family, which includes ash, generally
exhibits orthodox storage behavior of seeds that can
tolerate desiccation and/or freezing (Ellis et al. 1985;
Bonner 2008), and some Oleaceae species do form
persistent seed banks (Baskin and Baskin 1998).
Viability of ash seeds can be maintained in controlled
environments for up to 7 years (Bonner 2008), and
viable ash seeds have been detected in soil seed banks
after three to 8 years (Clark 1962; Leak 1963; Wright
and Rauscher 1990; BenDor et al. 2006). However,
our results are consistent with other studies showing
that white, green, and black ash seeds do not persist on
the forest floor or in the soil (Griffith 1991; Gucker
2005a, b). The lack of a persistent seed bank is
somewhat unusual for early- to mid-successional tree
species (Hyatt and Casper 2000), and is more consis-
tent with the typical behavior of seeds of dominant
late-successional canopy trees (Pickett and McDon-
nell 1989).
We observed a high density of established seed-
lings, but density of newly germinated seedlings was
initially very low and ultimately became nonexistent.
Quadrat surveys covering over 2,000 m2 of the forest
floor yielded 13 new seedlings (averaging 65 per ha for
all hydrological classes) in 2009, only 1 new seedling
in 2010, and no new seedlings in 2011. These values
are extremely low compared to sites in Ohio with
healthy ash trees (Fig. 6), and suggest that the lack of
ash seeds in soil samples was not due to annual
germination, but is consistent with our conclusion that
ash trees do not form a persistent seed bank.
In Ohio plots in 2008 and 2009, greater densities of
new ash seedlings were present in plots with healthy
ash trees (average ash canopy rating of 1) compared to
plots in later stages of decline (average ratings of 4 and
5). The similarly low densities of new seedlings in
Michigan and Ohio plots with extensive ash mortality
support our conclusions that the ash seed bank is
rapidly depleted and regeneration effectively ceases.
The highest seedling densities in Michigan occurred in
mesic stands, which is consistent with previous studies
of ash recruitment in forests (Lesica 2001), and with
Ash (Fraxinus spp.) mortality, regeneration, and seed bank dynamics
123
seed density, which was also highest in mesic stands.
In Ohio, seedling density did not vary across hydro-
logical class.
In fall of 2008, many ash trees throughout Michigan
and Ohio experienced a mast year, with high levels of
seed production (DAH, personal observation), and
studies have found that density of ash seedlings
increases in years following masts (Boerner and
Brinkman 1996). In Ohio, the density of newly
germinated seedlings in plots with living ash trees
(average ash canopy ratings of 1–4) increased by an
order of magnitude from 2008 to 2009. However,
where ash mortality approached 100 % (average ash
canopy rating of 5) very few or no new seedlings were
observed. This is contrary to the suggestion that ash
trees will increase seed production in response to
stress caused by EAB colonization (BenDor et al.
2006), and also is consistent with rapid depletion of
the seed bank following ash mortality.
Given the nearly 100 % EAB-induced ash mortal-
ity that we observed, and the complete cessation of
new ash regeneration, the fate of ash in these forests
will depend on the long-term survival of the orphaned
cohort of established ash seedlings and saplings and
their dynamic interaction with EAB. However, since
ash trees with dbh as small as 2.5 cm are susceptible to
EAB infestation (McCullough et al. 2008), they are
likely to be eliminated before reaching reproductive
maturity (20–25 cm dbh) if EAB populations can
persist at low densities following nearly complete
elimination of their host material.
It is reasonable to predict that as EAB continues to
spread, similar patterns of ash decline and seed bank
depletion will be observed at other locations. Hence, the
population-level changes described here have important
implications for the future of white, green, and black ash
species throughout eastern North American forests, and
potentially other ash species endemic to North America.
If the orphaned cohort of ash is extirpated by EAB
before reproducing, green, black, and white ash will be
functionally extirpated from our study sites, and
potentially over much of their range.
Not all ash species are equally susceptible to EAB
and the resistance of most North American species has
yet to be assessed. In southeastern Michigan, blue ash
was found to be less vulnerable to EAB infestation,
with up to 60 % of blue ash trees surviving in stands
where nearly 100 % of white or green ash had been
killed by EAB (Tanis and McCullough 2012).
As comprehensive ash mortality in southeastern
Michigan forests has resulted in over-exploitation of
its food supply, the carrying capacity for EAB has
been dramatically reduced, resulting in a self-induced
population crash. However, traps placed in our study
sites revealed that EAB was still present in low
densities in Michigan and Ohio stands in 2012 even
where the average mortality of ash trees was nearly
100 % (DAH and KSK, unpublished data). The
orphaned cohort of established seedlings and saplings
currently too small to be colonized by EAB, as well as
the very small number of surviving ash trees (Knight
et al. 2012), represent the only remaining individuals
capable of sustaining an EAB population in the Upper
Huron River Watershed in southeastern Michigan.
Hence, the future of ash and EAB there will be
determined by the outcome of the dynamic interaction
between ash saplings and low density EAB
populations.
Three Asian parasitoid species have been released
in North America, including in the vicinity of some of
our Michigan and Ohio sites, to provide classical
biological control of EAB (Liu et al. 2003; Bauer et al.
2010; Duan et al. 2012). Native parasitoids, particu-
larly Atanycolus spp. have also been observed to
parasitize EAB (Cappaert and McCullough 2009).
However, it remains unclear what long-term impact
natural enemies will have on EAB population dynam-
ics and ash survival. If they are able to regulate EAB
populations at low densities, then some ash saplings
may survive long enough to produce seeds, and thus
facilitate persistence at low densities as a dynamic
equilibrium develops between ash, EAB, and its
natural enemies.
The Michigan sites were severely impacted by Dutch
elm disease in the 1960s and 1970s (Barnes 1976), after
which ash increased in importance. Since then, Amer-
ican elm (Ulmus americana L.) has continued to persist
in these mixed hardwood forests, but typically as
smaller diameter individuals, while other species,
including sugar maple (Acer saccharum Marsh.) and
white ash, replaced elm in the canopy (Parker and
Leopold 1983). We think it is unlikely that ash will
continue to persist as elm has, given that the life history
strategies of ash and elm interact differently with the
respective invasive organisms, resulting in contrasting
patterns of demography. Elm flowers at a younger age
(Burns and Honkala 1990) and can reproduce before
succumbing to Dutch elm disease (Richardson and
W. S. Klooster et al.
123
Cares 1976), whereas ash as small as 2.5 cm dbh are
killed by EAB, and mortality therefore occurs before
reproduction, resulting in cessation of recruitment.
The patterns of ash demography and seed bank
dynamics that we observed near the epicenter of the
EAB infestation support the conclusion that as mor-
tality of ash approached and then exceeded 99 %, the
seed bank was rapidly depleted and ash regeneration
ceased. If this pattern is replicated as EAB spreads to
other regions, it has the potential to functionally
extirpate most ash species from eastern North Amer-
ican forests. Other regions, however, may not expe-
rience the same pattern of EAB dynamics and ash
mortality that we observed. EAB typically overwinter
as prepupal larvae, which are intolerant to freezing,
but have been shown to survive temperatures as low as
-30 �C (Crosthwaite et al. 2011). EAB survival may
decrease at northern latitudes (towards the northern
limits of the distribution of ash) where winter
temperatures frequently fall below this threshold,
potentially resulting in lower or slower rates of ash
mortality (Crosthwaite et al. 2011).
As a component of diverse forest communities, ash
species contribute to ecosystem services such as medi-
ating nutrient and water cycling (Reiners and Reiners
1970), serving as a host for many arthropods (Gandhi and
Herms 2010b), and providing food and shelter for birds
and mammals (Martin et al. 1951). Furthermore, canopy
gaps created when ash die may alter microenvironmental
conditions, and change forest structure, which could
increase the potential for invasion by nonnative species
(Gandhi and Herms 2010a). Monitoring changes in
species composition over time will help forest managers
develop strategies to mitigate the downstream effects
caused by wide-spread ash mortality and the potential
extirpation of ash from forested ecosystems.
Acknowledgments For their extensive assistance with field and
laboratory work we thank Limbania Aliega, Lourdes Arrueta,
Stephanie Blumer, Alejandra Claure, Christian Colindres, Kyle
Costilow, Tara Dell, Mary Douglas, Eileen Duarte, Charles Flower,
Stefanie Fluke, Tim Fox, Joan Jolliffas, Lawrence Long, Rina
Mejıa, Rachel Nieswander, Sarahı Nunez, Delmy Sanchez,
Sebastian Saenz, Stephanie Smith, and Nathan Yaussy, as well as
other members of the Herms, Knight and McCullough Labs. We are
especially grateful to Diane Hartzler who organized and
coordinated much of the field work in Michigan since the
inception of the study. We also thank the two anonymous
reviewers for their constructive suggestions that helped us
improve this manuscript. This research was funded by grants
from the USDA Forest Service Northeastern Research Station’s
Research on Biological Invasions of Northeastern Forests program;
USDA National Research Initiative Biology of Weedy and Invasive
Species in Agroecosystems competitive grants program; the
National Institute of Food and Agriculture; Cooperative
Agreements with the USDA Forest Service Northern Research
Station, Delaware, OH; and state and federal funds appropriated to
the Ohio Agricultural Research and Development Center and The
Ohio State University.
References
Anulewicz AC, McCullough DG, Cappaert DL (2007) Emerald
ash borer (Agrilus planipennis) density and canopy dieback
in three North American ash species. Arboric Urban For
33:338–349
Barnes BV (1976) Succession in deciduous swamp communities
of southeastern Michigan formerly dominated by Ameri-
can elm. Can J Bot 54:19–24
Baskin CC, Baskin JM (1998) Seeds: ecology, biogeography,
and evolution of dormancy and germination. Academic
Press, San Diego
BauerL, Gould J,DuanJ, et al. (2010) Emerald ash borer biological
control. In: McManus K, Gottschalk KW (eds) 21st US
Department of Agriculture Interagency Research Forum on
Invasive Species. USDA Forest Service, Annapolis, pp 70–73
BenDor TK, Metcalf SS, Fontenot LE et al (2006) Modeling the
spread of the emerald ash borer. Ecol Model 197:221–236
Boerner REJ, Brinkman JA (1996) Ten years of tree seedling
establishment and mortality in an Ohio deciduous forest
complex. Bull Torrey Bot Club 123:309–317
Bonner FT (2008) Fraxinus L. ash. In: Bonner FT, Karrfalt RP (eds)
The woody plant seed manual. Agricultural handbook 727. US
Department of Agriculture, Forest Service, Washington,
pp 537–543
Burns RM, Honkala BH (1990) Silvics of North America: 1.
Conifers; 2. Hardwoods. Agriculture handbook 654. 2. US
Department of Agriculture, Forest Service, Washington
Cappaert D, McCullough DG (2009) Occurrence and seasonal
abundance of Atanycolus cappaerti (Hymenoptera: Bra-
conidae) a native parasitoid of emerald ash borer, Agrilus
plonipennis (Coleoptera: Buprestidae). Great Lakes Ento-
mol 42:16–29
Cappaert DL, McCullough DG, Poland TM et al (2005) Emerald
ash borer in North America: a research and regulatory
challenge. Am Entomol 51:152–165
Cardina J, Sparrow DH (1996) A comparison of methods to
predict weed seedling populations from the soil seedbank.
Weed Sci 44:46–51
Clark FB (1962) White ash, hackberry, and yellow-poplar seed
remain viable when stored in the forest litter. Proceed
Indiana Acad Sci 72:112–114
Crosthwaite JC, Sobek S, Lyons DB et al (2011) The overwin-
tering physiology of the emerald ash borer, Agrilus plani-
pennis Fairmaire (Coleoptera: Buprestidae). J Insect
Physiol 57:166–173
D’Amato AW (2010) Silvicultural options for black ash com-
munities facing the threat of emerald ash borer. Black ash
symposium. USDA Forest Service. Bemidji. http://www.
fs.usda.gov/Internet/FSE_DOCUMENTS/stelprdb5191802.
Ash (Fraxinus spp.) mortality, regeneration, and seed bank dynamics
123
Dietze MC, Clark JS (2008) Changing the gap dynamics para-
digm: vegetative regeneration control on forest response to
disturbance. Ecol Monogr 78:331–347
Duan JJ, Bauer LS, Abell KJ et al (2012) Population responses
of hymenopteran parasitoids to the emerald ash borer
(Coleoptera: Buprestidae) in recently invaded areas in
north central United States. Bio Control 57:199–209
Ellis RH, Hong TD, Roberts EH (1985) Handbook of seed
technology for genebanks II. Compendium of specific
germination information and test recommendations.
International Board for Plant Genetic Resources, Rome
Eschtruth AK, Cleavitt NL, Battles JJ et al (2006) Vegetation
dynamics in declining eastern hemlock stands: 9 years of
forest response to hemlock woolly adelgid infestation. Can
J For Res 36:1435–1450
Faanes CA (1984) Wooded islands in a sea of prairie. Am Birds
38:3–6
Flower CE, Knight KS, Rebbeck J et al (2013) The relationship
between the emerald ash borer (Agrilus planipennis) and
ash (Fraxinus spp.) tree decline: using visual canopy con-
dition assessments and leaf isotope measurements to assess
pest damage. For Ecol Manag 303:143–147
Franklin JF, Spies TA, Pelt RV et al (2002) Disturbances and
structural development of natural forest ecosystems with
silvicultural implications, using Douglas-fir forests as an
example. For Ecol Manag 155:399–423
Gandhi KJK, Herms DA (2010a) Direct and indirect effects of
alien insect herbivores on ecological processes and inter-
actions in forests of eastern North America. Biol Invasions
12:389–405
Gandhi KJK, Herms DA (2010b) North American arthropods at
risk due to widespread Fraxinus mortality caused by the
alien emerald ash borer. Biol Invasions 12:1839–1846
Griffith RS (1991) Fraxinus americana. In: Fire effects infor-
mation system (online). USDA Forest Service, Rocky
Mountain Research Station, Fire Sciences Laboratory, p 32
Gucker CL (2005a) Fraxinus nigra. In: Fire effects information
system (online). USDA Forest Service, Rocky Mountain
Research Station, Fire Sciences Laboratory, p 32
Gucker CL (2005b) Fraxinus pennsylvanica. In: Fire effects
information system (online). USDA Forest Service, Rocky
Mountain Research Station, Fire Sciences Laboratory, p 32
Hyatt LA, Casper BB (2000) Seed bank formation during early
secondary succession in a temperate deciduous forest.
J Ecol 88:516–527
Kennedy HE (1990) Fraxinus pennsylvanica Marsh. green ash.
In: Burns RM, Honkala BH (eds) Silvics of North Ameri-
can. Agricultural handbook, vol 654. US Department of
Agriculture, Forest Service, Washington, pp 348–354
Klooster WS (2012) Forest responses to emerald ash borer-
induced ash mortality (Doctoral dissertation). The Ohio
State University, Columbus, p 205
Knight KS, Herms DA, Plumb R, et al. (2012) Dynamics of
surviving ash (Fraxinus spp.) in areas long infested by
emerald ash borer (Agrilus planipennis). In: Sniezko R,
Yanchuk A, Kliejunas J, Palmieri K, Alexander J, Frankel
S (eds) Proceedings of the 4th international workshop on
the genetics of host-parasite interactions in forestry: dis-
ease and insect resistance in forest trees. Eugene. Genetics
technical report PSW-GTR-240. US Department of
Agriculture, Forest Service, Pacific Southwest Research
Station, Albany, pp 143–152
Kurmis V, Kim JH (1989) Black ash stand composition and
structure in Carlton County, Minnesota. Department of
Forest Resources Staff Paper Series, no. 69. University of
Minnesota, Twin Cities
Leak WB (1963) Delayed germination of white ash seeds under
forest conditions. J For 61:768–772
Lesica P (2001) Recruitment of Fraxinus pennsylvanica (Olea-
ceae) in eastern Montana woodlands. Madrono 48:286–292
Liu H, Bauer LS, Gao R et al (2003) Exploratory survey for the
emerald ash borer, Agrilus planipennis (Coleoptera: Bu-
prestidae), and its natural enemies in China. Great Lakes
Entomol 36:191–204
Lovett GM, Canham CD, Arthur MA et al (2006) Forest eco-
system responses to exotic pests and pathogens in eastern
North America. Bioscience 56:395–405
MacFarlane DW, Meyer SP (2005) Characteristics and distri-
bution of potential ash tree hosts for emerald ash borer. For
Ecol Manag 213:15–24
Marquis DA (1975) Seed storage and germination under
northern hardwood forests. Can J For Res 5:478–484
Martin AC, Zim HS, Nelson AL (1951) American wildlife and
plants: a guide to wildlife food habits. Dover Publications,
Inc., New York
McCullough DG, Schneeberger NF, Katovich SA (2008)
Emerald ash borer pest alert. NA-PR-02-04. USDA Forest
Service
Orwig DA (2002) Ecosystem to regional impacts of introduced
pests and pathogens: historical context, questions andissues. J Biogeogr 29:1471–1474
Palik BJ, Ostry ME, Venette RC et al (2012) Tree regeneration
in black ash (Fraxinus nigra) stands exhibiting crown
dieback in Minnesota. For Ecol Manag 269:26–30
Parker GR, Leopold DJ (1983) Replacement of Ulmus ameri-
cana L. in a mature east-central Indiana woods. Bull Torrey
Bot Club 110:482–488
Peters J (2005) Tetrazolium testing handbook. Handbook on
seed testing, 6th edn. Association of Official Seed Analysts
Pickett STA, McDonnell MJ (1989) Seed bank dynamics in
temperate deciduous forest. In: Leck MA, Parker VT,
Simpson RL (eds) Ecology of soil seed banks. Academic
Press, San Diego, p 462
Poland TM, McCullough DG (2006) Emerald ash borer: inva-
sion of the urban forest and the threat to North America’s
ash resource. J For 104:118–124
Pugh SA, Liebhold AM, Morin RS (2011) Changes in ash tree
demography associated with emerald ash borer invasion,
indicated by regional forest inventory data from the Great
Lakes States. Can J For Res 41:2165–2175
Rebek EJ, Herms DA, Smitley DR (2008) Interspecific variation
in resistance to emerald ash borer (Coleoptera: Bupresti-
dae) among North American and Asian ash (Fraxinus
spp.). Environ Entomol 37:242–246
Reiners WA, Reiners NM (1970) Energy and nutrient dynamics
of forest floors in three Minnesota forests. J Ecol
58:497–519
Richardson CJ, Cares CW (1976) An analysis of elm (Ulmus
americana) mortality in a second-growth hardwood forest
in southeastern Michigan. Can J Bot 54:1120–1125
W. S. Klooster et al.
123
Sawma JT, Mohler CL (2002) Evaluating seed viability by an
unimbibed seed crush test in comparison with the tetrazo-
lium test. Weed Technol 16:781–786
Schlesinger RC (1990) Fraxinus americana L. white ash. In:
Burns RM, Honkala BH (eds) Silvics of North America.
Agricultural handbook, vol 654. US Department of Agri-
culture, Forest Service, Washington, pp 333–338
Siegert NW, McCullough DG, Liebhold AM, et al. (2008)
Dendrochronological reconstruction of the establishment
and spread of emerald ash borer. In: Mastro V, Lance D,
Reardon R, Parra G (eds) Emerald ash borer research and
development meeting. Pittsburgh, PA. FHTET 2008–2007.
US Department of Agriculture, Forest Service, Forest
Health Technology Enterprise Team, Morgantown, pp 4–5
Smith A (2006) Effects of community structure on forest sus-
ceptibility and response to the emerald ash borer invasion
of the Huron River Watershed in southeastern Michigan
(Master’s thesis). The Ohio State University, Columbus,
p 122
Tanis SR, McCullough DG (2012) Differential persistence of
blue ash and white ash following emerald ash borer inva-
sion. Can J For Res 42:1542–1550
US Forest Service (2007) Forest inventory and analysis national
core field guide, vol 1. Field data collection procedures for
phase 2 plots. Version 4.0. Available from http://www.fia.
fs.fed.us/library/field-guides-methods-proc/docs/2013/
Core%20FIA%20P2%20field%20guide_6-0_6_27_2013.
pdf. Accessed 28 February 2012
Whitehill JG, Herms DA, Bonello P (2009) Comparative con-
stituitive and induced phloem chemistry of North Ameri-
can, European, and Asian ash species that vary in resistance
to emerald ash borer. In: Lance D, Buck J, Binion D,
Reardon R, Mastro V (eds) Emerald ash borer research and
technology development meeting. Forest Health Technol-
ogy Enterprise Team, Pittsburgh, pp 56–57
Wright JW, Rauscher HM (1990) Fraxinus nigra Marsh. black
ash. In: Burns RM, Honkala BH (eds) Silvics of North
America. Agricultural handbook, vol 654. US Department
of Agricuture, Forest Service, Washington, pp 344–347
Ash (Fraxinus spp.) mortality, regeneration, and seed bank dynamics
123