Embed Size (px)
Citation preview
1
Political and Fiscal Decentralisation: Benefit and Cost
Glenn Withers
Presentation to Crawford School Seminar Series August 2007
2
Consumer Warning: The topic is decentralisation in industrial countries especially Australia
“For federal benefits to be reaped, relatively non-corrupt, socially stable and democratic conditions should be in place”
-Feld, Zimmerman and Doring, IZA, December 2006
3
1. Australian Federalism Is Under Seige
The Commonwealth has been using its financial powers (as seen recently in the Murray Darling Basin plan) and increased legislative power (as seen most recently in NSW v Commonwealth) to intervene more and more in areas of State responsibility. Centralism appears to be the order of the day: there is almost a conventional wisdom among commentators that centralist solutions are the way forward for Australia (Abbott and Costello).
4
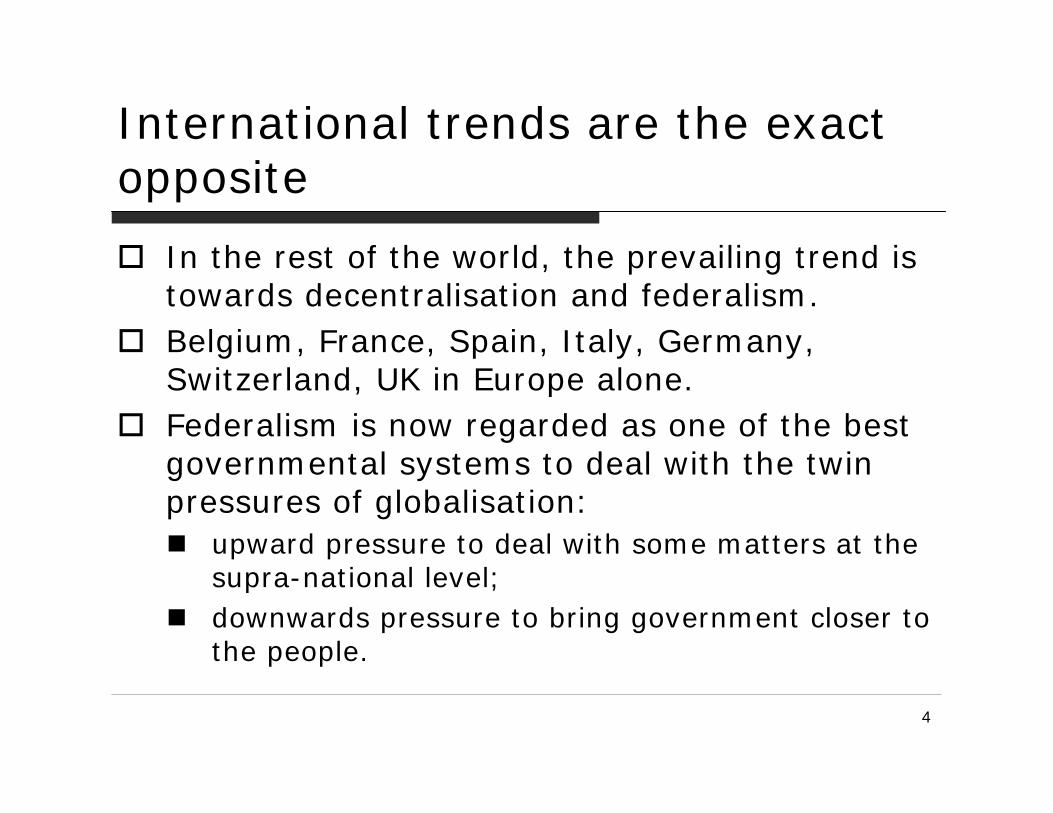
International trends are the exact opposite
In the rest of the world, the prevailing trend is towards decentralisation and federalism. Belgium, France, Spain, Italy, Germany, Switzerland, UK in Europe alone.Federalism is now regarded as one of the best governmental systems to deal with the twin pressures of globalisation:
upward pressure to deal with some matters at the supra-national level; downwards pressure to bring government closer to the people.
5
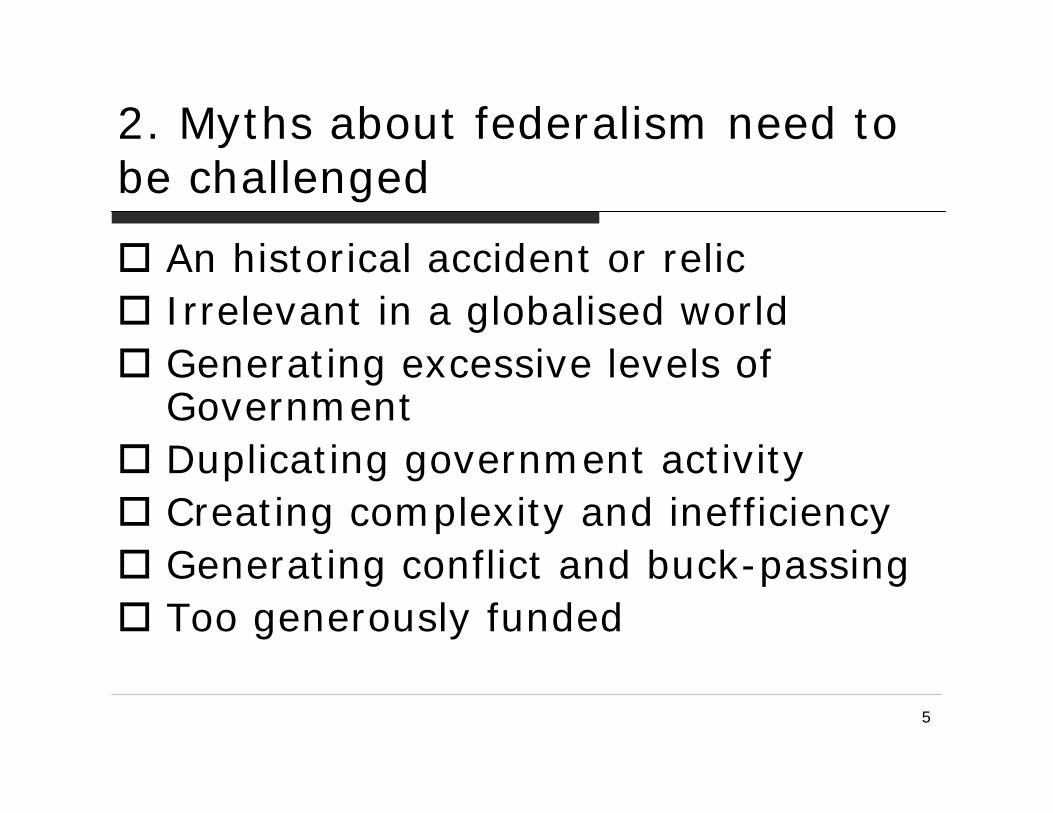
2. Myths about federalism need to be challenged
An historical accident or relicIrrelevant in a globalised worldGenerating excessive levels of GovernmentDuplicating government activityCreating complexity and inefficiencyGenerating conflict and buck-passingToo generously funded

6
The Benefits of Federalism need clear restatement: the six C’s
ChecksChoice CustomisationCompetitionCreativityCo-operation
7
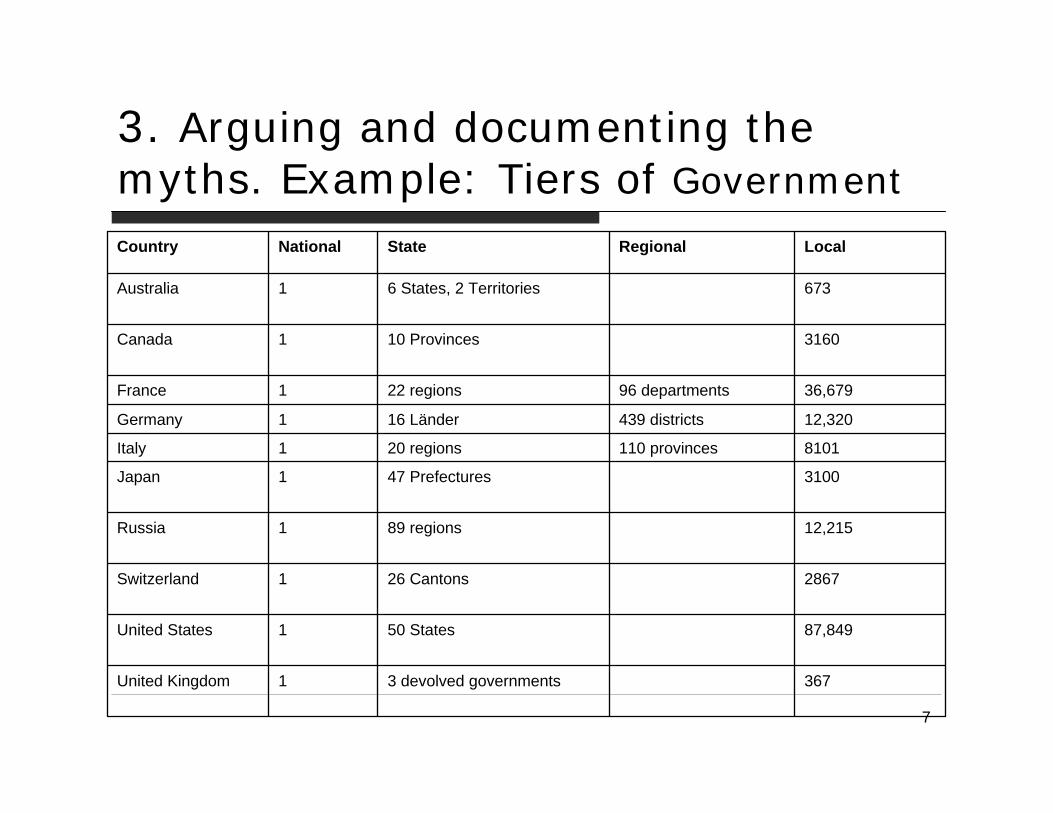
3. Arguing and documenting the myths. Example: Tiers of Government
3673 devolved governments1United Kingdom
87,84950 States1United States
286726 Cantons1Switzerland
12,21589 regions1Russia
310047 Prefectures1Japan
8101 110 provinces20 regions1Italy
12,320439 districts16 Länder1Germany
36,679 96 departments22 regions1France
316010 Provinces1Canada
6736 States, 2 Territories1Australia
LocalRegionalStateNationalCountry
8
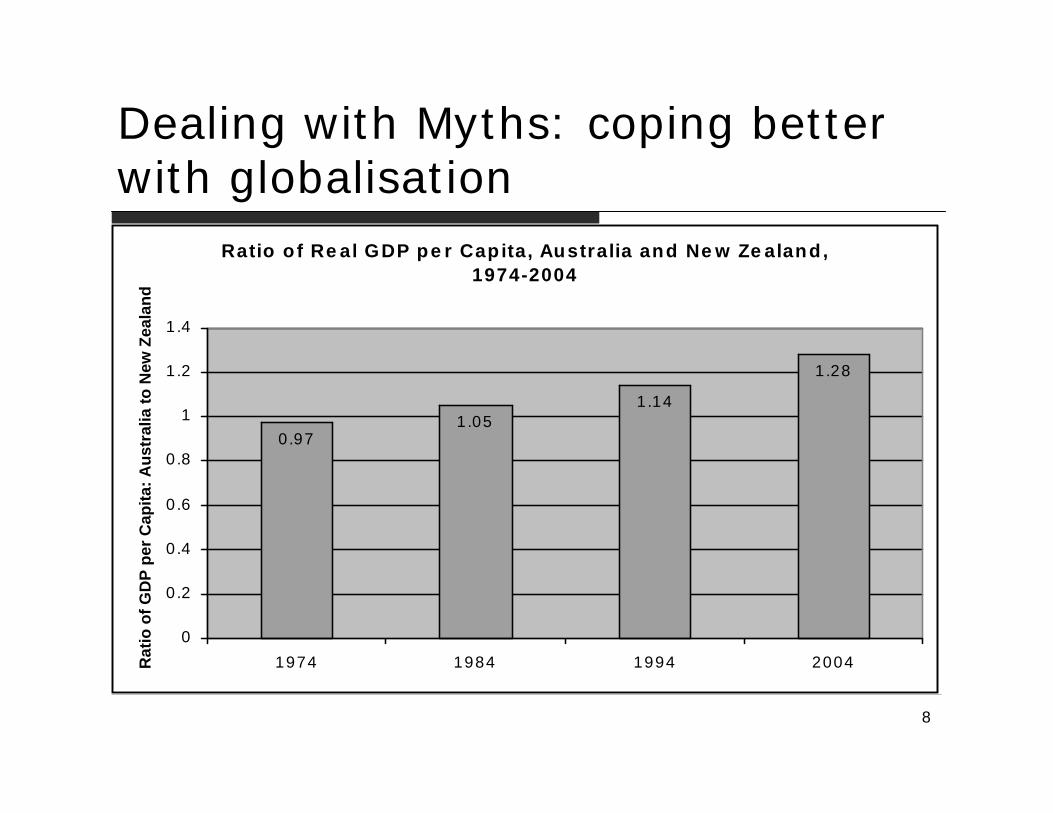
Dealing with Myths: coping better with globalisation
Ratio o f Re al GDP pe r Capita, Australia and Ne w Ze aland, 1974-2004
0.971.05
1.14
1.28
0
0.2
0.4
0.6
0.8
1
1.2
1.4
1974 1984 1994 2004Rat
io o
f GD
P pe
r Cap
ita: A
ustr
alia
to N
ew Z
eala
nd
9
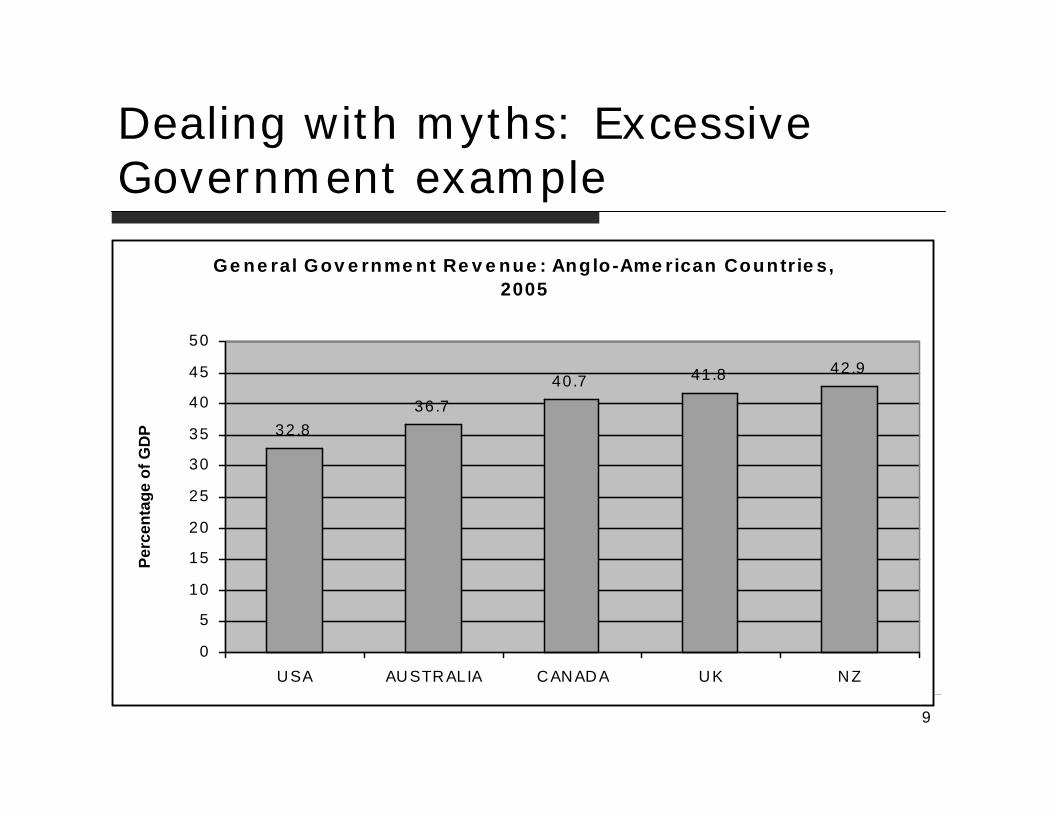
Dealing with myths: Excessive Government example
Ge ne ral Gov e rnme nt Re v e nue : Anglo-Ame rican Countrie s, 2005
32.836.7
40.7 41.8 42.9
0
5
10
15
20
25
30
35
40
45
50
USA AUSTR ALIA CANADA UK NZ
Perc
enta
ge o
f GD
P
10
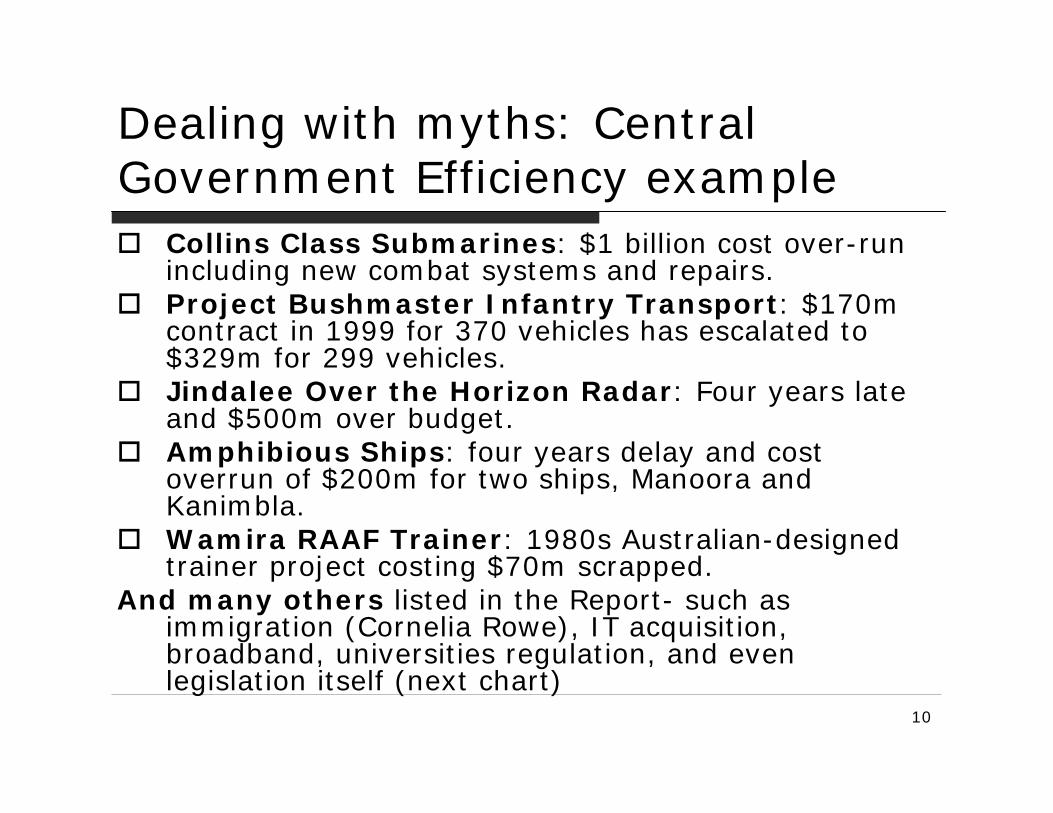
Dealing with myths: Central Government Efficiency example
Collins Class Submarines: $1 billion cost over-run including new combat systems and repairs.Project Bushmaster Infantry Transport: $170m contract in 1999 for 370 vehicles has escalated to $329m for 299 vehicles.Jindalee Over the Horizon Radar: Four years late and $500m over budget.Amphibious Ships: four years delay and cost overrun of $200m for two ships, Manoora and Kanimbla.Wamira RAAF Trainer: 1980s Australian-designed trainer project costing $70m scrapped.
And many others listed in the Report- such as immigration (Cornelia Rowe), IT acquisition, broadband, universities regulation, and even legislation itself (next chart)
11
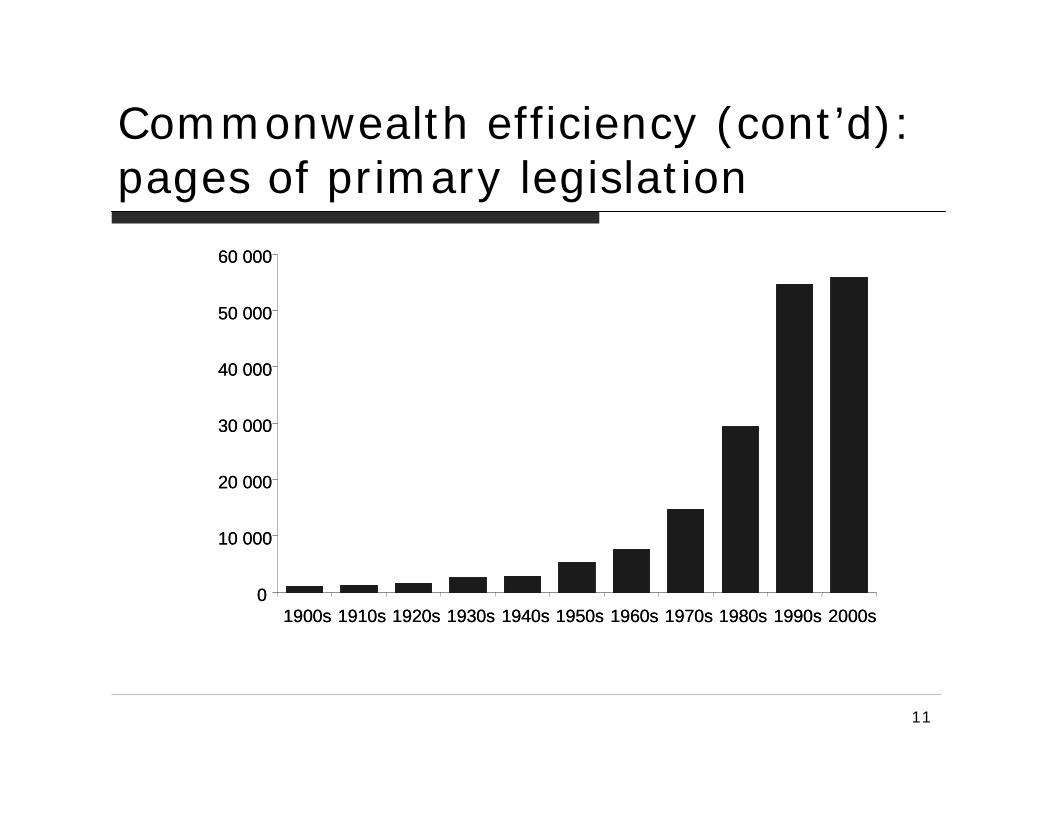
Commonwealth efficiency (cont’d): pages of primary legislation
0
10 000
20 000
30 000
40 000
50 000
60 000
1900s 1910s 1920s 1930s 1940s 1950s 1960s 1970s 1980s 1990s 2000s0
10 000
20 000
30 000
40 000
50 000
60 000
1900s 1910s 1920s 1930s 1940s 1950s 1960s 1970s 1980s 1990s 2000s
12
Dealing with myths: the Growth Tax example
Net payments to the States over the whole post-GST period remain at levels below the pre-GST average of 6% of GDP for the whole period of the 1980s and 1990s. During the same period, the Commonwealth’s revenue rose by a further 2% to 20% of GDP.
13
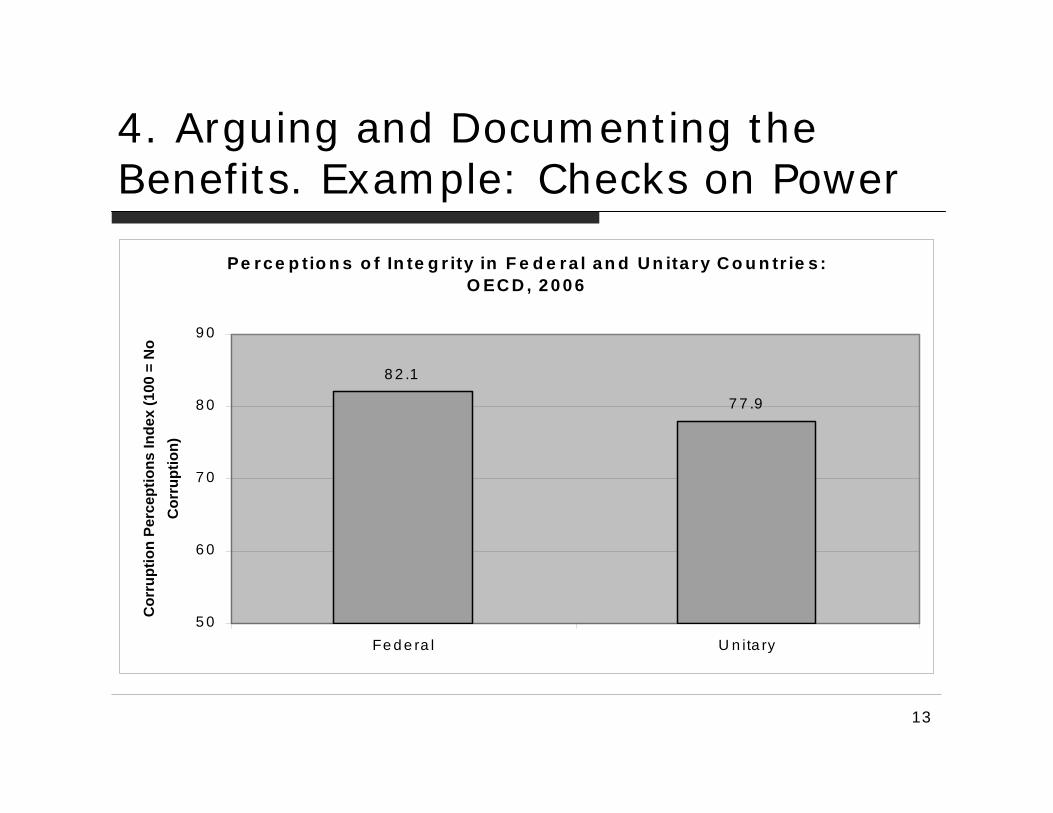
4. Arguing and Documenting the Benefits. Example: Checks on Power
Pe rc e p tio n s o f In te g r ity in F e d e ra l a n d U n ita ry C o u n tr ie s : O EC D , 2 0 0 6
8 2 .1
7 7 .9
5 0
6 0
7 0
8 0
9 0
Fe d e ra l U n ita ry
Cor
rupt
ion
Perc
eptio
ns In
dex
(100
= N
o C
orru
ptio
n)
14
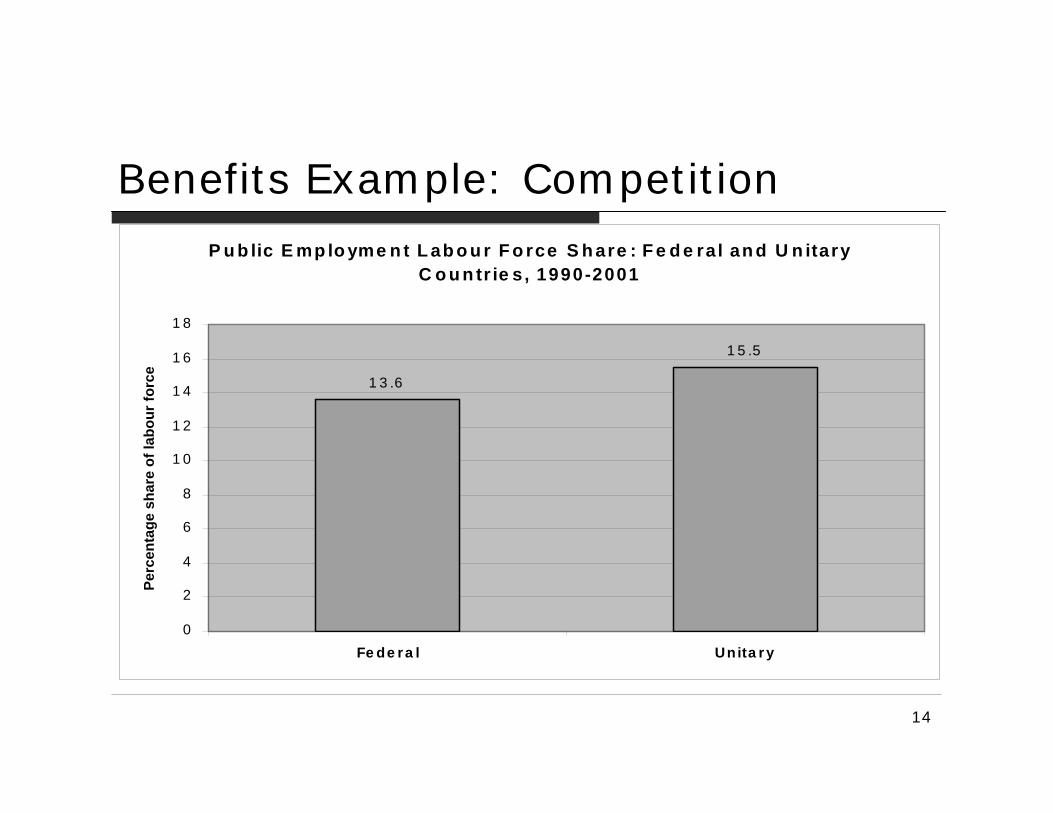
Benefits Example: CompetitionP u b lic E mp lo yme n t L ab o u r F o rce S h are : F e d e ra l an d U n itary
C o u n tr ie s, 1990-2001
1 5 .5
1 3 .6
0
2
4
6
8
1 0
1 2
1 4
1 6
1 8
Fe de ra l Unita r y
Perc
enta
ge s
hare
of l
abou
r for
ce
15
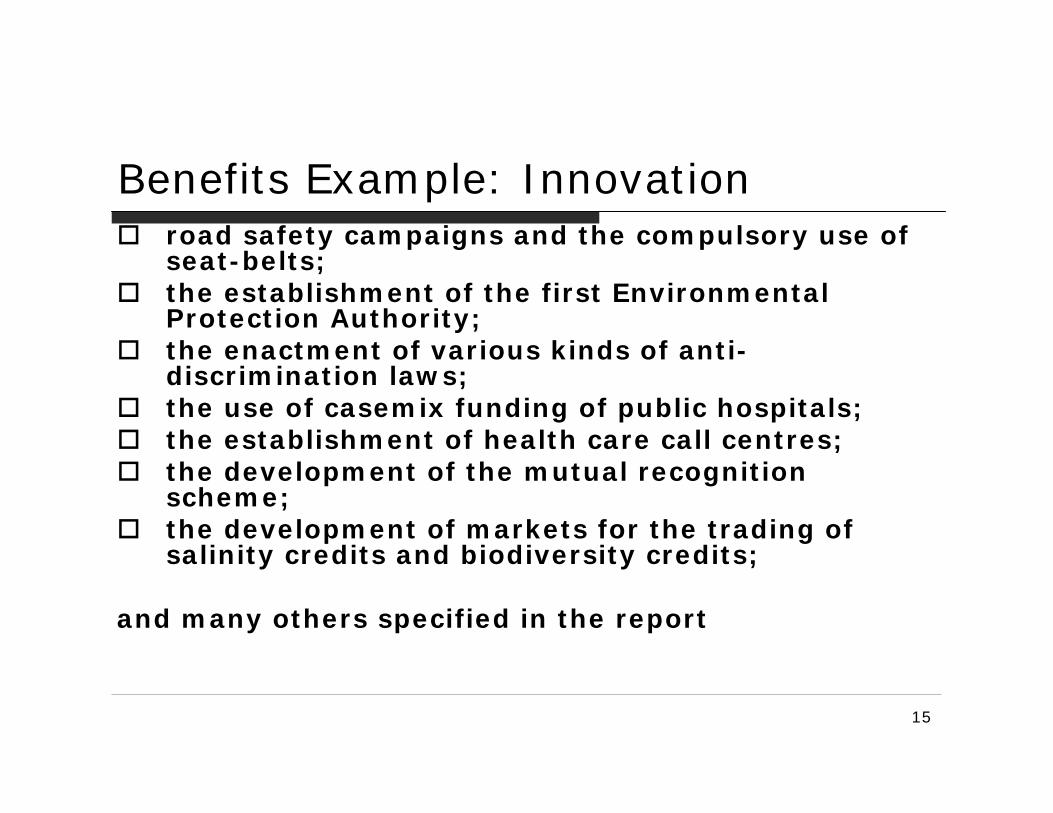
Benefits Example: Innovationroad safety campaigns and the compulsory use of seat-belts;the establishment of the first Environmental Protection Authority;the enactment of various kinds of anti-discrimination laws; the use of casemix funding of public hospitals;the establishment of health care call centres;the development of the mutual recognition scheme;the development of markets for the trading of salinity credits and biodiversity credits;
and many others specified in the report
16
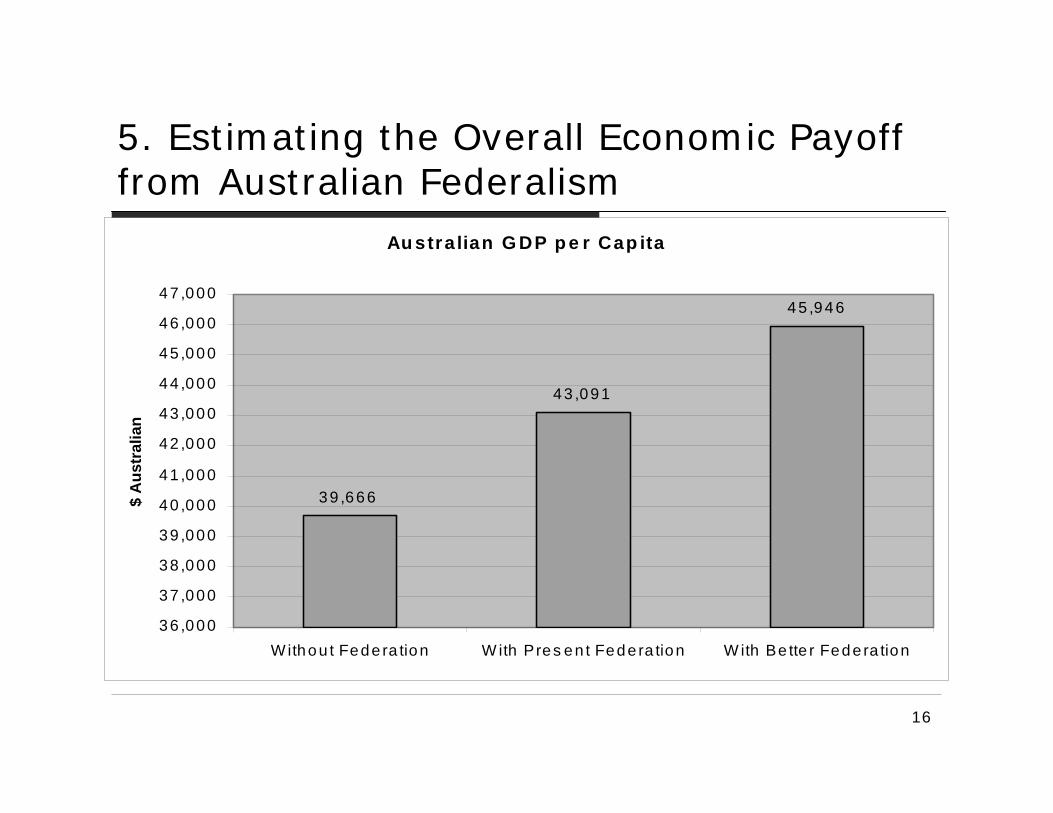
5. Estimating the Overall Economic Payoff from Australian Federalism
Au stra lian G DP p e r Cap ita
39 ,666
43 ,091
45 ,946
36 ,000
37 ,000
38 ,000
39 ,000
40 ,000
41 ,000
42 ,000
43 ,000
44 ,000
45 ,000
46 ,000
47 ,000
Withou t Fede ra tion W ith Pres en t Fede ra tion W ith Be tte r Fede ra tion
$ A
ustr
alia
n
17
6. Reform Options
1. Abolish the States and establish regional governments
2. Continue the centralist drift: including through opportunist federalism
3. Make federalism work better: co-operation and/or competition?
18
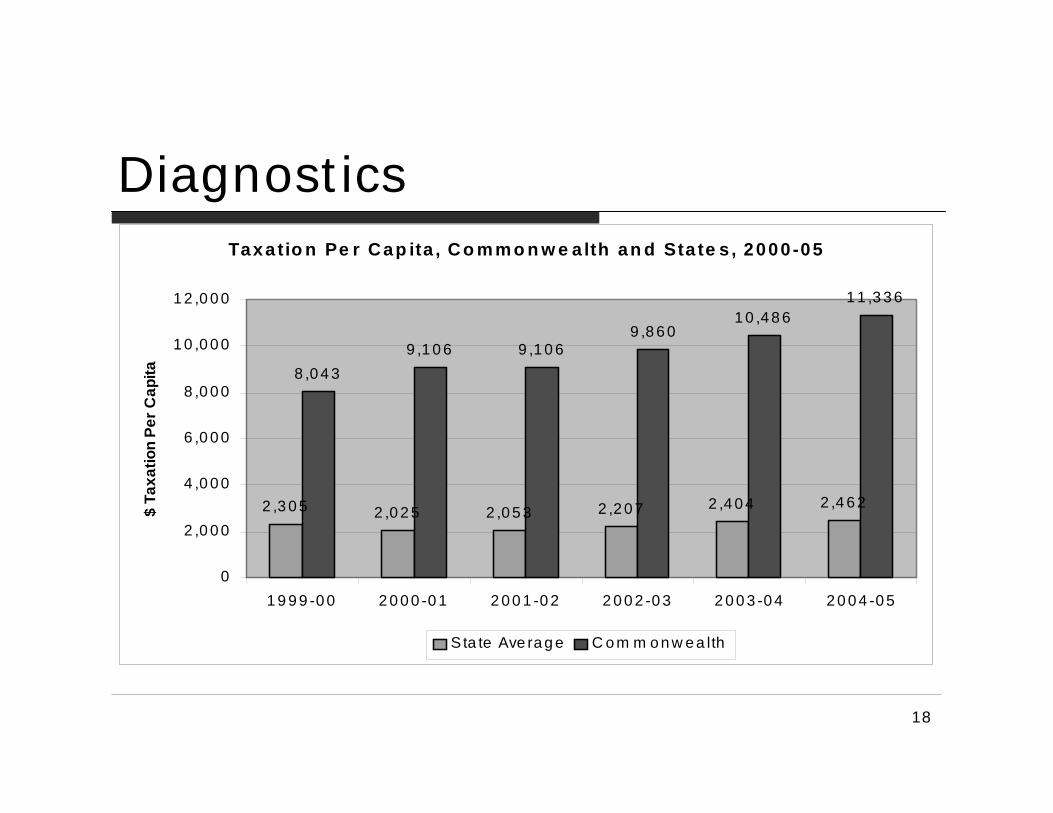
DiagnosticsTaxatio n Pe r Cap ita , C o m m o n w e a lth an d Sta te s , 2000 -05
2 ,3 0 5 2 ,0 2 5 2 ,0 5 3 2 ,2 0 7 2 ,4 0 4 2 ,4 6 2
8 ,0 4 39 ,1 0 6 9 ,1 0 6
9 ,8 6 01 0 ,4 8 6
1 1 ,3 3 6
0
2 ,0 0 0
4 ,0 0 0
6 ,0 0 0
8 ,0 0 0
1 0 ,0 0 0
1 2 ,0 0 0
1 9 9 9 -0 0 2 0 0 0 -0 1 2 0 0 1 -0 2 2 0 0 2 -0 3 2 0 0 3 -0 4 2 0 0 4 -0 5
$ Ta
xatio
n Pe
r Cap
ita
Sta te Ave ra g e C o m m o n w e a lth
19
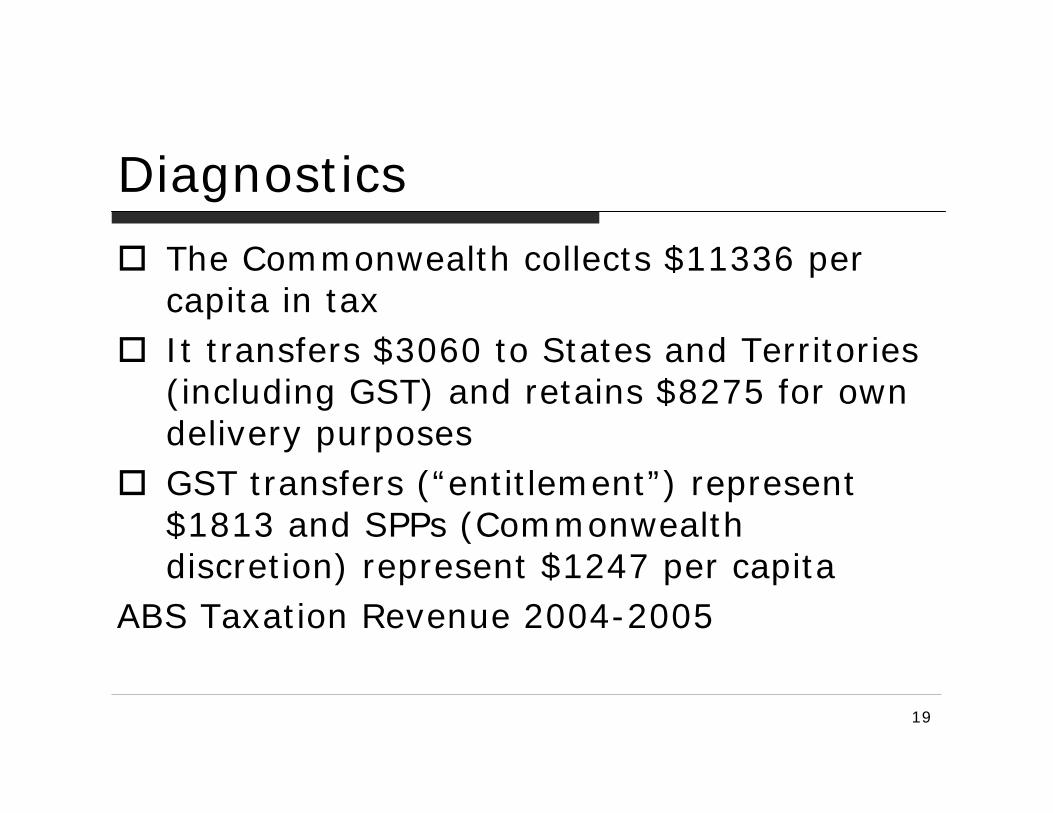
Diagnostics
The Commonwealth collects $11336 per capita in taxIt transfers $3060 to States and Territories (including GST) and retains $8275 for own delivery purposesGST transfers (“entitlement”) represent $1813 and SPPs (Commonwealth discretion) represent $1247 per capita
ABS Taxation Revenue 2004-2005
20
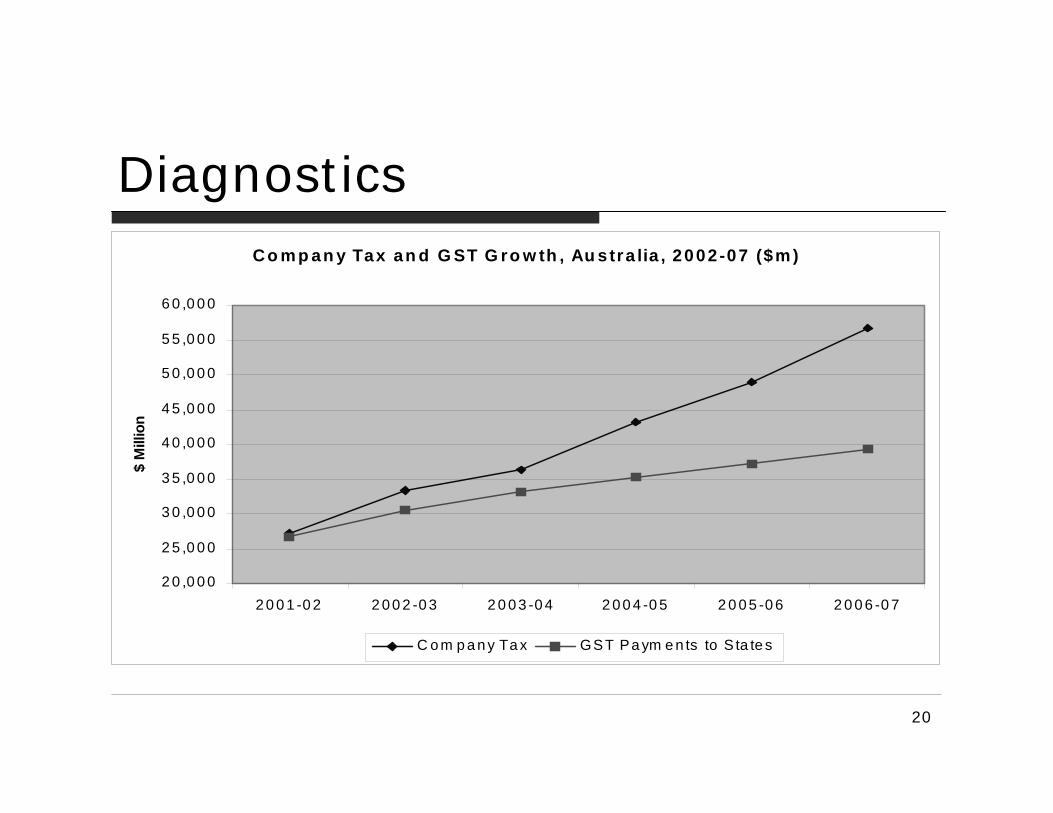
DiagnosticsCo m p an y Tax an d G ST G ro w th , Au stra lia , 2002 -07 ($m )
2 0 ,0 0 0
2 5 ,0 0 0
3 0 ,0 0 0
3 5 ,0 0 0
4 0 ,0 0 0
4 5 ,0 0 0
5 0 ,0 0 0
5 5 ,0 0 0
6 0 ,0 0 0
2 0 0 1 -0 2 2 0 0 2 -0 3 2 0 0 3 -0 4 2 0 0 4 -0 5 2 0 0 5 -0 6 2 0 0 6 -0 7
$ M
illio
n
C o m p a n y Ta x GST Pa ym e n ts to S ta te s
21
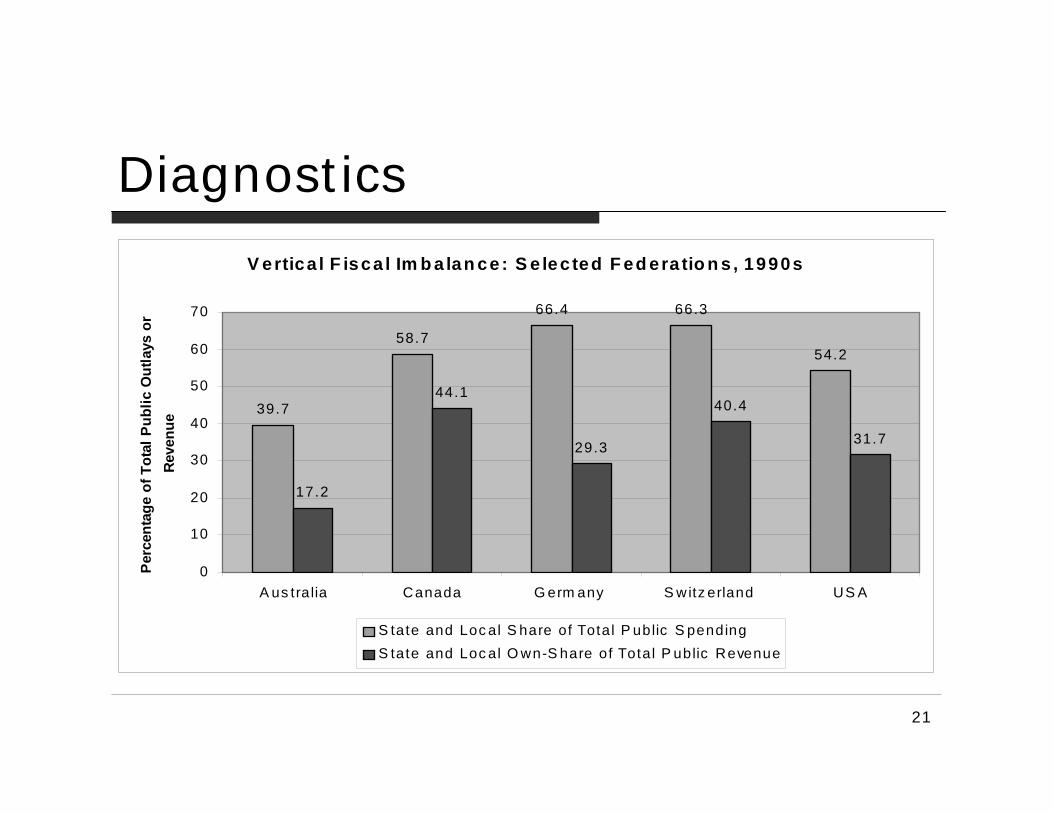
Diagnostics
V ertica l F isca l Im b a lan ce: S e lec ted F ed era tio n s , 1990s
39.7
58.7
66.4 66.3
54.2
17.2
44.1
29.3
40.4
31.7
0
10
20
30
40
50
60
70
A us tra lia Canada G erm any S witz erland US A
Per
cent
age
of T
otal
Pub
lic O
utla
ys o
r R
even
ue
S tate and Loc al S hare of Total P ublic S pendingS tate and Loc al O wn-S hare of Total P ublic Revenue
22
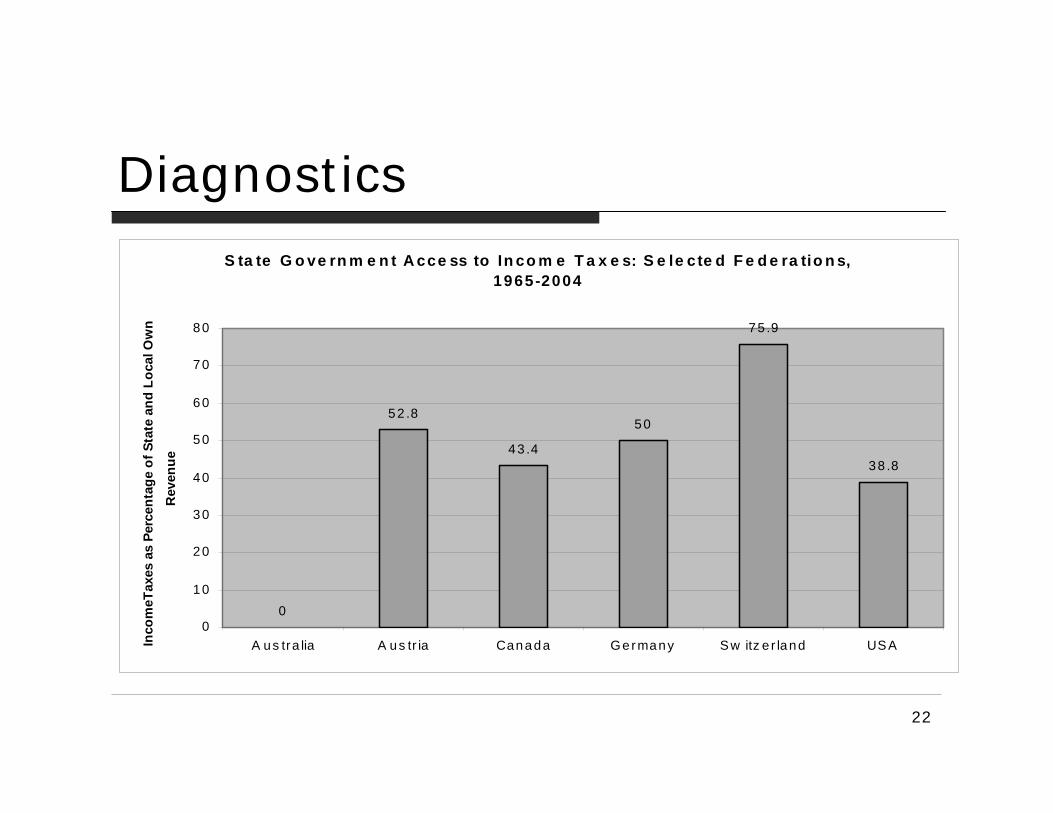
DiagnosticsS ta te G o ve rn m e n t A cce ss to In co m e T a x e s: S e le cte d F e d e ra tio n s,
1965-2004
0
52 .8
43 .4
50
75 .9
38 .8
0
10
20
30
40
50
60
70
80
A us tra lia A us tr ia Canada Germany Sw itz e r land USAInco
meT
axes
as
Perc
enta
ge o
f Sta
te a
nd L
ocal
Ow
n R
even
ue
23
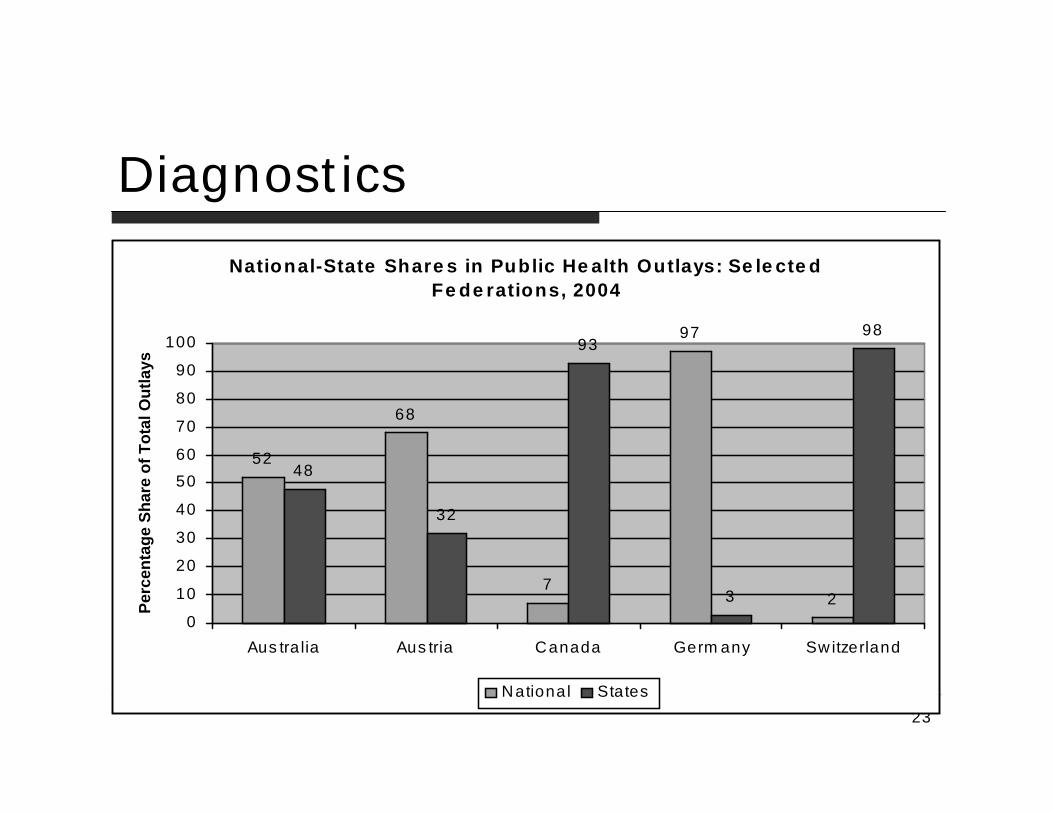
Diagnostics
National-State Share s in Public He alth Outlays: Se le cte d Fe de rations, 2004
52
68
7
97
2
48
32
93
3
98
0
10
20
30
40
50
60
70
80
90
100
Aus tra lia Aus tria Canada Germ any Switzerland
Perc
enta
ge S
hare
of T
otal
Out
lays
National States
24
Making Federalism Work Better
Reallocate roles between Commonwealth and State governmentsImprove mechanisms for inter-governmental co-operation Reform federal-fiscal financial relations Hold a Constitutional Convention for constitutional reform
25
Conclusions:The myths about federalism that are not borne out by the evidence.
We need a more constructive debate that takes into account international experience; it needs to balance fairly the advantages against the disadvantages.
Such a debate will assist reform of our federal system, taking full advantage of the benefits while eliminating or reducing the problems.
The potential ‘reform dividend’ from a new federalism is an estimated $86 billion pa or more.
26
Appendix
Other Studies (Costs Only): Drummond, Access EconomicsPrevious Studies Updated: Dowrick & Nguyen, Castles & DowrickPrevious Studies Extended: Twomey& Withers
27
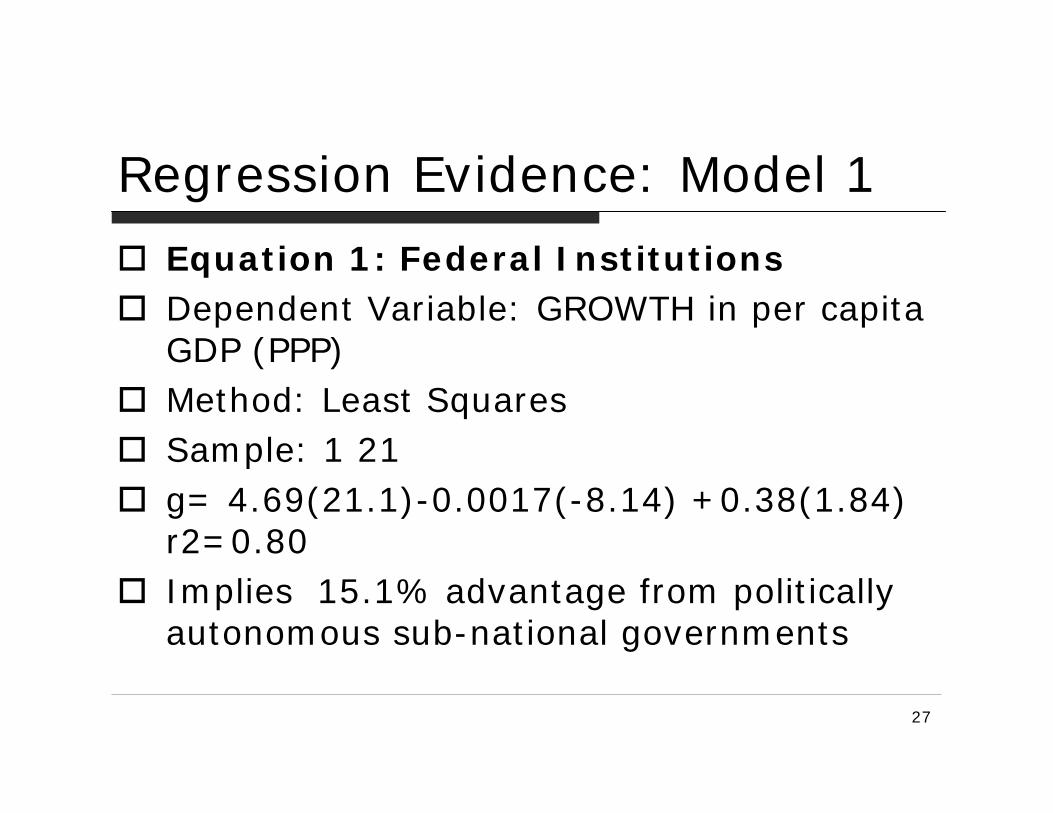
Regression Evidence: Model 1
Equation 1: Federal InstitutionsDependent Variable: GROWTH in per capita GDP (PPP)Method: Least SquaresSample: 1 21g= 4.69(21.1)-0.0017(-8.14) +0.38(1.84) r2=0.80Implies 15.1% advantage from politically autonomous sub-national governments
28
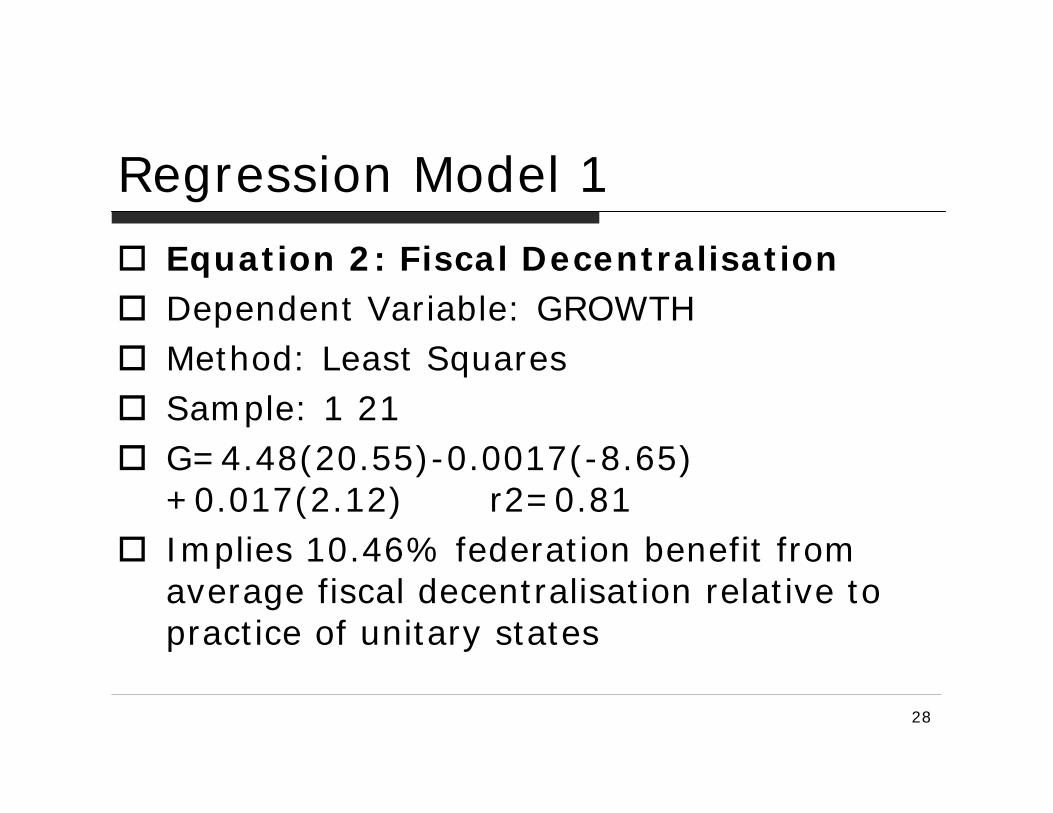
Regression Model 1
Equation 2: Fiscal DecentralisationDependent Variable: GROWTHMethod: Least SquaresSample: 1 21G=4.48(20.55)-0.0017(-8.65) +0.017(2.12) r2=0.81Implies 10.46% federation benefit from average fiscal decentralisation relative to practice of unitary states
29
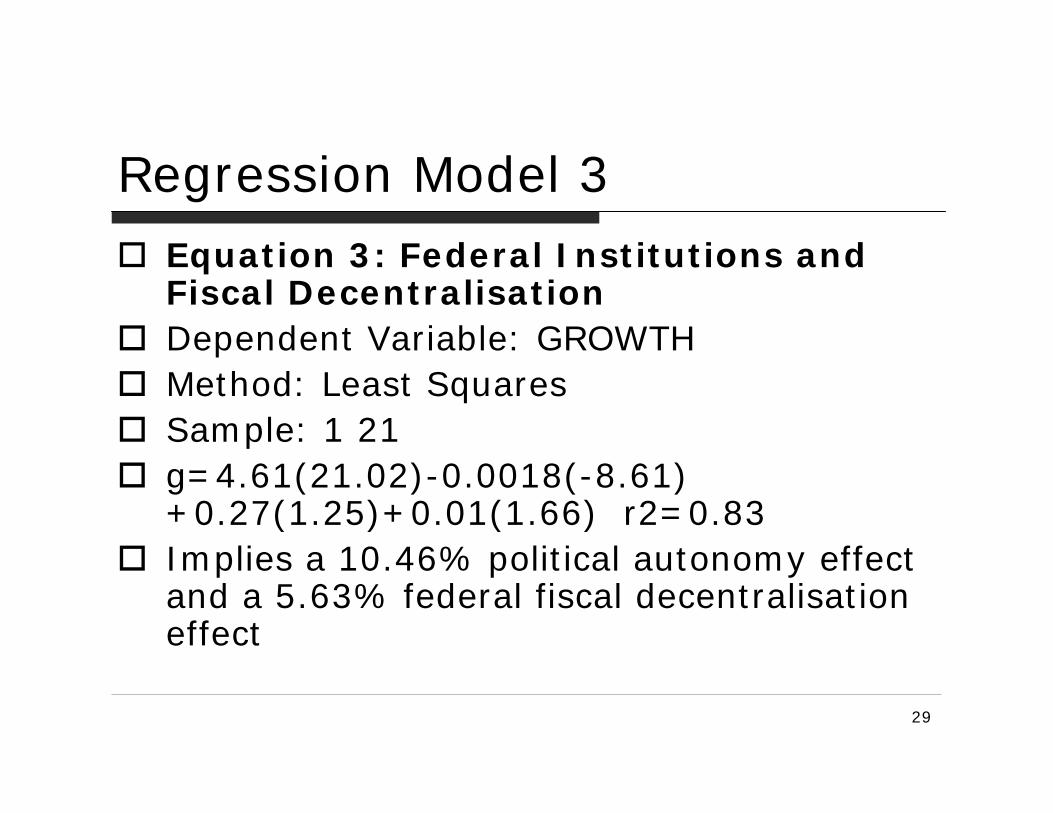
Regression Model 3Equation 3: Federal Institutions and Fiscal DecentralisationDependent Variable: GROWTHMethod: Least SquaresSample: 1 21g=4.61(21.02)-0.0018(-8.61) +0.27(1.25)+0.01(1.66) r2=0.83Implies a 10.46% political autonomy effect and a 5.63% federal fiscal decentralisationeffect

30
Source
Drawn from A.Twomey and G.Withers, Australia’s Federal Future, Federalist Paper No. 1, A Report for the Council for the Australian Federation, April 2007.Accessible on Crawford School website: Glenn Withers’ staff page: www.crawford.anu.edu.auOr contact [email protected] for supply of an electronic copy.