Embed Size (px)
Citation preview
GSC Biological and Pharmaceutical Sciences, 2018, 05(02), 126–131
Available online at GSC Online Press Directory
GSC Biological and Pharmaceutical Sciences
e-ISSN: 2581-3250, CODEN (USA): GBPSC2
Journal homepage: https://www.gsconlinepress.com/journals/gscbps
Corresponding author E-mail address:
Copyright © 2018 Author(s) retain the copyright of this article. This article is published under the terms of the Creative Commons Attribution Liscense 4.0.
(RE SE AR CH AR T I CL E)
Pollen allergy in relation to palynology and taxonomy of flowering plants at Abubakar Tafawa Balewa University, Yelwa Campus Bauchi, Bauchi State
Deba Fatima Aliyu 1, *, Ibrahim Yusuf Okpanachi 2 and Ezra Abalis Gaya 1
1 Department of Biological Science, Abubakar Tafawa Balewa University, Bauchi, Nigeria. 2 Department of Botany, University of Lagos, Nigeria.
Publication history: Received on 08 October 2018; revised on 17 November 2018; accepted on 20 November 2018
Article DOI: https://doi.org/10.30574/gscbps.2018.5.2.0112
Abstract
Pollen is a crucial part in flowering plants with a special structure and function. Pollens produce metabolites like proteins, nucleic acids, carbohydrates, lipids and vitamins that are responsible for their physiological and metabolic activities. These metabolites cause various types of allergies in humans. Samples and records were taken at the Yelwa campus of Abubakar Tafawa Balewa University, Bauchi. Fifty (51) species of pollens belonging to 28 families were identified. The most dominant families were Meliaceae, Fabaceae and Anacardiaceae. The family with most pollen was Fabaceae at 29.05 % followed by the Meliaceae at 12.11 % and Anacardiaceae 10.10%. The highest pollen counts were in the month of November (368) followed by December (340). Correlation was used to determine the relationship between pollen distribution and some meteorological parameters. It was observed that pollen concentration correlated positively with air pressure, temperature, wind direction and negatively correlated with rainfall and relative humidity. Allergic data gathered from Yelwa campus showed more allergic cases during the month of November and December. This study suggest that pollen may be the causative agents of most allergic cases in the studied area.
Keywords: Allergies; Pollen; Temperature; Relative humidity; Rainfall
1. Introduction
Pollen is a crucial part in the flowering plants with a special structure and function. Pollen is a single celled microgametophytes of seed plants, which produce sperm cells. Pollen grains have exine, which protects the sperm cells during movement from the stamens to the pistil of flowering plants.
Numbers of metabolites pollen grain contains like proteins; nucleic acids; carbohydrates, lipids and vitamins which are responsible for their physiological and metabolic activities [1]. Pollen grains releases proteins and other chemical metabolites in the environment at different rates and in different quantities depending primarily on specific differences. Such differences are responsible for the different types of allergic reactions caused by pollen grains [2]. Pollen concentration in the atmosphere depends partly on pollen dispersal of local flora and partly on the atmospheric transport of pollen from adjacent and distant regions. In analyzing the temporal and spatial variations of pollen concentrations; it is also necessary to address the meteorological and environmental factors such as temperature, precipitation, relative humidity, sunshine durations, wind speed and direction [3], [4], [5]. These factors are crucial both for the release of the pollen grains and for their atmospheric transport [6], [7].
Deba et al. / GSC Biological and Pharmaceutical Sciences 2018, 05(02), 126–131
127
The human immune system is a complex system that aims to trigger responses to dangerous foreign substances. Allergy is a condition in which immunoglobulin E (IgE) antibody-mediated immunologic responses occur in reaction to harmless antigens and are tailored at structures generally considered to be safe.
Production of immunoglobulin E (IgE) antibodies against the allergen leads to the excessive activation of certain white blood cells that result in an excessive inflammatory response in an allergic individual. Typical symptoms include allergic conjunctivitis (red eyes), allergic rhinitis (a runny nose) and contact dermatitis (skin inflammation/rash) [8].
Allergen exposure during the pollen season is a low-dose challenge over a long period and is more like the natural course of allergy development than high-dose allergen challenge. It is known from both experimental studies and real life that very high doses of allergen can elicit asthma symptoms in non-asthmatics [9].
2. Material and methods
2.1. Study Area
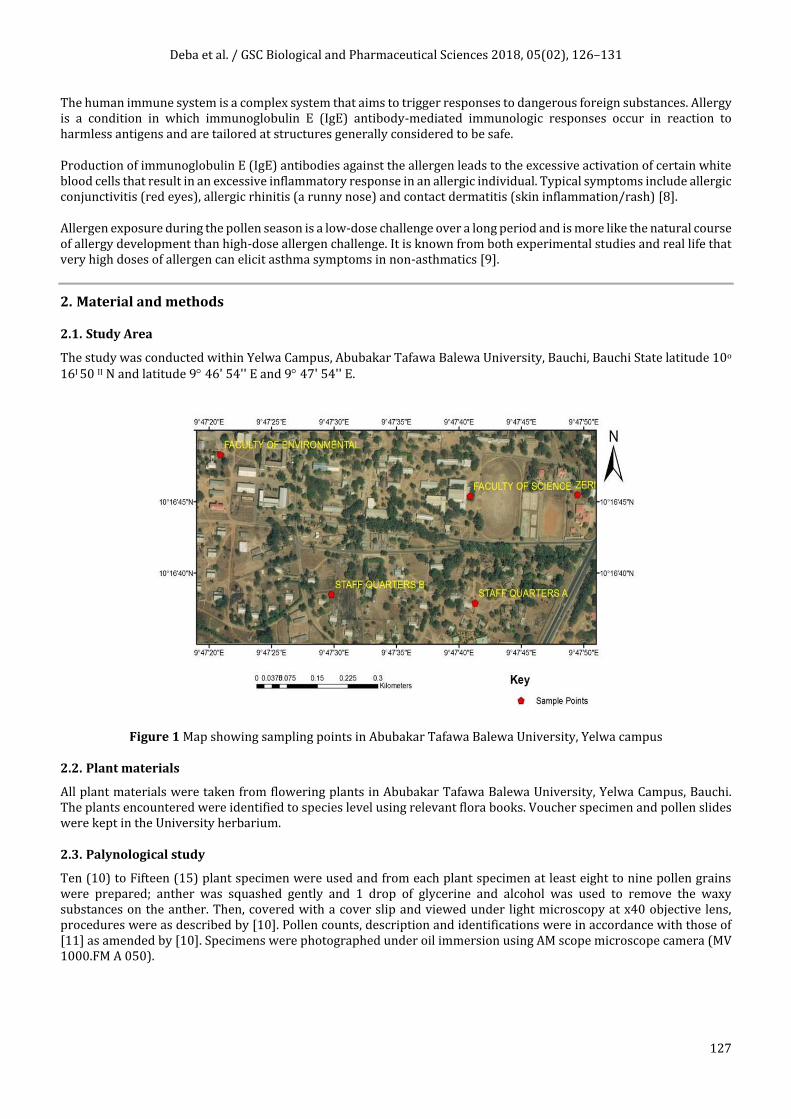
The study was conducted within Yelwa Campus, Abubakar Tafawa Balewa University, Bauchi, Bauchi State latitude 10o
16I 50 II N and latitude 9 46' 54'' E and 9 47' 54'' E.
Figure 1 Map showing sampling points in Abubakar Tafawa Balewa University, Yelwa campus
2.2. Plant materials
All plant materials were taken from flowering plants in Abubakar Tafawa Balewa University, Yelwa Campus, Bauchi. The plants encountered were identified to species level using relevant flora books. Voucher specimen and pollen slides were kept in the University herbarium.
2.3. Palynological study
Ten (10) to Fifteen (15) plant specimen were used and from each plant specimen at least eight to nine pollen grains were prepared; anther was squashed gently and 1 drop of glycerine and alcohol was used to remove the waxy substances on the anther. Then, covered with a cover slip and viewed under light microscopy at x40 objective lens, procedures were as described by [10]. Pollen counts, description and identifications were in accordance with those of [11] as amended by [10]. Specimens were photographed under oil immersion using AM scope microscope camera (MV 1000.FM A 050).
Deba et al. / GSC Biological and Pharmaceutical Sciences 2018, 05(02), 126–131
128
2.4. Metrological data
Meteorological parameters over the study period were obtained from Nigerian Metreological Agency (NIMET), Bauchi Metropolis.
2.5. Allergic data
Allergic data were collected from ATBU medical center Yelwa Campus.
2.6. Statistical analysis
Mean and the corresponding standard error, simple percentage and correlation were carried out using SPSS version 21.
3. Results
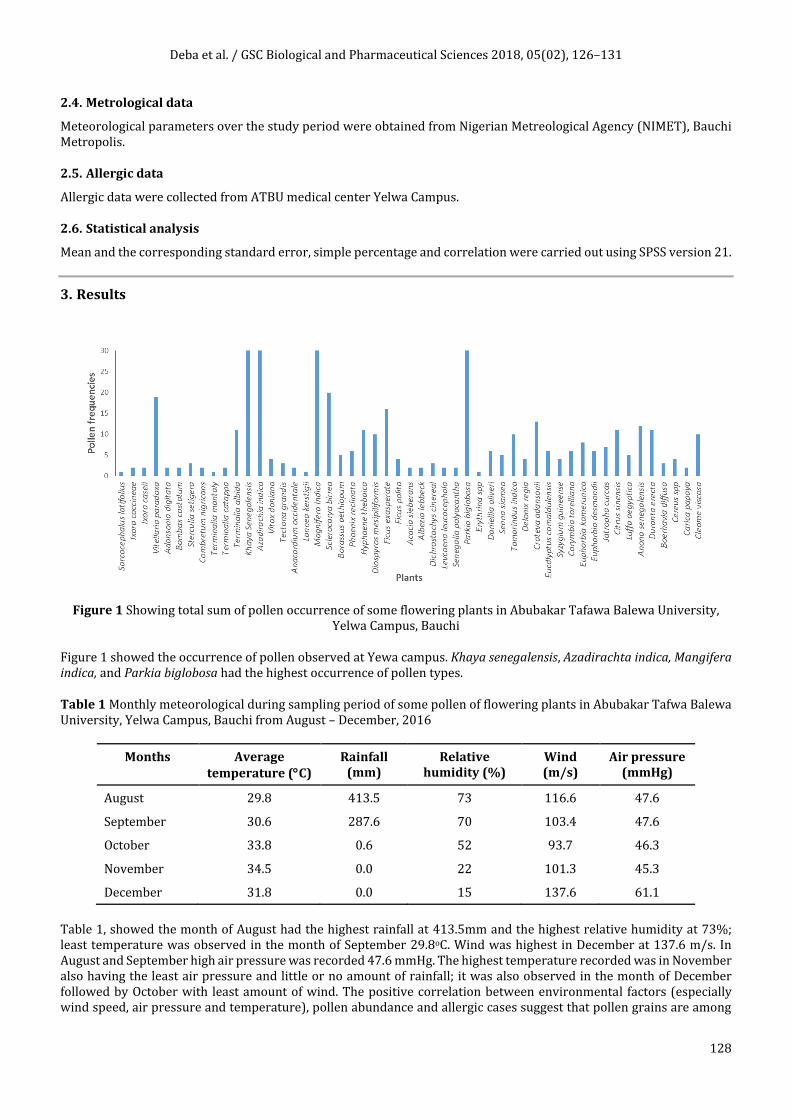
Figure 1 Showing total sum of pollen occurrence of some flowering plants in Abubakar Tafawa Balewa University, Yelwa Campus, Bauchi
Figure 1 showed the occurrence of pollen observed at Yewa campus. Khaya senegalensis, Azadirachta indica, Mangifera indica, and Parkia biglobosa had the highest occurrence of pollen types.
Table 1 Monthly meteorological during sampling period of some pollen of flowering plants in Abubakar Tafwa Balewa University, Yelwa Campus, Bauchi from August – December, 2016
Months Average temperature (C)
Rainfall (mm)
Relative humidity (%)
Wind (m/s)
Air pressure (mmHg)
August 29.8 413.5 73 116.6 47.6
September 30.6 287.6 70 103.4 47.6
October 33.8 0.6 52 93.7 46.3
November 34.5 0.0 22 101.3 45.3
December 31.8 0.0 15 137.6 61.1
Table 1, showed the month of August had the highest rainfall at 413.5mm and the highest relative humidity at 73%; least temperature was observed in the month of September 29.8oC. Wind was highest in December at 137.6 m/s. In August and September high air pressure was recorded 47.6 mmHg. The highest temperature recorded was in November also having the least air pressure and little or no amount of rainfall; it was also observed in the month of December followed by October with least amount of wind. The positive correlation between environmental factors (especially wind speed, air pressure and temperature), pollen abundance and allergic cases suggest that pollen grains are among
Deba et al. / GSC Biological and Pharmaceutical Sciences 2018, 05(02), 126–131
129
the major allergens of the studied environment, Yelwa campus, A.T.B.U, Bauchi. This also, reflects the environmental implications of pollen grains in the studied area and suggest necessary precautionary measures.
Table 2 Monthly cases of allergies between sampling periods from August – December, 2016 at Abubakar Tafawa Balewa University Yelwa Campus Medical Bay
Sr. No. Months Number of allergic cases
1 August 71
2 September 89
3 October 94
4 November 109
5 December 112
In relation to allergy data gathered from Abubakar Tafawa Balewa University medical care at Yelwa Campus Bauchi in table 2. Highest occurrence of allergy was observed in November and December. This could be as a result of less humid condition and relatively strong wind which can aid pollen distribution by wind.
Table 3 Correlation between meteorological data and monthly pollen occurrence
Metrological data Correlations Monthly pollen occurrence
(P>0.05)
Rainfall -0.895* 0.808
Relative Humidity -0.967**
Average Temperature 0.619
Wind 0.366
Air Pressure 0.600
* - Correlation is significant at the 0.05 level (2-tailed). **- Correlation is significant at the 0.01 level (2-tailed).
4. Discussion
Khaya senegalensis, Azadirachta indica, Mangifera indica, and Parkia biglobosa had the highest occurrence of pollen types observed at Yelwa campus According to [10], Entomophilis (insect pollinated) plant produce relatively few pollen grains. Plants having only a portion of their pollen grains airborne are termed amiphiphilious. Metrological data showed August had the highest rainfall at 413.5 mm followed by September with the least temperature at 29.8 C and the highest relative humidity. Wind was highest at December at 137.6 m/s followed by August with high air pressure at 47.6 mmHg followed by August and September. The highest temperature recorded at November also having the least air pressure and little or no amount of rainfall, also recorded at December followed by October with least amount of wind.
In this study pollen concentration correlated positively with air pressure, temperature, wind direction at 0.619, 0.366, 0.600 and negatively correlated with rainfall and relative humidity at -0.895, -0.967 which showed significance at p<0.05and p<0.01. Temperature affects the hygroscopic movement and water rupture of pollen grains that help to liberate pollen easily to the atmosphere [13]. Rebeiro et al., (2003), showed a significant correlation between airborne pollen concentration and certain meteorological parameters [14]. Pollen concentration positively correlated with temperature, wind direction and negatively correlated with rainfall and number of rainy days. Nevertheless, weather variables (wind, humidity, temperature, etc.) also influence pollen and spore behaviour and dispersion in the atmosphere [15]. In a 2008 study, Kasprzyk found that several meteorologic variables were influential in the daily ragweed pollen concentration. The maximum, mean, and change in temperature and the dew point variables were positively correlated with pollen concentration, whereas humidity was negatively correlated with pollen concentration. The higher cases of allergies in November and December observed in the present investigation can be attributed to higher concentration and movement of pollen grains during those period, further implicating grains as one of the major causes of allergies in the studied environment.
This should trigger the need for sensitization and suggested precautionary measures to minimize or curtail this environmental challenge. Pollen distribution across the observed showed highest observed pollen occurrence at
Deba et al. / GSC Biological and Pharmaceutical Sciences 2018, 05(02), 126–131
130
December 51 followed by October at 49 and the least was August. In relation to allergy data gathered from Abubakar Tafawa Balewa University medical care at Yelwa Campus Bauchi. Highest occurrence of allergy was observed at November and December. This could be attributed to excessive wind blow which aids pollen dispersal leading to increased respiratory problems within that period of time. Cakmak et al., (2002), reported that when people who have a pollen allergy inhale pollen which is carried by wind or bird from plant, they get allergy symptoms and that people can be allergic to different types of pollen [16]. Exposure to tree pollen is associated with increases in exacerbations of both asthma and allergic rhinitis [17-21] as well as the risk of developing allergic sensitization to pollen of the same type, with a particularly strong association between pollen exposure during infancy and subsequent allergic sensitization [21]. For example, one study found an increased risk of allergic sensitization to birch (Betula spp.) pollen in children at age 4.5 years who were exposed to an unusually high birch pollen season during infancy [22]
However, the nascent evidence base linking trees to health has pointed to possible adverse effects as well as health benefits. Recent work has focused on the human health implications of tree canopy coverage [22], but has not been able to evaluate the independent or mediating role of local variation in tree pollen exposure. Climatic changes influence vegetative growth, reproductive cycle and in turn, pollen counts. Relative humidity, temperature, wind speed and rainfall are the most important factors in daily variations of pollen grains [23]. The warm dry season stimulates flowering in some tree taxa and aids dehiscence [23].
5. Conclusion
Statistical analysis showed that air pressure, temperature and wind are positively correlated, while rainfall and relative humidity are negatively correlated to pollen concentration within the period of sampling. Data collected from Abubakar Tafawa Balewa University Yelwa Campus Clinic Bay showed more allergies during month of December than any other month; which showed high distribution of pollen. This study has established that pollen occurrence are agents of certain allergies and should be stringently guarded against, especially in the months of October, November and December.
Compliance with ethical standards
Acknowledgments
We wish to thank staffs of Department of Biological Sciences and Abubakar Tafawa balewa University medical center Yelwa, Bauchi for their contribution to the success of this research.
Disclosure of conflict of interest
There’s no what so ever any conflict of interest we are giving the outfit full right to publication of this work.
References
[1] Stanley R and Linskens HF (1974). Pollen: Biology. Biochemistry, Management, 33-36.
[2] Basarkar UG and Saoji AA (2006). Aerial survey of Parthenium hysterophorus L. pollen at Nagpur (MS). Journal of Phytological Research, 20(2): 271-277.
[3] Clot B (2001). Airborne birch pollen in Neuchâtel (Switzerland): onset, peak and daily patterns. Aerobiologia, 17(1), 25-29.
[4] Laaidi M (2001). Forecasting the start of the pollen season of Poaceae: evaluation of some methods based on meteorological factors. International Journal of Biometeorology, 45(1), 1-7.
[5] Porsbjerg C, Rasmussen A and Backer V (2003). Airborne pollen in Nuuk, Greenland, and the importance of meteorological parameters. Aerobiologia, 19(1), 29-37.
[6] Hellman S, Gaillard MJ, Broström A and Sugita S (2008). The reveals model, a new tool to estimate past regional plant abundance from pollen data in large lakes: validation in southern Sweden. Journal of Quaternary Science, 23(1), 21-42.
[7] Vogel H, Pauling A and Vogel B (2008). Numerical simulation of birch pollen dispersion with an operational weather forecast system. International journal of biometeorology, 52(8), 805-814.
[8] Sicherer SH (2011). Epidemiology of food allergy. Journal of Allergy and Clinical Immunology, 127(3), 594-602.
Deba et al. / GSC Biological and Pharmaceutical Sciences 2018, 05(02), 126–131
131
[9] Packe GE and Ayres J (1985). Asthma outbreak during a thunderstorm. The Lancet, 326(8448), 199-204.
[10] Zhigila DA, AbdulRahaman AA, Kolawole OS and Oladele FA (2014). Fruit morphology as taxonomic features in five varieties of Capsicum annuum L. Solanaceae. Journal of Botany, 29.
[11] Willard DA, Cooper SR, Gamez D and Jenshen J (2004). Atlas of pollen and spores of the Florida everglades. Palynology, 28, 175 – 227.
[12] Australasian Society of Clinical Immunology and Allergy (2015). Consensus communication on early peanut introduction and the prevention of peanut allergy in high-risk infants. Broovale, NSW, Austrailia. pp124.
[13] Lacey J (1981). Airborne actinomycete spores as respiratory allergens. Zentralbalt fur Bakteriologie, Mikrobiologie und Hygeine. I. Abt., Supplemente.
[14] Rebeiro H, Cunha M and Abreu I (2003). Airborne pollen concentration in the region of Braga, Portugal and its relationship with meteorological parameters. Aerobiologia, 19(1), 21-27.
[15] Rodriguez-Rajo FJ, Dopazo A and Jato V (2004). Environmental factors affecting the start of pollen season and concentrations of airborne Alnus pollen in two localities of Galicia (NW Spain). Annals of Agricultural and Environmental Medicine: AAEM, 11(1), 35-44.
[16] Cakmak I, Aydin L, Camazine S and Wells H (2002). Pollen traps and walnut-leaf smoke for Varroa control. American Bee Journal, 142(5), 367-370.
[17] Delfino RJ, Zeiger RS, Seltzer JM, Street DH and McLaren CE (2002). Association of asthma symptoms with peak particulate air pollution and effect modification by anti-inflammatory medication use. Environmental Health Perspectives, 110(10), 607.
[18] Villeneuve PJ, Doiron MS, Stieb D, Dales R, Burnett RT and Dugandzic R (2006). Is outdoor air pollution associated with physician visits for allergic rhinitis among the elderly in Toronto, Canada? Allergy, 61(6), 750-758.
[19] Sheffield PE, Weinberger KR, Ito K, Matte TD, Mathes, RW, Robinson GS and Kinney PL (2011). The association of tree pollen concentration peaks and allergy medication sales in New York City: 2003–2008, ISRN Allergy. 2011; 2011, 1–7.
[20] Darrow LA, Hess J, Rogers CA, Tolbert PE, Klein M and Sarnat SE (2012). Ambient pollen concentrations and emergency department visits for asthma and wheeze. Journal of Allergy and Clinical Immunology, 130(3), 630-638.
[21] Donovan C, Royce SG, Esposito J, Tran J, Ibrahim ZA, Tang ML and Bourke JE (2013). Differential effects of allergen challenge on large and small airway reactivity in mice. Plos One, 8(9), 74-101.
[22] Emberlin J, Smith M, Close R, and Adams-Groom B (2007). Changes in the pollen seasons of the early flowering trees Alnus spp. and Corylus spp. in Worcester, United Kingdom, 1996–2005. International Journal of Biometeorology, 51(3), 181.
[23] Solomon GF (1987). Psychoneuroimmunology: interactions between central nervous system and immune system. Journal of Neuroscience Research, 18(1), 1-9.
How to cite this article
Deba FA, Ibrahim YO and Ezra AG. (2018). Pollen allergy in relation to palynology and taxonomy of flowering plants at Abubakar Tafawa Balewa University, Yelwa Campus Bauchi, Bauchi State. GSC Biological and Pharmaceutical Sciences, 5(2), 126-131.