Embed Size (px)
Citation preview
NOAA Technical Memorandum NMFS-NE-131
Essential Fish Habitat Source Document:
Pollock, Pollachius virens,
Life History and Habitat Characteristics
U. S. DEPARTMENT OF COMMERCENational Oceanic and Atmospheric Administration
National Marine Fisheries ServiceNortheast Region
Northeast Fisheries Science CenterWoods Hole, Massachusetts
September 1999
Recent Issues
105. Review of American Lobster (Homarus americanus) Habitat Requirements and Responses to Contaminant Exposures.By Renee Mercaldo-Allen and Catherine A. Kuropat. July 1994. v + 52 p., 29 tables. NTIS Access. No. PB96-115555.
106. Selected Living Resources, Habitat Conditions, and Human Perturbations of the Gulf of Maine: Environmental andEcological Considerations for Fishery Management. By Richard W. Langton, John B. Pearce, and Jon A. Gibson, eds.August 1994. iv + 70 p., 2 figs., 6 tables. NTIS Access. No. PB95-270906.
107. Invertebrate Neoplasia: Initiation and Promotion Mechanisms -- Proceedings of an International Workshop, 23 June1992, Washington, D.C. By A. Rosenfield, F.G. Kern, and B.J. Keller, comps. & eds. September 1994. v + 31 p., 8 figs.,3 tables. NTIS Access. No. PB96-164801.
108. Status of Fishery Resources off the Northeastern United States for 1994. By Conservation and Utilization Division,Northeast Fisheries Science Center. January 1995. iv + 140 p., 71 figs., 75 tables. NTIS Access. No. PB95-263414.
109. Proceedings of the Symposium on the Potential for Development of Aquaculture in Massachusetts: 15-17 February 1995,Chatham/Edgartown/Dartmouth, Massachusetts. By Carlos A. Castro and Scott J. Soares, comps. & eds. January 1996.v + 26 p., 1 fig., 2 tables. NTIS Access. No. PB97-103782.
110. Length-Length and Length-Weight Relationships for 13 Shark Species from the Western North Atlantic. By Nancy E.Kohler, John G. Casey, Patricia A. Turner. May 1996. iv + 22 p., 4 figs., 15 tables. NTIS Access. No. PB97-135032.
111. Review and Evaluation of the 1994 Experimental Fishery in Closed Area II on Georges Bank. By Patricia A. Gerrior,Fredric M. Serchuk, Kathleen C. Mays, John F. Kenney, and Peter D. Colosi. October 1996. v + 52 p., 24 figs., 20 tables. NTISAccess. No. PB98-119159.
112. Data Description and Statistical Summary of the 1983-92 Cost-Earnings Data Base for Northeast U.S. CommercialFishing Vessels: A Guide to Understanding and Use of the Data Base. By Amy B. Gautam and Andrew W. Kitts. December1996. v + 21 p., 11 figs., 14 tables. NTIS Access. No. PB97-169320.
113. Individual Vessel Behavior in the Northeast Otter Trawl Fleet during 1982-92. By Barbara Pollard Rountree. August 1997.v + 50 p., 1 fig., 40 tables. NTIS Access. No. PB99-169997.
114. U.S. Atlantic and Gulf of Mexico Marine Mammal Stock Assessments -- 1996. By Gordon T. Waring, Debra L. Palka, KeithD. Mullin, James H.W. Hain, Larry J. Hansen, and Kathryn D. Bisack. October 1997. viii + 250 p., 42 figs., 47 tables. NTISAccess. No. PB98-112345.
115. Status of Fishery Resources off the Northeastern United States for 1998. By Stephen H. Clark, ed. September 1998. vi+ 149 p., 70 figs., 80 tables. NTIS Access. No. PB99-129694.
116. U.S. Atlantic Marine Mammal Stock Assessments -- 1998. By Gordon T. Waring, Debra L. Palka, Phillip J. Clapham, StevenSwartz, Marjorie C. Rossman, Timothy V.N. Cole, Kathryn D. Bisack, and Larry J. Hansen. February 1999. vii + 182 p., 16figs., 56 tables. NTIS Access. No. PB99-134140.
117. Review of Distribution of the Long-finned Pilot Whale (Globicephala melas) in the North Atlantic and Mediterranean.By Alan A. Abend and Tim D. Smith. April 1999. vi + 22 p., 14 figs., 3 tables. NTIS Access. No. PB99-165029.
118. Tautog (Tautoga onitis) Life History and Habitat Requirements. By Frank W. Steimle and Patricia A. Shaheen. May 1999.vi + 23 p., 1 fig., 1 table. NTIS Access. No. PB99-165011.
119. Data Needs for Economic Analysis of Fishery Management Regulations. By Andrew W. Kitts and Scott R. Steinback.August 1999. iv + 48 p., 10 figs., 22 tables. NTIS Access. No. PB99-171456.
120. Marine Mammal Research Program of the Northeast Fisheries Science Center during 1990-95. By Janeen M. Quintal andTim D. Smith. September 1999. v + 28 p., 4 tables, 4 app. NTIS Access. No. PB2000-100809.
U. S. DEPARTMENT OF COMMERCEWilliam Daley, Secretary
National Oceanic and Atmospheric AdministrationD. James Baker, Administrator
National Marine Fisheries ServicePenelope D. Dalton, Assistant Administrator for Fisheries
Northeast RegionNortheast Fisheries Science Center
Woods Hole, Massachusetts
September 1999
Essential Fish Habitat Source Document:
Pollock, Pollachius virens,Life History and Habitat Characteristics
Luca M. Cargnelli, Sara J. Griesbach, David B. Packer,Peter L. Berrien, Donna L. Johnson, and Wallace W. Morse
National Marine Fisheries Serv., James J. Howard Marine Sciences Lab., 74 Magruder Rd., Highlands, NJ 07732
This series represents a secondary level of scientifiic publishing. All issues employthorough internal scientific review; some issues employ external scientific review.Reviews are -- by design -- transparent collegial reviews, not anonymous peer reviews.All issues may be cited in formal scientific communications.
NOAA Technical Memorandum NMFS-NE-131
Editorial Notes on Issues 122-152in the
NOAA Technical Memorandum NMFS-NE Series
Editorial Production
For Issues 122-152, staff of the Northeast Fisheries Science Center's (NEFSC's) Ecosystems Processes Division havelargely assumed the role of staff of the NEFSC's Editorial Office for technical and copy editing, type composition, andpage layout. Other than the four covers (inside and outside, front and back) and first two preliminary pages, all preprintingeditorial production has been performed by, and all credit for such production rightfully belongs to, the authors andacknowledgees of each issue, as well as those noted below in "Special Acknowledgments."
Special Acknowledgments
David B. Packer, Sara J. Griesbach, and Luca M. Cargnelli coordinated virtually all aspects of the preprinting editorialproduction, as well as performed virtually all technical and copy editing, type composition, and page layout, of Issues122-152. Rande R. Cross, Claire L. Steimle, and Judy D. Berrien conducted the literature searching, citation checking,and bibliographic styling for Issues 122-152. Joseph J. Vitaliano produced all of the food habits figures in Issues 122-152.
Internet Availability
Issues 122-152 are being copublished, i.e., both as paper copies and as web postings. All web postings are, or will soonbe, available at: www.nefsc.nmfs.gov/nefsc/habitat/efh. Also, all web postings will be in "PDF" format.
Information Updating
By federal regulation, all information specific to Issues 122-152 must be updated at least every five years. All officialupdates will appear in the web postings. Paper copies will be reissued only when and if new information associated withIssues 122-152 is significant enough to warrant a reprinting of a given issue. All updated and/or reprinted issues will retainthe original issue number, but bear a "Revised (Month Year)" label.
Species Names
The NMFS Northeast Region�s policy on the use of species names in all technical communications is generally to followthe American Fisheries Society�s lists of scientific and common names for fishes (i.e., Robins et al. 1991a), mollusks (i.e.,Turgeon et al. 1998b), and decapod crustaceans (i.e., Williams et al. 1989c), and to follow the Society for MarineMammalogy's guidance on scientific and common names for marine mammals (i.e., Rice 1998d). Exceptions to this policyoccur when there are subsequent compelling revisions in the classifications of species, resulting in changes in the namesof species (e.g., Cooper and Chapleau 1998e).
aRobins, C.R. (chair); Bailey, R.M.; Bond, C.E.; Brooker, J.R.; Lachner, E.A.; Lea, R.N.; Scott, W.B. 1991. Common and scientific names of fishesfrom the United States and Canada. 5th ed. Amer. Fish. Soc. Spec. Publ. 20; 183 p.
bTurgeon, D.D. (chair); Quinn, J.F., Jr.; Bogan, A.E.; Coan, E.V.; Hochberg, F.G.; Lyons, W.G.; Mikkelsen, P.M.; Neves, R.J.; Roper, C.F.E.;Rosenberg, G.; Roth, B.; Scheltema, A.; Thompson, F.G.; Vecchione, M.; Williams, J.D. 1998. Common and scientific names of aquaticinvertebrates from the United States and Canada: mollusks. 2nd ed. Amer. Fish. Soc. Spec. Publ. 26; 526 p.
cWilliams, A.B. (chair); Abele, L.G.; Felder, D.L.; Hobbs, H.H., Jr.; Manning, R.B.; McLaughlin, P.A.; Pérez Farfante, I. 1989. Common andscientific names of aquatic invertebrates from the United States and Canada: decapod crustaceans. Amer. Fish. Soc. Spec. Publ. 17; 77 p.
dRice, D.W. 1998. Marine mammals of the world: systematics and distribution. Soc. Mar. Mammal. Spec. Publ. 4; 231 p.
eCooper, J.A.; Chapleau, F. 1998. Monophyly and interrelationships of the family Pleuronectidae (Pleuronectiformes), with a revised classification.Fish. Bull. (U.S.) 96:686-726.
Page iii
FOREWORD
One of the greatest long-term threats to the viability ofcommercial and recreational fisheries is the continuingloss of marine, estuarine, and other aquatic habitats.
Magnuson-Stevens Fishery Conservation andManagement Act (October 11, 1996)
The long-term viability of living marine resources dependson protection of their habitat.
NMFS Strategic Plan for FisheriesResearch (February 1998)
The Magnuson-Stevens Fishery Conservation andManagement Act (MSFCMA), which was reauthorizedand amended by the Sustainable Fisheries Act (1996),requires the eight regional fishery management councils todescribe and identify essential fish habitat (EFH) in theirrespective regions, to specify actions to conserve andenhance that EFH, and to minimize the adverse effects offishing on EFH. Congress defined EFH as “those watersand substrate necessary to fish for spawning, breeding,feeding or growth to maturity.” The MSFCMA requiresNMFS to assist the regional fishery management councilsin the implementation of EFH in their respective fisherymanagement plans.
NMFS has taken a broad view of habitat as the areaused by fish throughout their life cycle. Fish use habitatfor spawning, feeding, nursery, migration, and shelter, butmost habitats provide only a subset of these functions.Fish may change habitats with changes in life historystage, seasonal and geographic distributions, abundance,and interactions with other species. The type of habitat,as well as its attributes and functions, are important forsustaining the production of managed species.
The Northeast Fisheries Science Center compiled theavailable information on the distribution, abundance, andhabitat requirements for each of the species managed bythe New England and Mid-Atlantic Fishery ManagementCouncils. That information is presented in this series of30 EFH species reports (plus one consolidated methodsreport). The EFH species reports comprise a survey of theimportant literature as well as original analyses of fishery-
JAMES J. HOWARD MARINE SCIENCES LABORATORY
HIGHLANDS, NEW JERSEY
SEPTEMBER 1999
independent data sets from NMFS and several coastalstates. The species reports are also the source for thecurrent EFH designations by the New England and Mid-Atlantic Fishery Management Councils, and haveunderstandably begun to be referred to as the “EFH sourcedocuments.”
NMFS provided guidance to the regional fisherymanagement councils for identifying and describing EFHof their managed species. Consistent with this guidance,the species reports present information on current andhistoric stock sizes, geographic range, and the period andlocation of major life history stages. The habitats ofmanaged species are described by the physical, chemical,and biological components of the ecosystem where thespecies occur. Information on the habitat requirements isprovided for each life history stage, and it includes, whereavailable, habitat and environmental variables that controlor limit distribution, abundance, growth, reproduction,mortality, and productivity.
Identifying and describing EFH are the first steps inthe process of protecting, conserving, and enhancingessential habitats of the managed species. Ultimately,NMFS, the regional fishery management councils, fishingparticipants, Federal and state agencies, and otherorganizations will have to cooperate to achieve the habitatgoals established by the MSFCMA.
A historical note: the EFH species reports effectivelyrecommence a series of reports published by the NMFSSandy Hook (New Jersey) Laboratory (now formallyknown as the James J. Howard Marine SciencesLaboratory) from 1977 to 1982. These reports, whichwere formally labeled as Sandy Hook LaboratoryTechnical Series Reports, but informally known as “SandyHook Bluebooks,” summarized biological and fisheriesdata for 18 economically important species. The fact thatthe bluebooks continue to be used two decades after theirpublication persuaded us to make their successors – the 30EFH source documents – available to the public throughpublication in the NOAA Technical Memorandum NMFS-NE series.
JEFFREY N. CROSS, CHIEF
ECOSYSTEMS PROCESSES DIVISION
NORTHEAST FISHERIES SCIENCE CENTER
Page v
Contents
Introduction...............................................................................................................................................................................................1Life History ...............................................................................................................................................................................................1Habitat Characteristics ..............................................................................................................................................................................2Geographical Distribution .........................................................................................................................................................................3Status of the Stocks ...................................................................................................................................................................................5Research Needs .........................................................................................................................................................................................5Acknowledgments .....................................................................................................................................................................................5References Cited .......................................................................................................................................................................................5
Tables
Table 1. Size and age at maturity of U.S. pollock, Pollachius virens.......................................................................................................8Table 2. Summary of life history and habitat parameters for pollock, Pollachius virens .........................................................................9
Figures
Figure 1. The pollock, Pollachius virens (from Goode 1884) ..............................................................................................................11Figure 2. Summary of the early life history of pollock .........................................................................................................................12Figure 3. Pollock spawning locations based on the distribution of eggs and larvae from ichthyoplankton surveys.............................13Figure 4. Abundance of the major prey items in the pollock diet from NEFSC bottom trawl survey data on food habits ...................14Figure 5. Distribution and abundance of polluck from Newfoundland to Cape Hatteras during 1975-1994 .......................................15Figure 6. Distribution of pollock eggs collected during NEFSC MARMAP offshore ichthyoplankton surveys..................................16Figure 7. Abundance of pollock eggs relative to water temperature and depth based on NEFSC MARMAP surveys.........................19Figure 8. Distribution of pollock larvae collected during NEFSC MARMAP offshore ichthyoplankton surveys ...............................20Figure 9. Abundance of pollock larvae relative to water temperature and depth based on NEFSC MARMAP surveys ......................23Figure 10. Distribution of juveniles and adults collected during NEFSC trawl surveys.........................................................................24Figure 11. Abundance of juvenile and adult pollock relative to water temperature and depth based on NEFSC surveys......................26Figure 12. Distribution of juvenile and adult pollock collected during Massachusetts inshore trawl surveys........................................27Figure 13. Abundance of juvenile and adult pollock relative to water temperature and depth based on Massachusetts surveys ...........28Figure 14. Occurrence of pollock in Narragansett Bay during 1990-1996 based on Rhode Island bottom trawl surveys......................29Figure 15. Commercial landings and survey indices of pollock for Gulf of Maine, Georges Bank and the Scotian Shelf .....................30
Page 1
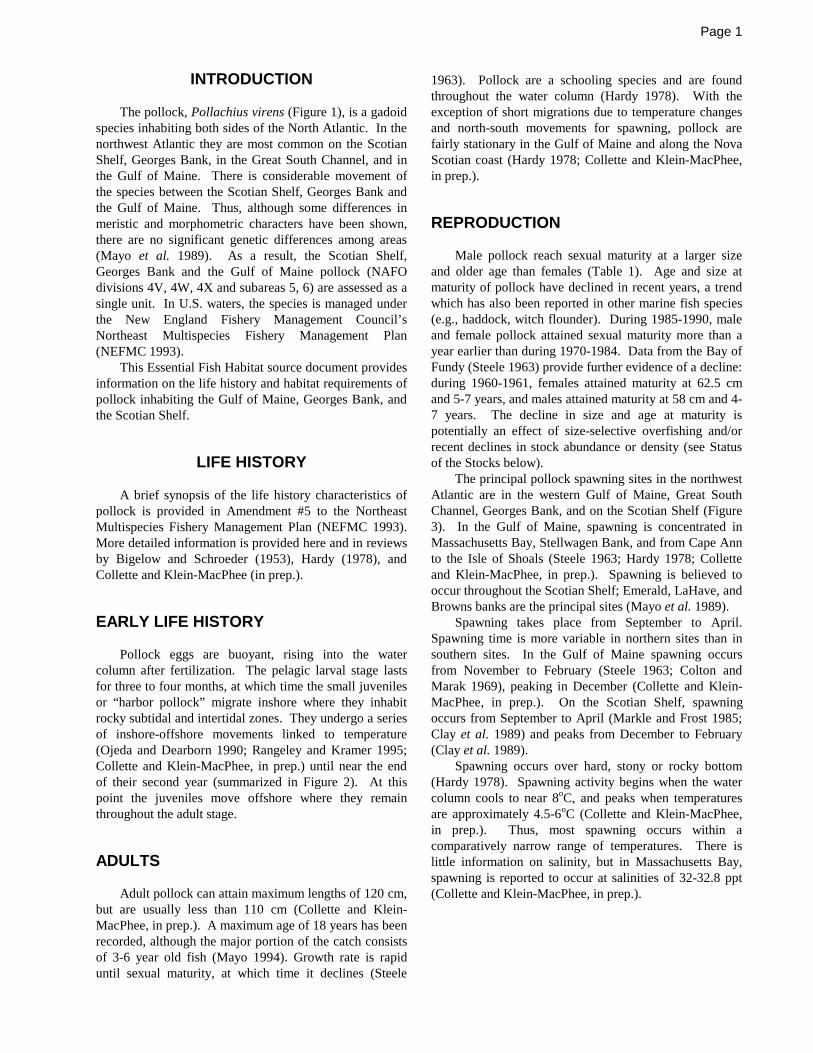
INTRODUCTION
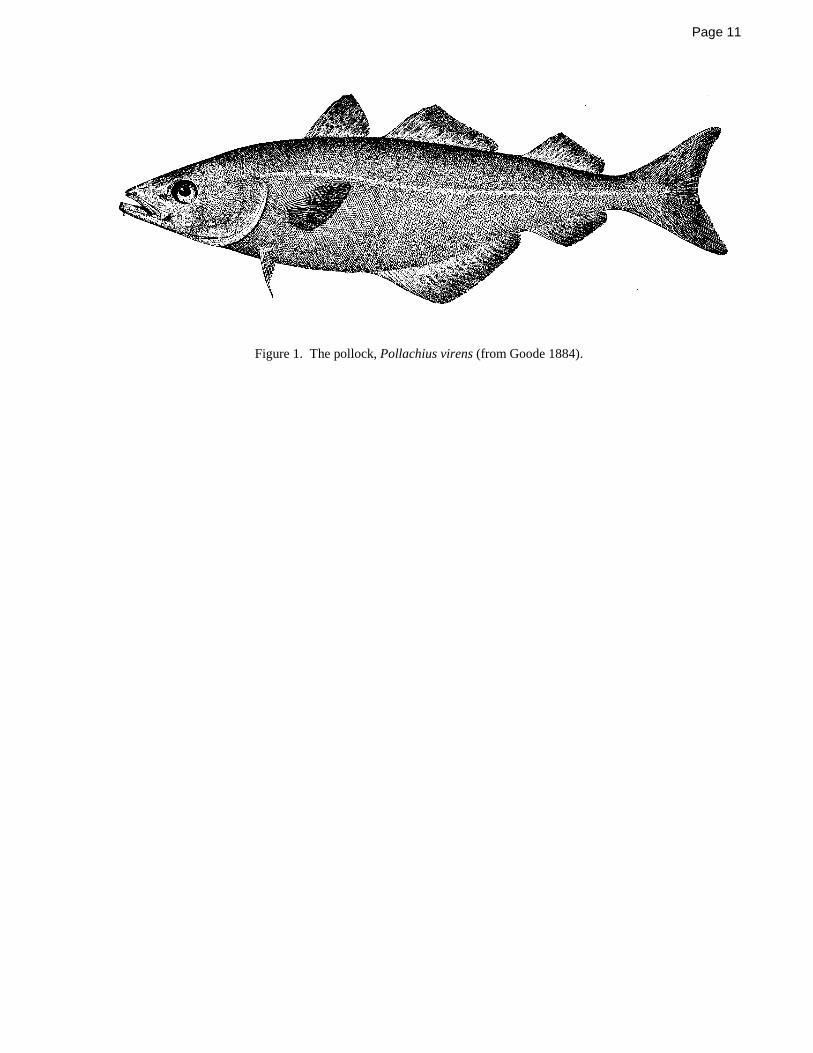
The pollock, Pollachius virens (Figure 1), is a gadoidspecies inhabiting both sides of the North Atlantic. In thenorthwest Atlantic they are most common on the ScotianShelf, Georges Bank, in the Great South Channel, and inthe Gulf of Maine. There is considerable movement ofthe species between the Scotian Shelf, Georges Bank andthe Gulf of Maine. Thus, although some differences inmeristic and morphometric characters have been shown,there are no significant genetic differences among areas(Mayo et al. 1989). As a result, the Scotian Shelf,Georges Bank and the Gulf of Maine pollock (NAFOdivisions 4V, 4W, 4X and subareas 5, 6) are assessed as asingle unit. In U.S. waters, the species is managed underthe New England Fishery Management Council’sNortheast Multispecies Fishery Management Plan(NEFMC 1993).
This Essential Fish Habitat source document providesinformation on the life history and habitat requirements ofpollock inhabiting the Gulf of Maine, Georges Bank, andthe Scotian Shelf.
LIFE HISTORY
A brief synopsis of the life history characteristics ofpollock is provided in Amendment #5 to the NortheastMultispecies Fishery Management Plan (NEFMC 1993).More detailed information is provided here and in reviewsby Bigelow and Schroeder (1953), Hardy (1978), andCollette and Klein-MacPhee (in prep.).
EARLY LIFE HISTORY
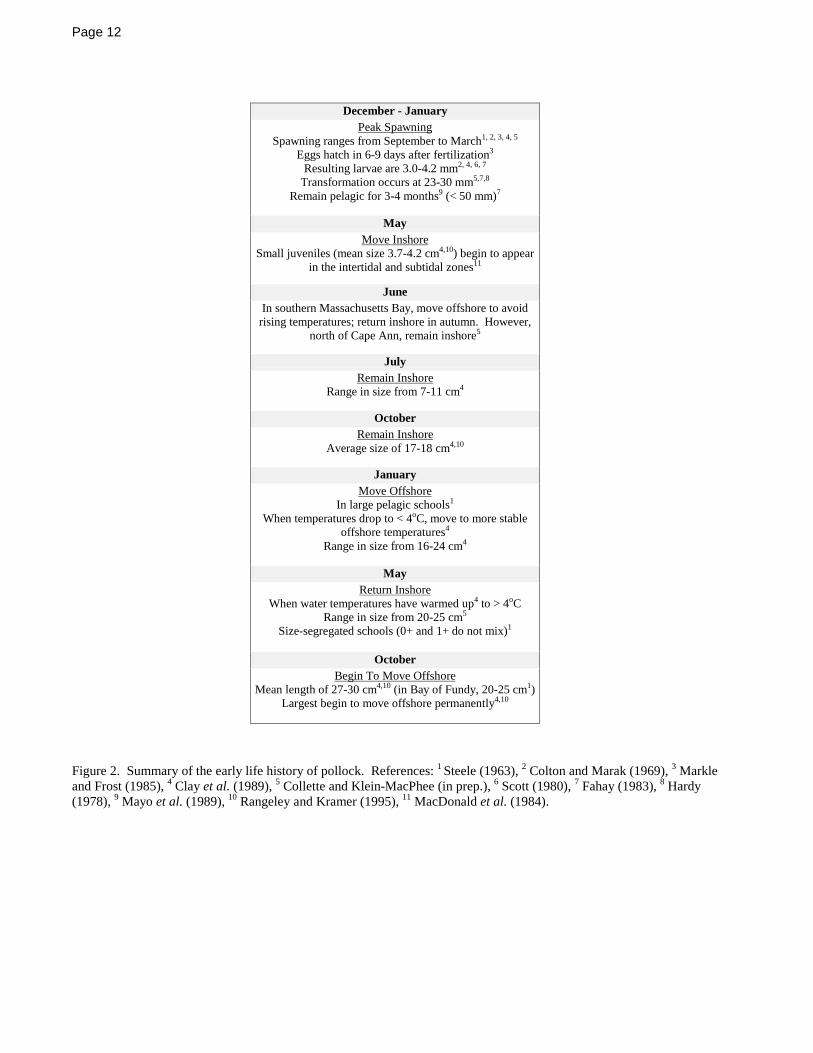
Pollock eggs are buoyant, rising into the watercolumn after fertilization. The pelagic larval stage lastsfor three to four months, at which time the small juvenilesor “harbor pollock” migrate inshore where they inhabitrocky subtidal and intertidal zones. They undergo a seriesof inshore-offshore movements linked to temperature(Ojeda and Dearborn 1990; Rangeley and Kramer 1995;Collette and Klein-MacPhee, in prep.) until near the endof their second year (summarized in Figure 2). At thispoint the juveniles move offshore where they remainthroughout the adult stage.
ADULTS
Adult pollock can attain maximum lengths of 120 cm,but are usually less than 110 cm (Collette and Klein-MacPhee, in prep.). A maximum age of 18 years has beenrecorded, although the major portion of the catch consistsof 3-6 year old fish (Mayo 1994). Growth rate is rapiduntil sexual maturity, at which time it declines (Steele
1963). Pollock are a schooling species and are foundthroughout the water column (Hardy 1978). With theexception of short migrations due to temperature changesand north-south movements for spawning, pollock arefairly stationary in the Gulf of Maine and along the NovaScotian coast (Hardy 1978; Collette and Klein-MacPhee,in prep.).
REPRODUCTION
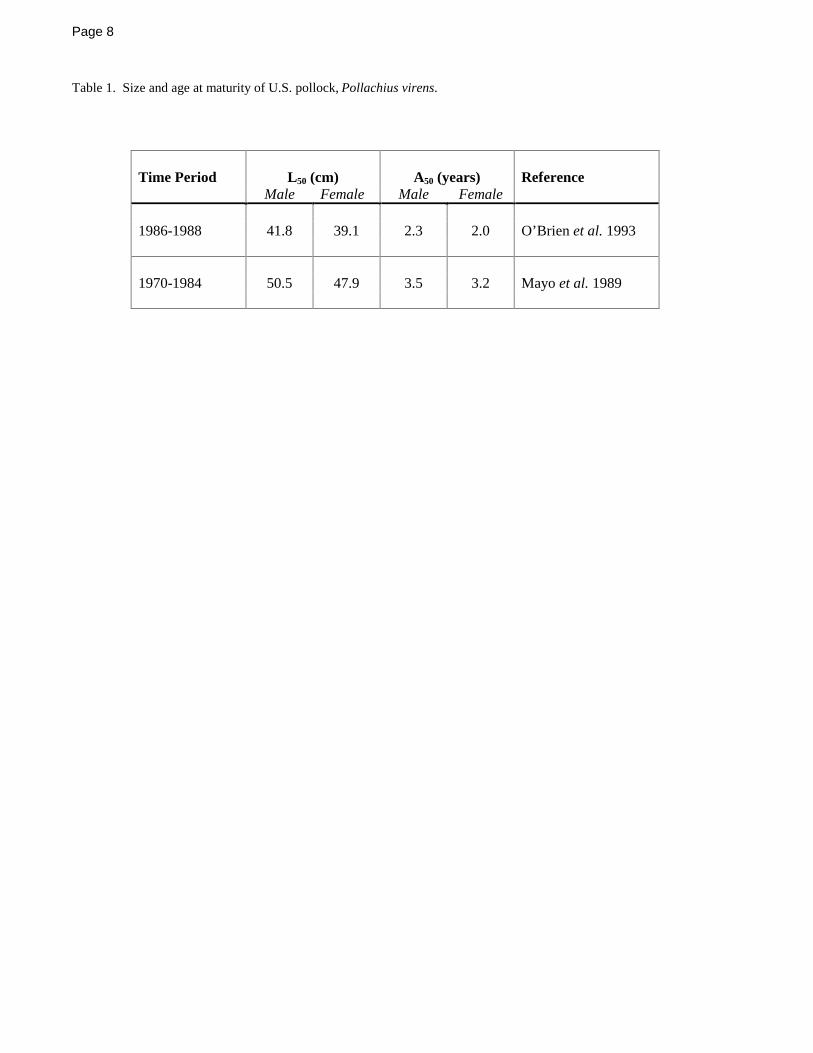
Male pollock reach sexual maturity at a larger sizeand older age than females (Table 1). Age and size atmaturity of pollock have declined in recent years, a trendwhich has also been reported in other marine fish species(e.g., haddock, witch flounder). During 1985-1990, maleand female pollock attained sexual maturity more than ayear earlier than during 1970-1984. Data from the Bay ofFundy (Steele 1963) provide further evidence of a decline:during 1960-1961, females attained maturity at 62.5 cmand 5-7 years, and males attained maturity at 58 cm and 4-7 years. The decline in size and age at maturity ispotentially an effect of size-selective overfishing and/orrecent declines in stock abundance or density (see Statusof the Stocks below).
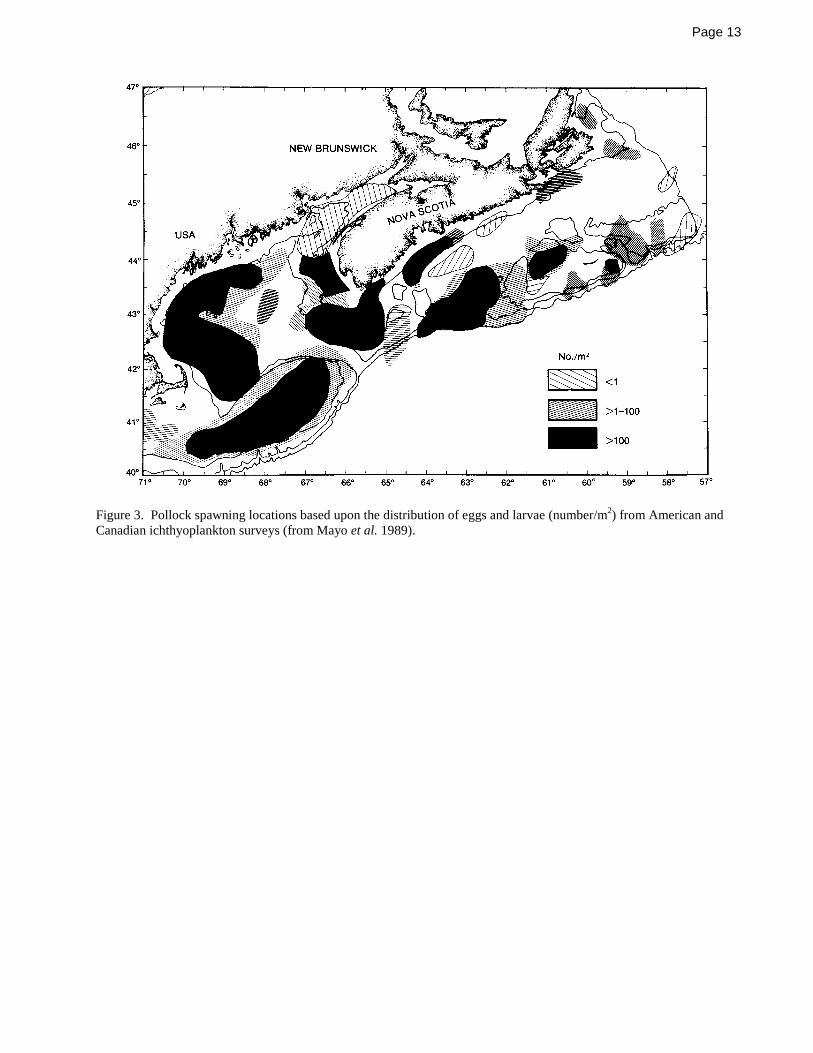
The principal pollock spawning sites in the northwestAtlantic are in the western Gulf of Maine, Great SouthChannel, Georges Bank, and on the Scotian Shelf (Figure3). In the Gulf of Maine, spawning is concentrated inMassachusetts Bay, Stellwagen Bank, and from Cape Annto the Isle of Shoals (Steele 1963; Hardy 1978; Colletteand Klein-MacPhee, in prep.). Spawning is believed tooccur throughout the Scotian Shelf; Emerald, LaHave, andBrowns banks are the principal sites (Mayo et al. 1989).
Spawning takes place from September to April.Spawning time is more variable in northern sites than insouthern sites. In the Gulf of Maine spawning occursfrom November to February (Steele 1963; Colton andMarak 1969), peaking in December (Collette and Klein-MacPhee, in prep.). On the Scotian Shelf, spawningoccurs from September to April (Markle and Frost 1985;Clay et al. 1989) and peaks from December to February(Clay et al. 1989).
Spawning occurs over hard, stony or rocky bottom(Hardy 1978). Spawning activity begins when the watercolumn cools to near 8oC, and peaks when temperaturesare approximately 4.5-6oC (Collette and Klein-MacPhee,in prep.). Thus, most spawning occurs within acomparatively narrow range of temperatures. There islittle information on salinity, but in Massachusetts Bay,spawning is reported to occur at salinities of 32-32.8 ppt(Collette and Klein-MacPhee, in prep.).
Page 2
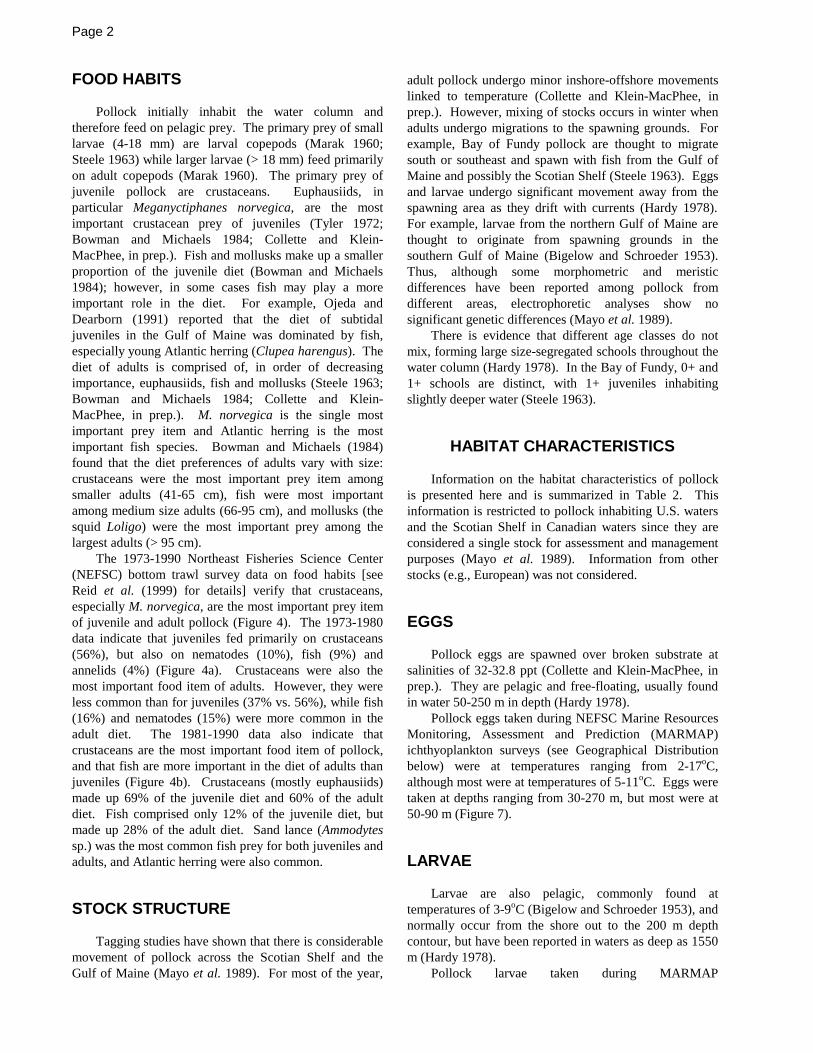
FOOD HABITS
Pollock initially inhabit the water column andtherefore feed on pelagic prey. The primary prey of smalllarvae (4-18 mm) are larval copepods (Marak 1960;Steele 1963) while larger larvae (> 18 mm) feed primarilyon adult copepods (Marak 1960). The primary prey ofjuvenile pollock are crustaceans. Euphausiids, inparticular Meganyctiphanes norvegica, are the mostimportant crustacean prey of juveniles (Tyler 1972;Bowman and Michaels 1984; Collette and Klein-MacPhee, in prep.). Fish and mollusks make up a smallerproportion of the juvenile diet (Bowman and Michaels1984); however, in some cases fish may play a moreimportant role in the diet. For example, Ojeda andDearborn (1991) reported that the diet of subtidaljuveniles in the Gulf of Maine was dominated by fish,especially young Atlantic herring (Clupea harengus). Thediet of adults is comprised of, in order of decreasingimportance, euphausiids, fish and mollusks (Steele 1963;Bowman and Michaels 1984; Collette and Klein-MacPhee, in prep.). M. norvegica is the single mostimportant prey item and Atlantic herring is the mostimportant fish species. Bowman and Michaels (1984)found that the diet preferences of adults vary with size:crustaceans were the most important prey item amongsmaller adults (41-65 cm), fish were most importantamong medium size adults (66-95 cm), and mollusks (thesquid Loligo) were the most important prey among thelargest adults (> 95 cm).
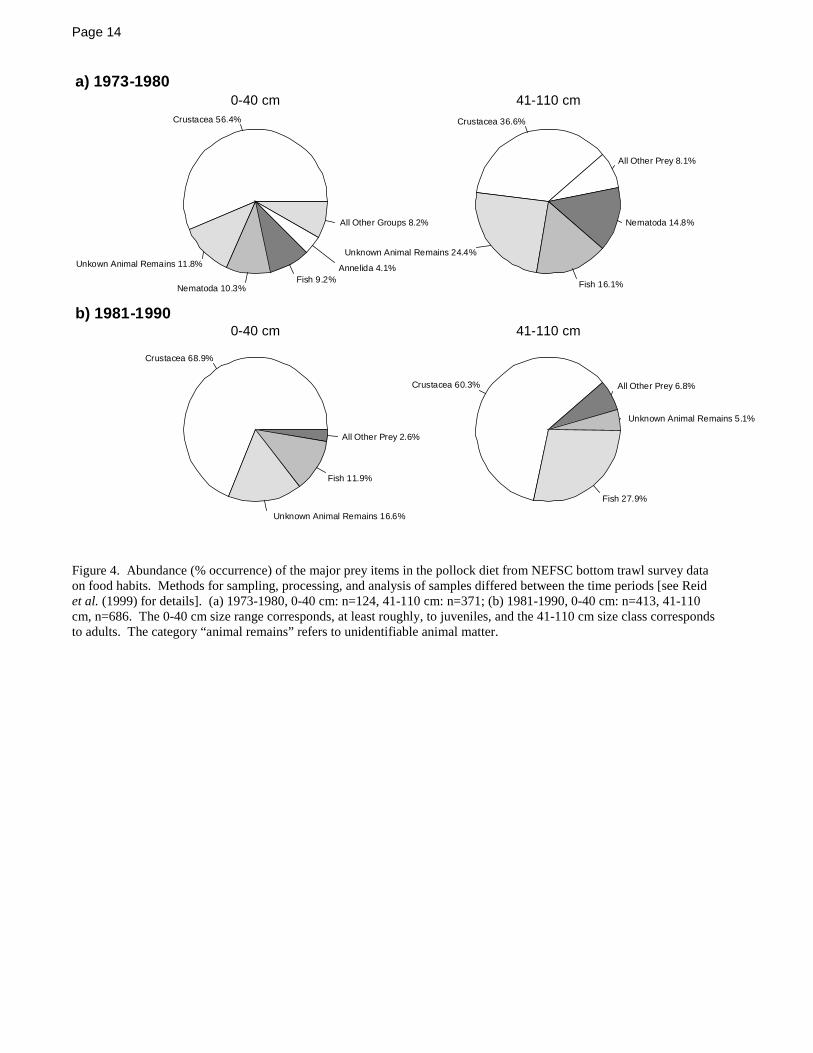
The 1973-1990 Northeast Fisheries Science Center(NEFSC) bottom trawl survey data on food habits [seeReid et al. (1999) for details] verify that crustaceans,especially M. norvegica, are the most important prey itemof juvenile and adult pollock (Figure 4). The 1973-1980data indicate that juveniles fed primarily on crustaceans(56%), but also on nematodes (10%), fish (9%) andannelids (4%) (Figure 4a). Crustaceans were also themost important food item of adults. However, they wereless common than for juveniles (37% vs. 56%), while fish(16%) and nematodes (15%) were more common in theadult diet. The 1981-1990 data also indicate thatcrustaceans are the most important food item of pollock,and that fish are more important in the diet of adults thanjuveniles (Figure 4b). Crustaceans (mostly euphausiids)made up 69% of the juvenile diet and 60% of the adultdiet. Fish comprised only 12% of the juvenile diet, butmade up 28% of the adult diet. Sand lance (Ammodytessp.) was the most common fish prey for both juveniles andadults, and Atlantic herring were also common.
STOCK STRUCTURE
Tagging studies have shown that there is considerablemovement of pollock across the Scotian Shelf and theGulf of Maine (Mayo et al. 1989). For most of the year,
adult pollock undergo minor inshore-offshore movementslinked to temperature (Collette and Klein-MacPhee, inprep.). However, mixing of stocks occurs in winter whenadults undergo migrations to the spawning grounds. Forexample, Bay of Fundy pollock are thought to migratesouth or southeast and spawn with fish from the Gulf ofMaine and possibly the Scotian Shelf (Steele 1963). Eggsand larvae undergo significant movement away from thespawning area as they drift with currents (Hardy 1978).For example, larvae from the northern Gulf of Maine arethought to originate from spawning grounds in thesouthern Gulf of Maine (Bigelow and Schroeder 1953).Thus, although some morphometric and meristicdifferences have been reported among pollock fromdifferent areas, electrophoretic analyses show nosignificant genetic differences (Mayo et al. 1989).
There is evidence that different age classes do notmix, forming large size-segregated schools throughout thewater column (Hardy 1978). In the Bay of Fundy, 0+ and1+ schools are distinct, with 1+ juveniles inhabitingslightly deeper water (Steele 1963).
HABITAT CHARACTERISTICS
Information on the habitat characteristics of pollockis presented here and is summarized in Table 2. Thisinformation is restricted to pollock inhabiting U.S. watersand the Scotian Shelf in Canadian waters since they areconsidered a single stock for assessment and managementpurposes (Mayo et al. 1989). Information from otherstocks (e.g., European) was not considered.
EGGS
Pollock eggs are spawned over broken substrate atsalinities of 32-32.8 ppt (Collette and Klein-MacPhee, inprep.). They are pelagic and free-floating, usually foundin water 50-250 m in depth (Hardy 1978).
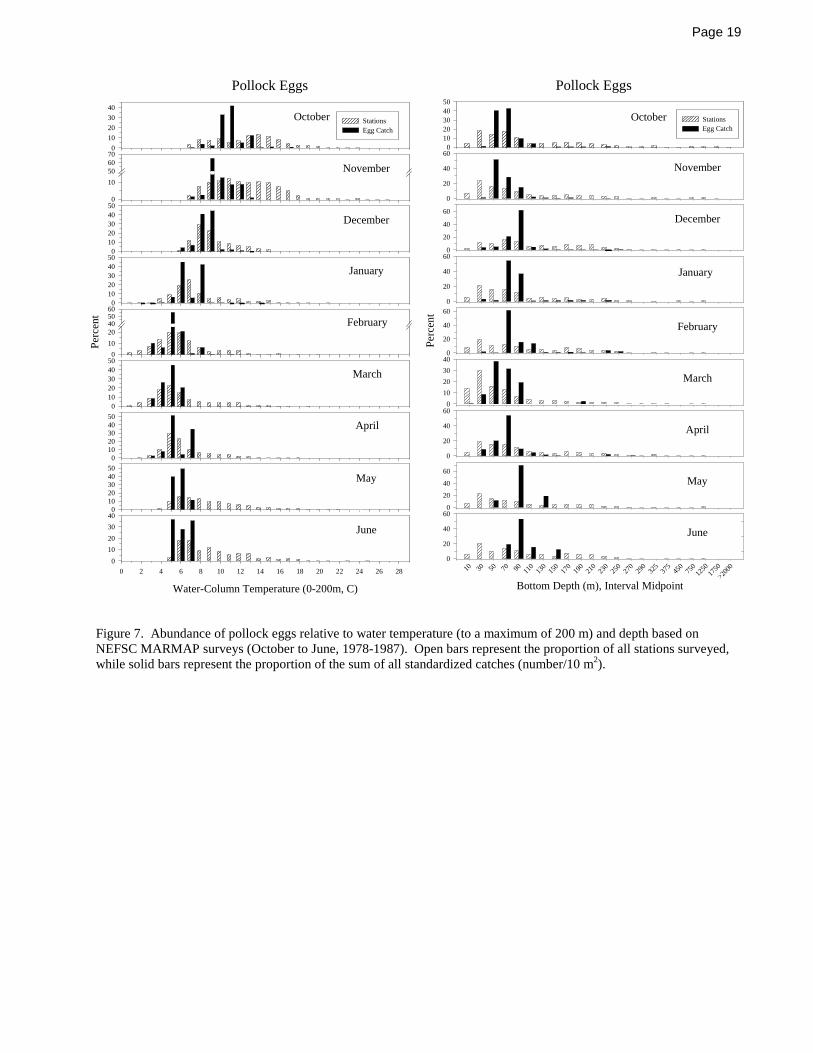
Pollock eggs taken during NEFSC Marine ResourcesMonitoring, Assessment and Prediction (MARMAP)ichthyoplankton surveys (see Geographical Distributionbelow) were at temperatures ranging from 2-17oC,although most were at temperatures of 5-11oC. Eggs weretaken at depths ranging from 30-270 m, but most were at50-90 m (Figure 7).
LARVAE
Larvae are also pelagic, commonly found attemperatures of 3-9oC (Bigelow and Schroeder 1953), andnormally occur from the shore out to the 200 m depthcontour, but have been reported in waters as deep as 1550m (Hardy 1978).
Pollock larvae taken during MARMAP
Page 3
ichthyoplankton surveys (see Geographical Distributionbelow) were at temperatures ranging from 2-17oC, but thisvaried seasonally and temperatures of 5-10oC were mostcommon. Larvae were taken at depths ranging from 10 to> 1000 m, but most were at 50-90 m (Figure 9).
JUVENILES
Juveniles have been reported over a wide variety ofsubstrates, including sand, mud, or rocky bottom andvegetation (Hardy 1978). They are found at temperaturesranging from 0-16oC and prefer salinities of around 31.5ppt (Hardy 1978). Inshore subtidal and intertidal zonesare utilized by age 0+ and 1+ juveniles and serve asimportant nursery areas (Steele 1963; Ojeda and Dearborn1990; Rangeley and Kramer 1995). Age 2+ juvenilesmove offshore, inhabiting depths of 130-150 m (Steele1963).
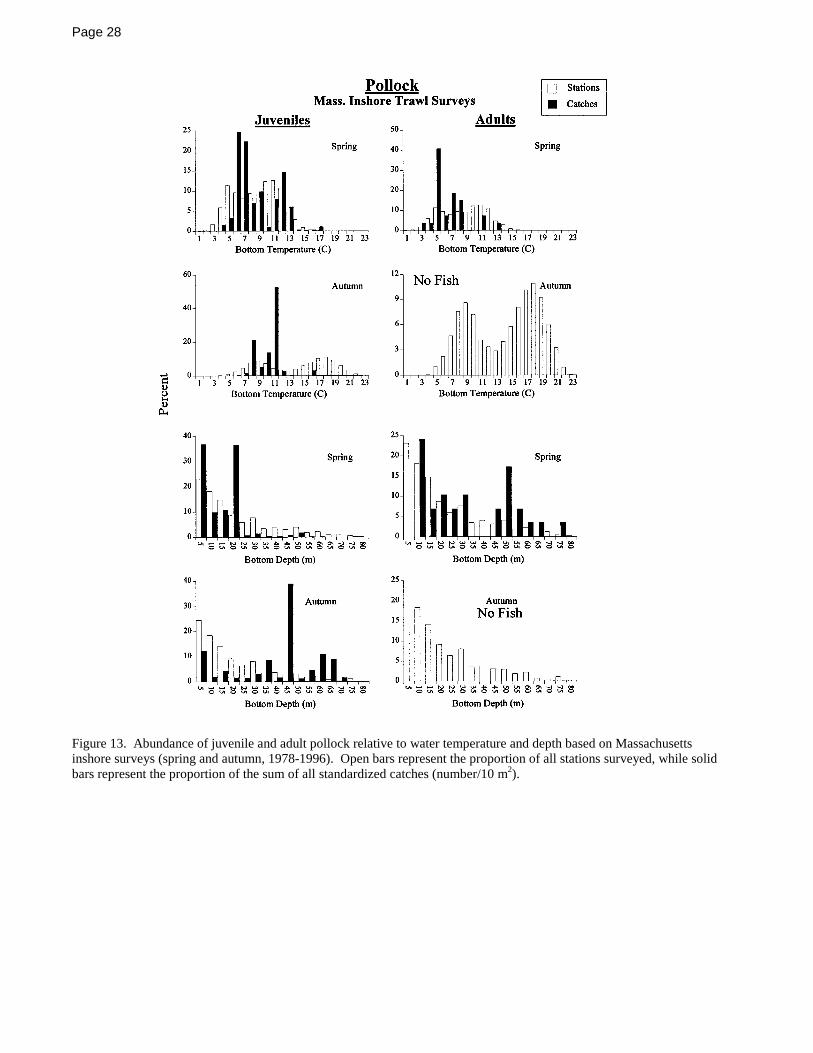
Juvenile haddock taken during NEFSC trawl surveys(see Geographical Distribution below) were attemperatures ranging from 1-18oC, but most were taken at3-12oC. They were taken at depths ranging from 5-125 m,but most were taken at 25-75 m (Figure 11). Juvenilestaken during Massachusetts trawl surveys (seeGeographical Distribution below) were at 6-13oC and 0-75 m (Figure 13).
ADULTS
Adults show little preference for bottom type (Scott1982b). They are found at high salinities, 31-34 ppt(Scott 1982a), and temperatures of 0-14oC (Hardy 1978;Scott 1982a; Collette and Klein-MacPhee, in prep.),although they tend to avoid temperatures > 11oC and <3oC. They inhabit a wide range of depths, 35-365 m(Hardy 1978; Scott 1982a), but most occur within the 137m depth contour and depths of 100-125 m are preferred(Hardy 1978). Adults tend to inhabit deeper waters inspring and summer than in winter and they are typicallyfound further offshore than juveniles (Mayo et al. 1989;Collette and Klein-MacPhee, in prep.).
Adult haddock taken during NEFSC trawl surveys(see Geographical Distribution below) were attemperatures ranging from 1-12oC, but most were taken at6-8oC. Adults were taken at depths ranging from 15-325m, but most were taken at 75-175 m (Figure 11). Mostadults taken during Massachusetts trawl surveys (seeGeographical Distribution below) were at 5-7oC and 10-30 m (Figure 13).
GEOGRAPHICAL DISTRIBUTION
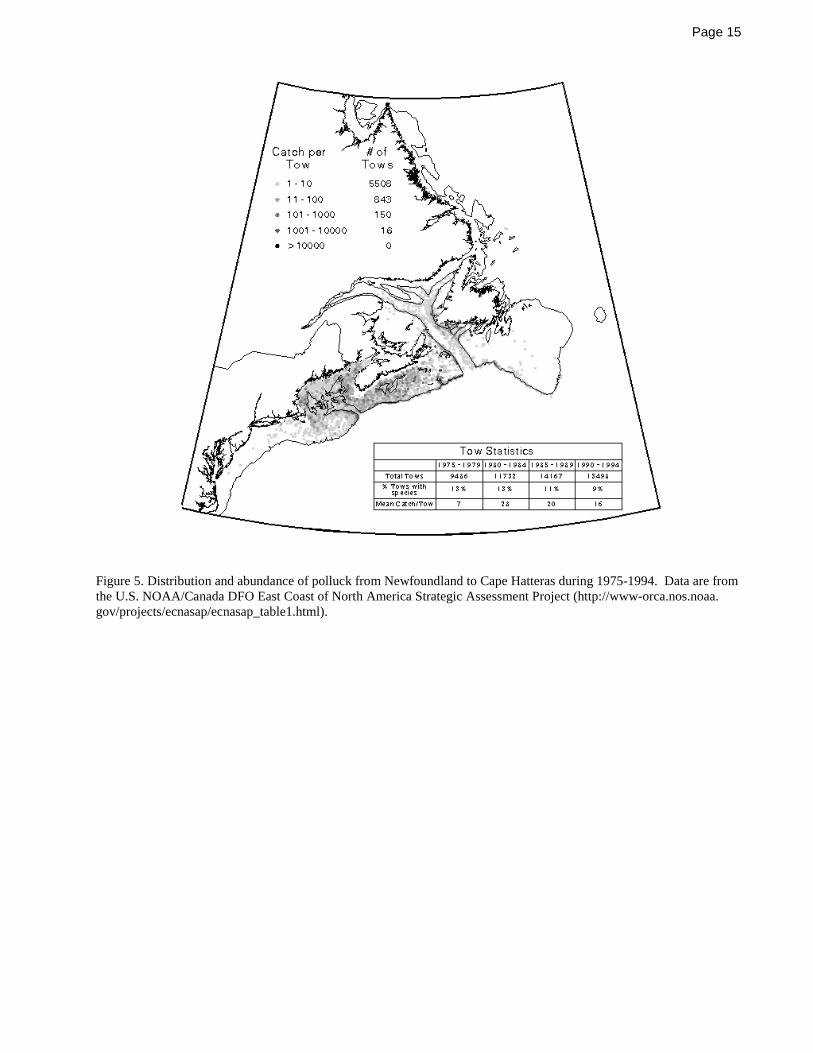
Pollock in the northwest Atlantic were distributedfrom the Delmarva Peninsula north to the Gulf of St.Lawrence and the Grand Banks during 1975-1994 (Figure5). The areas of highest abundance of the species are theScotian Shelf and the Gulf of Maine.
EGGS
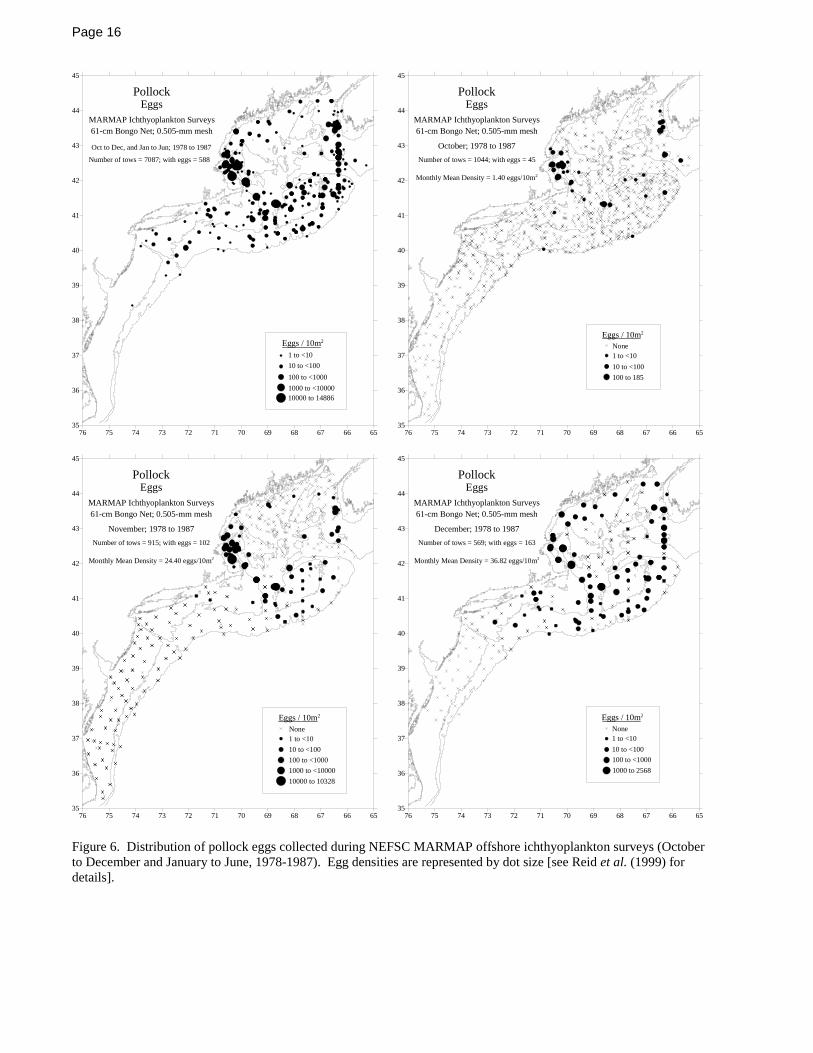
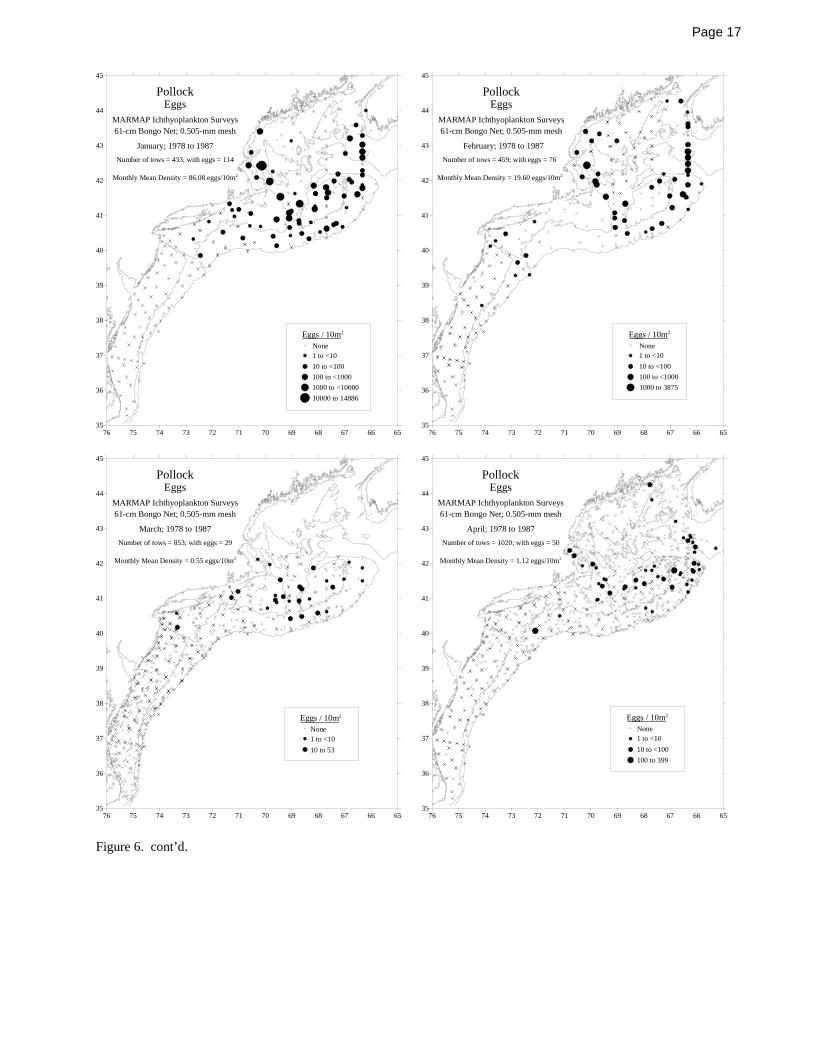
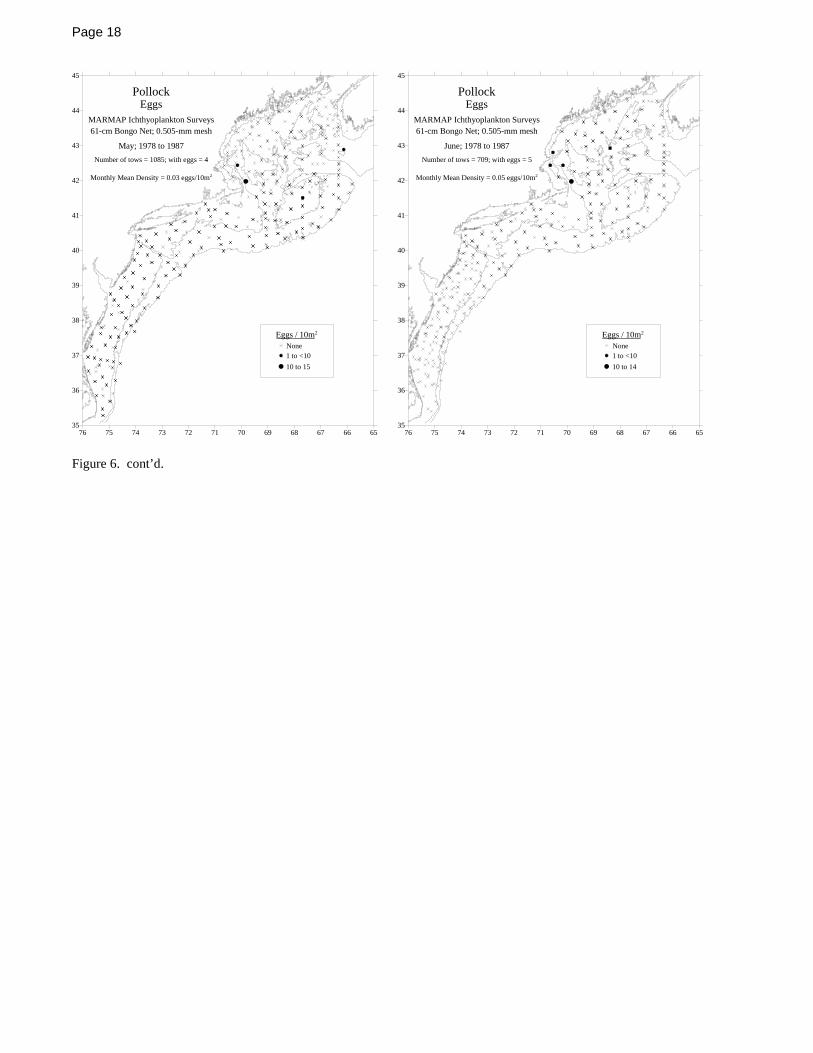
The 1978-1987 MARMAP offshore ichthyoplanktonsurveys [see Reid et al. (1999) for details] collected eggsduring October to June from off Delaware Bay tosouthwest Nova Scotia (Figure 6). Highest monthly meanegg densities occurred in November (24.4 eggs/10 m2),December (36.8 eggs/10 m2), January (86.1 eggs/10 m2)and February (19.6 eggs/10 m2) in Massachusetts Bay,Georges Bank, and Browns Bank. Egg densities wereconsiderably lower in months prior to and after this period(≤ 1.40 eggs/m2). This concurs with reports that peakspawning occurs during November to February (Hardy1978; Fahay 1983; Clay et al. 1989).
Eggs were collected at temperatures ranging fromabout 2-17oC (Figure 7). From October to February, eggswere found at increasingly lower temperatures, with mosteggs found at 10-11oC in October and most eggs found at5-6oC in February. From March to June the majority ofeggs were found at temperatures from around 5-7oC.Optimal development of eggs occurs at 3.3-8.9oC (Hardy1978).
Eggs were found over depths ranging from 30-270 m,but the majority of eggs were collected at a morerestricted range, 50-90 m (Figure 7). Hardy (1978)reported that eggs are found in water 50-250 m deep.
LARVAE
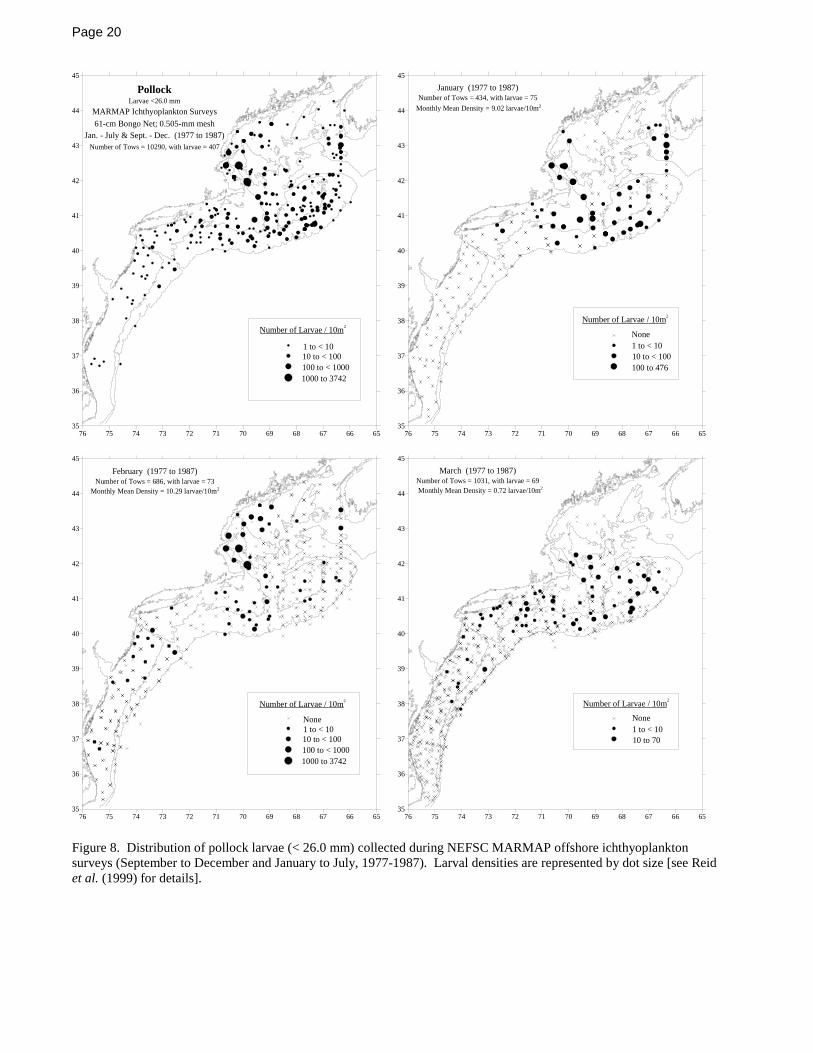
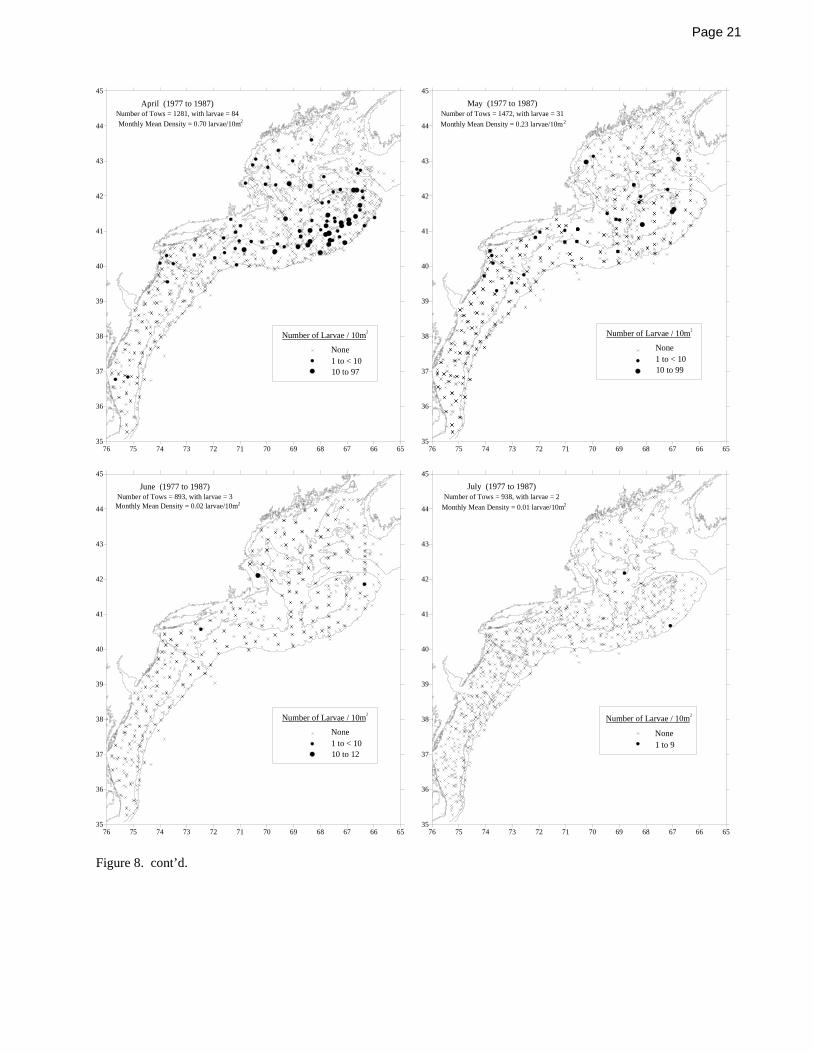
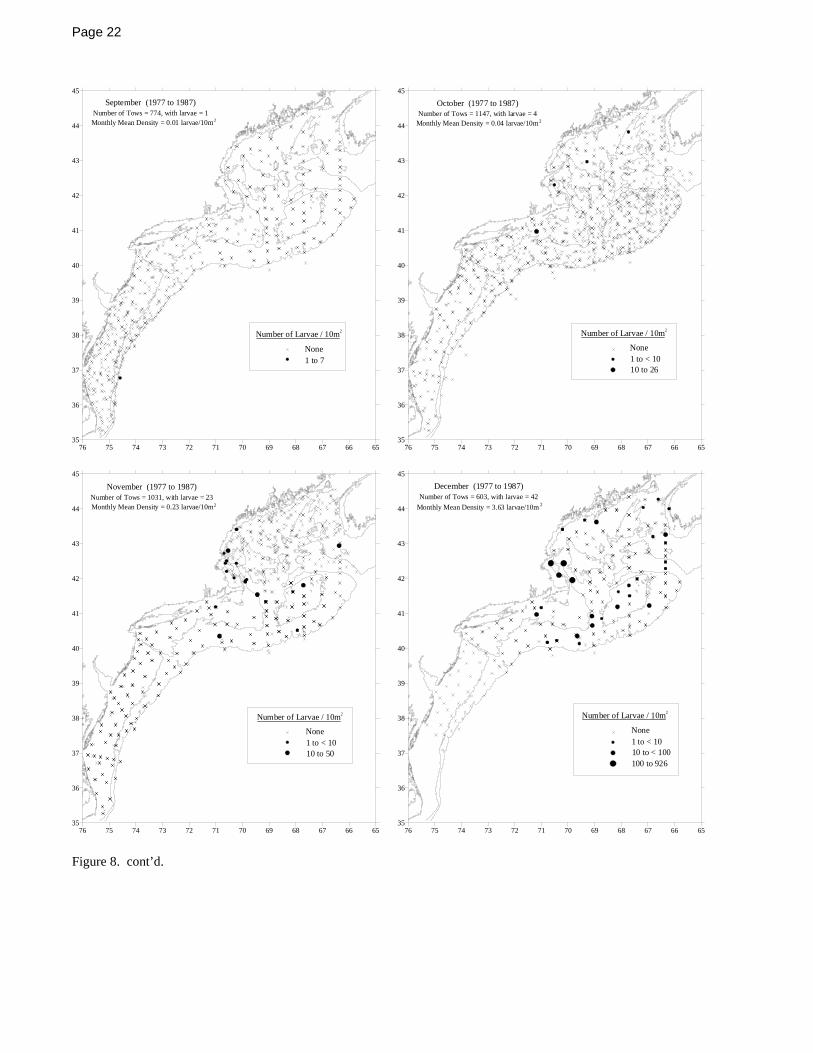
The 1977-1987 MARMAP offshore ichthyoplanktonsurveys [see Reid et al. (1999) for details] found larvaeduring September to July from off Chesapeake Bay tosouthwest Nova Scotia (Figure 8). The highest monthlymean larval densities occurred in December (3.6 larvae/10m2), January (9.0 larvae/10 m2) and February (10.3larvae/10 m2). Larval densities were considerably lowerin months prior to and after this period (≤ 0.72 larvae/10m2). This corresponds to peak spawning occurring fromNovember to February (Hardy 1978; Fahay 1983; Clay etal. 1989). The highest densities in December and Januaryappear to be in Massachusetts Bay, Georges Bank, and thewestern edge of Browns Bank; by Febraury the highestabundances are in Massachusetts Bay, off the east coast ofCape Cod, and in the vicinity of Jeffreys Ledge.
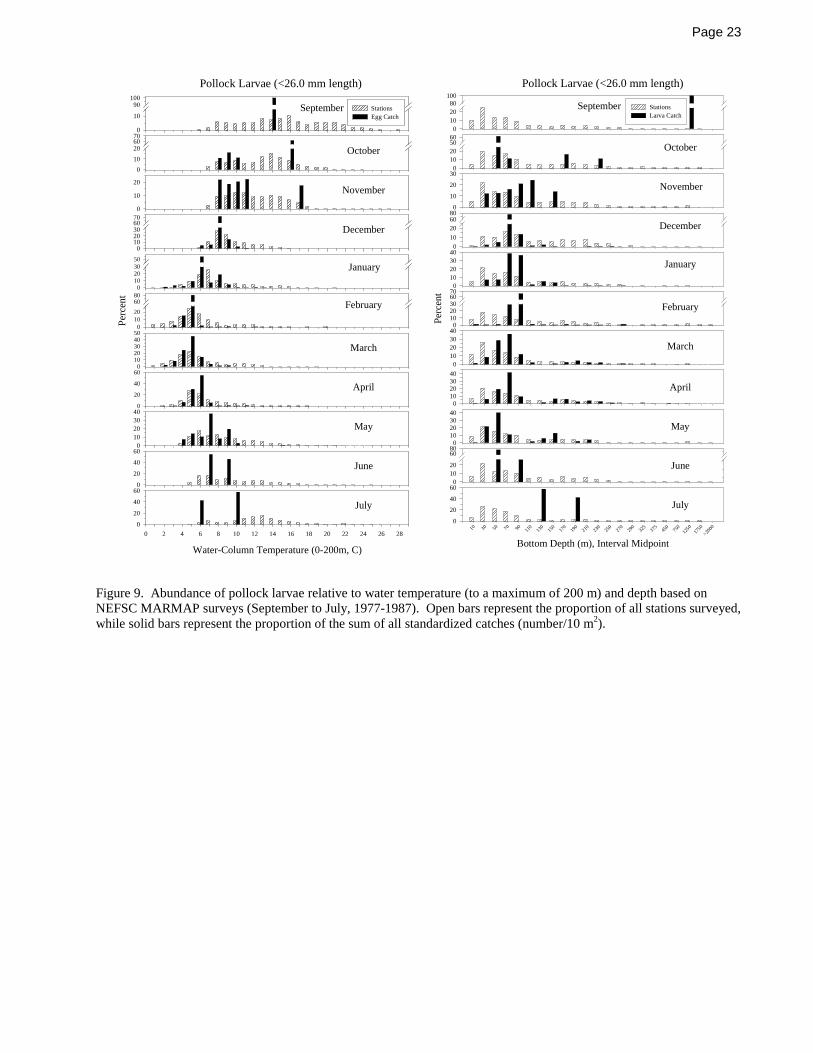
Larvae were collected within a temperature range ofabout 2-17oC (Figure 9). There appears to be a seasonaldifference in larval occurrence with bottom temperatures.
Page 4
In fall, larvae were found at temperatures of 8-17oC.Larvae were bimodally distributed relative to temperaturein October and November. In winter, larvae were found atcolder temperatures, approximately 2-13oC. In spring andsummer larvae were collected in slightly warmertemperatures ranging from 3-15oC, although the majoritywere at 5-10oC.
Larvae were collected at depths ranging from 10-250m from October to July (Figure 9). For most of the year,the majority of larvae were found at 50-90 m. Hardy(1978) reported that larvae are normally found out to the200 m depth contour, but that they have been found asdeep as 1550 m.
JUVENILES
NEFSC Bottom Trawl Surveys
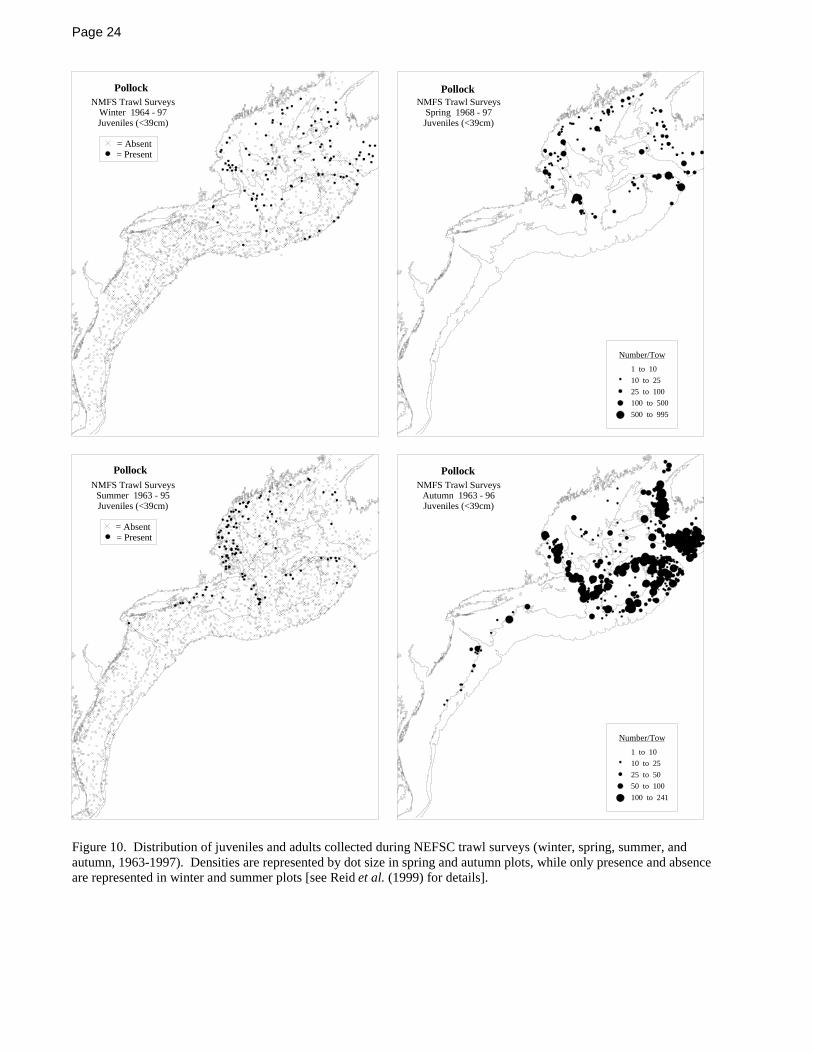
In the winter, NEFSC bottom trawl surveys [see Reidet al. (1999) for details] captured juveniles fromthroughout the Gulf of Maine, Browns Bank, and alongthe edges of Georges Bank (Figure 10). In summer, theywere spread along the inshore areas of the Gulf of Maine,off the coast of Rhode Island and Long Island, the westernedge of the Great South Channel, off Massachusetts, andthe northern edge of Georges Bank. In spring, the highestdensities of pollock were found along the fringes of theGulf of Maine, as well as the western edge of the GreatSouth Channel, the northeastern edge of Georges Bank,Browns Bank, and southwest Nova Scotia. Densities weresimilar in the autumn, with highest densities inMassachusetts Bay.
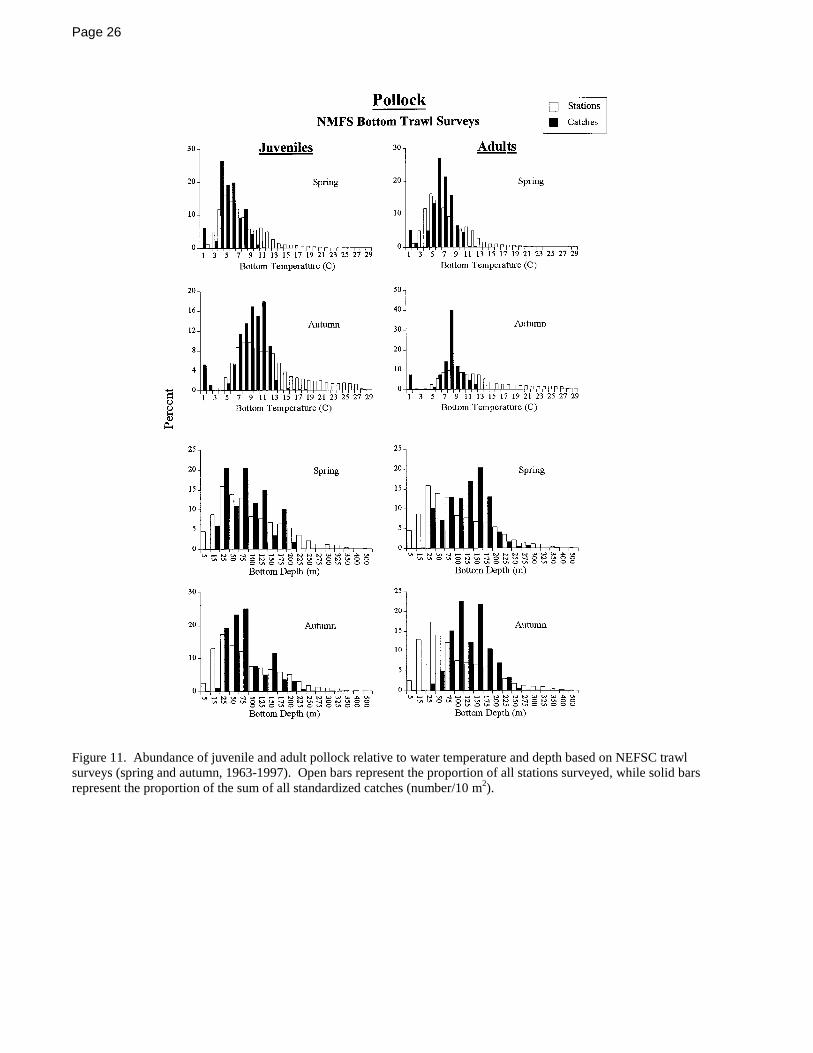
Juveniles were found at temperatures ranging from 1-18oC, although most were found at 4-12oC (Figure 11).There is a slight seasonal difference in juvenileoccurrence with bottom temperatures: juveniles werefound at colder temperatures in spring than in autumn. Inthe spring > 60% were collected at temperatures of around4-6oC, while in autumn > 60% were collected attemperatures of 8-11oC (Figure 11). Murawski and Finn(1988) found a similar trend for age 0+ and age 1+juveniles.
In the spring and fall, juveniles were caught at depthsranging from 5-250 m, but most were found between 25-75 m (Figure 11).
Massachusetts Inshore Trawl Survey
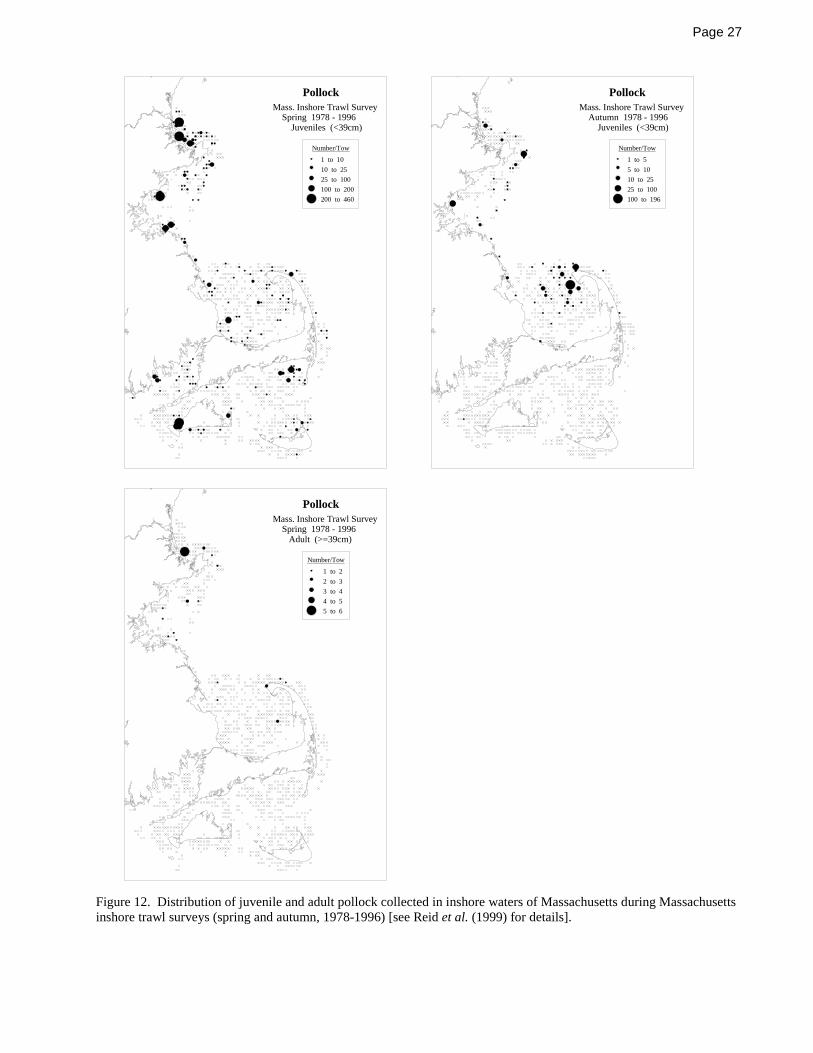
In spring, the 1978-1996 Massachusetts inshoresurveys [see Reid et al. (1999) for details] captured highdensities of juveniles north of Cape Ann, in the vicinity ofBoston Harbor, and the western shore of Martha’sVineyard (Figure 12). In the autumn, densities were lowerand juveniles were concentrated around the tip of CapeCod (Figure 12). Juveniles were more abundant in
inshore Massachusetts waters in spring than in autumn.There is a seasonal difference in juvenile occurrence
with bottom temperature. Juveniles were found over awider range of temperatures in spring than in autumn. Inthe spring, juveniles occurred primarily between 6-13oC,while in the fall they occurred mostly at temperaturesbetween 8 and 11oC (Figure 13).
There is also a seasonal difference in juvenileoccurrence with depth, with slightly deeper watersinhabited in autumn. In the spring, juveniles were foundfrom 0-75 m, but roughly 90% of juveniles were caught atdepths of # 20 m. In autumn they occurred from 0-70 mwith 40% caught at 45 m (Figure 13).
Rhode Island Bottom Trawl Survey
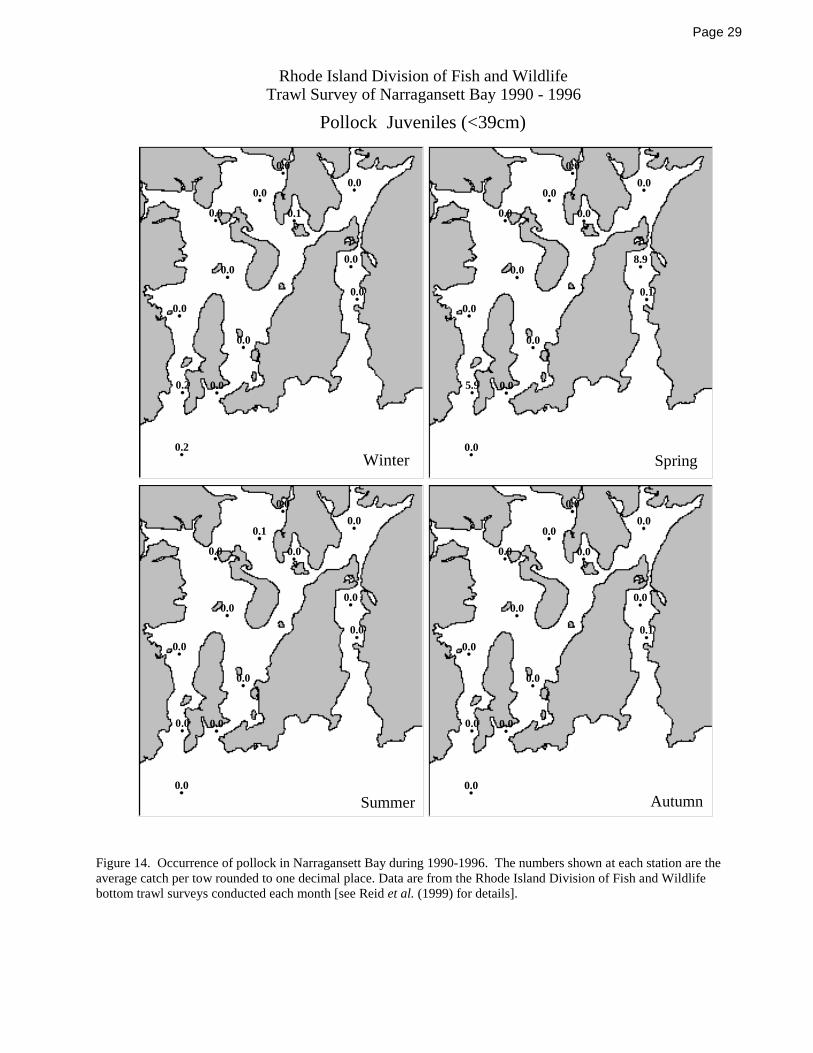
A total of only 336 pollock, all juveniles, were caughtin Narragansett Bay from 1990-1996 [see Reid et al.(1999) for details]. They were caught in all seasons, butthe vast majority (97%) were caught in spring (Figure 14).
Connecticut Fisheries Division Survey
Pollock are not commonly caught in the surveys ofLong Island Sound, and none have been recorded since1989 (Gottschall et al., in review). In surveys conductedfrom 1984-1990 throughout Long Island Sound, just 24juveniles were caught. All were caught during summer(July-August), at all depths and bottom types except sand.
ADULTS
NEFSC Bottom Trawl Survey
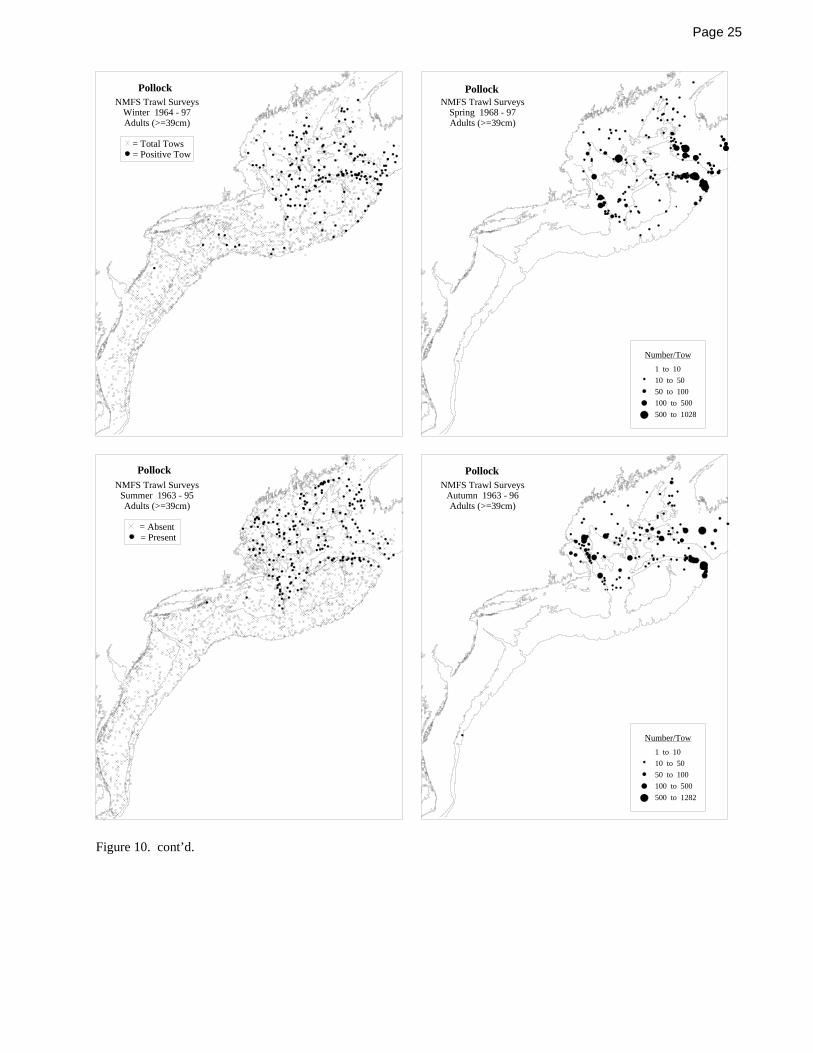
In winter, NEFSC bottom trawl surveys [see Reid etal. (1999) for details] captured adults mostly in theoffshore regions of the Gulf of Maine, Great SouthChannel, and along the northern edges of Georges Bank(Figure 10). The distribution of adults was similar insummer, although they were also present in nearshoreareas of the Gulf. In spring, adult pollock were spreadthroughout the Gulf of Maine with highest densities in thecentral Gulf, along the northeastern edge of GeorgesBank, the Great South Channel, and Browns Bank. Inautumn, the highest densities of adults were in thesouthwestern Gulf of Maine, the northeastern edge ofGeorges Bank, and Browns Bank. Adults were distributedfurther south in winter and spring than in summer andautumn.
Adults were found at temperatures of 1-12oC (Figure11). There does not appear to be a significant seasonaldifference in adult occurrence with bottom temperature,although in spring most adult pollock were found at 6-7oCwhile in autumn most were found at 8oC. These results
Page 5
support previous reports that adults occur from 1-14oCand that temperatures > 3.3oC are optimal (Collette andKlein-MacPhee, in prep.).
There also does not appear to be a major seasonaldifference in adult occurrence with depth. Adults werecaught at depths ranging from about 15-325 m, with themajority at 75-175 m (Figure 11).
Massachusetts Inshore Trawl Survey
Few adults were caught during the spring 1978-1996Massachusetts inshore surveys [see Reid et al. (1999) fordetails]. Those that were caught were mostly found northof Cape Ann; lower numbers were found in MassachusettsBay and around Cape Cod (Figure 12). No adults werecaught in the autumn surveys.
In the spring, adults occurred at temperatures rangingfrom 3-13oC, but approximately 60% were caught attemperatures of around 5-7oC (Figure 13). Approximately55% of adult pollock were caught at depths ranging from10-30 m, while the remainder were found at 45-75 m(Figure 13).
STATUS OF THE STOCKS
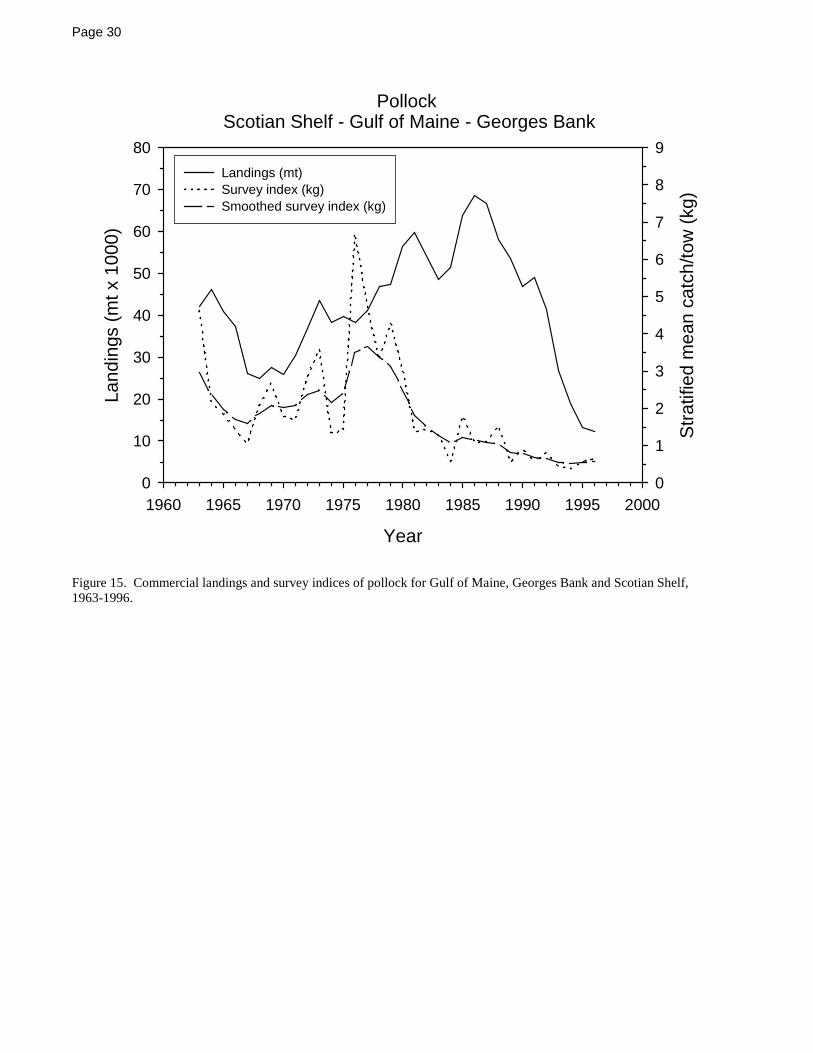
Commercial catches from the entire Scotian Shelf,Gulf of Maine and Georges Bank increased from anannual average of 38,200 mt during 1972-1976 to 68,900mt during 1986, but have since steadily declined tohistoric lows. The total landings in 1996 were 12,300metric tons (mt), a 7.5% decrease from 1995 (13,300 mt),a 35% decrease from 1994 (18,900 mt), and a 82%decrease from the 1986 peak (Figure 15; Mayo 1998).Total stock size, after increasing throughout the late1970’s and early 1980’s, has since markedly declined.Biomass indices for the Gulf of Maine-Georges Bankincreased during the mid-1970’s but declined sharplyduring the early 1980’s and have remained low.Spawning stock biomass increased from 90,000 mt in1974 to over 200,000 mt in 1985; SSB declined by 36%between 1986-1991 (Mayo 1995).
The September 1997 report to congress “Status ofFisheries of the United States” (National Marine FisheriesService 1997) reports that the state of overfishing of U.S.pollock stocks is currently unknown.
RESEARCH NEEDS
Many details of the biology of pollock from thenorthwest Atlantic are not well known. No information isavailable on the actual spawning event. This is potentiallyimportant information for understanding or modelling thegenetics and population dynamics of pollock stocks.Information on predation of the various life history stages
is lacking, and data on species interactions in general areneeded. More information is needed on the importance ofinshore areas, specifically rocky subtidal and intertidalzones and salt marshes, as nursery grounds for juvenilepollock. A better understanding of the role of these areasto recruitment and year-class strength is necessary. Thesehabitats may be critical bottleneck areas.
Finally, the genetic differentiation of stocks should beinvestigated further using more advanced and powerfulgenetic (e.g., microsatellite DNA markers) andbiochemical (e.g., elemental fingerprinting of otoliths)techniques. Currently, the management of Gulf of Mainearea pollock as a single unit stock is based on allozymeelectrophoresis analyses which indicate that the stocks aregenetically uniform (Mayo et al. 1989). Newer, morepowerful methods may reveal significant differences.
Most of the available information on northwestAtlantic pollock is restricted to distribution andabundance (EFH Level 2). Growth and survival (Level 3)and production rates (Level 4) by habitat are necessary inorder to accurately designate the essential habitat ofpollock.
ACKNOWLEDGMENTS
The literature review was greatly aided by the draftupdate to the Bigelow and Schroeder (1953) section onpollock provided by Bruce Collette. Joseph Vitalianoprovided gut contents data from the food habits database.The authors also wish to thank C. Steimle, J. Berrien, andR. Ramsey-Cross for help with the literature reviews.
REFERENCES CITED
Bigelow, H.B. and W.C. Schroeder. 1953. Fishes of theGulf of Maine. U.S. Fish Wildl. Serv., Fish. Bull. 53.577 p.
Bowman, R.E. and W.L. Michaels. 1984. Food ofseventeen species of northwest Atlantic fish. NOAATech. Mem. NMFS-F/NEC-28. 183 p.
Campana, S.E. 1989. Otolith microstructure of three larvalgadids in the Gulf of Maine, with inferences on earlylife history. Can. J. Zool. 67: 1401-1410.
Clay, D., W.T. Stobo, B. Beck, and P.C.F. Hurley. 1989.Growth of juvenile pollock (Pollachius virens L.)along the Atlantic coast of Canada with inferences ofinshore-offshore movements. J. Northwest Atl. Fish.Sci. 9: 37-43.
Collette, B.B. and G. Klein-MacPhee. In preparation.Pollock, Pollachius virens. In B.B. Collette and G.Klein-MacPhee eds. Bigelow and Schroeder’s fishesof the Gulf of Maine. Smithsonian Institution Press,Washington, DC.
Colton, J.B., Jr. and R.R. Marak. 1969. Guide foridentifying the common planktonic fish eggs and
Page 6
larvae of continental shelf waters, Cape Sable toBlock Island. U.S. Bur. Comm. Fish. Biol. Lab.Woods Hole Lab. Ref. No. 69-9. 43 p.
Fahay, M.P. 1983. Guide to the early stages of marinefishes occurring in the western North Atlantic Ocean,Cape Hatteras to the southern Scotian Shelf. J.Northwest Atl. Fish. Sci. 4: 1-423.
Goode, G.B. 1884. The fisheries and fishery industries ofthe United States. Section I: Natural history of usefulaquatic animals. Govt. Print. Office, Washington,DC. Plates.
Gottschall, K., M.W. Johnson, and D.G. Simpson. Inreview. The distribution and size composition offinfish, American lobster, and long-finned squid inLong Island Sound, based on the ConnecticutFisheries Division bottom trawl survey, 1984-1994.NOAA Tech. Rep.
Hardy, J.D., Jr. 1978. Development of fishes of the Mid-Atlantic Bight: An atlas of egg, larval and juvenilestages. Vol. 2 Anguillidae through Syngnathidae.U.S. Fish Wildl. Serv. Biol. Serv. Prog. FWS/OBS-78/12. 458 p.
Hoberman, J.M. and A.C. Jensen. 1962. The growth rateof New England pollock. Trans. Am. Fish. Soc. 91:227-228.
Langton, R.W. and R.E. Bowman. 1980. Food of fifteennorthwest Atlantic gadiform fishes. NOAA Tech.Rep. SSRF-740. 23 p.
MacDonald, J.S., M.J. Dadswell, R.G. Appy, G.D.Melvin, and D.A. Methven. 1984. Fishes, fishassemblages, and their seasonal movements in thelower Bay of Fundy and Passamaquoddy Bay,Canada. Fish. Bull. (U.S.) 82: 121-139.
Marak, R.R. 1960. Food habits of larval cod, haddock andcoalfish in the Gulf of Maine and Georges Bank area.J. Cons. Int. Explor. Mer 25: 147-157.
Markle, D.F. and L.-A. Frost. 1985. Comparativemorphology, seasonality, and a key to planktonic fisheggs from the Nova Scotian shelf. Can. J. Zool. 63:246-257.
Maurer, R.O., Jr. and R.E. Bowman. 1975. Food habits ofmarine fishes of the northwest Atlantic – data report.U.S. Natl. Mar. Fish. Serv. Northeast Fish. Cent.Woods Hole Lab. Ref. Doc. 75-3. 90 p.
Mayo, R. 1994. Life histories and habitat requirements ofdemersal fishes. In R.W. Langton, J.B. Pearce, andJ.A. Gibson eds. Selected living resources, habitatconditions, and human perturbations of the Gulf ofMaine: Environmental and ecological considerationsfor fishery management. p. 2-3. NOAA Tech. Mem.NMFS-NE-106.
Mayo, R. 1995. Pollock. In Conservation and UtilizationDivision, Northeast Fisheries Science Center eds.Status of the fishery resources off the northeasternUnited States for 1994. p. 61-63. NOAA Tech. Mem.NMFS-NE-108.
Mayo, R. 1998. Pollock. In S.H. Clark ed. Status of the
fishery resources off the northeastern United Statesfor 1998. p. 67-69. NOAA Tech. Mem. NMFS-NE-115.
Mayo, R.K., J.M. McGlade, and S.H. Clark. 1989.Patterns of exploitation and biological status ofpollock (Pollachius virens L.) in the Scotian Shelf,Georges Bank, and Gulf of Maine area. J. NorthwestAtl. Fish. Sci. 9: 13-36.
Murawski, S.A. and J.T. Finn. 1988. Biological bases formixed-species fisheries: species co-distribution inrelation to environmental and biotic variables. Can. J.Fish. Aquat. Sci. 45: 1720-1735.
National Marine Fisheries Service. 1997. Report toCongress. Status of fisheries of the United States:Report on the status of fisheries of the United States.September 1997. [Homepage of the National MarineFisheries Service]. [Online]. Available: http://www.nmfs.gov/sfa/Fstatus.html.
[NEFMC] New England Fishery Management Council.1993. Final amendment #5 to the NortheastMultispecies Fishery Management Plan incorporatingthe supplemental environmental impact statement.Vol. I. September 1993. NEFMC. [Saugus, MA.] 361p.
O’Brien, L., J. Burnett, and R.K. Mayo. 1993. Maturationof nineteen species of finfish off the Northeast coastof the United States, 1985-1990. NOAA Tech. Rep.NMFS 113. 66 p.
Ojeda, F.P. and J.H. Dearborn. 1990. Diversity,abundance, and spatial distribution of fishes andcrustaceans in the rocky subtidal zone of the Gulf ofMaine. Fish. Bull. (U.S.) 88: 403-410.
Ojeda, F.P. and J.H. Dearborn. 1991. Feeding ecology ofbenthic mobile predators: experimental analyses oftheir influence in rocky subtidal communities of theGulf of Maine. J. Exp. Mar. Biol. Ecol. 149: 13-44.
Rangeley, R.W. and D.L. Kramer. 1995. Use of rockyintertidal habitats by juvenile pollock Pollachiusvirens. Mar. Ecol. Prog. Ser. 126: 9-17.
Reid, R., F. Almeida, and C. Zetlin. 1999. Essential fishhabitat source document: Fishery independentsurveys, data sources, and methods. NOAA Tech.Mem. NMFS-NE-122. 39 p.
Rountree, R.A. and K.W. Able. 1992. Fauna of polyhalinesubtidal marsh creeks in southern New Jersey:composition, abundance and biomass. Estuaries 15:171-185.
Scott, J.S. 1980. Occurrence of pollock, Pollachiusvirens, and sand lance, Ammodytes sp., larvae in theBay of Fundy. J. Northwest Atl. Fish. Sci. 1: 45-48.
Scott, J.S. 1982a. Depth, temperature and salinitypreferences of common fishes of the Scotian Shelf. J.Northwest Atl. Fish. Sci. 3: 29-39.
Scott, J.S. 1982b. Selection of bottom type bygroundfishes of the Scotian Shelf. Can. J. Fish.Aquat. Sci. 39: 943-947.
Steele, D.H. 1963. Pollock (Pollachius virens (L.)) in the

Page 7
Bay of Fundy. J. Fish. Res. Board Can. 20:1267-1314.
Tyler, A.V. 1972. Food resource division among northernmarine demersal fishes. J. Fish. Res. Board Can. 29:997-1003.
Page 8
Table 1. Size and age at maturity of U.S. pollock, Pollachius virens.
Time Period L50 (cm) A50 (years) ReferenceMale Female Male Female
1986-1988 41.8 39.1 2.3 2.0 O’Brien et al. 1993
1970-1984 50.5 47.9 3.5 3.2 Mayo et al. 1989
Page 9
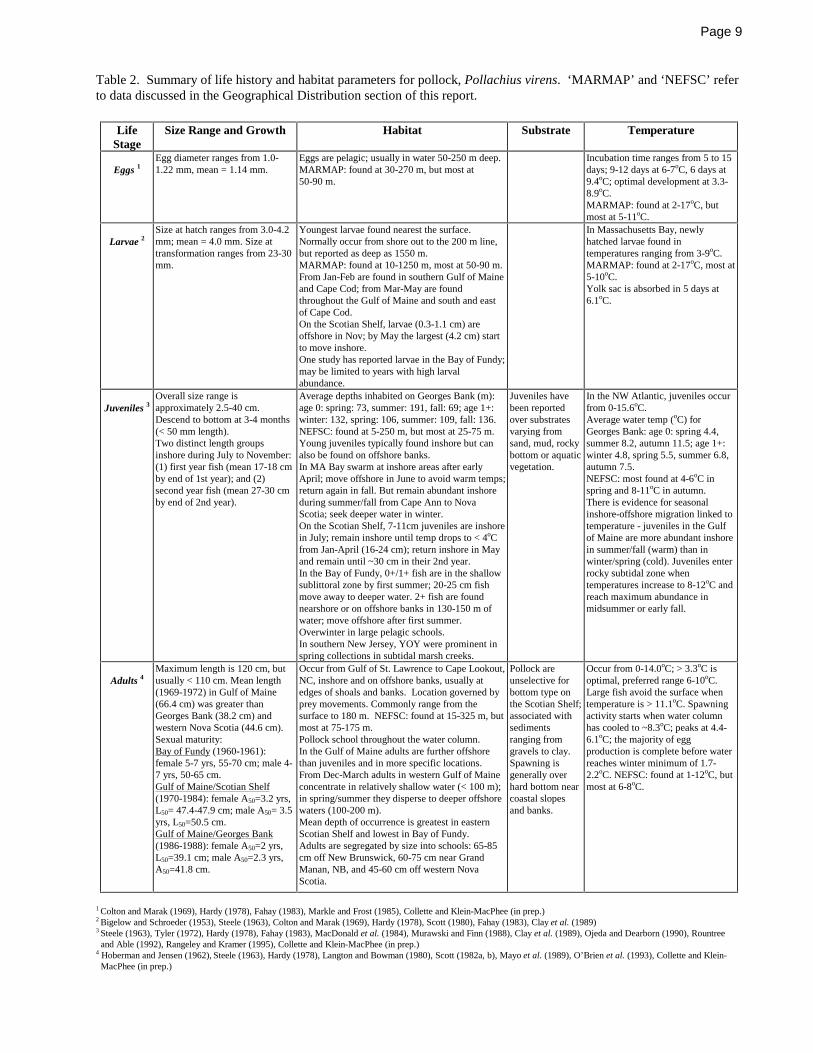
Table 2. Summary of life history and habitat parameters for pollock, Pollachius virens. ‘MARMAP’ and ‘NEFSC’ referto data discussed in the Geographical Distribution section of this report.
LifeStage
Size Range and Growth Habitat Substrate Temperature
Eggs 1Egg diameter ranges from 1.0-1.22 mm, mean = 1.14 mm.
Eggs are pelagic; usually in water 50-250 m deep.MARMAP: found at 30-270 m, but most at50-90 m.
Incubation time ranges from 5 to 15days; 9-12 days at 6-7oC, 6 days at9.4oC; optimal development at 3.3-8.9oC.MARMAP: found at 2-17oC, butmost at 5-11oC.
Larvae 2Size at hatch ranges from 3.0-4.2mm; mean = 4.0 mm. Size attransformation ranges from 23-30mm.
Youngest larvae found nearest the surface.Normally occur from shore out to the 200 m line,but reported as deep as 1550 m.MARMAP: found at 10-1250 m, most at 50-90 m.From Jan-Feb are found in southern Gulf of Maineand Cape Cod; from Mar-May are foundthroughout the Gulf of Maine and south and eastof Cape Cod.On the Scotian Shelf, larvae (0.3-1.1 cm) areoffshore in Nov; by May the largest (4.2 cm) startto move inshore.One study has reported larvae in the Bay of Fundy;may be limited to years with high larvalabundance.
In Massachusetts Bay, newlyhatched larvae found intemperatures ranging from 3-9oC.MARMAP: found at 2-17oC, most at5-10oC.Yolk sac is absorbed in 5 days at6.1oC.
Juveniles 3Overall size range isapproximately 2.5-40 cm.Descend to bottom at 3-4 months(< 50 mm length).Two distinct length groupsinshore during July to November:(1) first year fish (mean 17-18 cmby end of 1st year); and (2)second year fish (mean 27-30 cmby end of 2nd year).
Average depths inhabited on Georges Bank (m):age 0: spring: 73, summer: 191, fall: 69; age 1+:winter: 132, spring: 106, summer: 109, fall: 136.NEFSC: found at 5-250 m, but most at 25-75 m.Young juveniles typically found inshore but canalso be found on offshore banks.In MA Bay swarm at inshore areas after earlyApril; move offshore in June to avoid warm temps;return again in fall. But remain abundant inshoreduring summer/fall from Cape Ann to NovaScotia; seek deeper water in winter.On the Scotian Shelf, 7-11cm juveniles are inshorein July; remain inshore until temp drops to < 4oCfrom Jan-April (16-24 cm); return inshore in Mayand remain until ~30 cm in their 2nd year.In the Bay of Fundy, 0+/1+ fish are in the shallowsublittoral zone by first summer; 20-25 cm fishmove away to deeper water. 2+ fish are foundnearshore or on offshore banks in 130-150 m ofwater; move offshore after first summer.Overwinter in large pelagic schools.In southern New Jersey, YOY were prominent inspring collections in subtidal marsh creeks.
Juveniles havebeen reportedover substratesvarying fromsand, mud, rockybottom or aquaticvegetation.
In the NW Atlantic, juveniles occurfrom 0-15.6oC.Average water temp (oC) forGeorges Bank: age 0: spring 4.4,summer 8.2, autumn 11.5; age 1+:winter 4.8, spring 5.5, summer 6.8,autumn 7.5.NEFSC: most found at 4-6oC inspring and 8-11oC in autumn.There is evidence for seasonalinshore-offshore migration linked totemperature - juveniles in the Gulfof Maine are more abundant inshorein summer/fall (warm) than inwinter/spring (cold). Juveniles enterrocky subtidal zone whentemperatures increase to 8-12oC andreach maximum abundance inmidsummer or early fall.
Adults 4Maximum length is 120 cm, butusually < 110 cm. Mean length(1969-1972) in Gulf of Maine(66.4 cm) was greater thanGeorges Bank (38.2 cm) andwestern Nova Scotia (44.6 cm).Sexual maturity:Bay of Fundy (1960-1961):female 5-7 yrs, 55-70 cm; male 4-7 yrs, 50-65 cm.Gulf of Maine/Scotian Shelf(1970-1984): female A50=3.2 yrs,L50= 47.4-47.9 cm; male A50= 3.5yrs, L50=50.5 cm.Gulf of Maine/Georges Bank(1986-1988): female A50=2 yrs,L50=39.1 cm; male A50=2.3 yrs,A50=41.8 cm.
Occur from Gulf of St. Lawrence to Cape Lookout,NC, inshore and on offshore banks, usually atedges of shoals and banks. Location governed byprey movements. Commonly range from thesurface to 180 m. NEFSC: found at 15-325 m, butmost at 75-175 m.Pollock school throughout the water column.In the Gulf of Maine adults are further offshorethan juveniles and in more specific locations.From Dec-March adults in western Gulf of Maineconcentrate in relatively shallow water (< 100 m);in spring/summer they disperse to deeper offshorewaters (100-200 m).Mean depth of occurrence is greatest in easternScotian Shelf and lowest in Bay of Fundy.Adults are segregated by size into schools: 65-85cm off New Brunswick, 60-75 cm near GrandManan, NB, and 45-60 cm off western NovaScotia.
Pollock areunselective forbottom type onthe Scotian Shelf;associated withsedimentsranging fromgravels to clay.Spawning isgenerally overhard bottom nearcoastal slopesand banks.
Occur from 0-14.0oC; > 3.3oC isoptimal, preferred range 6-10oC.Large fish avoid the surface whentemperature is > 11.1oC. Spawningactivity starts when water columnhas cooled to ~8.3oC; peaks at 4.4-6.1oC; the majority of eggproduction is complete before waterreaches winter minimum of 1.7-2.2oC. NEFSC: found at 1-12oC, butmost at 6-8oC.
1 Colton and Marak (1969), Hardy (1978), Fahay (1983), Markle and Frost (1985), Collette and Klein-MacPhee (in prep.)2 Bigelow and Schroeder (1953), Steele (1963), Colton and Marak (1969), Hardy (1978), Scott (1980), Fahay (1983), Clay et al. (1989)3 Steele (1963), Tyler (1972), Hardy (1978), Fahay (1983), MacDonald et al. (1984), Murawski and Finn (1988), Clay et al. (1989), Ojeda and Dearborn (1990), Rountree and Able (1992), Rangeley and Kramer (1995), Collette and Klein-MacPhee (in prep.)4 Hoberman and Jensen (1962), Steele (1963), Hardy (1978), Langton and Bowman (1980), Scott (1982a, b), Mayo et al. (1989), O’Brien et al. (1993), Collette and Klein- MacPhee (in prep.)
Page 10
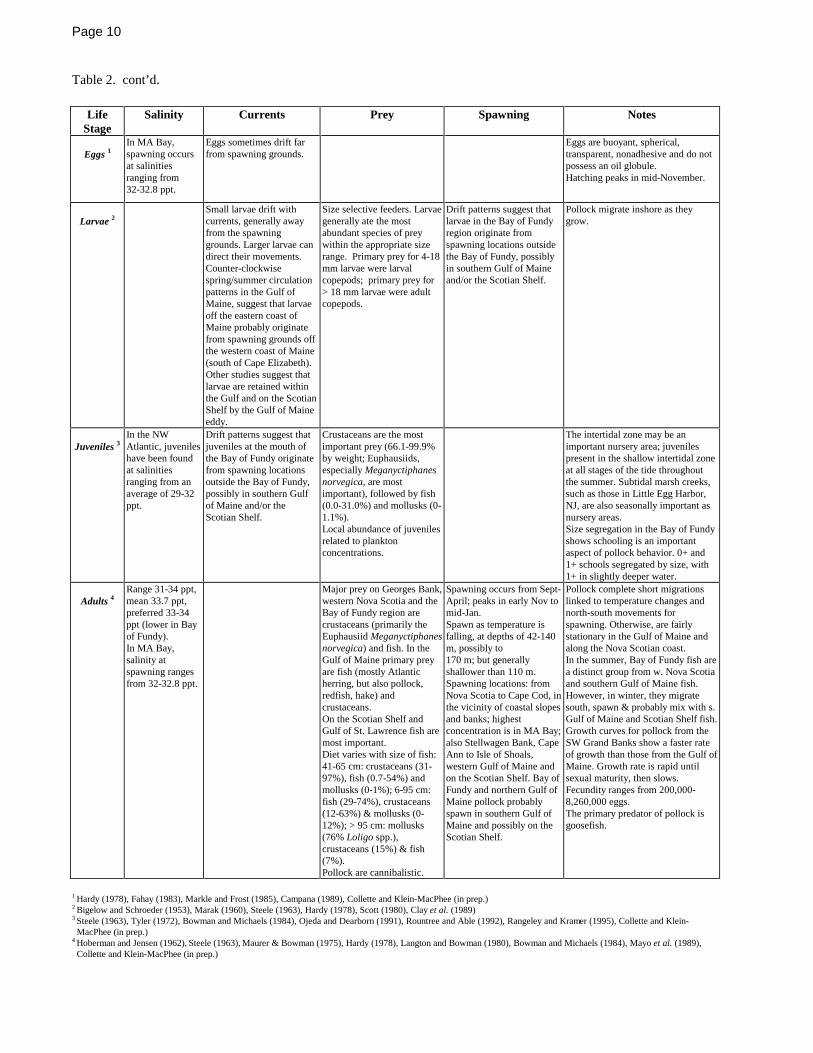
Table 2. cont’d.
LifeStage
Salinity Currents Prey Spawning Notes
Eggs 1In MA Bay,spawning occursat salinitiesranging from32-32.8 ppt.
Eggs sometimes drift farfrom spawning grounds.
Eggs are buoyant, spherical,transparent, nonadhesive and do notpossess an oil globule.Hatching peaks in mid-November.
Larvae 2Small larvae drift withcurrents, generally awayfrom the spawninggrounds. Larger larvae candirect their movements.Counter-clockwisespring/summer circulationpatterns in the Gulf ofMaine, suggest that larvaeoff the eastern coast ofMaine probably originatefrom spawning grounds offthe western coast of Maine(south of Cape Elizabeth).Other studies suggest thatlarvae are retained withinthe Gulf and on the ScotianShelf by the Gulf of Maineeddy.
Size selective feeders. Larvaegenerally ate the mostabundant species of preywithin the appropriate sizerange. Primary prey for 4-18mm larvae were larvalcopepods; primary prey for> 18 mm larvae were adultcopepods.
Drift patterns suggest thatlarvae in the Bay of Fundyregion originate fromspawning locations outsidethe Bay of Fundy, possiblyin southern Gulf of Maineand/or the Scotian Shelf.
Pollock migrate inshore as theygrow.
Juveniles 3In the NWAtlantic, juvenileshave been foundat salinitiesranging from anaverage of 29-32ppt.
Drift patterns suggest thatjuveniles at the mouth ofthe Bay of Fundy originatefrom spawning locationsoutside the Bay of Fundy,possibly in southern Gulfof Maine and/or theScotian Shelf.
Crustaceans are the mostimportant prey (66.1-99.9%by weight; Euphausiids,especially Meganyctiphanesnorvegica, are mostimportant), followed by fish(0.0-31.0%) and mollusks (0-1.1%).Local abundance of juvenilesrelated to planktonconcentrations.
The intertidal zone may be animportant nursery area; juvenilespresent in the shallow intertidal zoneat all stages of the tide throughoutthe summer. Subtidal marsh creeks,such as those in Little Egg Harbor,NJ, are also seasonally important asnursery areas.Size segregation in the Bay of Fundyshows schooling is an importantaspect of pollock behavior. 0+ and1+ schools segregated by size, with1+ in slightly deeper water.
Adults 4Range 31-34 ppt,mean 33.7 ppt,preferred 33-34ppt (lower in Bayof Fundy).In MA Bay,salinity atspawning rangesfrom 32-32.8 ppt.
Major prey on Georges Bank,western Nova Scotia and theBay of Fundy region arecrustaceans (primarily theEuphausiid Meganyctiphanesnorvegica) and fish. In theGulf of Maine primary preyare fish (mostly Atlanticherring, but also pollock,redfish, hake) andcrustaceans.On the Scotian Shelf andGulf of St. Lawrence fish aremost important.Diet varies with size of fish:41-65 cm: crustaceans (31-97%), fish (0.7-54%) andmollusks (0-1%); 6-95 cm:fish (29-74%), crustaceans(12-63%) & mollusks (0-12%); > 95 cm: mollusks(76% Loligo spp.),crustaceans (15%) & fish(7%).Pollock are cannibalistic.
Spawning occurs from Sept-April; peaks in early Nov tomid-Jan.Spawn as temperature isfalling, at depths of 42-140m, possibly to170 m; but generallyshallower than 110 m.Spawning locations: fromNova Scotia to Cape Cod, inthe vicinity of coastal slopesand banks; highestconcentration is in MA Bay;also Stellwagen Bank, CapeAnn to Isle of Shoals,western Gulf of Maine andon the Scotian Shelf. Bay ofFundy and northern Gulf ofMaine pollock probablyspawn in southern Gulf ofMaine and possibly on theScotian Shelf.
Pollock complete short migrationslinked to temperature changes andnorth-south movements forspawning. Otherwise, are fairlystationary in the Gulf of Maine andalong the Nova Scotian coast.In the summer, Bay of Fundy fish area distinct group from w. Nova Scotiaand southern Gulf of Maine fish.However, in winter, they migratesouth, spawn & probably mix with s.Gulf of Maine and Scotian Shelf fish.Growth curves for pollock from theSW Grand Banks show a faster rateof growth than those from the Gulf ofMaine. Growth rate is rapid untilsexual maturity, then slows.Fecundity ranges from 200,000-8,260,000 eggs.The primary predator of pollock isgoosefish.
1 Hardy (1978), Fahay (1983), Markle and Frost (1985), Campana (1989), Collette and Klein-MacPhee (in prep.)2 Bigelow and Schroeder (1953), Marak (1960), Steele (1963), Hardy (1978), Scott (1980), Clay et al. (1989)3 Steele (1963), Tyler (1972), Bowman and Michaels (1984), Ojeda and Dearborn (1991), Rountree and Able (1992), Rangeley and Kramer (1995), Collette and Klein- MacPhee (in prep.)4 Hoberman and Jensen (1962), Steele (1963), Maurer & Bowman (1975), Hardy (1978), Langton and Bowman (1980), Bowman and Michaels (1984), Mayo et al. (1989), Collette and Klein-MacPhee (in prep.)
Page 11
Figure 1. The pollock, Pollachius virens (from Goode 1884).
Page 12
December - JanuaryPeak Spawning
Spawning ranges from September to March1, 2, 3, 4, 5
Eggs hatch in 6-9 days after fertilization3
Resulting larvae are 3.0-4.2 mm2, 4, 6, 7
Transformation occurs at 23-30 mm5,7,8
Remain pelagic for 3-4 months9 (< 50 mm)7
MayMove Inshore
Small juveniles (mean size 3.7-4.2 cm4,10) begin to appearin the intertidal and subtidal zones11
JuneIn southern Massachusetts Bay, move offshore to avoid
rising temperatures; return inshore in autumn. However,north of Cape Ann, remain inshore5
JulyRemain Inshore
Range in size from 7-11 cm4
OctoberRemain Inshore
Average size of 17-18 cm4,10
JanuaryMove Offshore
In large pelagic schools1
When temperatures drop to < 4oC, move to more stableoffshore temperatures4
Range in size from 16-24 cm4
MayReturn Inshore
When water temperatures have warmed up4 to > 4oCRange in size from 20-25 cm5
Size-segregated schools (0+ and 1+ do not mix)1
OctoberBegin To Move Offshore
Mean length of 27-30 cm4,10 (in Bay of Fundy, 20-25 cm1)Largest begin to move offshore permanently4,10
Figure 2. Summary of the early life history of pollock. References: 1 Steele (1963), 2 Colton and Marak (1969), 3 Markleand Frost (1985), 4 Clay et al. (1989), 5 Collette and Klein-MacPhee (in prep.), 6 Scott (1980), 7 Fahay (1983), 8 Hardy(1978), 9 Mayo et al. (1989), 10 Rangeley and Kramer (1995), 11 MacDonald et al. (1984).
Page 13
Figure 3. Pollock spawning locations based upon the distribution of eggs and larvae (number/m2) from American andCanadian ichthyoplankton surveys (from Mayo et al. 1989).
Page 14
Figure 4. Abundance (% occurrence) of the major prey items in the pollock diet from NEFSC bottom trawl survey dataon food habits. Methods for sampling, processing, and analysis of samples differed between the time periods [see Reidet al. (1999) for details]. (a) 1973-1980, 0-40 cm: n=124, 41-110 cm: n=371; (b) 1981-1990, 0-40 cm: n=413, 41-110cm, n=686. The 0-40 cm size range corresponds, at least roughly, to juveniles, and the 41-110 cm size class correspondsto adults. The category “animal remains” refers to unidentifiable animal matter.
Crustacea 56.4%
Unkown Animal Remains 11.8%
Nematoda 10.3%Fish 9.2%
Annelida 4.1%
All Other Groups 8.2%
Crustacea 36.6%
Unknown Animal Remains 24.4%
Fish 16.1%
Nematoda 14.8%
All Other Prey 8.1%
Crustacea 68.9%
Unknown Animal Remains 16.6%
Fish 11.9%
All Other Prey 2.6%
Crustacea 60.3%
Fish 27.9%
Unknown Animal Remains 5.1%
All Other Prey 6.8%
a) 1973-1980
b) 1981-1990
0-40 cm 41-110 cm
0-40 cm 41-110 cm
Page 15
Figure 5. Distribution and abundance of polluck from Newfoundland to Cape Hatteras during 1975-1994. Data are fromthe U.S. NOAA/Canada DFO East Coast of North America Strategic Assessment Project (http://www-orca.nos.noaa.gov/projects/ecnasap/ecnasap_table1.html).
Page 16
Figure 6. Distribution of pollock eggs collected during NEFSC MARMAP offshore ichthyoplankton surveys (Octoberto December and January to June, 1978-1987). Egg densities are represented by dot size [see Reid et al. (1999) fordetails].
76 75 74 73 72 71 70 69 68 67 66 6535
36
37
38
39
40
41
42
43
44
45
EggsMARMAP Ichthyoplankton Surveys
Oct to Dec, and Jan to Jun; 1978 to 1987
Number of tows = 7087; with eggs = 588
Pollock
61-cm Bongo Net; 0.505-mm mesh
Eggs / 10m2
1 to <10
10 to <100
100 to <1000
1000 to <1000010000 to 14886
76 75 74 73 72 71 70 69 68 67 66 6535
36
37
38
39
40
41
42
43
44
45
EggsMARMAP Ichthyoplankton Surveys
October; 1978 to 1987
Number of tows = 1044; with eggs = 45
Pollock
Monthly Mean Density = 1.40 eggs/10m2
61-cm Bongo Net; 0.505-mm mesh
None1 to <10
10 to <100
100 to 185
Eggs / 10m2
76 75 74 73 72 71 70 69 68 67 66 6535
36
37
38
39
40
41
42
43
44
45
EggsMARMAP Ichthyoplankton Surveys
November; 1978 to 1987
Number of tows = 915; with eggs = 102
Pollock
Monthly Mean Density = 24.40 eggs/10m2
61-cm Bongo Net; 0.505-mm mesh
None1 to <10
10 to <100
100 to <1000
Eggs / 10m2
1000 to <10000
10000 to 10328
76 75 74 73 72 71 70 69 68 67 66 6535
36
37
38
39
40
41
42
43
44
45
EggsMARMAP Ichthyoplankton Surveys
December; 1978 to 1987
Number of tows = 569; with eggs = 163
Pollock
Monthly Mean Density = 36.82 eggs/10m2
61-cm Bongo Net; 0.505-mm mesh
None1 to <10
10 to <100
100 to <1000
Eggs / 10m2
1000 to 2568
Page 17
Figure 6. cont’d.
76 75 74 73 72 71 70 69 68 67 66 6535
36
37
38
39
40
41
42
43
44
45
EggsMARMAP Ichthyoplankton Surveys
January; 1978 to 1987
Number of tows = 433; with eggs = 114
Pollock
Monthly Mean Density = 86.08 eggs/10m2
61-cm Bongo Net; 0.505-mm mesh
None1 to <10
10 to <100
100 to <1000
Eggs / 10m2
1000 to <10000
10000 to 14886
76 75 74 73 72 71 70 69 68 67 66 6535
36
37
38
39
40
41
42
43
44
45
EggsMARMAP Ichthyoplankton Surveys
February; 1978 to 1987
Number of tows = 459; with eggs = 76
Pollock
Monthly Mean Density = 19.60 eggs/10m2
61-cm Bongo Net; 0.505-mm mesh
None1 to <10
10 to <100
100 to <1000
Eggs / 10m2
1000 to 3875
76 75 74 73 72 71 70 69 68 67 66 6535
36
37
38
39
40
41
42
43
44
45
EggsMARMAP Ichthyoplankton Surveys
March; 1978 to 1987
Number of tows = 853; with eggs = 29
Pollock
Monthly Mean Density = 0.55 eggs/10m2
61-cm Bongo Net; 0.505-mm mesh
None1 to <10
10 to 53
Eggs / 10m2
76 75 74 73 72 71 70 69 68 67 66 6535
36
37
38
39
40
41
42
43
44
45
EggsMARMAP Ichthyoplankton Surveys
April; 1978 to 1987
Number of tows = 1020; with eggs = 50
Pollock
Monthly Mean Density = 1.12 eggs/10m2
61-cm Bongo Net; 0.505-mm mesh
None1 to <10
10 to <100
100 to 399
Eggs / 10m2
Page 18
Figure 6. cont’d.
76 75 74 73 72 71 70 69 68 67 66 6535
36
37
38
39
40
41
42
43
44
45
EggsMARMAP Ichthyoplankton Surveys
May; 1978 to 1987
Number of tows = 1085; with eggs = 4
Pollock
Monthly Mean Density = 0.03 eggs/10m2
61-cm Bongo Net; 0.505-mm mesh
None1 to <10
10 to 15
Eggs / 10m2
76 75 74 73 72 71 70 69 68 67 66 6535
36
37
38
39
40
41
42
43
44
45
EggsMARMAP Ichthyoplankton Surveys
June; 1978 to 1987
Number of tows = 709; with eggs = 5
Pollock
Monthly Mean Density = 0.05 eggs/10m2
61-cm Bongo Net; 0.505-mm mesh
None1 to <10
10 to 14
Eggs / 10m2
Page 19
Figure 7. Abundance of pollock eggs relative to water temperature (to a maximum of 200 m) and depth based onNEFSC MARMAP surveys (October to June, 1978-1987). Open bars represent the proportion of all stations surveyed,while solid bars represent the proportion of the sum of all standardized catches (number/10 m2).
June
Bottom Depth (m), Interval Midpoint
10 30 50 70 90 110
130
150
170
190
210
230
250
270
290
325
375
450
750
1250
1750
>2000
0
20
40
60
May
0
20
40
60
April
0
20
40
60
March
0
10
20
30
40
February
Per
cent
0
20
40
60
January
0
20
40
60
December
0
20
40
60
November
0
20
40
60
Pollock Eggs
October
01020304050
StationsEgg Catch
January
01020304050
April
01020304050
May
01020304050
June
Water-Column Temperature (0-200m, C)
0 2 4 6 8 10 12 14 16 18 20 22 24 26 28
0
10
20
30
40
October
0
10
20
30
40
StationsEgg Catch
Pollock Eggs
February
Perc
ent
0
10
20405060
March
01020304050
November
0
10
506070
December
01020304050
Page 20
Figure 8. Distribution of pollock larvae (< 26.0 mm) collected during NEFSC MARMAP offshore ichthyoplanktonsurveys (September to December and January to July, 1977-1987). Larval densities are represented by dot size [see Reidet al. (1999) for details].
76 75 74 73 72 71 70 69 68 67 66 6535
36
37
38
39
40
41
42
43
44
45
MARMAP Ichthyoplankton Surveys
61-cm Bongo Net; 0.505-mm meshJan. - July & Sept. - Dec. (1977 to 1987)
Pollock
Number of Tows = 10290, with larvae = 407
Larvae <26.0 mm
1 to < 1010 to < 100100 to < 10001000 to 3742
Number of Larvae / 10m2
76 75 74 73 72 71 70 69 68 67 66 6535
36
37
38
39
40
41
42
43
44
45
January (1977 to 1987)Number of Tows = 434, with larvae = 75
Monthly Mean Density = 9.02 larvae/10m2
Number of Larvae / 10m2
None1 to < 1010 to < 100100 to 476
76 75 74 73 72 71 70 69 68 67 66 6535
36
37
38
39
40
41
42
43
44
45
February (1977 to 1987)Number of Tows = 686, with larvae = 73
Monthly Mean Density = 10.29 larvae/10m2
None1 to < 1010 to < 100100 to < 10001000 to 3742
Number of Larvae / 10m2
76 75 74 73 72 71 70 69 68 67 66 6535
36
37
38
39
40
41
42
43
44
45
March (1977 to 1987)Number of Tows = 1031, with larvae = 69Monthly Mean Density = 0.72 larvae/10m2
Number of Larvae / 10m2
None1 to < 1010 to 70
Page 21
Figure 8. cont’d.
76 75 74 73 72 71 70 69 68 67 66 6535
36
37
38
39
40
41
42
43
44
45
April (1977 to 1987)Number of Tows = 1281, with larvae = 84Monthly Mean Density = 0.70 larvae/10m2
Number of Larvae / 10m2
None1 to < 1010 to 97
76 75 74 73 72 71 70 69 68 67 66 6535
36
37
38
39
40
41
42
43
44
45
May (1977 to 1987)Number of Tows = 1472, with larvae = 31
Monthly Mean Density = 0.23 larvae/10m2
Number of Larvae / 10m2
None1 to < 1010 to 99
76 75 74 73 72 71 70 69 68 67 66 6535
36
37
38
39
40
41
42
43
44
45
June (1977 to 1987)Number of Tows = 893, with larvae = 3Monthly Mean Density = 0.02 larvae/10m2
Number of Larvae / 10m2
None1 to < 1010 to 12
76 75 74 73 72 71 70 69 68 67 66 6535
36
37
38
39
40
41
42
43
44
45
July (1977 to 1987)Number of Tows = 938, with larvae = 2
Monthly Mean Density = 0.01 larvae/10m2
Number of Larvae / 10m2
None1 to 9
Page 22
Figure 8. cont’d.
76 75 74 73 72 71 70 69 68 67 66 6535
36
37
38
39
40
41
42
43
44
45
September (1977 to 1987)Number of Tows = 774, with larvae = 1Monthly Mean Density = 0.01 larvae/10m2
Number of Larvae / 10m2
None1 to 7
76 75 74 73 72 71 70 69 68 67 66 6535
36
37
38
39
40
41
42
43
44
45
October (1977 to 1987)Number of Tows = 1147, with larvae = 4Monthly Mean Density = 0.04 larvae/10m 2
Number of Larvae / 10m2
None1 to < 1010 to 26
76 75 74 73 72 71 70 69 68 67 66 6535
36
37
38
39
40
41
42
43
44
45
November (1977 to 1987)Number of Tows = 1031, with larvae = 23Monthly Mean Density = 0.23 larvae/10m2
Number of Larvae / 10m2
None1 to < 1010 to 50
76 75 74 73 72 71 70 69 68 67 66 6535
36
37
38
39
40
41
42
43
44
45
December (1977 to 1987)Number of Tows = 603, with larvae = 42
Monthly Mean Density = 3.63 larvae/10m 2
Number of Larvae / 10m2
None1 to < 1010 to < 100100 to 926
Page 23
Figure 9. Abundance of pollock larvae relative to water temperature (to a maximum of 200 m) and depth based onNEFSC MARMAP surveys (September to July, 1977-1987). Open bars represent the proportion of all stations surveyed,while solid bars represent the proportion of the sum of all standardized catches (number/10 m2).
January
010203050
April
0
20
40
60
May
010203040
June
0
20
40
60
July
Water-Column Temperature (0-200m, C)
0 2 4 6 8 10 12 14 16 18 20 22 24 26 28
0
20
40
60
November
0
10
20
Pollock Larvae (<26.0 mm length)
September
0
10
90100
StationsEgg Catch
March
01020304050
October
0
10
206070
February
Per
cent
01020
6080
December
01020306070
January
010203040
April
010203040
December
010
206080
Pollock Larvae (<26.0 mm length)
September
0102080
100
StationsLarva Catch
May
010203040
June
01020
6080
July
Bottom Depth (m), Interval Midpoint
10 30 50 70 90 110
130 150 170
190
210 230 250
270 290 325
375 450 750
1250
1750
>2000
0
20
40
60
October
010205060
March
010203040
February
Perc
ent
01020306070
November
0
10
20
30
Page 24
Figure 10. Distribution of juveniles and adults collected during NEFSC trawl surveys (winter, spring, summer, andautumn, 1963-1997). Densities are represented by dot size in spring and autumn plots, while only presence and absenceare represented in winter and summer plots [see Reid et al. (1999) for details].
Number/Tow
1 to 10
10 to 25
25 to 100
100 to 500
500 to 995
NMFS Trawl SurveysSpring 1968 - 97Juveniles (<39cm)
PollockNMFS Trawl Surveys
Winter 1964 - 97Juveniles (<39cm)
= Absent = Present
Pollock
Number/Tow
1 to 10
10 to 25
25 to 50
50 to 100
100 to 241
NMFS Trawl SurveysAutumn 1963 - 96Juveniles (<39cm)
PollockNMFS Trawl Surveys
Summer 1963 - 95Juveniles (<39cm)
= Absent = Present
Pollock
Page 25
Figure 10. cont’d.
NMFS Trawl SurveysWinter 1964 - 97Adults (>=39cm)
= Total Tows = Positive Tow
Pollock
Number/Tow
1 to 10
10 to 50
50 to 100
100 to 500
500 to 1028
NMFS Trawl SurveysSpring 1968 - 97Adults (>=39cm)
Pollock
NMFS Trawl SurveysSummer 1963 - 95Adults (>=39cm)
= Absent = Present
Pollock
Number/Tow
1 to 10
10 to 50
50 to 100
100 to 500
500 to 1282
NMFS Trawl SurveysAutumn 1963 - 96Adults (>=39cm)
Pollock
Page 26
Figure 11. Abundance of juvenile and adult pollock relative to water temperature and depth based on NEFSC trawlsurveys (spring and autumn, 1963-1997). Open bars represent the proportion of all stations surveyed, while solid barsrepresent the proportion of the sum of all standardized catches (number/10 m2).
Page 27
Figure 12. Distribution of juvenile and adult pollock collected in inshore waters of Massachusetts during Massachusettsinshore trawl surveys (spring and autumn, 1978-1996) [see Reid et al. (1999) for details].
PollockMass. Inshore Trawl Survey Spring 1978 - 1996 Juveniles (<39cm)
Number/Tow
1 to 10
10 to 25
25 to 100
100 to 200
200 to 460
PollockMass. Inshore Trawl Survey Autumn 1978 - 1996 Juveniles (<39cm)
Number/Tow
1 to 5
5 to 10
10 to 25
25 to 100
100 to 196
PollockMass. Inshore Trawl Survey Spring 1978 - 1996 Adult (>=39cm)
Number/Tow
1 to 2
2 to 3
3 to 4
4 to 5
5 to 6
Page 28
Figure 13. Abundance of juvenile and adult pollock relative to water temperature and depth based on Massachusettsinshore surveys (spring and autumn, 1978-1996). Open bars represent the proportion of all stations surveyed, while solidbars represent the proportion of the sum of all standardized catches (number/10 m2).
Page 29
Figure 14. Occurrence of pollock in Narragansett Bay during 1990-1996. The numbers shown at each station are theaverage catch per tow rounded to one decimal place. Data are from the Rhode Island Division of Fish and Wildlifebottom trawl surveys conducted each month [see Reid et al. (1999) for details].
0.2
0.0
0.0
0.0
0.1
0.0
0.00.0
0.0
0.0
0.0
0.00.2
0.0
0.0
0.0
0.0
0.0
0.0
8.90.0
0.0
0.1
0.0
0.05.9
0.0
0.0
0.1
0.0
0.0
0.0
0.00.0
0.0
0.0
0.0
0.00.0
0.0
0.0
0.0
0.0
0.0
0.0
0.00.0
0.0
0.1
0.0
0.00.0
Spring
Summer Autumn
Winter
Pollock Juveniles (<39cm)
Rhode Island Division of Fish and WildlifeTrawl Survey of Narragansett Bay 1990 - 1996
Page 30
Figure 15. Commercial landings and survey indices of pollock for Gulf of Maine, Georges Bank and Scotian Shelf,1963-1996.
Pollock Scotian Shelf - Gulf of Maine - Georges Bank
Year
1960 1965 1970 1975 1980 1985 1990 1995 2000
Land
ings
(m
t x 1
000)
0
10
20
30
40
50
60
70
80
Str
atifi
ed m
ean
catc
h/to
w (
kg)
0
1
2
3
4
5
6
7
8
9
Landings (mt)Survey index (kg)Smoothed survey index (kg)
NORTHEAST FISHERIES SCIENCE CENTERDr. Michael P. Sissenwine, Science & Research Director
CAPT John T. Moakley, Operations, Management & Information Services Staff ChiefTeri L. Frady, Research Communications Unit Chief
Jon A. Gibson, Biological Sciences Editor & Laura S. Garner, Editorial Assistant
Publishing in NOAA Technical Memorandum NMFS-NE
Manuscript Qualification
This series represents a secondary level of scientific pub-lishing in the National Marine Fisheries Service (NMFS). Forall issues, the series employs thorough internal scientific review,but not necessarily external scientific review. For most issues,the series employs rigorous technical and copy editing. Manu-scripts that may warrant a primary level of scientific publishingshould be initially submitted to one of NMFS�s primary series(i.e., Fishery Bulletin, NOAA Technical Report NMFS, or Ma-rine Fisheries Review).
Identical, or fundamentally identical, manuscripts shouldnot be concurrently submitted to this and any other publicationseries. Manuscripts which have been rejected by any primaryseries strictly because of geographic or temporal limitations maybe submitted to this series.
Manuscripts by Northeast Fisheries Science Center(NEFSC) authors will be published in this series upon approvalby the NEFSC's Deputy Science & Research Director. Manu-scripts by non-NEFSC authors may be published in this series if:1) the manuscript serves the NEFSC�s mission; 2) the manu-script meets the Deputy Science & Research Director�s ap-proval; and 3) the author arranges for the printing and bindingfunds to be transferred to the NEFSC�s Research Communica-tions Unit account from another federal account. For all manu-scripts submitted by non-NEFSC authors and published in thisseries, the NEFSC will disavow all responsibility for the manu-scripts� contents; authors must accept such responsibility.
The ethics of scientific research and scientific publishingare a serious matter. All manuscripts submitted to this series areexpected to adhere -- at a minimum -- to the ethical guidelinescontained in Chapter 1 (�Ethical Conduct in Authorship andPublication�) of the CBE Style Manual, fifth edition (Chicago,IL: Council of Biology Editors). Copies of the manual areavailable at virtually all scientific libraries.
Manuscript Preparation
Organization: Manuscripts must have an abstract, table ofcontents, and -- if applicable -- lists of tables, figures, andacronyms. As much as possible, use traditional scientific manu-script organization for sections: �Introduction,� �Study Area,��Methods & Materials,� �Results,� �Discussion� and/or �Con-clusions,� �Acknowledgments,� and �References Cited.�
Style: All NEFSC publication and report series are obli-gated to conform to the style contained in the most recent editionof the United States Government Printing Office Style Manual.That style manual is silent on many aspects of scientific manu-scripts. NEFSC publication and report series rely more on theCBE Style Manual, fifth edition.
For in-text citations, use the name-date system. A specialeffort should be made to ensure that the list of cited workscontains all necessary bibliographic information. For abbrevi-ating serial titles in such lists, use the most recent edition of theSerial Sources for the BIOSIS Previews Database (Philadelphia,PA: Biosciences Information Service). Personal communica-tions must include date of contact and full name and mailingaddress of source.
For spelling of scientific and common names of fishes,mollusks, and decapod crustaceans from the United States andCanada, use Special Publications No. 20 (fishes), 26 (mollusks),and 17 (decapod crustaceans) of the American Fisheries Society(Bethesda, MD). For spelling of scientific and common namesof marine mammals, use Special Publication No. 4 of theSociety for Marine Mammalogy (Lawrence, KS). For spelling ingeneral, use the most recent edition of Webster�s Third NewInternational Dictionary of the English Language Unabridged(Springfield, MA: G.&C. Merriam).
Typing text, tables, and figure captions: Text, includingtables and figure captions, must be converted to, or able to becoverted to, WordPerfect. In general, keep text simple (e.g.,don�t switch fonts, don�t use hard returns within paragraphs,don�t indent except to begin paragraphs). Especially, don�t useWordPerfect graphics for embedding tables and figures in text.If the automatic footnoting function is used, also save a list offootnotes as a separate WordPerfect file. When the final draft isready for review, save the text, tables, figure captions, footnotes,and front matter as separate document files.
Tables should be prepared using all tabs or all spacesbetween columnar data, but not a combination of the two.Figures must be original (even if oversized) and on paper; theycannot be photocopies (e.g., Xerox) unless that is all that isavailable, nor be on disk. Except under extraordinary circum-stances, color will not be used in illustrations.
Manuscript Submission
Authors must submit one paper copy of the double-spacedmanuscript, one magnetic copy on a disk, and original figures (ifapplicable). NEFSC authors must include a completely signed-off �NEFSC Manuscript/Abstract/Webpage Review Form.�Non-NEFSC authors who are not federal employees will berequired to sign a �Release of Copyright� form.
Send all materials and address all correspondence to:
Jon A. Gibson, Biological Sciences EditorNortheast Fisheries Science CenterNational Marine Fisheries Service
166 Water StreetWoods Hole, MA 02543-1026 USA
Research Communications UnitNortheast Fisheries Science Center
National Marine Fisheries Service, NOAA166 Water St.
Woods Hole, MA 02543-1026
NOAA Technical Memorandum NMFS-NE -- This series is issued irregularly. The series includes: data reports of long-term or large area studies; synthesis reports for major resources or habitats; annual reports of assessment or monitoring programs;documentary reports of oceanographic conditions or phenomena; manuals describing field and lab techniques; literature surveys of majorresource or habitat topics; findings of task forces or working groups; summary reports of scientific or technical workshops; and indexedand/or annotated bibliographies. All issues receive internal scientific review and most issues receive technical and copy editing. Limitedfree copies are available from authors or the NEFSC. Issues are also available from the National Technical Information Service, 5285Port Royal Rd., Springfield, VA 22161.
Fishermen's Report and The Shark Tagger -- The Fishermen's Report (FR) is a quick-turnaround report on thedistribution and relative abundance of commercial fisheries resources as derived from each of the NEFSC's periodic research vesselsurveys of the Northeast's continental shelf. There is no scientific review, nor any technical or copy editing, of the FR; copies are availablethrough free subscription. The Shark Tagger (TST) is an annual summary of tagging and recapture data on large pelagic sharks as derivedfrom the NMFS's Cooperative Shark Tagging Program; it also presents information on the biology (movement, growth, reproduction, etc.)of these sharks as subsequently derived from the tagging and recapture data. There is internal scientific review, but no technical or copyediting, of the TST; copies are available only to participants in the tagging program.
Northeast Fisheries Science Center Reference Document -- This series is issued irregularly. The seriesincludes: data reports on field and lab observations or experiments; progress reports on continuing experiments, monitoring, andassessments; background papers for scientific or technical workshops; and simple bibliographies. Issues receive internal scientific reviewbut no technical or copy editing. No subscriptions. Free distribution of single copies.
The mission of NOAA's National Marine Fisheries Service (NMFS) is "stewardship of living marine resources for thebenefit of the nation through their science-based conservation and management and promotion of the health of theirenvironment." As the research arm of the NMFS's Northeast Region, the Northeast Fisheries Science Center (NEFSC)supports the NMFS mission by "planning, developing, and managing multidisciplinary programs of basic and appliedresearch to: 1) better understand the living marine resources (including marine mammals) of the Northwest Atlantic, andthe environmental quality essential for their existence and continued productivity; and 2) describe and provide tomanagement, industry, and the public, options for the utilization and conservation of living marine resources andmaintenance of environmental quality which are consistent with national and regional goals and needs, and withinternational commitments." Results of NEFSC research are largely reported in primary scientific media (e.g.,anonymously-peer-reviewed scientific journals). However, to assist itself in providing data, information, and advice toits constituents, the NEFSC occasionally releases its results in its own media. Those media are in three categories:
Publications and Reportsof the
Northeast Fisheries Science Center
To obtain a copy of a technical memorandum or a reference document, or to subscribe to the fishermen's report,write: Research Communications Unit, Northeast Fisheries Science Center, 166 Water St., Woods Hole, MA02543-1026. An annual list of NEFSC publications and reports is available upon request at the above address.Any use of trade names in any NEFSC publication or report does not imply endorsement.
STANDARD MAIL A