Embed Size (px)
Citation preview
Finally, it must be stressed that the results of this study are only for the distribution patterns of ntmospherically derived plutonium and may not necessarily apply on a one-to-one basis with the distribution of plutonium derived from indus- try-related sources.
Acknou) l edgmen t
The authors thank James E. Schindler and his graduate students for collecting water samples in Georgia, and Captain E. Dunster and Earl Wilson of the R/V Mys i s for their inval- uable service and cooperation in the field program.
Literature Cited
(1) Wahlgren, M. A., Alberts. J . J., Nelson, I). M., Orlandini, K. A.. ’“l’ransuranium Nuclides i l l the Environment”. Proceedings of an
International Atomic Energy Agency Conference, p 9, San Fran- cisco. Calif.. 1976.
(2) Schindler, J. E., Alberts, J . J.. Arch. Hydrobiol., 74,429 (1974). (3) Golchert, N. W., Sedlet, J., Radiochem. Radioanal. Lett., 12,215
(1972). (4) Wahlgren, M. A., Marshall, J. S.. “Impacts of Nuclear Releases
into the Aquatic Environment”, Proceedings of an Intemit ional Atomic Energy Agency Conference, p 227, Otaniemi, Finland, 1975.
( 5 ) Ayers. J . C., Sttsrmer, E. F., McWilliam, P., Univ. Michigan Great 1,akes Res. Div. Spec. Rpt. No. 30, p 95, Ann Arbor, Mich., 1967.
16) Ladewski, T. B., Stoermer, E. F., Proc. 16th Conf. Great Lakes Res., p 791, 1973.
(7) Andelman, d. B., Rozzell, T. C., Ado. Chem. Ser., 93, 118 (1970).
Receiued for reuieu September 27,1976. Accepted February 15,1977. Work performed under the auspices of the U.S. Energy Research and Decehpment Administration.
Polychlorinated Biphenyls in Coastal Marine Zooplankton: Bioaccumulation by Equilibrium Partitioning
John R. Clayton, Jr.’, Spyros P. Pavlou*, and Norman F. Breitner2 Department of Oceanography, University of Washington, Seattle, Wash. 98195
- __ Chlorobiphenyl concentrations in marine zooplankton
from estuarine zones of the North Eastern Pacific Ocean were measured from 1973 through 1975. Concentrations in the lipid fraction of the organisms ranged between 1 and 16 ppm. For the low levels detected in seawater (0.7-3.4 ppt), the data suggest that bioaccumulation is predominantly controlled by equilibrium partitioning of the chemical between the internal lipid pools of the biota and ambient water. Amplification factors of lo6 are determined in terms of lipid-water concen- tration ratios, K f . These quantities are uniform over a wide range of spatial and temporal regimes, species composition, and lipid content of the organisms. The results from this study provide good evidence tha t a t least for pelagic biota a t the lower trophic levels, food chain biomagnification is not a controlling factor in attaining the observed residue levels.
Polychlorinated biphenyls (C12ClnHlo-, with n = 1 , 2 . . . 10) are well recognized as ubiquitous components in aquatic ecosystems (1-3). Their worldwide occurrence has become an issue of increasing concern due to their continued global product,ion and persistence, their slow rates of chemical and biological degradation, their capacity for bioaccumulation, and their toxicity to living systems.
Coastal ecosyst.ems in particular receive substantial input loads of chlorohiphenyls (CH) with the main sources being industrial and municipal sewage outfalls, river runoff, aerial fallout, and dredge spoil disposal (2,446‘). Since these regions are capable of providing large quantities of harvestable food resources, as a result of high productivity in the lower trophic levels ( 7 ) . any biological effects induced by CB are of critical importance to man and t,he stability of the ecosystem. Fur- thermore. these compounds have been shown to alter the species composition of mixed phytoplankton cultures (8, 9) and inhibit the reproduction of certain zooplankton (10) .
_______.__-._.____....__I_______-- ~
I Present address. College of Fisheries WH-10. Llniversity of
I’resent address. Rigelow 1,nhoratory tor Ocean Sciences. McKown \.I’ashington, Seattle, Wash. 08198.
Point. West Hoothhay Harbor. Me. 04575.
Consequently, adequate information on current residue quantities and distributions in lower pelagic trophic levels is essential for predicting potential effects a t the ecosystem level.
Rationale. Although CB reqidues in marine zooplankton have previously been reported (11-16), interpretation and comparison of these data are difficult for the following reasons: The residues are frequently normalized to different parame- ters (Le., zooplankton fresh weight or lipid weight, or volume of water), sample contamination by surface films and float- ables during field collection may produce erroneously high results (12, 17, 18), and predictions of biological consequences to zooplankton populations may be meaningless without prior knowledge of the factors that control the biological availability of the chemical.
This paper presents a detailed analysis of CB residues measured in zooplankton in an effort to elucidate factors that control bioaccumulation of these stable organic molecules in lower trophic levels of nearshore ecosystems.
Material and Me thods
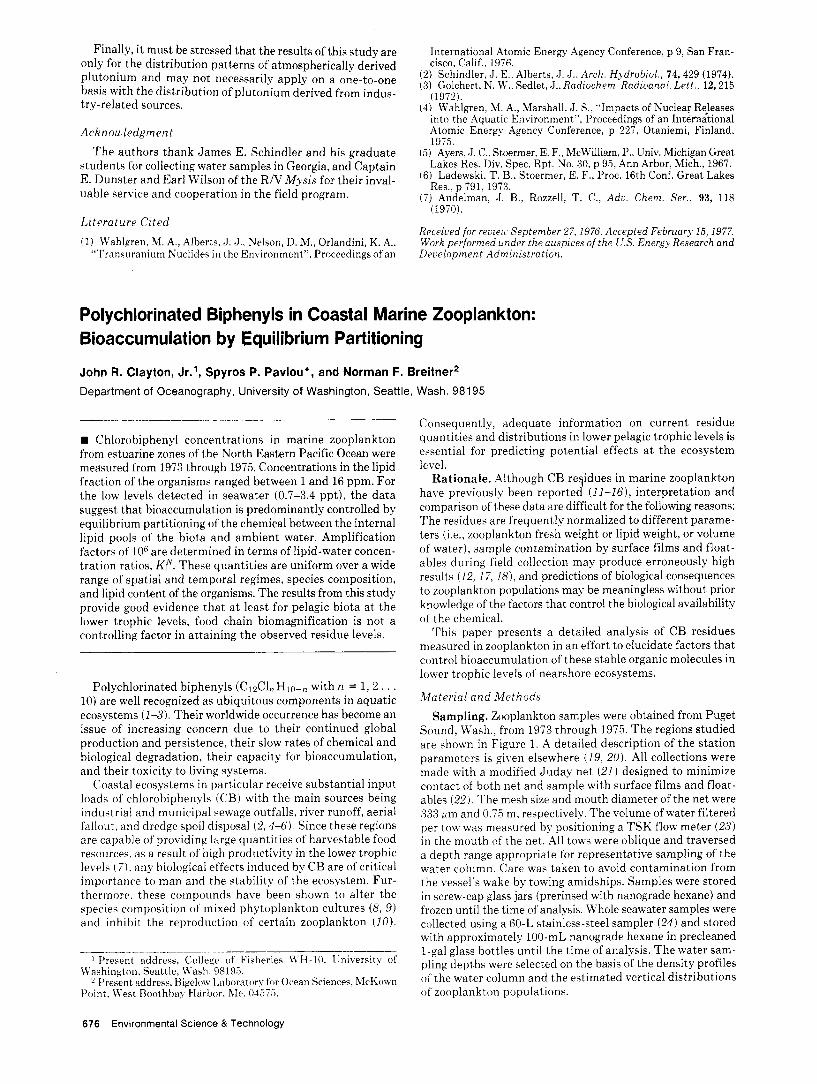
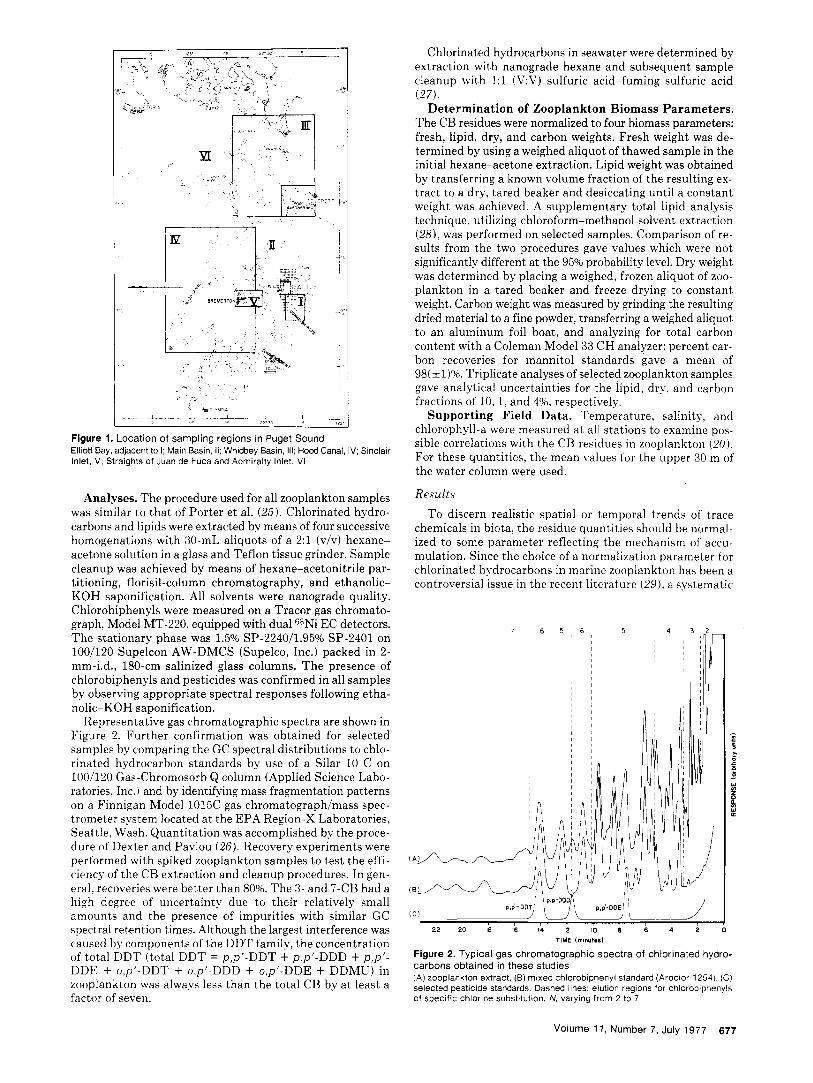
Sampling. Zooplankton samples were obtained from Puget Sound, Wash., from 1973 through 1975. The regions studied are shown in Figure 1. A detailed description of the station parameters is given elsewhere (19, 20) All collections were made with a modified Juday net (21) designed to minimize contact of both net and sample with surface films and float- ables (22) The mesh size and mouth diameter of the net were 333 pm and 0.75 m, respectively. The volume of water filtered per tow was measured by positioning a TSK flow meter (23) in the mouth of the net. All tows were oblique and traversed a depth range appropriate for representative sampling of the water column. Care was taken to avoid contamination from the veqsel’s wake by towing amidships. Samples were stored in screw-cap glass jars (prerinsed with nanograde hexane) and frozen until the time of analysis. Whole seawater samples were collected using a 60-L stainless-steel sampler ( 2 4 ) and stored with approximately 100-mL nanograde hexane in precleaned 1-gal glass bottles until the time of analysis. The water sam- pling depths were selected on the basis of the density profiles of the water column and the estimated vertical distributions of zooplankton populations.
676 Environmental Science & Technology
Chlorinated hydrocarbons in seawater were determined by extraction with nanograde hexane and subsequent sample cleanup with 1:l (V:Vj sulfuric acid-fuming sulfuric acid (27).
Determination of Zooplankton Biomass Parameters . The CB residues were normalized to four biomass parameters: fresh, lipid, dry, and carbon weights. Fresh weight was de- termined by using a weighed aliquot of thawed sample in the initial hexane-acetone extraction. Lipid weight was obtained by transferring a known volume fraction of the resulting ex- tract to a dry, tared beaker and desiccating until a constant weight was achieved. A supplementary total lipid analysis technique, utilizing chloroform-methanol solvent extraction (28) , was performed on selected samples. Comparison of re- sults from the two procedures gave values which were not significantly different at the 95% probability level. Dry weight was determined by placing a weighed, frozen aliquot of zoo- plankton in a tared beaker and freeze drying to constant weight. Carbon weight was measured by grinding the resulting dried material to a fine powder, transferring a weighed aliquot to an aluminum foil boat, and analyzing for total carbon content with a Coleman Model 33 CH analyzer; percent car- bon recoveries for mannitol standards gave a mean of 98( * I)%. Triplicate analyses of selected zooplankton samples gave analytical uncertainties for the lipid, dry. and carbon fractions of 10, 1, and 496, respectively.
Support ing Field Data. Temperature, salinity. and chlorophyll-a were measured at all stations to examine pos- sible correlations with the CB residues in zooplankton (20) For these quantities, the mean values for the upper 30 m of the water column were used.
Results To discern realistic spatial or temporal trends of trace
chemicals in biota, the residue quantities should be normal- ized to some parameter reflecting the mechanism of accu- mulation. Since the choice of a normalization parameter for chlorinated hydrocarbons in marine zooplankton has been a controversial issue in the recent literature (29). a systematic
< k U2‘
I ++-?
Elliott Bay, adjacent to I Main Basin, II Whidbey Basin, 111 Hood Canal, IV Sinclair Inlet, V Straights of Juan de Fuca and Admiralty Inlet VI
Analyses. The procedure used for all zooplankton samples was similar to that of Porter et al. (25 ) . Chlorinated hydro- carbons and lipids were extracted by means of four successive homogenations with 30-mL aliquots of a 2:l (v/v) hexane- acetone solution in a glass and Teflon tissue grinder. Sample cleanup was achieved by means of hexane-acetonitrile par- titioning, florisil-column chromatography, and ethanolic- KOH saponification. All solvents were nanograde quality. Chlorobiphenyls were measured on a Tracor gas chromato- graph, Model MT-220, equipped with dual 63Ni EC detectors. The stationary phase was 1.5% SP-224011.95% SP-2401 on 100/120 Supelcon AW-DMCS (Supelco, Inc.) packed in 2- mm-i.d., 180-cm salinized glass columns. The presence of chlorobiphenyls and pesticides was confirmed in all samples by observing appropriate spectral responses following etha- nolic-KOH saponification.
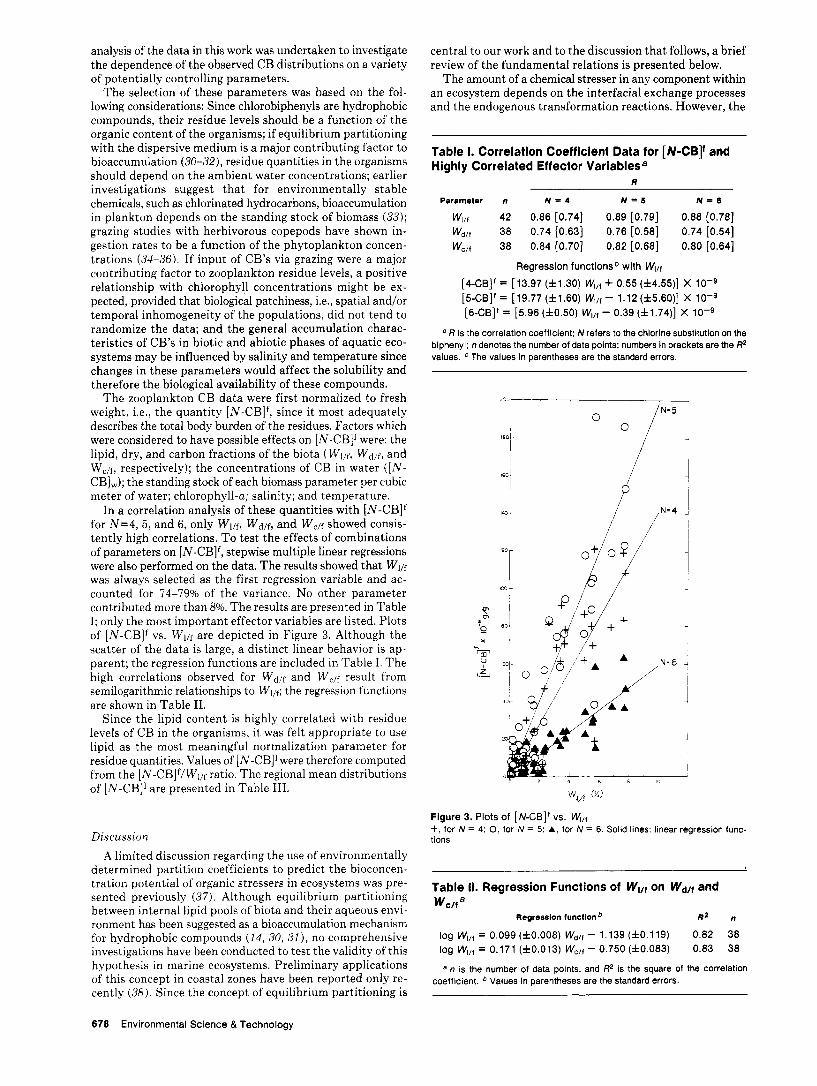
Representative gas chromatographic spectra are shown in Figure 2. Further confirmation was obtained for selected samples by comparing the GC spectral distributions to chlo- rinated hydrocarbon standards by use of a Silar 10 C on 100/120 Gas-Chromosorb Q column (Applied Science Labo- ratories, Inc.) and by identifying mass fragmentation patterns on a Finnigan Model 1015C gas chromatograph/mass spec- trometer system located a t the EPA Region-X Laboratories, Seattle, Wash. Quantitation was accomplished by the proce- dure of Dexter and Pavlou (26). Recovery experiments were performed with spiked zooplankton samples to test the effi- ciency of the CB extraction and cleanup procedures. In gen- eral, recoveries were better than 80%. The 3- and 7-CB had a high degree of uncertainty due to their relatively small amounts and the presence of impurities with similar GC spectral retention times. Although the largest interference was caused by components of the DDT family, the concentration of total DDT (total DDT = p,p’-DDT + p,p’-DDD + p,p’- DDE + o,p’-DDT + o,p’-DDD + o,p’-DDE + DDMU) in zooplankton was always less than the total CB by a t least a factor of seven.
Figure 2. Typical gas chromatographic spectra of chlorinated hydro- carbons obtained in these studies (A) zooplankton extract, (B) mixed chlorobiphenyl standard (Aroclor 1254). (C) selected pesticide standards. Dashed lines: elution regions for chlorobiphenyls of specific chlorine substitution. N. varying from 2 to 7
Volume 11, Number 7 , July 1977 677
analysis of the data in this work was undertaken to investigate the dependence of the observed CB distributions on a variety of potentially controlling parameters.
The selection of these parameters was based on the fol- lowing considerations: Since chlorobiphenyls are hydrophobic compounds, their residue levels should be a function of the organic content of the organisms; if equilibrium partitioning with the dispersive medium is a major contributing factor to bioaccumulation (30-32), residue quantities in the organisms should depend on the ambient water concentrations; earlier investigations suggest that for environmentally stable chemicals, such as chlorinated hydrocarbons, bioaccumulation in plankton depends on the standing stock of biomass (33); grazing studies with herbivorous copepods have shown in- gestion rates to be a function of the phytoplankton concen- trations (34-36) . If input of CB's via grazing were a major contributing factor to zooplankton residue levels, a positive relationship with chlorophyll concentrations might be ex- pected, provided that biological patchiness, Le., spatial and/or temporal inhomogeneity of the populations, did not tend to randomize the data; and the general accumulation charac- teristics of CB's in biotic and abiotic phases of aquatic eco- systems may be influenced by salinity and temperature since changes in these parameters would affect the solubility and therefore the biological availability of these compounds.
The zooplankton CB data were first normalized to fresh weight, Le., the quantity [N-CBIf, since it most adequately describes the total body burden of the residues. Factors which were considered to have possible effects on [N-CB]' were: the lipid, dry, and carbon fractions of the biota (Wilt, Wdlf, and Wc/f, respectively); the concentrations of CB in water ( [ N - CB],); the standing stock of each biomass parameter per cubic meter of water; chlorophyll-a; salinity; and temperature.
In a correlation analysis of these quantities with [N-CBIf for N=4, 5, and 6, only Wllf, Wd/f, and W,lf showed consis- tently high correlations. To test the effects of combinations of parameters on [N-CBIf, stepwise multiple linear regressions were also performed on the data. The results showed that Wl/f was always selected as the first regression variable and ac- counted for 74-79% of the variance. No other parameter contributed more than 8%. The results are presented in Table I; only the most important effector variables are listed. Plots of [N-CBIf vs. Wllf are depicted in Figure 3. Although the scatter of the data is large, a distinct linear behavior is ap- parent; the regression functions are included in Table I. The high correlations observed for Wd/f and Wclf result from semilogarithmic relationships to Wllf; the regression functions are shown in Table 11.
Since the lipid content is highly correlated with residue levels of CB in the organisms, it was felt appropriate to use lipid as the most meaningful normalization parameter for residue quantities. Values of [N-CB]' were therefore computed from the [N-CBIf/Wl/f ratio. The regional mean distributions of [N-CB]] are presented in Table 111.
Discussion A limited discussion regarding the use of environmentally
determined partition coefficients to predict the bioconcen- tration potential of organic stressers in ecosystems was pre- sented previously ( 3 7 ) . Although equilibrium partitioning between internal lipid pools of biota and their aqueous envi- ronment has been suggested as a bioaccumulation mechanism for hydrophobic compounds (14, 30, 31 ), no comprehensive investigations have been conducted to test the validity of this hypothesis in marine ecosystems. Preliminary applications of this concept in coastal zones have been reported only re- cently (38). Since the concept of equilibrium partitioning is
central to our work and to the discussion that follows, a brief review of the fundamental relations is presented below.
The amount of a chemical stresser in any component within an ecosystem depends on the interfacial exchange processes and the endogenous transformation reactions. However, the
Table I. Correlation Coefficient Data for [N-CB]' and Highly Correlated Effector Variablesa
R
Parameter n N = 4 N = 5 N = 6
Wl/f 42 0.86 [0.74] 0.89 [0.79] 0.88 [0.78] W d / j 38 0.74 [0.63] 0.76 [0.58] 0.74 [0.54] Wc/f 38 0.84 [0.70] 0.82 [0.68] 0.80 [0.64]
Regression functions with WIlf
[CCB]' = [13.97 ( f 1 . 3 0 ) Wl,f -I- 0.55 ( f4 .55 ) ] X [5-CBIf = [19.77 ( f l . 6 0 ) W,/f - 1.12 (f5.60)] X [6-CB]' = [5.96 (f0.50) Wl,f - 0.39 ( f1 .74 ) ] X
a R is the correlation coefficient: N refers to the chlorine substitution on the biphenyl: n denotes the number of data points: numbers in brackets are the R2 values. The values in parentheses are the standard errors.
A t
6 5 C
w,/i ?A)
Figure 3. Plots of [ KCB]' vs. W,,, +, for N = 4; 0, for N = 5; A, for N = 6. Solid lines: linear regression func- tions
~
Table II. Regression Functions of W,/, on WdIf and Wclf a
Regression function * R2 n
log Wl/f = 0.099 ( f0 .008) Wd/f - 1.139 (fO.119) log Wl/f = 0.171 ( f 0 . 0 1 3 ) Wc/, - 0.750 ( f 0 . 0 8 3 )
0.82 38 0.83 38
a n is the number of data points. and R2 is the square of the correlation coefficient. Values in parentheses are the standard errors.
678 Environmental Science & Technology
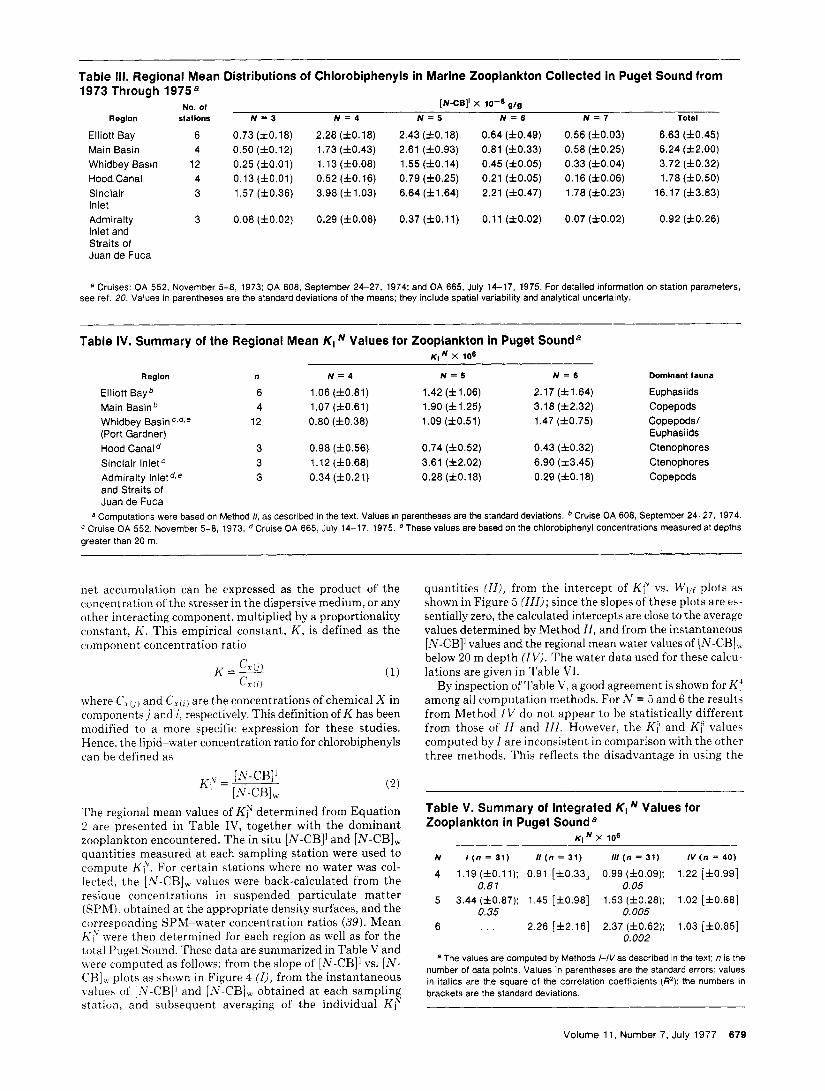
Table 111. Regional Mean Distributions of Chlorobiphenyls in Marine Zooplankton Collected in Puget Sound from 1973 Through 1975a -
- No. 01 [N-CBII x 10-6
Region slallons N = 3 N = 4 N = 5 N = 6 N = 7 Total
Elliott Bay 6 0.73 (f0.18) 2.28 (f0.18) 2.43 (f0.18) 0.64 (f0.49) 0.56 (f0.03) 6.63 (f0.45) Main Basin 4 0.50 (f0.12) 1.73 (f0.43) 2.61 (f0.93) 0.81 (f0.33) 0.58 (f0.25) 6.24 (f2.00) Whidbey Basin 12 0.25 (fO.01) 1.13 (f0.08) 1.55 (f0.14) 0.45 (f0.05) 0.33 (f0.04) 3.72 (f0.32) Hoodcanal 4 0.13 (fO.O1) 0.52 (50.16) 0.79 (f0.25) 0.21 (f0.05) 0.16 (f0.06) 1.78 (f0.50) Sinclair 3 1.57 (f0.36) 3.98 (f1.03) 6.64 (f1.64) 2.21 (f0.47) 1.78 (10.23) 16.17 (f3.83) Inlet Admiralty 3 0.08 (f0.02) 0.29 (f0.08) 0.37 (fO.ll) 0.11 (f0.02) 0.07 (f0.02) 0.92 (f0.26) Inlet and Straits of JuandeFuca
a Cruises: OA 552, November 5-8, 1973; OA 608, September 24-27, 1974; and OA 665, July 14-17, 1975. For detailed information on station parameters, see ref. 20. Values in parentheses are the standard deviations of the means: they include spatial variability and analytical uncertainty.
Table IV. Summary of the Regional Mean K, Values for Zooplankton in Puget Sounda K i N X lo6
Region n N = 4 N = 5 N = 6 Dominant lama
Elliott Bayb 6 1.06 (f0.81) 1.42 (f1.06) 2.17 (f1.64) Euphasiids Main Basinb 4 1.07 (f0.61) 1.90 (f1.25) 3.18 (f2.32) Copepods
0.80 (f0.38) 1.09 (f0.51) 1.47 (f0.75) Copepods1 (Port Gardner) Euphasiids
Hood Canal 3 0.98 (f0.56) 0.74 (f0.52) 0.43 (f0.32) Ctenophores Sinclair InletC 3 1.12 (f0.68) 3.61 (f2.02) 6.90 (f3.45) Ctenophores
Admiralty Inlet d,e 3 0.34 (f0.21) and Straits of Juan de Fuca
Whidbey Basin c r d r e 12
0.28 (f0.18) 0.29 (f0.18) Copepods
a Computations were based on Method I/, as described in the text. Values in parentheses are the standard deviations. Cruise OA 608, September 24-27, 1974. Cruise OA 665, July 14-17, 1975. e These values are based on the chlorobiphenyl concentrations measured at depths Cruise OA 552, November 5-8, 1973.
greater than 20 m.
net accumulation can be expressed as the product of the concentration of the stresser in the dispersive medium, or any other interacting component, multiplied by a proportionality constant, K . This empirical constant, K , is defined as the component concentration ratio
(1)
where Cr( , ) and C x ( r ) are the concentrations of chemical X in components J and i, respectively. This definition of K has been modified to a more specific expression for these studies. Hence, the lipid-water concentration ratio for chlorobiphenyls can be defined as
K - ‘*b) c x ( 1 1
K Y = - IN-CB]] [ N - CB]
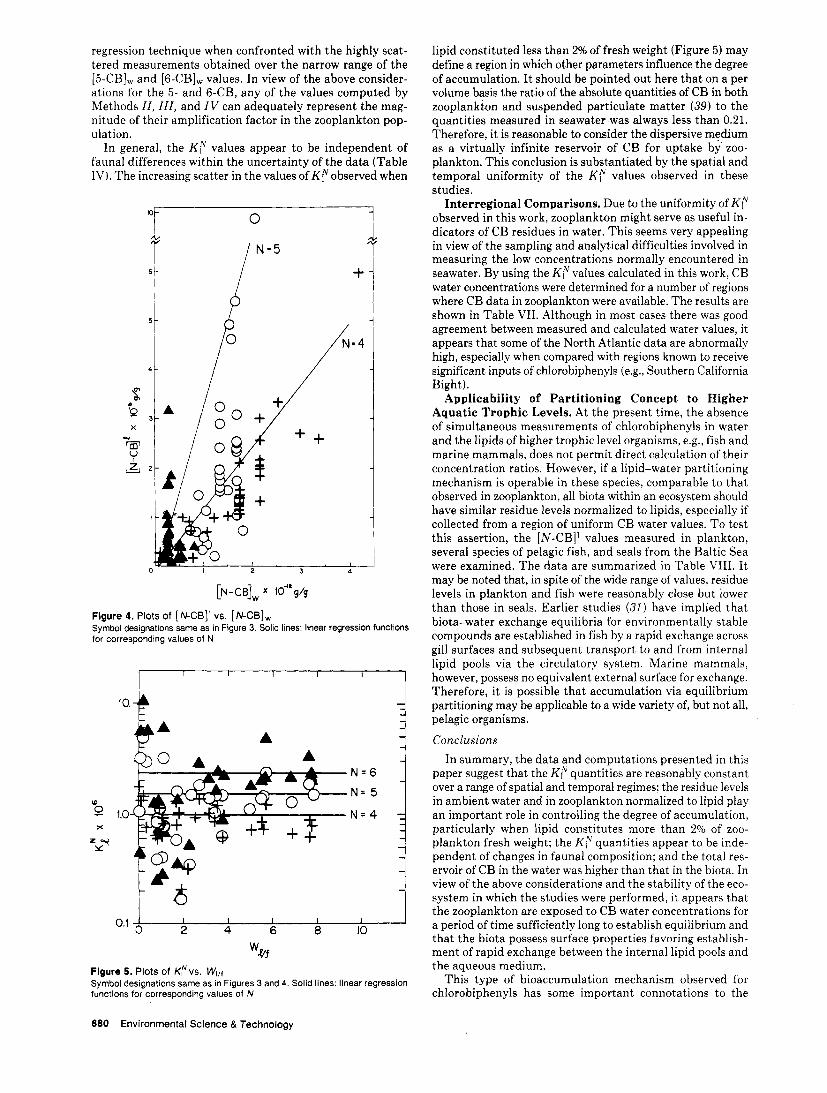
The regional mean values of K y determined from Equation 2 are presented in Table IV, together with the dominant zooplankton encountered. The in situ [N-CB]’ and [N-CB], quantities measured a t each sampling station were used to compute K:. For certain stations where no water was col- lected, the [N-CB], values were back-calculated from the residue concentrations in suspended particulate matter (SPM), obtained a t the appropriate density surfaces, and the corresponding SPM-water concentration ratios (39). Mean K > were then determined for each region as well as for the total Puget Sound. These data are summarized in Table V and uere computed as follows: from the slope of [N-CB]’ vs. [N- CHIi\ plots as shown in Figure 4 ( I ) , from the instantaneous \aluei of [,V-CB]’ and [N-CB], obtained a t each sampling station, and subsequent averaging of the individual K r
quantities ( I I ) , from the intercept of Ki’ vs. Wilt plots as shown in Figure 5 ( I I I ) ; since the slopes of these plots are es- sentially zero, the calculated intercepts are close to the average values determined by Method I I , and from the instantaneous [N-CB]] values and the regional mean water values of [N-CHI, below 20 m depth (IV). The water data used for these calcu- lations are given in Table VI.
By inspection of Table V, a good agreement is shown for K: among all computation methods. For N = 5 and 6 the results from Method IV do not appear to be statistically different from those of I I and I l l . However. the K ; and KY values computed by I are inconsistent in comparison with the other three methods. This reflects the disadvantage in using the
Table V. Summary of Integrated KI Values for Zooplankton in Puget Sounda
K l N X 10’
N I ( n = 31) I/ ( n = 31) 111 ( n = 31) IV ( n = 40)
4 1.19 (fO.11); 0.91 [f0.33] 0.99 (f0.09); 1.22 [f0.99]
5 3.44 (f0.87); 1.45 [f0.98] 1.53 (f0.28); 1.02 [f0.68]
6 . . . 2.26 [f2.16] 2.37 (f0.62); 1.03 [f0.85]
a The values are computed by Methods /-/Vas described in the text; n is the number of data points. Values in parentheses are the standard errors; values in italics are the square of the correlation coefficients (I?); the numbers in brackets are the standard deviations.
0.81 0.05
0.35 0.005
0.002
Volume 1 1 , Number 7, July 1977 679
regression technique when confronted with the highly scat- tered measurements obtained over the narrow range of the [5-CBJW and [6-CB], values. In view of the above consider- ations for the 5- and W B , any of the values computed by Methods I I , 111, and IV can adequately represent the mag- nitude of their amplification factor in the zooplankton pop- ulation.
In general, the K p values appear to be independent of faunal differences within the uncertainty of the data (Table IV). The increasing scatter in the values of K p observed when
0 0
/
4l P /=4
S
4
2
I
0 2 3 4
+ +
3 4
[N-CB], X 1O'*g/g
Figure 4. Plots of [N-CB]' vs. [N-CB], . . Symbol designations same as in Figure 3. Solid lines: linear regression functions for corresponding values of N
I I I
io. 4 ' L
A
1 I I I 1 1 2 4 6 8 IO
w# Flgure 5. Plots of Kyvs . Wilt Symbol designations same as in Figures 3 and 4. Solid lines: linear regression functions for corresponding values of N
lipid constituted less than 2% of fresh weight (Figure 5) may define a region in which other parameters influence the degree of accumulation. I t should be pointed out here that on a per volume basis the ratio of the absolute quantities of CB in both zooplankton and suspended particulate matter (39) to the quantities measured in seawater was always less than 0.21. Therefore, it is reasonable to consider the dispersive medium as a virtually infinite reservoir of CB for uptake b y zoo- plankton. This conclusion is substantiated by the spatial and temporal uniformity of the K p values observed in these studies.
Interregional Comparisons. Due to the uniformity of K r observed in this work, zooplankton might serve as useful in- dicators of CB residues in water. This seems very appealing in view of the sampling and analytical difficulties involved in measuring the low concentrations normally encountered in seawater. By using the K y values calculated in this work, CB water concentrations were determined for a number of regions where CB data in zooplankton were available. The results are shown in Table VII. Although in most cases there was good agreement between measured and calculated water values, it appears that some of the North Atlantic data are abnormally high, especially when compared with regions known to receive significant inputs of chlorobiphenyls (e.g., Southern California Bight).
Applicability of Partitioning Concept to Higher Aquatic Trophic Levels. At the present time, the absence of simultaneous measurements of chlorobiphenyls in water and the lipids of higher trophic level organisms, e.g., fish and marine mammals, does not permit direct calculation of their concentration ratios. However, if a lipid-water partitioning mechanism is operable in these species, comparable to that observed in zooplankton, all biota within an ecosystem should have similar residue levels normalized to lipids, especially if collected from a region of uniform CB water values. To test this assertion, the [N-CB]] values measured in plankton, several species of pelagic fish, and seals from the Baltic Sea were examined. The data are summarized in Table VIII. I t may be noted that, in spite of the wide range of values, residue levels in plankton and fish were reasonably close but lower than those in seals. Earlier studies (31) have implied that biota-water exchange equilibria for environmentally stable compounds are established in fish by a rapid exchange across gill surfaces and subsequent transport to and from internal lipid pools via the circulatory system. Marine mammals, however, possess no equivalent external surface for exchange. Therefore, it is possible that accumulation via equilibrium partitioning may be applicable to a wide variety of, but not all, pelagic organisms.
Conclusions In summary, the data and computations presented in this
paper suggest that the K p quantities are reasonably constant over a range of spatial and temporal regimes; the residue levels in ambient water and in zooplankton normalized to lipid play an important role in controlling the degree of accumulation, particularly when lipid constitutes more than 2% of zoo- plankton fresh weight; the KT quantities appear to be inde- pendent of changes in faunal composition; and the total res- ervoir of CB in the water was higher than that in the biota. In view of the above considerations and the stability of the eco- system in which the studies were performed, it appears that the zooplankton are exposed to CB water concentrations for a period of time sufficiently long to establish equilibrium and that the biota possess surface properties favoring establish- ment of rapid exchange between the internal lipid pools and the aqueous medium.
This type of bioaccumulation mechanism observed for chlorobiphenyls has some important connotations to the
680 Environmental Science & Technology
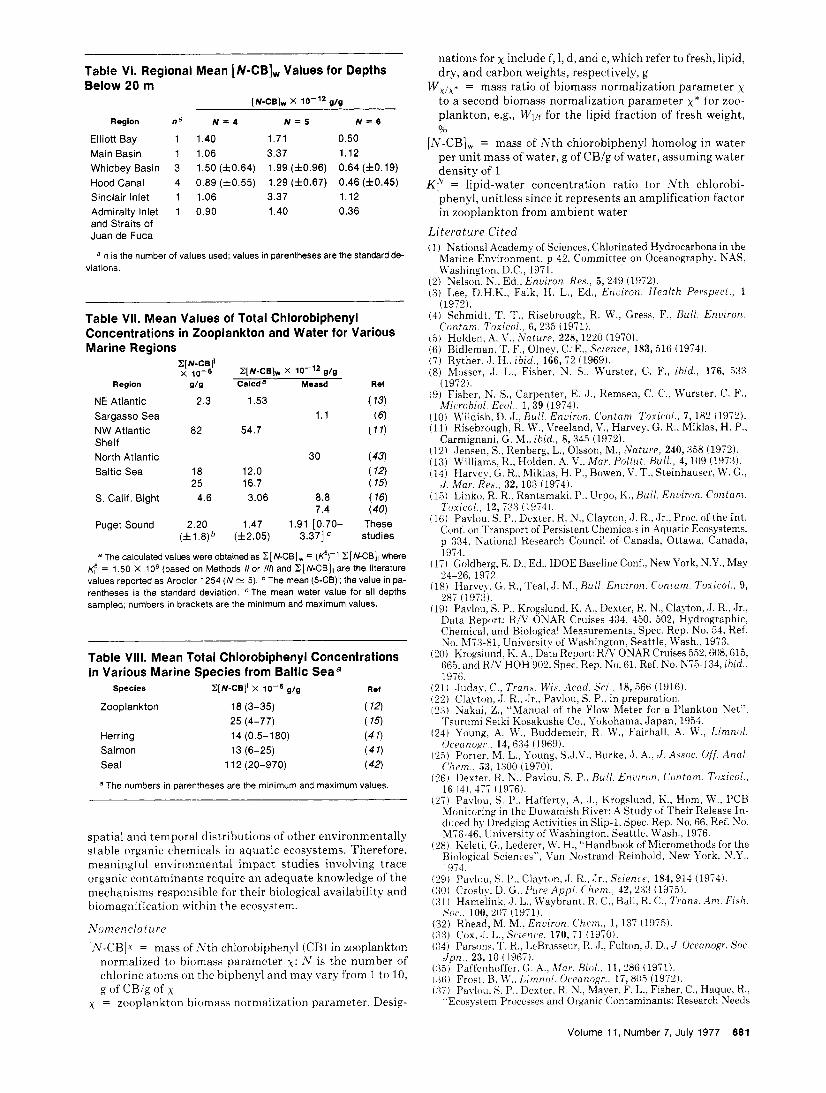
Table VI. Regional Mean [N-CB], Values for Depths Below 20 m
IN-CBl, X a/a
Region na N = 4 N = 5 N = 6
Elliott Bay 1 1.40 1.71 0.50 Main Basin 1 1.06 3.37 1.12 Whidbey Basin 3 1.50 (f0.64) 1.99 (f0.96) 0.64 (f0.19) Hood Canal 4 0.89 (f0.55) 1.29 (60.67) 0.46 (f0.45) Sinclair Inlet 1 1.06 3.37 1.12 Admiralty Inlet 1 0.90 1.40 0.36 and Straits of Juan de Fuca
a n is the number of values used; values in parentheses are the standard de- viations.
Table VII. Mean Values of Total Chlorobiphenyl Concentrations in Zooplankton and Water for Various Marine Regions
Z[ N-CB]‘ x 10-6 Z[N-CB]w X 10-l’ g/g
Region g/g Calcda Measd Ref
NE Atlantic 2.3 1.53 ( 13) Sargasso Sea 1.1 ( 6) NW Atlantic 82 54.7 (11) Shelf
North Atlantic 30 (43) Baltic Sea 18 12.0 ( 7 4
25 16.7 ( 15) S. Calif. Bight 4.6 3.06 8.8 ( 16)
Puget Sound 2.20 1.47 1.91 [0.70- These (f1.8)b (f2.05) 3.371 studies
a The calculatedvalues wereobtainedas Z[N-CB], = (e)-’ Z[N-CB]I where = 1.50 X lo6 (based on Methods / I or !I/) and Z[N-CB], are the literature
The mean (5-CB)’; the value in pa- The mean water value for all depths
7.4 (40)
values reported as Aroclor 1254 (N N 5). rentheses is the standard deviation. sampled; numbers in brackets are the minimum and maximum values.
Table VIII. Mean Total Chlorobiphenyl Concentrations in Various Marine Species from Baltic Seaa
Species Z[ N-CB]’ X g/g Ref
Zooplankton 18 (3-35) ( 12) 25 (4-77) ( 15)
Herring 14 (0.5-180) ( 4 7) Salmon 13 (6-25) ( 4 7) Seal 112 (20-970) ( 42)
a The numbers in parentheses are the minimum and maximum values.
spatial and temporal distributions of other environmentally stable organic chemicals in aquatic ecosystems. Therefore, meaningful environmental impact studies involving trace organic contaminants require an adequate knowledge of the mechanisms responsible for their biological availability and biomagnification within the ecosystem.
LVom en el a tu re
[,Y-CB]k = mass of chlorobiphenyl (CB) in zooplankton normalized t o biomass parameter x: iV is the number of chlorine atoms on the biphenyl and may vary from 1 to 10,
x = zooplankton biomass normalization parameter. Desig- g of CR/# of x
nations for x include f, 1, d , and c, which refer to fresh, lipid, dry, and carbon weights, respectively, g
WXlx* = mass ratio of biomass normalization parameter x to a second biomass normalization parameter x* for zoo- plankton, e.g., Wilt. for the lipid fraction of fresh weight, %
[N-CB], = mass of N t h chlorobiphenyl homolog in water per unit mass of water, g of CB/g of wat,er, assuming water density of 1
K y = lipid-water concentration ratio for N t h chlorobi- phenyl, unitless since i t represents an amplification factor in zooplankton from ambient water
Li t e ra ture Cited (1) National Academy of Sciences, Chlorinated Hydrocarbons in the
Marine Environment. p 42, Committee on Oceanography, NAS, Washington, D.C., 1971.
( 2 ) Nelson, ?J.$ Ed.. Enuiron. Res., 5 , 249 (1972). (3) Lee, D.H.K., Falk, H . L., Ed., Enciron. Health Perspect., 1
14) Schmidt. T. T.. Risebrough, R. W., Gress, F., Bull. Environ. (1972).
Contam. Toxicol., 6, 235 (1971). (6 ) Holden, A. V.. “Vature, 228,1220 (1970). (6) Bidleman. T. F., Olney, C;E., Science, 183,516 (1974). ( 7 ) Ryther. J . H., ibid., 166, 72 (1969). (8) Mosser. J . L., Fisher, N. S., Wurster, C. F., ibid., 176, 533
(1977i ~ - - ._ , . (9) Fisher. N. S., Carpenter, E. J . , Remsen, C. C., Wurster, C. F.,
(10) FVildish, D. J . , Bull. Enciron. Contam. Toxicoi., 7, 182 (1972). (11) Risebroueh. R. W.. Vreeland, V., Harvey, G. R., Miklas, H. P.,
Micrcibiol. Ecol., 1, 39 (1974).
CarmignaniYG. M., bid., 8, 345 (1972). (12) .Jensen. S., Renberg, L.. Olsson, M., Nature, 240,358 (1972). (13) Williams, R., Holden. A. V., Mar. Pollut. Bull., 4, 109 (1973). (141 Harvey, G. R.. Miklas, H. P., Bowen, V. T., Steinhauser, LV. G.,
J . Mar. Res., 32, 103 (1974). (1.5) Linko. R. R., Rantamaki. P., Urpo, K., Bull. En~liron. Contam.
Toxicol.. 12, 733 (1974). (16) Pavlou. S. P.. Dexter, R. N., Clayton, J. R., ,Jr., Proc. of the Int.
Conf. on Transport of Persistent Chemicals in Aquatic Ecosystems. p 334. National Research Council of Canada, Ottawa, Canada, 1974.
(17) Goldberg, E. D., Ed., IDOE Baseline Conf., New York, N.Y.. May “-26.1972.
(18) Harvey. G. R., Teal, d. M.. Buli. Enuiron. Contam. Toxicoi., 9, 287 11973).
(19) Pavlou. S. P., Krogslund. K. A,, Dexter, R. N., Clayton, J. R., .Jr., Data Report: R/V ONAR Cruises 434, 450, 502, Hydrographic, Chemical, and Biological Measurements, Spec. Rep. No. 54, Ref. No. M73-81, University of h’ashington, Seattle, Wash., 1973.
120) Krogslund, K. A,. Data Report: RA; ONAR Cruises 552,608,615, 665. and R/V HOH 902, Spec. Rep. No. 61, Ref. No. N75-134, ibid. , 1976.
( 2 1 ) .Juday. C., Trans. Wis. Acad . Sci., 18,566 (1916). 122) Clayton, .J. R., ,Jr,. Pavlou, S. P.. in preparation. ( 2 3 ) Nakai, Z.. “Manual of the Flow Meter for a Plankton Net”,
Tsurumi Seiki Kosakushe Co., Yokohama, Japan , 1954. (24) Young. A. LV,, Buddemeir, R. W., Fairhall, .4. \V., Limnol.
Oceanogr., 14, 634 (1969). (X) Porter, M. L., Young. S..J.V.. Burke, J . A,. J . Assoc. Off. Anal.
C‘hern., 53, 1300 (1970). (26) Dexter, R. N,, Pavlou, S. P., Bull. Enciron. Contam. Toxicol.,
16 (41,477 (1976). ( 2 7 ) Pavlou, S. P., Hafferty. A. -J., Krogslund, K., Hom, W.. P C B
Monitoring in the Duwamish River: A Study of Their Release In- duced by Dredging Activities in Slip-1. Spec. Rep. No. 66, Ref. No. M76-46. University of Washington, Seattle, LVash., 1976.
(28) Keleti, G.. Lederer. W. H., “Handbook of Micromethods for the Biological Sciences”, \’an Nostrand-Reinhold, New York. 9 . Y . . 197.1.
(299) Pavlou. S. P.. Clayton. ,J. R.. Jr., Science. 184,914 (1974). (301 Crosbv. D. G.. Pure i l a ~ l . C‘hem.. 42, 233 (197,s). i:il) Hameiink, J . Id., LVayhrant, R. C.. Ball, R. C. , Trans. Am. Fish.
( 3 2 ) Rhead. M. M.. Enciron. Chern., I , 137 (1975). SO(.,, 100, 207 (1971).
iiii COX. .J.’L.. s c i P n c P , i i o , 71 (1970). (34) Parsons. T. R.. LeBrasseur, R. ,J., Fulton, J. D., J . Oceanogr. Soc.
J p n . . 23, 10 (1967). (35) Paff’enhi)ffer. G . A , . Mar . Bioi., 11, 286 (1971). (36) Frost. R. LV,, Lirnnol. Oceanogr., 17, 805 (1972). i?7) Pavlou. S. P.. Dexter. R. N., Mayer, F. L., Fisher, C.. Haque, R.,
“Ecosystem Processes and Organic Contaminants: Research Needs
Volume 1 1 , Number 7, July 1977 681
and an Interdisciplinary Prospective”, Stock No. 038-000-00304-6, pp 21-26, National Science Foundation, Washington, D.C., 1977.
(38) Dexter, R. N.,Pavlou, S. P., Proc., 5 th Tech. Conf,on Estuaries of the Pacific Northwest, Circ. No. 51, Oregon State University, Corvallis, Ore., April 1-2, 1976.
(39) Dexter. R. N.. PhD dissertation. Universitv of Washington.
(42) Olsson, M., Johnels, A. G., Vaz, R., National Swedish Protection
(43) Harvey, G. R., Steinhauer, W. G., Teal, J. M., Science, 180,643 Board, SNV P M 591,1975.
(1973).
- ,
Seattle, ash., 1976.
71 (1972). Grant No. R-800362.
(40) Scura, E. D., McClure, V. E.,Mar. Chem., 3,337 (1975). (41) Jensen, S., Johnels, A. G., Olsson, M., Otterlind, G., Ambio, 1,
Received for revieu August 27, 1976. Accepted February 16, 1977. Work supported by the U.S. Environmental Protection Agency,
Monitoring of Polynuclear Aromatic Hydrocarbons in Water 1. Extraction and Recovery of Benzo(a)pyrene with Porous Polyurethane Foam
Jitendra Saxena”, Jack Kozuchowski, and Dipak K. Basu Center for Chemical Hazard Assessment, Syracuse Research Corp., Syracuse, N.Y. 132 10
The concentration of trace quantities of benzo(a)pyrene from water with flexible polyurethane foam plug was studied. The recovery from water was independent of flow rates over a wide range but increased to a great extent with increase in temperature of water. Other factors which influenced ben- zo(a)pyrene retention were: water pH, diameter of the column used for holding plugs, and coating of the foam plugs with chromatographic phases. The foam-sorbed benzo(a)pyrene was stable, and its recovery quantitative after storage of the plug for seven days a t 4 “C. Some loss of benzo(a)pyrene oc- curred when foam plugs were stored a t room temperature.
Among the many chemical oncogenic agents, polycyclic aromatic hydrocarbons (PAH) play an unique role because of their demonstrated carcinogenic activity (1,2) and because of their wide distribution and long persistence in the envi- ronment (3) . To control the possible intake of PAH com- pounds by man through drinking water, it is necessary to as- certain their levels. The concentration of PAH compounds in drinking water, however, is so low ( 4 ) that concentration of large volumes is required to meet the detection limit of the analytical method.
The effort required for extracting large volumes of samples renders the solvent extraction method unattractive and sometimes unfeasible. An instrument employing on-site continuous liquid-liquid extraction ( 5 ) has doubtful practical value for routine analysis of PAH because of slow flow rates (-20-35 mL/min) necessary to establish an equilibrium dis- tribution between the aqueous and organic phases. Further- more, many good PAH solvents (e.g., benzene) cannot be used in the system because of their relatively high water solubility. The limitation of the two most promising sorbents-XAD- resins (6, 7) and Tenax (8)-is their incapability of allowing water flow rates greater than 50 mL/min. Passage of large volumes of water a t such flow rates is very time consuming.
The discovery of the ability of polyurethane foams to retain a number of compounds including PCB’s and organochlorine pesticides from water (9-11) produced a surge of interest in using this technique to concentrate other compounds as well. Gough and Gesser (12) used polyurethane foams for the re- covery of phtalate esters from water. These authors and others (11, 13) used foam plugs coated with gas chromatographic liquid phases with varying degrees of success. Bedford ( 1 4 ) , however, reported that polyurethane foam cannot be used reliably to extract‘ PCB’s from turbid natural waters. The studies conducted by EPA (15) with paper mill wastewater components, fuel oil, and textile dyes showed that both coated
and uncoated foams are very limited in their extraction abil- ity.
In this paper, the removal of trace quantities of benzo(a)- pyrene (BaP), a major representative of carcinogenic PAH, from water with a flexible polyurethane foam plug is reported. The optimum conditions for PAH retention by foam plugs have been determined. The method can be extended to other PAH’s, and such studies will be reported separately.
Experimenta 1 Materials and Reagents. The studies were carried out
using radiolabeled benzo(a)-pyrene (7-1O-l4C) because of the ease and greater sensitivity of 14C-detection. This also elimi- nated the necessity for determination of background levels of BaP in water. Radiolabeled BaP in methanol solution was obtained from California Bionuclear Corp. The BaP was of 98% purity and used without further purification.
Polyurethane foam plugs used were diSPo plugs (Scientific Products, Inc.), Identi plugs (VWR Scientific), and plugs cut from UU34 foam sheets (Thomas E. Forrest Co., Inc.).
Tap water used in these studies was obtained from labo- ratory tap and was derived from Skaneateles Lake. The only treatments the water received prior to distribution were chlorination and fluoridation (16). Raw water was collected from Onondaga Lake (Syracuse, N.Y.) in the month of De- cember. Large floating and suspended particles were removed by filtration through a fine wire screen prior to use.
Chromaflex columns used for holding the foam plugs were purchased from Kontes Glass Co. The oscillating-type pump, Gilmont flow meter, and Haake Model FE thermostated cir- culator were purchased from Scientific Products, Inc.
All the solvents used were AR grade and purchased from Mallinckrodt Chemical Co.The nematic liquid crystal[N,N’- bis(p-methoxybenzy1idene)-cup’-bi-p-toluidine] was obtained from Eastman Kodak Co., and gas chromatographic phases DC-200 and SE-30 were from Analabs, Inc. Insta-gel and the chemicals for preparing scintillation fluid were purchased from Packard Instrument Co.
Procedure. For sorption studies under static conditions, a preweighed foam plug was left in contact for 4 h with 14C- BaP solution which had been preequilibrated with the glass container. The difference in the 1%-activity in initial and final water sample gave the amount of 14C-BaP sorbed by the foam plug. This was carried out using each foam over a range of BaP concentrations.
In the flow system experiments, one foam plug was wetted with distilled water and placed in a 25-mm Chromaflex col- umn. It was washed successively with acetone, benzene, ace- tone, and distilled water. Preequilibrated tap water containing
682 Environmental Science & Technology