Embed Size (px)
Citation preview
Polymers in nanotechnology : molecular recognition andsurface modificationCitation for published version (APA):Papen - Botterhuis, N. E. (2008). Polymers in nanotechnology : molecular recognition and surface modification.Eindhoven: Technische Universiteit Eindhoven. https://doi.org/10.6100/IR636780
DOI:10.6100/IR636780
Document status and date:Published: 01/01/2008
Document Version:Publisher’s PDF, also known as Version of Record (includes final page, issue and volume numbers)
Please check the document version of this publication:
• A submitted manuscript is the version of the article upon submission and before peer-review. There can beimportant differences between the submitted version and the official published version of record. Peopleinterested in the research are advised to contact the author for the final version of the publication, or visit theDOI to the publisher's website.• The final author version and the galley proof are versions of the publication after peer review.• The final published version features the final layout of the paper including the volume, issue and pagenumbers.Link to publication
General rightsCopyright and moral rights for the publications made accessible in the public portal are retained by the authors and/or other copyright ownersand it is a condition of accessing publications that users recognise and abide by the legal requirements associated with these rights.
• Users may download and print one copy of any publication from the public portal for the purpose of private study or research. • You may not further distribute the material or use it for any profit-making activity or commercial gain • You may freely distribute the URL identifying the publication in the public portal.
If the publication is distributed under the terms of Article 25fa of the Dutch Copyright Act, indicated by the “Taverne” license above, pleasefollow below link for the End User Agreement:www.tue.nl/taverne
Take down policyIf you believe that this document breaches copyright please contact us at:[email protected] details and we will investigate your claim.
Download date: 30. May. 2020

Polymers in Nanotechnology Molecular Recognition and Surface Modification

Polymers in Nanotechnology Molecular Recognition and Surface Modification
PROEFSCHRIFT
ter verkrijging van de graad van doctor aan de Technische Universiteit Eindhoven, op gezag van de
Rector Magnificus, prof.dr.ir. C.J. van Duijn, voor een commissie aangewezen door het College voor
Promoties in het openbaar te verdedigen op donderdag 11 september 2008 om 14.00 uur
door
Nicole Ellen Papen-Botterhuis
geboren te Haaksbergen
Dit proefschrift is goedgekeurd door de promotoren: prof.dr. R.P. Sijbesma en prof.dr. E.W. Meijer
This research has been financially supported by NanoNed, the nanotechnology program of the Dutch Ministry of Economic Affairs. Cover design: Nicole Papen-Botterhuis, Kelly Stelwagen-van den Hout en Gildeprint
Drukkerijen B.V., Enschede Printed by: Gildeprint Drukkerijen B.V., Enschede A catalogue record is available from the Eindhoven University of Technology Library. ISBN: 978-90-386-1348-2

Manuscript committee: Prof. dr. R.P. Sijbesma (Eindhoven University of Technology) Prof. dr. E.W. Meijer (Eindhoven University of Technology) Prof. dr. S. Thayumanavan (University of Massachusetts, Amherst) Prof. dr. B.J. Ravoo (Westfälische Wilhelms Universität, Münster) Prof. dr. D.J. Broer (Eindhoven University of Technology)
Voor iedereen die ik lief heb en had

Table of Contents Chapter 1: Introduction: Polymers in Nanotechnology 1
1.1 Polymers in Nanotechnology 2 1.2 Polymers in Top-Down Nanotechnology 4 1.3 Polymers in Bottom-Up Nanotechnology 6 1.4 Challenges for Polymers in Nanotechnology 9 1.5 Aim and Outline of this Thesis 10 1.6 References 12 Chapter 2: Nanofibrous Morphology of pTHF-bisurea Thermoplastic Elastomers 17
2.1 Introduction 18 2.2 Results 21
Synthesis 21 Preparation of Single Fiber Samples for Transmission Electron Microscopy 22 Single Fiber Analysis with Atomic Force Microscopy 23 Phase Morphology in pTHF-bisurea Films as Studied with X-ray Techniques 28
2.3 Discussion and Conclusions 32 2.4 Materials and Methods 33 2.5 References 35 Chapter 3: Molecular Recognition in Bisurea Thermoplastic Elastomers Studied with Pyrene-Based Fluorescent Probes and Atomic Force Microscopy 39
3.1 Introduction 40 3.2 Results and Discussion 41
Synthesis 41 AFM Measurements 42 Fluorescence and UV Measurements 43 AFM and Fluorescence Studies on Polymer Films with a monoPyrene Bisurea Guest 46 Time-Gated Fluorescence Measurements 47
3.3 Conclusions 48 3.4 Materials and Methods 48 3.5 References 50
Chapter 4: Self-Sorting of Guests and Hard Blocks in Bisurea-Based Thermoplastic Elastomers 53
4.1 Introduction 54 4.2 Results 56
Synthesis 56 Self-Sorting Monitored via Exciplex Formation between Pyrene and Dimethylaniline 58
Self-Sorting of DMA and Pyrene Guests in Mixtures of Two Polymers 58 Self-Sorting of DMA and Pyrene Guests in Mixtures of Three Polymers 62
Fluorescence Resonance Energy Transfer (FRET) 64 FRET Measurements 65 Using FRET to Analyze Stacking of Ribbons into Fibers 67
Enhancement of TPE Properties by Self-sorting 68 4.3 Discussion and Conclusions 71 4.4 Materials and Methods 72 4.5 References 78 Chapter 5: Microcontact Printing with Hydrophilic Bisurea Thermoplastic Elastomers 83
5.1 Introduction 84 5.2 Results 86
Preparation of pTHF-bisurea Stamps 86 Hydrophilicity of pTHF-bisurea Polymers 90 Microcontact Printing of Thiols on Gold Substrates with pTHF-bisurea Stamps 91 Catalytic Microcontact Printing with pTHF-bisurea Stamps 93
Synthesis of Bisurea Guest Molecules with Carboxylic End Groups 94 Catalytic Microcontact Printing on Imine-Functionalized Gold Substrates 94
5.3 Discussion and Conclusions 99 5.4 Materials and Methods 101 5.5 References 104 Chapter 6: Surface Modification and Patterning of PEN Films with Dendrimers 107
6.1 Introduction 108 6.2 Results 110
Surface Modification of PEN Films with Dendrimers 110
Patterning of PEN Films with Dendrimers 115
Patterning with Soft Elastomeric Stamps 115 Patterning with Rigid Silicon Stamps 116
Metallization of PEN Films via Electroless Deposition (ELD) 119 Electroless Deposition of Metals on Dendrimer-Modified PEN Films 119 Metallization of Dendrimer Patterns 122
6.3 Discussion and Conclusions 123 6.4 Materials and Methods 125 6.5 References 127 Chapter 7: Self-assembly and Morphology of Polydimethylsiloxane Supramolecular Thermoplastic Elastomers 131
7.1 Introduction 132 7.2 Results 134
Thermal Properties 134 Surface Morphology 136 AFM on Single Fibers 138 Oscillatory Shear Experiments 139
7.3 Discussion and Conclusions 140 7.4 Materials and Methods 141 7.5 References 143 Colour Figures 147 Summary 153 Samenvatting voor niet-chemici 155 Curriculum Vitae 157 List of Publications 158 Dankwoord 159
1
11
Introduction: Polymers in Nanotechnology
Abstract Nanotechnology is a highly interdisciplinary field, in which researchers strive to control matter on the nanoscale. This can be achieved by scaling down lithographic techniques, thereby miniaturizing patterns and creating nanostructures. This approach is called top-down nanotechnology, as opposed to bottom-up nanotechnology, in which small molecules or particles are assembled into larger 2D or 3D structures. Polymers are perfectly fit to bridge the gap between top-down and bottom-up nanotechnology due to their size in between the atomic and macroscopic scale. Furthermore, polymers are versatile materials for nanotechnology due to their processability, low cost and tunable properties. In this chapter, the role of polymers in bottom-up and top-down nanotechnology is illustrated with several examples and challenges for the use of polymers in nanotechnology are outlined.
Chapter 1
2
1.1 Polymers in Nanotechnology
Nanotechnology is currently one of the fastest growing areas in science. A general definition of nanotechnology is ‘The field that deals with the precise control of matter on the nanoscale’, with at least one of the dimensions smaller than 100 nm.1 Although the field of nanotechnology has only recently gained a lot of attention, some of the concepts of nanotechnology were already mentioned in 1867 by James Clerk Maxwell, who introduced in a thought experiment a small creature that was able to handle individual molecules. The term nanometer was introduced in the beginning of the 20th century by Richard Adolf Zsigmondy, after his discovery and visualization of nanoparticles by using a dark field ultramicroscope. More concepts of nanotechnology were introduced in 1959 by the physicist Richard Feynman in his famous speech ‘There’s plenty of Room at the Bottom’,2,3 in which he challenged researchers to miniaturize devices and written text down to the nanoscale. In fact, many of the concepts and techniques he envisioned at that time are indeed being used today in nanotechnology. The necessity for miniaturization down to the nanoscale was demonstrated by Gordon Moore in 1965. He observed that the number of transistors per chip had doubled every 18-24 months and he predicted that this trend would continue, requiring manufacturing technologies for sizes smaller than 100 nm around the year 2000. His prediction indeed still holds, with current manufacturing technologies at a length scale of 45 nm, and is known as Moore’s law. The actual term nanotechnology was introduced for the first time by Norio Taniguchi in 1974.4 He defined nanotechnology as ‘the production technology needed to get the extra-high accuracy and ultra-fine dimensions needed in such items as integrated circuits, opto-electronic devices, mechanical parts for pumps, bearings and computer memory devices and aspheric lenses, in all of which accuracies of the order of 1 nm are becoming necessary. This accuracy can be reached by processing of, separation, consolidation and deformation of materials by one atom or by one molecule.’ From this moment on, interest in nanotechnology grew, although there was no universal awareness of its full potential yet. This changed in 1986 with the publication of a book about nanotechnology by K. Eric Drexler, in which the concepts of nanotechnology were described and a view of the future was given in which molecular machines were operating on the nanoscale to manufacture nanodevices or nanostructures.
Although the development of such molecular machines is still far beyond the current possibilities of nanotechnology, other developments in nanotechnology have been incredibly fast in recent years; so fast, that it is easy to forget that processes based on nanotechnology and materials containing nanostructures have already been used in materials science for more than a thousand years without knowing their exact length scale. Therefore an important breakthrough for nanotechnology was the development of imaging techniques with a resolution in the nanometer range, such as electron microscopes (1931)5 and scanning probe
Introduction: Polymers in Nanotechnology
3
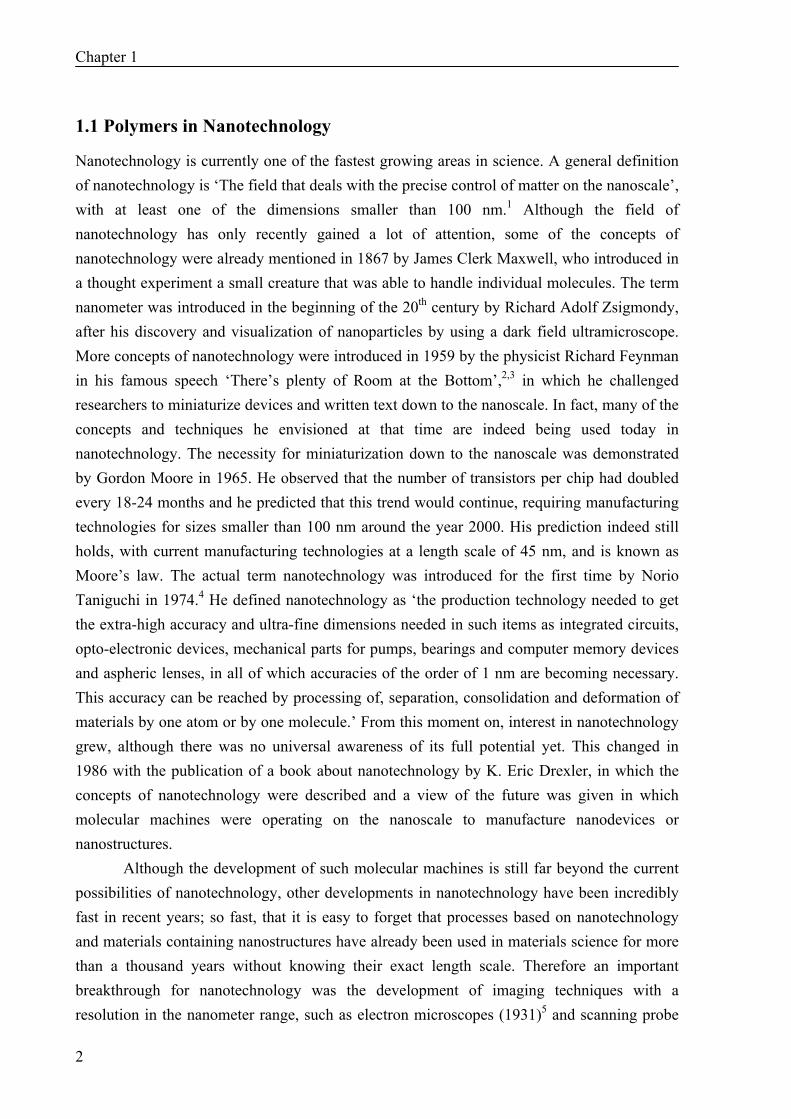
microscopes (1982).6,7 These imaging tools have enabled researchers to measure the sizes of fabricated structures, thereby classifying them as nanostructures, and to visualize and understand processes and phenomena at the nanoscale. Another important reason for the fast expansion of the field of nanotechnology is the joining in of other sciences. Whereas nanotechnology was originally seen as the field that was trying to miniaturize microtechnology, later on also researchers working on assembling molecules and colloids realized the importance of their work for nanotechnology. As a result, the goals of nanotechnology are presently being pursued using two approaches: top-down nanotechnology and bottom-up nanotechnology (Figure 1.1). Technologies that are used in top-down nanotechnology are mostly lithographic techniques such as (extreme) UV lithography, nanoimprint lithography, e-beam lithography, soft lithography and scanning probe lithography. The largest challenges for these techniques lie in enhancing the resolution and making these technologies cheaper and faster. In bottom-up nanotechnology, (self-) assembly of molecules or colloids is used to create nanostructures or nanopatterns. The most important concern in bottom-up nanotechnology is the control over the spatial position of the molecules or nanoparticles. For the fabrication of devices, a combination with top-down techniques is required to provide an interface with the technical environment.
In both approaches, polymers play an important role, because they combine a number of favourable features, including flexibility, processability, low cost, size in the nanometer range, diverse functionalities and microphase separation. The role of polymers in top-down and bottom-up nanotechnology will be further elaborated in sections 1.2 and 1.3, respectively.
Figure 1.1: Overview of relevant sizes in nanotechnology. Reproduced with modifications from Geissler et al.8 Commercial applications of nanotechnology are currently still limited, although processors with transistors smaller than 100 nm have already been produced since 5 years. The top
Chapter 1
4
nanotechnology products already commercialized comprise the use of nanoparticles in cosmetics, protective coatings or disinfectants and the fabrication of computer chips. However, a large increase in commercialized nanotechnology products is foreseen in the next five years.9
Many people are worried about the health and environmental effect of products from nanotechnology. The main causes for concern are the enhanced surface to volume ratio of nanoparticles, which leads to a higher reactivity, and the problem that these nanoparticles can be inhaled as dust. Indeed, Poland et al. showed that inhalation of carbon nanotubes has a toxic effect similar to the inhalation of asbestos.10 However, it should be realized that inhalation of asbestos particles by victims mainly occurred because people were not aware of the risks at that time. The current awareness of the potential hazards of nanoparticles is already an important step forward in preventing exposure. Nevertheless, establishing the risks of any new nanotechnology product is a challenging task for researchers in the nanotechnology field.
1.2 Polymers in Top-Down Nanotechnology
Many lithographic techniques that are presently in use in the top-down approach to fabricate nanostructures have originally been developed for precision engineering or microtechnology. UV lithography and imprint lithography are examples of existing techniques where technological advancements have lead to higher resolutions from micrometer up to nanometer sizes. In UV lithography, polymers are used as resists. Exposure of the polymer resist to UV radiation trough a mask induces reactions in the polymer that make it either more soluble (positive resist) or less soluble (negative resist). After development, a pattern of resist remains that can be used as a mask for etching of the substrate, or for the fabrication of metal patterns via a lift-off procedure. The minimum feature sizes obtained using UV lithography have decreased rapidly over the years (Figure 1.2). However, the maximum resolution that can be obtained with UV lithography is limited by the wavelength of extreme UV light (14.5 nm). Furthermore, photolithography is an expensive technique since the substrate size is limited by the size of the exposure tools. While for high-end applications (such as computer chips or liquid crystalline displays) this is satisfactory, for low-end applications lower cost roll-to-roll manufacturing techniques are preferred. Therefore, other methods have been investigated to obtain a patterned layer of polymer resist on a surface.
In nanoimprint lithography (NIL), a pattern is imprinted in a polymer resist layer. This imprinting can either be done above the Tg of the polymer (thermal NIL)11 or at room temperature in a liquid prepolymer that is subsequently cured via UV radiation (mold-assisted or UV-NIL).12,13 Choosing the proper materials for the molds and the polymer resist is of great importance for the success rate of NIL, due to thermal expansion, adhesion and material
Introduction: Polymers in Nanotechnology
5
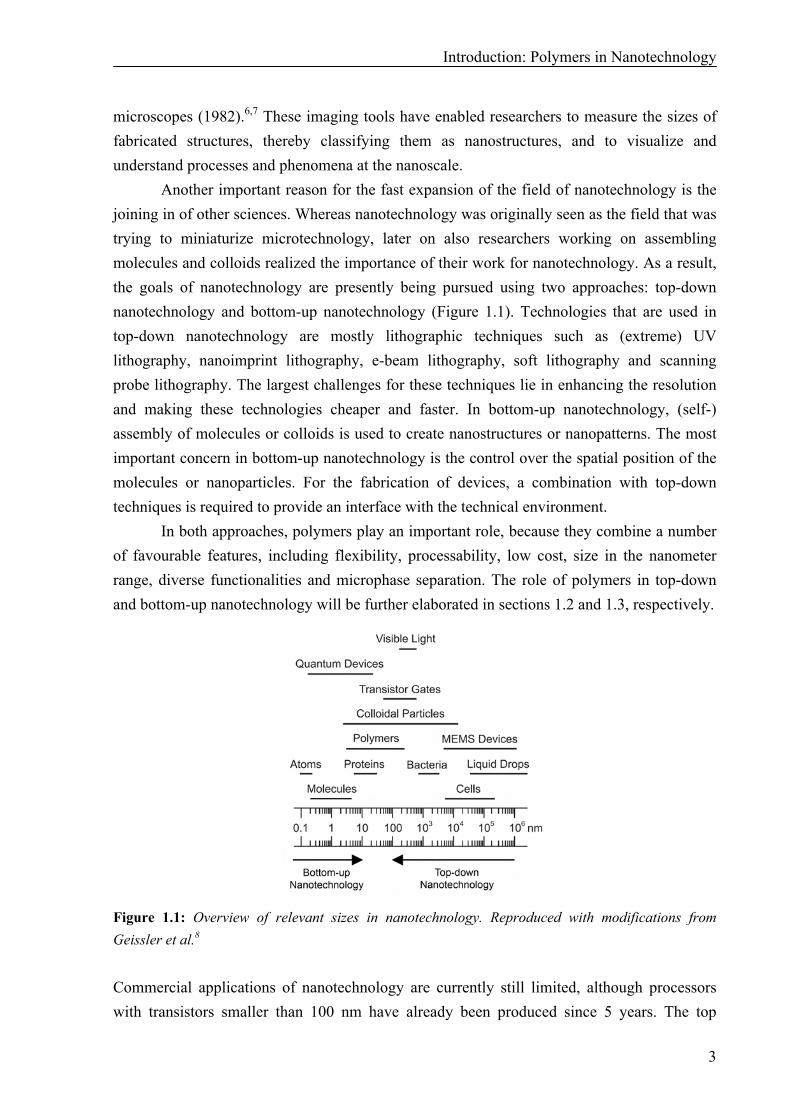
transport.14 Nanoimprint lithographic tools are commercially available that can imprint structures as small as 20 nm, but in literature already imprinting of structures of 6 nm has been reported.15
Figure 1.2: Trends in UV lithography: comparison of trends in the feature sizes of integrated circuits (IC’s) that have been produced by the company LSI and in the wavelength of the exposure light. NA is the numerical aperture of the optical system and RET is a resolution-enhancement technique, which both need to be optimized to fulfil the miniaturization trend of IC’s. Reproduced from Ito et al.16
A new technique that was developed for top-down nanotechnology is scanning probe lithography (SPL), in which an AFM tip is used to pattern surfaces,17,18 for instance by indentation of polymer films for high-density data storage.19 The advantage of this technique is that high resolutions can be obtained.20,21 However, the serial nature of this technique leads to low troughput and high costs. Higher troughputs can be achieved in SPL by the development of arrays of thousands of tips, which has been successfully demonstrated for imprinting polymer with the development of the ‘millipede’.22
Above-mentioned techniques have utilized polymers either as a resist layer or as a substrate. However, Whitesides et al. investigated the use of elastomeric stamps as the structuring device for patterning of substrates. This has led to the development of many new techniques for top-down nanotechnology collected under the name Soft Lithography.23 The first soft lithographic technique that was developed was microcontact printing (μCP).24 Kumar et al. showed that a patterned elastomeric stamp could be used to print patterns of self-assembled monolayer (SAM) on a metal surface. The patterned SAM was subsequently applied as a mask to selectively etch the metal. Soon after the development of μCP, many
Chapter 1
6
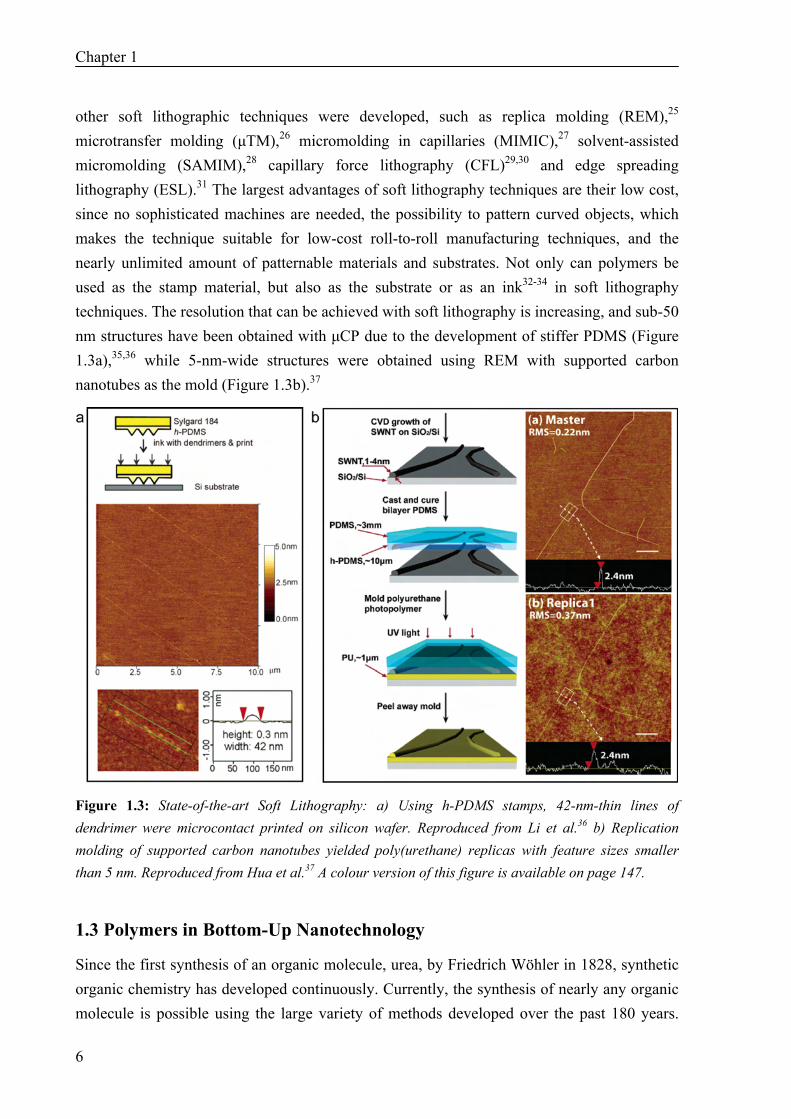
other soft lithographic techniques were developed, such as replica molding (REM),25 microtransfer molding (μTM),26 micromolding in capillaries (MIMIC),27 solvent-assisted micromolding (SAMIM),28 capillary force lithography (CFL)29,30 and edge spreading lithography (ESL).31 The largest advantages of soft lithography techniques are their low cost, since no sophisticated machines are needed, the possibility to pattern curved objects, which makes the technique suitable for low-cost roll-to-roll manufacturing techniques, and the nearly unlimited amount of patternable materials and substrates. Not only can polymers be used as the stamp material, but also as the substrate or as an ink32-34 in soft lithography techniques. The resolution that can be achieved with soft lithography is increasing, and sub-50 nm structures have been obtained with μCP due to the development of stiffer PDMS (Figure 1.3a),35,36 while 5-nm-wide structures were obtained using REM with supported carbon nanotubes as the mold (Figure 1.3b).37
Figure 1.3: State-of-the-art Soft Lithography: a) Using h-PDMS stamps, 42-nm-thin lines of dendrimer were microcontact printed on silicon wafer. Reproduced from Li et al.36 b) Replication molding of supported carbon nanotubes yielded poly(urethane) replicas with feature sizes smaller than 5 nm. Reproduced from Hua et al.37 A colour version of this figure is available on page 147.
1.3 Polymers in Bottom-Up Nanotechnology
Since the first synthesis of an organic molecule, urea, by Friedrich Wöhler in 1828, synthetic organic chemistry has developed continuously. Currently, the synthesis of nearly any organic molecule is possible using the large variety of methods developed over the past 180 years.
Introduction: Polymers in Nanotechnology
7
The next step towards more complex structures is the assembly of molecules, alternatively combined with inorganic particles, into well-defined supramolecular aggregates. Control of this assembly process is the main objective in bottom-up nanotechnology. Supramolecular polymers and block copolymers are promising candidates for bottom-up nanotechnology, since their morphology can be tuned by changes in molecular design or assembly conditions. Examples of applications of polymers in a few subfields of bottom-up nanotechnology will be briefly discussed in the following paragraphs.
In the field of nanoelectronics, the self-assembly of π-conjugated molecules via hydrogen bonding is used to form fiber-like supramolecular polymer stacks, which can potentially be used as conductive wires in organic opto-electronic devices.38-41 Unfortunately, the current flow through these molecular wires is not yet reliable. The reliability of the molecular junction was successfully improved by growing a self-assembled monolayer of thiols between the top and bottom electrode, using a conductive polymer layer between the SAM and the top electrode to prevent electrical shorts.42
Nanomedicine is the medical application of nanotechnology. Examples of applications that are currently under investigation include the development of drug delivery systems43 and targeting nanoparticles for imaging, and fabrication of implants or scaffolds for tissue engineering. Polymers are good candidates for application in all these areas, since there are many biocompatible and biodegradable polymers available, and the mechanical, chemical and surface properties of polymers can easily be modified, as well as their size. Functionalization of polymer scaffolds with peptide sequences that promote cell adhesion can for instance be done via supramolecular interactions.44,45 An advantage of using supramolecular interactions for modification of polymers is that a modular approach can be used and polymers with different functionalities can be obtained simply via mixing. The strength of the interaction of the functional group with the polymer can be tuned, thereby achieving controlled release of the functional group (i.e. drugs or peptide sequences).
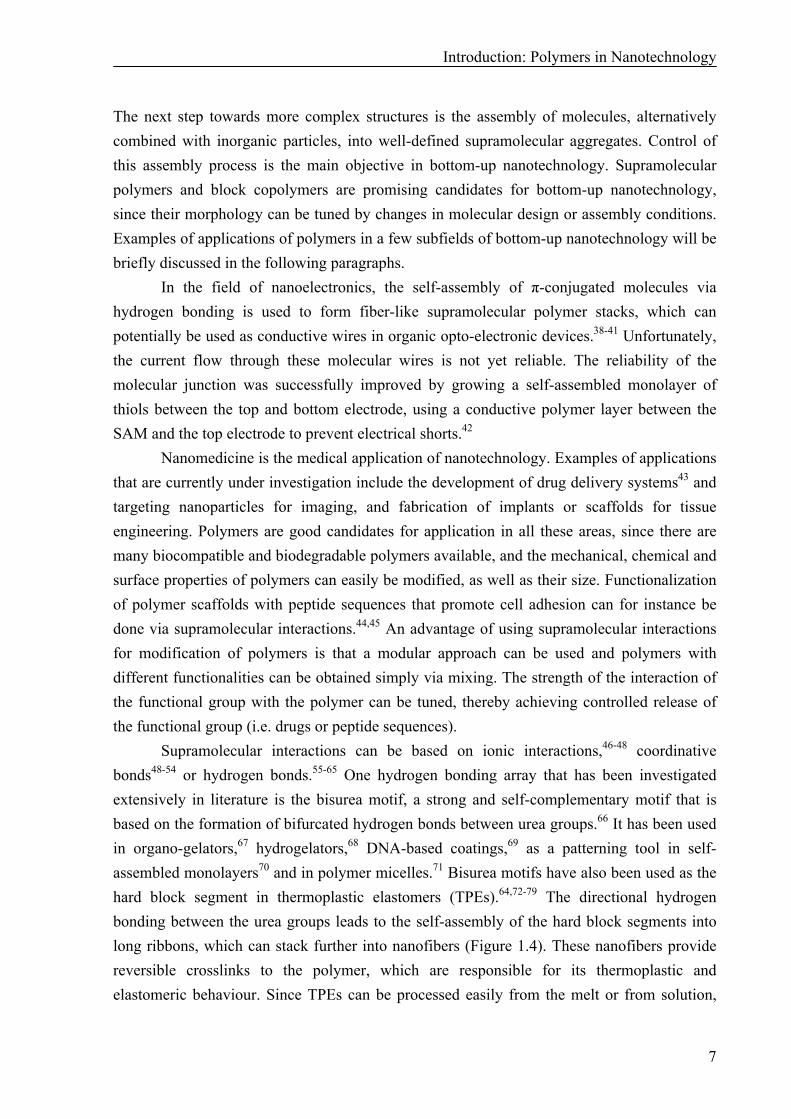
Supramolecular interactions can be based on ionic interactions,46-48 coordinative bonds48-54 or hydrogen bonds.55-65 One hydrogen bonding array that has been investigated extensively in literature is the bisurea motif, a strong and self-complementary motif that is based on the formation of bifurcated hydrogen bonds between urea groups.66 It has been used in organo-gelators,67 hydrogelators,68 DNA-based coatings,69 as a patterning tool in self-assembled monolayers70 and in polymer micelles.71 Bisurea motifs have also been used as the hard block segment in thermoplastic elastomers (TPEs).64,72-79 The directional hydrogen bonding between the urea groups leads to the self-assembly of the hard block segments into long ribbons, which can stack further into nanofibers (Figure 1.4). These nanofibers provide reversible crosslinks to the polymer, which are responsible for its thermoplastic and elastomeric behaviour. Since TPEs can be processed easily from the melt or from solution,
Chapter 1
8
these polymers are very suitable for the fabrication of tissue engineering scaffolds. Furthermore, the bisurea nanofibers can be used for the functionalization of the polymer, since it has been shown that a peptide molecule containing a bisurea motif was bound tightly to a bisurea TPE with an identical bisurea motif (Figure 1.4a).79
Figure 1.4: a) Hydrogen bonding between bisurea hard block units in a bisurea-based thermoplastic elastomer, and incorporation of functional groups. b) AFM height and phase image of nanofibrous morphology of a bisurea-based thermoplastic elastomer. Reproduced from Versteegen et al.76 Control over the position of functional groups has been investigated by using self-sorting in multi-functionalized polymers80-85 or by using block copolymers. Block copolymers are useful in nanotechnology because they spontaneously form nanostructures due to microphase separation.86-89 Their morphology can be tuned between spherical, cylindrical, interconnected network or lamellar or by varying the sizes of the blocks. If the two blocks have a different etch-resistance, the block copolymer morphology can be directly transferred into a silicon wafer via etching.90 Ordering and alignment of the block copolymer microdomains can be achieved by combining bottom-up assembly of block copolymers with top-down fabrication of patterned substrates, since the block copolymers will align to the edges of the patterns.91,92 The differences in chemical composition of the two blocks can be used for the controlled functionalization of one of the two blocks.46,93,94 Also the selective binding of nanoparticles to one of the two blocks has been achieved.95
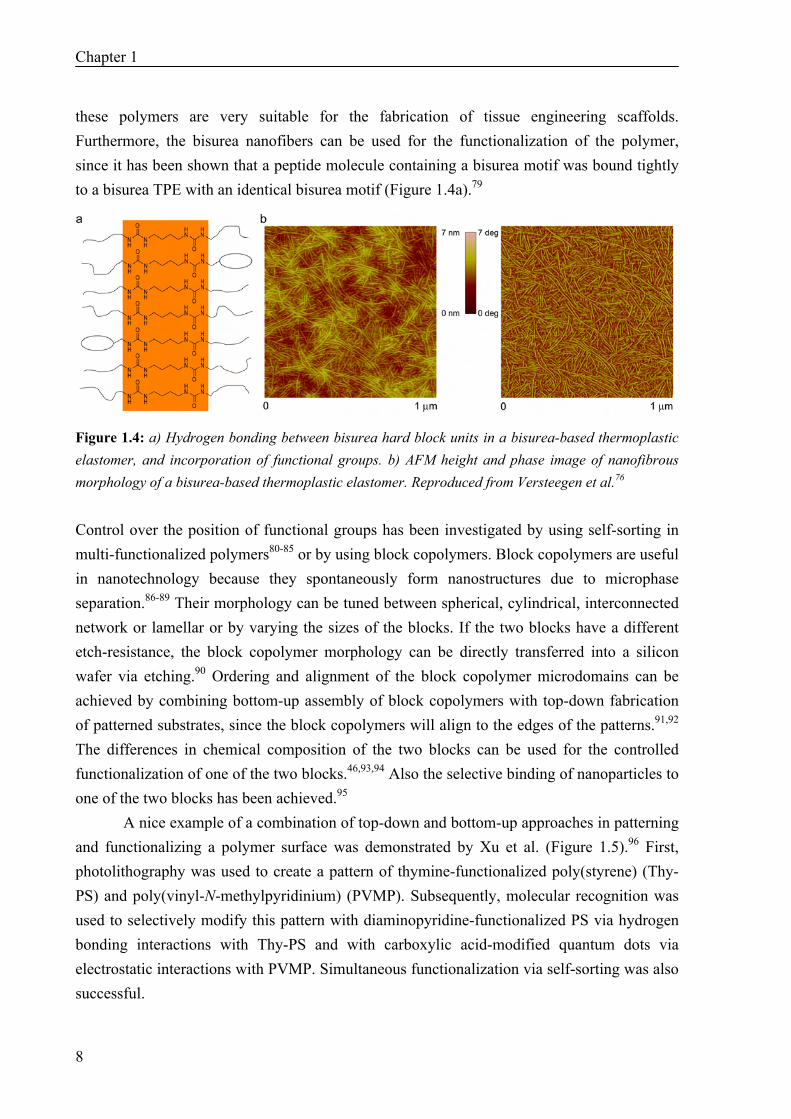
A nice example of a combination of top-down and bottom-up approaches in patterning and functionalizing a polymer surface was demonstrated by Xu et al. (Figure 1.5).96 First, photolithography was used to create a pattern of thymine-functionalized poly(styrene) (Thy-PS) and poly(vinyl-N-methylpyridinium) (PVMP). Subsequently, molecular recognition was used to selectively modify this pattern with diaminopyridine-functionalized PS via hydrogen bonding interactions with Thy-PS and with carboxylic acid-modified quantum dots via electrostatic interactions with PVMP. Simultaneous functionalization via self-sorting was also successful.
Introduction: Polymers in Nanotechnology
9
Figure 1.5: Combination of top-down photolithography and bottom-up self-assembly to create patterns of polymers and nanoparticles. Reproduced from Xu et al.96 A colour version of this figure is available on page 147. The principle of molecular recognition via supramolecular interactions is not only useful for the functionalization of polymers. Molecular recognition inside nanoporous polycarbonate membranes can be used to selectively filter dyes and proteins,97 which is of interest for the development of biosensors.
1.4 Challenges for Polymers in Nanotechnology
With top-down and bottom-up techniques meeting at the nanoscale, many possibilities and challenges arise for nanotechnology. Regarding the use of polymers in nanotechnology, each specific field has its own challenges. For UV lithography, the current photoresists are not suitable for extreme UV, since their absorption coefficients at 14.5 nm are too high. New polymers have to be found that have low absorption, high sensitivity, high etch resistance and the ability to form high resolution images with low line-edge roughness.98
In soft lithography, the use of commercially available PDMS as the material for elastomeric stamps is not ideal, since this PDMS is very soft and hydrophobic. Alternative stamp materials are currently under investigation; some of these new stamp materials exhibit a higher modulus, thereby preventing sagging and pairing of the stamp and improving the resolution that can be reached with microcontact printing,35,99,100 others are more hydrophilic than PDMS and can be used for printing polar inks or proteins.99,101-104 Another problem in microcontact printing is the diffusion of ink over the substrate. Solutions are being sought in two directions, namely limiting the diffusion of the ink by using a higher molecular weight ink,105,106 such as a polymer, or preventing the use of an ink by functionalization of the stamp surface with reactive or catalytic groups.107-109
Chapter 1
10
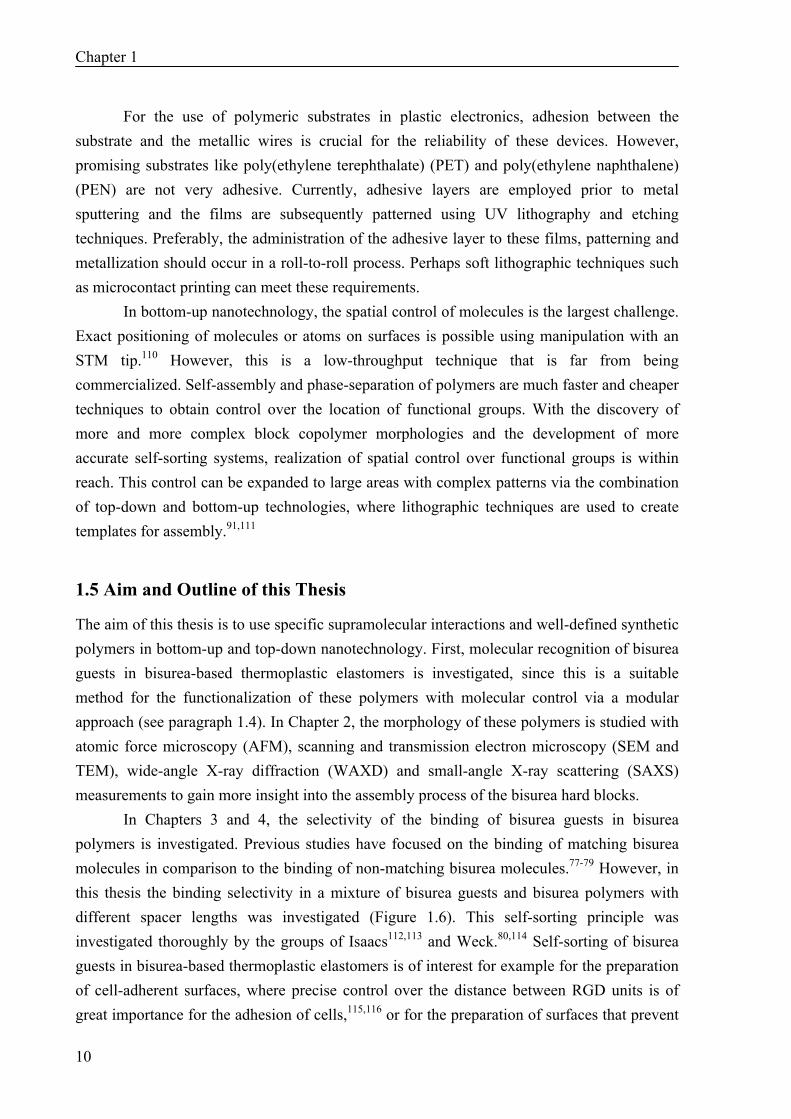
For the use of polymeric substrates in plastic electronics, adhesion between the substrate and the metallic wires is crucial for the reliability of these devices. However, promising substrates like poly(ethylene terephthalate) (PET) and poly(ethylene naphthalene) (PEN) are not very adhesive. Currently, adhesive layers are employed prior to metal sputtering and the films are subsequently patterned using UV lithography and etching techniques. Preferably, the administration of the adhesive layer to these films, patterning and metallization should occur in a roll-to-roll process. Perhaps soft lithographic techniques such as microcontact printing can meet these requirements.
In bottom-up nanotechnology, the spatial control of molecules is the largest challenge. Exact positioning of molecules or atoms on surfaces is possible using manipulation with an STM tip.110 However, this is a low-throughput technique that is far from being commercialized. Self-assembly and phase-separation of polymers are much faster and cheaper techniques to obtain control over the location of functional groups. With the discovery of more and more complex block copolymer morphologies and the development of more accurate self-sorting systems, realization of spatial control over functional groups is within reach. This control can be expanded to large areas with complex patterns via the combination of top-down and bottom-up technologies, where lithographic techniques are used to create templates for assembly.91,111
1.5 Aim and Outline of this Thesis
The aim of this thesis is to use specific supramolecular interactions and well-defined synthetic polymers in bottom-up and top-down nanotechnology. First, molecular recognition of bisurea guests in bisurea-based thermoplastic elastomers is investigated, since this is a suitable method for the functionalization of these polymers with molecular control via a modular approach (see paragraph 1.4). In Chapter 2, the morphology of these polymers is studied with atomic force microscopy (AFM), scanning and transmission electron microscopy (SEM and TEM), wide-angle X-ray diffraction (WAXD) and small-angle X-ray scattering (SAXS) measurements to gain more insight into the assembly process of the bisurea hard blocks.
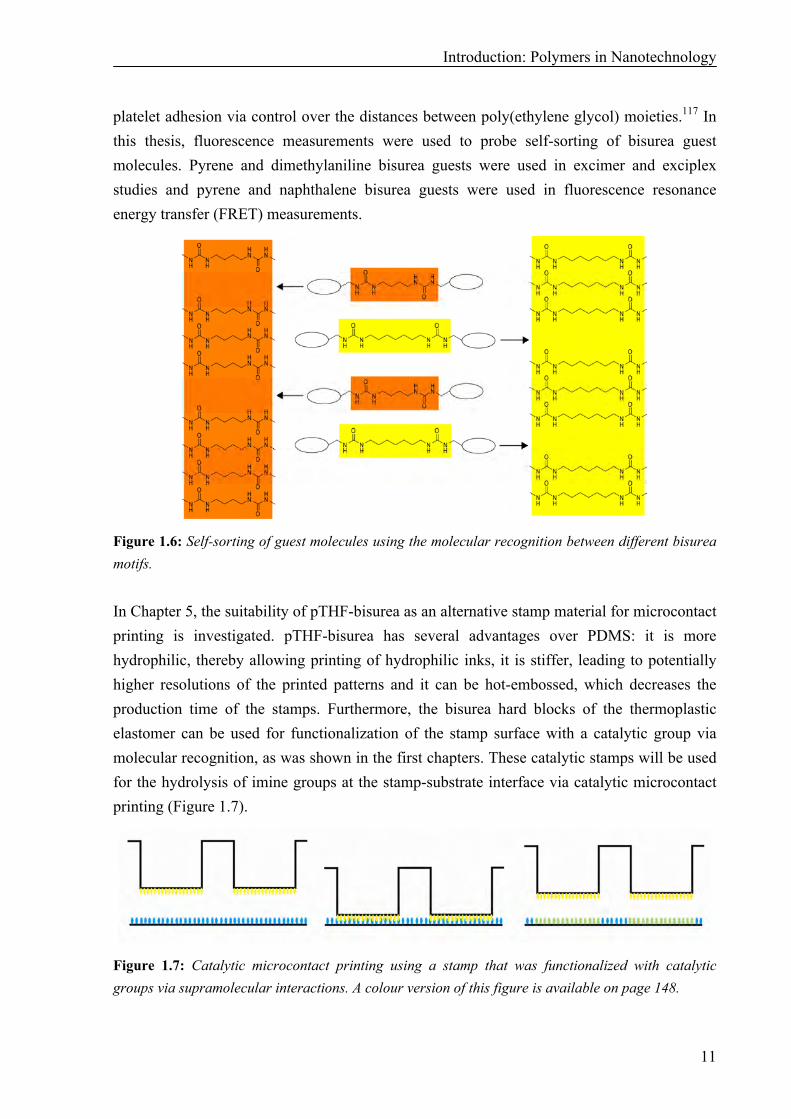
In Chapters 3 and 4, the selectivity of the binding of bisurea guests in bisurea polymers is investigated. Previous studies have focused on the binding of matching bisurea molecules in comparison to the binding of non-matching bisurea molecules.77-79 However, in this thesis the binding selectivity in a mixture of bisurea guests and bisurea polymers with different spacer lengths was investigated (Figure 1.6). This self-sorting principle was investigated thoroughly by the groups of Isaacs112,113 and Weck.80,114 Self-sorting of bisurea guests in bisurea-based thermoplastic elastomers is of interest for example for the preparation of cell-adherent surfaces, where precise control over the distance between RGD units is of great importance for the adhesion of cells,115,116 or for the preparation of surfaces that prevent
Introduction: Polymers in Nanotechnology
11
platelet adhesion via control over the distances between poly(ethylene glycol) moieties.117 In this thesis, fluorescence measurements were used to probe self-sorting of bisurea guest molecules. Pyrene and dimethylaniline bisurea guests were used in excimer and exciplex studies and pyrene and naphthalene bisurea guests were used in fluorescence resonance energy transfer (FRET) measurements.
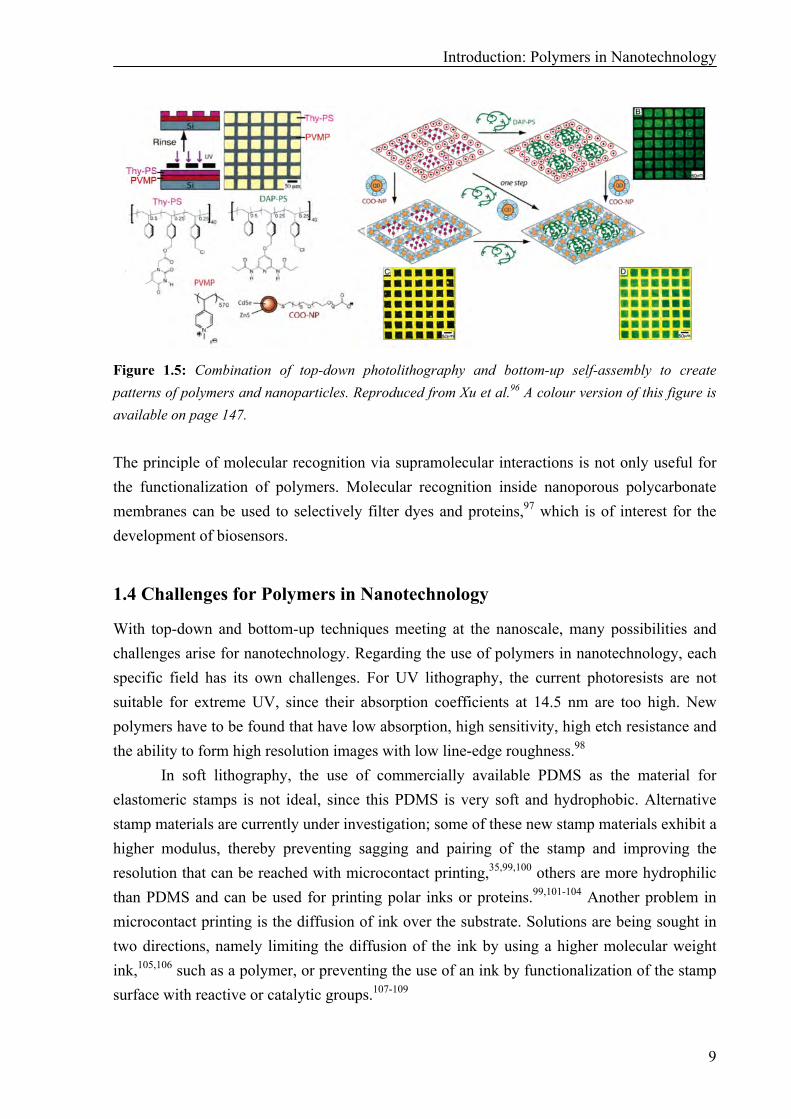
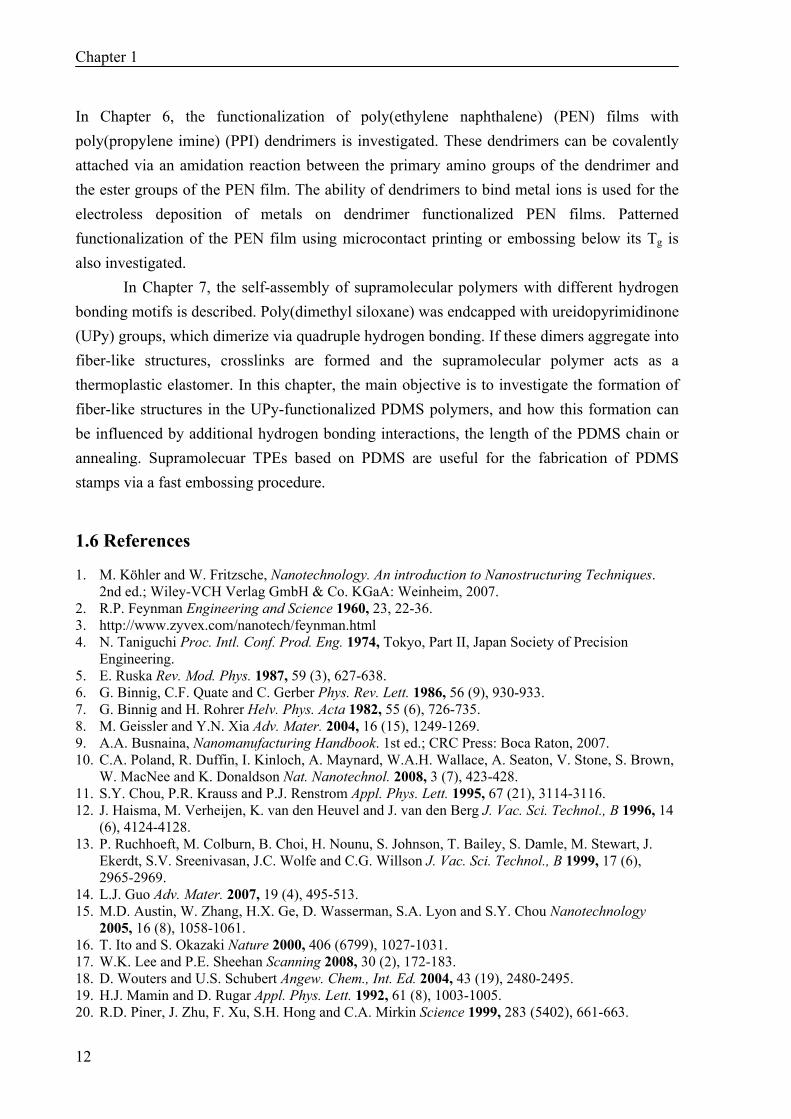
Figure 1.6: Self-sorting of guest molecules using the molecular recognition between different bisurea motifs. In Chapter 5, the suitability of pTHF-bisurea as an alternative stamp material for microcontact printing is investigated. pTHF-bisurea has several advantages over PDMS: it is more hydrophilic, thereby allowing printing of hydrophilic inks, it is stiffer, leading to potentially higher resolutions of the printed patterns and it can be hot-embossed, which decreases the production time of the stamps. Furthermore, the bisurea hard blocks of the thermoplastic elastomer can be used for functionalization of the stamp surface with a catalytic group via molecular recognition, as was shown in the first chapters. These catalytic stamps will be used for the hydrolysis of imine groups at the stamp-substrate interface via catalytic microcontact printing (Figure 1.7).
Figure 1.7: Catalytic microcontact printing using a stamp that was functionalized with catalytic groups via supramolecular interactions. A colour version of this figure is available on page 148.
Chapter 1
12
In Chapter 6, the functionalization of poly(ethylene naphthalene) (PEN) films with poly(propylene imine) (PPI) dendrimers is investigated. These dendrimers can be covalently attached via an amidation reaction between the primary amino groups of the dendrimer and the ester groups of the PEN film. The ability of dendrimers to bind metal ions is used for the electroless deposition of metals on dendrimer functionalized PEN films. Patterned functionalization of the PEN film using microcontact printing or embossing below its Tg is also investigated.
In Chapter 7, the self-assembly of supramolecular polymers with different hydrogen bonding motifs is described. Poly(dimethyl siloxane) was endcapped with ureidopyrimidinone (UPy) groups, which dimerize via quadruple hydrogen bonding. If these dimers aggregate into fiber-like structures, crosslinks are formed and the supramolecular polymer acts as a thermoplastic elastomer. In this chapter, the main objective is to investigate the formation of fiber-like structures in the UPy-functionalized PDMS polymers, and how this formation can be influenced by additional hydrogen bonding interactions, the length of the PDMS chain or annealing. Supramolecuar TPEs based on PDMS are useful for the fabrication of PDMS stamps via a fast embossing procedure.
1.6 References
1. M. Köhler and W. Fritzsche, Nanotechnology. An introduction to Nanostructuring Techniques. 2nd ed.; Wiley-VCH Verlag GmbH & Co. KGaA: Weinheim, 2007.
2. R.P. Feynman Engineering and Science 1960, 23, 22-36. 3. http://www.zyvex.com/nanotech/feynman.html 4. N. Taniguchi Proc. Intl. Conf. Prod. Eng. 1974, Tokyo, Part II, Japan Society of Precision
Engineering. 5. E. Ruska Rev. Mod. Phys. 1987, 59 (3), 627-638. 6. G. Binnig, C.F. Quate and C. Gerber Phys. Rev. Lett. 1986, 56 (9), 930-933. 7. G. Binnig and H. Rohrer Helv. Phys. Acta 1982, 55 (6), 726-735. 8. M. Geissler and Y.N. Xia Adv. Mater. 2004, 16 (15), 1249-1269. 9. A.A. Busnaina, Nanomanufacturing Handbook. 1st ed.; CRC Press: Boca Raton, 2007. 10. C.A. Poland, R. Duffin, I. Kinloch, A. Maynard, W.A.H. Wallace, A. Seaton, V. Stone, S. Brown,
W. MacNee and K. Donaldson Nat. Nanotechnol. 2008, 3 (7), 423-428. 11. S.Y. Chou, P.R. Krauss and P.J. Renstrom Appl. Phys. Lett. 1995, 67 (21), 3114-3116. 12. J. Haisma, M. Verheijen, K. van den Heuvel and J. van den Berg J. Vac. Sci. Technol., B 1996, 14
(6), 4124-4128. 13. P. Ruchhoeft, M. Colburn, B. Choi, H. Nounu, S. Johnson, T. Bailey, S. Damle, M. Stewart, J.
Ekerdt, S.V. Sreenivasan, J.C. Wolfe and C.G. Willson J. Vac. Sci. Technol., B 1999, 17 (6), 2965-2969.
14. L.J. Guo Adv. Mater. 2007, 19 (4), 495-513. 15. M.D. Austin, W. Zhang, H.X. Ge, D. Wasserman, S.A. Lyon and S.Y. Chou Nanotechnology
2005, 16 (8), 1058-1061. 16. T. Ito and S. Okazaki Nature 2000, 406 (6799), 1027-1031. 17. W.K. Lee and P.E. Sheehan Scanning 2008, 30 (2), 172-183. 18. D. Wouters and U.S. Schubert Angew. Chem., Int. Ed. 2004, 43 (19), 2480-2495. 19. H.J. Mamin and D. Rugar Appl. Phys. Lett. 1992, 61 (8), 1003-1005. 20. R.D. Piner, J. Zhu, F. Xu, S.H. Hong and C.A. Mirkin Science 1999, 283 (5402), 661-663.
Introduction: Polymers in Nanotechnology
13
21. M. Péter, X.M. Li, J. Huskens and D.N. Reinhoudt J. Am. Chem. Soc. 2004, 126 (37), 11684-11690.
22. P. Vettiger, M. Despont, U. Drechsler, U. Durig, W. Haberle, M.I. Lutwyche, H.E. Rothuizen, R. Stutz, R. Widmer and G.K. Binnig IBM J. Res. Dev. 2000, 44 (3), 323-340.
23. Y.N. Xia and G.M. Whitesides Annu. Rev. Mater. Sci. 1998, 28, 153-184. 24. A. Kumar and G.M. Whitesides Appl. Phys. Lett. 1993, 63 (14), 2002-2004. 25. Y.N. Xia, E. Kim, X.M. Zhao, J.A. Rogers, M. Prentiss and G.M. Whitesides Science 1996, 273
(5273), 347-349. 26. X.M. Zhao, Y.N. Xia and G.M. Whitesides Adv. Mater. 1996, 8 (10), 837-&. 27. E. Kim, Y.N. Xia and G.M. Whitesides Nature 1995, 376 (6541), 581-584. 28. E. Kim, Y.N. Xia, X.M. Zhao and G.M. Whitesides Adv. Mater. 1997, 9 (8), 651-654. 29. K.Y. Suh and H.H. Lee Adv. Funct. Mater. 2002, 12 (6-7), 405-413. 30. K.Y. Suh, Y.S. Kim and H.H. Lee Adv. Mater. 2001, 13 (18), 1386-1389. 31. M. Geissler, J.M. McLellan and Y.N. Xia Nano Lett. 2005, 5 (1), 31-36. 32. S.M. Miller, S.M. Troian and S. Wagner J. Vac. Sci. Technol., B 2002, 20 (6), 2320-2327. 33. D.W. Li and L.J. Guo J. Phys. D: Appl. Phys. 2008, 41 (10). 34. R.D. Bennett, A.J. Hart, A.C. Miller, P.T. Hammond, D.J. Irvine and R.E. Cohen Langmuir 2006,
22 (20), 8273-8276. 35. H. Schmid and B. Michel Macromolecules 2000, 33 (8), 3042-3049. 36. H.W. Li, B.V.O. Muir, G. Fichet and W.T.S. Huck Langmuir 2003, 19 (6), 1963-1965. 37. F. Hua, Y.G. Sun, A. Gaur, M.A. Meitl, L. Bilhaut, L. Rotkina, J.F. Wang, P. Geil, M. Shim, J.A.
Rogers and A. Shim Nano Lett. 2004, 4 (12), 2467-2471. 38. S. Yagai, S. Kubota, T. Iwashima, K. Kishikawa, T. Nakanishi, T. Karatsu and A. Kitamura
Chem.--Eur. J. 2008, 14 (17), 5246-5257. 39. A. Schenning and E.W. Meijer Chem. Commun. 2005, (26), 3245-3258. 40. F.J.M. Hoeben, P. Jonkheijm, E.W. Meijer and A. Schenning Chem. Rev. 2005, 105 (4), 1491-
1546. 41. P. Jonkheijm, F.J.M. Hoeben, R. Kleppinger, J. van Herrikhuyzen, A. Schenning and E.W. Meijer
J. Am. Chem. Soc. 2003, 125 (51), 15941-15949. 42. H.B. Akkerman, P.W.M. Blom, D.M. de Leeuw and B. de Boer Nature 2006, 441 (7089), 69-72. 43. M. Goldberg, R. Langer and X.Q. Jia J. Biomater. Sci., Polym. Ed. 2007, 18 (3), 241-268. 44. P.Y.W. Dankers and E.W. Meijer Bull. Chem. Soc. Jpn. 2007, 80 (11), 2047-2073. 45. P.Y.W. Dankers, M.C. Harmsen, L.A. Brouwer, M.J.A. van Luyn and E.W. Meijer Nat. Mater.
2005, 4 (7), 568-574. 46. J. Ruokolainen, R. Makinen, M. Torkkeli, T. Makela, R. Serimaa, G. ten Brinke and O. Ikkala
Science 1998, 280 (5363), 557-560. 47. O. Ikkala and G. ten Brinke Chem. Commun. 2004, (19), 2131-2137. 48. S. Valkama, O. Lehtonen, K. Lappalainen, H. Kosonen, P. Castro, T. Repo, M. Torkkeli, R.
Serimaa, G. ten Brinke, M. Leskela and O. Ikkala Macromol. Rapid Commun. 2003, 24 (9), 556-560.
49. T. Vermonden, M.J. van Steenbergen, N.A.M. Besseling, A.T.M. Marcelis, W.E. Hennink, E.J.R. Sudholter and M.A.C. Stuart J. Am. Chem. Soc. 2004, 126 (48), 15802-15808.
50. J.B. Beck and S.J. Rowan J. Am. Chem. Soc. 2003, 125 (46), 13922-13923. 51. H. Hofmeier, R. Hoogenboom, M.E.L. Wouters and U.S. Schubert J. Am. Chem. Soc. 2005, 127
(9), 2913-2921. 52. J.M.J. Paulusse, J.P.J. Huijbers and R.P. Sijbesma Macromolecules 2005, 38 (15), 6290-6298. 53. J.M.J. Paulusse and R.P. Sijbesma Angew. Chem., Int. Ed. 2004, 43 (34), 4460-4462. 54. S. Schmatloch, A.M.J. van den Berg, A.S. Alexeev, H. Hofmeier and U.S. Schubert
Macromolecules 2003, 36 (26), 9943-9949. 55. C. Fouquey, J.M. Lehn and A.M. Levelut Adv. Mater. 1990, 2 (5), 254-257. 56. R.P. Sijbesma, F.H. Beijer, L. Brunsveld, B.J.B. Folmer, J.H.K.K. Hirschberg, R.F.M. Lange,
J.K.L. Lowe and E.W. Meijer Science 1997, 278 (5343), 1601-1604. 57. J.H.K.K. Hirschberg, F.H. Beijer, H.A. van Aert, P.C.M.M. Magusin, R.P. Sijbesma and E.W.
Meijer Macromolecules 1999, 32 (8), 2696-2705.
Chapter 1
14
58. B.J.B. Folmer, R.P. Sijbesma, R.M. Versteegen, J.A.J. van der Rijt and E.W. Meijer Adv. Mater. 2000, 12 (12), 874-878.
59. V. Berl, M. Schmutz, M.J. Krische, R.G. Khoury and J.M. Lehn Chem.--Eur. J. 2002, 8 (5), 1227-1244.
60. F. Lortie, S. Boileau and L. Bouteiller Chem.--Eur. J. 2003, 9 (13), 3008-3014. 61. W.H. Binder, M.J. Kunz and E. Ingolic J. Polym. Sci., Part A: Polym. Chem. 2003, 42 (1), 162-
172. 62. C.L. Elkins, K. Viswanathan and T.E. Long Macromolecules 2006, 39 (9), 3132-3139. 63. P. Cordier, F. Tournilhac, C. Soulie-Ziakovic and L. Leibler Nature 2008, 451 (7181), 977-980. 64. O. Colombani, C. Barioz, L. Bouteiller, C. Chanéac, L. Fompérie, F. Lortie and H. Montès
Macromolecules 2005, 38 (5), 1752-1759. 65. P.Y.W. Dankers, E.N.M. van Leeuwen, G.M.L. van Gemert, A.J.H. Spiering, M.C. Harmsen, L.A.
Brouwer, H.M. Janssen, A.W. Bosman, M.J.A. van Luyn and E.W. Meijer Biomaterials 2006, 27 (32), 5490-5501.
66. W. Dannecker, J. Kopf and H. Rust Crystal Structure Communications 1979, 8 (2), 429-432. 67. J. van Esch, F. Schoonbeek, M. de Loos, H. Kooijman, A.L. Spek, R.M. Kellogg and B.L. Feringa
Chem.--Eur. J. 1999, 5 (3), 937-950. 68. M. de Loos, A. Friggeri, J. van Esch, R.M. Kellogg and B.L. Feringa Organic & Biomolecular
Chemistry 2005, 3 (9), 1631-1639. 69. M.R.J. Vos, P.H.H. Bomans, F. de Haas, P.M. Frederik, J.A. Jansen, R.J.M. Nolte and N.A.J.M.
Sommerdijk J. Am. Chem. Soc. 2007, 129 (39), 11894-11895. 70. S. De Feyter, M. Larsson, N. Schuurmans, B. Verkuijl, G. Zoriniants, A. Gesquière, M.M. Abdel-
Mottaleb, J. van Esch, B.L. Feringa, J. van Stam and F. De Schryver Chem.--Eur. J. 2003, 9 (5), 1198-1206.
71. N. Chebotareva, P.H.H. Bomans, P.M. Frederik, N.A.J.M. Sommerdijk and R.P. Sijbesma Chem. Commun. 2005, (39), 4967-4969.
72. D. Tyagi, G.L. Wilkes, I. Yilgör and J.E. McGrath Polym. Bull. 1982, 8 (11-1), 543-550. 73. O. Colombani and L. Bouteiller New J. Chem. 2004, 28 (11), 1373-1382. 74. S. Das, I. Yilgör, E. Yilgör, B. Inci, O. Tezgel, F.L. Beyer and G.L. Wilkes Polymer 2007, 48 (1),
290-301. 75. I. Yilgör and E. Yilgör Polym. Rev. 2007, 47 (4), 487-510. 76. R.M. Versteegen, R. Kleppinger, R.P. Sijbesma and E.W. Meijer Macromolecules 2006, 39 (2),
772-783. 77. R.A. Koevoets, R.M. Versteegen, H. Kooijman, A.L. Spek, R.P. Sijbesma and E.W. Meijer J. Am.
Chem. Soc. 2005, 127 (9), 2999-3003. 78. E. Wisse, L.E. Govaert, H.E.H. Meijer and E.W. Meijer Macromolecules 2006, 39 (21), 7425-
7432. 79. E. Wisse, A.J.H. Spiering, E.N.M. van Leeuwen, R.A.E. Renken, P.Y.W. Dankers, L.A. Brouwer,
M.J.A. van Luyn, M.C. Harmsen, N.A.J.M. Sommerdijk and E.W. Meijer Biomacromolecules 2006, 7 (12), 3385-3395.
80. C.R. South, C. Burd and M. Weck Acc. Chem. Res. 2007, 40 (1), 63-74. 81. W. Gerhardt, M. Crne and M. Weck Chem.--Eur. J. 2004, 10 (24), 6212-6221. 82. T.B. Norsten, E. Jeoung, R.J. Thibault and V.M. Rotello Langmuir 2003, 19 (17), 7089-7093. 83. J.M. Pollino and M. Weck Chem. Soc. Rev. 2005, 34 (3), 193-207. 84. M. Weck Polym. Int. 2007, 56 (4), 453-460. 85. S.K. Yang and M. Weck Macromolecules 2008, 41 (2), 346-351. 86. C. Park, J. Yoon and E.L. Thomas Polymer 2003, 44 (22), 6725-6760. 87. Z.H. Nie and E. Kumacheva Nat. Mater. 2008, 7 (4), 277-290. 88. A. del Campo and E. Arzt Chem. Rev. 2008, 108 (3), 911-945. 89. I.W. Hamley Angew. Chem., Int. Ed. 2003, 42 (15), 1692-1712. 90. Y.S. Jung and C.A. Ross Nano Lett. 2007, 7 (7), 2046-2050. 91. M. Roerdink, M.A. Hempenius, U. Gunst, H.F. Arlinghaus and G.J. Vancso Small 2007, 3 (8),
1415-1423. 92. H.C. Kim, C.T. Rettner and L. Sundstrom Nanotechnology 2008, 19 (23), 235301.
Introduction: Polymers in Nanotechnology
15
93. R. Shenhar, H. Xu, B.L. Frankamp, T.E. Mates, A. Sanyal, O. Uzun and V.M. Rotello J. Am. Chem. Soc. 2005, 127 (46), 16318-16324.
94. O. Ikkala and G. ten Brinke Science 2002, 295 (5564), 2407-2409. 95. A. Haryono and W.H. Binder Small 2006, 2 (5), 600-611. 96. H. Xu, R. Hong, T.X. Lu, O. Uzun and V.M. Rotello J. Am. Chem. Soc. 2006, 128 (10), 3162-
3163. 97. E.N. Savariar, K. Krishnamoorthy and S. Thayumanavan Nat. Nanotechnol. 2008, 3 (2), 112-117. 98. D. Bratton, D. Yang, J.Y. Dai and C.K. Ober Polym. Adv. Technol. 2006, 17 (2), 94-103. 99. G. Csucs, T. Kunzler, K. Feldman, F. Robin and N.D. Spencer Langmuir 2003, 19 (15), 6104-
6109. 100.D. Trimbach, K. Feldman, N.D. Spencer, D.J. Broer and C.W.M. Bastiaansen Langmuir 2003, 19
(26), 10957-10961. 101.N. Coq, T. van Bommel, R.A. Hikmet, H.R. Stapert and W.U. Dittmer Langmuir 2007, 23 (9),
5154-5160. 102.N.Y. Lee, J.R. Lim, M.J. Lee, J.B. Kim, S.J. Jo, H.K. Baik and Y.S. Kim Langmuir 2006, 22 (21),
9018-9022. 103.D.C. Trimbach, M. Al-Hussein, W.H. de Jeu, M. Decré, D.J. Broer and C.W.M. Bastiaansen
Langmuir 2004, 20 (11), 4738-4742. 104.D.C. Trimbach, H. Stapert, J. van Orselen, K.D. Jandt, C.W.M. Bastiaansen and D.J. Broer Adv.
Eng. Mater. 2007, 9 (12), 1123-1128. 105.M. Liebau, J. Huskens and D.N. Reinhoudt Adv. Funct. Mater. 2001, 11 (2), 147-150. 106.H.W. Li, D.J. Kang, M.G. Blamire and W.T.S. Huck Nano Lett. 2002, 2 (4), 347-349. 107.P.W. Snyder, M.S. Johannes, B.N. Vogen, R.L. Clark and E.J. Toone J. Org. Chem. 2007, 72
(19), 7459-7461. 108.X.M. Li, M. Péter, J. Huskens and D.N. Reinhoudt Nano Lett. 2003, 3 (10), 1449-1453. 109.A.A. Shestopalov, R.L. Clark and E.J. Toone J. Am. Chem. Soc. 2007, 129 (45), 13818-13819. 110.D.M. Eigler and E.K. Schweizer Nature 1990, 344 (6266), 524-526. 111.S. Kim, J. Lee, S.M. Jeon, H.H. Lee, K. Char and B.H. Sohn Macromolecules 2008, 41 (10),
3401-3404. 112.P. Mukhopadhyay, P.Y. Zavalij and L. Isaacs J. Am. Chem. Soc. 2006, 128 (43), 14093-14102. 113.A.X. Wu and L. Isaacs J. Am. Chem. Soc. 2003, 125 (16), 4831-4835. 114.C. Burd and M. Weck Macromolecules 2005, 38 (17), 7225-7230. 115.E.A. Cavalcanti-Adam, A. Micoulet, J. Blummel, J. Auernheimer, H. Kessler and J.P. Spatz Eur.
J. Cell Biol. 2006, 85 (3-4), 219-224. 116.M. Arnold, E.A. Cavalcanti-Adam, R. Glass, J. Blummel, W. Eck, M. Kantlehner, H. Kessler and
J.P. Spatz ChemPhysChem 2004, 5 (3), 383-388. 117.A.M.S. Kumar, S. Sivakova, J.D. Fox, J.E. Green, R.E. Marchant and S.J. Rowan J. Am. Chem.
Soc. 2008, 130 (4), 1466-1476.
16
17
22
Nanofibrous Morphology of pTHF-bisurea Thermoplastic Elastomers
Abstract In this chapter, a study of the morphology of the thermoplastic elastomer pTHF-bisurea is reported, focusing on the molecular structure of the hard block domains. Bisurea groups are known to form ribbon-like assemblies due to the directionality of the urea hydrogen bonding motif. For the formation of the hard block crystallites that give the pTHF-bisurea its thermoplastic and elastomeric properties, stacking of ribbons into 3D structures is necessary. The fiber-like 3D structures were imaged using TEM, SEM and AFM after drop-casting pTHF-bisurea from a dilute solution. Information about the number of ribbons in one fiber was obtained via AFM measurements on single fibers of four different pTHF-bisurea polymers, varying in the length of the soft block or the length of the alkyl spacer between the urea units. While the number of ribbons per fiber varied between 1 and 7, fibers with 3-4 ribbons were predominant in all four polymers. The fiber cross-sectional area increased with increasing height of the fiber, while the width remained approximately constant. This indicates that the bisurea ribbons are oriented parallel to the substrate and that stacking of the ribbons occurs perpendicular to the substrate. In addition to single fiber measurements, also AFM images of bundles of fibers were analyzed, and cross-sectional areas were determined. In the bundles, the average width and average number of ribbons per fiber was the same as for the single fiber measurements, although all fibers consisted of more than one ribbon. SAXS and WAXD measurements were performed to study the bulk morphology of the polymers. The SAXS data show that the d-spacing (interpreted as the average distance between the fibers) of the pTHF-bisurea polymers increases with an increase in soft block length, and also with an increase in the length of the alkyl spacer between the urea groups. A part of this work will be submitted for publication: N.E. Botterhuis, C.F.C. Fitié, J.G.P. Goossens and R.P. Sijbesma, manuscript in preparation.
Chapter 2
18
2.1 Introduction
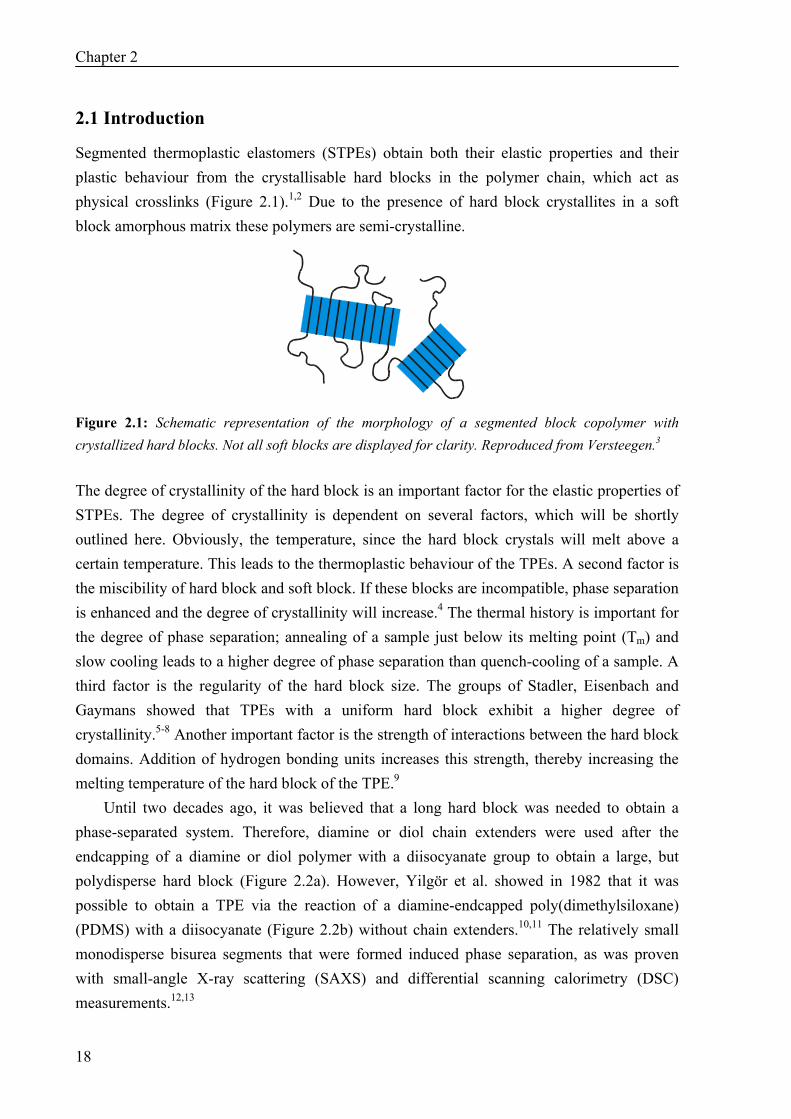
Segmented thermoplastic elastomers (STPEs) obtain both their elastic properties and their plastic behaviour from the crystallisable hard blocks in the polymer chain, which act as physical crosslinks (Figure 2.1).1,2 Due to the presence of hard block crystallites in a soft block amorphous matrix these polymers are semi-crystalline.
Figure 2.1: Schematic representation of the morphology of a segmented block copolymer with crystallized hard blocks. Not all soft blocks are displayed for clarity. Reproduced from Versteegen.3
The degree of crystallinity of the hard block is an important factor for the elastic properties of STPEs. The degree of crystallinity is dependent on several factors, which will be shortly outlined here. Obviously, the temperature, since the hard block crystals will melt above a certain temperature. This leads to the thermoplastic behaviour of the TPEs. A second factor is the miscibility of hard block and soft block. If these blocks are incompatible, phase separation is enhanced and the degree of crystallinity will increase.4 The thermal history is important for the degree of phase separation; annealing of a sample just below its melting point (Tm) and slow cooling leads to a higher degree of phase separation than quench-cooling of a sample. A third factor is the regularity of the hard block size. The groups of Stadler, Eisenbach and Gaymans showed that TPEs with a uniform hard block exhibit a higher degree of crystallinity.5-8 Another important factor is the strength of interactions between the hard block domains. Addition of hydrogen bonding units increases this strength, thereby increasing the melting temperature of the hard block of the TPE.9
Until two decades ago, it was believed that a long hard block was needed to obtain a phase-separated system. Therefore, diamine or diol chain extenders were used after the endcapping of a diamine or diol polymer with a diisocyanate group to obtain a large, but polydisperse hard block (Figure 2.2a). However, Yilgör et al. showed in 1982 that it was possible to obtain a TPE via the reaction of a diamine-endcapped poly(dimethylsiloxane) (PDMS) with a diisocyanate (Figure 2.2b) without chain extenders.10,11 The relatively small monodisperse bisurea segments that were formed induced phase separation, as was proven with small-angle X-ray scattering (SAXS) and differential scanning calorimetry (DSC) measurements.12,13
Nanofibrous Morphology of pTHF-bisurea Thermoplastic Elastomers
19
a
b
c
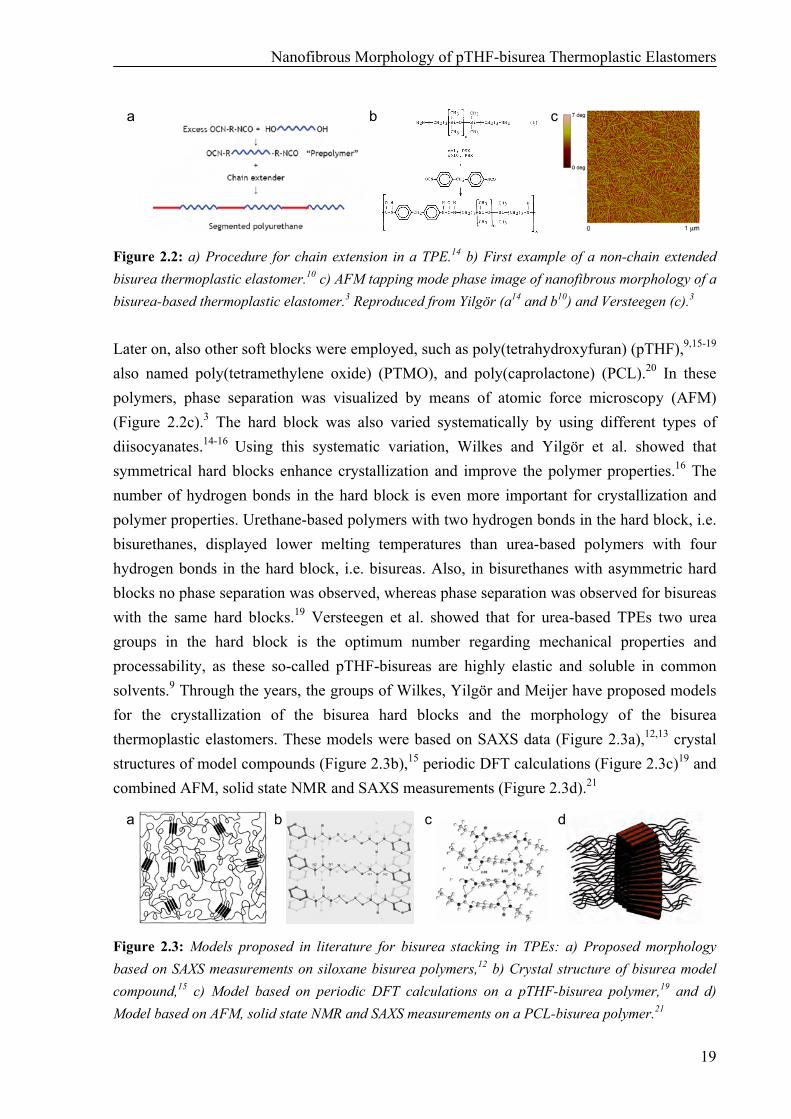
Figure 2.2: a) Procedure for chain extension in a TPE.14 b) First example of a non-chain extended bisurea thermoplastic elastomer.10 c) AFM tapping mode phase image of nanofibrous morphology of a bisurea-based thermoplastic elastomer.3 Reproduced from Yilgör (a14 and b10) and Versteegen (c).3
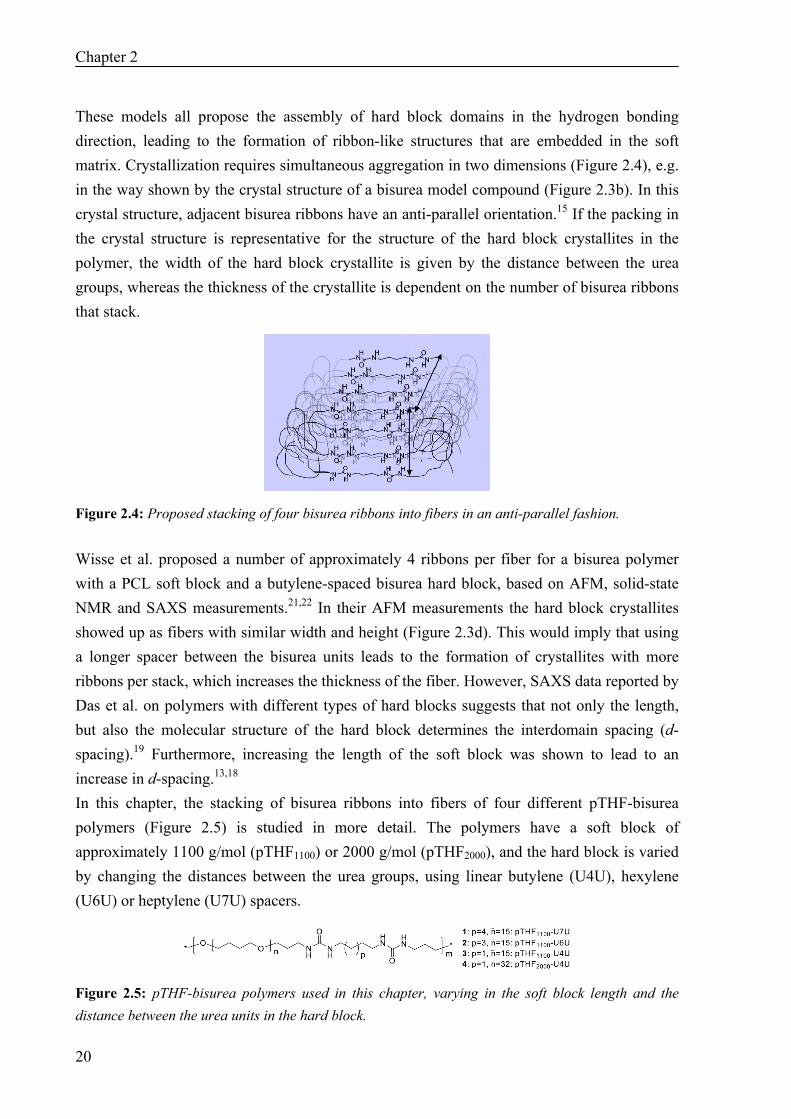
Later on, also other soft blocks were employed, such as poly(tetrahydroxyfuran) (pTHF),9,15-19 also named poly(tetramethylene oxide) (PTMO), and poly(caprolactone) (PCL).20 In these polymers, phase separation was visualized by means of atomic force microscopy (AFM) (Figure 2.2c).3 The hard block was also varied systematically by using different types of diisocyanates.14-16 Using this systematic variation, Wilkes and Yilgör et al. showed that symmetrical hard blocks enhance crystallization and improve the polymer properties.16 The number of hydrogen bonds in the hard block is even more important for crystallization and polymer properties. Urethane-based polymers with two hydrogen bonds in the hard block, i.e. bisurethanes, displayed lower melting temperatures than urea-based polymers with four hydrogen bonds in the hard block, i.e. bisureas. Also, in bisurethanes with asymmetric hard blocks no phase separation was observed, whereas phase separation was observed for bisureas with the same hard blocks.19 Versteegen et al. showed that for urea-based TPEs two urea groups in the hard block is the optimum number regarding mechanical properties and processability, as these so-called pTHF-bisureas are highly elastic and soluble in common solvents.9 Through the years, the groups of Wilkes, Yilgör and Meijer have proposed models for the crystallization of the bisurea hard blocks and the morphology of the bisurea thermoplastic elastomers. These models were based on SAXS data (Figure 2.3a),12,13 crystal structures of model compounds (Figure 2.3b),15 periodic DFT calculations (Figure 2.3c)19 and combined AFM, solid state NMR and SAXS measurements (Figure 2.3d).21
a
b
c
d
Figure 2.3: Models proposed in literature for bisurea stacking in TPEs: a) Proposed morphology based on SAXS measurements on siloxane bisurea polymers,12 b) Crystal structure of bisurea model compound,15 c) Model based on periodic DFT calculations on a pTHF-bisurea polymer,19 and d) Model based on AFM, solid state NMR and SAXS measurements on a PCL-bisurea polymer.21
Chapter 2
20
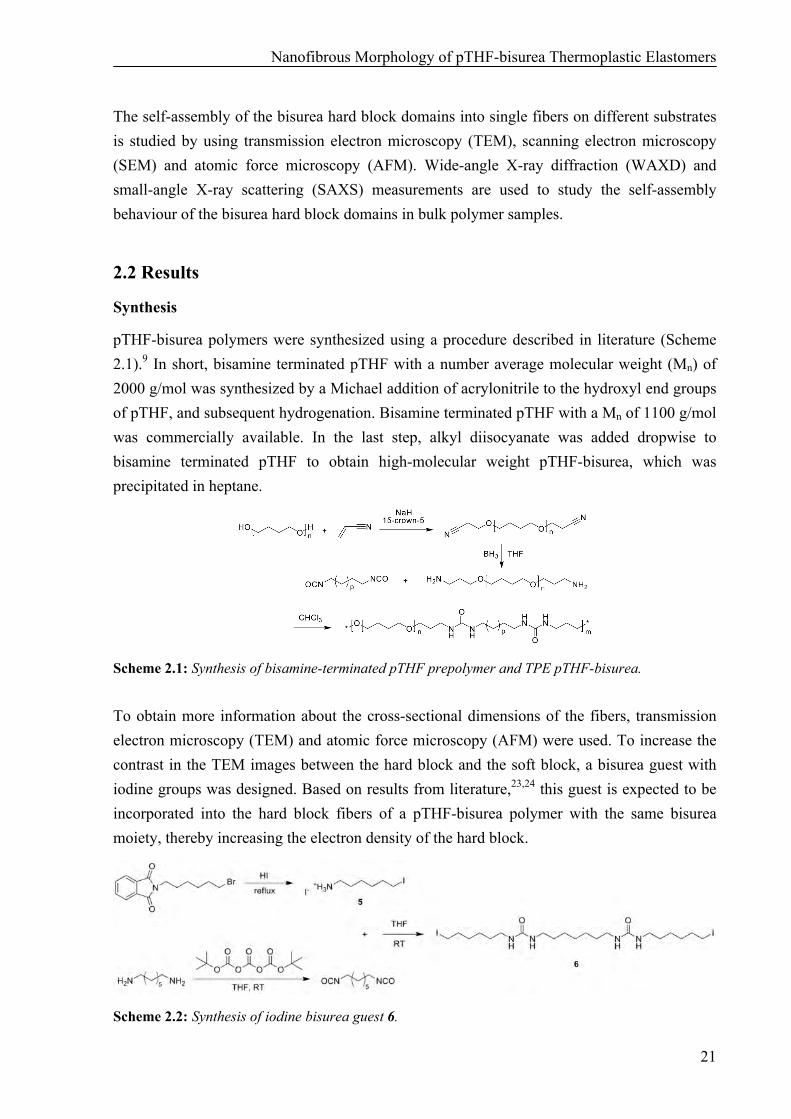
These models all propose the assembly of hard block domains in the hydrogen bonding direction, leading to the formation of ribbon-like structures that are embedded in the soft matrix. Crystallization requires simultaneous aggregation in two dimensions (Figure 2.4), e.g. in the way shown by the crystal structure of a bisurea model compound (Figure 2.3b). In this crystal structure, adjacent bisurea ribbons have an anti-parallel orientation.15 If the packing in the crystal structure is representative for the structure of the hard block crystallites in the polymer, the width of the hard block crystallite is given by the distance between the urea groups, whereas the thickness of the crystallite is dependent on the number of bisurea ribbons that stack.
Figure 2.4: Proposed stacking of four bisurea ribbons into fibers in an anti-parallel fashion.
Wisse et al. proposed a number of approximately 4 ribbons per fiber for a bisurea polymer with a PCL soft block and a butylene-spaced bisurea hard block, based on AFM, solid-state NMR and SAXS measurements.21,22 In their AFM measurements the hard block crystallites showed up as fibers with similar width and height (Figure 2.3d). This would imply that using a longer spacer between the bisurea units leads to the formation of crystallites with more ribbons per stack, which increases the thickness of the fiber. However, SAXS data reported by Das et al. on polymers with different types of hard blocks suggests that not only the length, but also the molecular structure of the hard block determines the interdomain spacing (d-spacing).19 Furthermore, increasing the length of the soft block was shown to lead to an increase in d-spacing.13,18 In this chapter, the stacking of bisurea ribbons into fibers of four different pTHF-bisurea polymers (Figure 2.5) is studied in more detail. The polymers have a soft block of approximately 1100 g/mol (pTHF1100) or 2000 g/mol (pTHF2000), and the hard block is varied by changing the distances between the urea groups, using linear butylene (U4U), hexylene (U6U) or heptylene (U7U) spacers.
Figure 2.5: pTHF-bisurea polymers used in this chapter, varying in the soft block length and the distance between the urea units in the hard block.
Nanofibrous Morphology of pTHF-bisurea Thermoplastic Elastomers
21
The self-assembly of the bisurea hard block domains into single fibers on different substrates is studied by using transmission electron microscopy (TEM), scanning electron microscopy (SEM) and atomic force microscopy (AFM). Wide-angle X-ray diffraction (WAXD) and small-angle X-ray scattering (SAXS) measurements are used to study the self-assembly behaviour of the bisurea hard block domains in bulk polymer samples.
2.2 Results
Synthesis
pTHF-bisurea polymers were synthesized using a procedure described in literature (Scheme 2.1).9 In short, bisamine terminated pTHF with a number average molecular weight (Mn) of 2000 g/mol was synthesized by a Michael addition of acrylonitrile to the hydroxyl end groups of pTHF, and subsequent hydrogenation. Bisamine terminated pTHF with a Mn of 1100 g/mol was commercially available. In the last step, alkyl diisocyanate was added dropwise to bisamine terminated pTHF to obtain high-molecular weight pTHF-bisurea, which was precipitated in heptane.
Scheme 2.1: Synthesis of bisamine-terminated pTHF prepolymer and TPE pTHF-bisurea.
To obtain more information about the cross-sectional dimensions of the fibers, transmission electron microscopy (TEM) and atomic force microscopy (AFM) were used. To increase the contrast in the TEM images between the hard block and the soft block, a bisurea guest with iodine groups was designed. Based on results from literature,23,24 this guest is expected to be incorporated into the hard block fibers of a pTHF-bisurea polymer with the same bisurea moiety, thereby increasing the electron density of the hard block.
Scheme 2.2: Synthesis of iodine bisurea guest 6.
Chapter 2
22
The iodine bisurea guest 6 was synthesized according to Scheme 2.2.25 N-(6-bromohexyl)-phthalimide was converted into 6-iodohexan-1-aminium iodide 5 using a procedure described in literature26 and subsequently reacted with 1,7-diisocyanatoheptane, obtained via treatment of 1,7-diaminoheptane with di-tert-butyltricarbonate.27 Preparation of Single Fiber Samples for Transmission Electron Microscopy
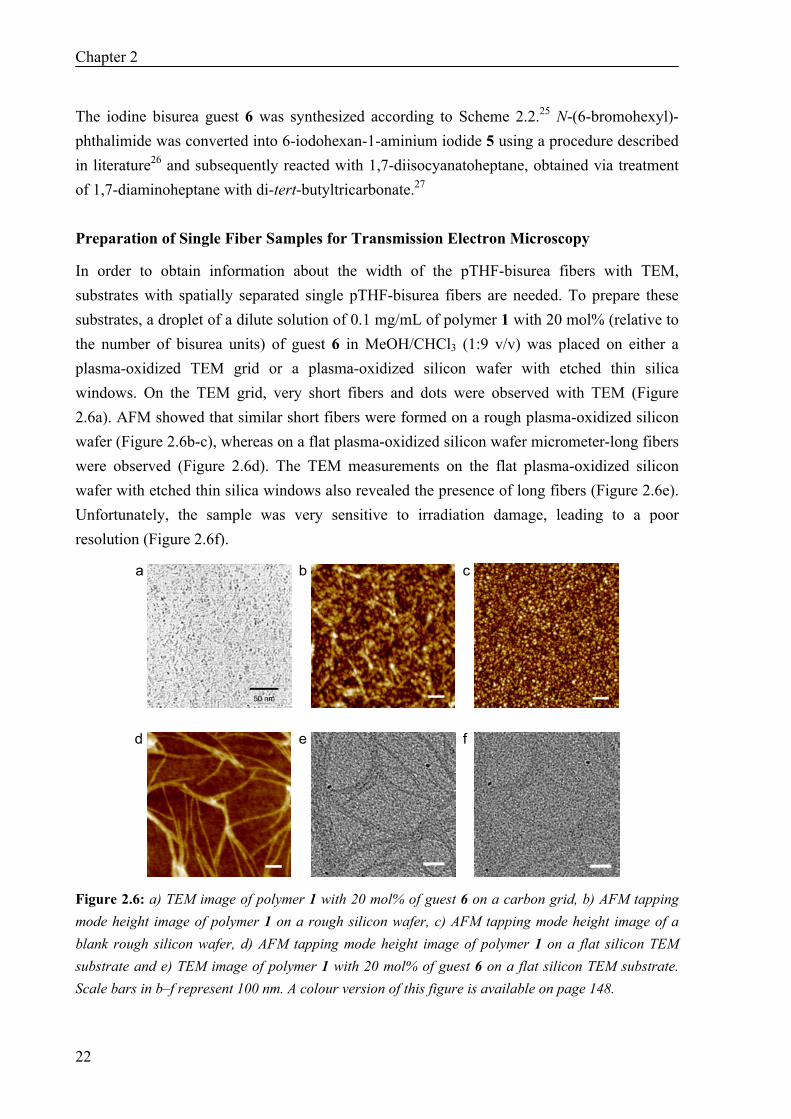
In order to obtain information about the width of the pTHF-bisurea fibers with TEM, substrates with spatially separated single pTHF-bisurea fibers are needed. To prepare these substrates, a droplet of a dilute solution of 0.1 mg/mL of polymer 1 with 20 mol% (relative to the number of bisurea units) of guest 6 in MeOH/CHCl3 (1:9 v/v) was placed on either a plasma-oxidized TEM grid or a plasma-oxidized silicon wafer with etched thin silica windows. On the TEM grid, very short fibers and dots were observed with TEM (Figure 2.6a). AFM showed that similar short fibers were formed on a rough plasma-oxidized silicon wafer (Figure 2.6b-c), whereas on a flat plasma-oxidized silicon wafer micrometer-long fibers were observed (Figure 2.6d). The TEM measurements on the flat plasma-oxidized silicon wafer with etched thin silica windows also revealed the presence of long fibers (Figure 2.6e). Unfortunately, the sample was very sensitive to irradiation damage, leading to a poor resolution (Figure 2.6f).
a
b
c
d
e
f
Figure 2.6: a) TEM image of polymer 1 with 20 mol% of guest 6 on a carbon grid, b) AFM tapping mode height image of polymer 1 on a rough silicon wafer, c) AFM tapping mode height image of a blank rough silicon wafer, d) AFM tapping mode height image of polymer 1 on a flat silicon TEM substrate and e) TEM image of polymer 1 with 20 mol% of guest 6 on a flat silicon TEM substrate. Scale bars in b–f represent 100 nm. A colour version of this figure is available on page 148.
Nanofibrous Morphology of pTHF-bisurea Thermoplastic Elastomers
23
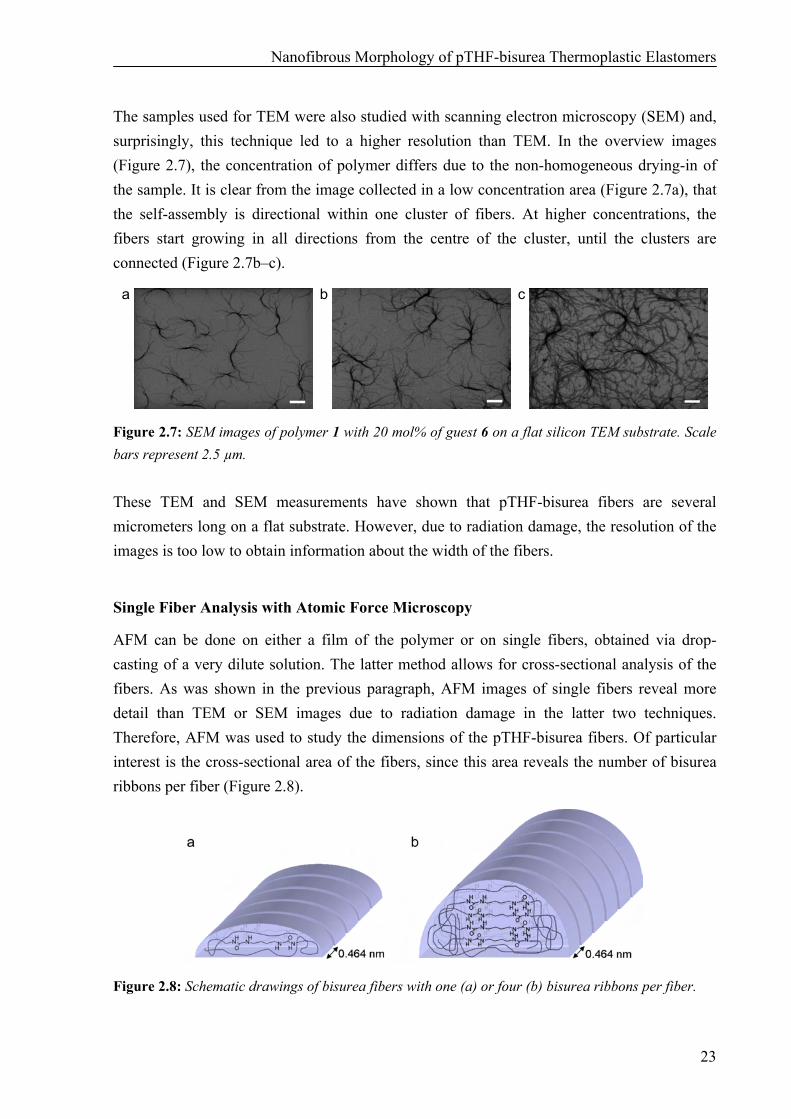
The samples used for TEM were also studied with scanning electron microscopy (SEM) and, surprisingly, this technique led to a higher resolution than TEM. In the overview images (Figure 2.7), the concentration of polymer differs due to the non-homogeneous drying-in of the sample. It is clear from the image collected in a low concentration area (Figure 2.7a), that the self-assembly is directional within one cluster of fibers. At higher concentrations, the fibers start growing in all directions from the centre of the cluster, until the clusters are connected (Figure 2.7b–c).
a
b
c
Figure 2.7: SEM images of polymer 1 with 20 mol% of guest 6 on a flat silicon TEM substrate. Scale bars represent 2.5 µm. These TEM and SEM measurements have shown that pTHF-bisurea fibers are several micrometers long on a flat substrate. However, due to radiation damage, the resolution of the images is too low to obtain information about the width of the fibers.
Single Fiber Analysis with Atomic Force Microscopy
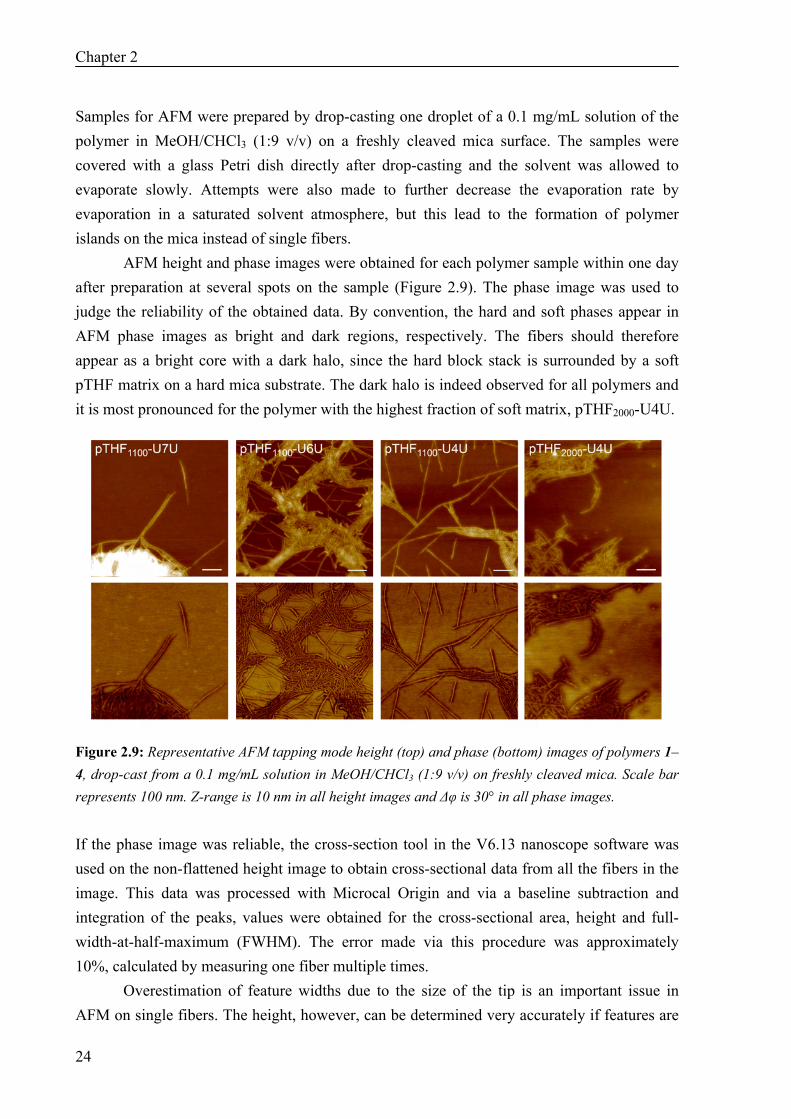
AFM can be done on either a film of the polymer or on single fibers, obtained via drop-casting of a very dilute solution. The latter method allows for cross-sectional analysis of the fibers. As was shown in the previous paragraph, AFM images of single fibers reveal more detail than TEM or SEM images due to radiation damage in the latter two techniques. Therefore, AFM was used to study the dimensions of the pTHF-bisurea fibers. Of particular interest is the cross-sectional area of the fibers, since this area reveals the number of bisurea ribbons per fiber (Figure 2.8).
Figure 2.8: Schematic drawings of bisurea fibers with one (a) or four (b) bisurea ribbons per fiber.
Chapter 2
24
Samples for AFM were prepared by drop-casting one droplet of a 0.1 mg/mL solution of the polymer in MeOH/CHCl3 (1:9 v/v) on a freshly cleaved mica surface. The samples were covered with a glass Petri dish directly after drop-casting and the solvent was allowed to evaporate slowly. Attempts were also made to further decrease the evaporation rate by evaporation in a saturated solvent atmosphere, but this lead to the formation of polymer islands on the mica instead of single fibers.
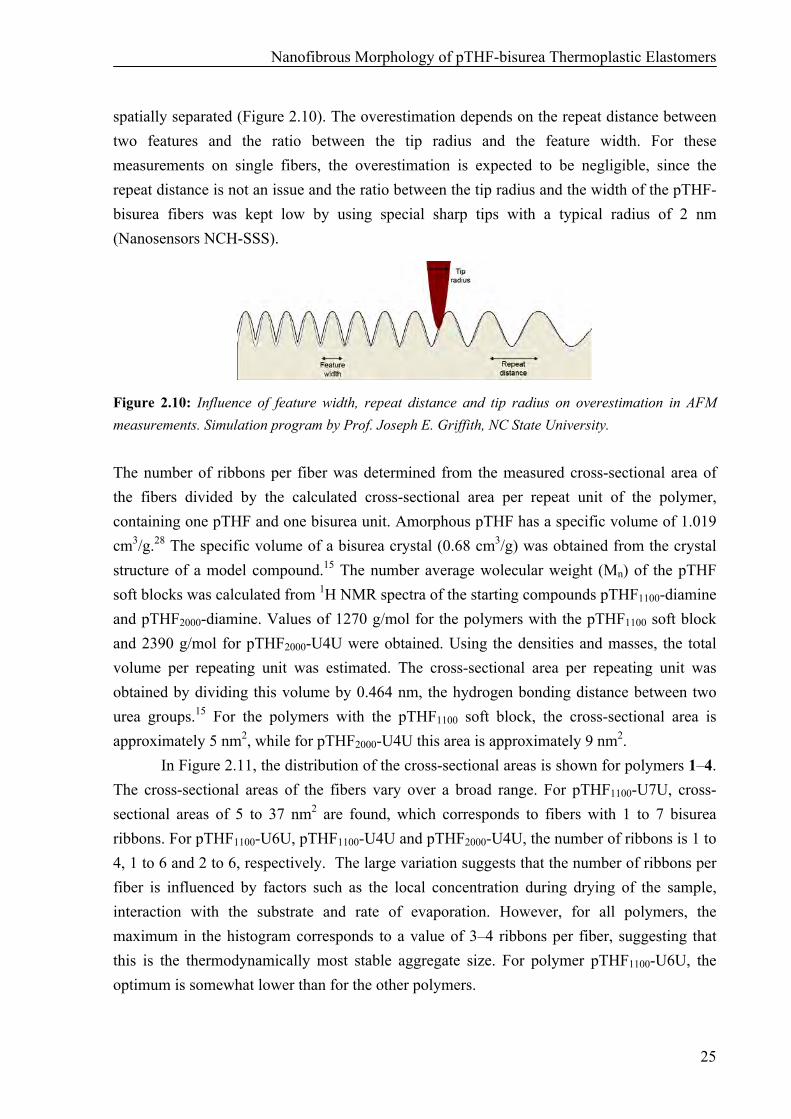
AFM height and phase images were obtained for each polymer sample within one day after preparation at several spots on the sample (Figure 2.9). The phase image was used to judge the reliability of the obtained data. By convention, the hard and soft phases appear in AFM phase images as bright and dark regions, respectively. The fibers should therefore appear as a bright core with a dark halo, since the hard block stack is surrounded by a soft pTHF matrix on a hard mica substrate. The dark halo is indeed observed for all polymers and it is most pronounced for the polymer with the highest fraction of soft matrix, pTHF2000-U4U.
Figure 2.9: Representative AFM tapping mode height (top) and phase (bottom) images of polymers 1–4, drop-cast from a 0.1 mg/mL solution in MeOH/CHCl3 (1:9 v/v) on freshly cleaved mica. Scale bar represents 100 nm. Z-range is 10 nm in all height images and Δφ is 30° in all phase images. If the phase image was reliable, the cross-section tool in the V6.13 nanoscope software was used on the non-flattened height image to obtain cross-sectional data from all the fibers in the image. This data was processed with Microcal Origin and via a baseline subtraction and integration of the peaks, values were obtained for the cross-sectional area, height and full-width-at-half-maximum (FWHM). The error made via this procedure was approximately 10%, calculated by measuring one fiber multiple times.
Overestimation of feature widths due to the size of the tip is an important issue in AFM on single fibers. The height, however, can be determined very accurately if features are
Nanofibrous Morphology of pTHF-bisurea Thermoplastic Elastomers
25
spatially separated (Figure 2.10). The overestimation depends on the repeat distance between two features and the ratio between the tip radius and the feature width. For these measurements on single fibers, the overestimation is expected to be negligible, since the repeat distance is not an issue and the ratio between the tip radius and the width of the pTHF-bisurea fibers was kept low by using special sharp tips with a typical radius of 2 nm (Nanosensors NCH-SSS).
Figure 2.10: Influence of feature width, repeat distance and tip radius on overestimation in AFM measurements. Simulation program by Prof. Joseph E. Griffith, NC State University. The number of ribbons per fiber was determined from the measured cross-sectional area of the fibers divided by the calculated cross-sectional area per repeat unit of the polymer, containing one pTHF and one bisurea unit. Amorphous pTHF has a specific volume of 1.019 cm3/g.28 The specific volume of a bisurea crystal (0.68 cm3/g) was obtained from the crystal structure of a model compound.15 The number average wolecular weight (Mn) of the pTHF soft blocks was calculated from 1H NMR spectra of the starting compounds pTHF1100-diamine and pTHF2000-diamine. Values of 1270 g/mol for the polymers with the pTHF1100 soft block and 2390 g/mol for pTHF2000-U4U were obtained. Using the densities and masses, the total volume per repeating unit was estimated. The cross-sectional area per repeating unit was obtained by dividing this volume by 0.464 nm, the hydrogen bonding distance between two urea groups.15 For the polymers with the pTHF1100 soft block, the cross-sectional area is approximately 5 nm2, while for pTHF2000-U4U this area is approximately 9 nm2.
In Figure 2.11, the distribution of the cross-sectional areas is shown for polymers 1–4. The cross-sectional areas of the fibers vary over a broad range. For pTHF1100-U7U, cross-sectional areas of 5 to 37 nm2 are found, which corresponds to fibers with 1 to 7 bisurea ribbons. For pTHF1100-U6U, pTHF1100-U4U and pTHF2000-U4U, the number of ribbons is 1 to 4, 1 to 6 and 2 to 6, respectively. The large variation suggests that the number of ribbons per fiber is influenced by factors such as the local concentration during drying of the sample, interaction with the substrate and rate of evaporation. However, for all polymers, the maximum in the histogram corresponds to a value of 3–4 ribbons per fiber, suggesting that this is the thermodynamically most stable aggregate size. For polymer pTHF1100-U6U, the optimum is somewhat lower than for the other polymers.
Chapter 2
26
0 5 10 15 20 25 30 35 40 45 500
2
4
6
8pTHF1100-U7U
Cross-sectional area (nm2)0 5 10 15 20 25 30 35 40 45 50
0
5
10
15
pTHF1100-U6U
Cross-sectional area (nm2)0 5 10 15 20 25 30 35 40 45 50
0
5
10
15 pTHF1100-U4U
Cross-sectional area (nm2)0 5 10 15 20 25 30 35 40 45 50
0
2
4
6pTHF2000-U4U
Cross-sectional area (nm2)
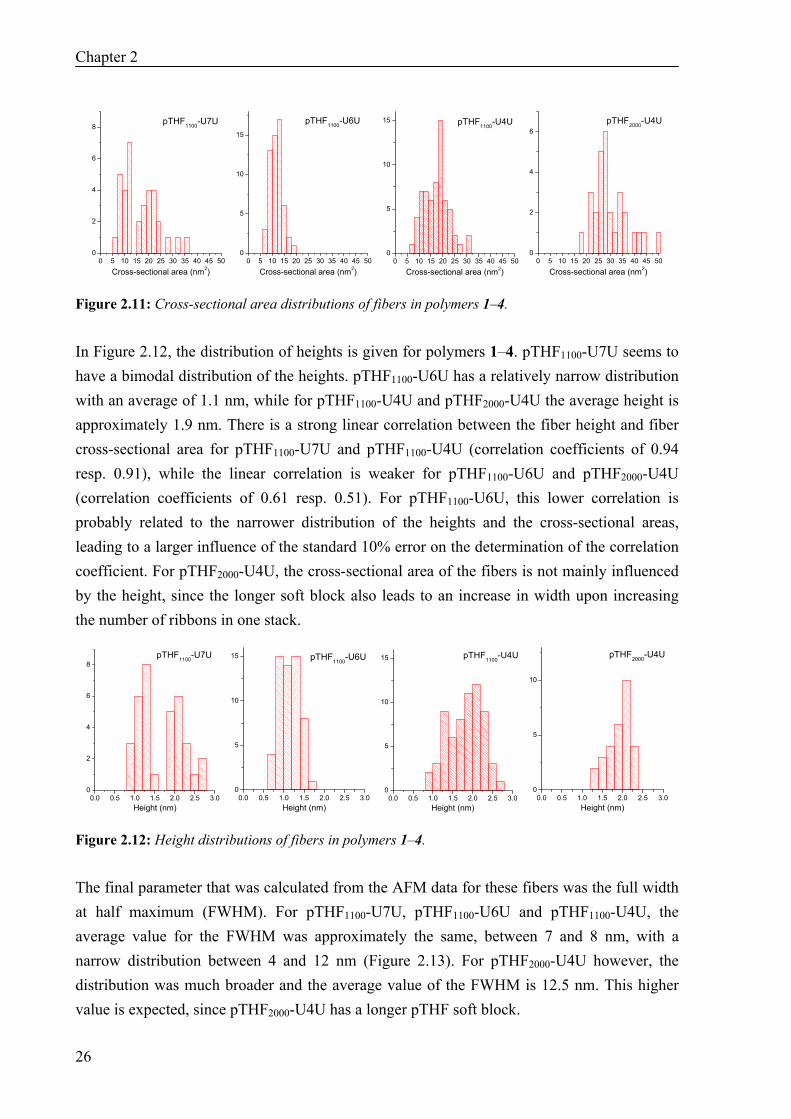
Figure 2.11: Cross-sectional area distributions of fibers in polymers 1–4. In Figure 2.12, the distribution of heights is given for polymers 1–4. pTHF1100-U7U seems to have a bimodal distribution of the heights. pTHF1100-U6U has a relatively narrow distribution with an average of 1.1 nm, while for pTHF1100-U4U and pTHF2000-U4U the average height is approximately 1.9 nm. There is a strong linear correlation between the fiber height and fiber cross-sectional area for pTHF1100-U7U and pTHF1100-U4U (correlation coefficients of 0.94 resp. 0.91), while the linear correlation is weaker for pTHF1100-U6U and pTHF2000-U4U (correlation coefficients of 0.61 resp. 0.51). For pTHF1100-U6U, this lower correlation is probably related to the narrower distribution of the heights and the cross-sectional areas, leading to a larger influence of the standard 10% error on the determination of the correlation coefficient. For pTHF2000-U4U, the cross-sectional area of the fibers is not mainly influenced by the height, since the longer soft block also leads to an increase in width upon increasing the number of ribbons in one stack.
0.0 0.5 1.0 1.5 2.0 2.5 3.00
2
4
6
8pTHF1100-U7U
Height (nm)0.0 0.5 1.0 1.5 2.0 2.5 3.0
0
5
10
15 pTHF1100-U6U
Height (nm)0.0 0.5 1.0 1.5 2.0 2.5 3.0
0
5
10
15 pTHF1100-U4U
Height (nm)0.0 0.5 1.0 1.5 2.0 2.5 3.0
0
5
10
pTHF2000-U4U
Height (nm)
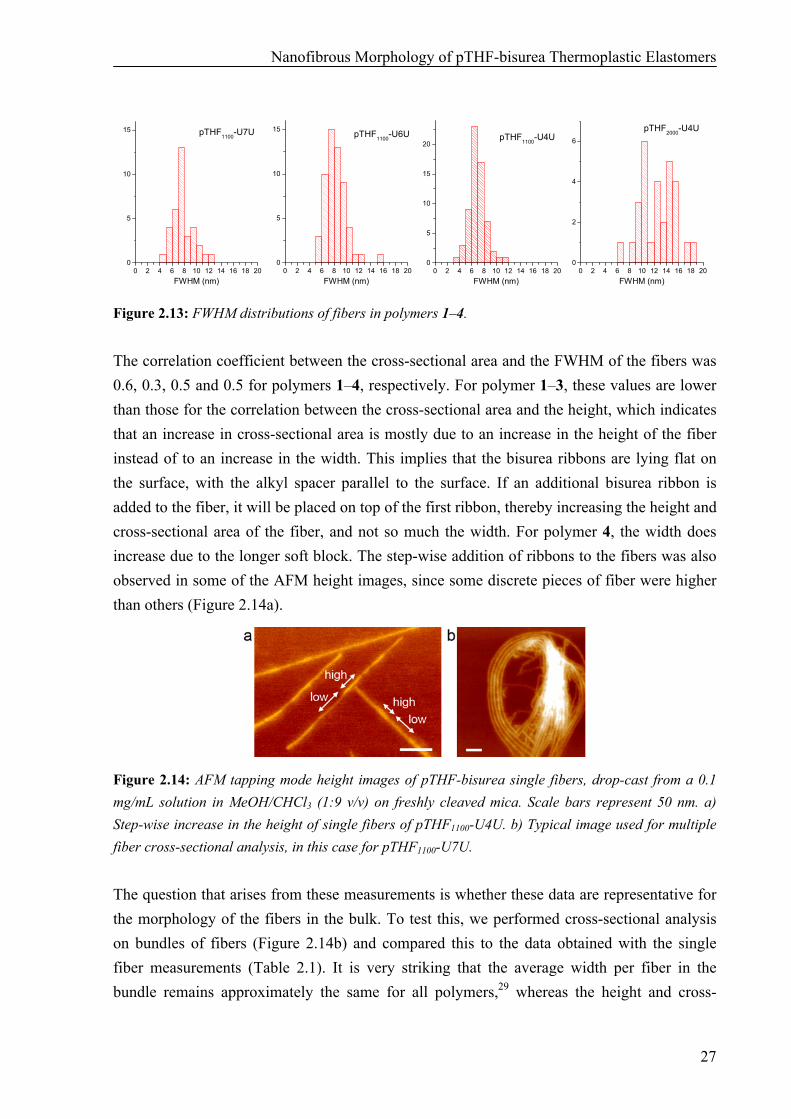
Figure 2.12: Height distributions of fibers in polymers 1–4. The final parameter that was calculated from the AFM data for these fibers was the full width at half maximum (FWHM). For pTHF1100-U7U, pTHF1100-U6U and pTHF1100-U4U, the average value for the FWHM was approximately the same, between 7 and 8 nm, with a narrow distribution between 4 and 12 nm (Figure 2.13). For pTHF2000-U4U however, the distribution was much broader and the average value of the FWHM is 12.5 nm. This higher value is expected, since pTHF2000-U4U has a longer pTHF soft block.
Nanofibrous Morphology of pTHF-bisurea Thermoplastic Elastomers
27
0 2 4 6 8 10 12 14 16 18 200
5
10
15 pTHF1100-U7U
FWHM (nm)0 2 4 6 8 10 12 14 16 18 20
0
5
10
15 pTHF1100-U6U
FWHM (nm)0 2 4 6 8 10 12 14 16 18 20
0
5
10
15
20pTHF1100-U4U
FWHM (nm)0 2 4 6 8 10 12 14 16 18 20
0
2
4
6
pTHF2000-U4U
FWHM (nm)
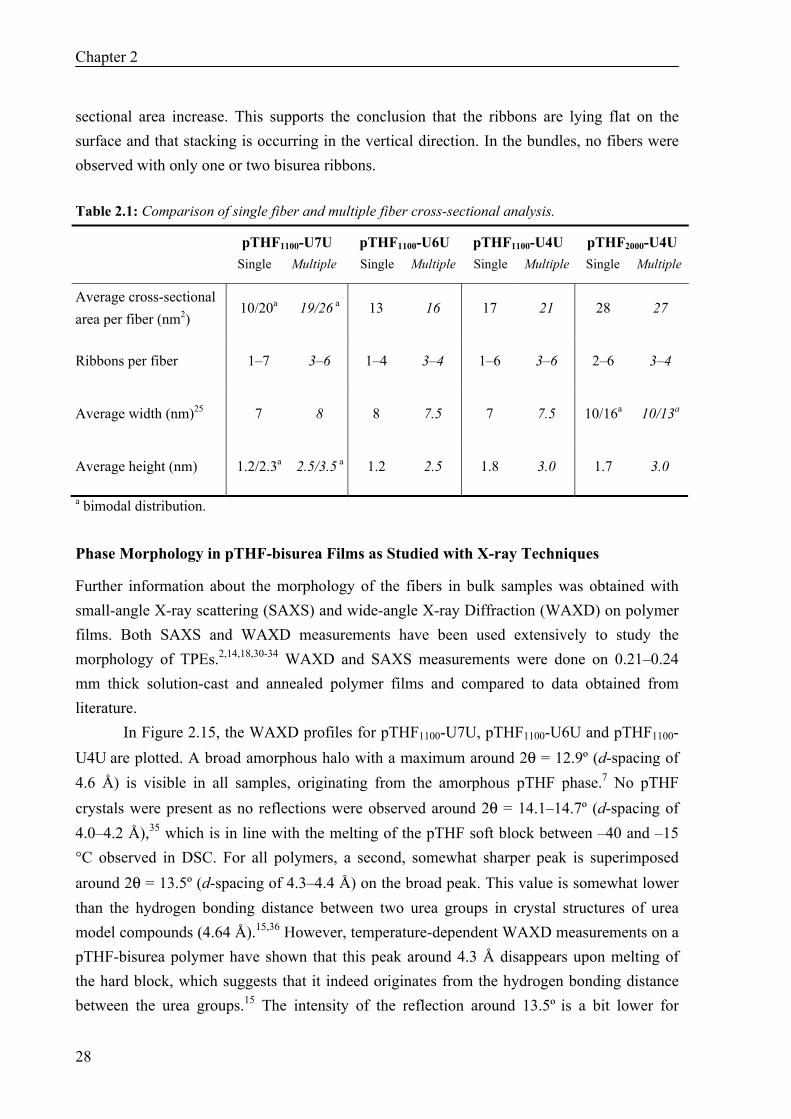
Figure 2.13: FWHM distributions of fibers in polymers 1–4. The correlation coefficient between the cross-sectional area and the FWHM of the fibers was 0.6, 0.3, 0.5 and 0.5 for polymers 1–4, respectively. For polymer 1–3, these values are lower than those for the correlation between the cross-sectional area and the height, which indicates that an increase in cross-sectional area is mostly due to an increase in the height of the fiber instead of to an increase in the width. This implies that the bisurea ribbons are lying flat on the surface, with the alkyl spacer parallel to the surface. If an additional bisurea ribbon is added to the fiber, it will be placed on top of the first ribbon, thereby increasing the height and cross-sectional area of the fiber, and not so much the width. For polymer 4, the width does increase due to the longer soft block. The step-wise addition of ribbons to the fibers was also observed in some of the AFM height images, since some discrete pieces of fiber were higher than others (Figure 2.14a).
Figure 2.14: AFM tapping mode height images of pTHF-bisurea single fibers, drop-cast from a 0.1 mg/mL solution in MeOH/CHCl3 (1:9 v/v) on freshly cleaved mica. Scale bars represent 50 nm. a) Step-wise increase in the height of single fibers of pTHF1100-U4U. b) Typical image used for multiple fiber cross-sectional analysis, in this case for pTHF1100-U7U. The question that arises from these measurements is whether these data are representative for the morphology of the fibers in the bulk. To test this, we performed cross-sectional analysis on bundles of fibers (Figure 2.14b) and compared this to the data obtained with the single fiber measurements (Table 2.1). It is very striking that the average width per fiber in the bundle remains approximately the same for all polymers,29 whereas the height and cross-
Chapter 2
28
sectional area increase. This supports the conclusion that the ribbons are lying flat on the surface and that stacking is occurring in the vertical direction. In the bundles, no fibers were observed with only one or two bisurea ribbons. Table 2.1: Comparison of single fiber and multiple fiber cross-sectional analysis.
pTHF1100-U7U
Single Multiple pTHF1100-U6U
Single MultiplepTHF1100-U4U
Single Multiple pTHF2000-U4U
Single Multiple
Average cross-sectional area per fiber (nm2)
10/20a 19/26 a 13 16 17 21 28 27
Ribbons per fiber 1–7 3–6 1–4 3–4 1–6 3–6 2–6 3–4
Average width (nm)25 7 8 8 7.5 7 7.5 10/16a 10/13a
Average height (nm) 1.2/2.3a 2.5/3.5 a 1.2 2.5 1.8 3.0 1.7 3.0
a bimodal distribution. Phase Morphology in pTHF-bisurea Films as Studied with X-ray Techniques
Further information about the morphology of the fibers in bulk samples was obtained with small-angle X-ray scattering (SAXS) and wide-angle X-ray Diffraction (WAXD) on polymer films. Both SAXS and WAXD measurements have been used extensively to study the morphology of TPEs.2,14,18,30-34 WAXD and SAXS measurements were done on 0.21–0.24 mm thick solution-cast and annealed polymer films and compared to data obtained from literature.
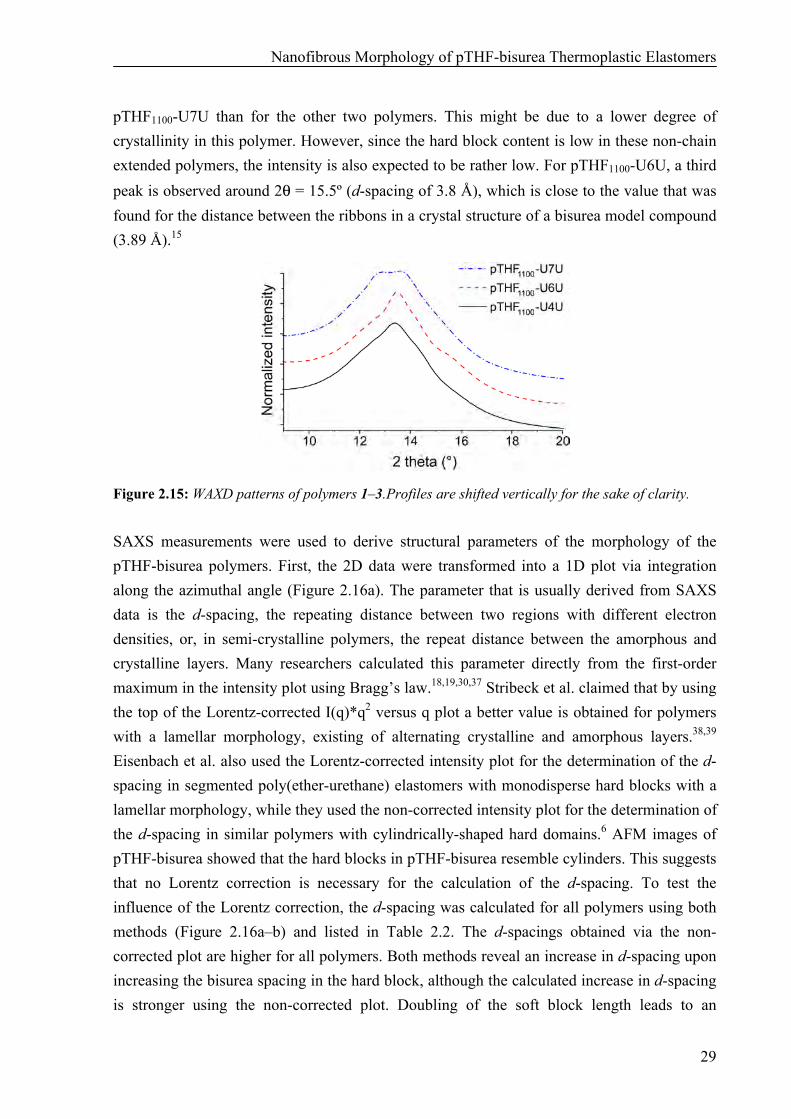
In Figure 2.15, the WAXD profiles for pTHF1100-U7U, pTHF1100-U6U and pTHF1100-U4U are plotted. A broad amorphous halo with a maximum around 2θ = 12.9º (d-spacing of 4.6 Å) is visible in all samples, originating from the amorphous pTHF phase.7 No pTHF crystals were present as no reflections were observed around 2θ = 14.1–14.7º (d-spacing of 4.0–4.2 Å),35 which is in line with the melting of the pTHF soft block between –40 and –15 °C observed in DSC. For all polymers, a second, somewhat sharper peak is superimposed around 2θ = 13.5º (d-spacing of 4.3–4.4 Å) on the broad peak. This value is somewhat lower than the hydrogen bonding distance between two urea groups in crystal structures of urea model compounds (4.64 Å).15,36 However, temperature-dependent WAXD measurements on a pTHF-bisurea polymer have shown that this peak around 4.3 Å disappears upon melting of the hard block, which suggests that it indeed originates from the hydrogen bonding distance between the urea groups.15 The intensity of the reflection around 13.5º is a bit lower for
Nanofibrous Morphology of pTHF-bisurea Thermoplastic Elastomers
29
pTHF1100-U7U than for the other two polymers. This might be due to a lower degree of crystallinity in this polymer. However, since the hard block content is low in these non-chain extended polymers, the intensity is also expected to be rather low. For pTHF1100-U6U, a third peak is observed around 2θ = 15.5º (d-spacing of 3.8 Å), which is close to the value that was found for the distance between the ribbons in a crystal structure of a bisurea model compound (3.89 Å).15
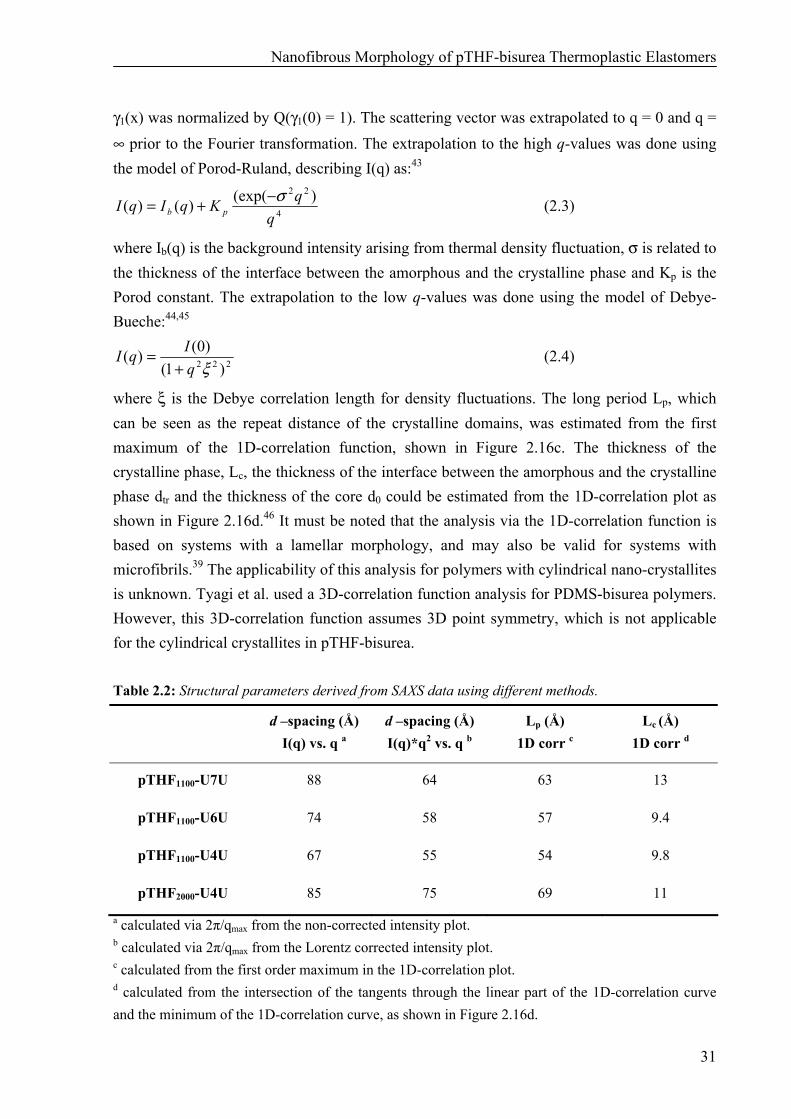
Figure 2.15: WAXD patterns of polymers 1–3.Profiles are shifted vertically for the sake of clarity. SAXS measurements were used to derive structural parameters of the morphology of the pTHF-bisurea polymers. First, the 2D data were transformed into a 1D plot via integration along the azimuthal angle (Figure 2.16a). The parameter that is usually derived from SAXS data is the d-spacing, the repeating distance between two regions with different electron densities, or, in semi-crystalline polymers, the repeat distance between the amorphous and crystalline layers. Many researchers calculated this parameter directly from the first-order maximum in the intensity plot using Bragg’s law.18,19,30,37 Stribeck et al. claimed that by using the top of the Lorentz-corrected I(q)*q2 versus q plot a better value is obtained for polymers with a lamellar morphology, existing of alternating crystalline and amorphous layers.38,39 Eisenbach et al. also used the Lorentz-corrected intensity plot for the determination of the d-spacing in segmented poly(ether-urethane) elastomers with monodisperse hard blocks with a lamellar morphology, while they used the non-corrected intensity plot for the determination of the d-spacing in similar polymers with cylindrically-shaped hard domains.6 AFM images of pTHF-bisurea showed that the hard blocks in pTHF-bisurea resemble cylinders. This suggests that no Lorentz correction is necessary for the calculation of the d-spacing. To test the influence of the Lorentz correction, the d-spacing was calculated for all polymers using both methods (Figure 2.16a–b) and listed in Table 2.2. The d-spacings obtained via the non-corrected plot are higher for all polymers. Both methods reveal an increase in d-spacing upon increasing the bisurea spacing in the hard block, although the calculated increase in d-spacing is stronger using the non-corrected plot. Doubling of the soft block length leads to an
Chapter 2
30
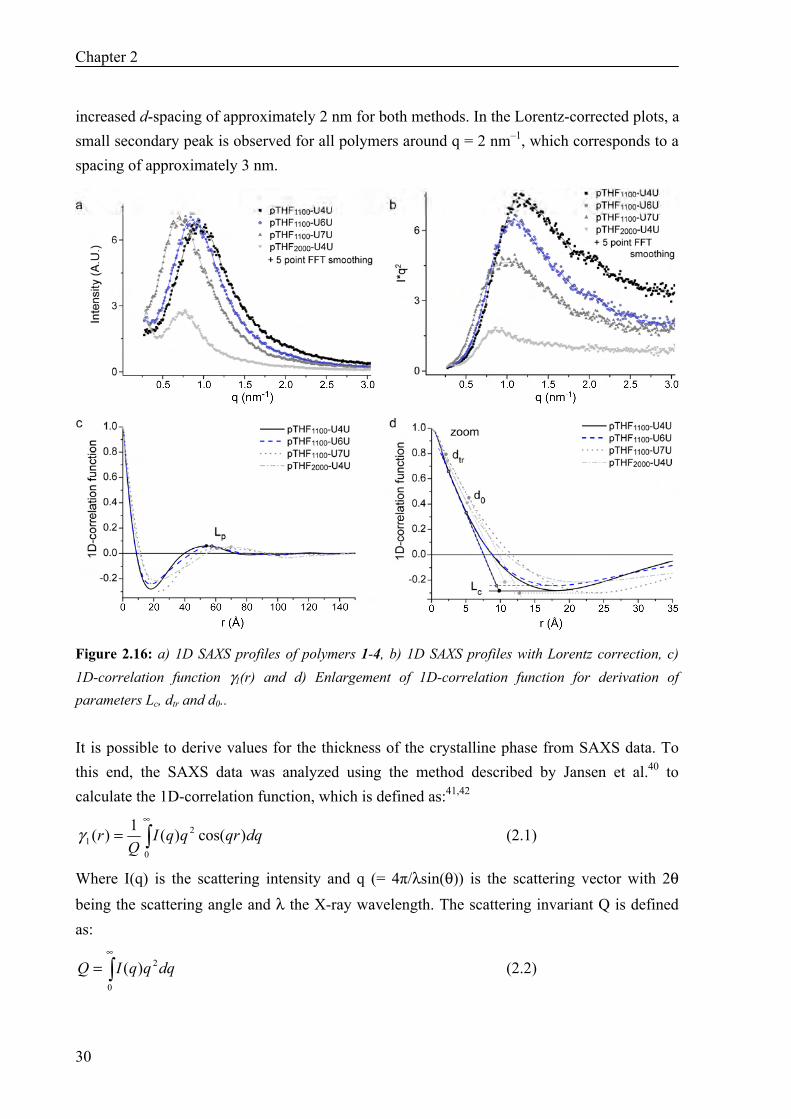
increased d-spacing of approximately 2 nm for both methods. In the Lorentz-corrected plots, a small secondary peak is observed for all polymers around q = 2 nm–1, which corresponds to a spacing of approximately 3 nm.
Figure 2.16: a) 1D SAXS profiles of polymers 1-4, b) 1D SAXS profiles with Lorentz correction, c) 1D-correlation function γ1(r) and d) Enlargement of 1D-correlation function for derivation of parameters Lc, dtr and d0.. It is possible to derive values for the thickness of the crystalline phase from SAXS data. To this end, the SAXS data was analyzed using the method described by Jansen et al.40 to calculate the 1D-correlation function, which is defined as:41,42
∫∞
=0
21 )cos()(1)( dqqrqqI
Qrγ (2.1)
Where I(q) is the scattering intensity and q (= 4π/λsin(θ)) is the scattering vector with 2θ being the scattering angle and λ the X-ray wavelength. The scattering invariant Q is defined as:
∫∞
=0
2)( dqqqIQ (2.2)
Nanofibrous Morphology of pTHF-bisurea Thermoplastic Elastomers
31
γ1(x) was normalized by Q(γ1(0) = 1). The scattering vector was extrapolated to q = 0 and q = ∞ prior to the Fourier transformation. The extrapolation to the high q-values was done using the model of Porod-Ruland, describing I(q) as:43
4
22 )(exp()()(q
qKqIqI pbσ−+= (2.3)
where Ib(q) is the background intensity arising from thermal density fluctuation, σ is related to the thickness of the interface between the amorphous and the crystalline phase and Kp is the Porod constant. The extrapolation to the low q-values was done using the model of Debye-Bueche:44,45
222 )1()0()(ξq
IqI+
= (2.4)
where ξ is the Debye correlation length for density fluctuations. The long period Lp, which can be seen as the repeat distance of the crystalline domains, was estimated from the first maximum of the 1D-correlation function, shown in Figure 2.16c. The thickness of the crystalline phase, Lc, the thickness of the interface between the amorphous and the crystalline phase dtr and the thickness of the core d0 could be estimated from the 1D-correlation plot as shown in Figure 2.16d.46 It must be noted that the analysis via the 1D-correlation function is based on systems with a lamellar morphology, and may also be valid for systems with microfibrils.39 The applicability of this analysis for polymers with cylindrical nano-crystallites is unknown. Tyagi et al. used a 3D-correlation function analysis for PDMS-bisurea polymers. However, this 3D-correlation function assumes 3D point symmetry, which is not applicable for the cylindrical crystallites in pTHF-bisurea. Table 2.2: Structural parameters derived from SAXS data using different methods.
d –spacing (Å)
I(q) vs. q a
d –spacing (Å) I(q)*q2 vs. q b
Lp (Å) 1D corr c
Lc (Å) 1D corr d
pTHF1100-U7U 88 64 63 13
pTHF1100-U6U 74 58 57 9.4
pTHF1100-U4U 67 55 54 9.8
pTHF2000-U4U 85 75 69 11
a calculated via 2π/qmax from the non-corrected intensity plot. b calculated via 2π/qmax from the Lorentz corrected intensity plot. c calculated from the first order maximum in the 1D-correlation plot. d calculated from the intersection of the tangents through the linear part of the 1D-correlation curve and the minimum of the 1D-correlation curve, as shown in Figure 2.16d.
Chapter 2
32
In Table 2.2, all data obtained with the different SAXS analysis methods are listed. It is clear that for the d-spacing, or Lp, the trend is the same for all methods: the Lp increases with an increase in soft block length or with an increase in the alkyl spacing between the urea groups. The values found for the thickness of the crystalline phase via the 1D-correlation function correspond well with the calculated values from the crystal structures of model compounds,23 being 10.8 Å for a butylene spaced bisurea and 14.5 Å for a heptylene spaced bisurea. Surprisingly, the estimated Lc of pTHF1100-U6U is lower than the Lc of pTHF1100-U4U and pTHF2000-U4U.
2.3 Discussion and Conclusions
In this chapter, the formation of pTHF-bisurea fibers on different substrates was investigated with TEM, SEM and AFM. Micrometer long fibers were formed and observed on mica and flat silicon wafer, but not on rough substrates.
Cross-sectional analysis on AFM height images of single fibers of pTHF-bisurea polymers with different soft block and hard block lengths has given more insight into the stacking of hydrogen-bonded bisurea ribbons into fibers. A preference to form fibers with 3-4 ribbons was found for all polymers, either for measurements on single fibers or for measurements on bundles of fibers. However, in the measurements on single fibers, also single ribbons were found on the surface, which were not observed in the bundle measurements. This indicates that the surface measurements are not fully representative for the bulk.
SAXS measurements showed that the d-spacing increased with an increase in soft block length, which was also observed by Tyagi13 and Das.18 Furthermore an increase in d-spacing with 10 to 20 Å (depending on the analysis technique used) was observed when the alkyl spacing between the urea groups was changed from butylene to heptylene, while the soft block length was kept constant. However, this increase in d-spacing with an increase in alkyl spacing was not expected, since the thickness of the crystallite has only a limited influence on the d-spacing. The d-spacing is influenced by many factors, such as the degree of phase separation, the interface thickness and the number of ribbons that are stacked into one fiber. Since the degree of phase separation and the interface thickness are expected to remain constant upon changing the bisurea spacer length, the increased d-spacing is probably due to an increased number of ribbons per fiber. This supports the conclusion by Wisse et al.47 that the number of ribbons in one fiber is determined by the width of the crystalline phase. However, this trend was not observed in the AFM data.
Das et al. reported a d-spacing of 80 Å for pTHF1100-U6U, which is higher than the value reported here.19 This might be due to differences in either synthesis and workup procedure of the polymer (no precipitation in heptane) or preparation of the polymer film
Nanofibrous Morphology of pTHF-bisurea Thermoplastic Elastomers
33
(different annealing temperature). Versteegen et al. reported a value of 60 Å for the d-spacing of pTHF1100-U4U, calculated from the maximum in the Lorentz corrected plot. The differences in the observed values indicate the sensitivity of these measurements towards differences in polymer batches or sample preparation.
In conclusion, self-assembly of bisurea hard blocks into micrometer long fibers was observed with TEM, SEM and AFM. AFM cross-sectional analysis revealed the stacking of approximately 3–4 bisurea ribbons per pTHF-bisurea fiber. This number could not be verified with SAXS measurements, since no verified model was available to couple the d-spacing to a value for the diameter of non-aligned cylindrical nanofibers.
2.4 Materials and Methods
Materials. All solvents used in the synthesis were A.R. grade and purchased from Biosolve. 1,7-diaminoheptane and bis(3-aminopropyl)-poly(tetrahydrofuran), Mn = 1100 g/mol were purchased from Aldrich and N-(6-bromohexyl)-phthalimide was purchased from ABCR. Etched silicon wafers for TEM measurements were kindly provided by J. Loos, Soft Matter Cryo-TEM Research Unit, Eindhoven University of Technology. Methods. NMR spectra were acquired on a 400 MHz Varian Mercury Vx (400 MHz for 1H-NMR, 100 MHz for 13C-NMR), a 400 MHz Bruker (400 MHz for 1H-NMR, 100 MHz for 13C-NMR) or a 300 MHz Varian Gemini-2000 (300 MHz for 1H-NMR, 75 MHz for 13C-NMR) spectrometer. Proton and Carbon chemical shifts are reported in ppm downfield of tetramethylsilane using the resonance of the deuterated solvent as internal standard. Splitting patterns are designated as singlet (s), doublet (d), triplet (t) and multiplet (m). Infrared spectra were recorded on a Perkin Elmer Spectrum One FT-IR spectrometer with a Universal ATR Sampling Accessory. MALDI-TOF was performed on a PerSeptive Biosystems DE PRO Voyager MALDI-TOF mass spectrometer using cyano-4-hydroxycinnamic acid as the calibration matrix. Scanning electron microscopy images were measured on a Philips XL 30 ESEM-FEG using an acceleration voltage of 1 kV and a secondary electron (SE) detector. Molecular weights of the synthesized polymers were determined by SEC using a poly(styrene) calibrated PL-GPC 120 high temperature chromatograph that was equipped with a PL gel 5 μm Mixed-C column, an autosampler and an RI detector at 80 °C in 1-methyl-2-pyrrolidinone (NMP). All molecular weights were relative to the poly(styrene) standards. Synthesis of 1–6. Polymer 1, pTHF1100-U7U. Polymer 1 was synthesized using a procedure derived from literature.9 In short, 1.3 g (10 mmol) of 1,7-diaminoheptane was dissolved in 5 mL of dry CH2Cl2 and injected under the surface of a vigorously stirring solution of 5.6 g (21 mmol) of di-tert-butyl tricarbonate27 in 120 mL of dry CH2Cl2 under argon. After 30 min, 200 mg (2.5 mmol) of pyridine was added. The reaction mixture was filtered and added dropwise to a solution of 10 g (9.1 mmol) of bis(3-aminopropyl)-poly(tetrahydrofuran), Mn = 1100 g/mol, in 110 mL of CH2Cl2, while monitoring the disappearance of the peak for the CH2 next to the NH2 by 1H NMR. The reaction mixture was precipitated in 800 mL of heptane. Yield = 94% (11 g). IR: ν = 3320, 2934, 2854, 1617, 1579, 1366, 1105. 1H NMR (300
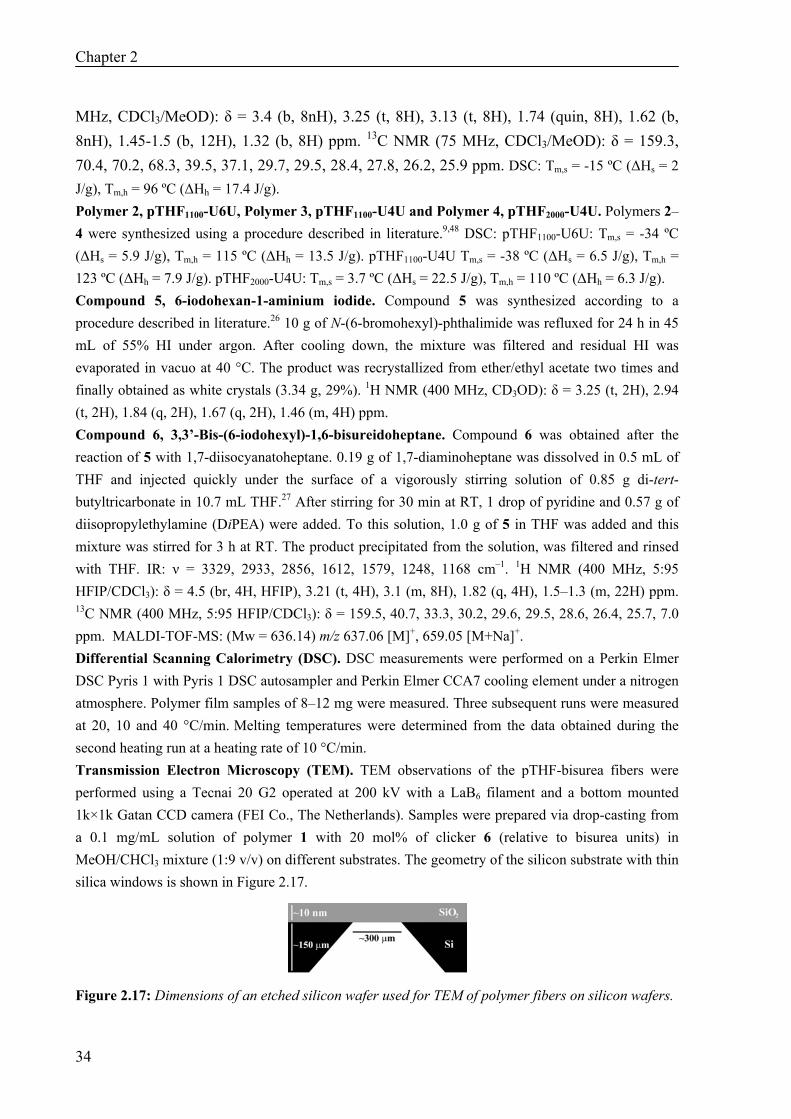
Chapter 2
34
MHz, CDCl3/MeOD): δ = 3.4 (b, 8nH), 3.25 (t, 8H), 3.13 (t, 8H), 1.74 (quin, 8H), 1.62 (b, 8nH), 1.45-1.5 (b, 12H), 1.32 (b, 8H) ppm. 13C NMR (75 MHz, CDCl3/MeOD): δ = 159.3, 70.4, 70.2, 68.3, 39.5, 37.1, 29.7, 29.5, 28.4, 27.8, 26.2, 25.9 ppm. DSC: Tm,s = -15 ºC (ΔHs = 2 J/g), Tm,h = 96 ºC (ΔHh = 17.4 J/g). Polymer 2, pTHF1100-U6U, Polymer 3, pTHF1100-U4U and Polymer 4, pTHF2000-U4U. Polymers 2–4 were synthesized using a procedure described in literature.9,48 DSC: pTHF1100-U6U: Tm,s = -34 ºC (ΔHs = 5.9 J/g), Tm,h = 115 ºC (ΔHh = 13.5 J/g). pTHF1100-U4U Tm,s = -38 ºC (ΔHs = 6.5 J/g), Tm,h = 123 ºC (ΔHh = 7.9 J/g). pTHF2000-U4U: Tm,s = 3.7 ºC (ΔHs = 22.5 J/g), Tm,h = 110 ºC (ΔHh = 6.3 J/g). Compound 5, 6-iodohexan-1-aminium iodide. Compound 5 was synthesized according to a procedure described in literature.26 10 g of N-(6-bromohexyl)-phthalimide was refluxed for 24 h in 45 mL of 55% HI under argon. After cooling down, the mixture was filtered and residual HI was evaporated in vacuo at 40 °C. The product was recrystallized from ether/ethyl acetate two times and finally obtained as white crystals (3.34 g, 29%). 1H NMR (400 MHz, CD3OD): δ = 3.25 (t, 2H), 2.94 (t, 2H), 1.84 (q, 2H), 1.67 (q, 2H), 1.46 (m, 4H) ppm. Compound 6, 3,3’-Bis-(6-iodohexyl)-1,6-bisureidoheptane. Compound 6 was obtained after the reaction of 5 with 1,7-diisocyanatoheptane. 0.19 g of 1,7-diaminoheptane was dissolved in 0.5 mL of THF and injected quickly under the surface of a vigorously stirring solution of 0.85 g di-tert-butyltricarbonate in 10.7 mL THF.27 After stirring for 30 min at RT, 1 drop of pyridine and 0.57 g of diisopropylethylamine (DiPEA) were added. To this solution, 1.0 g of 5 in THF was added and this mixture was stirred for 3 h at RT. The product precipitated from the solution, was filtered and rinsed with THF. IR: ν = 3329, 2933, 2856, 1612, 1579, 1248, 1168 cm–1. 1H NMR (400 MHz, 5:95 HFIP/CDCl3): δ = 4.5 (br, 4H, HFIP), 3.21 (t, 4H), 3.1 (m, 8H), 1.82 (q, 4H), 1.5–1.3 (m, 22H) ppm. 13C NMR (400 MHz, 5:95 HFIP/CDCl3): δ = 159.5, 40.7, 33.3, 30.2, 29.6, 29.5, 28.6, 26.4, 25.7, 7.0 ppm. MALDI-TOF-MS: (Mw = 636.14) m/z 637.06 [M]+, 659.05 [M+Na]+. Differential Scanning Calorimetry (DSC). DSC measurements were performed on a Perkin Elmer DSC Pyris 1 with Pyris 1 DSC autosampler and Perkin Elmer CCA7 cooling element under a nitrogen atmosphere. Polymer film samples of 8–12 mg were measured. Three subsequent runs were measured at 20, 10 and 40 °C/min. Melting temperatures were determined from the data obtained during the second heating run at a heating rate of 10 °C/min. Transmission Electron Microscopy (TEM). TEM observations of the pTHF-bisurea fibers were performed using a Tecnai 20 G2 operated at 200 kV with a LaB6 filament and a bottom mounted 1k×1k Gatan CCD camera (FEI Co., The Netherlands). Samples were prepared via drop-casting from a 0.1 mg/mL solution of polymer 1 with 20 mol% of clicker 6 (relative to bisurea units) in MeOH/CHCl3 mixture (1:9 v/v) on different substrates. The geometry of the silicon substrate with thin silica windows is shown in Figure 2.17.
Figure 2.17: Dimensions of an etched silicon wafer used for TEM of polymer fibers on silicon wafers.
Nanofibrous Morphology of pTHF-bisurea Thermoplastic Elastomers
35
The samples were enclosed in covered Petri dishes and kept at room temperature until the samples were dry. All substrates were subjected to an oxygen plasma treatment prior to drop-casting. Atomic Force Microscopy (AFM). AFM images were recorded using a Multimode Nanoscope IV (Digital Instruments, Inc. Santa Barbara, California, now Veeco). The microscope was operated in the tapping (or intermittent contact) mode using silicon cantilever tips (Nanosensors, PPP-NCH, frequency 204–497 kHz, force constant 10–130 N/m or SSS-NCH, frequency 273–320 kHz, spring constant 22–35 N/m, typical tip radius 2 nm). A scan rate of 1 Hz with 1024 samples per line and a scan angle of 90° were used. The RMS free oscillation amplitude was set to 2.0 V and the offset for autotuning was 15%. The operating setpoint ratio (Asp/A0) was set to approximately 0.9. Integral and proportional gains were optimized for each sample. All images were subjected to a first-order plane-fitting procedure to compensate for sample tilt. Single fibers samples: Approximately 20 µL of a solution of 0.1 mg/mL in MeOH/CHCl3 (1:9 v/v) was placed onto the surface of a freshly cleaved mica disk. The samples were enclosed in covered Petri dishes and kept at room temperature until the samples were dry. Wide-angle X-ray Diffraction (WAXD) and Small-angle X-ray Scattering (SAXS). WAXD and SAXS experiments were performed at the DUBBLE beam line (BM26B) at the European Synchrotron Radiation Facility (ESRF) in Grenoble, France. The 2-D SAXS images were collected using an acquisition time of 5 min for each sample. To record the SAXS data, a multiwire two-dimensional detector positioned at approximately 1.5 m from the sample was used. The X-ray energy was 12 keV, corresponding to a wavelength of 1.02 Å. The positions of the diffracted peaks of a silver behanate standard sample were used in order to calibrate the explored SAXS q-range. The 2D-SAXS images were later transformed into 1D-profiles by performing radial integration along the azimuthal angle using the FIT2D program developed by dr. Hammersley of the ESRF.49,50 The 2D-WAXD images were recorded using a FreLon fast CCD camera with 10×10 cm2 sensitive screen and pixel size of 97.6×97.6 μm. The X-ray energy was again 12 keV and the sample-to-detector distance used was ~ 91 mm. FIT2D was used to radially integrate the 2D-WAXD images and diffraction signals from a HDPE standard sample were used to calibrate the WAXD detector. Before radial integration, corrections for dark current and detector flat field were performed on the WAXD images. Polymer film preparation for SAXS and WAXD measurements. Polymers were dissolved in MeOH/CHCl3 (1:9 v/v) and poured into silylated Petri dishes. The dishes were covered with a larger Petri dish to allow the solvent to evaporate slowly. Annealing of the films was performed by placing the dry films in an oven at 130 °C for 1 h, and cooling down at a rate of 20 °C/h. The thickness of the resulting films was 0.21–0.24 mm.
2.5 References
1. R.J. Cella J. Polym. Sci., Part C: Polym. Symp. 1973, (42), 727-740. 2. G. Holden, N.R. Legge, R.P. Quirk and H.E. Schroeder, Thermoplastic Elastomers, 2nd Edition.
Carl Hanser Verlag: München, 1996. 3. R.M. Versteegen, Well-defined Thermoplastic Elastomers. Reversible networks based on
hydrogen bonding. PhD Thesis, Eindhoven University of Technology, Eindhoven, 2003.
Chapter 2
36
4. N.E. Botterhuis, D.J.M. van Beek, G.M.L. van Gemert, A.W. Bosman and R.P. Sijbesma J. Polym. Sci., Part A: Polym. Chem. 2008, 46 (12), 3877-3885.
5. C.D. Eisenbach, T. Heinemann, A. Ribbe and E. Stadler Angew. Makromol. Chem. 1992, 202, 221-241.
6. C.D. Eisenbach and E. Stadler Macromol. Chem. Phys. 1995, 196 (6), 1981-1997. 7. M. van der Schuur, J. de Boer and R.J. Gaymans Polymer 2005, 46 (22), 9243-9256. 8. M. Niesten, J.W. ten Brinke and R.J. Gaymans Polymer 2001, 42 (4), 1461-1469. 9. R.M. Versteegen, R.P. Sijbesma and E.W. Meijer Macromolecules 2005, 38 (8), 3176-3184. 10. I. Yilgör, J.S. Riffle, G.L. Wilkes and J.E. McGrath Polym. Bull. 1982, 8 (11-1), 535-542. 11. D. Tyagi, G.L. Wilkes, I. Yilgör and J.E. McGrath Polym. Bull. 1982, 8 (11-1), 543-550. 12. D. Tyagi, I. Yilgör, J.E. McGrath and G.L. Wilkes Polymer 1984, 25 (12), 1807-1816. 13. D. Tyagi, J.E. McGrath and G.L. Wilkes Polym. Eng. Sci. 1986, 26 (20), 1371-1398. 14. I. Yilgör and E. Yilgör Polym. Rev. 2007, 47 (4), 487-510. 15. R.M. Versteegen, R. Kleppinger, R.P. Sijbesma and E.W. Meijer Macromolecules 2006, 39 (2),
772-783. 16. J.P. Sheth, D.B. Klinedinst, G.L. Wilkes, Y. Iskender and E. Yilgör Polymer 2005, 46 (18), 7317-
7322. 17. J.P. Sheth, D.B. Klinedinst, T.W. Pechar, G.L. Wilkes, E. Yilgör and I. Yilgör Macromolecules
2005, 38 (24), 10074-10079. 18. S. Das, I. Yilgör, E. Yilgör, B. Inci, O. Tezgel, F.L. Beyer and G.L. Wilkes Polymer 2007, 48 (1),
290-301. 19. S. Das, D.F. Cox, G.L. Wilkes, D.B. Klinedinst, I. Yilgör, E. Yilgör and F.L. Beyer J. Macromol.
Sci., Part B: Phys. 2007, 46 (5), 853-875. 20. E. Wisse, A.J.H. Spiering, E.N.M. van Leeuwen, R.A.E. Renken, P.Y.W. Dankers, L.A. Brouwer,
M.J.A. van Luyn, M.C. Harmsen, N.A.J.M. Sommerdijk and E.W. Meijer Biomacromolecules 2006, 7 (12), 3385-3395.
21. E. Wisse, Biomaterials by the supramolecular control of nanofibers. PhD Thesis, Eindhoven University of Technology, Eindhoven, 2007.
22. E. Wisse, A.J.H. Spiering, F. Pfeifer, G. Portale, H.W. Siesler and E.W. Meijer, manuscript in preparation.
23. R.A. Koevoets, R.M. Versteegen, H. Kooijman, A.L. Spek, R.P. Sijbesma and E.W. Meijer J. Am. Chem. Soc. 2005, 127 (9), 2999-3003.
24. E. Wisse, L.E. Govaert, H.E.H. Meijer and E.W. Meijer Macromolecules 2006, 39 (21), 7425-7432.
25. Note: The synthesis was performed by N. Chebotareva, but was not reported in literature. 26. W.S. Fones, R.S. Stander and J. White J. Org. Chem. 1951, 16 (5), 708-712. 27. H.W.I. Peerlings and E.W. Meijer Tetrahedron Lett. 1999, 40, 1021-1024. 28. I.J.W. Bowman, D.S. Brown and R.E. Wetton Polymer 1969, 10 (8), 715-718. 29. Note: For the cross-sectional analysis on multiple fibers, it was not possible to measure the
FWHM for each fiber separately. Therefore, the FWHM was measured of the total fiber bundle, and divided by the number of fibers in the bundle.
30. D. Husken, J. Feijen and R.J. Gaymans J. Polym. Sci., Part A: Polym. Chem. 2007, 45 (19), 4522-4535.
31. W. Neumuller and R. Bonart J. Macromol. Sci., Part B: Phys. 1982, 21 (2), 203-217. 32. R. Bonart and E.H. Muller J. Macromol. Sci., Part B: Phys. 1974, 10 (2), 345-357. 33. R. Bonart and E.H. Muller J. Macromol. Sci., Part B: Phys. 1974, 10 (1), 177-189. 34. R. Bonart J. Macromol. Sci., Part B: Phys. 1968, 2 (1), 115 - 138. 35. M. Cesari, G. Perego and A. Mazzei Makromol. Chem. 1965, 83 (APR), 196-206. 36. S. De Feyter, M. Larsson, N. Schuurmans, B. Verkuijl, G. Zoriniants, A. Gesquière, M.M. Abdel-
Mottaleb, J. van Esch, B.L. Feringa, J. van Stam and F. De Schryver Chem.--Eur. J. 2003, 9 (5), 1198-1206.
37. J.P. Sheth, S. Unal, E. Yilgör, I. Yilgör, F.L. Beyer, T.E. Long and G.L. Wilkes Polymer 2005, 46 (23), 10180-10190.
Nanofibrous Morphology of pTHF-bisurea Thermoplastic Elastomers
37
38. C. Santa Cruz, N. Stribeck, H.G. Zachmann and F.J.B. Calleja Macromolecules 1991, 24 (22), 5980-5990.
39. N. Stribeck, X-Ray Scattering of Soft Matter. 1st ed.; Springer-Verlag: Berlin, 2007. 40. M.A.G. Jansen, L.H. Wu, J.G.P. Goossens, G. de Wit, C. Bailly and C.E. Koning J. Polym. Sci.,
Part A: Polym. Chem. 2007, 45 (5), 882-899. 41. C.G. Vonk and G. Kortleve Koll. Zeit. & Zeit. Polym. 1967, 220 (1), 19-24. 42. G.R. Strobl and M. Schneider J. Polym. Sci., Part B: Polym. Phys 1980, 18 (6), 1343-1359. 43. W. Ruland Colloid Polym. Sci. 1977, 255 (5), 417-427. 44. P. Debye, H.R. Anderson and H. Brumberger J. Appl. Phys. 1957, 28 (6), 679-683. 45. P. Debye and A.M. Bueche J. Appl. Phys. 1949, 20 (6), 518-525. 46. A.J. Ryan, J.L. Stanford, W. Bras and T.M.W. Nye Polymer 1997, 38 (4), 759-768. 47. E. Wisse, A.J.H. Spiering, F. Pfeifer, G. Portale, H.W. Siesler and E.W. Meijer 2008. 48. R.A. Koevoets, Functional materials based on multiple hydrogen bonding motifs. PhD Thesis,
Eindhoven University of Technology, Eindhoven, 2005. 49. A.P. Hammersley, S.O. Svensson, M. Hanfland, A.N. Fitch and D. Hausermann High Pressure
Res. 1996, 14, 235-248. 50. http://www.esrf.eu/computing/scientific/FIT2D/index.html
38
39
33
Molecular Recognition in Bisurea Thermoplastic Elastomers Studied with Pyrene-Based Fluorescent
Probes and Atomic Force Microscopy
Abstract Insight into the molecular details of the hydrogen-bond driven self-assembly process of polymeric bisurea systems with guest molecules was obtained using bisurea pyrene probes in UV/vis absorption, fluorescence and atomic force microscopy (AFM) measurements. These probes are randomly dispersed in the hard blocks of thermoplastic elastomers with matching bisurea groups, whereas they phase segregate if the hard blocks have a different spacing between the urea groups. This work has been published: N.E. Botterhuis, S. Karthikeyan, D. Veldman, S.C.J. Meskers and R.P. Sijbesma Chem. Commun. 2008, DOI: 10.1039/b804457k.
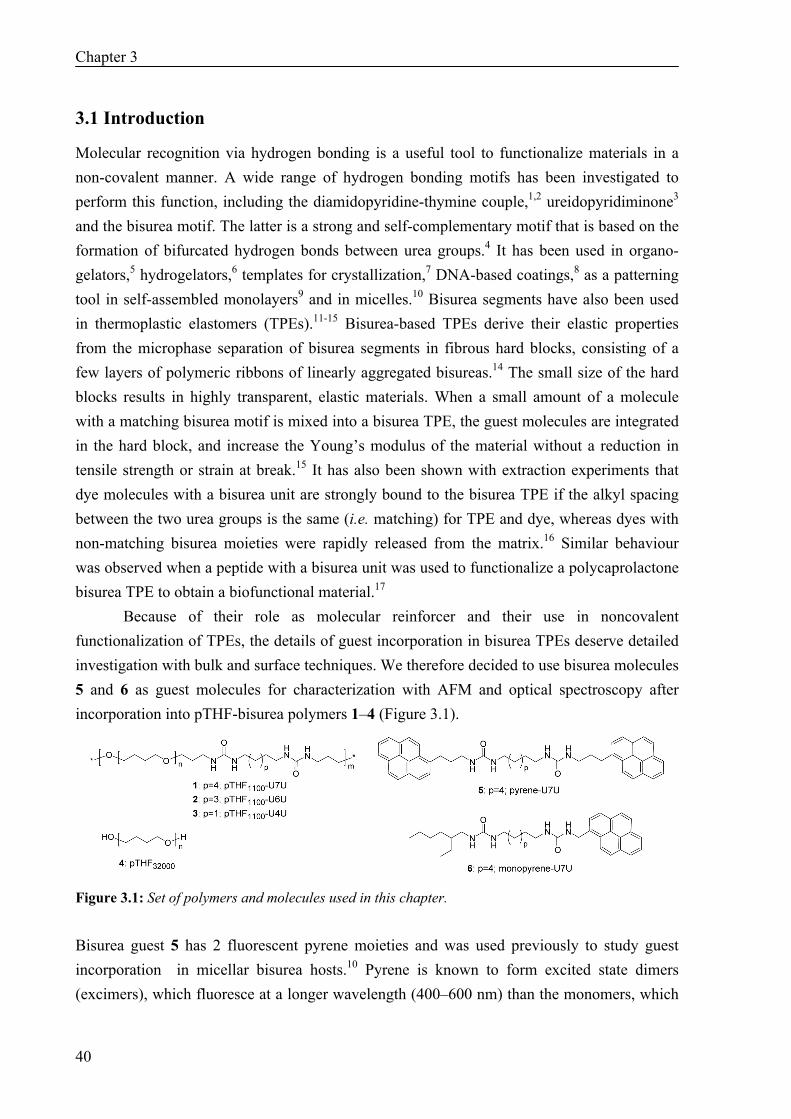
Chapter 3
40
3.1 Introduction
Molecular recognition via hydrogen bonding is a useful tool to functionalize materials in a non-covalent manner. A wide range of hydrogen bonding motifs has been investigated to perform this function, including the diamidopyridine-thymine couple,1,2 ureidopyridiminone3 and the bisurea motif. The latter is a strong and self-complementary motif that is based on the formation of bifurcated hydrogen bonds between urea groups.4 It has been used in organo-gelators,5 hydrogelators,6 templates for crystallization,7 DNA-based coatings,8 as a patterning tool in self-assembled monolayers9 and in micelles.10 Bisurea segments have also been used in thermoplastic elastomers (TPEs).11-15 Bisurea-based TPEs derive their elastic properties from the microphase separation of bisurea segments in fibrous hard blocks, consisting of a few layers of polymeric ribbons of linearly aggregated bisureas.14 The small size of the hard blocks results in highly transparent, elastic materials. When a small amount of a molecule with a matching bisurea motif is mixed into a bisurea TPE, the guest molecules are integrated in the hard block, and increase the Young’s modulus of the material without a reduction in tensile strength or strain at break.15 It has also been shown with extraction experiments that dye molecules with a bisurea unit are strongly bound to the bisurea TPE if the alkyl spacing between the two urea groups is the same (i.e. matching) for TPE and dye, whereas dyes with non-matching bisurea moieties were rapidly released from the matrix.16 Similar behaviour was observed when a peptide with a bisurea unit was used to functionalize a polycaprolactone bisurea TPE to obtain a biofunctional material.17
Because of their role as molecular reinforcer and their use in noncovalent functionalization of TPEs, the details of guest incorporation in bisurea TPEs deserve detailed investigation with bulk and surface techniques. We therefore decided to use bisurea molecules 5 and 6 as guest molecules for characterization with AFM and optical spectroscopy after incorporation into pTHF-bisurea polymers 1–4 (Figure 3.1).
Figure 3.1: Set of polymers and molecules used in this chapter. Bisurea guest 5 has 2 fluorescent pyrene moieties and was used previously to study guest incorporation in micellar bisurea hosts.10 Pyrene is known to form excited state dimers (excimers), which fluoresce at a longer wavelength (400–600 nm) than the monomers, which
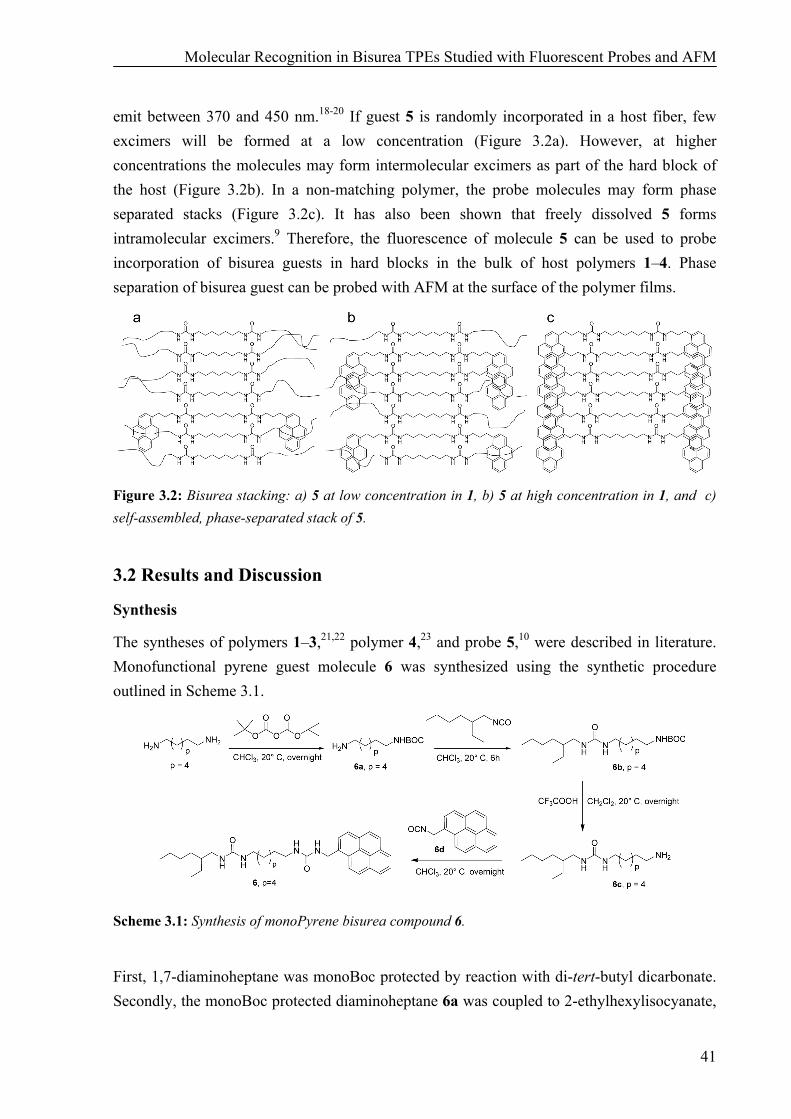
Molecular Recognition in Bisurea TPEs Studied with Fluorescent Probes and AFM
41
emit between 370 and 450 nm.18-20 If guest 5 is randomly incorporated in a host fiber, few excimers will be formed at a low concentration (Figure 3.2a). However, at higher concentrations the molecules may form intermolecular excimers as part of the hard block of the host (Figure 3.2b). In a non-matching polymer, the probe molecules may form phase separated stacks (Figure 3.2c). It has also been shown that freely dissolved 5 forms intramolecular excimers.9 Therefore, the fluorescence of molecule 5 can be used to probe incorporation of bisurea guests in hard blocks in the bulk of host polymers 1–4. Phase separation of bisurea guest can be probed with AFM at the surface of the polymer films.
Figure 3.2: Bisurea stacking: a) 5 at low concentration in 1, b) 5 at high concentration in 1, and c) self-assembled, phase-separated stack of 5.
3.2 Results and Discussion
Synthesis
The syntheses of polymers 1–3,21,22 polymer 4,23 and probe 5,10 were described in literature. Monofunctional pyrene guest molecule 6 was synthesized using the synthetic procedure outlined in Scheme 3.1.
Scheme 3.1: Synthesis of monoPyrene bisurea compound 6.
First, 1,7-diaminoheptane was monoBoc protected by reaction with di-tert-butyl dicarbonate. Secondly, the monoBoc protected diaminoheptane 6a was coupled to 2-ethylhexylisocyanate,
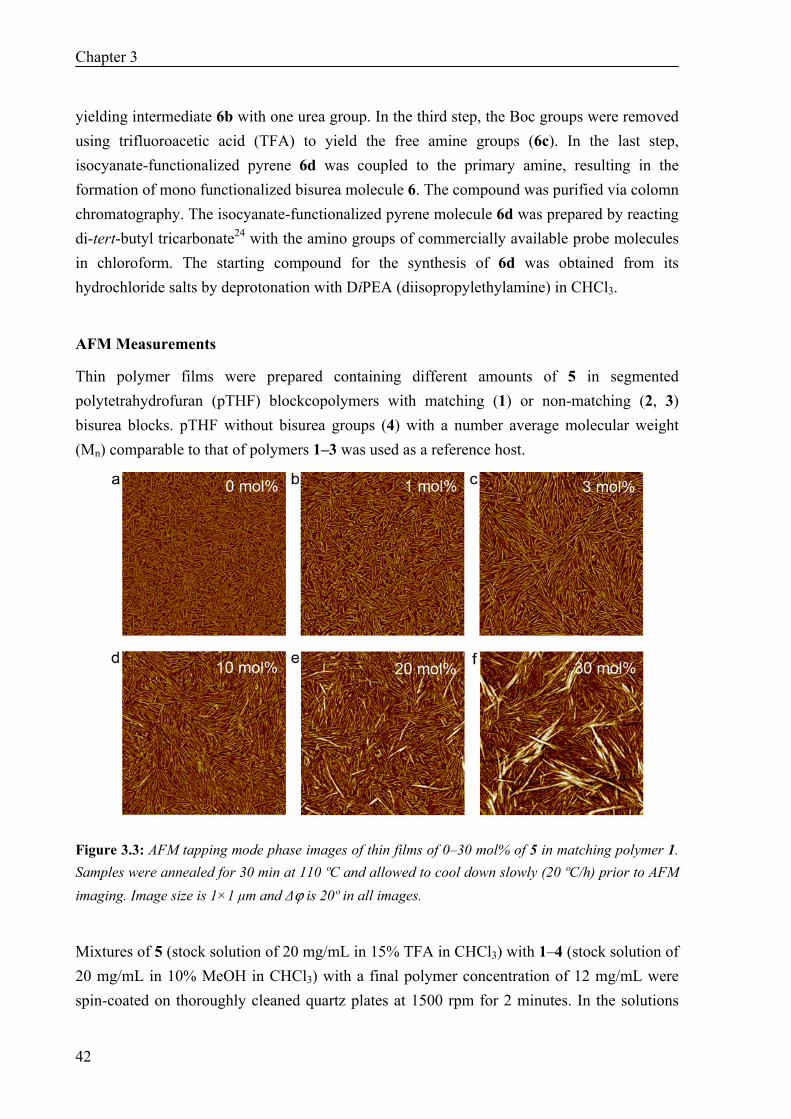
Chapter 3
42
yielding intermediate 6b with one urea group. In the third step, the Boc groups were removed using trifluoroacetic acid (TFA) to yield the free amine groups (6c). In the last step, isocyanate-functionalized pyrene 6d was coupled to the primary amine, resulting in the formation of mono functionalized bisurea molecule 6. The compound was purified via colomn chromatography. The isocyanate-functionalized pyrene molecule 6d was prepared by reacting di-tert-butyl tricarbonate24 with the amino groups of commercially available probe molecules in chloroform. The starting compound for the synthesis of 6d was obtained from its hydrochloride salts by deprotonation with DiPEA (diisopropylethylamine) in CHCl3.
AFM Measurements
Thin polymer films were prepared containing different amounts of 5 in segmented polytetrahydrofuran (pTHF) blockcopolymers with matching (1) or non-matching (2, 3) bisurea blocks. pTHF without bisurea groups (4) with a number average molecular weight (Mn) comparable to that of polymers 1–3 was used as a reference host.
Figure 3.3: AFM tapping mode phase images of thin films of 0–30 mol% of 5 in matching polymer 1. Samples were annealed for 30 min at 110 ºC and allowed to cool down slowly (20 ºC/h) prior to AFM imaging. Image size is 1×1 μm and Δϕ is 20º in all images.
Mixtures of 5 (stock solution of 20 mg/mL in 15% TFA in CHCl3) with 1–4 (stock solution of 20 mg/mL in 10% MeOH in CHCl3) with a final polymer concentration of 12 mg/mL were spin-coated on thoroughly cleaned quartz plates at 1500 rpm for 2 minutes. In the solutions
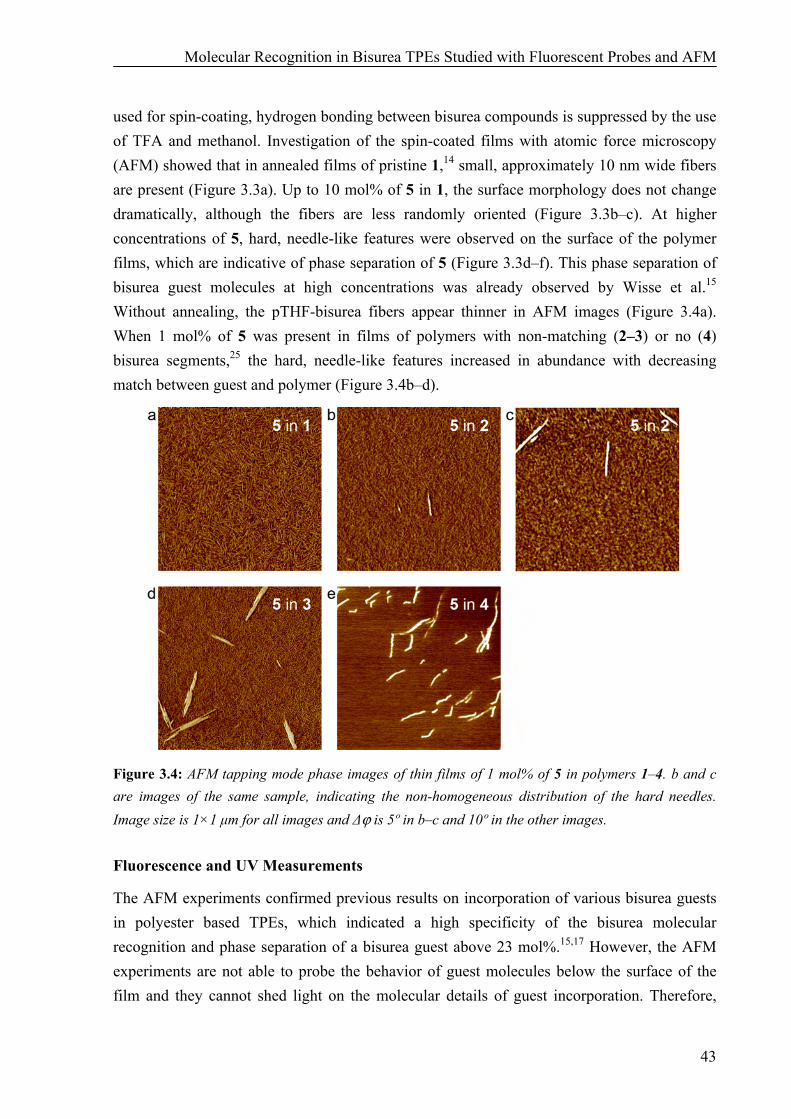
Molecular Recognition in Bisurea TPEs Studied with Fluorescent Probes and AFM
43
used for spin-coating, hydrogen bonding between bisurea compounds is suppressed by the use of TFA and methanol. Investigation of the spin-coated films with atomic force microscopy (AFM) showed that in annealed films of pristine 1,14 small, approximately 10 nm wide fibers are present (Figure 3.3a). Up to 10 mol% of 5 in 1, the surface morphology does not change dramatically, although the fibers are less randomly oriented (Figure 3.3b–c). At higher concentrations of 5, hard, needle-like features were observed on the surface of the polymer films, which are indicative of phase separation of 5 (Figure 3.3d–f). This phase separation of bisurea guest molecules at high concentrations was already observed by Wisse et al.15 Without annealing, the pTHF-bisurea fibers appear thinner in AFM images (Figure 3.4a). When 1 mol% of 5 was present in films of polymers with non-matching (2–3) or no (4) bisurea segments,25 the hard, needle-like features increased in abundance with decreasing match between guest and polymer (Figure 3.4b–d).
Figure 3.4: AFM tapping mode phase images of thin films of 1 mol% of 5 in polymers 1–4. b and c are images of the same sample, indicating the non-homogeneous distribution of the hard needles. Image size is 1×1 μm for all images and Δϕ is 5º in b–c and 10º in the other images. Fluorescence and UV Measurements
The AFM experiments confirmed previous results on incorporation of various bisurea guests in polyester based TPEs, which indicated a high specificity of the bisurea molecular recognition and phase separation of a bisurea guest above 23 mol%.15,17 However, the AFM experiments are not able to probe the behavior of guest molecules below the surface of the film and they cannot shed light on the molecular details of guest incorporation. Therefore,
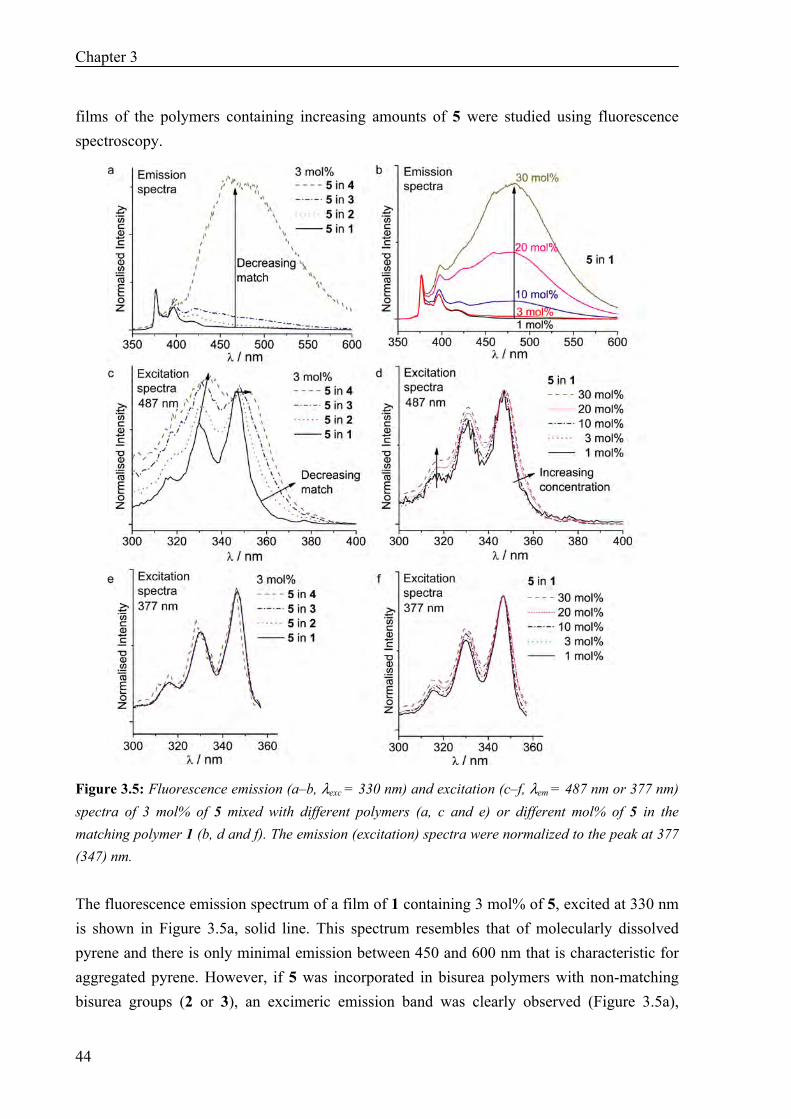
Chapter 3
44
films of the polymers containing increasing amounts of 5 were studied using fluorescence spectroscopy.
Figure 3.5: Fluorescence emission (a–b, λexc = 330 nm) and excitation (c–f, λem = 487 nm or 377 nm) spectra of 3 mol% of 5 mixed with different polymers (a, c and e) or different mol% of 5 in the matching polymer 1 (b, d and f). The emission (excitation) spectra were normalized to the peak at 377 (347) nm. The fluorescence emission spectrum of a film of 1 containing 3 mol% of 5, excited at 330 nm is shown in Figure 3.5a, solid line. This spectrum resembles that of molecularly dissolved pyrene and there is only minimal emission between 450 and 600 nm that is characteristic for aggregated pyrene. However, if 5 was incorporated in bisurea polymers with non-matching bisurea groups (2 or 3), an excimeric emission band was clearly observed (Figure 3.5a),
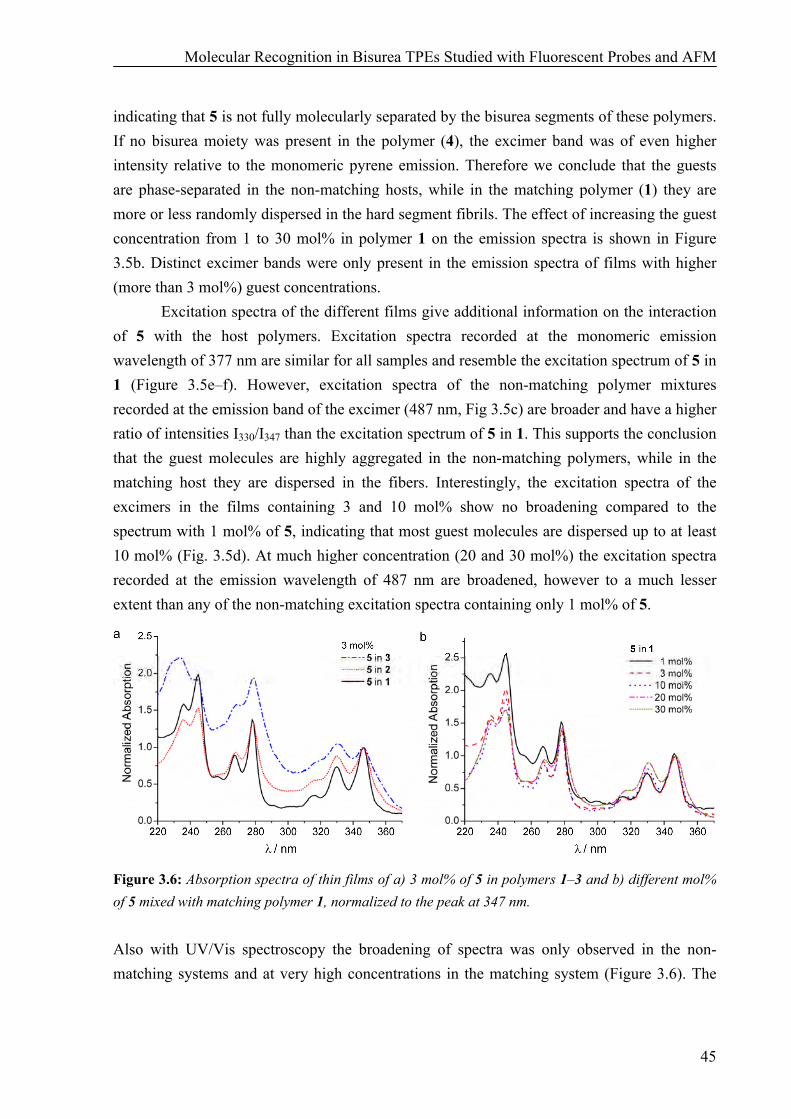
Molecular Recognition in Bisurea TPEs Studied with Fluorescent Probes and AFM
45
indicating that 5 is not fully molecularly separated by the bisurea segments of these polymers. If no bisurea moiety was present in the polymer (4), the excimer band was of even higher intensity relative to the monomeric pyrene emission. Therefore we conclude that the guests are phase-separated in the non-matching hosts, while in the matching polymer (1) they are more or less randomly dispersed in the hard segment fibrils. The effect of increasing the guest concentration from 1 to 30 mol% in polymer 1 on the emission spectra is shown in Figure 3.5b. Distinct excimer bands were only present in the emission spectra of films with higher (more than 3 mol%) guest concentrations.
Excitation spectra of the different films give additional information on the interaction of 5 with the host polymers. Excitation spectra recorded at the monomeric emission wavelength of 377 nm are similar for all samples and resemble the excitation spectrum of 5 in 1 (Figure 3.5e–f). However, excitation spectra of the non-matching polymer mixtures recorded at the emission band of the excimer (487 nm, Fig 3.5c) are broader and have a higher ratio of intensities I330/I347 than the excitation spectrum of 5 in 1. This supports the conclusion that the guest molecules are highly aggregated in the non-matching polymers, while in the matching host they are dispersed in the fibers. Interestingly, the excitation spectra of the excimers in the films containing 3 and 10 mol% show no broadening compared to the spectrum with 1 mol% of 5, indicating that most guest molecules are dispersed up to at least 10 mol% (Fig. 3.5d). At much higher concentration (20 and 30 mol%) the excitation spectra recorded at the emission wavelength of 487 nm are broadened, however to a much lesser extent than any of the non-matching excitation spectra containing only 1 mol% of 5.
Figure 3.6: Absorption spectra of thin films of a) 3 mol% of 5 in polymers 1–3 and b) different mol% of 5 mixed with matching polymer 1, normalized to the peak at 347 nm.
Also with UV/Vis spectroscopy the broadening of spectra was only observed in the non-matching systems and at very high concentrations in the matching system (Figure 3.6). The
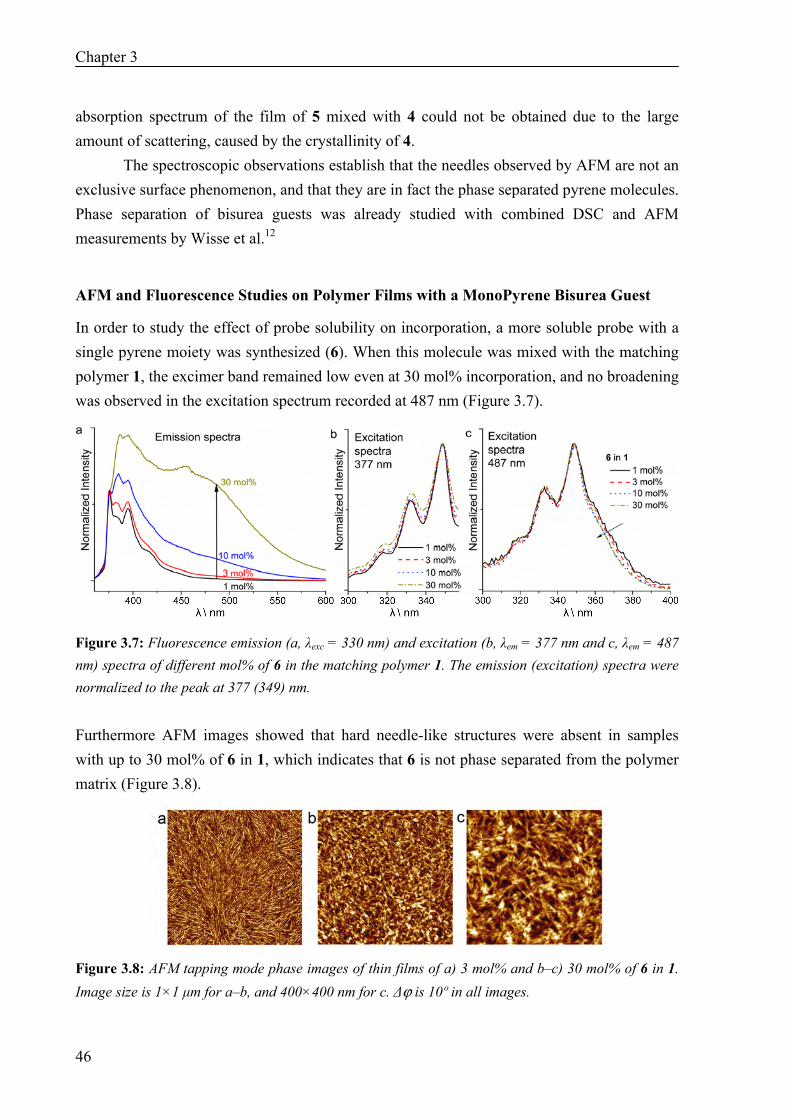
Chapter 3
46
absorption spectrum of the film of 5 mixed with 4 could not be obtained due to the large amount of scattering, caused by the crystallinity of 4.
The spectroscopic observations establish that the needles observed by AFM are not an exclusive surface phenomenon, and that they are in fact the phase separated pyrene molecules. Phase separation of bisurea guests was already studied with combined DSC and AFM measurements by Wisse et al.12
AFM and Fluorescence Studies on Polymer Films with a MonoPyrene Bisurea Guest
In order to study the effect of probe solubility on incorporation, a more soluble probe with a single pyrene moiety was synthesized (6). When this molecule was mixed with the matching polymer 1, the excimer band remained low even at 30 mol% incorporation, and no broadening was observed in the excitation spectrum recorded at 487 nm (Figure 3.7).
Figure 3.7: Fluorescence emission (a, λexc = 330 nm) and excitation (b, λem = 377 nm and c, λem = 487 nm) spectra of different mol% of 6 in the matching polymer 1. The emission (excitation) spectra were normalized to the peak at 377 (349) nm. Furthermore AFM images showed that hard needle-like structures were absent in samples with up to 30 mol% of 6 in 1, which indicates that 6 is not phase separated from the polymer matrix (Figure 3.8).
Figure 3.8: AFM tapping mode phase images of thin films of a) 3 mol% and b–c) 30 mol% of 6 in 1. Image size is 1×1 μm for a–b, and 400×400 nm for c. Δϕ is 10º in all images.
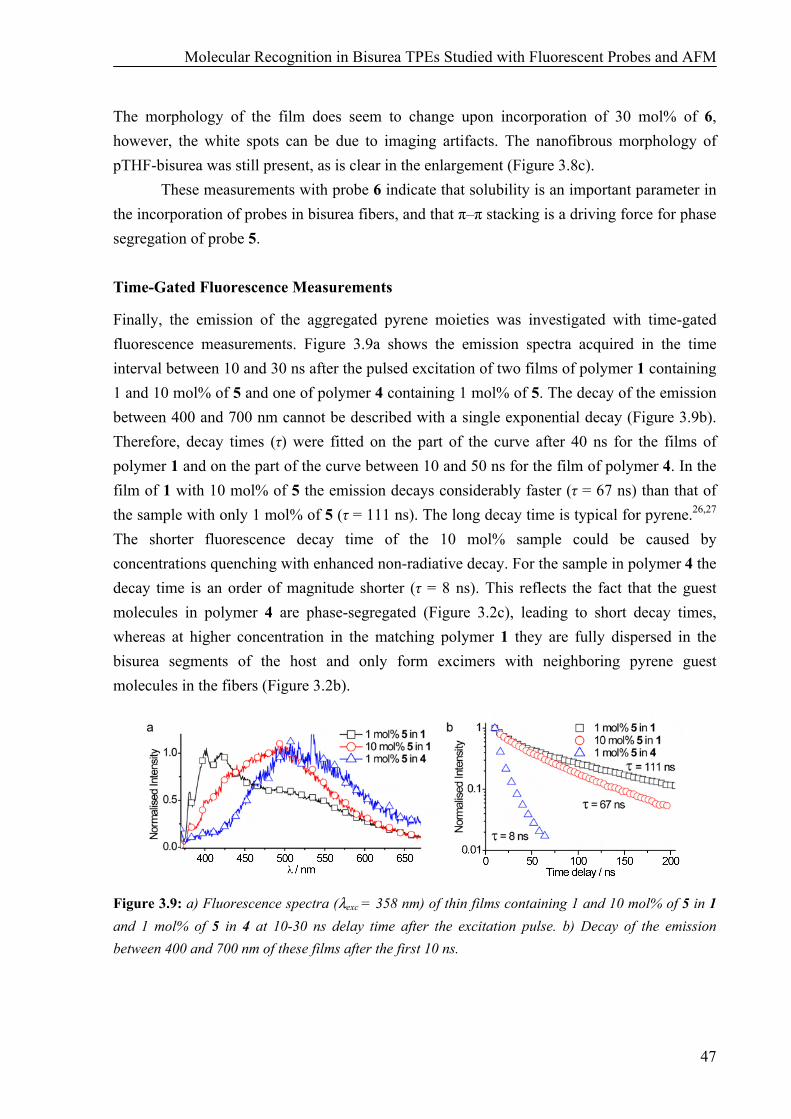
Molecular Recognition in Bisurea TPEs Studied with Fluorescent Probes and AFM
47
The morphology of the film does seem to change upon incorporation of 30 mol% of 6, however, the white spots can be due to imaging artifacts. The nanofibrous morphology of pTHF-bisurea was still present, as is clear in the enlargement (Figure 3.8c).
These measurements with probe 6 indicate that solubility is an important parameter in the incorporation of probes in bisurea fibers, and that π–π stacking is a driving force for phase segregation of probe 5. Time-Gated Fluorescence Measurements
Finally, the emission of the aggregated pyrene moieties was investigated with time-gated fluorescence measurements. Figure 3.9a shows the emission spectra acquired in the time interval between 10 and 30 ns after the pulsed excitation of two films of polymer 1 containing 1 and 10 mol% of 5 and one of polymer 4 containing 1 mol% of 5. The decay of the emission between 400 and 700 nm cannot be described with a single exponential decay (Figure 3.9b). Therefore, decay times (τ) were fitted on the part of the curve after 40 ns for the films of polymer 1 and on the part of the curve between 10 and 50 ns for the film of polymer 4. In the film of 1 with 10 mol% of 5 the emission decays considerably faster (τ = 67 ns) than that of the sample with only 1 mol% of 5 (τ = 111 ns). The long decay time is typical for pyrene.26,27 The shorter fluorescence decay time of the 10 mol% sample could be caused by concentrations quenching with enhanced non-radiative decay. For the sample in polymer 4 the decay time is an order of magnitude shorter (τ = 8 ns). This reflects the fact that the guest molecules in polymer 4 are phase-segregated (Figure 3.2c), leading to short decay times, whereas at higher concentration in the matching polymer 1 they are fully dispersed in the bisurea segments of the host and only form excimers with neighboring pyrene guest molecules in the fibers (Figure 3.2b).
Figure 3.9: a) Fluorescence spectra (λexc = 358 nm) of thin films containing 1 and 10 mol% of 5 in 1 and 1 mol% of 5 in 4 at 10-30 ns delay time after the excitation pulse. b) Decay of the emission between 400 and 700 nm of these films after the first 10 ns.
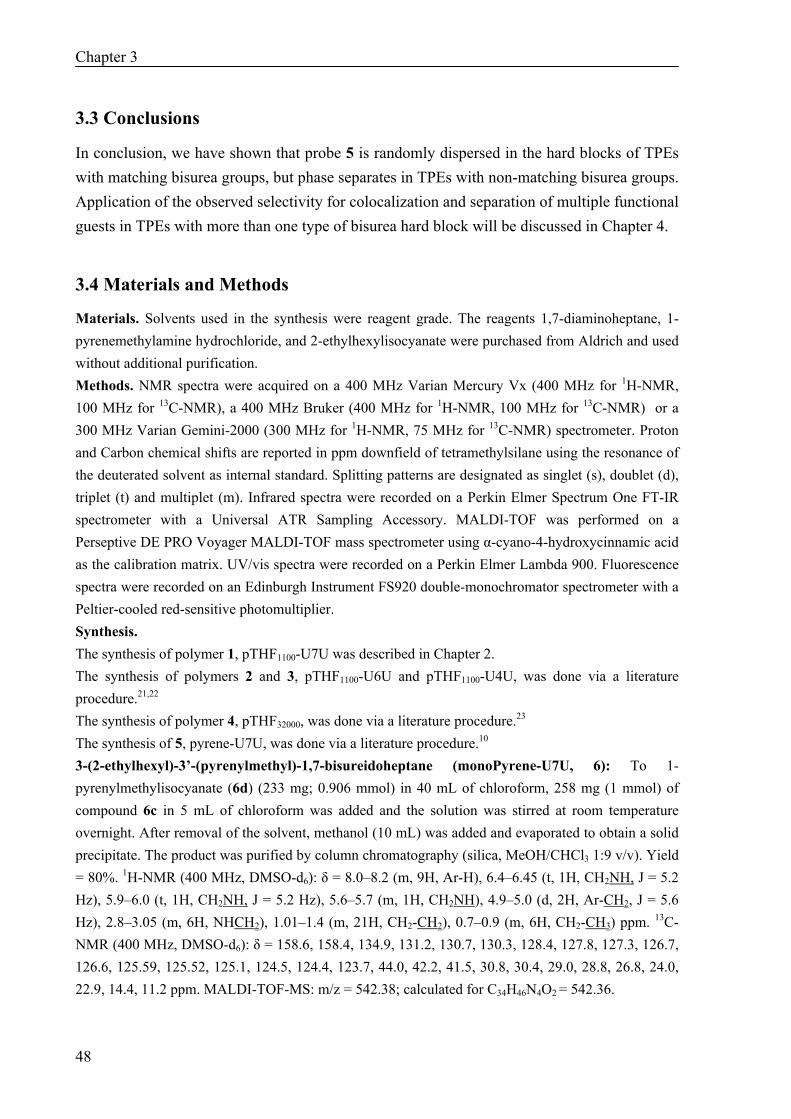
Chapter 3
48
3.3 Conclusions
In conclusion, we have shown that probe 5 is randomly dispersed in the hard blocks of TPEs with matching bisurea groups, but phase separates in TPEs with non-matching bisurea groups. Application of the observed selectivity for colocalization and separation of multiple functional guests in TPEs with more than one type of bisurea hard block will be discussed in Chapter 4.
3.4 Materials and Methods
Materials. Solvents used in the synthesis were reagent grade. The reagents 1,7-diaminoheptane, 1-pyrenemethylamine hydrochloride, and 2-ethylhexylisocyanate were purchased from Aldrich and used without additional purification. Methods. NMR spectra were acquired on a 400 MHz Varian Mercury Vx (400 MHz for 1H-NMR, 100 MHz for 13C-NMR), a 400 MHz Bruker (400 MHz for 1H-NMR, 100 MHz for 13C-NMR) or a 300 MHz Varian Gemini-2000 (300 MHz for 1H-NMR, 75 MHz for 13C-NMR) spectrometer. Proton and Carbon chemical shifts are reported in ppm downfield of tetramethylsilane using the resonance of the deuterated solvent as internal standard. Splitting patterns are designated as singlet (s), doublet (d), triplet (t) and multiplet (m). Infrared spectra were recorded on a Perkin Elmer Spectrum One FT-IR spectrometer with a Universal ATR Sampling Accessory. MALDI-TOF was performed on a Perseptive DE PRO Voyager MALDI-TOF mass spectrometer using α-cyano-4-hydroxycinnamic acid as the calibration matrix. UV/vis spectra were recorded on a Perkin Elmer Lambda 900. Fluorescence spectra were recorded on an Edinburgh Instrument FS920 double-monochromator spectrometer with a Peltier-cooled red-sensitive photomultiplier. Synthesis. The synthesis of polymer 1, pTHF1100-U7U was described in Chapter 2. The synthesis of polymers 2 and 3, pTHF1100-U6U and pTHF1100-U4U, was done via a literature procedure.21,22 The synthesis of polymer 4, pTHF32000, was done via a literature procedure.23 The synthesis of 5, pyrene-U7U, was done via a literature procedure.10 3-(2-ethylhexyl)-3’-(pyrenylmethyl)-1,7-bisureidoheptane (monoPyrene-U7U, 6): To 1-pyrenylmethylisocyanate (6d) (233 mg; 0.906 mmol) in 40 mL of chloroform, 258 mg (1 mmol) of compound 6c in 5 mL of chloroform was added and the solution was stirred at room temperature overnight. After removal of the solvent, methanol (10 mL) was added and evaporated to obtain a solid precipitate. The product was purified by column chromatography (silica, MeOH/CHCl3 1:9 v/v). Yield = 80%. 1H-NMR (400 MHz, DMSO-d6): δ = 8.0–8.2 (m, 9H, Ar-H), 6.4–6.45 (t, 1H, CH2NH, J = 5.2 Hz), 5.9–6.0 (t, 1H, CH2NH, J = 5.2 Hz), 5.6–5.7 (m, 1H, CH2NH), 4.9–5.0 (d, 2H, Ar-CH2, J = 5.6 Hz), 2.8–3.05 (m, 6H, NHCH2), 1.01–1.4 (m, 21H, CH2-CH2), 0.7–0.9 (m, 6H, CH2-CH3) ppm. 13C-NMR (400 MHz, DMSO-d6): δ = 158.6, 158.4, 134.9, 131.2, 130.7, 130.3, 128.4, 127.8, 127.3, 126.7, 126.6, 125.59, 125.52, 125.1, 124.5, 124.4, 123.7, 44.0, 42.2, 41.5, 30.8, 30.4, 29.0, 28.8, 26.8, 24.0, 22.9, 14.4, 11.2 ppm. MALDI-TOF-MS: m/z = 542.38; calculated for C34H46N4O2 = 542.36.
Molecular Recognition in Bisurea TPEs Studied with Fluorescent Probes and AFM
49
7-(Tert-butoxycarbonylamino)-1-heptylamine (6a): The N-Boc-1,7-diaminoheptane (7-(Tert-butoxycarbonylamino)-1-heptylamine) was synthesized according to the procedure reported in the literature.28 N-Boc-[N-3-(2-ethylhexyl)-ureido]-heptylamine (6b): A solution 300 mg (1.29 mmol) of 7-(Tert-butoxycarbonylamino)-1-heptylamine (6a) in chloroform (20 mL) was added to a solution of 201 mg (1.29 mmol) of 2-ethylhexylisocyanate in 10 mL of chloroform. After 6 h stirring at room temperature, the solvent was removed. 1H NMR confirmed the formation of the product and the product was used as such for the next step without further purification. 1H-NMR (300 MHz, CDCl3): δ = 4.4–4.6 (m, 3H, -NH), 3.01–3.2 (m, 6H, CH2-N), 1.5 (s, 9H, C(CH3)), 1.2–1.4 (m, 15H, CH2CH2), 0.8–1.0 (t, 6H, CH2-CH3, J = 6.5 Hz) ppm. [N-3-(2-ethylhexyl)-ureido]-heptylamine (6c): Compound 6b was dissolved in 30 mL of dichloromethane with 5 mL of trifluoroacetic acid (TFA). After 16 h stirring at room temperature, the solvent was removed and fresh dichloromethane was added. The organic layer was then washed with 200 mL of 1 M sodium hydroxide solution and the aqueous layer collected. The aqueous sodium hydroxide layer was extracted with dichloromethane (3×20 mL). The combined organic layer was dried under anhydrous sodium sulphate. Solvent was evaporated to obtain the product. Yield = 91% (340 mg). 1H-NMR (400 MHz, CDCl3): δ = 4.8–4.95 (t, 2H, -NH, J = 12 Hz), 3.01–3.2 (m, 4H, CH2-N), 2.6–2.7 (m, 2H, NH2), 1.1–1.4 (m, 21H, CH2CH2), 0.8–1.0 (t, 6H, CH2-CH3, J = 6.5 Hz) ppm.13C-NMR (400 MHz, CDCl3): δ = 158.8, 43.2, 42.1, 40.4, 39.8, 33.7, 30.9, 30.3, 29.2, 28.9, 26.8, 26.7, 24.1, 23.0, 14.0, 10.8 ppm. 1-Pyrenylmethylisocyanate (6d): 250 mg (0.9366 mmol) of 1-pyrenylmethylamine hydrochloride was suspended in 30 mL of chloroform. To this 186 mg (260 μl, 1.44 mmol) of DiPEA (diisopropylethylamine) was added. After the addition of DiPEA, the solution became clear. The solution was stirred for 60 min and the reaction mixture was washed with distilled water (10×15 mL)), dried under anhydrous sodium sulphate and it was used for further reaction. Yield = 97% (210 mg). 210 mg (0.909 mmol) of the 1-pyrenylmethylamine was added to 1.1 eq (262 mg, 1 mmol) of di-tert-butyltricarbonate24 in 15 mL of chloroform and stirred at room temperature for 2 hours. The formation of 1-pyrenylmethylisocyanate (233 mg) was confirmed by IR (NCO peak at 2267 cm–1) and 1H NMR spectroscopy. 1H NMR (400 MHz, CDCl3): δ = 8.2–8.4 (m, 9H, Ar-H), 5.24 (s, 2H, CH2-Ar) ppm. Preparation of polymer films for AFM and fluorescence measurements. Quartz substrates (3×3 cm) were cleaned by ultrasonic treatment in acetone (10 min), rubbing with SDS soap solution, sonication in SDS soap solution (10 min), rinsing in a stream of demineralised water (15 min), sonication in isopropranol (5 min) and finally UV/ozone treatment (30 min). Solutions for spin-coating were freshly prepared by mixing different stock solutions, reaching a final polymer concentration of 12 mg/mL. Stock solutions for pTHF-bisureas were always 20 mg/mL in MeOH/CHCl3 (1:9 v/v). Stock solutions for pyrene bisurea guests were always 20 mg/mL in TFA/CHCl3 (15:85 v/v). The mol% of bisurea guest was calculated with respect to the number of bisurea groups in the polymer, assuming a molecular weight of a polymer repeating unit of 1400 g/mol for all polymers. The stock solutions were freshly prepared prior to spin-coating, and the pyrene stock solutions were used within 30 minutes to prevent degradation of the compounds by the TFA. The solutions were spin-coated at 1500 rpm for 2 minutes.
Chapter 3
50
Atomic force Microscopy (AFM). AFM images were recorded using a Dimension 3100 Nanoscope III (Digital Instruments, Inc. Santa Barbara, California, now Veeco). For polymer films, the microscopes were operated in the tapping (or intermittent contact) mode using silicon cantilever tips (Nanosensors, PPP-NCH-50, frequency 204–497 kHz, force constant 10–130 N/m). A scan rate of 1 Hz and a scan angle of 90° were used, and RMS free oscillation amplitude was set to 2.0V. The operating setpoint ratio (Asp/A0) was set to approximately 0.9. Integral and proportional gains were optimized for each sample. All images were subjected to a first-order plane-fitting procedure to compensate for sample tilt. Fluorescence measurements. Fluorescence spectra were recorded on an Edinburgh Instrument FS920 double-monochromator spectrometer with a Peltier-cooled red-sensitive photomultiplier. The dwell time was set to 0.2, the number of scans to 3 and the step size to 1 nm. The emission and excitation slit sizes were set to 4 nm. Emission spectra were recorded after excitation at 330 nm. Excitation spectra were recorded at emission wavelengths of 377 and 487 nm.
3.5 References
1. C. Fouquey, J.M. Lehn and A.M. Levelut Adv. Mater. 1990, 2 (5), 254-257. 2. R. Shenhar, H. Xu, B.L. Frankamp, T.E. Mates, A. Sanyal, O. Uzun and V.M. Rotello J. Am.
Chem. Soc. 2005, 127 (46), 16318-16324. 3. R.P. Sijbesma, F.H. Beijer, L. Brunsveld, B.J.B. Folmer, J.H.K.K. Hirschberg, R.F.M. Lange,
J.K.L. Lowe and E.W. Meijer Science 1997, 278 (5343), 1601-1604. 4. W. Dannecker, J. Kopf and H. Rust Cryst. Struct. Commun. 1979, 8 (2), 429-432. 5. J. van Esch, F. Schoonbeek, M. de Loos, H. Kooijman, A.L. Spek, R.M. Kellogg and B.L. Feringa
Chem.--Eur. J. 1999, 5 (3), 937-950. 6. M. de Loos, A. Friggeri, J. van Esch, R.M. Kellogg and B.L. Feringa Org. Biomol. Chem. 2005, 3
(9), 1631-1639. 7. D.C. Popescu, M.M.J. Smulders, B.P. Pichon, N. Chebotareva, S.Y. Kwak, O.L.J. van Asselen,
R.P. Sijbesma, E. Di Masi and N.A.J.M. Sommerdijk J. Am. Chem. Soc. 2007, 129 (45), 14058-14067.
8. M.R.J. Vos, P.H.H. Bomans, F. de Haas, P.M. Frederik, J.A. Jansen, R.J.M. Nolte and N.A.J.M. Sommerdijk J. Am. Chem. Soc. 2007, 129 (39), 11894-11895.
9. S. De Feyter, M. Larsson, N. Schuurmans, B. Verkuijl, G. Zoriniants, A. Gesquière, M.M. Abdel-Mottaleb, J. van Esch, B.L. Feringa, J. van Stam and F. De Schryver Chem.--Eur. J. 2003, 9 (5), 1198-1206.
10. N. Chebotareva, P.H.H. Bomans, P.M. Frederik, N.A.J.M. Sommerdijk and R.P. Sijbesma Chem. Commun. 2005, (39), 4967-4969.
11. O. Colombani and L. Bouteiller New J. Chem. 2004, 28 (11), 1373-1382. 12. O. Colombani, C. Barioz, L. Bouteiller, C. Chanéac, L. Fompérie, F. Lortie and H. Montès
Macromolecules 2005, 38 (5), 1752-1759. 13. S. Das, I. Yilgör, E. Yilgör, B. Inci, O. Tezgel, F.L. Beyer and G.L. Wilkes Polymer 2007, 48 (1),
290-301. 14. R.M. Versteegen, R. Kleppinger, R.P. Sijbesma and E.W. Meijer Macromolecules 2006, 39 (2),
772-783. 15. E. Wisse, L.E. Govaert, H.E.H. Meijer and E.W. Meijer Macromolecules 2006, 39 (21), 7425-
7432. 16. R.A. Koevoets, R.M. Versteegen, H. Kooijman, A.L. Spek, R.P. Sijbesma and E.W. Meijer J. Am.
Chem. Soc. 2005, 127 (9), 2999-3003.
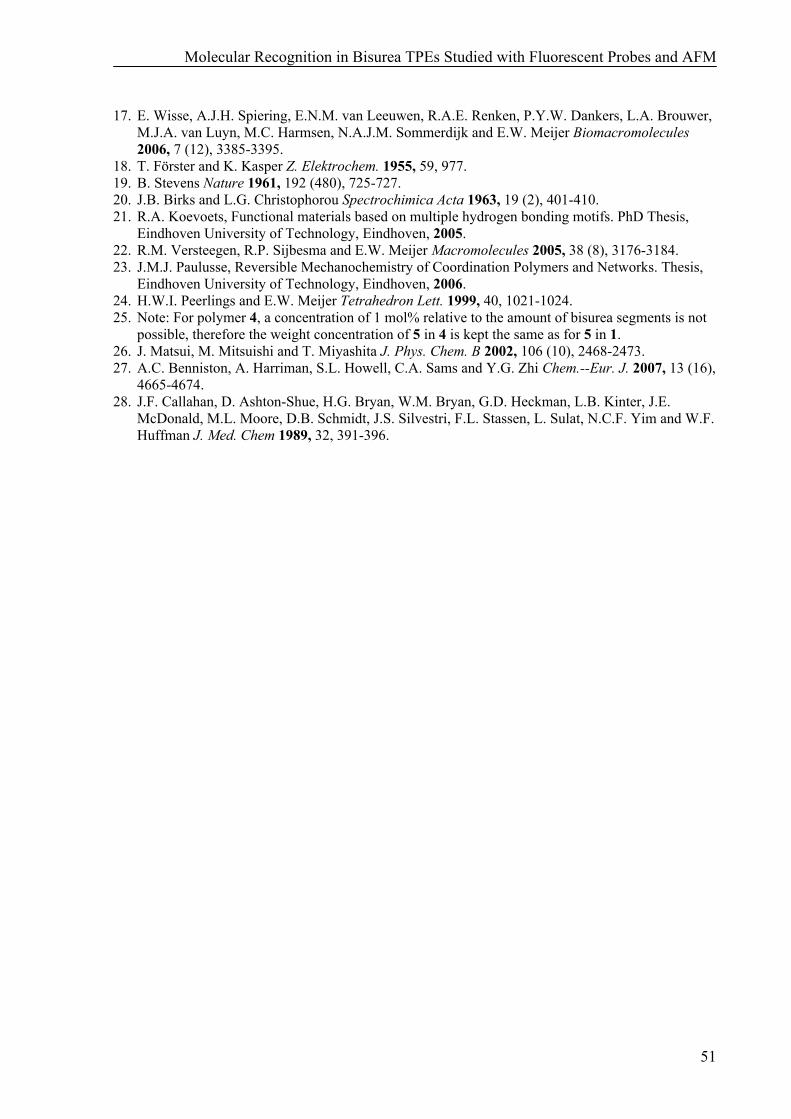
Molecular Recognition in Bisurea TPEs Studied with Fluorescent Probes and AFM
51
17. E. Wisse, A.J.H. Spiering, E.N.M. van Leeuwen, R.A.E. Renken, P.Y.W. Dankers, L.A. Brouwer, M.J.A. van Luyn, M.C. Harmsen, N.A.J.M. Sommerdijk and E.W. Meijer Biomacromolecules 2006, 7 (12), 3385-3395.
18. T. Förster and K. Kasper Z. Elektrochem. 1955, 59, 977. 19. B. Stevens Nature 1961, 192 (480), 725-727. 20. J.B. Birks and L.G. Christophorou Spectrochimica Acta 1963, 19 (2), 401-410. 21. R.A. Koevoets, Functional materials based on multiple hydrogen bonding motifs. PhD Thesis,
Eindhoven University of Technology, Eindhoven, 2005. 22. R.M. Versteegen, R.P. Sijbesma and E.W. Meijer Macromolecules 2005, 38 (8), 3176-3184. 23. J.M.J. Paulusse, Reversible Mechanochemistry of Coordination Polymers and Networks. Thesis,
Eindhoven University of Technology, Eindhoven, 2006. 24. H.W.I. Peerlings and E.W. Meijer Tetrahedron Lett. 1999, 40, 1021-1024. 25. Note: For polymer 4, a concentration of 1 mol% relative to the amount of bisurea segments is not
possible, therefore the weight concentration of 5 in 4 is kept the same as for 5 in 1. 26. J. Matsui, M. Mitsuishi and T. Miyashita J. Phys. Chem. B 2002, 106 (10), 2468-2473. 27. A.C. Benniston, A. Harriman, S.L. Howell, C.A. Sams and Y.G. Zhi Chem.--Eur. J. 2007, 13 (16),
4665-4674. 28. J.F. Callahan, D. Ashton-Shue, H.G. Bryan, W.M. Bryan, G.D. Heckman, L.B. Kinter, J.E.
McDonald, M.L. Moore, D.B. Schmidt, J.S. Silvestri, F.L. Stassen, L. Sulat, N.C.F. Yim and W.F. Huffman J. Med. Chem 1989, 32, 391-396.
52
83
55
Microcontact Printing with Hydrophilic Bisurea Thermoplastic Elastomers
Abstract In this chapter, the applicability of the thermoplastic elastomer pTHF-bisurea as the stamp material for microcontact printing is reported. The main advantages of using pTHF-bisurea as stamp material over the commonly used poly(dimethylsiloxane) (PDMS) are the reduced preparation time of the stamps and the hydrophilic character of pTHF-bisurea, which makes the stamps suitable for the printing of polar inks. The successful preparation of pTHF-bisurea stamps within 1 min via hot embossing against fluorinated silicon wafers is demonstrated. These stamps were successfully used for microcontact printing of hydrophobic as well as hydrophilic inks. Furthermore, the utility of pTHF-bisurea stamps for catalytic—or inkless—microcontact printing was investigated. The stamp material was functionalized with acidic groups via molecular recognition of the bisurea moieties in the stamp material with bisurea moieties in an acidic guest molecule. These acid-functionalized stamps were used for the selective hydrolysis of imine groups on a surface. Height and friction patterns were observed at the surface. Unfortunately, further experiments revealed the transfer of stamp material to the surface. Since the transfer cannot be prevented, pTHF-bisurea is not ideal for catalytic printing experiments. These results show that a critical attitude towards printing experiments with any stamp material, including PDMS (which is also known to contaminate substrates), is necessary.
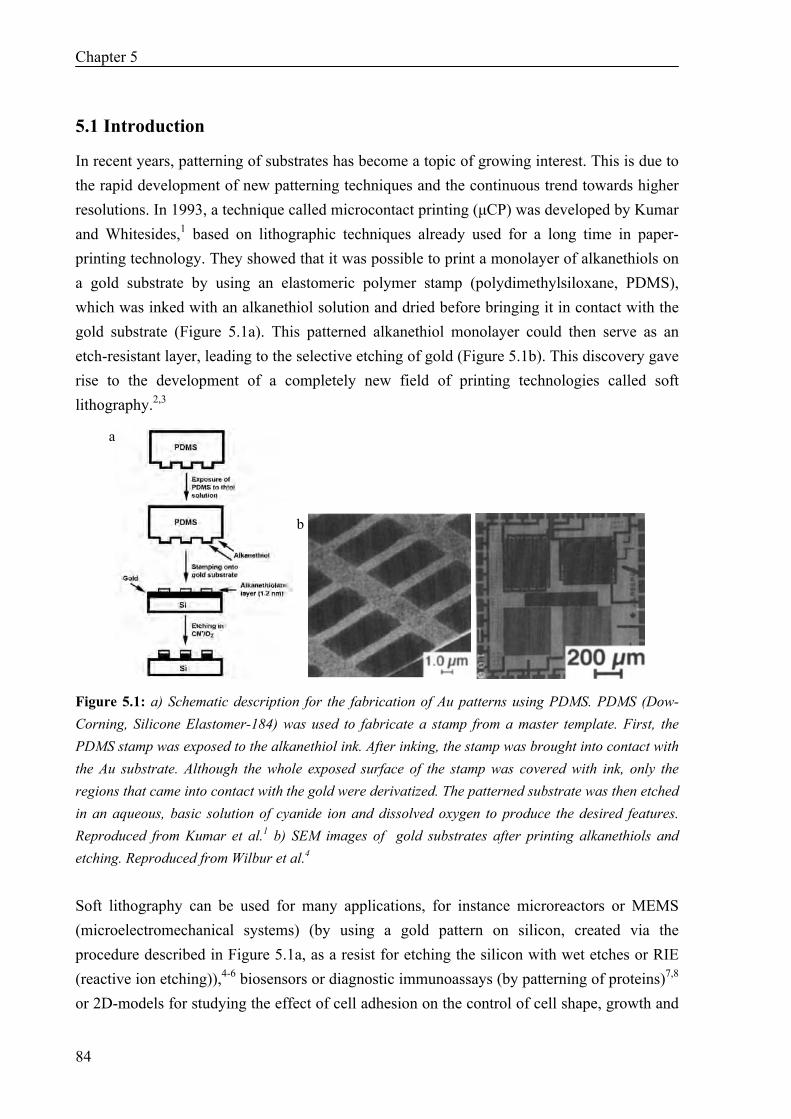
Chapter 5
84
5.1 Introduction
In recent years, patterning of substrates has become a topic of growing interest. This is due to the rapid development of new patterning techniques and the continuous trend towards higher resolutions. In 1993, a technique called microcontact printing (μCP) was developed by Kumar and Whitesides,1 based on lithographic techniques already used for a long time in paper-printing technology. They showed that it was possible to print a monolayer of alkanethiols on a gold substrate by using an elastomeric polymer stamp (polydimethylsiloxane, PDMS), which was inked with an alkanethiol solution and dried before bringing it in contact with the gold substrate (Figure 5.1a). This patterned alkanethiol monolayer could then serve as an etch-resistant layer, leading to the selective etching of gold (Figure 5.1b). This discovery gave rise to the development of a completely new field of printing technologies called soft lithography.2,3
a
b
Figure 5.1: a) Schematic description for the fabrication of Au patterns using PDMS. PDMS (Dow-Corning, Silicone Elastomer-184) was used to fabricate a stamp from a master template. First, the PDMS stamp was exposed to the alkanethiol ink. After inking, the stamp was brought into contact with the Au substrate. Although the whole exposed surface of the stamp was covered with ink, only the regions that came into contact with the gold were derivatized. The patterned substrate was then etched in an aqueous, basic solution of cyanide ion and dissolved oxygen to produce the desired features. Reproduced from Kumar et al.1 b) SEM images of gold substrates after printing alkanethiols and etching. Reproduced from Wilbur et al.4 Soft lithography can be used for many applications, for instance microreactors or MEMS (microelectromechanical systems) (by using a gold pattern on silicon, created via the procedure described in Figure 5.1a, as a resist for etching the silicon with wet etches or RIE (reactive ion etching)),4-6 biosensors or diagnostic immunoassays (by patterning of proteins)7,8 or 2D-models for studying the effect of cell adhesion on the control of cell shape, growth and
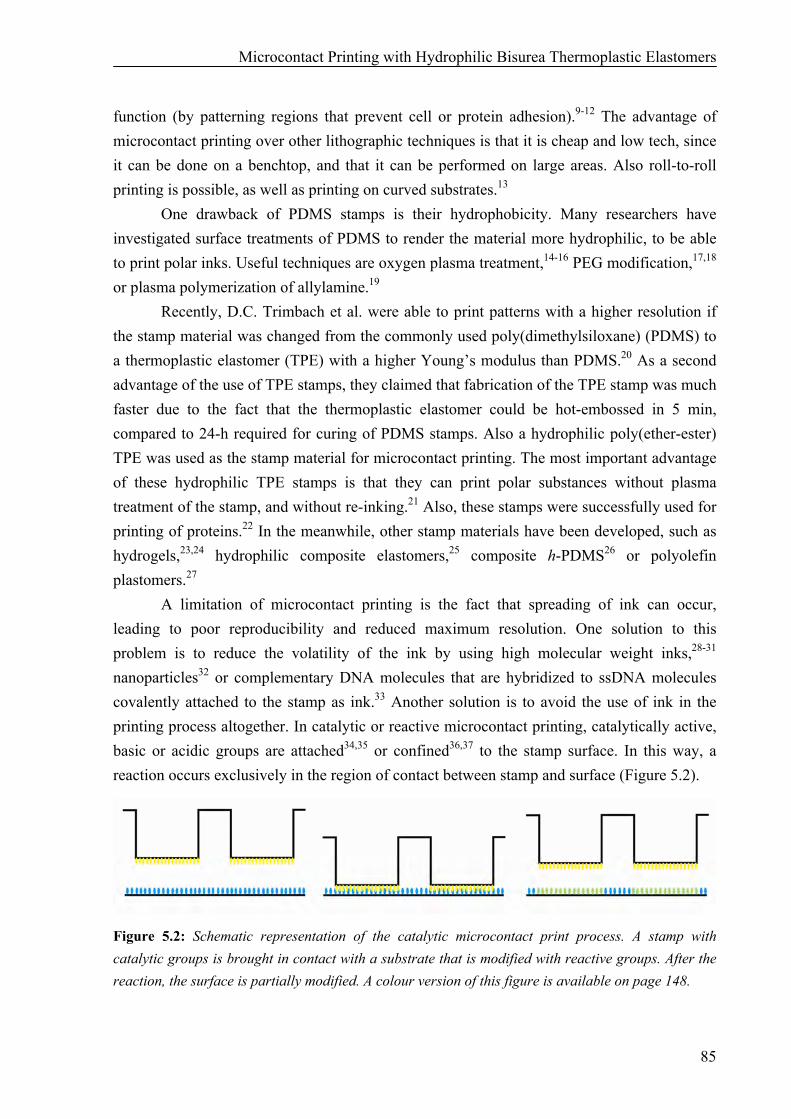
Microcontact Printing with Hydrophilic Bisurea Thermoplastic Elastomers
85
function (by patterning regions that prevent cell or protein adhesion).9-12 The advantage of microcontact printing over other lithographic techniques is that it is cheap and low tech, since it can be done on a benchtop, and that it can be performed on large areas. Also roll-to-roll printing is possible, as well as printing on curved substrates.13
One drawback of PDMS stamps is their hydrophobicity. Many researchers have investigated surface treatments of PDMS to render the material more hydrophilic, to be able to print polar inks. Useful techniques are oxygen plasma treatment,14-16 PEG modification,17,18 or plasma polymerization of allylamine.19
Recently, D.C. Trimbach et al. were able to print patterns with a higher resolution if the stamp material was changed from the commonly used poly(dimethylsiloxane) (PDMS) to a thermoplastic elastomer (TPE) with a higher Young’s modulus than PDMS.20 As a second advantage of the use of TPE stamps, they claimed that fabrication of the TPE stamp was much faster due to the fact that the thermoplastic elastomer could be hot-embossed in 5 min, compared to 24-h required for curing of PDMS stamps. Also a hydrophilic poly(ether-ester) TPE was used as the stamp material for microcontact printing. The most important advantage of these hydrophilic TPE stamps is that they can print polar substances without plasma treatment of the stamp, and without re-inking.21 Also, these stamps were successfully used for printing of proteins.22 In the meanwhile, other stamp materials have been developed, such as hydrogels,23,24 hydrophilic composite elastomers,25 composite h-PDMS26 or polyolefin plastomers.27 A limitation of microcontact printing is the fact that spreading of ink can occur, leading to poor reproducibility and reduced maximum resolution. One solution to this problem is to reduce the volatility of the ink by using high molecular weight inks,28-31 nanoparticles32 or complementary DNA molecules that are hybridized to ssDNA molecules covalently attached to the stamp as ink.33 Another solution is to avoid the use of ink in the printing process altogether. In catalytic or reactive microcontact printing, catalytically active, basic or acidic groups are attached34,35 or confined36,37 to the stamp surface. In this way, a reaction occurs exclusively in the region of contact between stamp and surface (Figure 5.2).
Figure 5.2: Schematic representation of the catalytic microcontact print process. A stamp with catalytic groups is brought in contact with a substrate that is modified with reactive groups. After the reaction, the surface is partially modified. A colour version of this figure is available on page 148.
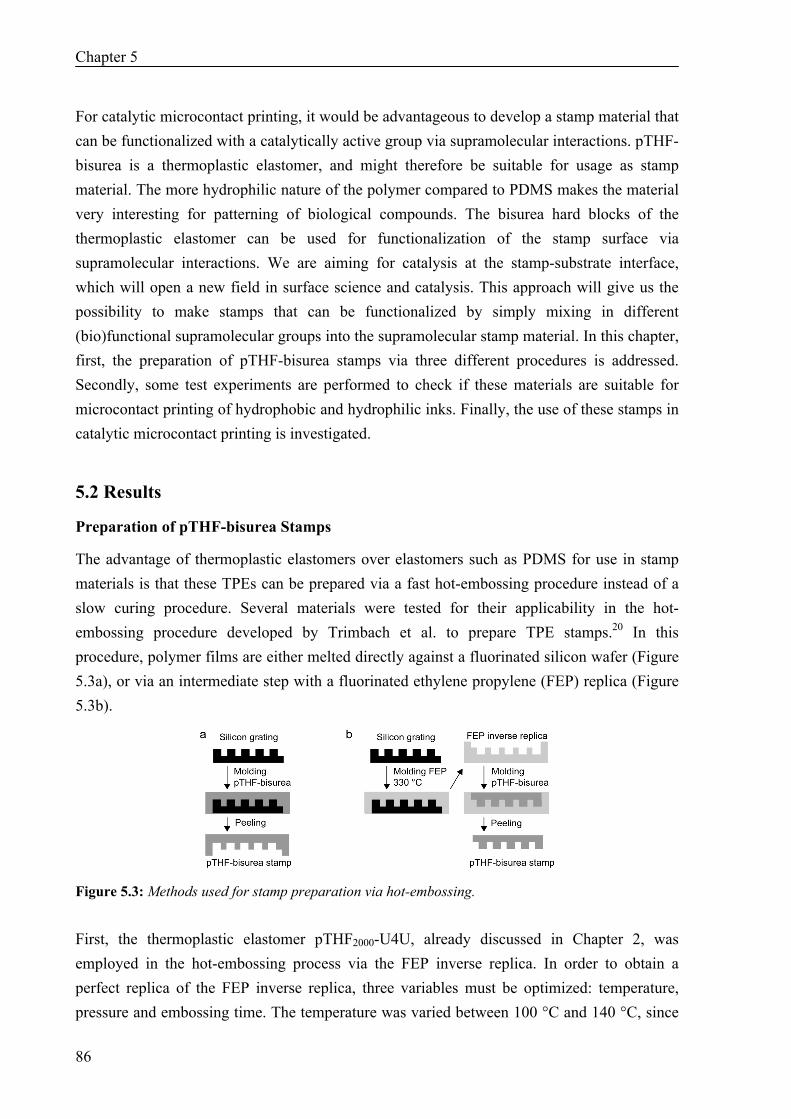
Chapter 5
86
For catalytic microcontact printing, it would be advantageous to develop a stamp material that can be functionalized with a catalytically active group via supramolecular interactions. pTHF-bisurea is a thermoplastic elastomer, and might therefore be suitable for usage as stamp material. The more hydrophilic nature of the polymer compared to PDMS makes the material very interesting for patterning of biological compounds. The bisurea hard blocks of the thermoplastic elastomer can be used for functionalization of the stamp surface via supramolecular interactions. We are aiming for catalysis at the stamp-substrate interface, which will open a new field in surface science and catalysis. This approach will give us the possibility to make stamps that can be functionalized by simply mixing in different (bio)functional supramolecular groups into the supramolecular stamp material. In this chapter, first, the preparation of pTHF-bisurea stamps via three different procedures is addressed. Secondly, some test experiments are performed to check if these materials are suitable for microcontact printing of hydrophobic and hydrophilic inks. Finally, the use of these stamps in catalytic microcontact printing is investigated.
5.2 Results
Preparation of pTHF-bisurea Stamps
The advantage of thermoplastic elastomers over elastomers such as PDMS for use in stamp materials is that these TPEs can be prepared via a fast hot-embossing procedure instead of a slow curing procedure. Several materials were tested for their applicability in the hot-embossing procedure developed by Trimbach et al. to prepare TPE stamps.20 In this procedure, polymer films are either melted directly against a fluorinated silicon wafer (Figure 5.3a), or via an intermediate step with a fluorinated ethylene propylene (FEP) replica (Figure 5.3b).
Figure 5.3: Methods used for stamp preparation via hot-embossing. First, the thermoplastic elastomer pTHF2000-U4U, already discussed in Chapter 2, was employed in the hot-embossing process via the FEP inverse replica. In order to obtain a perfect replica of the FEP inverse replica, three variables must be optimized: temperature, pressure and embossing time. The temperature was varied between 100 °C and 140 °C, since
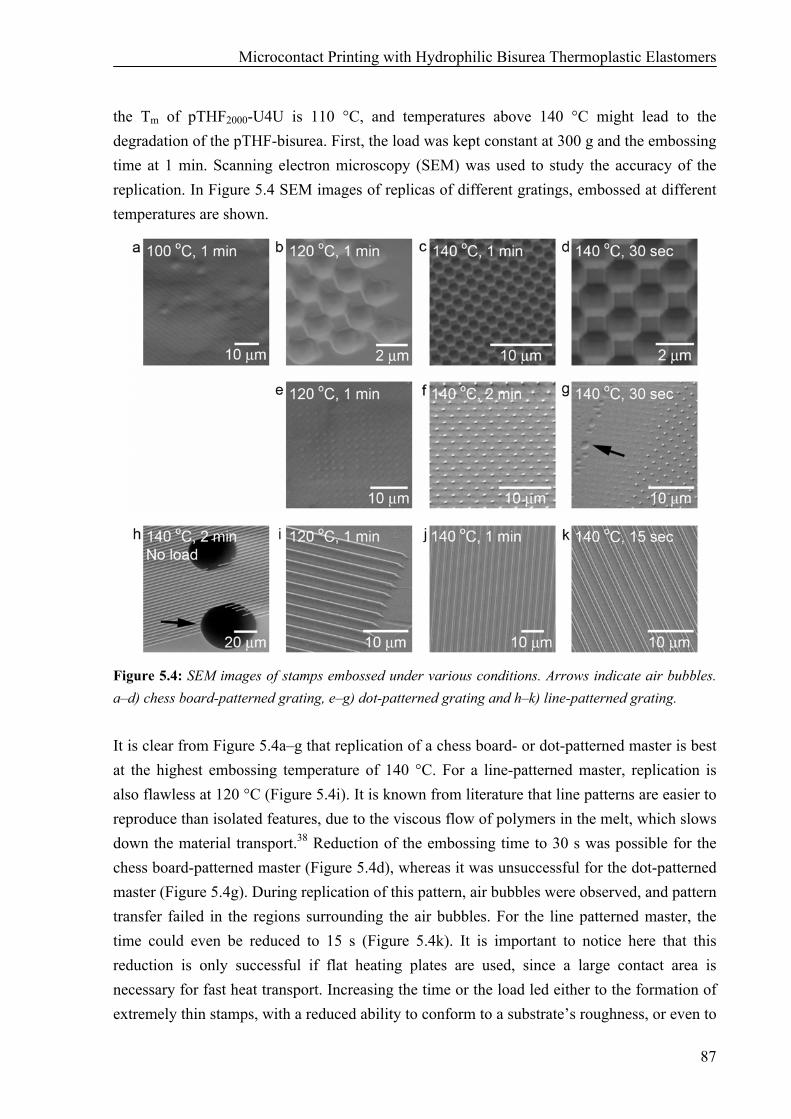
Microcontact Printing with Hydrophilic Bisurea Thermoplastic Elastomers
87
the Tm of pTHF2000-U4U is 110 °C, and temperatures above 140 °C might lead to the degradation of the pTHF-bisurea. First, the load was kept constant at 300 g and the embossing time at 1 min. Scanning electron microscopy (SEM) was used to study the accuracy of the replication. In Figure 5.4 SEM images of replicas of different gratings, embossed at different temperatures are shown.
Figure 5.4: SEM images of stamps embossed under various conditions. Arrows indicate air bubbles. a–d) chess board-patterned grating, e–g) dot-patterned grating and h–k) line-patterned grating. It is clear from Figure 5.4a–g that replication of a chess board- or dot-patterned master is best at the highest embossing temperature of 140 °C. For a line-patterned master, replication is also flawless at 120 °C (Figure 5.4i). It is known from literature that line patterns are easier to reproduce than isolated features, due to the viscous flow of polymers in the melt, which slows down the material transport.38 Reduction of the embossing time to 30 s was possible for the chess board-patterned master (Figure 5.4d), whereas it was unsuccessful for the dot-patterned master (Figure 5.4g). During replication of this pattern, air bubbles were observed, and pattern transfer failed in the regions surrounding the air bubbles. For the line patterned master, the time could even be reduced to 15 s (Figure 5.4k). It is important to notice here that this reduction is only successful if flat heating plates are used, since a large contact area is necessary for fast heat transport. Increasing the time or the load led either to the formation of extremely thin stamps, with a reduced ability to conform to a substrate’s roughness, or even to
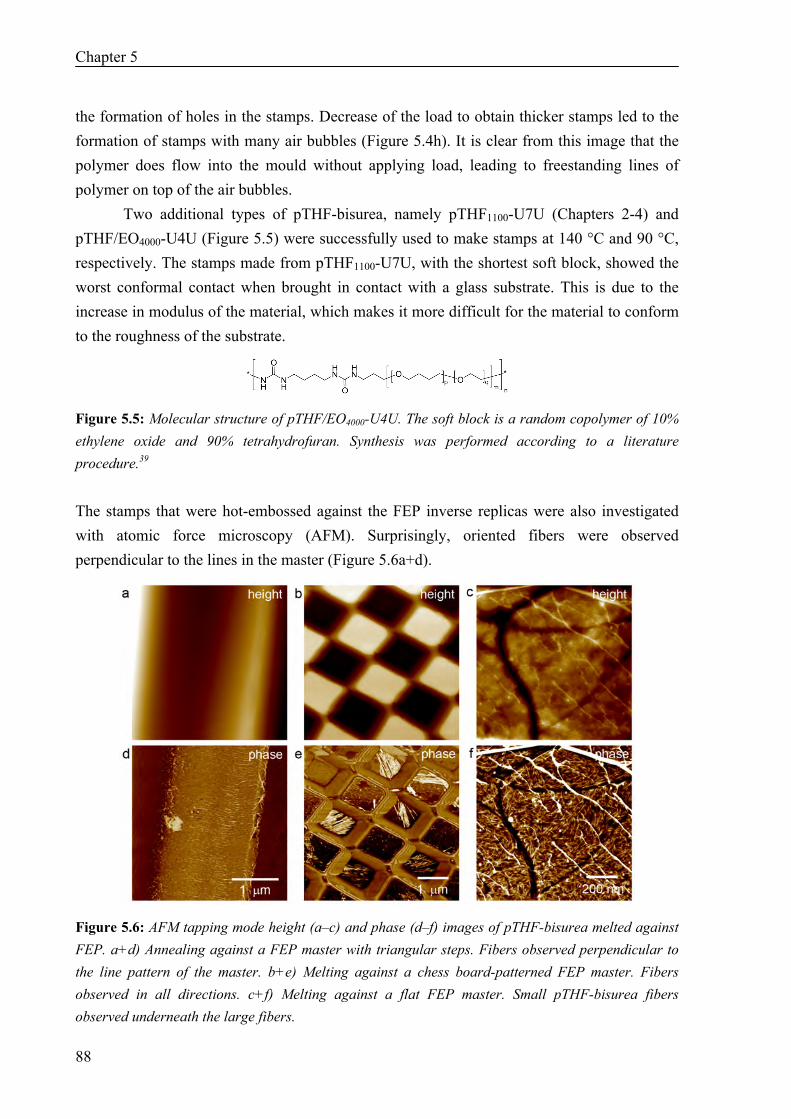
Chapter 5
88
the formation of holes in the stamps. Decrease of the load to obtain thicker stamps led to the formation of stamps with many air bubbles (Figure 5.4h). It is clear from this image that the polymer does flow into the mould without applying load, leading to freestanding lines of polymer on top of the air bubbles.
Two additional types of pTHF-bisurea, namely pTHF1100-U7U (Chapters 2-4) and pTHF/EO4000-U4U (Figure 5.5) were successfully used to make stamps at 140 °C and 90 °C, respectively. The stamps made from pTHF1100-U7U, with the shortest soft block, showed the worst conformal contact when brought in contact with a glass substrate. This is due to the increase in modulus of the material, which makes it more difficult for the material to conform to the roughness of the substrate.
Figure 5.5: Molecular structure of pTHF/EO4000-U4U. The soft block is a random copolymer of 10% ethylene oxide and 90% tetrahydrofuran. Synthesis was performed according to a literature procedure.39
The stamps that were hot-embossed against the FEP inverse replicas were also investigated with atomic force microscopy (AFM). Surprisingly, oriented fibers were observed perpendicular to the lines in the master (Figure 5.6a+d).
Figure 5.6: AFM tapping mode height (a–c) and phase (d–f) images of pTHF-bisurea melted against FEP. a+d) Annealing against a FEP master with triangular steps. Fibers observed perpendicular to the line pattern of the master. b+e) Melting against a chess board-patterned FEP master. Fibers observed in all directions. c+f) Melting against a flat FEP master. Small pTHF-bisurea fibers observed underneath the large fibers.
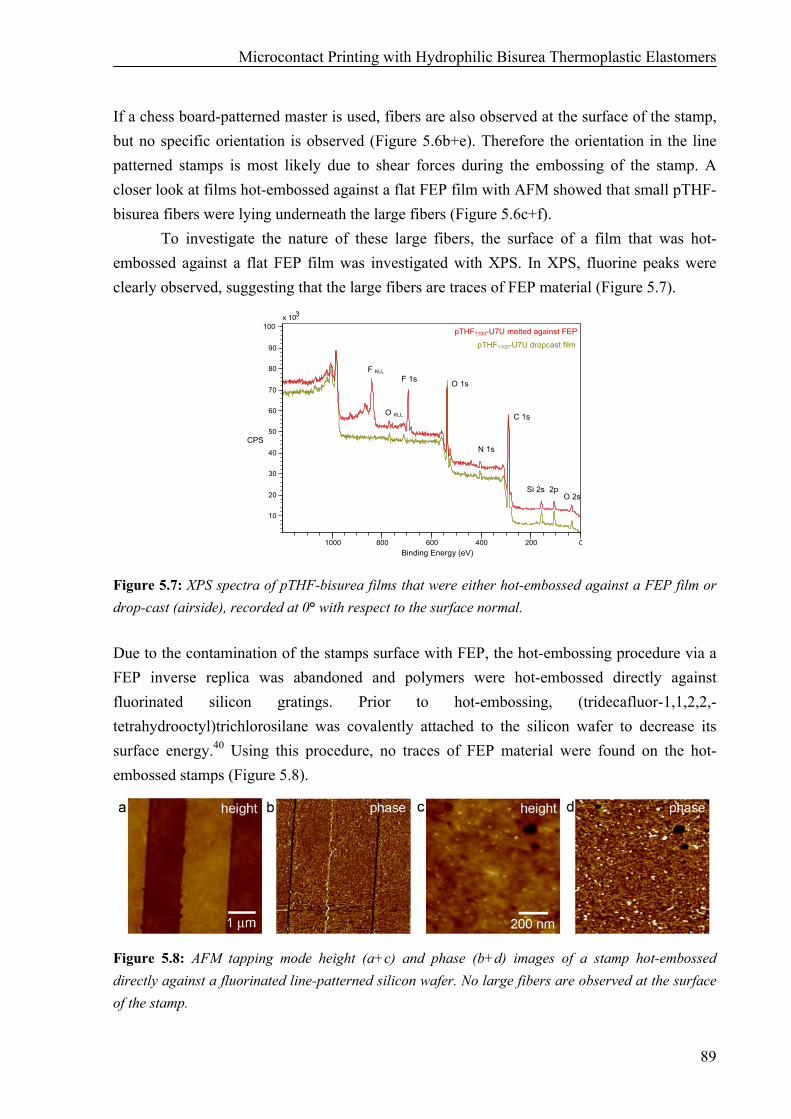
Microcontact Printing with Hydrophilic Bisurea Thermoplastic Elastomers
89
If a chess board-patterned master is used, fibers are also observed at the surface of the stamp, but no specific orientation is observed (Figure 5.6b+e). Therefore the orientation in the line patterned stamps is most likely due to shear forces during the embossing of the stamp. A closer look at films hot-embossed against a flat FEP film with AFM showed that small pTHF-bisurea fibers were lying underneath the large fibers (Figure 5.6c+f).
To investigate the nature of these large fibers, the surface of a film that was hot-embossed against a flat FEP film was investigated with XPS. In XPS, fluorine peaks were clearly observed, suggesting that the large fibers are traces of FEP material (Figure 5.7).
pTHF1100-U7U melted against FEP
pTHF1100-U7U dropcast film
x 10 3
10
20
30
40
50
60
70
80
90
100
CPS
1000 800 600 400 200 0Binding Energy (eV)
O 1s
C 1s
N 1s
Si 2s 2pO 2s
F 1sF KLL
O KLL
Figure 5.7: XPS spectra of pTHF-bisurea films that were either hot-embossed against a FEP film or drop-cast (airside), recorded at 0° with respect to the surface normal. Due to the contamination of the stamps surface with FEP, the hot-embossing procedure via a FEP inverse replica was abandoned and polymers were hot-embossed directly against fluorinated silicon gratings. Prior to hot-embossing, (tridecafluor-1,1,2,2,-tetrahydrooctyl)trichlorosilane was covalently attached to the silicon wafer to decrease its surface energy.40 Using this procedure, no traces of FEP material were found on the hot-embossed stamps (Figure 5.8).
Figure 5.8: AFM tapping mode height (a+c) and phase (b+d) images of a stamp hot-embossed directly against a fluorinated line-patterned silicon wafer. No large fibers are observed at the surface of the stamp.
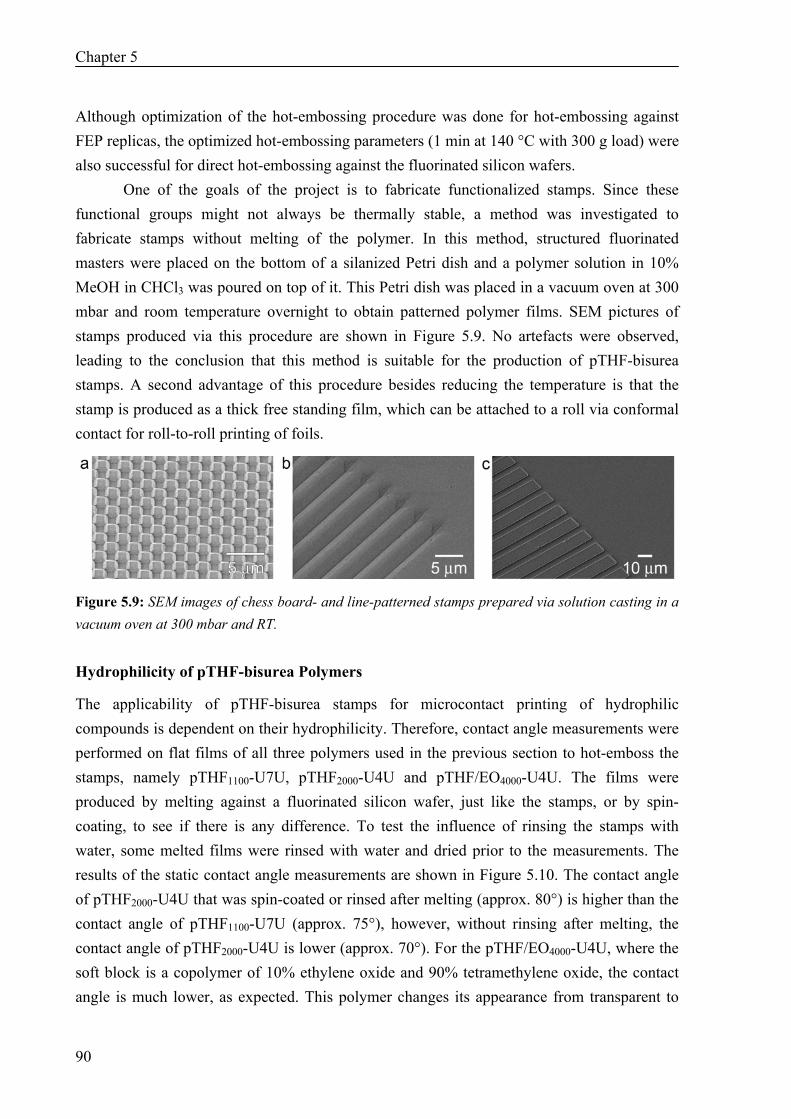
Chapter 5
90
Although optimization of the hot-embossing procedure was done for hot-embossing against FEP replicas, the optimized hot-embossing parameters (1 min at 140 °C with 300 g load) were also successful for direct hot-embossing against the fluorinated silicon wafers.
One of the goals of the project is to fabricate functionalized stamps. Since these functional groups might not always be thermally stable, a method was investigated to fabricate stamps without melting of the polymer. In this method, structured fluorinated masters were placed on the bottom of a silanized Petri dish and a polymer solution in 10% MeOH in CHCl3 was poured on top of it. This Petri dish was placed in a vacuum oven at 300 mbar and room temperature overnight to obtain patterned polymer films. SEM pictures of stamps produced via this procedure are shown in Figure 5.9. No artefacts were observed, leading to the conclusion that this method is suitable for the production of pTHF-bisurea stamps. A second advantage of this procedure besides reducing the temperature is that the stamp is produced as a thick free standing film, which can be attached to a roll via conformal contact for roll-to-roll printing of foils.
Figure 5.9: SEM images of chess board- and line-patterned stamps prepared via solution casting in a vacuum oven at 300 mbar and RT. Hydrophilicity of pTHF-bisurea Polymers
The applicability of pTHF-bisurea stamps for microcontact printing of hydrophilic compounds is dependent on their hydrophilicity. Therefore, contact angle measurements were performed on flat films of all three polymers used in the previous section to hot-emboss the stamps, namely pTHF1100-U7U, pTHF2000-U4U and pTHF/EO4000-U4U. The films were produced by melting against a fluorinated silicon wafer, just like the stamps, or by spin-coating, to see if there is any difference. To test the influence of rinsing the stamps with water, some melted films were rinsed with water and dried prior to the measurements. The results of the static contact angle measurements are shown in Figure 5.10. The contact angle of pTHF2000-U4U that was spin-coated or rinsed after melting (approx. 80°) is higher than the contact angle of pTHF1100-U7U (approx. 75°), however, without rinsing after melting, the contact angle of pTHF2000-U4U is lower (approx. 70°). For the pTHF/EO4000-U4U, where the soft block is a copolymer of 10% ethylene oxide and 90% tetramethylene oxide, the contact angle is much lower, as expected. This polymer changes its appearance from transparent to
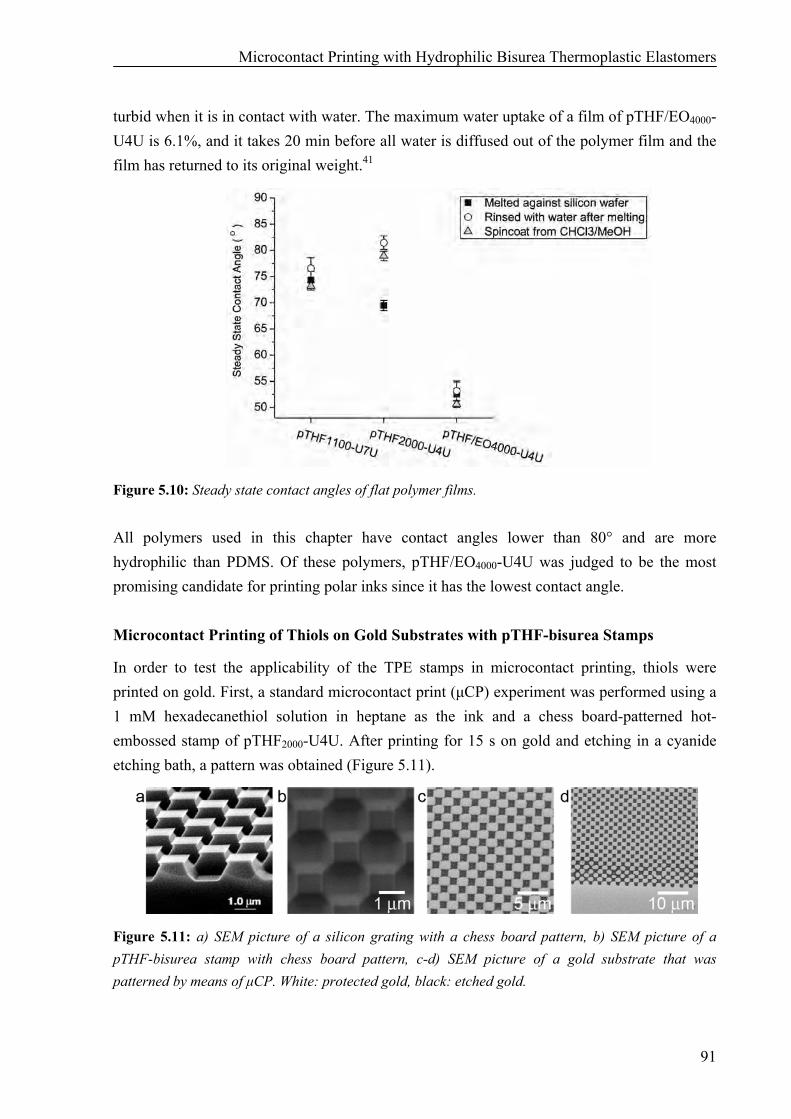
Microcontact Printing with Hydrophilic Bisurea Thermoplastic Elastomers
91
turbid when it is in contact with water. The maximum water uptake of a film of pTHF/EO4000-U4U is 6.1%, and it takes 20 min before all water is diffused out of the polymer film and the film has returned to its original weight.41
Figure 5.10: Steady state contact angles of flat polymer films. All polymers used in this chapter have contact angles lower than 80° and are more hydrophilic than PDMS. Of these polymers, pTHF/EO4000-U4U was judged to be the most promising candidate for printing polar inks since it has the lowest contact angle. Microcontact Printing of Thiols on Gold Substrates with pTHF-bisurea Stamps
In order to test the applicability of the TPE stamps in microcontact printing, thiols were printed on gold. First, a standard microcontact print (μCP) experiment was performed using a 1 mM hexadecanethiol solution in heptane as the ink and a chess board-patterned hot-embossed stamp of pTHF2000-U4U. After printing for 15 s on gold and etching in a cyanide etching bath, a pattern was obtained (Figure 5.11).
Figure 5.11: a) SEM picture of a silicon grating with a chess board pattern, b) SEM picture of a pTHF-bisurea stamp with chess board pattern, c-d) SEM picture of a gold substrate that was patterned by means of μCP. White: protected gold, black: etched gold.
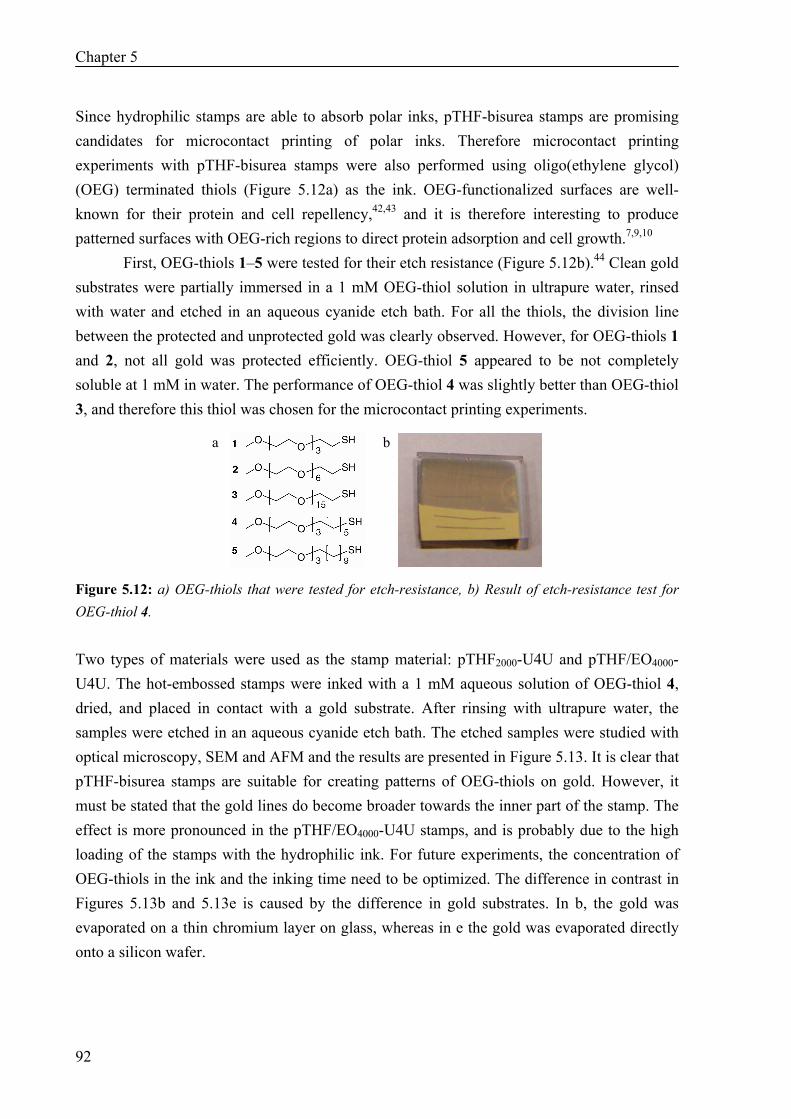
Chapter 5
92
Since hydrophilic stamps are able to absorb polar inks, pTHF-bisurea stamps are promising candidates for microcontact printing of polar inks. Therefore microcontact printing experiments with pTHF-bisurea stamps were also performed using oligo(ethylene glycol) (OEG) terminated thiols (Figure 5.12a) as the ink. OEG-functionalized surfaces are well-known for their protein and cell repellency,42,43 and it is therefore interesting to produce patterned surfaces with OEG-rich regions to direct protein adsorption and cell growth.7,9,10
First, OEG-thiols 1–5 were tested for their etch resistance (Figure 5.12b).44 Clean gold substrates were partially immersed in a 1 mM OEG-thiol solution in ultrapure water, rinsed with water and etched in an aqueous cyanide etch bath. For all the thiols, the division line between the protected and unprotected gold was clearly observed. However, for OEG-thiols 1 and 2, not all gold was protected efficiently. OEG-thiol 5 appeared to be not completely soluble at 1 mM in water. The performance of OEG-thiol 4 was slightly better than OEG-thiol 3, and therefore this thiol was chosen for the microcontact printing experiments.
a
b
Figure 5.12: a) OEG-thiols that were tested for etch-resistance, b) Result of etch-resistance test for OEG-thiol 4. Two types of materials were used as the stamp material: pTHF2000-U4U and pTHF/EO4000-U4U. The hot-embossed stamps were inked with a 1 mM aqueous solution of OEG-thiol 4, dried, and placed in contact with a gold substrate. After rinsing with ultrapure water, the samples were etched in an aqueous cyanide etch bath. The etched samples were studied with optical microscopy, SEM and AFM and the results are presented in Figure 5.13. It is clear that pTHF-bisurea stamps are suitable for creating patterns of OEG-thiols on gold. However, it must be stated that the gold lines do become broader towards the inner part of the stamp. The effect is more pronounced in the pTHF/EO4000-U4U stamps, and is probably due to the high loading of the stamps with the hydrophilic ink. For future experiments, the concentration of OEG-thiols in the ink and the inking time need to be optimized. The difference in contrast in Figures 5.13b and 5.13e is caused by the difference in gold substrates. In b, the gold was evaporated on a thin chromium layer on glass, whereas in e the gold was evaporated directly onto a silicon wafer.
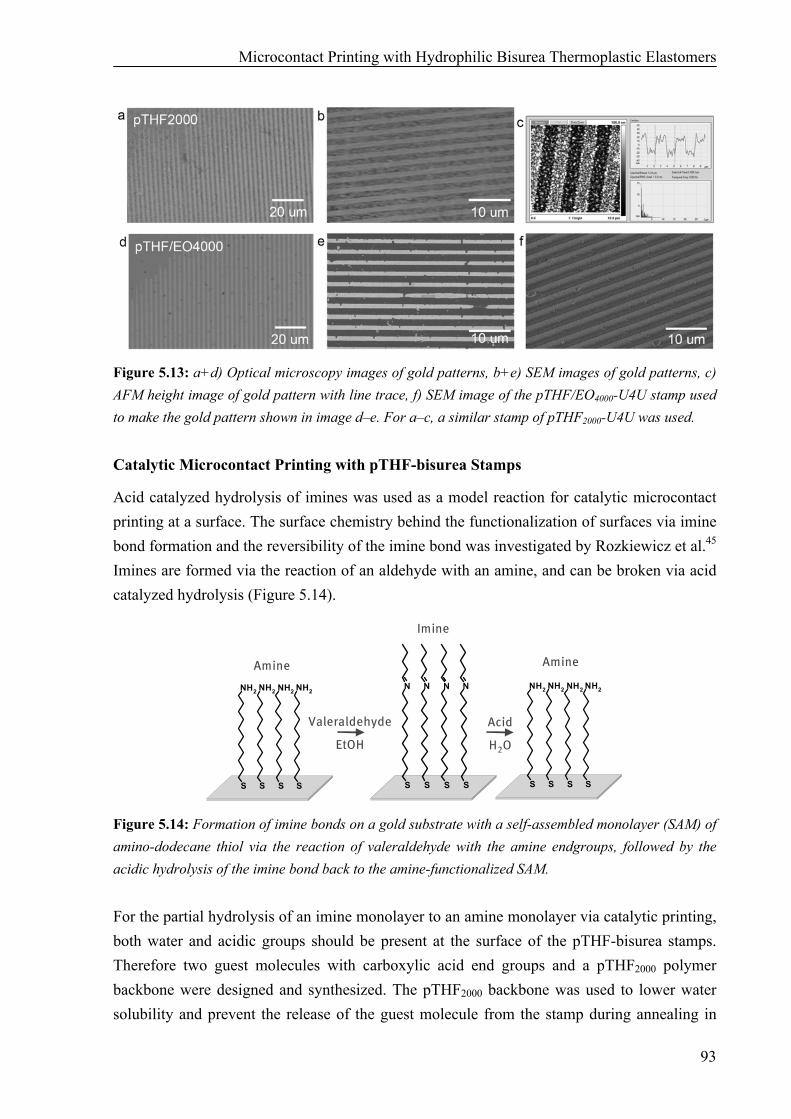
Microcontact Printing with Hydrophilic Bisurea Thermoplastic Elastomers
93
Figure 5.13: a+d) Optical microscopy images of gold patterns, b+e) SEM images of gold patterns, c) AFM height image of gold pattern with line trace, f) SEM image of the pTHF/EO4000-U4U stamp used to make the gold pattern shown in image d–e. For a–c, a similar stamp of pTHF2000-U4U was used. Catalytic Microcontact Printing with pTHF-bisurea Stamps
Acid catalyzed hydrolysis of imines was used as a model reaction for catalytic microcontact printing at a surface. The surface chemistry behind the functionalization of surfaces via imine bond formation and the reversibility of the imine bond was investigated by Rozkiewicz et al.45 Imines are formed via the reaction of an aldehyde with an amine, and can be broken via acid catalyzed hydrolysis (Figure 5.14).
NH2
S
NH2
S
NH2
S
NH2
S
Acid
H2O
Amine
Imine
N
S
N
S
N
S
N
S
NH2
S
NH2
S
NH2
S
NH2
S
Valeraldehyde
EtOH
Amine
Figure 5.14: Formation of imine bonds on a gold substrate with a self-assembled monolayer (SAM) of amino-dodecane thiol via the reaction of valeraldehyde with the amine endgroups, followed by the acidic hydrolysis of the imine bond back to the amine-functionalized SAM. For the partial hydrolysis of an imine monolayer to an amine monolayer via catalytic printing, both water and acidic groups should be present at the surface of the pTHF-bisurea stamps. Therefore two guest molecules with carboxylic acid end groups and a pTHF2000 polymer backbone were designed and synthesized. The pTHF2000 backbone was used to lower water solubility and prevent the release of the guest molecule from the stamp during annealing in
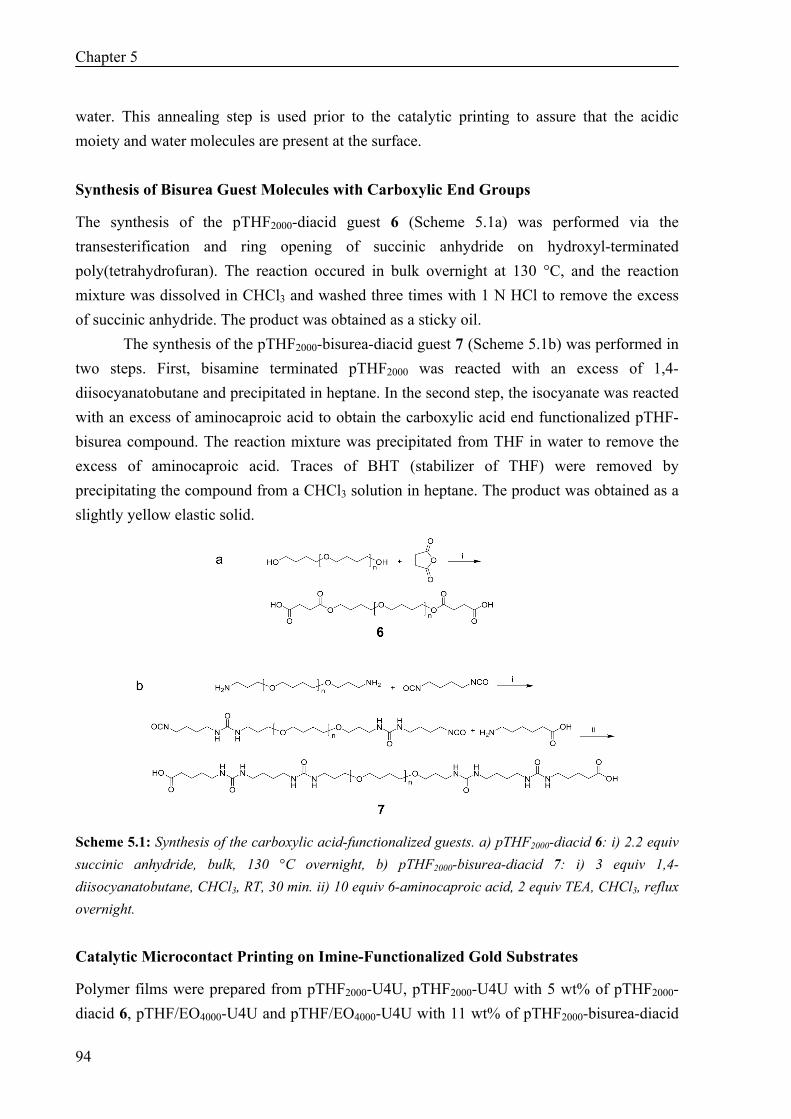
Chapter 5
94
water. This annealing step is used prior to the catalytic printing to assure that the acidic moiety and water molecules are present at the surface. Synthesis of Bisurea Guest Molecules with Carboxylic End Groups
The synthesis of the pTHF2000-diacid guest 6 (Scheme 5.1a) was performed via the transesterification and ring opening of succinic anhydride on hydroxyl-terminated poly(tetrahydrofuran). The reaction occured in bulk overnight at 130 °C, and the reaction mixture was dissolved in CHCl3 and washed three times with 1 N HCl to remove the excess of succinic anhydride. The product was obtained as a sticky oil.
The synthesis of the pTHF2000-bisurea-diacid guest 7 (Scheme 5.1b) was performed in two steps. First, bisamine terminated pTHF2000 was reacted with an excess of 1,4-diisocyanatobutane and precipitated in heptane. In the second step, the isocyanate was reacted with an excess of aminocaproic acid to obtain the carboxylic acid end functionalized pTHF-bisurea compound. The reaction mixture was precipitated from THF in water to remove the excess of aminocaproic acid. Traces of BHT (stabilizer of THF) were removed by precipitating the compound from a CHCl3 solution in heptane. The product was obtained as a slightly yellow elastic solid.
Scheme 5.1: Synthesis of the carboxylic acid-functionalized guests. a) pTHF2000-diacid 6: i) 2.2 equiv succinic anhydride, bulk, 130 °C overnight, b) pTHF2000-bisurea-diacid 7: i) 3 equiv 1,4-diisocyanatobutane, CHCl3, RT, 30 min. ii) 10 equiv 6-aminocaproic acid, 2 equiv TEA, CHCl3, reflux overnight. Catalytic Microcontact Printing on Imine-Functionalized Gold Substrates
Polymer films were prepared from pTHF2000-U4U, pTHF2000-U4U with 5 wt% of pTHF2000-diacid 6, pTHF/EO4000-U4U and pTHF/EO4000-U4U with 11 wt% of pTHF2000-bisurea-diacid
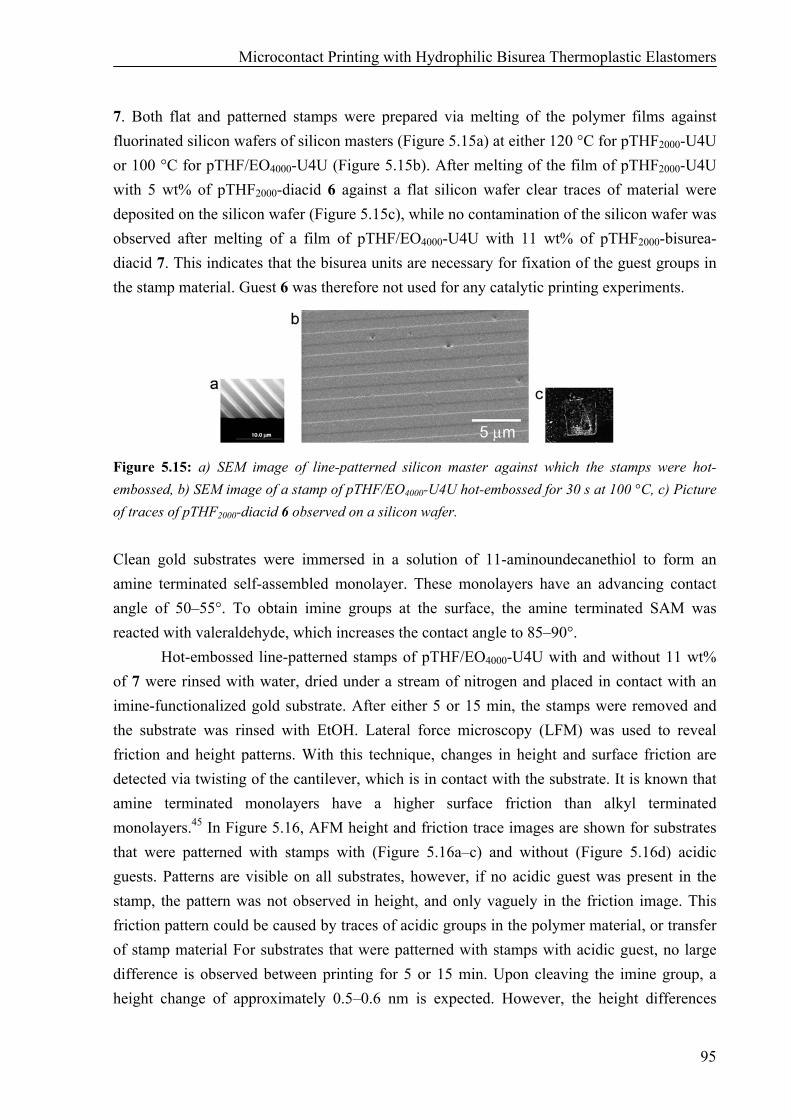
Microcontact Printing with Hydrophilic Bisurea Thermoplastic Elastomers
95
7. Both flat and patterned stamps were prepared via melting of the polymer films against fluorinated silicon wafers of silicon masters (Figure 5.15a) at either 120 °C for pTHF2000-U4U or 100 °C for pTHF/EO4000-U4U (Figure 5.15b). After melting of the film of pTHF2000-U4U with 5 wt% of pTHF2000-diacid 6 against a flat silicon wafer clear traces of material were deposited on the silicon wafer (Figure 5.15c), while no contamination of the silicon wafer was observed after melting of a film of pTHF/EO4000-U4U with 11 wt% of pTHF2000-bisurea-diacid 7. This indicates that the bisurea units are necessary for fixation of the guest groups in the stamp material. Guest 6 was therefore not used for any catalytic printing experiments.
Figure 5.15: a) SEM image of line-patterned silicon master against which the stamps were hot-embossed, b) SEM image of a stamp of pTHF/EO4000-U4U hot-embossed for 30 s at 100 °C, c) Picture of traces of pTHF2000-diacid 6 observed on a silicon wafer. Clean gold substrates were immersed in a solution of 11-aminoundecanethiol to form an amine terminated self-assembled monolayer. These monolayers have an advancing contact angle of 50–55°. To obtain imine groups at the surface, the amine terminated SAM was reacted with valeraldehyde, which increases the contact angle to 85–90°. Hot-embossed line-patterned stamps of pTHF/EO4000-U4U with and without 11 wt% of 7 were rinsed with water, dried under a stream of nitrogen and placed in contact with an imine-functionalized gold substrate. After either 5 or 15 min, the stamps were removed and the substrate was rinsed with EtOH. Lateral force microscopy (LFM) was used to reveal friction and height patterns. With this technique, changes in height and surface friction are detected via twisting of the cantilever, which is in contact with the substrate. It is known that amine terminated monolayers have a higher surface friction than alkyl terminated monolayers.45 In Figure 5.16, AFM height and friction trace images are shown for substrates that were patterned with stamps with (Figure 5.16a–c) and without (Figure 5.16d) acidic guests. Patterns are visible on all substrates, however, if no acidic guest was present in the stamp, the pattern was not observed in height, and only vaguely in the friction image. This friction pattern could be caused by traces of acidic groups in the polymer material, or transfer of stamp material For substrates that were patterned with stamps with acidic guest, no large difference is observed between printing for 5 or 15 min. Upon cleaving the imine group, a height change of approximately 0.5–0.6 nm is expected. However, the height differences
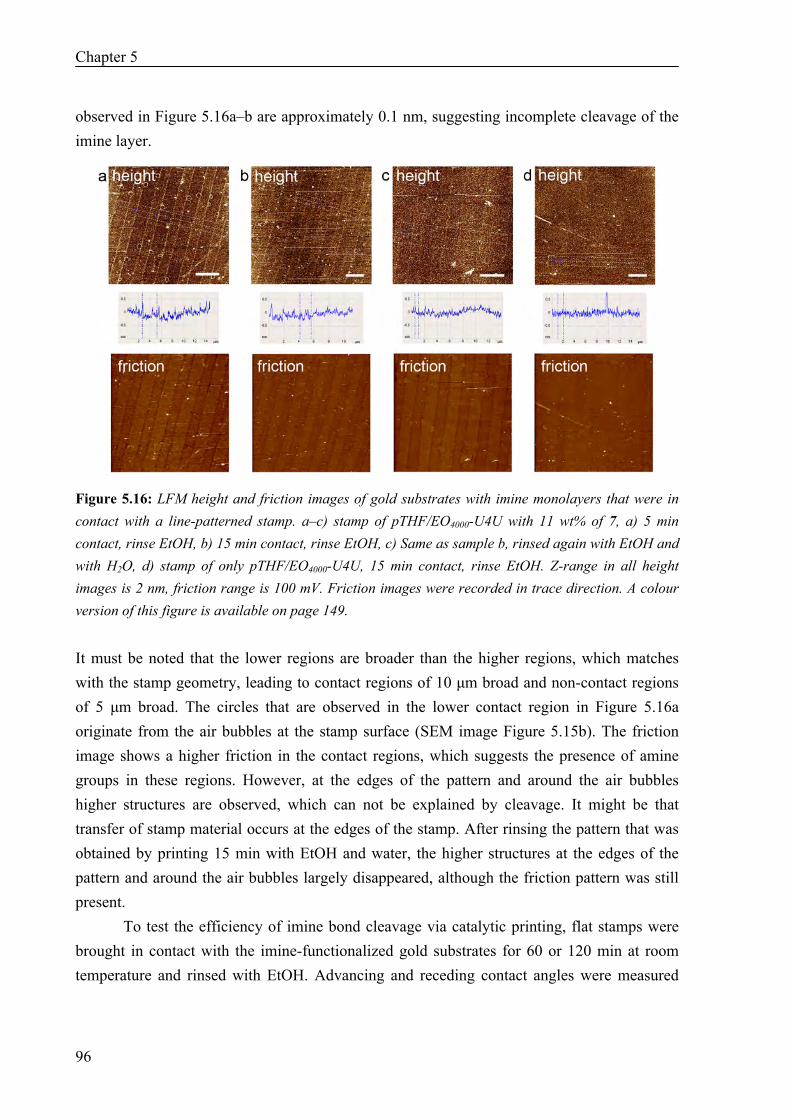
Chapter 5
96
observed in Figure 5.16a–b are approximately 0.1 nm, suggesting incomplete cleavage of the imine layer.
Figure 5.16: LFM height and friction images of gold substrates with imine monolayers that were in contact with a line-patterned stamp. a–c) stamp of pTHF/EO4000-U4U with 11 wt% of 7, a) 5 min contact, rinse EtOH, b) 15 min contact, rinse EtOH, c) Same as sample b, rinsed again with EtOH and with H2O, d) stamp of only pTHF/EO4000-U4U, 15 min contact, rinse EtOH. Z-range in all height images is 2 nm, friction range is 100 mV. Friction images were recorded in trace direction. A colour version of this figure is available on page 149. It must be noted that the lower regions are broader than the higher regions, which matches with the stamp geometry, leading to contact regions of 10 μm broad and non-contact regions of 5 μm broad. The circles that are observed in the lower contact region in Figure 5.16a originate from the air bubbles at the stamp surface (SEM image Figure 5.15b). The friction image shows a higher friction in the contact regions, which suggests the presence of amine groups in these regions. However, at the edges of the pattern and around the air bubbles higher structures are observed, which can not be explained by cleavage. It might be that transfer of stamp material occurs at the edges of the stamp. After rinsing the pattern that was obtained by printing 15 min with EtOH and water, the higher structures at the edges of the pattern and around the air bubbles largely disappeared, although the friction pattern was still present.
To test the efficiency of imine bond cleavage via catalytic printing, flat stamps were brought in contact with the imine-functionalized gold substrates for 60 or 120 min at room temperature and rinsed with EtOH. Advancing and receding contact angles were measured
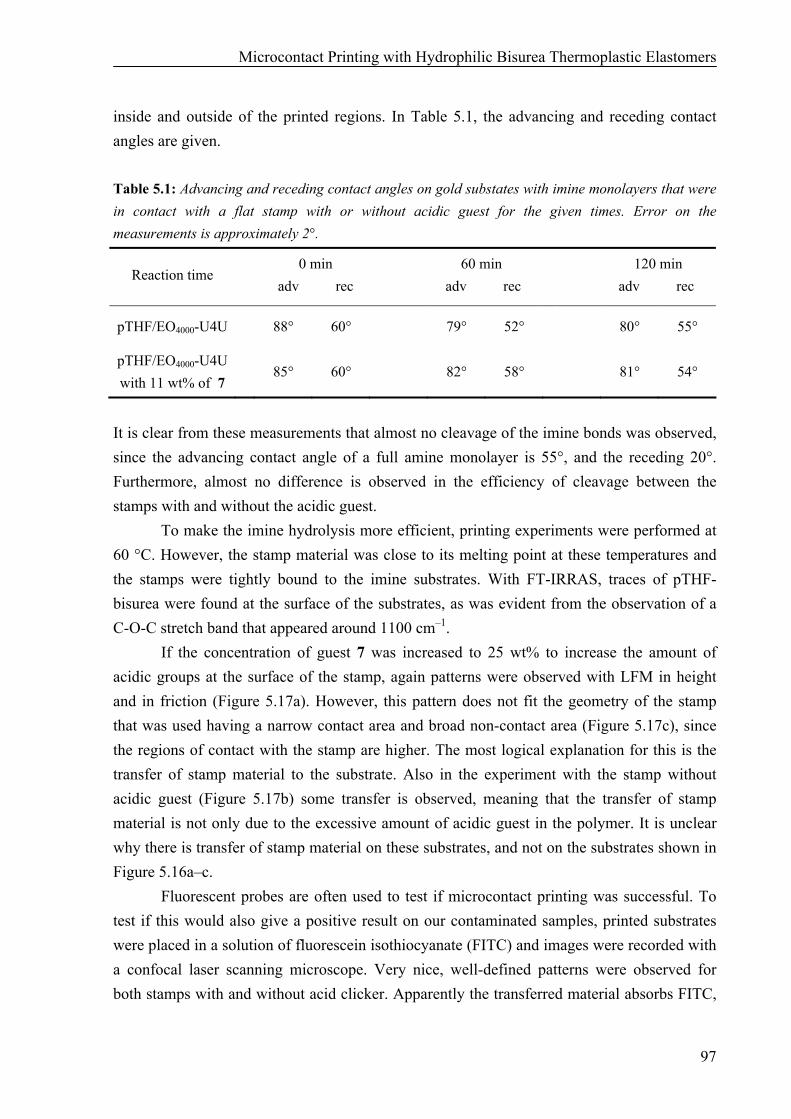
Microcontact Printing with Hydrophilic Bisurea Thermoplastic Elastomers
97
inside and outside of the printed regions. In Table 5.1, the advancing and receding contact angles are given. Table 5.1: Advancing and receding contact angles on gold substates with imine monolayers that were in contact with a flat stamp with or without acidic guest for the given times. Error on the measurements is approximately 2°.
Reaction time 0 min
adv rec 60 min
adv rec 120 min
adv rec
pTHF/EO4000-U4U 88° 60° 79° 52° 80° 55°
pTHF/EO4000-U4U with 11 wt% of 7
85° 60° 82° 58° 81° 54°
It is clear from these measurements that almost no cleavage of the imine bonds was observed, since the advancing contact angle of a full amine monolayer is 55°, and the receding 20°. Furthermore, almost no difference is observed in the efficiency of cleavage between the stamps with and without the acidic guest. To make the imine hydrolysis more efficient, printing experiments were performed at 60 °C. However, the stamp material was close to its melting point at these temperatures and the stamps were tightly bound to the imine substrates. With FT-IRRAS, traces of pTHF-bisurea were found at the surface of the substrates, as was evident from the observation of a C-O-C stretch band that appeared around 1100 cm–1. If the concentration of guest 7 was increased to 25 wt% to increase the amount of acidic groups at the surface of the stamp, again patterns were observed with LFM in height and in friction (Figure 5.17a). However, this pattern does not fit the geometry of the stamp that was used having a narrow contact area and broad non-contact area (Figure 5.17c), since the regions of contact with the stamp are higher. The most logical explanation for this is the transfer of stamp material to the substrate. Also in the experiment with the stamp without acidic guest (Figure 5.17b) some transfer is observed, meaning that the transfer of stamp material is not only due to the excessive amount of acidic guest in the polymer. It is unclear why there is transfer of stamp material on these substrates, and not on the substrates shown in Figure 5.16a–c.
Fluorescent probes are often used to test if microcontact printing was successful. To test if this would also give a positive result on our contaminated samples, printed substrates were placed in a solution of fluorescein isothiocyanate (FITC) and images were recorded with a confocal laser scanning microscope. Very nice, well-defined patterns were observed for both stamps with and without acid clicker. Apparently the transferred material absorbs FITC,
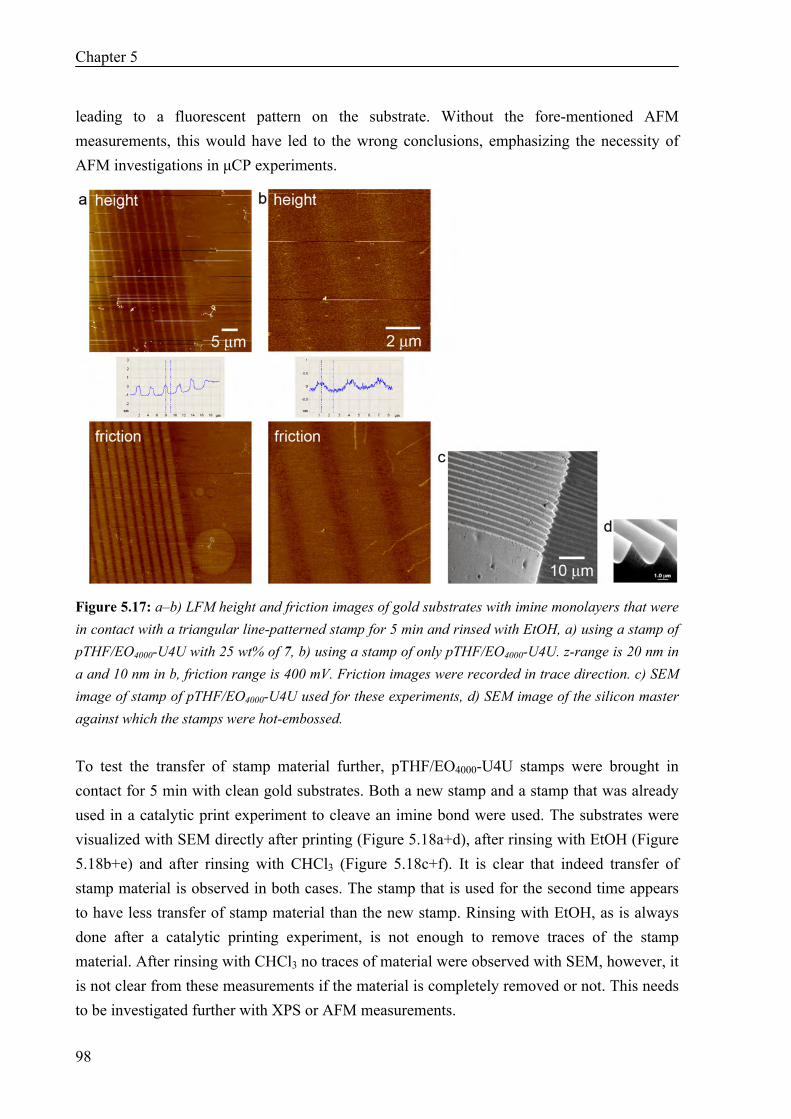
Chapter 5
98
leading to a fluorescent pattern on the substrate. Without the fore-mentioned AFM measurements, this would have led to the wrong conclusions, emphasizing the necessity of AFM investigations in μCP experiments.
Figure 5.17: a–b) LFM height and friction images of gold substrates with imine monolayers that were in contact with a triangular line-patterned stamp for 5 min and rinsed with EtOH, a) using a stamp of pTHF/EO4000-U4U with 25 wt% of 7, b) using a stamp of only pTHF/EO4000-U4U. z-range is 20 nm in a and 10 nm in b, friction range is 400 mV. Friction images were recorded in trace direction. c) SEM image of stamp of pTHF/EO4000-U4U used for these experiments, d) SEM image of the silicon master against which the stamps were hot-embossed. To test the transfer of stamp material further, pTHF/EO4000-U4U stamps were brought in contact for 5 min with clean gold substrates. Both a new stamp and a stamp that was already used in a catalytic print experiment to cleave an imine bond were used. The substrates were visualized with SEM directly after printing (Figure 5.18a+d), after rinsing with EtOH (Figure 5.18b+e) and after rinsing with CHCl3 (Figure 5.18c+f). It is clear that indeed transfer of stamp material is observed in both cases. The stamp that is used for the second time appears to have less transfer of stamp material than the new stamp. Rinsing with EtOH, as is always done after a catalytic printing experiment, is not enough to remove traces of the stamp material. After rinsing with CHCl3 no traces of material were observed with SEM, however, it is not clear from these measurements if the material is completely removed or not. This needs to be investigated further with XPS or AFM measurements.
Microcontact Printing with Hydrophilic Bisurea Thermoplastic Elastomers
99
Figure 5.18: SEM images of gold substrates that were brought in contact with either a new pTHF/EO4000-U4U stamp (a–c) or a pTHF/EO4000-U4U stamp that was already used in a printing experiment (d–f). After rinsing with EtOH, the patterns are still visible (b, e), but after rinsing with CHCl3 no visible traces are left at the surface (c, f).
5.3 Discussion and Conclusions
In this chapter, the possibilities for the use of pTHF-bisurea materials as stamp material were explored. The preparation of the stamps was successful via hot-embossing against a fluorinated silicon wafer or via solution casting. Hot-embossing of the stamps against a fluorinated ethylene propylene master is not a useful route, since traces of the FEP material were found at the stamp surface. Since the FEP is hydrophobic, this will reduce the hydrophilicity of the stamp. The pTHF-bisurea stamps were successfully used for the microcontact printing of hydrophobic alkane thiol inks as well as for hydrophilic PEG thiol inks. Although Saalmink et al.16 have used these PEG thiols as non-etch resistant molecules, we have observed that they do exert some etch resistance.
Catalytic microcontact printing was demonstrated by using an imine-functionalized substrate and acidic guest groups in the stamp. Although a proof of principle was given, transfer of stamp material is an important problem in these experiments. In some catalytic printing experiments, transfer of stamp material was observed when using stamps of pTHF/EO4000-U4U with or without pTHF-bisurea-diacid guest 7. Probably this material transfer is mostly due to low molecular weight compounds, such as the pTHF-bisurea-diacid guest, but also low molecular weight chains from the pTHF-bisurea polymer. The presence of these low molecular weight chains in pTHF-bisurea is an intrinsic problem of the pTHF-bisurea, since it is prepared via a step polymerization.
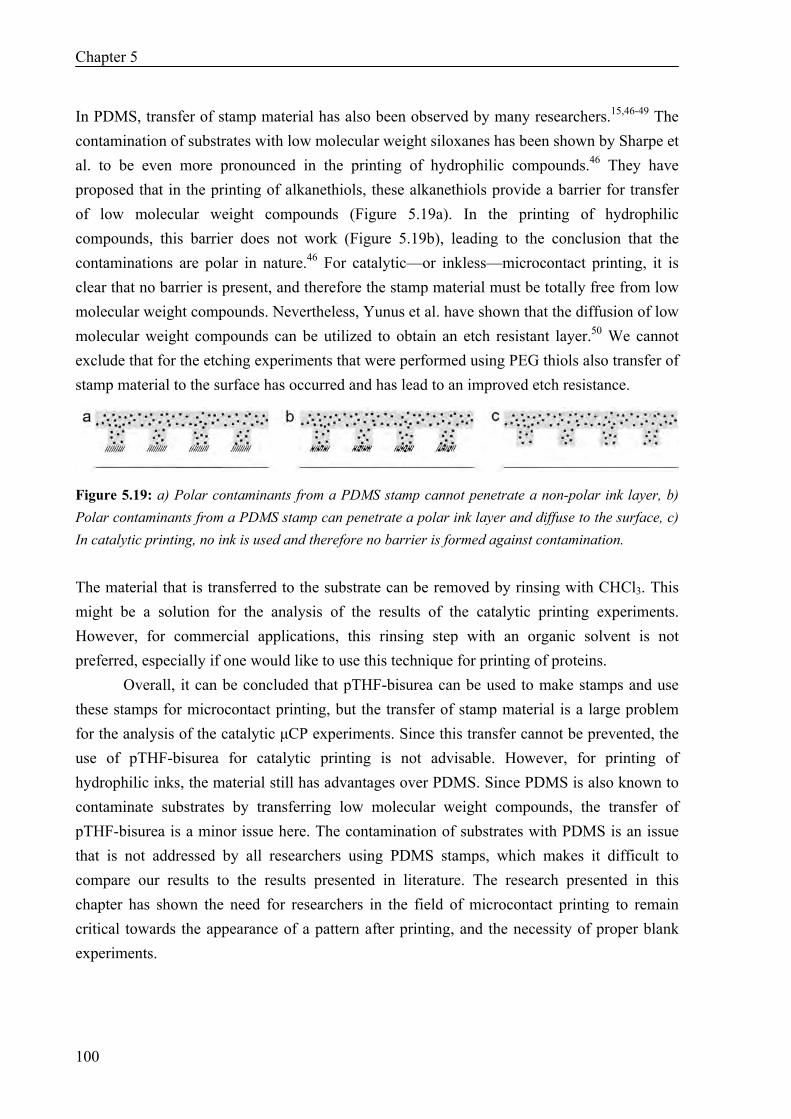
Chapter 5
100
In PDMS, transfer of stamp material has also been observed by many researchers.15,46-49 The contamination of substrates with low molecular weight siloxanes has been shown by Sharpe et al. to be even more pronounced in the printing of hydrophilic compounds.46 They have proposed that in the printing of alkanethiols, these alkanethiols provide a barrier for transfer of low molecular weight compounds (Figure 5.19a). In the printing of hydrophilic compounds, this barrier does not work (Figure 5.19b), leading to the conclusion that the contaminations are polar in nature.46 For catalytic—or inkless—microcontact printing, it is clear that no barrier is present, and therefore the stamp material must be totally free from low molecular weight compounds. Nevertheless, Yunus et al. have shown that the diffusion of low molecular weight compounds can be utilized to obtain an etch resistant layer.50 We cannot exclude that for the etching experiments that were performed using PEG thiols also transfer of stamp material to the surface has occurred and has lead to an improved etch resistance.
Figure 5.19: a) Polar contaminants from a PDMS stamp cannot penetrate a non-polar ink layer, b) Polar contaminants from a PDMS stamp can penetrate a polar ink layer and diffuse to the surface, c) In catalytic printing, no ink is used and therefore no barrier is formed against contamination. The material that is transferred to the substrate can be removed by rinsing with CHCl3. This might be a solution for the analysis of the results of the catalytic printing experiments. However, for commercial applications, this rinsing step with an organic solvent is not preferred, especially if one would like to use this technique for printing of proteins.
Overall, it can be concluded that pTHF-bisurea can be used to make stamps and use these stamps for microcontact printing, but the transfer of stamp material is a large problem for the analysis of the catalytic μCP experiments. Since this transfer cannot be prevented, the use of pTHF-bisurea for catalytic printing is not advisable. However, for printing of hydrophilic inks, the material still has advantages over PDMS. Since PDMS is also known to contaminate substrates by transferring low molecular weight compounds, the transfer of pTHF-bisurea is a minor issue here. The contamination of substrates with PDMS is an issue that is not addressed by all researchers using PDMS stamps, which makes it difficult to compare our results to the results presented in literature. The research presented in this chapter has shown the need for researchers in the field of microcontact printing to remain critical towards the appearance of a pattern after printing, and the necessity of proper blank experiments.
Microcontact Printing with Hydrophilic Bisurea Thermoplastic Elastomers
101
5.4 Materials and Methods
Materials. Unless stated otherwise, all reagents and solvents were purchased from commercial sources and were used without further purification. Solvents used in the synthesis were A.R. grade and purchased from Biosolve. Succinic anhydride and 6-aminocaproic acid were purchased from Acros, 1,4-diisocyanatobutane and triethylamine were purchased from Fluka and bis(3-aminopropyl)-poly(tetrahydrofuran), Mn = 1100 g/mol, and poly(tetrahydrofuran) diol, Mn = 2000 g/mol, were purchased from Aldrich. Tridecafluoro-1,1,2,2-tetrahydrooctyl-1-trichlorosilane was purchased from ABCR. Random copolymer of THF and EO, Mn = 4000 g/mol, was kindly provided by prof. dr. Doetse Sikkema (Akzo-Nobel). Fluorinated etylenepropylene (FEP, DuPont) was kindly provided by D. C. Trimbach (Eindhoven University of Technology). Methods. NMR spectra were acquired on a 400 MHz Varian Mercury Vx (400 MHz for 1H-NMR, 100 MHz for 13C-NMR), a 400 MHz Bruker (400 MHz for 1H-NMR, 100 MHz for 13C-NMR) or a 300 MHz Varian Gemini-2000 (300 MHz for 1H-NMR, 75 MHz for 13C-NMR) spectrometer. Proton and Carbon chemical shifts are reported in ppm downfield of tetramethylsilane using the resonance of the deuterated solvent as internal standard. Splitting patterns are designated as singlet (s), doublet (d), triplet (t) and multiplet (m). Infrared spectra were recorded on a Perkin Elmer Spectrum One FT-IR spectrometer with a Universal ATR Sampling Accessory. MALDI-TOF was performed on a PerSeptive Biosystems DE PRO Voyager MALDI-TOF mass spectrometer using cyano-4-hydroxycinnamic acid as the calibration matrix. Scanning electron microscopy (SEM) images were measured on a Philips XL 30 ESEM-FEG using an acceleration voltage of 1kV and a secondary electron (SE) detector. A Jenaval microscope from Sondag optical instruments was used for optical microscopy. Molecular weights of the synthesized polymers were determined by GPC using a polystyrene calibrated PL-GPC 120 high temperature chromatograph that was equipped with a PL gel 5 μm Mixed-C column, an autosampler and an RI detector at 80 °C in 1-methyl-2-pyrrolidinone (NMP) All molecular weights were relative to polystyrene standards. Fourier transform infrared reflection-absorption spectroscopy (FT-IRRAS) spectra of 1024 scans at 4 cm–1 were recorded on a Bio-Rad FTS6000-spectrometer with a liquid nitrogen-cooled mercury cadmium telluride (MCT) detector equipped with a Seagull reflection accessory (Harrick Scientific). The polarizer was set at 90º, so that p-polarised radiation was obtained, and the incident angle was 85º with respect to the gold substrate. Synthesis. pTHF2000-U4U. pTHF2000-U4U was synthesized via a literature procedure.39,51 pTHF1100-U7U. The synthesis of pTHF1100-U7U was described in Chapter 2. pTHF/EO4000-U4U. pTHF/EO4000-U4U was synthesized via a literature procedure.39 OEG-thiols 1–5. The OEG-thiols used in this chapter were kindly provided by dr. Henk Stapert, Philips Research. pTHF2000-diacid (6). Poly(tetrahydrofuran) diol, (4.7 g, Mn = 2000 g/mol), was co-evaporated three times with 100 mL of toluene to remove traces of water. 0.51 g (5.1 mmol) of succinic anhydride was added to the dry pTHF and the mixture was heated to 130 °C overnight. The reaction mixture was dissolved in 75 mL of CHCl3, washed three times with 75 mL 1 N HCl and dried over MgSO4. 1H-
Chapter 5
102
NMR (400 MHz, CDCl3): δ = 4.12 (t, 4H), 3.4 (m, 4nH), 2.63 (m, 8H), 1.6 (m, 4nH) ppm. 13C-NMR (75 MHz, CDCl3): δ = 172.2, 70.7, 70.2, 64.6, 29.4, 28.8, 26.6, 26.2, 25.7 ppm. Yield = 98%. pTHF2000-bisurea-diacid (7). Bisamine-terminated poly(tetrahydrofuran) was prepared from poly(tetrahydrofuran) diol (Mn = 2000 g/mol) according to a literature procedure.39 0.95 g (0.45 mmol) of this bisamine-terminated poly(tetrahydrofuran) was dissolved in 25 mL of CHCl3 (new bottle) and added dropwise to a mixture of 0.19 g (1.35 mmol) of 1,4-diisocyanatobutane in 25 mL of CHCl3 (new bottle). After 1 h at RT, the mixture was concentrated in vacuo to 10 mL and precipitated in cold heptane. Since the reaction product was an oily substance, the heptane could be decanted. The reaction product was further evaporated in vacuo to dryness. IR: ν = 3338, 2938, 2854, 2265, 1639, 1569, 1367, 1103 cm–1. 1H-NMR (300 MHz, CDCl3): δ = 4.85 (t, 2H), 4.62 (t, 2H), 3.5 (t, 4H), 3.4 (m, 4nH), 3.28 (q, 4H), 3.2 (q, 8H), 1.72 (m, 12H), 1.6 (m, 4nH) ppm. In the second step, 0.59 g (4.5 mmol) of 6-aminocaproic acid and 0.1 g of triethylamine were dissolved in 50 mL CHCl3 (new bottle, placed under argon and heated to 80 °C. The reaction product from the first step (bis(N-isocyanato-butyl-ureido) poly(tetrahydrofuran)) was added and the reaction mixture was stirred at 80 °C for 24 h under argon. After cooling down, 2 mL of MeOH was added and the reaction mixture was filtered over a glass filter and evaporated to dryness. The residue was dissolved in 150 mL of THF, concentrated in vacuo to 15 mL and precipitated in 150 mL of demineralized water. The precipitate was dissolved in CHCl3 and dried with MgSO4. The solution was then concentrated in vacuo to 15 mL and precipitated in heptane to remove traces of BHT (stabilizer of THF). IR: ν = 3325, 2939, 2853, 1731, 1618, 1579, 1366, 1104 cm–1. 1H-NMR (300 MHz, CDCl3): δ = 5.1–5.7 (b, 10H), 3.6, 3.4 (m, (4n+4)H), 3.3 (q, 8H), 3.2 (q, 8H), 2.3(t, 4H), 1.8 (m, 4H), 1.6 (m, 4nH), 1.5 (m, 8H), 1.3 (m, 4H) ppm. 13C-NMR (75 MHz, CDCl3): δ = 177.5, 159.7, 159.5, 70.9, 70.7, 70.6, 70.4, 69.1, 39.8, 39.6, 39.3, 38.1, 33.5, 29.5, 29.0, 27.1, 27.0, 26.3, 26.1, 25.9, 25.5, 23.7 ppm. GPC (NMP, 80°C, PS standards): Mn = 20.000 g/mol. The starting compound, which should have an Mn of approximately 2200 g/mol, showed an Mn of 6000 g/mol with the same setup, suggesting that the calibration with PS standards is not suitable for the measurement of these polymers in NMP. However, the Mn of 20.000 g/mol does suggest that chain extension has occurred in the first step, leading to a relatively lower number of acid groups in the final compound. Atomic force Microscopy (AFM). AFM images were recorded using a Multimode Nanoscope IV or a Dimension 3100 Nanoscope III (Digital Instruments, Inc. Santa Barbara, California, now Veeco). For polymer films, the microscopes were operated in the tapping (or intermittent contact) mode using silicon cantilever tips (Nanosensors, PPP-NCH-50, frequency 204–497 kHz, force constant 10–130 N/m or NSG10, 190–325 kHz, 5.5–22.5 N/m)). Scanner 5962EV was used with a scan rate of 1 Hz and a scan angle of 90°. RMS free oscillation amplitude was set to 2.0V. The operating setpoint ratio (Asp/A0) was set to approximately 0.9. Integral gain and proportional gain were optimized for each sample. All images were subjected to a first-order plane-fitting procedure to compensate for sample tilt. Lateral force microscopy (LFM) was used for friction measurements on monolayers. The Dimension microscope was operated in the contact mode using cantilever D of DNP-S10 tips (Veeco Probes, 18–24 kHz, 0.06 N/m). The scanning angle was set to 90°, the vertical deflection setpoint to –2V and scan rate was 1 Hz. Integral gain and proportional gain were optimized for each sample.
Microcontact Printing with Hydrophilic Bisurea Thermoplastic Elastomers
103
Polymer film preparation. Polymers and any guests were dissolved in MeOH/CHCl3 (1:9 v/v) mixtures and poured into silylated Petri dishes or Teflon dishes. The dishes were covered with a larger Petri dish to allow the solvent to evaporate slowly. Preparation of stamps. Stamps were either produced via hot-embossing against an intermediate fluorinated ethylene propylene (FEP) replica (method I), via hot-embossing against a fluorinated silicon wafer (method II), or via solution casting (method III). In the first method, different types of calibration gratings (5×5 mm, Mikromasch, TGX, TGT, TGG or TGZ, Talin, Estonia) for scanning probe microscopy were used to prepare a FEP replica. First, the calibration gratings were fluorinated. The surface was oxidized for 30 min using an oxygen plasma at a pressure of 1 mbar and a RF power of 75 W in a plasma etcher (Emitech K1050X, Ashford, England). Then the gratings were placed in a petridish with one drop of tridecafluoro-1,1,2,2-tetrahydrooctyl-1-trichlorosilane, covered with aluminium foil and placed in a desiccator at 100 mbar for 1 h. Finally the gratings were rinsed with EtOH, baked in a vacuum oven at 80 °C for 1 h and rinsed with isopropanol. The FEP intermediate replica was produced via hot-embossing of a FEP film at 330 °C for 5 min with a load of 200 g against one of the fluorinated gratings (5×5 mm), in a machine that accurately controls temperature and load (Tribotrack, Daca instruments, Goleta, CA, USA). The pTHF-bisurea stamps were hot-embossed using the same machine at different temperatures, times and loads against the FEP intermediate replica. In the second method, the pTHF-bisurea was directly hot-embossed against the fluorinated gratings in 1 min using a temperature close to the melting temperature of the used polymer and a load of 200 g (unless stated otherwise). In the third method, pTHF-bisurea was dissolved in a MeOH/CHCl3 (1:9 v/v) mixture (20 mg/ml). The fluorinated silicon gratings were placed on the bottom of a Petri dish and the polymer solution was poured on top of it. The solvent was allowed to evaporate overnight in a vacuum oven at room temperate and 300 mbar. X-ray Photon Spectroscopy (XPS). XPS measurements were performed with a VG CLAM II spectrometer and VG XR3E2 twin x-ray source using the aluminium anode (Al Kα = 1486.6 eV) operating at 250 W with a background pressure of 2×10⁻⁹ mbar. Spectra were recorded using the VGX900 data system with a pass energy of 100 eV and a step energy of 0.7 eV. Contact angle measurements. Contact angles on polymer films were measured on a Drop Shape Analysis DSA 10 apparatus from Krüss, using the sessile drop method at room temperature. Contact angles were recorded continuously during the first 10 s with a frequency of 2 Hz after placing a water droplet on the film surface. Each set of measurements was repeated three times on different positions on the same sample, using two samples per polymer. Preparation of gold substrates. Gold on silicon substrates were kindly provided by dr. Henk Stapert from Philips Research. Glass substrates (3×3 cm) were cleaned by ultrasonic treatment in acetone (10 min), rubbing with SDS soap solution, sonication in SDS soap solution (10 min), rinsing in a stream of demineralised water (15 min), sonication in isopropranol (5 min) and finally UV/ozone treatment (30 min). The substrates were then transferred to a N2 glove box, where first a chromium layer (5 nm) and then a gold layer (50 or 100 nm) was deposited by thermal evaporation under vacuum (5×10⁻⁶ mbar, 1 ppm O2 and <1 ppm H2O). Microcontact printing. Gold substrates were cleaned by using an argon plasma at a pressure of 1 mbar and a RF power of 75 W for 5 min in a plasma etcher (Emitech K1050X, Ashford, England).
Chapter 5
104
Alkane thiols: a pTHF2000-U4U stamp was inked for 30 s using a solution of 1 mM hexadecanethiol in heptane. After drying with N2, the stamp was brought in contact with a gold substrate for 30 s. After removal of the stamp, the substrate was rinsed with EtOH and etched in an aqueous solution of 1 M KOH, 0.1 M NaCN and 0.01 M K3Fe(CN)6 for 1 min. OEG thiols: Stamps were inked for 30–180 s in an aqueous solution of 1 mM OEG-thiol 4. After drying with N2, the stamp was brought in contact with a gold substrate for 30 s. After removal of the stamp, the substrate was rinsed with EtOH and etched in an aqueous solution of 1 M KOH, 0.1 M NaCN and 0.01 M K3Fe(CN)6 for 1 min. Preparation of imine substrates. Imine monolayers on gold substrates were prepared via a literature procedure.45
5.5 References
1. A. Kumar and G.M. Whitesides Appl. Phys. Lett. 1993, 63 (14), 2002-2004. 2. Y.N. Xia and G.M. Whitesides Annu. Rev. Mater. Sci. 1998, 28, 153-184. 3. B. Michel, A. Bernard, A. Bietsch, E. Delamarche, M. Geissler, D. Juncker, H. Kind, J.P. Renault,
H. Rothuizen, H. Schmid, P. Schmidt-Winkel, R. Stutz and H. Wolf IBM J. Res. Dev. 2001, 45 (5), 697-719.
4. J.L. Wilbur, A. Kumar, E. Kim and G.M. Whitesides Adv. Mater. 1994, 6 (7-8), 600-604. 5. E. Kim, A. Kumar and G.M. Whitesides J. Electrochem. Soc. 1995, 142 (2), 628-633. 6. T.K. Whidden, D.K. Ferry, M.N. Kozicki, E. Kim, A. Kumar, J. Wilbur and G.M. Whitesides
Nanotechnology 1996, 7 (4), 447-451. 7. G.P. Lopez, H.A. Biebuyck, R. Harter, A. Kumar and G.M. Whitesides J. Am. Chem. Soc. 1993,
115 (23), 10774-10781. 8. M. Mrksich and G.M. Whitesides Trends Biotechnol. 1995, 13 (6), 228-235. 9. R. Singhvi, A. Kumar, G.P. Lopez, G.N. Stephanopoulos, D.I.C. Wang, G.M. Whitesides and D.E.
Ingber Science 1994, 264 (5159), 696-698. 10. M. Mrksich, L.E. Dike, J. Tien, D.E. Ingber and G.M. Whitesides Exp. Cell Res. 1997, 235 (2),
305-313. 11. F. Li, B. Li, Q.M. Wang and J.H.C. Wang Cell Motil. Cytoskeleton 2008, 65 (4), 332-341. 12. A. Offenhäusser, S. Böcker-Meffert, T. Decker, R. Helpenstein, P. Gasteier, J. Groll, M. Möller,
A. Reska, S. Schäfer, P. Schulte and A. Vogt-Eisele Soft Matter 2007, 3 (3), 290-298. 13. R.J. Jackman, J.L. Wilbur and G.M. Whitesides Science 1995, 269 (5224), 664-666. 14. S.G. Zhang, L. Yan, M. Altman, M. Lassle, H. Nugent, F. Frankel, D.A. Lauffenburger, G.M.
Whitesides and A. Rich Biomaterials 1999, 20 (13), 1213-1220. 15. H. Hillborg, J.F. Ankner, U.W. Gedde, G.D. Smith, H.K. Yasuda and K. Wikstrom Polymer 2000,
41 (18), 6851-6863. 16. M. Saalmink, C. van der Marel, H.R. Stapert and D. Burdinski Langmuir 2006, 22 (3), 1016-1026. 17. C. Donzel, M. Geissler, A. Bernard, H. Wolf, B. Michel, J. Hilborn and E. Delamarche Adv.
Mater. 2001, 13 (15), 1164-1167. 18. E. Delamarche, C. Donzel, F.S. Kamounah, H. Wolf, M. Geissler, R. Stutz, P. Schmidt-Winkel, B.
Michel, H.J. Mathieu and K. Schaumburg Langmuir 2003, 19 (21), 8749-8758. 19. V.B. Sadhu, A. Perl, M. Péter, D.I. Rozkiewicz, G. Engbers, B.J. Ravoo, D.N. Reinhoudt and J.
Huskens Langmuir 2007, 23 (12), 6850-6855. 20. D. Trimbach, K. Feldman, N.D. Spencer, D.J. Broer and C.W.M. Bastiaansen Langmuir 2003, 19
(26), 10957-10961. 21. D.C. Trimbach, M. Al-Hussein, W.H. de Jeu, M. Decré, D.J. Broer and C.W.M. Bastiaansen
Langmuir 2004, 20 (11), 4738-4742. 22. D.C. Trimbach, H. Stapert, J. van Orselen, K.D. Jandt, C.W.M. Bastiaansen and D.J. Broer Adv.
Eng. Mater. 2007, 9 (12), 1123-1128.
Microcontact Printing with Hydrophilic Bisurea Thermoplastic Elastomers
105
23. D.B. Weibel, A. Lee, M. Mayer, S.F. Brady, D. Bruzewicz, J. Yang, W.R. DiLuzio, J. Clardy and G.M. Whitesides Langmuir 2005, 21 (14), 6436-6442.
24. N. Coq, T. van Bommel, R.A. Hikmet, H.R. Stapert and W.U. Dittmer Langmuir 2007, 23 (9), 5154-5160.
25. N.Y. Lee, J.R. Lim, M.J. Lee, J.B. Kim, S.J. Jo, H.K. Baik and Y.S. Kim Langmuir 2006, 22 (21), 9018-9022.
26. H. Schmid and B. Michel Macromolecules 2000, 33 (8), 3042-3049. 27. G. Csucs, T. Kunzler, K. Feldman, F. Robin and N.D. Spencer Langmuir 2003, 19 (15), 6104-
6109. 28. M. Liebau, J. Huskens and D.N. Reinhoudt Adv. Funct. Mater. 2001, 11 (2), 147-150. 29. H.W. Li, D.J. Kang, M.G. Blamire and W.T.S. Huck Nano Lett. 2002, 2 (4), 347-349. 30. H.W. Li, B.V.O. Muir, G. Fichet and W.T.S. Huck Langmuir 2003, 19 (6), 1963-1965. 31. A. Perl, M. Péter, B.J. Ravoo, D.N. Reinhoudt and J. Huskens Langmuir 2006, 22 (18), 7568-
7573. 32. X.M. Li, V. Paraschiv, J. Huskens and D.N. Reinhoudt J. Am. Chem. Soc. 2003, 125 (14), 4279-
4284. 33. S. Thévenet, H.Y. Chen, J. Lahann and F. Stellacci Adv. Mater. 2007, 19 (24), 4333-4337. 34. P.W. Snyder, M.S. Johannes, B.N. Vogen, R.L. Clark and E.J. Toone J. Org. Chem. 2007, 72 (19),
7459-7461. 35. A.A. Shestopalov, R.L. Clark and E.J. Toone J. Am. Chem. Soc. 2007, 129 (45), 13818-13819. 36. C.L. Feng, A. Embrechts, I. Bredebusch, J. Schnekenburger, W. Domschke, G.J. Vancso and H.
Schönherr Adv. Mater. 2007, 19 (2), 286-290. 37. C.L. Feng, G.J. Vancso and H. Schönherr Langmuir 2007, 23 (3), 1131-1140. 38. H.C. Scheer, H. Schulz, T. Hoffmann and C.M.S. Torres J. Vac. Sci. Technol., B 1998, 16 (6),
3917-3921. 39. R.M. Versteegen, R.P. Sijbesma and E.W. Meijer Macromolecules 2005, 38 (8), 3176-3184. 40. G.Y. Jung, Z.Y. Li, W. Wu, Y. Chen, D.L. Olynick, S.Y. Wang, W.M. Tong and R.S. Williams
Langmuir 2005, 21 (4), 1158-1161. 41. This was measured by placing a solution cast film of pTHF/EO4000-U4U for 4 h in a vial with
ultrapure water. After removal of the film from the water, it was shortly dried with a tissue and weighed immediately. The evaporation of water was followed in time until the film had returned to its old weight.
42. K.L. Prime and G.M. Whitesides J. Am. Chem. Soc. 1993, 115 (23), 10714-10721. 43. K.L. Prime and G.M. Whitesides Science 1991, 252 (5009), 1164-1167. 44. Note: This test was done to find the best candidate for the microcontact printing experiments with
the hydrophilic TPEs, not to demonstrate their usefulness as an etch resist. 45. D.I. Rozkiewicz, B.J. Ravoo and D.N. Reinhoudt Langmuir 2005, 21 (14), 6337-6343. 46. R.B.A. Sharpe, D. Burdinski, C. van der Marel, J.A.J. Jansen, J. Huskens, H.J.W. Zandvliet, D.N.
Reinhoudt and B. Poelsema Langmuir 2006, 22 (13), 5945-5951. 47. D.J. Graham, D.D. Price and B.D. Ratner Langmuir 2002, 18 (5), 1518-1527. 48. J.O. Foley, E. Fu, L.J. Gamble and P. Yager Langmuir 2008, 24 (7), 3628-3635. 49. K. Glasmästar, J. Gold, A.S. Andersson, D.S. Sutherland and B. Kasemo Langmuir 2003, 19 (13),
5475-5483. 50. S. Yunus, C.D. de Looringhe, C. Poleunis and A. Delcorte Surf. Interface Anal. 2007, 39 (12-13),
922-925. 51. R.A. Koevoets, Functional materials based on multiple hydrogen bonding motifs. PhD Thesis,
Eindhoven University of Technology, Eindhoven, 2005.
106
131
77
Self-Assembly and Morphology of Polydimethylsiloxane
Supramolecular Thermoplastic Elastomers
Abstract Functionalization of polydimethylsiloxane (PDMS) polymers with hydrogen bonding ureidopyrimidinone (UPy) groups leads to supramolecular thermoplastic elastomers. In previous studies, no lateral stacking of UPy dimers was observed in UPy-functionalized polymers, unless additional urethane or urea groups were built into the hard block. However, in UPy functionalized PDMS, lateral stacking of UPy dimers does take place, even in the absence of urea or urethane groups, since long fibers were observed in the atomic force microscopy (AFM) phase image. The presence of these interactions in the bulk was proven by oscillatory shear experiments. We attribute the stacking to the incompatibility of soft block and hard block, leading to phase separation at the nanoscale. Moreover, we have shown that additional urethane or urea groups in the hard block do lead to materials with more fibers and higher melting points. For the UPy-urea functionalized PDMS even single fibers were observed with AFM when drop-cast from dilute solutions. When the length of the soft block was increased, the morphology changed from fibrous to spherical. This work has been published: N.E. Botterhuis, D.J.M. van Beek, G.M.L. van Gemert, A.W. Bosman and R.P. Sijbesma J. Polym. Sci. Part A, Polym. Chem. 2008, 46, (12), 3877-3885.
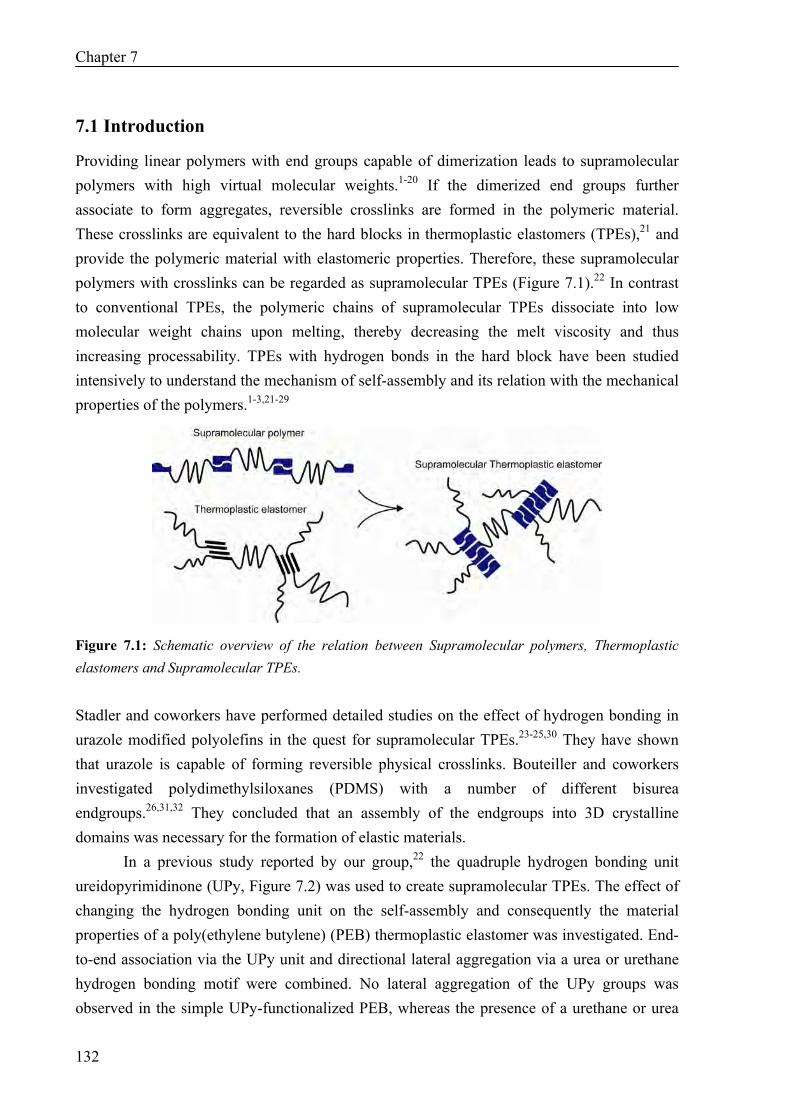
Chapter 7
132
7.1 Introduction
Providing linear polymers with end groups capable of dimerization leads to supramolecular polymers with high virtual molecular weights.1-20 If the dimerized end groups further associate to form aggregates, reversible crosslinks are formed in the polymeric material. These crosslinks are equivalent to the hard blocks in thermoplastic elastomers (TPEs),21 and provide the polymeric material with elastomeric properties. Therefore, these supramolecular polymers with crosslinks can be regarded as supramolecular TPEs (Figure 7.1).22 In contrast to conventional TPEs, the polymeric chains of supramolecular TPEs dissociate into low molecular weight chains upon melting, thereby decreasing the melt viscosity and thus increasing processability. TPEs with hydrogen bonds in the hard block have been studied intensively to understand the mechanism of self-assembly and its relation with the mechanical properties of the polymers.1-3,21-29
Figure 7.1: Schematic overview of the relation between Supramolecular polymers, Thermoplastic elastomers and Supramolecular TPEs. Stadler and coworkers have performed detailed studies on the effect of hydrogen bonding in urazole modified polyolefins in the quest for supramolecular TPEs.23-25,30 They have shown that urazole is capable of forming reversible physical crosslinks. Bouteiller and coworkers investigated polydimethylsiloxanes (PDMS) with a number of different bisurea endgroups.26,31,32 They concluded that an assembly of the endgroups into 3D crystalline domains was necessary for the formation of elastic materials.
In a previous study reported by our group,22 the quadruple hydrogen bonding unit ureidopyrimidinone (UPy, Figure 7.2) was used to create supramolecular TPEs. The effect of changing the hydrogen bonding unit on the self-assembly and consequently the material properties of a poly(ethylene butylene) (PEB) thermoplastic elastomer was investigated. End-to-end association via the UPy unit and directional lateral aggregation via a urea or urethane hydrogen bonding motif were combined. No lateral aggregation of the UPy groups was observed in the simple UPy-functionalized PEB, whereas the presence of a urethane or urea
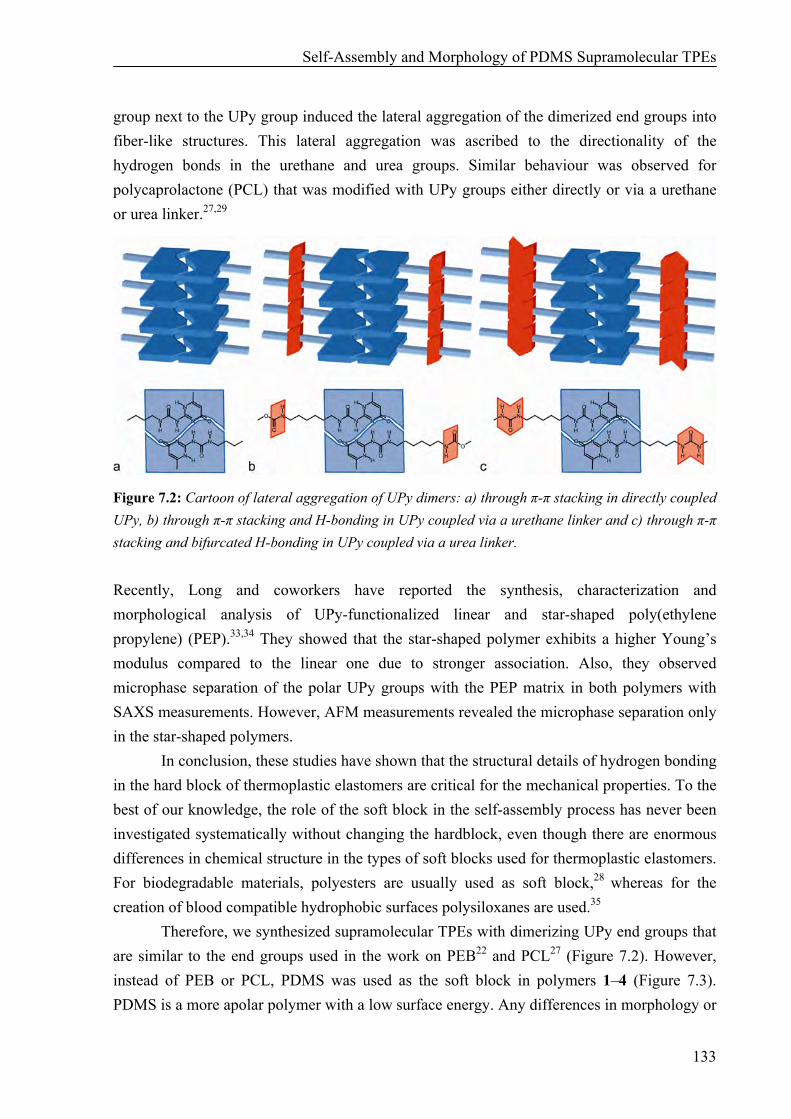
Self-Assembly and Morphology of PDMS Supramolecular TPEs
133
group next to the UPy group induced the lateral aggregation of the dimerized end groups into fiber-like structures. This lateral aggregation was ascribed to the directionality of the hydrogen bonds in the urethane and urea groups. Similar behaviour was observed for polycaprolactone (PCL) that was modified with UPy groups either directly or via a urethane or urea linker.27,29
Figure 7.2: Cartoon of lateral aggregation of UPy dimers: a) through π-π stacking in directly coupled UPy, b) through π-π stacking and H-bonding in UPy coupled via a urethane linker and c) through π-π stacking and bifurcated H-bonding in UPy coupled via a urea linker. Recently, Long and coworkers have reported the synthesis, characterization and morphological analysis of UPy-functionalized linear and star-shaped poly(ethylene propylene) (PEP).33,34 They showed that the star-shaped polymer exhibits a higher Young’s modulus compared to the linear one due to stronger association. Also, they observed microphase separation of the polar UPy groups with the PEP matrix in both polymers with SAXS measurements. However, AFM measurements revealed the microphase separation only in the star-shaped polymers.
In conclusion, these studies have shown that the structural details of hydrogen bonding in the hard block of thermoplastic elastomers are critical for the mechanical properties. To the best of our knowledge, the role of the soft block in the self-assembly process has never been investigated systematically without changing the hardblock, even though there are enormous differences in chemical structure in the types of soft blocks used for thermoplastic elastomers. For biodegradable materials, polyesters are usually used as soft block,28 whereas for the creation of blood compatible hydrophobic surfaces polysiloxanes are used.35
Therefore, we synthesized supramolecular TPEs with dimerizing UPy end groups that are similar to the end groups used in the work on PEB22 and PCL27 (Figure 7.2). However, instead of PEB or PCL, PDMS was used as the soft block in polymers 1–4 (Figure 7.3). PDMS is a more apolar polymer with a low surface energy. Any differences in morphology or
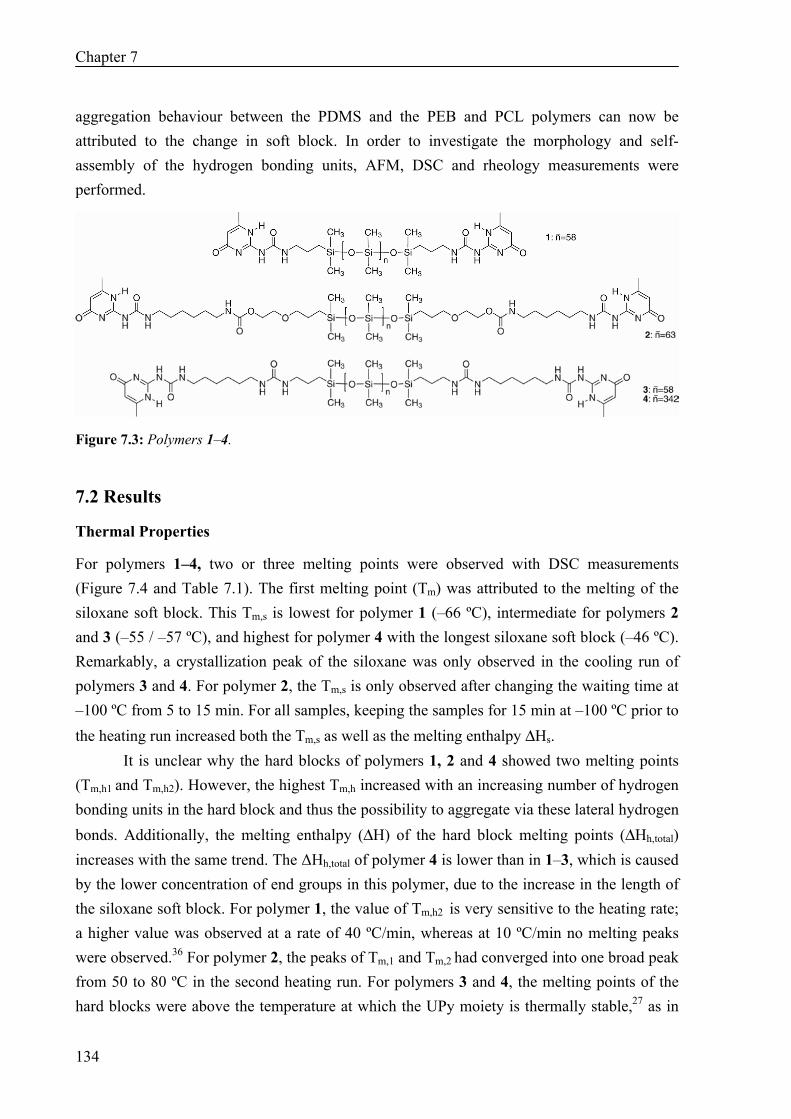
Chapter 7
134
aggregation behaviour between the PDMS and the PEB and PCL polymers can now be attributed to the change in soft block. In order to investigate the morphology and self-assembly of the hydrogen bonding units, AFM, DSC and rheology measurements were performed.
Figure 7.3: Polymers 1–4.
7.2 Results
Thermal Properties
For polymers 1–4, two or three melting points were observed with DSC measurements (Figure 7.4 and Table 7.1). The first melting point (Tm) was attributed to the melting of the siloxane soft block. This Tm,s is lowest for polymer 1 (–66 ºC), intermediate for polymers 2 and 3 (–55 / –57 ºC), and highest for polymer 4 with the longest siloxane soft block (–46 ºC). Remarkably, a crystallization peak of the siloxane was only observed in the cooling run of polymers 3 and 4. For polymer 2, the Tm,s is only observed after changing the waiting time at –100 ºC from 5 to 15 min. For all samples, keeping the samples for 15 min at –100 ºC prior to the heating run increased both the Tm,s as well as the melting enthalpy ΔHs.
It is unclear why the hard blocks of polymers 1, 2 and 4 showed two melting points (Tm,h1 and Tm,h2). However, the highest Tm,h increased with an increasing number of hydrogen bonding units in the hard block and thus the possibility to aggregate via these lateral hydrogen bonds. Additionally, the melting enthalpy (ΔH) of the hard block melting points (ΔHh,total) increases with the same trend. The ΔHh,total of polymer 4 is lower than in 1–3, which is caused by the lower concentration of end groups in this polymer, due to the increase in the length of the siloxane soft block. For polymer 1, the value of Tm,h2 is very sensitive to the heating rate; a higher value was observed at a rate of 40 ºC/min, whereas at 10 ºC/min no melting peaks were observed.36 For polymer 2, the peaks of Tm,1 and Tm,2 had converged into one broad peak from 50 to 80 ºC in the second heating run. For polymers 3 and 4, the melting points of the hard blocks were above the temperature at which the UPy moiety is thermally stable,27 as in
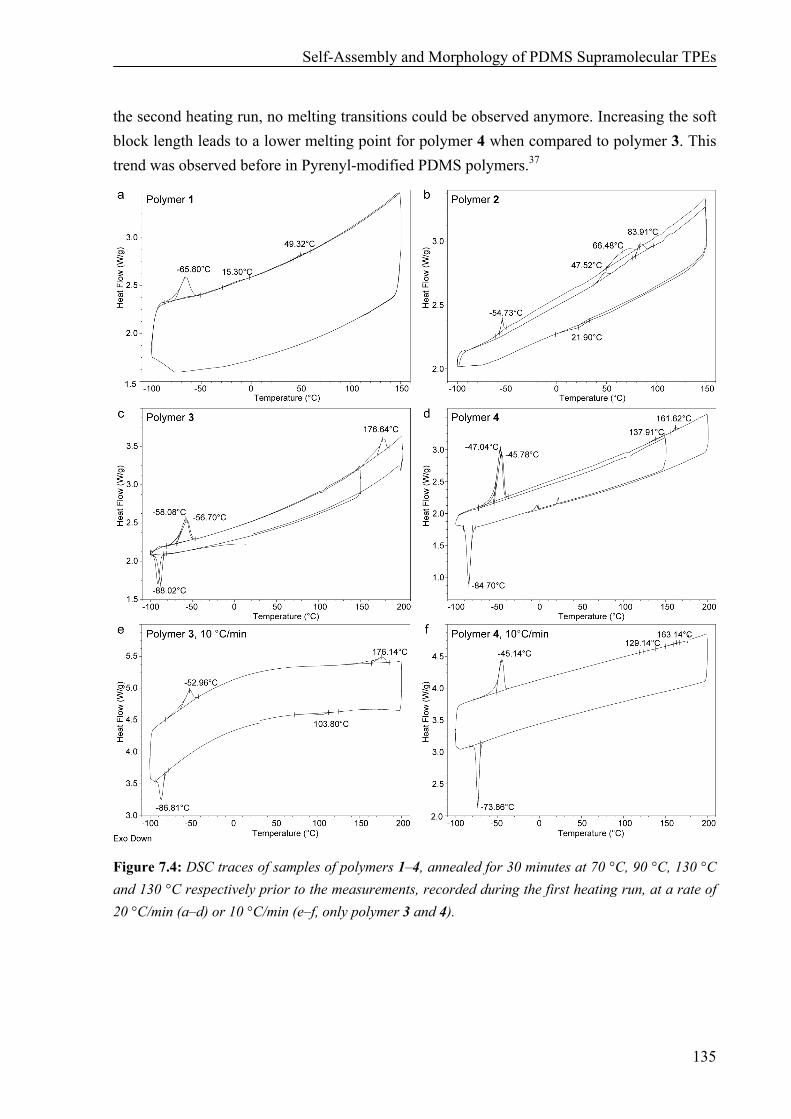
Self-Assembly and Morphology of PDMS Supramolecular TPEs
135
the second heating run, no melting transitions could be observed anymore. Increasing the soft block length leads to a lower melting point for polymer 4 when compared to polymer 3. This trend was observed before in Pyrenyl-modified PDMS polymers.37
Figure 7.4: DSC traces of samples of polymers 1–4, annealed for 30 minutes at 70 °C, 90 °C, 130 °C and 130 °C respectively prior to the measurements, recorded during the first heating run, at a rate of 20 °C/min (a–d) or 10 °C/min (e–f, only polymer 3 and 4).
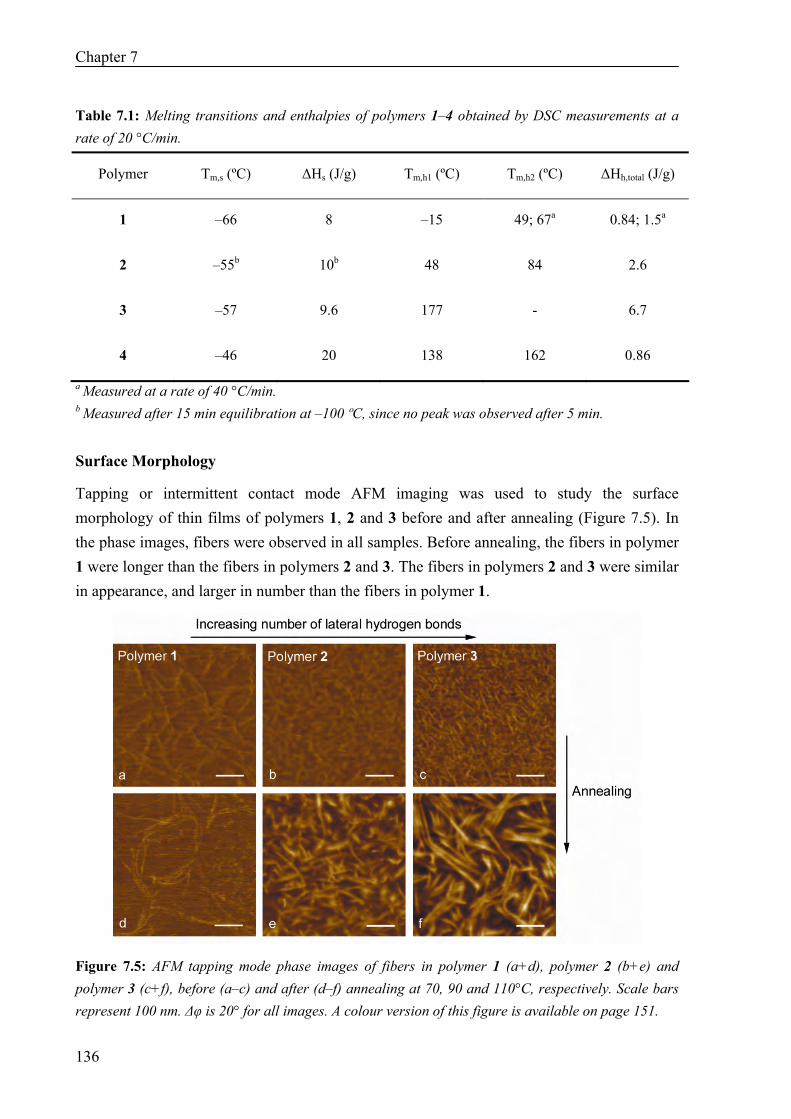
Chapter 7
136
Table 7.1: Melting transitions and enthalpies of polymers 1–4 obtained by DSC measurements at a rate of 20 °C/min.
Polymer Tm,s (ºC) ΔHs (J/g) Tm,h1 (ºC) Tm,h2 (ºC) ΔHh,total (J/g)
1 –66 8 –15 49; 67a 0.84; 1.5a
2 –55b 10b 48 84 2.6
3 –57 9.6 177 - 6.7
4 –46 20 138 162 0.86
a Measured at a rate of 40 °C/min. b Measured after 15 min equilibration at –100 ºC, since no peak was observed after 5 min. Surface Morphology
Tapping or intermittent contact mode AFM imaging was used to study the surface morphology of thin films of polymers 1, 2 and 3 before and after annealing (Figure 7.5). In the phase images, fibers were observed in all samples. Before annealing, the fibers in polymer 1 were longer than the fibers in polymers 2 and 3. The fibers in polymers 2 and 3 were similar in appearance, and larger in number than the fibers in polymer 1.
Figure 7.5: AFM tapping mode phase images of fibers in polymer 1 (a+d), polymer 2 (b+e) and polymer 3 (c+f), before (a–c) and after (d–f) annealing at 70, 90 and 110°C, respectively. Scale bars represent 100 nm. Δφ is 20° for all images. A colour version of this figure is available on page 151.
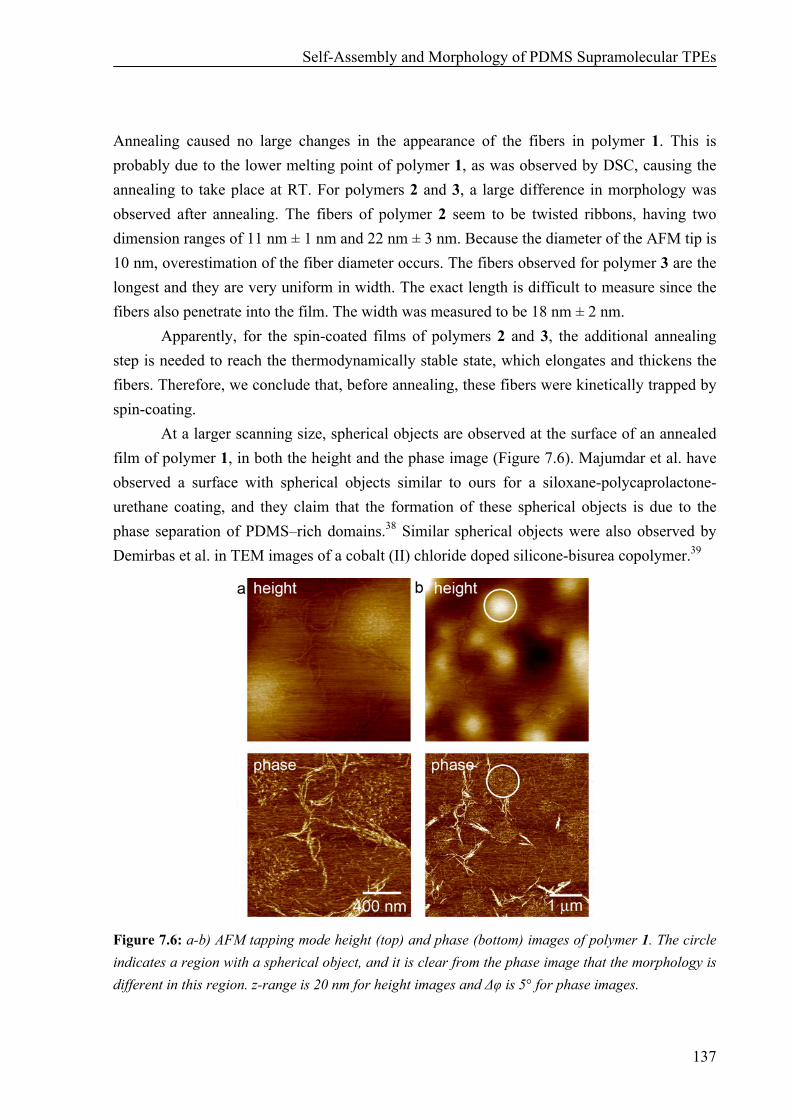
Self-Assembly and Morphology of PDMS Supramolecular TPEs
137
Annealing caused no large changes in the appearance of the fibers in polymer 1. This is probably due to the lower melting point of polymer 1, as was observed by DSC, causing the annealing to take place at RT. For polymers 2 and 3, a large difference in morphology was observed after annealing. The fibers of polymer 2 seem to be twisted ribbons, having two dimension ranges of 11 nm ± 1 nm and 22 nm ± 3 nm. Because the diameter of the AFM tip is 10 nm, overestimation of the fiber diameter occurs. The fibers observed for polymer 3 are the longest and they are very uniform in width. The exact length is difficult to measure since the fibers also penetrate into the film. The width was measured to be 18 nm ± 2 nm.
Apparently, for the spin-coated films of polymers 2 and 3, the additional annealing step is needed to reach the thermodynamically stable state, which elongates and thickens the fibers. Therefore, we conclude that, before annealing, these fibers were kinetically trapped by spin-coating.
At a larger scanning size, spherical objects are observed at the surface of an annealed film of polymer 1, in both the height and the phase image (Figure 7.6). Majumdar et al. have observed a surface with spherical objects similar to ours for a siloxane-polycaprolactone-urethane coating, and they claim that the formation of these spherical objects is due to the phase separation of PDMS–rich domains.38 Similar spherical objects were also observed by Demirbas et al. in TEM images of a cobalt (II) chloride doped silicone-bisurea copolymer.39
Figure 7.6: a-b) AFM tapping mode height (top) and phase (bottom) images of polymer 1. The circle indicates a region with a spherical object, and it is clear from the phase image that the morphology is different in this region. z-range is 20 nm for height images and Δφ is 5° for phase images.
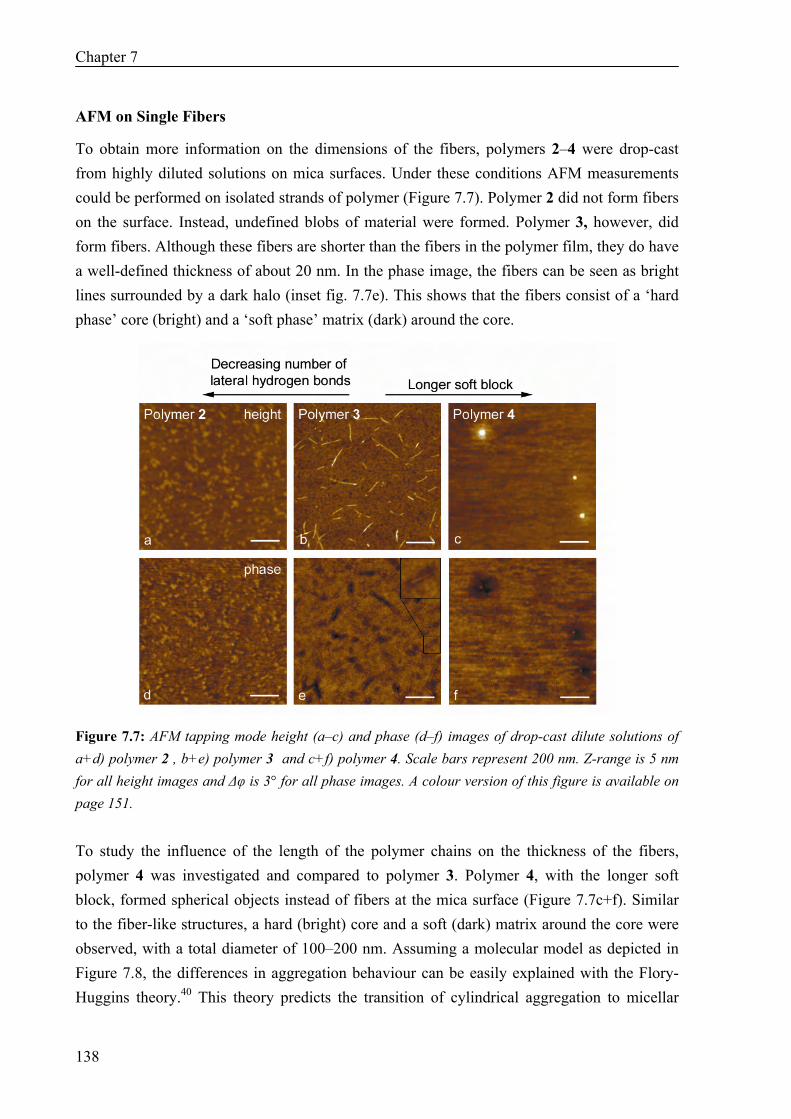
Chapter 7
138
AFM on Single Fibers
To obtain more information on the dimensions of the fibers, polymers 2–4 were drop-cast from highly diluted solutions on mica surfaces. Under these conditions AFM measurements could be performed on isolated strands of polymer (Figure 7.7). Polymer 2 did not form fibers on the surface. Instead, undefined blobs of material were formed. Polymer 3, however, did form fibers. Although these fibers are shorter than the fibers in the polymer film, they do have a well-defined thickness of about 20 nm. In the phase image, the fibers can be seen as bright lines surrounded by a dark halo (inset fig. 7.7e). This shows that the fibers consist of a ‘hard phase’ core (bright) and a ‘soft phase’ matrix (dark) around the core.
Figure 7.7: AFM tapping mode height (a–c) and phase (d–f) images of drop-cast dilute solutions of a+d) polymer 2 , b+e) polymer 3 and c+f) polymer 4. Scale bars represent 200 nm. Z-range is 5 nm for all height images and Δφ is 3° for all phase images. A colour version of this figure is available on page 151. To study the influence of the length of the polymer chains on the thickness of the fibers, polymer 4 was investigated and compared to polymer 3. Polymer 4, with the longer soft block, formed spherical objects instead of fibers at the mica surface (Figure 7.7c+f). Similar to the fiber-like structures, a hard (bright) core and a soft (dark) matrix around the core were observed, with a total diameter of 100–200 nm. Assuming a molecular model as depicted in Figure 7.8, the differences in aggregation behaviour can be easily explained with the Flory-Huggins theory.40 This theory predicts the transition of cylindrical aggregation to micellar
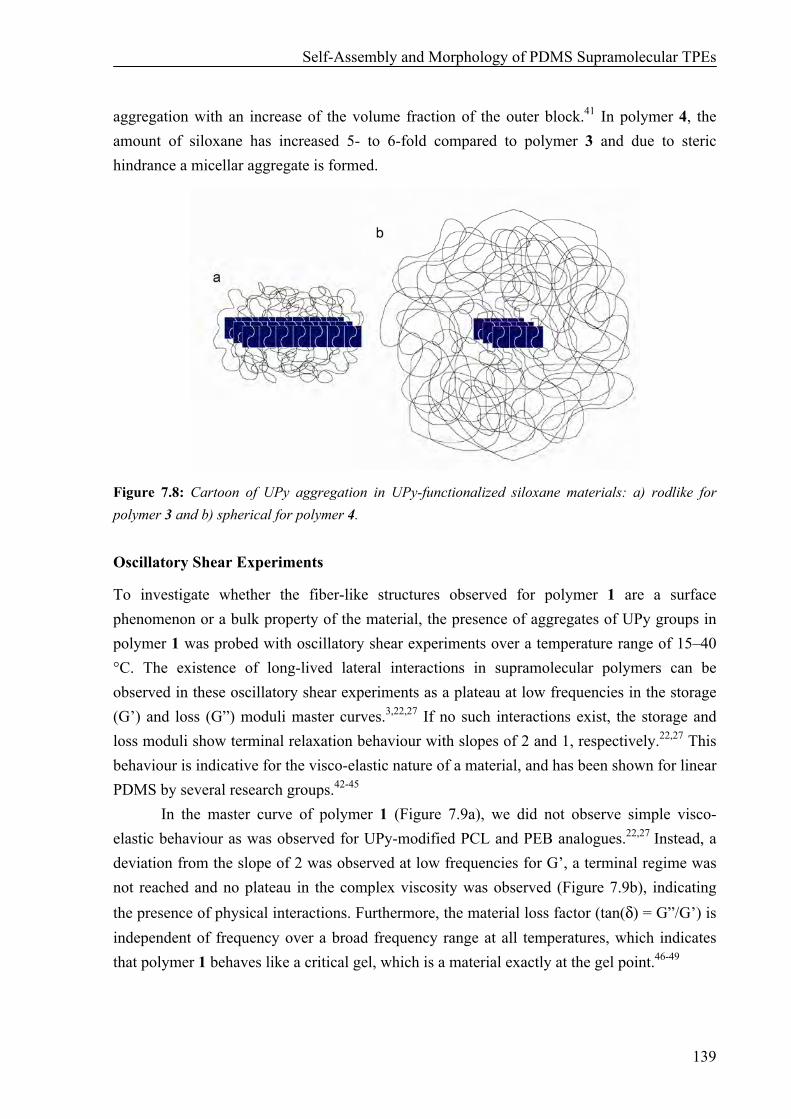
Self-Assembly and Morphology of PDMS Supramolecular TPEs
139
aggregation with an increase of the volume fraction of the outer block.41 In polymer 4, the amount of siloxane has increased 5- to 6-fold compared to polymer 3 and due to steric hindrance a micellar aggregate is formed.
Figure 7.8: Cartoon of UPy aggregation in UPy-functionalized siloxane materials: a) rodlike for polymer 3 and b) spherical for polymer 4. Oscillatory Shear Experiments
To investigate whether the fiber-like structures observed for polymer 1 are a surface phenomenon or a bulk property of the material, the presence of aggregates of UPy groups in polymer 1 was probed with oscillatory shear experiments over a temperature range of 15–40 °C. The existence of long-lived lateral interactions in supramolecular polymers can be observed in these oscillatory shear experiments as a plateau at low frequencies in the storage (G’) and loss (G”) moduli master curves.3,22,27 If no such interactions exist, the storage and loss moduli show terminal relaxation behaviour with slopes of 2 and 1, respectively.22,27 This behaviour is indicative for the visco-elastic nature of a material, and has been shown for linear PDMS by several research groups.42-45
In the master curve of polymer 1 (Figure 7.9a), we did not observe simple visco-elastic behaviour as was observed for UPy-modified PCL and PEB analogues.22,27 Instead, a deviation from the slope of 2 was observed at low frequencies for G’, a terminal regime was not reached and no plateau in the complex viscosity was observed (Figure 7.9b), indicating the presence of physical interactions. Furthermore, the material loss factor (tan(δ) = G”/G’) is independent of frequency over a broad frequency range at all temperatures, which indicates that polymer 1 behaves like a critical gel, which is a material exactly at the gel point.46-49
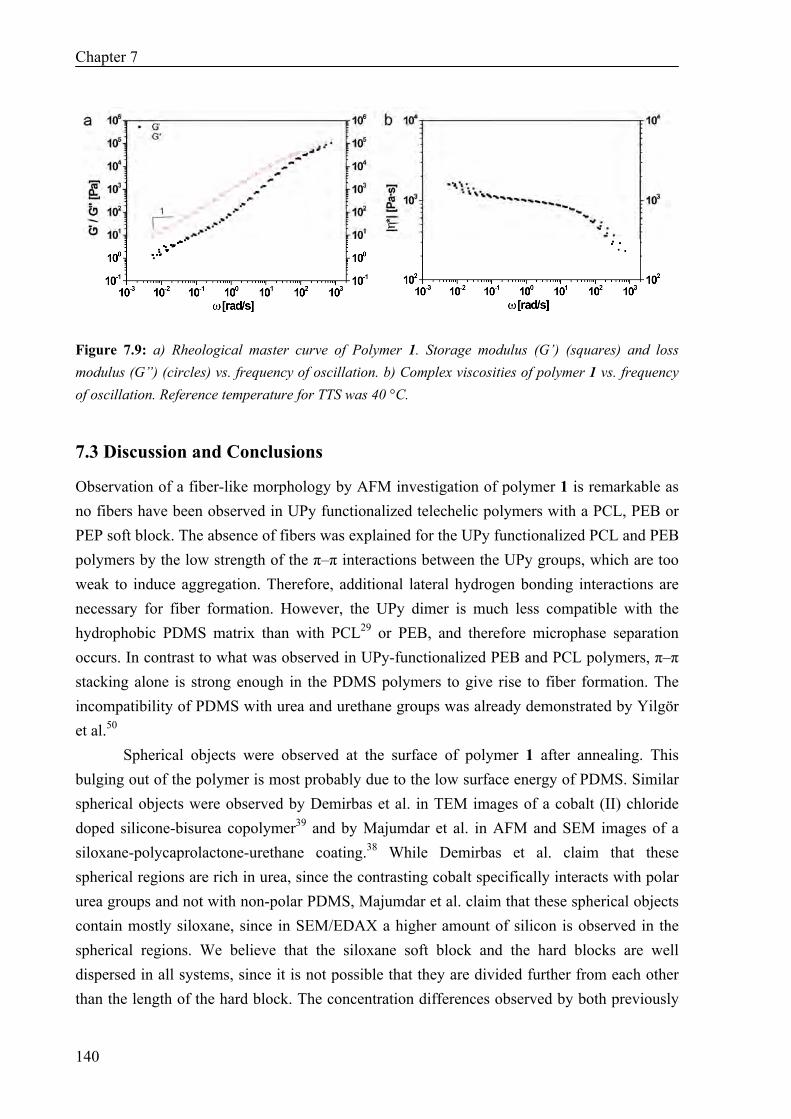
Chapter 7
140
Figure 7.9: a) Rheological master curve of Polymer 1. Storage modulus (G’) (squares) and loss modulus (G”) (circles) vs. frequency of oscillation. b) Complex viscosities of polymer 1 vs. frequency of oscillation. Reference temperature for TTS was 40 °C.
7.3 Discussion and Conclusions
Observation of a fiber-like morphology by AFM investigation of polymer 1 is remarkable as no fibers have been observed in UPy functionalized telechelic polymers with a PCL, PEB or PEP soft block. The absence of fibers was explained for the UPy functionalized PCL and PEB polymers by the low strength of the π–π interactions between the UPy groups, which are too weak to induce aggregation. Therefore, additional lateral hydrogen bonding interactions are necessary for fiber formation. However, the UPy dimer is much less compatible with the hydrophobic PDMS matrix than with PCL29 or PEB, and therefore microphase separation occurs. In contrast to what was observed in UPy-functionalized PEB and PCL polymers, π–π stacking alone is strong enough in the PDMS polymers to give rise to fiber formation. The incompatibility of PDMS with urea and urethane groups was already demonstrated by Yilgör et al.50
Spherical objects were observed at the surface of polymer 1 after annealing. This bulging out of the polymer is most probably due to the low surface energy of PDMS. Similar spherical objects were observed by Demirbas et al. in TEM images of a cobalt (II) chloride doped silicone-bisurea copolymer39 and by Majumdar et al. in AFM and SEM images of a siloxane-polycaprolactone-urethane coating.38 While Demirbas et al. claim that these spherical regions are rich in urea, since the contrasting cobalt specifically interacts with polar urea groups and not with non-polar PDMS, Majumdar et al. claim that these spherical objects contain mostly siloxane, since in SEM/EDAX a higher amount of silicon is observed in the spherical regions. We believe that the siloxane soft block and the hard blocks are well dispersed in all systems, since it is not possible that they are divided further from each other than the length of the hard block. The concentration differences observed by both previously
Self-Assembly and Morphology of PDMS Supramolecular TPEs
141
mentioned papers in TEM and EDAX most probably arise from the differences in height, since a thicker polymer film will give more contrast in TEM and a higher amount of Si in EDAX.
Oscillatory shear experiments of polymer 1 strengthen the hypothesis that long-living physical interactions originate from phase separation of the UPy dimers and the PDMS polymer. The fibers, which are present in the whole film, are a result of the combination of this phase separation and the π–π stacking of the dimerized UPy moieties.
In conclusion, we have shown that lateral self-assembly of UPy dimers in UPy-functionalized supramolecular thermoplastic elastomers is induced in a polymer with a lower compatibility to the UPy moiety, and leads to profound morphological and rheological changes.
7.4 Materials and Methods
Materials. All solvents were purchased from Biosolve (AR grade) and used as received. Dibutyltindilaurate was obtained from Aldrich. Bis(2-hydroxy ethyl propyl ether) terminated polydimethylsiloxane was a generous gift from Shin-Etsu (Mn = 4940 g/mol). Synthesis. The synthesis of polymers 1, 3 and 4 has been described elsewhere.51 Polymer 2. 30.15 g (6.10 mmol) of bis(2-hydroxy ethylpropyl ether) terminated polydimethylsiloxane was dissolved in chloroform (150 mL) together with 3 drops of dibutyltindilaurate. To this solution 3.59 g (12.2 mmol) 2(6-isocyanatohexylaminocarbonylamino)-6-methyl-4[1H]pyrimidinone3 was added, and then heated to reflux while stirred under an argon atmosphere for 16 hours. Subsequently, the viscous clear solution was diluted with 150 mL chloroform and 30 mL ethanol, and filtered over Celite. The filtrate was dried by rotary evaporation, followed by drying in vacuo, resulting in a clear, semi-soft material. 1H-NMR (400 MHz, CDCl3): δ = 13.1 (2H), 11.9 (2H), 10.1 (2H), 5.8 (2H), 4.9 (2H), 4.2 (4H), 3.6 (4H), 3.4 (4H), 3.3 (4H), 3.1 (4H), 2.2 (6H), 1.7-1.2 (12H), 0.5 (4H), 0.3– -0.2 ppm. SEC (THF, PS-standards): Mn = 3200 g/mol, Mw = 6700 g/mol. Differential scanning calorimetry (DSC). Thermal transitions of the polymers were determined on a Perkin Elmer Differential Scanning Calorimeter Pyris 1 with DSC Autosampler and Perkin Elmer CCA7 cooling element under a nitrogen atmosphere with heating and cooling rates of 10, 20 or 40 °C/min and held at –100 °C for 5 min (unless stated otherwise). Samples of 9–12 mg were measured. Samples of polymers 1–4 were annealed for 30 minutes at 70 °C, 90 °C, 130 °C and 130 °C respectively (above 130 °C the UPy unit is not stable), and were allowed to slowly cool down, with an approximate rate of 20 °C/h. Melting transitions were measured during the first heating run after annealing, unless stated otherwise. Gel permeation chromatography (GPC). GPC was performed on a Shimadzu LC-10ADvp, using a Shimadzu SPD-M10Avp photodiode array detector at 254 nm and a PLgel 5 μm Mixed C (200–2×10⁶ g/mol) column in series with a PLgel 5 μm Mixed D (200–4×10⁵ g/mol) column. THF was used as
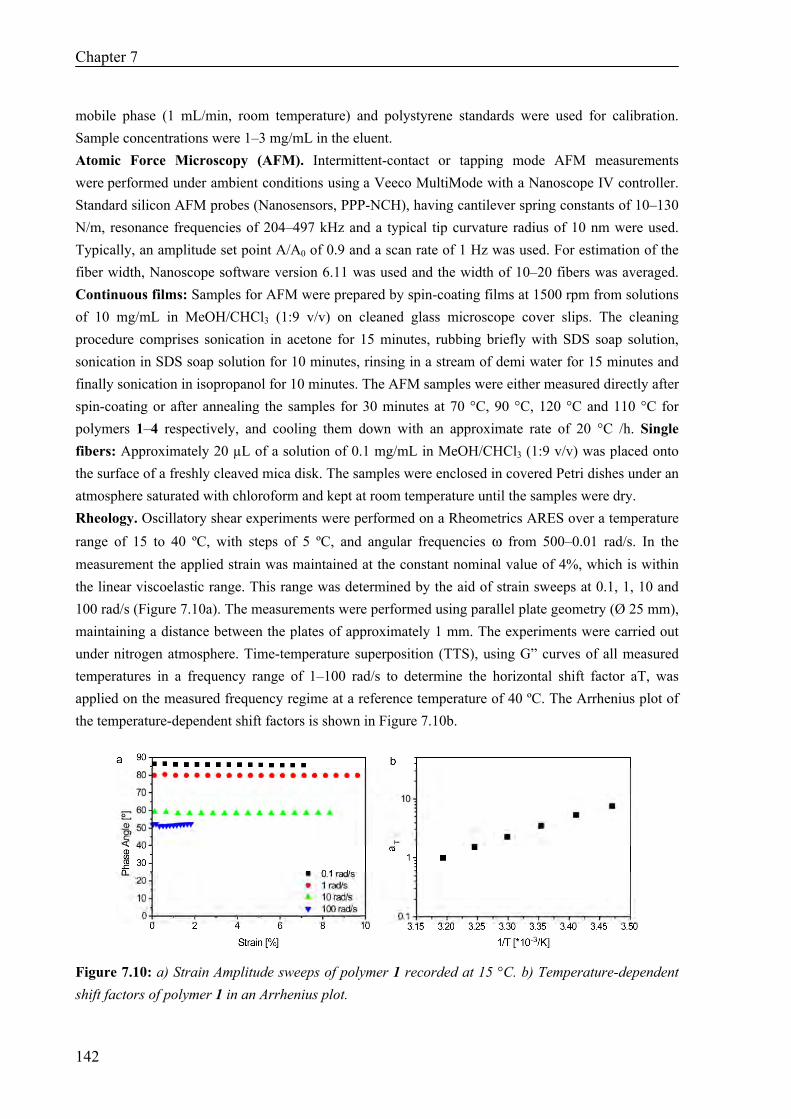
Chapter 7
142
mobile phase (1 mL/min, room temperature) and polystyrene standards were used for calibration. Sample concentrations were 1–3 mg/mL in the eluent. Atomic Force Microscopy (AFM). Intermittent-contact or tapping mode AFM measurements were performed under ambient conditions using a Veeco MultiMode with a Nanoscope IV controller. Standard silicon AFM probes (Nanosensors, PPP-NCH), having cantilever spring constants of 10–130 N/m, resonance frequencies of 204–497 kHz and a typical tip curvature radius of 10 nm were used. Typically, an amplitude set point A/A0 of 0.9 and a scan rate of 1 Hz was used. For estimation of the fiber width, Nanoscope software version 6.11 was used and the width of 10–20 fibers was averaged. Continuous films: Samples for AFM were prepared by spin-coating films at 1500 rpm from solutions of 10 mg/mL in MeOH/CHCl3 (1:9 v/v) on cleaned glass microscope cover slips. The cleaning procedure comprises sonication in acetone for 15 minutes, rubbing briefly with SDS soap solution, sonication in SDS soap solution for 10 minutes, rinsing in a stream of demi water for 15 minutes and finally sonication in isopropanol for 10 minutes. The AFM samples were either measured directly after spin-coating or after annealing the samples for 30 minutes at 70 °C, 90 °C, 120 °C and 110 °C for polymers 1–4 respectively, and cooling them down with an approximate rate of 20 °C /h. Single fibers: Approximately 20 µL of a solution of 0.1 mg/mL in MeOH/CHCl3 (1:9 v/v) was placed onto the surface of a freshly cleaved mica disk. The samples were enclosed in covered Petri dishes under an atmosphere saturated with chloroform and kept at room temperature until the samples were dry. Rheology. Oscillatory shear experiments were performed on a Rheometrics ARES over a temperature range of 15 to 40 ºC, with steps of 5 ºC, and angular frequencies ω from 500–0.01 rad/s. In the measurement the applied strain was maintained at the constant nominal value of 4%, which is within the linear viscoelastic range. This range was determined by the aid of strain sweeps at 0.1, 1, 10 and 100 rad/s (Figure 7.10a). The measurements were performed using parallel plate geometry (Ø 25 mm), maintaining a distance between the plates of approximately 1 mm. The experiments were carried out under nitrogen atmosphere. Time-temperature superposition (TTS), using G” curves of all measured temperatures in a frequency range of 1–100 rad/s to determine the horizontal shift factor aT, was applied on the measured frequency regime at a reference temperature of 40 ºC. The Arrhenius plot of the temperature-dependent shift factors is shown in Figure 7.10b.
Figure 7.10: a) Strain Amplitude sweeps of polymer 1 recorded at 15 °C. b) Temperature-dependent shift factors of polymer 1 in an Arrhenius plot.
Self-Assembly and Morphology of PDMS Supramolecular TPEs
143
7.5 References
1. L. Brunsveld, B.J.B. Folmer, E.W. Meijer and R.P. Sijbesma Chem. Rev. 2001, 101 (12), 4071-4097.
2. A. Ciferri, Supramolecular Polymers, Second Edition. CRC Press: Boca Raton, 2005. 3. B.J.B. Folmer, R.P. Sijbesma, R.M. Versteegen, J.A.J. van der Rijt and E.W. Meijer Adv. Mater.
2000, 12 (12), 874-878. 4. C. Fouquey, J.M. Lehn and A.M. Levelut Adv. Mater. 1990, 2 (5), 254-7. 5. M. Kotera, J.M. Lehn and J.P. Vigneron J. Chem. Soc., Chem. Commun. 1994, (2), 197-9. 6. R.P. Sijbesma, F.H. Beijer, L. Brunsveld, B.J.B. Folmer, J.H.K.K. Hirschberg, R.F.M. Lange,
J.K.L. Lowe and E.W. Meijer Science 1997, 278 (5343), 1601-1604. 7. J.H.K.K. Hirschberg, F.H. Beijer, H.A. van Aert, P.C.M.M. Magusin, R.P. Sijbesma and E.W.
Meijer Macromolecules 1999, 32 (8), 2696-2705. 8. V. Berl, M. Schmutz, M.J. Krische, R.G. Khoury and J.M. Lehn Chem.--Eur. J. 2002, 8 (5), 1227-
1244. 9. W.H. Binder, M.J. Kunz and E. Ingolic J. Polym. Sci., Part A: Polym. Chem. 2003, 42 (1), 162-
172. 10. J. Xu, E.A. Fogleman and S.L. Craig Macromolecules 2004, 37 (5), 1863-1870. 11. D. Hinderberger, O. Schmelz, M. Rehahn and G. Jeschke Angew. Chem., Int. Ed. 2004, 43 (35),
4616-4621. 12. S. Schmatloch, A.M.J. van den Berg, A.S. Alexeev, H. Hofmeier and U.S. Schubert
Macromolecules 2003, 36 (26), 9943-9949. 13. R. Dobrawa and F. Würthner J. Polym. Sci., Part A: Polym. Chem. 2005, 43 (21), 4981-4995. 14. D.G. Kurth, A. Meister, A.F. Thunemann and G. Forster Langmuir 2003, 19 (10), 4055-4057. 15. T. Vermonden, M.J. van Steenbergen, N.A.M. Besseling, A.T.M. Marcelis, W.E. Hennink, E.J.R.
Sudholter and M.A.C. Stuart J. Am. Chem. Soc. 2004, 126 (48), 15802-15808. 16. W.C. Yount, H. Juwarker and S.L. Craig J. Am. Chem. Soc. 2003, 125 (50), 15302-15303. 17. J.M.J. Paulusse and R.P. Sijbesma J. Polym. Sci., Part A: Polym. Chem. 2006, 44 (19), 5445-5453. 18. J.B. Beck and S.J. Rowan J. Am. Chem. Soc. 2003, 125 (46), 13922-13923. 19. J.B. Beck, J.M. Ineman and S.J. Rowan Macromolecules 2005, 38 (12), 5060-5068. 20. S. Sivakova, D.A. Bohnsack, M.E. Mackay, P. Suwanmala and S.J. Rowan J. Am. Chem. Soc.
2005, 127 (51), 18202-18211. 21. G. Holden, N.R. Legge, R.P. Quirk and H.E. Schroeder, Thermoplastic Elastomers, 2nd Edition.
Carl Hanser Verlag: München, 1996. 22. H. Kautz, D.J.M. van Beek, R.P. Sijbesma and E.W. Meijer Macromolecules 2006, 39 (13), 4265-
4267. 23. C.I.D. Bica, W. Burchard and R. Stadler Eur. Polym. J. 1997, 33 (10-12), 1759-1766. 24. R. Stadler and J. Burgert Makromol. Chem. 1986, 187 (7), 1681-1690. 25. R. Stadler and L. De Lucca Freitas Polym. Bull. (Berlin, Ger.) 1986, 15 (2), 173-179. 26. O. Colombani and L. Bouteiller New J. Chem. 2004, 28 (11), 1373-1382. 27. D.J.M. van Beek, A.J.H. Spiering, G.W.M. Peters, K. te Nijenhuis and R.P. Sijbesma
Macromolecules 2007, 40, 8464-8475. 28. E. Wisse, A.J.H. Spiering, E.N.M. van Leeuwen, R.A.E. Renken, P.Y.W. Dankers, L.A. Brouwer,
M.J.A. van Luyn, M.C. Harmsen, N.A.J.M. Sommerdijk and E.W. Meijer Biomacromolecules 2006, 7 (12), 3385-3395.
29. E. Wisse, P.Y.W. Dankers, B. Mezari, P.C.M.M. Magusin and E.W. Meijer, manuscript in preparation.
30. C. Hilger and R. Stadler Macromolecules 1992, 25 (24), 6670-80. 31. F. Lortie, S. Boileau and L. Bouteiller Chem.--Eur. J. 2003, 9 (13), 3008-3014. 32. O. Colombani, C. Barioz, L. Bouteiller, C. Chanéac, L. Fompérie, F. Lortie and H. Montès
Macromolecules 2005, 38 (5), 1752-1759. 33. C.L. Elkins, K. Viswanathan and T.E. Long Macromolecules 2006, 39 (9), 3132-3139. 34. B.D. Mather, C.L. Elkins, F.L. Beyer and T.E. Long Macromol. Rapid Commun. 2007, 28 (16),
1601-1606.
Chapter 7
144
35. A. Takahara, A.Z. Okkema, S.L. Cooper and A.J. Coury Biomaterials 1991, 12 (3), 324-334. 36. For this reason, only the data of the 20 °C/min measurements was reported for polymers 2-4. 37. B.A. Jones and J.M. Torkelson J. Polym. Sci., Part B: Polym. Phys. 2004, 42 (18), 3470-3475. 38. P. Majumdar and D.C. Webster Macromolecules 2005, 38 (14), 5857-5859. 39. U. Demirbas, A. Kurt, A. Sennaroglu, E. Yilgör and I. Yilgör Polymer 2006, 47 (4), 982-990. 40. P.J. Flory J. Chem. Phys. 1949, 17 (3), 223-240. 41. F.S. Bates and G.H. Fredrickson Annu. Rev. Phys. Chem. 1990, 41, 525-557. 42. L. Di Landro, M. Levi, D. Nichetti and A. Consolo Eur. Polym. J. 2003, 39 (9), 1831-1838. 43. Y. Ito Bull. Chem. Soc. Japan 1966, 39 (7), 1368-72. 44. J.A. Ressia, M.A. Villar and E.M. Valles Macromol. Symp. 2001, 168 (Natural and Synthetic
Polymers: Challenges and Perspectives), 43-54. 45. S.E. Shim and A.I. Isayev Rheol. Acta 2004, 43 (2), 127-136. 46. A. Izuka, H.H. Winter and T. Hashimoto Macromolecules 1992, 25 (9), 2422-2428. 47. H.H. Winter Polym. Eng. Sci. 1987, 27 (22), 1698-1702. 48. F. Chambon and H.H. Winter J. Rheol. 1987, 31 (8), 683-697. 49. H.H. Winter and F. Chambon J. Rheol. 1986, 30 (2), 367-382. 50. E. Yilgör, E. Burgaz, E. Yurtsever and I. Yilgör Polymer 2000, 41 (3), 849-857. 51. A.W. Bosman, H.M. Janssen, G.M.L. Van Gemert, R.M. Versteegen, E.W. Meijer and R.P.
Sijbesma Siloxane polymers with quadruple hydrogen bonding units. 2003-NL870/2004052963, 20031209, 2004.

Self-Assembly and Morphology of PDMS Supramolecular TPEs
145

146
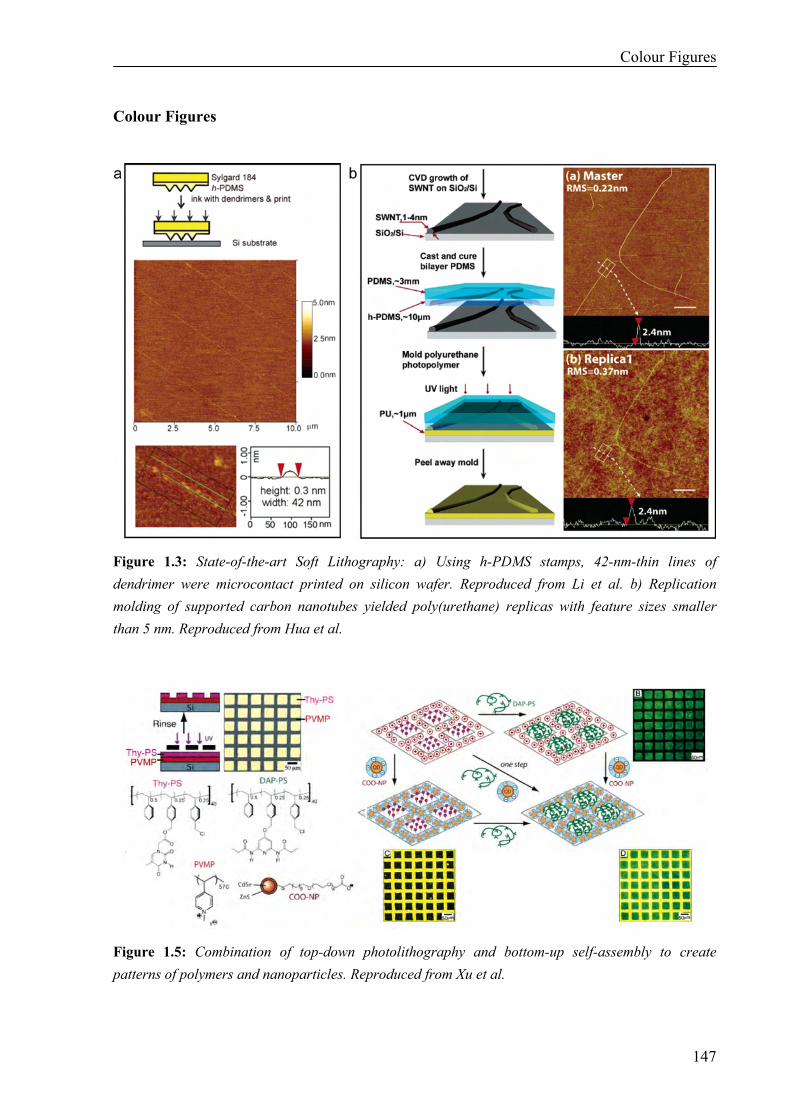
Colour Figures
147
Colour Figures
Figure 1.3: State-of-the-art Soft Lithography: a) Using h-PDMS stamps, 42-nm-thin lines of dendrimer were microcontact printed on silicon wafer. Reproduced from Li et al. b) Replication molding of supported carbon nanotubes yielded poly(urethane) replicas with feature sizes smaller than 5 nm. Reproduced from Hua et al.
Figure 1.5: Combination of top-down photolithography and bottom-up self-assembly to create patterns of polymers and nanoparticles. Reproduced from Xu et al.
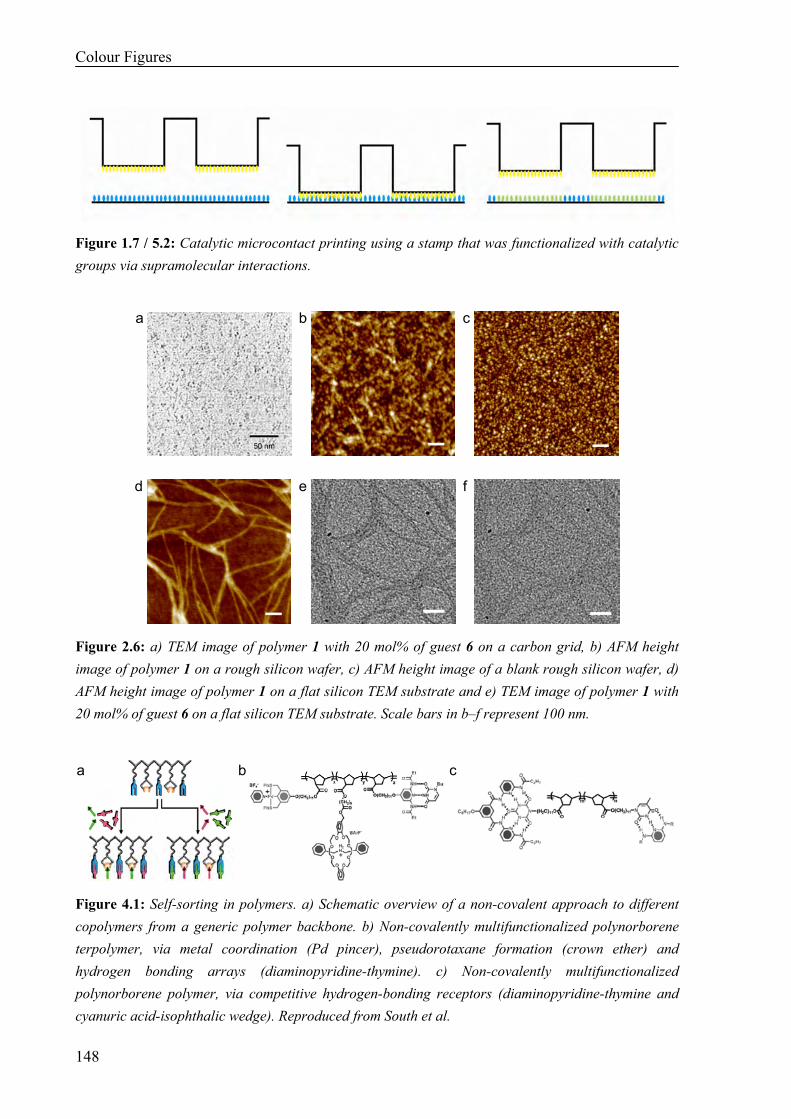
Colour Figures
148
Figure 1.7 / 5.2: Catalytic microcontact printing using a stamp that was functionalized with catalytic groups via supramolecular interactions.
a
b
c
d
e
f
Figure 2.6: a) TEM image of polymer 1 with 20 mol% of guest 6 on a carbon grid, b) AFM height image of polymer 1 on a rough silicon wafer, c) AFM height image of a blank rough silicon wafer, d) AFM height image of polymer 1 on a flat silicon TEM substrate and e) TEM image of polymer 1 with 20 mol% of guest 6 on a flat silicon TEM substrate. Scale bars in b–f represent 100 nm.
a
b
c
Figure 4.1: Self-sorting in polymers. a) Schematic overview of a non-covalent approach to different copolymers from a generic polymer backbone. b) Non-covalently multifunctionalized polynorborene terpolymer, via metal coordination (Pd pincer), pseudorotaxane formation (crown ether) and hydrogen bonding arrays (diaminopyridine-thymine). c) Non-covalently multifunctionalized polynorborene polymer, via competitive hydrogen-bonding receptors (diaminopyridine-thymine and cyanuric acid-isophthalic wedge). Reproduced from South et al.
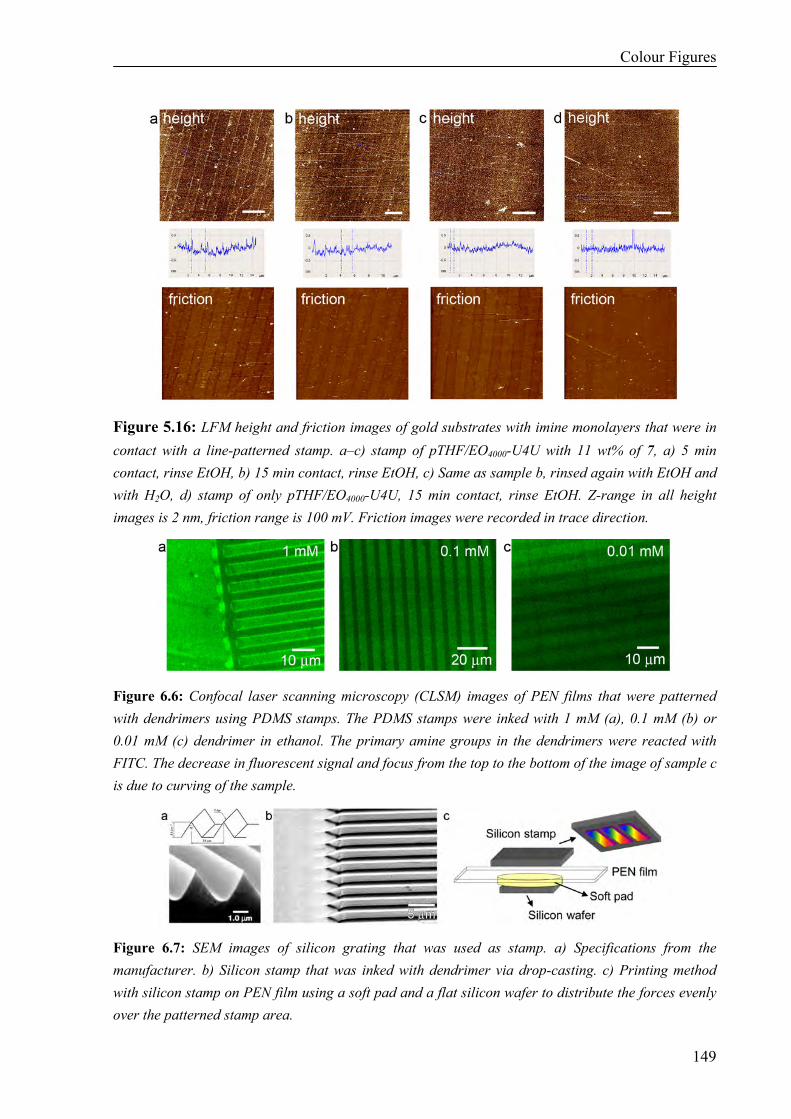
Colour Figures
149
Figure 5.16: LFM height and friction images of gold substrates with imine monolayers that were in contact with a line-patterned stamp. a–c) stamp of pTHF/EO4000-U4U with 11 wt% of 7, a) 5 min contact, rinse EtOH, b) 15 min contact, rinse EtOH, c) Same as sample b, rinsed again with EtOH and with H2O, d) stamp of only pTHF/EO4000-U4U, 15 min contact, rinse EtOH. Z-range in all height images is 2 nm, friction range is 100 mV. Friction images were recorded in trace direction.
Figure 6.6: Confocal laser scanning microscopy (CLSM) images of PEN films that were patterned with dendrimers using PDMS stamps. The PDMS stamps were inked with 1 mM (a), 0.1 mM (b) or 0.01 mM (c) dendrimer in ethanol. The primary amine groups in the dendrimers were reacted with FITC. The decrease in fluorescent signal and focus from the top to the bottom of the image of sample c is due to curving of the sample.
Figure 6.7: SEM images of silicon grating that was used as stamp. a) Specifications from the manufacturer. b) Silicon stamp that was inked with dendrimer via drop-casting. c) Printing method with silicon stamp on PEN film using a soft pad and a flat silicon wafer to distribute the forces evenly over the patterned stamp area.
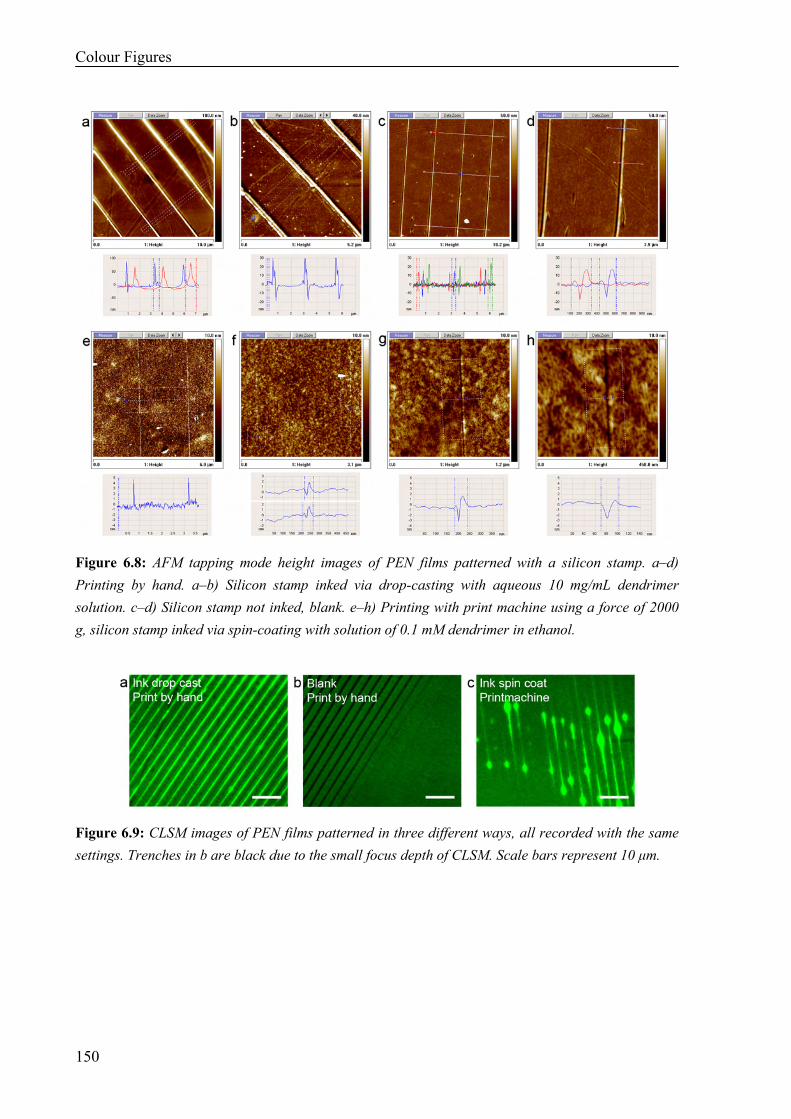
Colour Figures
150
Figure 6.8: AFM tapping mode height images of PEN films patterned with a silicon stamp. a–d) Printing by hand. a–b) Silicon stamp inked via drop-casting with aqueous 10 mg/mL dendrimer solution. c–d) Silicon stamp not inked, blank. e–h) Printing with print machine using a force of 2000 g, silicon stamp inked via spin-coating with solution of 0.1 mM dendrimer in ethanol.
Figure 6.9: CLSM images of PEN films patterned in three different ways, all recorded with the same settings. Trenches in b are black due to the small focus depth of CLSM. Scale bars represent 10 μm.
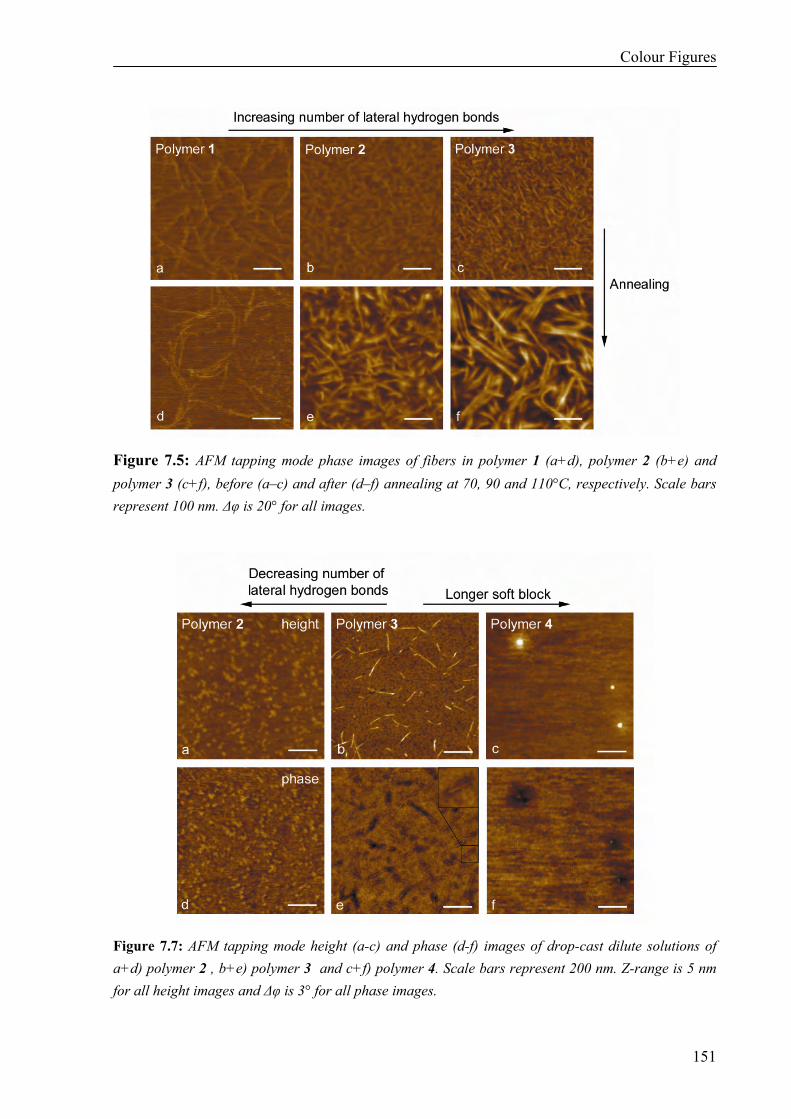
Colour Figures
151
Figure 7.5: AFM tapping mode phase images of fibers in polymer 1 (a+d), polymer 2 (b+e) and polymer 3 (c+f), before (a–c) and after (d–f) annealing at 70, 90 and 110°C, respectively. Scale bars represent 100 nm. Δφ is 20° for all images.
Figure 7.7: AFM tapping mode height (a-c) and phase (d-f) images of drop-cast dilute solutions of a+d) polymer 2 , b+e) polymer 3 and c+f) polymer 4. Scale bars represent 200 nm. Z-range is 5 nm for all height images and Δφ is 3° for all phase images.

152
Summary
153
Polymers in Nanotechnology Molecular Recognition and Surface Modification In this thesis, several polymers are probed for their application in bottom-up or top-down Nanotechnology. First, the principle of molecular recognition in bisurea-based thermoplastic elastomers was investigated, since this is an interesting method for the functionalization of these polymers with molecular control via a modular bottom-up approach. The morphology of four different bisurea polymers, varying in the length of the polytetrahydrofuran soft block or the length of the alkyl spacer between the urea units in the hard block, was studied with AFM, TEM, SAXS and WAXS measurements to gain more insight in the assembly process of the bisurea hard blocks. The results of these measurements are described in Chapter 2. They suggest the stacking of 3-4 bisurea ribbons in fiber-like aggregates, independent of soft block length or spacing between the urea units. The d-spacing of the polymers, interpreted as the average distance between the fibers, did increase upon an increase in soft block length or an increase in spacing between the urea units. Furthermore, the selectivity of the binding of a bisurea guest in the bisurea polymer was studied and described in Chapters 3 and 4. Matching of the spacer length between the two urea groups is a crucial factor in the strength of binding. If the spacer lengths are the same, the amount of guest that is washed out from a polymer film is small. Previous studies had focused on the binding of matching bisurea molecules in comparison to the binding of non-matching bisurea molecules. However, in this thesis also the binding selectivity in a mixture of bisurea guests and bisurea polymers with different spacer lengths was investigated. The position of the bisurea guest molecules with respect to each other was probed via fluorescence measurements. In Chapter 3 it is shown that bisurea-pyrene probes are randomly incorporated in the hard blocks of thermoplastic elastomers with matching bisurea groups, whereas they phase separate from polymers with non-matching or no bisurea groups. In Chapter 4, the self-sorting of bisurea guest molecules in a mixture of matching and non-matching hosts was investigated. Self-sorting of molecules is an interesting phenomenon to gain control over the position of guest molecules, since functional guests based on matching resp. non-matching bisurea recognition units can be colocalized or separated. The formation of exciplexes between pyrene and dimethylaniline bisurea guests with matching and non-matching bisurea groups is described, as well as energy transfer between matching and non-matching pyrene and naphthalene bisurea guests, as was probed with fluorescence resonance energy transfer (FRET) measurements. The bisurea guest molecules appeared to selectively bind to the fibers of their matching polymer, meaning that polymers with different bisurea spacings form separate fibers. Annealing of the polymer films further improved the self-sorting capacity of the guest molecules.
Summary
154
In Chapter 5, the use of the thermoplastic elastomer pTHF-bisurea as the stamp material for microcontact printing is presented. The main advantages of using pTHF-bisurea as stamp material over the commonly used poly(dimethylsiloxane) (PDMS) are the reduced preparation time of the stamps via hot embossing and the more hydrophilic character of pTHF-bisurea, which makes the stamps suitable for the printing of polar inks. The successful preparation of pTHF-bisurea stamps within one minute by molding against fluorinated silicon wafers was demonstrated. These stamps were successfully used for microcontact printing of hydrophobic as well as hydrophilic inks. Furthermore, the utility of pTHF-bisurea stamps for catalytic or inkless microcontact printing was investigated. The bisurea stamp material was functionalized with catalytic, acid-functionalized bisurea guest groups via molecular recognition. The catalytic, acid-functionalized stamps were used for the selective hydrolysis of imine groups at the stamp-substrate interface. AFM measurements indeed revealed height and friction patterns on the substrate. Unfortunately, further experiments revealed the transfer of stamp material to the surface, which limits the applicability of this polymer for catalytic surface patterning. These results show that a critical attitude towards printing experiments with any stamp material is necessary (including PDMS, which is also known to contaminate substrates) In Chapter 6, the functionalization of poly(ethylene naphthalene) (PEN) films with amine-terminated poly(propylene imine) (PPI) dendrimers is discussed. These dendrimers are covalently attached via amidation, which was shown with Fourier-transform infrared reflection-absorption spectroscopy (FT-IRRAS), X-ray photon spectroscopy (XPS) and contact angle measurements. After functionalization of the PEN with PPI dendrimer, the PEN film becomes smoother, more hydrophilic and the interaction of the amine groups in the dendrimers with metal ions can be used for the electroless deposition of metal on the PEN film. Due to the covalent binding of the dendrimer to the PEN film, no detachment of the metal film was observed. Finally, patterns of dendrimer and metal were produced on the surface of the PEN films via microcontact printing. In the last chapter of this thesis, functionalization of polydimethylsiloxane (PDMS) polymers with hydrogen bonding ureidopyrimidinone (UPy) groups to obtain supramolecular thermoplastic elastomers is described. In previous studies, no lateral stacking of UPy dimers was observed in UPy-functionalized polymers, unless additional urethane or urea groups were built into the hard block. However, in UPy functionalized PDMS, lateral stacking of UPy dimers does take place, even in the absence of urea or urethane groups; long fibers were observed in the atomic force microscopy (AFM) phase image. The presence of these interactions in the bulk was proven by oscillatory shear experiments. We attribute the stacking to the incompatibility of soft block and hard block, leading to phase separation at the nanoscale. Additional urethane or urea groups in the hard block do lead to materials with more fibers and higher melting points.
Samenvatting voor niet-chemici
155
Polymeren in Nanotechnologie Moleculaire Herkenning en Oppervlakte Modificatie In dit proefschrift staat het gebruik van polymeren voor verschillende toepassingen in de nanotechnologie centraal. Nanotechnologie is de wetenschap die zich bezighoudt met het maken van structuren, die tussen 1 en 100 nm groot zijn, en het nauwkeurig positioneren van deze nanostructuren. Een nanometer is slechts één miljoenste millimeter groot. Er zijn momenteel twee stromingen binnen de nanotechnologie: aan de ene kant wordt er door wetenschappers gewerkt aan het opbouwen van nanostructuren vanuit nog kleinere bouwstenen, de moleculen. Dit noemen we bottom-up nanotechnologie. Aan de andere kant werken wetenschappers aan het steeds verder miniaturiseren van bestaande lithografische productieprocessen, waarbij materiaal wordt verwijderd totdat nanostructuren ontstaan. Dit noemen we top-down nanotechnologie. In het onderzoek wat beschreven wordt in dit proefschrift hebben we zowel bottom-up als top-down nanotechnologie gebruikt en onderzocht of we hiervoor polymeren kunnen gebruiken. Polymeren zijn grote moleculen die worden gemaakt door herhaalde koppeling van kleine moleculen tot ketens. De voordelen van polymeren zijn dat ze goedkoop te produceren zijn en gemakkelijk verwerkbaar zijn. Voor het gebruik van polymeren in bottom-up nanotechnologie is het van belang dat er interacties zijn tussen de polymeerketens; nanostructuren worden gevormd doordat de ketens gaan stapelen (aggregeren). Deze nanostructuren zijn de knooppunten in het polymere netwerk, die ervoor zorgen dat het polymeer elastische eigenschappen krijgt. Als het polymeer verwarmd wordt, worden de interacties zwakker en vallen de nanostructuren uit elkaar, waardoor het polymeer smelt. Dit zogenaamde thermoplastische gedrag zorgt voor een goede verwerkbaarheid van het polymeer in processen zoals spuitgieten, inkjet printen of imprinten. In ons onderzoek hebben we gebruik gemaakt van interacties tussen de polymeerketens door middel van waterstofbruggen. Waterstofbruggen zijn reversibele interacties, die erg belangrijk zijn in de natuur; ze zorgen onder andere voor het bij elkaar houden van DNA en de structuur van eiwitten. In hoofdstuk 2-4 hebben we het aggregatiegedrag onderzocht van polymeren met bisureagroepen. Deze bisureagroepen bestaan uit twee ureumgroepen met een in lengte variërend verbindingsstuk, zodat de afstand tussen de ureumgroepen gevarieerd kan worden. De ureumgroepen kunnen twee waterstofbruggen vormen met andere ureumgroepen, waardoor stapeling van de ureumgroepen optreedt, zoals op de achterkant van dit proefschrift te zien is. Het is gebleken, dat in een mengsel met bouwblokken met verschillende afstanden tussen de ureumgroepen, alleen de bouwblokken met dezelfde afstand tussen de ureumgroepen op elkaar stapelen. Dit noemen we moleculaire herkenning, waardoor een zelfsorterend systeem ontstaat. Door nu diverse functionele groepen vast te maken aan de bouwblokken, kunnen deze functionele
Samenvatting voor niet-chemici
156
groepen bij elkaar worden gebracht (bij het gebruik van twee dezelfde bouwblokken) of juist van elkaar worden gescheiden (bij het gebruik van twee verschillende bouwblokken). We hebben ook nog een ander soort polymeren met waterstofbruggen onderzocht en beschreven in hoofdstuk 7, namelijk de supramoleculaire thermoplastische elastomeren. In deze klasse van polymeren worden hele korte stukjes polymeer aan elkaar geplakt door middel van reversibele interacties. Bij het smelten van het polymeer worden de interacties verbroken en blijven er korte stukjes over, waardoor het gesmolten polymeer minder stroperig is dan normale thermoplastische elastomeren, en dus makkelijker te verwerken. De interacties die we gebruikt hebben om de polymeerketens aan elkaar te plakken zijn wederom waterstofbruggen; aan beide uiteinden van de polymeerketens zitten ureïdopyrimidinon (UPy) groepen, die vier waterstofbruggen kunnen vormen. Doordat we gebruik hebben gemaakt van een polymeer dat niet mengbaar is met de UPy-groepen, ontstaat er fasescheiding, wat we kunnen zien met een speciale microscoop die het oppervlak met nanometer resolutie aftast en verschillen in hoogte, adhesie en stijfheid meet. We hebben gezien dat het verhogen van het aantal waterstofbruggen leidt tot het vormen van grotere, stabielere aggregaten. Dit zorgt voor een verhoging in de smelttemperatuur van het polymeer. In hoofdstuk 5 gebruiken we polymeren voor top-down nanotechnologie. Met de bisurea thermoplastische elastomeren uit hoofdstuk 2 worden stempels met nanostructuren gemaakt. Omdat deze polymeren gesmolten kunnen worden, kunnen we hiervoor een imprint-procedure gebruiken die veel sneller is dan conventionele technieken om stempels te maken. Met deze stempels kunnen we vervolgens nanopatronen stempelen met verschillende soorten inkt op een goud-oppervlak. Deze techniek, die in 1993 uitgevonden is, noemen we microcontact printen. Omdat de polymeren die we gebruikt hebben hydrofieler (waterminnender) zijn dan het materiaal waar op dit moment de stempels mee gemaakt worden, kunnen ook hydrofiele moleculen gebruikt worden als inkt. De oppervlaktes met nanopatronen kunnen bijvoorbeeld gebruikt worden als chips voor biosensoren, indien eiwitten als inkt worden gebruikt. In hoofdstuk 6 hebben we patronen gemaakt op plastic folies van poly(ethyleen naftaleen) (PEN). Deze folies kunnen gebruikt worden voor flexibele plastic elektronica, zoals flexibele zonnecellen, kleding met sensoren erin of textiel met geïntegreerde verlichting. Het grote probleem voor het gebruik van deze PEN folies is de slechte hechting van de metalen bedrading aan de folie. Wij hebben laten zien dat we deze hechting kunnen verbeteren door de folie eerst te laten reageren met dendrimeren. Deze dendrimeren zijn sterk vertakte moleculen met een hoog molecuulgewicht en relatief veel reactieve eindgroepen. Hierdoor kan het dendrimeer op meerdere plaatsen met de folie reageren. Ook is het mogelijk een patroon van dendrimeren op de folie te maken door ze te stempelen via de microcontact print-techniek en ze te laten reageren. Omdat er depositie van metaal is op de plek waar deze dendrimeren zich bevinden, ontstaat er een metaalpatroon op de folie.
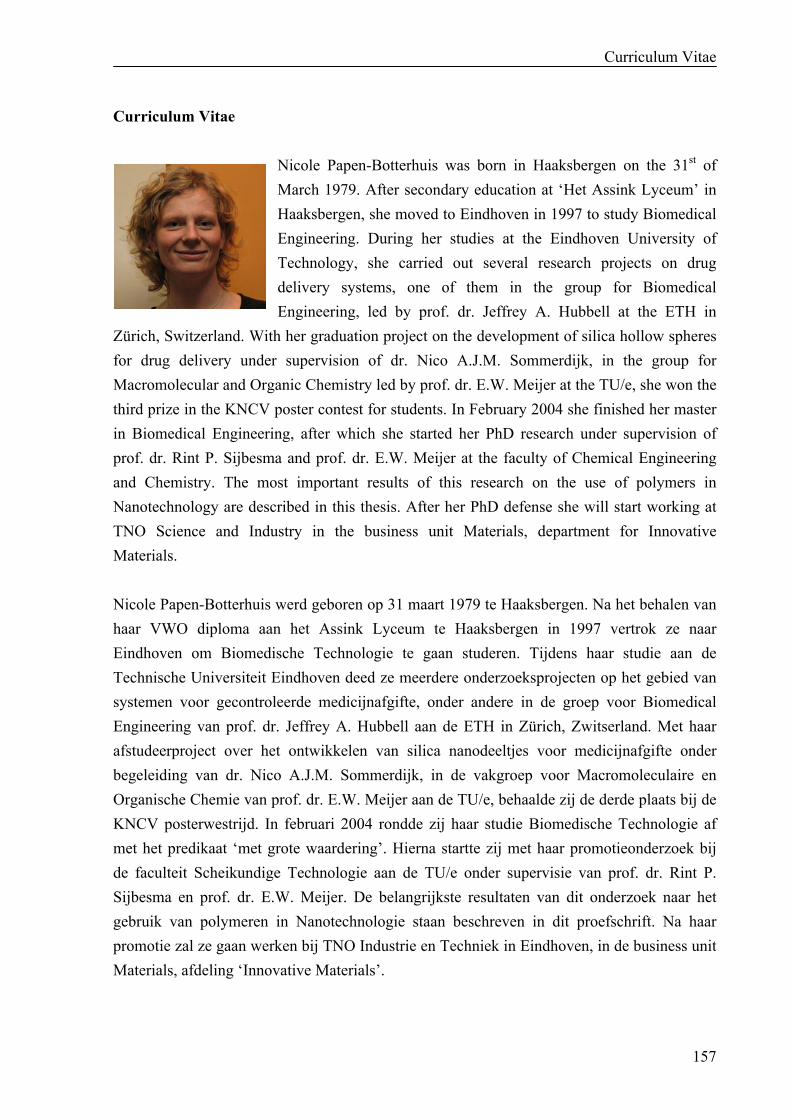
Curriculum Vitae
157
Curriculum Vitae
Nicole Papen-Botterhuis was born in Haaksbergen on the 31st of March 1979. After secondary education at ‘Het Assink Lyceum’ in Haaksbergen, she moved to Eindhoven in 1997 to study Biomedical Engineering. During her studies at the Eindhoven University of Technology, she carried out several research projects on drug delivery systems, one of them in the group for Biomedical Engineering, led by prof. dr. Jeffrey A. Hubbell at the ETH in
Zürich, Switzerland. With her graduation project on the development of silica hollow spheres for drug delivery under supervision of dr. Nico A.J.M. Sommerdijk, in the group for Macromolecular and Organic Chemistry led by prof. dr. E.W. Meijer at the TU/e, she won the third prize in the KNCV poster contest for students. In February 2004 she finished her master in Biomedical Engineering, after which she started her PhD research under supervision of prof. dr. Rint P. Sijbesma and prof. dr. E.W. Meijer at the faculty of Chemical Engineering and Chemistry. The most important results of this research on the use of polymers in Nanotechnology are described in this thesis. After her PhD defense she will start working at TNO Science and Industry in the business unit Materials, department for Innovative Materials. Nicole Papen-Botterhuis werd geboren op 31 maart 1979 te Haaksbergen. Na het behalen van haar VWO diploma aan het Assink Lyceum te Haaksbergen in 1997 vertrok ze naar Eindhoven om Biomedische Technologie te gaan studeren. Tijdens haar studie aan de Technische Universiteit Eindhoven deed ze meerdere onderzoeksprojecten op het gebied van systemen voor gecontroleerde medicijnafgifte, onder andere in de groep voor Biomedical Engineering van prof. dr. Jeffrey A. Hubbell aan de ETH in Zürich, Zwitserland. Met haar afstudeerproject over het ontwikkelen van silica nanodeeltjes voor medicijnafgifte onder begeleiding van dr. Nico A.J.M. Sommerdijk, in de vakgroep voor Macromoleculaire en Organische Chemie van prof. dr. E.W. Meijer aan de TU/e, behaalde zij de derde plaats bij de KNCV posterwestrijd. In februari 2004 rondde zij haar studie Biomedische Technologie af met het predikaat ‘met grote waardering’. Hierna startte zij met haar promotieonderzoek bij de faculteit Scheikundige Technologie aan de TU/e onder supervisie van prof. dr. Rint P. Sijbesma en prof. dr. E.W. Meijer. De belangrijkste resultaten van dit onderzoek naar het gebruik van polymeren in Nanotechnologie staan beschreven in dit proefschrift. Na haar promotie zal ze gaan werken bij TNO Industrie en Techniek in Eindhoven, in de business unit Materials, afdeling ‘Innovative Materials’.
Curriculum Vitae
158
List of Publications N.E. Botterhuis, S. Karthikeyan, D. Veldman, S.C.J. Meskers and R.P. Sijbesma, Molecular recognition in bisurea thermoplastic elastomers studied with pyrene-based fluorescent probes and atomic force microscopy. Chem. Commun. 2008, DOI: 10.1039/b804457k. N.E. Botterhuis, D.J.M. van Beek, G.M.L. van Gemert, A.W. Bosman and R.P. Sijbesma, Self-assembly and morphology of PDMS supramolecular thermoplastic elastomers. J. Polym. Sci., Part A: Polym. Chem. 2008, 46 (12), 3877-3885. M.J. Boerakker, N.E. Botterhuis, P.H.H. Bomans, P.M. Frederik, E.M. Meijer, R.J.M. Nolte and N.A.J.M. Sommerdijk, Aggregation behavior of giant amphiphiles prepared by cofactor reconstruction. Chem.--Eur. J. 2006, 12 (23), 6071-6080. N.E. Botterhuis, Q. Sun, P.C.M.M. Magusin, R.A. van Santen and N.A.J.M. Sommerdijk, Hollow silica spheres with ordered pore structure and their application in controlled release studies. Chem.--Eur. J. 2006, 12 (5), 1448-1456. A. Rehor, N.E. Botterhuis, J.A. Hubbell, N.A.J.M. Sommerdijk and N. Tirelli, Glucose sensitivity through oxidation responsiveness. An example of cascade-responsive nano-sensors. J. Mater. Chem. 2005, 15 (37), 4006-4009. T. J. van Brakel, J. J. R. Hermans, B. J. Janssen, H. van Essen, N.E. Botterhuis, J. F. M. Smits and J. G. Maessen, Intrapericardial delivery enhances cardiac effects of Sotalol and Atenolol. J. Cardiovasc. Pharmacol. 2004, 44 (1), 50-56. Papers that will be submitted: N.E. Botterhuis, C.F.C. Fitié, J.G.P. Goossens and R.P. Sijbesma, Nanofibrous morphology of pTHF-bisurea thermoplastic elastomers, manuscript in preparation. N.E. Botterhuis, S. Karthikeyan, A.J.H. Spiering and R.P. Sijbesma, Self-sorting of guests and hard blocks in bisurea-based thermoplastic elastomers, manuscript in preparation. N.E. Botterhuis, R.M.R. Willemsen, R.A. Tacken, O.L.J. van Asselen, P.C. Thüne, M. Péter, J.J. Michels and R.P. Sijbesma, Surface modification and patterning of PEN films with dendrimers, manuscript in preparation.
Dankwoord
159
Dankwoord Het is ongelooflijk hoeveel mensen in vier jaar tijd bijgedragen hebben aan mijn plezierige, leerzame en zeer gevarieerde promotietijd! Van de begeleiding bij het onderzoek tot gezellige uitstapjes, van Nanoned meetings tot de backup thuis: Iedereen heeft vier jaar lang voor mij klaargestaan. Ontzettend bedankt hiervoor! Een aantal mensen wil ik op deze laatste pagina’s van mijn proefschrift graag in het bijzonder bedanken. Allereerst Rint Sijbesma, opgeklommen van copromotor tot eerste promotor tijdens mijn promotie. Je hebt me geïntroduceerd in het veld van de supramoleculaire polymeren, en mij door een aantal moeilijke periodes in mijn onderzoek gesleept. Duizendmaal dank hiervoor! Succes met het uitbreiden van je eigen onderzoeksgroep, ik ben trots dat ik daarvan deel heb mogen uitmaken! Daarnaast wil ik uiteraard Bert Meijer bedanken, de drijvende kracht achter SMO (of is het nu toch MST?) Ik vind het super dat je mijn tweede promotor bent, en wens je erg veel succes met het opbouwen van het ICMS. Hopelijk verdwijnt je wetenschappelijke bijdrage niet onder de stapels papierwerk! Then I would like to thank the members of my manuscript committee for reading my manuscript and approving it. First of all, prof. S. Thayumanavan, thank you very much, also for coming all the way to Eindhoven for my PhD defense. Daarnaast wil ik graag prof. B.J. Ravoo bedanken: Bart Jan, tevens bedankt voor de prettige samenwerking! Als laatste prof. D.J. Broer, niet alleen bedankt voor je correcties op mijn manuscript, maar ook voor je input tijdens de Nanoned meetings. De twee leden die mijn promotie commissie complementeren, dr. N.A.J.M. Sommerdijk en dr. S.C.J. Meskers, wil ik ook alvast hartelijk bedanken. Nico, jouw enthousiasme werkt aanstekelijk. De mogelijkheden die je me hebt gegeven tijdens mijn studie om onderzoek te doen aan drug delivery systemen waardeer ik nog steeds! Veel succes met de Soft Matter Cryo-TEM Research Unit. Stefan, jouw spectroscopische kennis heeft in grote mate bijgedragen aan hoofdstukken 3 en 4 van dit proefschrift, bedankt hiervoor! We zijn op onze scheikunde faculteit gezegend met een enorme hoeveelheid meetapparatuur met de juiste specialisten, die nooit te beroerd zijn geweest om mij ergens mee te helpen. Voor de instructie en interpretatie van de FT-IRRAS metingen wil ik Otto van Asselen en Pit Theunissen bedanken, voor de instructie voor de XPS metingen Peter Thüne en Tiny Verhoeven, voor de instructie voor de contacthoekmetingen Tamara Dikić en Daniela Voinea-Popescu, voor de TEM metingen Joachim Loos (Soft Matter Cryo-TEM Research Unit) en Patrick Chin, voor de GPC metingen Ralf Bovee en voor de MALDI-TOF metingen Xianwen Lou. Ook van de meetapparatuur op andere faculteiten heb ik dankbaar gebruik gemaakt. Ik wil graag Marc van Maris bedanken voor al zijn inspanningen waardoor ik SEM metingen
Dankwoord
160
kon doen, Martijn Kemerink omdat hij altijd met raad en daad terzijde stond bij de AFM metingen, Rob Petterson en Léon Govaert voor hun hulp bij de trektesten en Marcel Wijlaars voor de instructie op de CLSM. Daarnaast wil ik graag nog een aantal mensen bedanken die op een andere wijze een bijdrage hebben geleverd aan mijn promotie onderzoek. Allereerst Jolanda Spiering, Karthik Sivasubramaniam, Natalia Chebotareva, Rolf Koevoets, Gaby van Gemert (SyMO-Chem) en Tonny Bosman (SupraPolix), voor de synthese van een groot gedeelte van de verbindingen die in dit proefschrift beschreven staan. Daarnaast wil ik Dirk Veldman en Stefan Meskers bedanken voor hun hulp bij de optische spectroscopie. De samenwerking met Linda Havermans-Van Beek heeft geleid tot een mooie paper met cover, thanks a lot! In fact all the members of Rint’s group have had more or less input in my research during our breakfast meetings. Thank you all! Voor de SAXS en WAXS metingen en uitwerkingen in hoofdstuk 2 wil ik graag Han Goossens, Carel Fitié, Giuseppe Portale en Martin Wolffs bedanken. Een proefschrift zonder mooie cartoons is natuurlijk niet af; Eva Wisse en Ron Versteegen, bedankt dat ik cartoons van jullie mocht gebruiken. David Trimbach, Cees Bastiaansen en Henk Stapert wil ik graag bedanken voor de nuttige discussies over microcontact printen met TPEs, en voor het ter beschikking stellen van apparatuur en de benodigde materialen. Het katalytische printen heb ik uitgevoerd in samenwerking met Dorota Rożkiewicz en Bart Jan Ravoo aan de Universiteit Twente. Bedankt voor jullie hartelijke ontvangst, het zal jullie niet ontgaan zijn dat ik mij altijd zeer thuis heb gevoeld bij jullie. Maryana Escalante-Marun en prof. Vinod Subramaniam wil ik bedanken voor hun inspanningen om AFFM te meten aan de single fibers van hoofdstuk 2. Helaas bleek dat net een stap te ver! Voor hun bijdrage aan het werk aan PEN films in hoofdstuk 6 wil ik graag Mária Péter en Jasper Michels van het Holst Centre en Roberto Willemsen en Roland Tacken van TNO bedanken. Last but not least wil ik graag alle mensen bedanken die SMO maken of hebben gemaakt tot een fantastische plek om te werken: Joke, Angela, Hanneke, Ingrid, Carine, Emma, Hannie, Sonja, Henk, Hans en de complete wetenschappelijke staf voor antwoorden op alle mogelijke en onmogelijke vragen. Nanoned wil ik niet alleen bedanken voor de financiering van dit onderzoek, maar ook voor de organisatie van de Nanoned symposia en de IP valorisatie cursus. Daarnaast wil ik graag alle leden van de gebruikerscommissie van het flagship Nanofabrication bedanken voor hun kritische blik en input in mijn onderzoek. Natuurlijk mag de sociale ondersteuning nooit onderschat worden bij een promotieonderzoek. Het werken op Lab 4 en in kantoor STO 4.43 heb ik dan ook altijd als een voorrecht gezien! Lab- en kamergenootjes: bedankt voor de leuke tijd. Ook tijdens de uitjes, kerstborrels, pokeravonden, skivakanties, beachvolleybalweekenden en aan de koffietafel (ook in het Spectrum gebouw), viel er altijd van alles te beleven. Hiervoor wil ik in het bijzonder Jolanda (jij houdt me in balans), Kelly en Sjoerd, Maarten en Leonie,
Dankwoord
161
Linda en Pim, Eva en Bart, Dirk en Karin, Frank, Martin, Carel en Kicki, Arjan, Johan, Sagitta, Robert, Michel, Patricia, Daniela en Lucian, Hinke en Bram, Ronald, Jeroen en Noelle, Jan en Matthijn voor bedanken, maar eigenlijk is de hele SMO-M2N clan hiervoor verantwoordelijk! Ik heb me altijd als een vis in het water gevoeld tussen jullie allemaal. Arjan, Jolanda en Kelly, ook nog bedankt voor het nalezen van mijn proefschrift. Voor de nodige ontspanning zonder chemische grappen tussendoor kon ik gelukkig ook bij veel mensen terecht. Manon en Marc en Anita en Gerben, jullie vriendschap is me bijzonder dierbaar en gelukkig onverwoestbaar gebleken de afgelopen jaren! Meiden van Briljant, jullie diversiteit houdt me scherp! Bedankt voor jullie luisterend oor en alle topfeesten en weekendjes, hopelijk volgen er nog vele. De vrienden uit Lichtenvoorde wil ik bedanken voor de gezelligheid en voor het geven van het goede voorbeeld op diverse gebieden. De leden van popkoor Sway wil ik bedanken voor de vele muzikale maandagavonden, en de volleybalheren van de Hightecs voor het tolereren van een vrouw in hun team... Ik ben gezegend met twee paranimfen die op alle vragen een antwoord zouden moeten weten, aangezien ze beiden docent scheikunde zijn geworden! Mark, al sinds de basisschool blijven we op hetzelfde pad, hoewel niet altijd in ruimtelijke zin. Nu gaan we toch echt allebei iets anders doen, maar ongetwijfeld blijven we elkaar vaak zien in Haaksbergen of Eindhoven! Kelly, mijn kamergenootje en partner-in-crime. Hoeveel uren hebben we samen doorgebracht met nadenken over vraagstukken waar we in ons eentje niet uitkwamen? En dat waren niet alleen de chemische problemen! Veel succes als lerares. Hopelijk komen mijn kinderen ooit bij jou of bij Mark op school… De laatste regels van dit dankwoord zijn voor de belangrijkste mensen in mijn leven, mijn familie. Hoewel de afstand groot is, waren jullie er altijd voor mij de afgelopen 4 jaren. Harrie en Lucie, bedankt voor jullie interesse en steun. Ik voel me helemaal thuis bij jullie, ook als ‘aangenomen’ dochter. Ook Chantal, Ronnie, Lisette en Erik wil ik graag bedanken voor hun nuchtere kijk op de zaken. Mams, jij bent de beste. Zonder jou en papa was ik nooit zover gekomen. Je stond en staat nog steeds altijd voor me klaar. Ik wens je alle geluk van de wereld toe samen met Jan. Ik kan me geen leven voorstellen zonder mijn zussies, Moniek en Fiona. Met Albert, Rutger en de kids erbij vormen we een mooi stel. Het is ongelooflijk hoe dicht het verdriet ons bij elkaar heeft gebracht, hopelijk gaat dat nooit meer kapot! Dion, ik ben sprakeloos. Je bent alles wat ik wil. Ik heb je lief.


![nanotechnology - MWITt2040116/document/nanotechnology [Compatibility Mode].pdf · Nanotechnology อ.สิริหทัย ศรีขวัญใจ ครูวิชาการสาขาเคม](https://img.pdfslide.net/doc/110x75/5ed2ee8082b1917a215e8537/nanotechnology-t2040116documentnanotechnology-compatibility-modepdf-nanotechnology.jpg)


![Introduction to Nanotechnology What is Nanotechnology While many definitions for nanotechnology exist, the [National Nanotechnology Initiative] NNI calls](https://img.pdfslide.net/doc/110x75/56649d9e5503460f94a88dbf/introduction-to-nanotechnology-what-is-nanotechnology-while-many-definitions.jpg)