Embed Size (px)
Citation preview
Chapter 2
© 2012 Chan et al., licensee InTech. This is an open access chapter distributed under the terms of the Creative Commons Attribution License (http://creativecommons.org/licenses/by/3.0), which permits unrestricted use, distribution, and reproduction in any medium, provided the original work is properly cited.
Poly(trimethylene terephthalate) – The New Generation of Engineering Thermoplastic Polyester
Chin Han Chan, Sarathchandran and Sabu Thomas
Additional information is available at the end of the chapter
http://dx.doi.org/10.5772/50317
1. Introduction
Polyester is the category of polymers with ester functional group on the main chain, although there are many types of polyester, the term polyester in industries specifically refers to poly(ethylene terephthalate) (PET) and poly(butylene terephthalate). Polyesters can be classified as thermoplastic or thermosetting depending on the chemical structures. Table 1 shows the industrial production of polyesters, and it is estimated that the production will exceed 50 million tons by the year of 2015. Polyesters are made from chemical substances found mainly in petroleum and are mainly manufactured into fibers, films, and plastics. These polyesters are abbreviated as mGT, where m denotes the number of methylene groups; e.g.: PET, Poly(trimethylene terephthalate) (PTT) and PBT are abbreviated as 2GT, 3GT and 4GT, respectively.
Market size per yearProduct type 2002 [Million tons/year] 2008 [Million tons/year] Textile-PET 20 39 Resin, bottle/A-PET (solution casted PET)
9 16
Film-PET 1.2 1.5 Special polyester 1 2.5 Total 31.2 49
Table 1. The world production of polyester[1]
The credit of finding that alcohols and carboxylic acids can be mixed successfully to create fibers goes to W.H.Carothers, who was working for DuPont at the time and unfortunately
Polyester 20
when he discovered Nylon, polyester took a back seat. Carothers’s incomplete research had not advanced to investigating the polyester formed from mixing ethylene glycol and terephthalic acid. It was the two British scientists – Whinfield and Dickson[1] who patented PET in 1941. Later that year, the first polyester fiber – Terylene – was synthesized by Whinfield and Dickson along with Birtwhistle and Ritchiethey. Terylene was first manufactured by Imperial Chemical Industries or ICI. PET forms the basis of synthetic fibers like Dacron, Terylene and polyesters. DuPont's polyester research lead to a whole range of trademarked products, one example is Mylar (1952), an extraordinarily strong PET fiber that grew out of the development of Dacron in the early 1950s.
The industrial production of polyesters involves three steps
1. Condensation Polymerization: When acid and alcohol are reacted in vacuum, at high temperatures condensation polymerization takes place. After the polymerization, the material is extruded onto a casting trough in the form of ribbon. Upon cooling, the ribbon hardens and is cut into chips.
2. Melt-spun Fiber: The chips are dried completely. Hopper reservoirs are then used to melt the chips. Afterwards, the molten polymer is extruded through spinnerets and cooled down by air blowing. It is then loosely wound around cylinders.
3. Drawing: The fibers consequently formed are hot stretched to about five times of their original length (to reduce the fiber width). This is then converted into products.
PTT is an aromatic polyester prepared by the melt polycondensation of 1, 3-propanediol (PDO) with either terephthalic acid (TPA) or dimethyl terephthalate (DMT). PTT is synthesized by the transesterification of propane diol with dimethylene terephthalate or by the esterification of propane diol with terephthalic acid. The reaction is carried out in the presence of hot catalyst like titanium butoxide and dibutyl tin oxide at a temperature of 260 oC. The important by-products of this reaction include acrolien and allyl alcohol[3]. Direct esterification of propane diol and terephthalic acid is considered as the least economic and industrial method. The reaction is carried out in the presence of a “heel” under a pressure of 70-150 kPa at a temperature of 260 oC. The “heel” is usually referred to the added PTT oligomers which act as a reaction medium and increase the solubility of terephthalic acid[3]. Recent studies by different groups show that the selection of the catalyst plays a major role on the reaction rate and PTT properties. Commonly used catalysts like titanium[4], tin[5, 6] and antimony[7, 8] compounds have their own limitations. Titanium-based catalysts are active but the PTT is discolored, antimony-based catalysts are toxic and only active in polycondensation while tin-based compounds have lower catalytic activity. G. P. Karayannidis and co-workers (2003)[7] reported the use of stannous octoate as the catalyst for PTT synthesis but its catalytic activity is poor, resulting in a low molecular weight PTT which was confirmed by measuring the content of terminal carboxyl groups. In this study, the catalytic activity was followed by measuring the amount of water generated and characterized by the degree of esterification (DE). Intrinsic viscosity measurement was carried out by using an Ubbelohde viscometer at 25 oC with 0.005 g mL-1 PTT solution of 1, 1, 2, 2-tetrachloroethane/phenol (50/50, w/w) mixture. The content of terminal carboxyl
Poly(trimethylene terephthalate) – The New Generation of Engineering Thermoplastic Polyester 21
group (CTCG) was determined by titrating 25 mL of chloroform and a few drops of phenolphthalein indicator to a solution of 1.000 g of PTT and 25 mL of benzyl alcohol against a titer of 0.561 g of KOH in 1 L of benzyl alcohol.
Catalyst
PTT
Intrinsic viscosity ([η]) (dL g-1)
CTCG (mol t-1) (content of terminal carboxyl groups)
Degree of esterification (DE) after 1.8 hr
Stannous oxalate (SnC2O4) 0.8950 15 97 Stannous octoate ([CH3(CH2)3CH(C2H5)COO]2Sn)
0.6155 34 75
Dibutyltin oxide (Bu2SnO) 0.8192 21 75 Tetrabutyl titanate 0.8491 20 82
Table 2. Effect of various catalysts on the properties of PTT. The amount of catalyst taken was 5·10-4 mol/mol of TPA, and esterification for 1.6 hrs; at 230 oC [9].
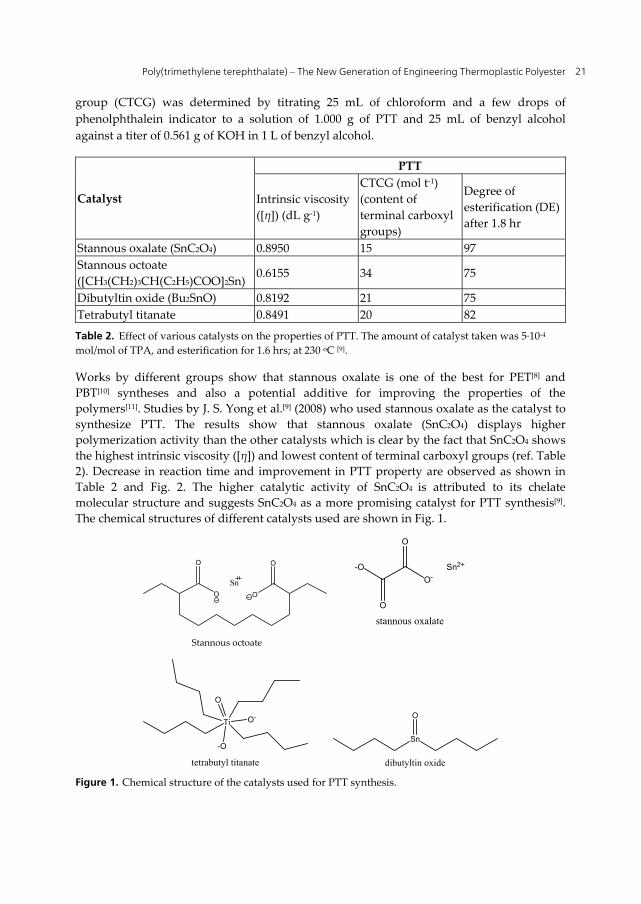
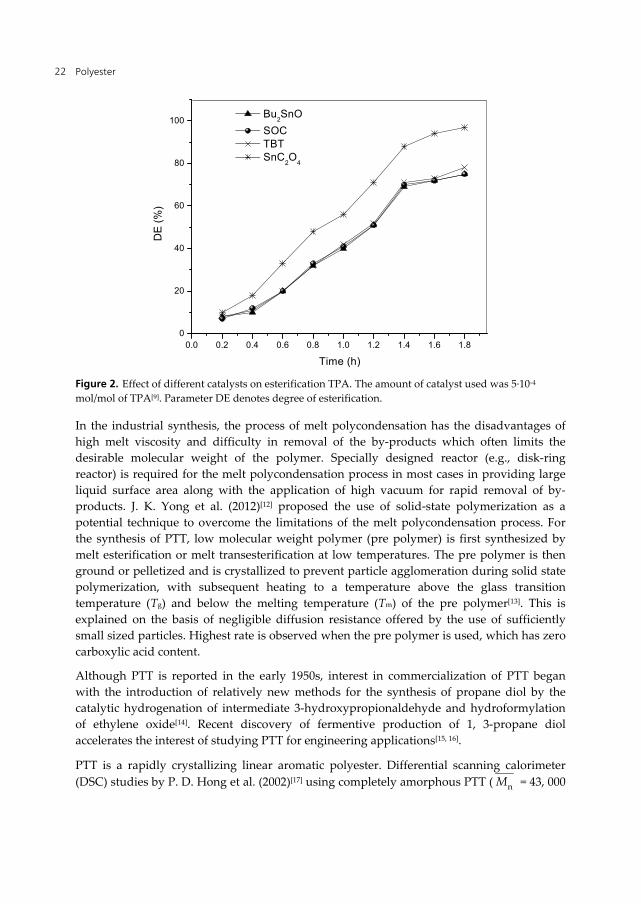
Works by different groups show that stannous oxalate is one of the best for PET[8] and PBT[10] syntheses and also a potential additive for improving the properties of the polymers[11]. Studies by J. S. Yong et al.[9] (2008) who used stannous oxalate as the catalyst to synthesize PTT. The results show that stannous oxalate (SnC2O4) displays higher polymerization activity than the other catalysts which is clear by the fact that SnC2O4 shows the highest intrinsic viscosity ([η]) and lowest content of terminal carboxyl groups (ref. Table 2). Decrease in reaction time and improvement in PTT property are observed as shown in Table 2 and Fig. 2. The higher catalytic activity of SnC2O4 is attributed to its chelate molecular structure and suggests SnC2O4 as a more promising catalyst for PTT synthesis[9]. The chemical structures of different catalysts used are shown in Fig. 1.
Figure 1. Chemical structure of the catalysts used for PTT synthesis.
Polyester 22
0.0 0.2 0.4 0.6 0.8 1.0 1.2 1.4 1.6 1.80
20
40
60
80
100
DE
(%
)
Time (h)
Bu2SnO
SOC TBT SnC
2O
4
Figure 2. Effect of different catalysts on esterification TPA. The amount of catalyst used was 5·10-4 mol/mol of TPA[9]. Parameter DE denotes degree of esterification.
In the industrial synthesis, the process of melt polycondensation has the disadvantages of high melt viscosity and difficulty in removal of the by-products which often limits the desirable molecular weight of the polymer. Specially designed reactor (e.g., disk-ring reactor) is required for the melt polycondensation process in most cases in providing large liquid surface area along with the application of high vacuum for rapid removal of by-products. J. K. Yong et al. (2012)[12] proposed the use of solid-state polymerization as a potential technique to overcome the limitations of the melt polycondensation process. For the synthesis of PTT, low molecular weight polymer (pre polymer) is first synthesized by melt esterification or melt transesterification at low temperatures. The pre polymer is then ground or pelletized and is crystallized to prevent particle agglomeration during solid state polymerization, with subsequent heating to a temperature above the glass transition temperature (Tg) and below the melting temperature (Tm) of the pre polymer[13]. This is explained on the basis of negligible diffusion resistance offered by the use of sufficiently small sized particles. Highest rate is observed when the pre polymer is used, which has zero carboxylic acid content.
Although PTT is reported in the early 1950s, interest in commercialization of PTT began with the introduction of relatively new methods for the synthesis of propane diol by the catalytic hydrogenation of intermediate 3-hydroxypropionaldehyde and hydroformylation of ethylene oxide[14]. Recent discovery of fermentive production of 1, 3-propane diol accelerates the interest of studying PTT for engineering applications[15, 16].
PTT is a rapidly crystallizing linear aromatic polyester. Differential scanning calorimeter (DSC) studies by P. D. Hong et al. (2002)[17] using completely amorphous PTT ( nM = 43, 000
Poly(trimethylene terephthalate) – The New Generation of Engineering Thermoplastic Polyester 23
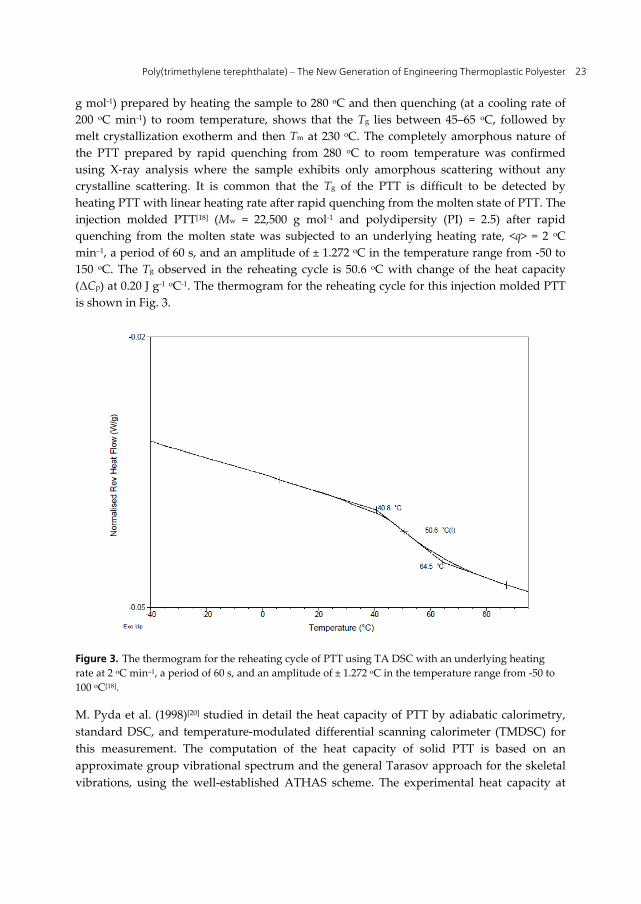
g mol-1) prepared by heating the sample to 280 oC and then quenching (at a cooling rate of 200 oC min-1) to room temperature, shows that the Tg lies between 45–65 oC, followed by melt crystallization exotherm and then Tm at 230 oC. The completely amorphous nature of the PTT prepared by rapid quenching from 280 oC to room temperature was confirmed using X-ray analysis where the sample exhibits only amorphous scattering without any crystalline scattering. It is common that the Tg of the PTT is difficult to be detected by heating PTT with linear heating rate after rapid quenching from the molten state of PTT. The injection molded PTT[18] (Mw = 22,500 g mol-1 and polydipersity (PI) = 2.5) after rapid quenching from the molten state was subjected to an underlying heating rate, <q> = 2 oC min–1, a period of 60 s, and an amplitude of ± 1.272 oC in the temperature range from -50 to 150 oC. The Tg observed in the reheating cycle is 50.6 oC with change of the heat capacity (ΔCp) at 0.20 J g-1 oC-1. The thermogram for the reheating cycle for this injection molded PTT is shown in Fig. 3.
Figure 3. The thermogram for the reheating cycle of PTT using TA DSC with an underlying heating rate at 2 oC min–1, a period of 60 s, and an amplitude of ± 1.272 oC in the temperature range from -50 to 100 oC[18].
M. Pyda et al. (1998)[20] studied in detail the heat capacity of PTT by adiabatic calorimetry, standard DSC, and temperature-modulated differential scanning calorimeter (TMDSC) for this measurement. The computation of the heat capacity of solid PTT is based on an approximate group vibrational spectrum and the general Tarasov approach for the skeletal vibrations, using the well-established ATHAS scheme. The experimental heat capacity at
Polyester 24
constant pressure is first converted to heat capacity at constant volume using the Nernst-Lindemann approximation
2
o pp v
v om
3 (exp)(exp) (exp)
(exp)
RA CC C
TCT
− = (1)
Where Ao is an approximately universal constant with a value 0.0039 K mol J-1; T is the temperature, Tom is the equilibrium melting temperature and R the universal gas constant. Later, based on the assumption that at low temperatures Cv(exp) contains only vibrational contributions, Cv(exp) is then separated into heat capacity linked to the group and skeletal vibration, which is then fitted to the general Tarasov function,[20, 21] in order to obtain the 3 characteristic parameters Θ1, Θ2, and Θ3 where Θ = hν/kB (h is the Planck’s constant, ν is the frequency, and kB is the Boltzmann constant). The functions D1, D2, D3 are the one-, two-, and three- dimensional Debye functions[22, 23]. The characteristic temperature Θ3 describes the skeletal contributions with a quadratic frequency distribution and for linear macromolecules, the value of Θ3 is between 0 and 150 K. M. Pyda et al. (1998) also suggested that knowing Θ1, Θ2, and Θ3 by curve fitting, skeletal heat capacities and with a list of group vibrations, one can easily calculate the heat capacity at constant volume for the solid state of a polymer, which is then converted to heat capacity of the solid at constant pressure using eqn. (1). The values obtained can be extended over a wide temperature range (0.1-1000 K) and serves as a baseline for the vibrational contributions to the heat capacity. M. Pyda et al. (1998)[20] also calculated the heat capacity of the liquid state (CpL) based on the empirical assumption that CpL is a linear function of temperature and using the addition scheme developed for ATHAS. The total heat capacity of liquid PTT is obtained from the contributions of the various structural groups (like CH2, NH2, COO, C6H4 etc.).
2v 3 3 3 31 2 1 2 2 2
1 1 2 2 31 1 2
( ), ,
C skT D D D D D
NR T T T T T T T T
Θ Θ Θ Θ Θ Θ Θ Θ Θ Θ = = − − − − Θ Θ Θ
(2)
The mechanical and electrical properties of PTT are close to PET, and even when these polyesters show lower mechanical properties as compared to Nylons, they show better elelctrical properties. The thermal stability of PTT by referring to the onset of decomposition temperature using thermal gravimetry analyzer (TGA), is comparable to polycarbonates (c.f. Tables 3, 4 and Fig. 5). Thermogram in Fig. 5 shows that PTT[18] is thermally stable up to 373 oC with 1.5 wt% of mass loss when it was heated up at 30 oC min-1 in nitrogen atmosphere. PTT thermally degrades further at around 494 oC with 92 wt% of mass loss and the remaining 4 wt% of mass fully decomposes at 600 oC.
Crystallization of PTT takes place below the Tm and above the Tg of PTT. At temperature below Tm, crystallization of PTT is driven by thermodynamics and at temperature below Tg crystallization ceases due to lack of segmental mobility of PTT chains. The Tm of PTT can be determined by examining the variation in density during cooling or/and heating of PTT at a
Poly(trimethylene terephthalate) – The New Generation of Engineering Thermoplastic Polyester 25
fixed rate. S. –T. Lin et al.[27] studied this relation (variation of density of PTT upon heating or/and cooling) by using atomistic simulations, where the molecular dynamic simulation was used to determine the properties of PTT down to the molecular level. The variation of density with respect to temperature as observed by S. –T. Lin et al. is shown in Fig. 4[27]. The reported Tm of PTT (with an entanglement Mw between 4900-5000 g mol-1) is around 227–277 oC and Tg is around 102 oC. Experimentally observed values for Tm is in the range of 226-230 oC, and Tg is between 45-65 oC. The marked difference in estimated Tm and Tg by using atomistic simulations and DSC, respectively, can be attributed to the extremely fast cooling rate (1012 oC s-1) for the former analysis and much slower rate for the later.
Physical Property
PET PTT PBT Nylon 6,6 PC Nylon 6
Chemical structure
Specific Gravity (measured as per ASTM D792 specifications)
1.40 1.35 1.34 1.14 1.20 1.14
Tm (OC) (Using DSC for injection molded samples at a heating rate of 10 OC min-1*)
265 227 228 265 -- 230
Tg* (oC) 80 45-60 25 50-90 150 50 Onset of decomposition temperature by using TGA (oC)
350 373 378 375 -- 398
*indicates that the same experimental conditions were used in both the studies
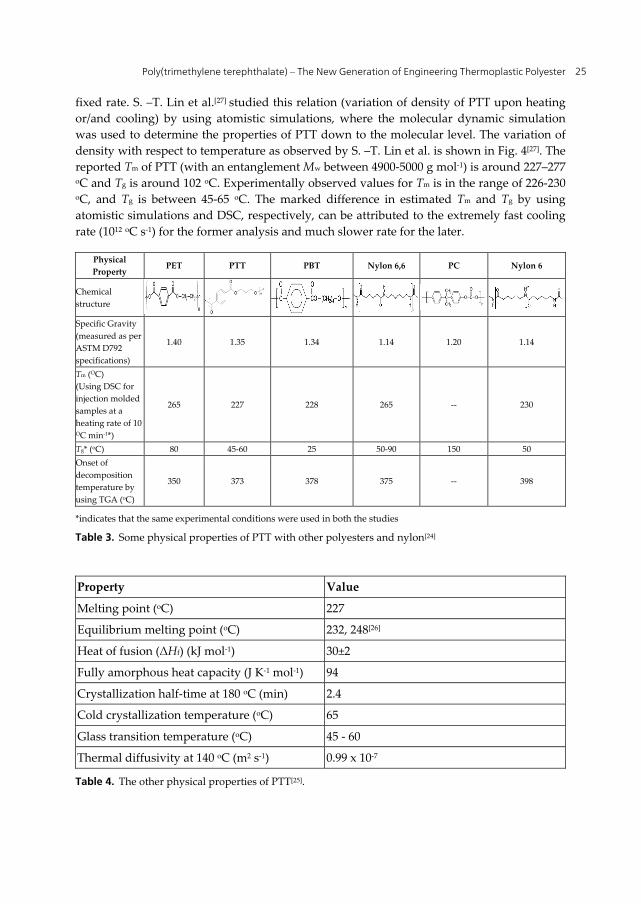
Table 3. Some physical properties of PTT with other polyesters and nylon[24]
Property Value
Melting point (oC) 227
Equilibrium melting point (oC) 232, 248[26]
Heat of fusion (ΔHf) (kJ mol-1) 30±2
Fully amorphous heat capacity (J K-1 mol-1) 94
Crystallization half-time at 180 oC (min) 2.4
Cold crystallization temperature (oC) 65
Glass transition temperature (oC) 45 - 60
Thermal diffusivity at 140 oC (m2 s-1) 0.99 x 10⁻⁷
Table 4. The other physical properties of PTT[25].
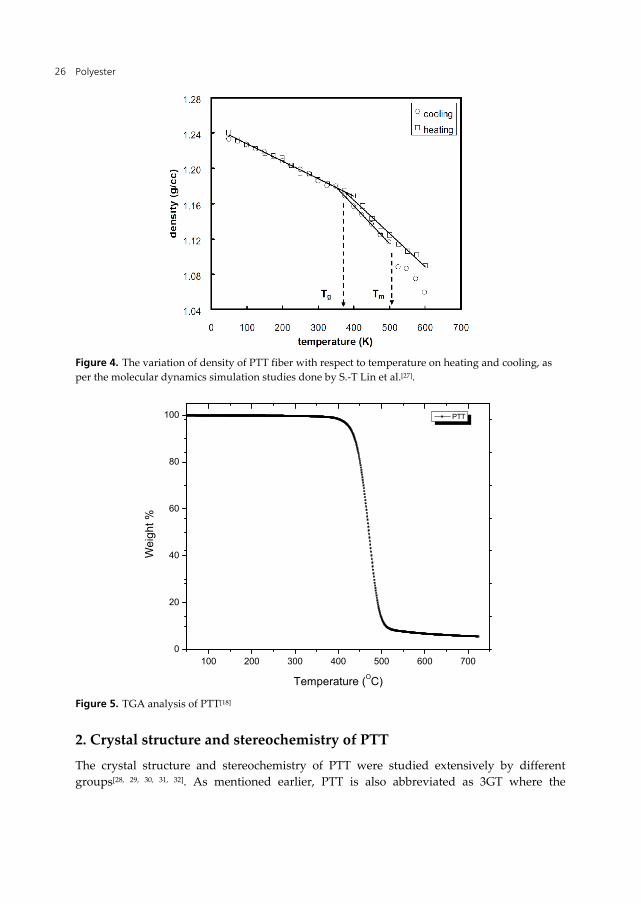
Polyester 26
Figure 4. The variation of density of PTT fiber with respect to temperature on heating and cooling, as per the molecular dynamics simulation studies done by S.-T Lin et al.[27].
100 200 300 400 500 600 7000
20
40
60
80
100 PTT
Temperature (OC)
Wei
ght %
Figure 5. TGA analysis of PTT[18]
2. Crystal structure and stereochemistry of PTT
The crystal structure and stereochemistry of PTT were studied extensively by different groups[28, 29, 30, 31, 32]. As mentioned earlier, PTT is also abbreviated as 3GT where the
Poly(trimethylene terephthalate) – The New Generation of Engineering Thermoplastic Polyester 27
crystalline PTT has gauche and trans conformations. The chain conformation of the PTT fiber changes reversibly between two forms when the fiber is strained. This can be followed by using the techniques of X-ray diffraction. In the unstrained form the methylene section of the PTT chain has the conformation of gauche-trans-gauche; upon straining this conformation changes to trans-trans-trans (Hall and Pass, 1976)[28].
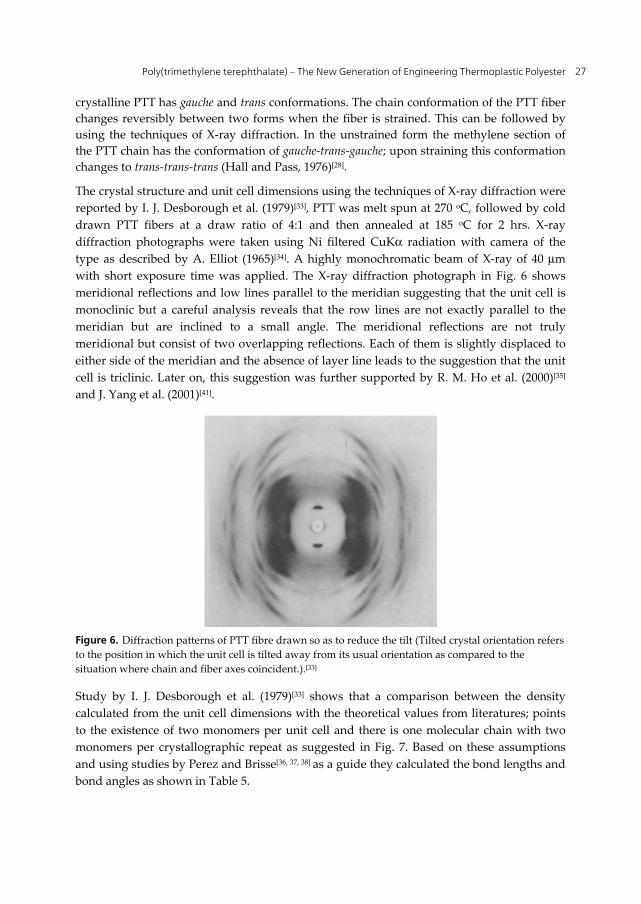
The crystal structure and unit cell dimensions using the techniques of X-ray diffraction were reported by I. J. Desborough et al. (1979)[33], PTT was melt spun at 270 oC, followed by cold drawn PTT fibers at a draw ratio of 4:1 and then annealed at 185 oC for 2 hrs. X-ray diffraction photographs were taken using Ni filtered CuKα radiation with camera of the type as described by A. Elliot (1965)[34]. A highly monochromatic beam of X-ray of 40 μm with short exposure time was applied. The X-ray diffraction photograph in Fig. 6 shows meridional reflections and low lines parallel to the meridian suggesting that the unit cell is monoclinic but a careful analysis reveals that the row lines are not exactly parallel to the meridian but are inclined to a small angle. The meridional reflections are not truly meridional but consist of two overlapping reflections. Each of them is slightly displaced to either side of the meridian and the absence of layer line leads to the suggestion that the unit cell is triclinic. Later on, this suggestion was further supported by R. M. Ho et al. (2000)[35] and J. Yang et al. (2001)[41].
Figure 6. Diffraction patterns of PTT fibre drawn so as to reduce the tilt (Tilted crystal orientation refers to the position in which the unit cell is tilted away from its usual orientation as compared to the situation where chain and fiber axes coincident.).[33]
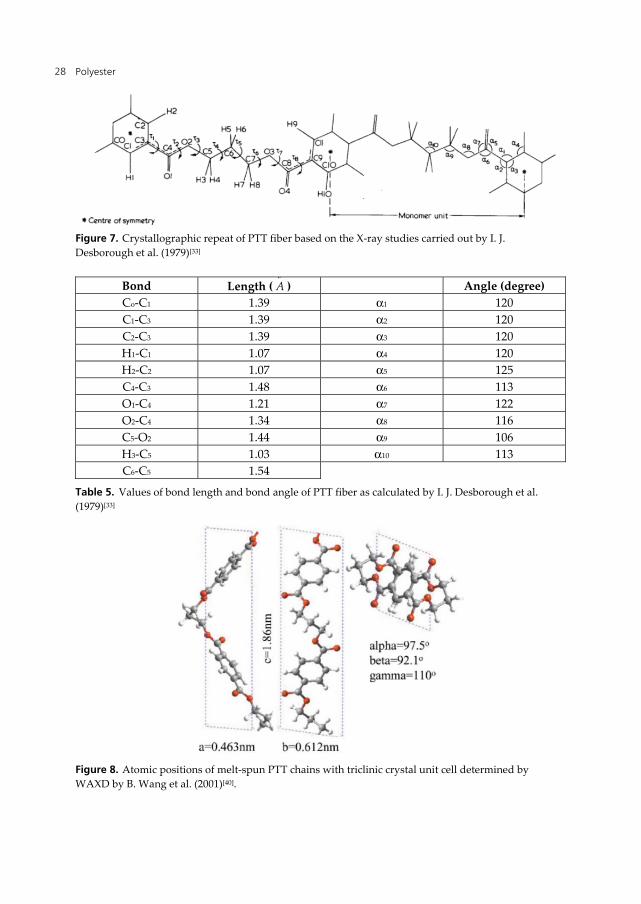
Study by I. J. Desborough et al. (1979)[33] shows that a comparison between the density calculated from the unit cell dimensions with the theoretical values from literatures; points to the existence of two monomers per unit cell and there is one molecular chain with two monomers per crystallographic repeat as suggested in Fig. 7. Based on these assumptions and using studies by Perez and Brisse[36, 37, 38] as a guide they calculated the bond lengths and bond angles as shown in Table 5.
Polyester 28
Figure 7. Crystallographic repeat of PTT fiber based on the X-ray studies carried out by I. J. Desborough et al. (1979)[33]
Bond Length (oA ) Angle (degree)
Co-C1 1.39 α1 120 C1-C3 1.39 α2 120 C2-C3 1.39 α3 120 H1-C1 1.07 α4 120 H2-C2 1.07 α5 125 C4-C3 1.48 α6 113 O1-C4 1.21 α7 122 O2-C4 1.34 α8 116 C5-O2 1.44 α9 106 H3-C5 1.03 α10 113 C6-C5 1.54
Table 5. Values of bond length and bond angle of PTT fiber as calculated by I. J. Desborough et al. (1979)[33]
Figure 8. Atomic positions of melt-spun PTT chains with triclinic crystal unit cell determined by WAXD by B. Wang et al. (2001)[40].
Poly(trimethylene terephthalate) – The New Generation of Engineering Thermoplastic Polyester 29
The length ratio between c-axis of the unit cell and the extended chain length of PTT is found to be about 75% indicating a big zigzag conformation along the c-axis, which has been suggested as the high deformability in crystals when drawn, and this explains why slight deviation in unit cell dimensions are usually observed by different groups. This also accounts for the enhanced tendency of PTT to form fibers when compared to other polyesters, which is evidenced by the exceptional use of PTT as fibers for different applications like sports wear. All these studies by different groups lead us to the conclusion that the unit cell of PTT is triclinic with two monomer units per unit cell, and the unit cell of the PTT crystal varies slightly based on the preparative conditions of PTT. We summarize the preparative conditions of PTT and the corresponding lattice constants of the triclinic unit cell in Table 6.
Preparative conditions
Lattice constants Characterization technique Reference
a (nm) b (nm) c (nm) α (o) β (o) Υ (o) melt spun at 270 oC, followed by cold drawn at a draw ratio of 4:1 and then annealed at 185 oC for 2 hrs
4.5 6.2 18.3 98 90 111 electron diffraction
I. J. Desborough et al. (1979)[33]
Melt polymerization 4.60 6.22 18.36 97.8 90.2 111.3
electron diffraction
I. H. Hall et al. (1984)[42].
Confined thin film melt polymerization (CTFMP) at temperatures between 150-220 oC
4.53 6.15 18.61 97 92 111
Electron diffraction CERIUS simulation program.
J. Yang et al. (2001)[41].
Bulk polymerization (180 oC and 72h)
4.57 6.41 18.65 98.57 91.45 112.2 WAXD J. Yang et al. (2001)[41].
Polycondensation reaction between terephthalic acid and propane diol
0.463 0.612 1.86 97.5 92.1 110 WAXD B. Wang et al. (2001)[40]
Table 6. The preparative conditions of PTT and the corresponding lattice constants of the triclinic unit cell.
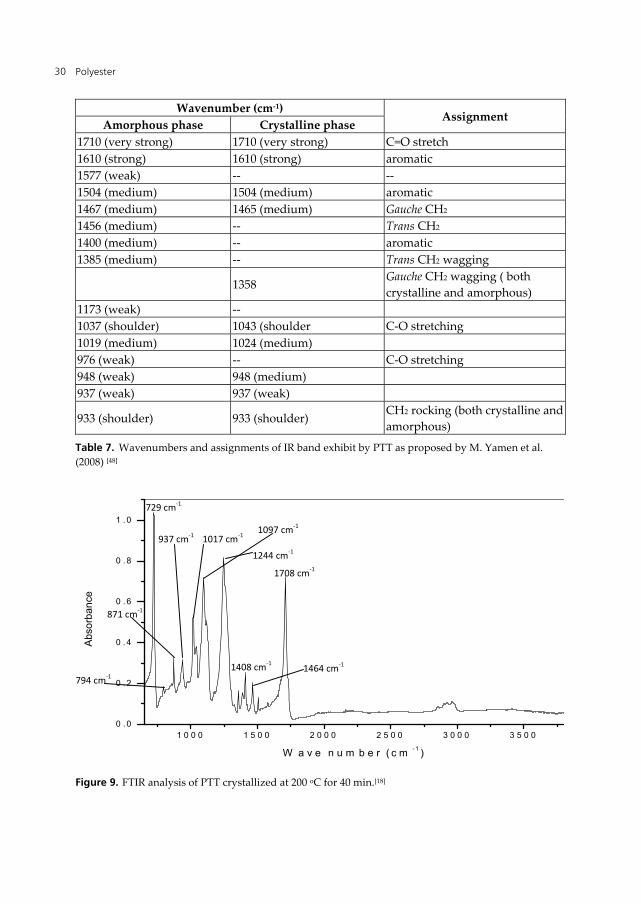
3. Infrared spectroscopic analysis of PTT
FTIR spectroscopy can be used as a tool to study the crystalline and amorphous fractions[44,
45, 46, 47, 48] of PTT. The absorption bands of IR between 1750–800 cm-1 is helpful to estimate the fraction of the crystalline phase of PTT samples. The assignment of the absorption bands in this region for PTT was proposed by M. Yamen et al. (2008) (Ref. Table 7).[48]
Polyester 30
Wavenumber (cm-1)Assignment
Amorphous phase Crystalline phase1710 (very strong) 1710 (very strong) C=O stretch 1610 (strong) 1610 (strong) aromatic 1577 (weak) -- -- 1504 (medium) 1504 (medium) aromatic 1467 (medium) 1465 (medium) Gauche CH2 1456 (medium) -- Trans CH2 1400 (medium) -- aromatic 1385 (medium) -- Trans CH2 wagging
1358 Gauche CH2 wagging ( both crystalline and amorphous)
1173 (weak) -- 1037 (shoulder) 1043 (shoulder C-O stretching 1019 (medium) 1024 (medium) 976 (weak) -- C-O stretching 948 (weak) 948 (medium) 937 (weak) 937 (weak)
933 (shoulder) 933 (shoulder) CH2 rocking (both crystalline and amorphous)
Table 7. Wavenumbers and assignments of IR band exhibit by PTT as proposed by M. Yamen et al. (2008) [48]
Figure 9. FTIR analysis of PTT crystallized at 200 oC for 40 min.[18]
Poly(trimethylene terephthalate) – The New Generation of Engineering Thermoplastic Polyester 31
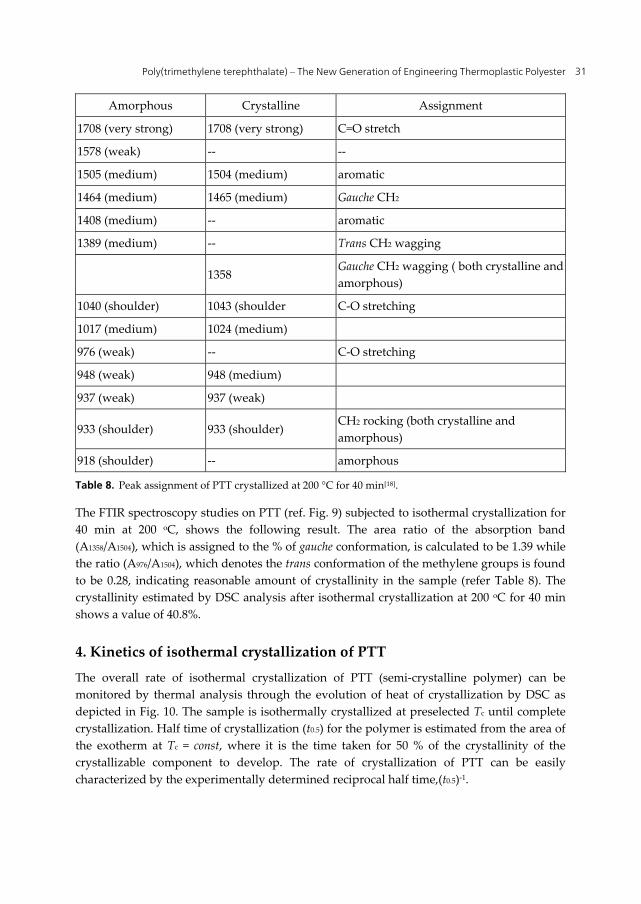
Amorphous Crystalline Assignment
1708 (very strong) 1708 (very strong) C=O stretch
1578 (weak) -- --
1505 (medium) 1504 (medium) aromatic
1464 (medium) 1465 (medium) Gauche CH2
1408 (medium) -- aromatic
1389 (medium) -- Trans CH2 wagging
1358 Gauche CH2 wagging ( both crystalline and amorphous)
1040 (shoulder) 1043 (shoulder C-O stretching
1017 (medium) 1024 (medium)
976 (weak) -- C-O stretching
948 (weak) 948 (medium)
937 (weak) 937 (weak)
933 (shoulder) 933 (shoulder) CH2 rocking (both crystalline and amorphous)
918 (shoulder) -- amorphous
Table 8. Peak assignment of PTT crystallized at 200 °C for 40 min[18].
The FTIR spectroscopy studies on PTT (ref. Fig. 9) subjected to isothermal crystallization for 40 min at 200 oC, shows the following result. The area ratio of the absorption band (A1358/A1504), which is assigned to the % of gauche conformation, is calculated to be 1.39 while the ratio (A976/A1504), which denotes the trans conformation of the methylene groups is found to be 0.28, indicating reasonable amount of crystallinity in the sample (refer Table 8). The crystallinity estimated by DSC analysis after isothermal crystallization at 200 oC for 40 min shows a value of 40.8%.
4. Kinetics of isothermal crystallization of PTT
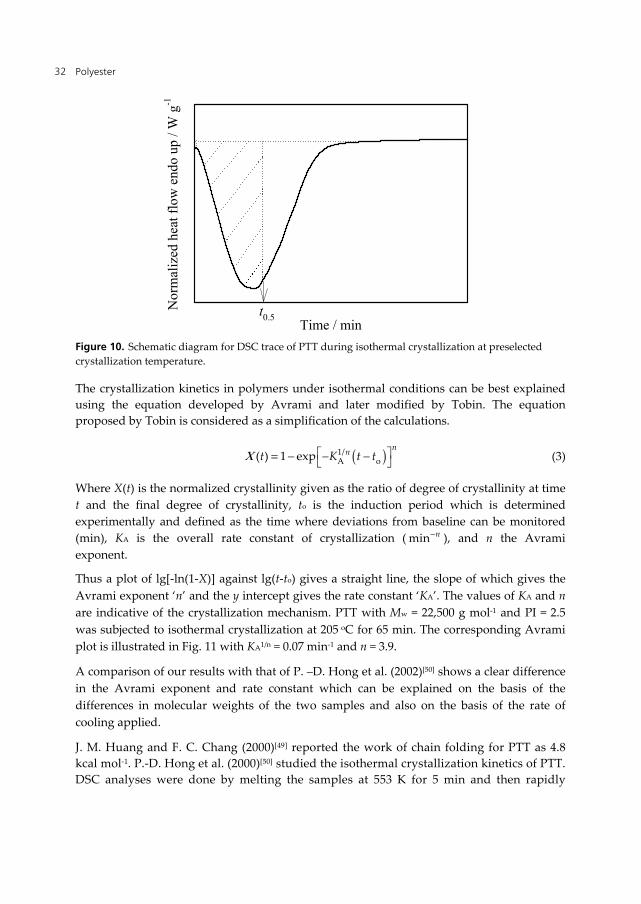
The overall rate of isothermal crystallization of PTT (semi-crystalline polymer) can be monitored by thermal analysis through the evolution of heat of crystallization by DSC as depicted in Fig. 10. The sample is isothermally crystallized at preselected Tc until complete crystallization. Half time of crystallization (t0.5) for the polymer is estimated from the area of the exotherm at Tc = const, where it is the time taken for 50 % of the crystallinity of the crystallizable component to develop. The rate of crystallization of PTT can be easily characterized by the experimentally determined reciprocal half time,(t0.5)-1.
Polyester 32
Time / min
Nor
mal
ized
hea
t flo
w e
ndo
up /
W g
-1
t0.5
Figure 10. Schematic diagram for DSC trace of PTT during isothermal crystallization at preselected crystallization temperature.
The crystallization kinetics in polymers under isothermal conditions can be best explained using the equation developed by Avrami and later modified by Tobin. The equation proposed by Tobin is considered as a simplification of the calculations.
( )1/A o( ) 1 exp
nnt K t tΧ = − − − (3)
Where X(t) is the normalized crystallinity given as the ratio of degree of crystallinity at time t and the final degree of crystallinity, to is the induction period which is determined experimentally and defined as the time where deviations from baseline can be monitored (min), KA is the overall rate constant of crystallization ( nmin− ), and n the Avrami exponent.
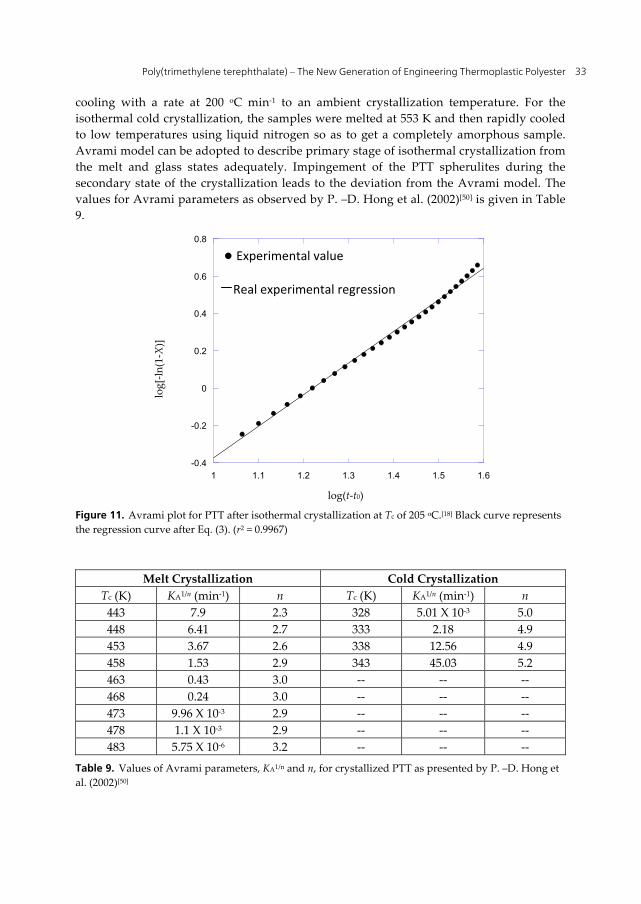
Thus a plot of lg[-ln(1-X)] against lg(t-to) gives a straight line, the slope of which gives the Avrami exponent ‘n’ and the y intercept gives the rate constant ‘KA’. The values of KA and n are indicative of the crystallization mechanism. PTT with Mw = 22,500 g mol-1 and PI = 2.5 was subjected to isothermal crystallization at 205 oC for 65 min. The corresponding Avrami plot is illustrated in Fig. 11 with KA1/n = 0.07 min-1 and n = 3.9.
A comparison of our results with that of P. –D. Hong et al. (2002)[50] shows a clear difference in the Avrami exponent and rate constant which can be explained on the basis of the differences in molecular weights of the two samples and also on the basis of the rate of cooling applied.
J. M. Huang and F. C. Chang (2000)[49] reported the work of chain folding for PTT as 4.8 kcal mol-1. P.-D. Hong et al. (2000)[50] studied the isothermal crystallization kinetics of PTT. DSC analyses were done by melting the samples at 553 K for 5 min and then rapidly
Poly(trimethylene terephthalate) – The New Generation of Engineering Thermoplastic Polyester 33
cooling with a rate at 200 oC min-1 to an ambient crystallization temperature. For the isothermal cold crystallization, the samples were melted at 553 K and then rapidly cooled to low temperatures using liquid nitrogen so as to get a completely amorphous sample. Avrami model can be adopted to describe primary stage of isothermal crystallization from the melt and glass states adequately. Impingement of the PTT spherulites during the secondary state of the crystallization leads to the deviation from the Avrami model. The values for Avrami parameters as observed by P. –D. Hong et al. (2002)[50] is given in Table 9.
Figure 11. Avrami plot for PTT after isothermal crystallization at Tc of 205 oC.[18] Black curve represents the regression curve after Eq. (3). (r2 = 0.9967)
Melt Crystallization Cold Crystallization
Tc (K) KA1/n (min-1) n Tc (K) KA1/n (min-1) n 443 7.9 2.3 328 5.01 X 10⁻³ 5.0 448 6.41 2.7 333 2.18 4.9 453 3.67 2.6 338 12.56 4.9 458 1.53 2.9 343 45.03 5.2 463 0.43 3.0 -- -- -- 468 0.24 3.0 -- -- -- 473 9.96 X 10⁻³ 2.9 -- -- -- 478 1.1 X 10⁻³ 2.9 -- -- -- 483 5.75 X 10⁻⁶ 3.2 -- -- --
Table 9. Values of Avrami parameters, KA1/n and n, for crystallized PTT as presented by P. –D. Hong et al. (2002)[50]
log(t-t0)
log[
-ln(1
-X)]
Polyester 34
The Avrami exponent values vary between 2 to 3 corresponding to different Tcs indicating a mixed nucleation and growth mechanism, while the Avrami exponent values of 5 corresponds to a solid sheaf like growth and athermal nucleation for cold crystallization. They reported that the regime I-II and regime II-III transition occurs at temperatures of 488 and 468 K, respectively. The crystallite morphologies of PTT from the melt and cold crystallizations exhibit typical negative spherulite and sheaf-like crystallite, respectively. The regime I-II-III transition is accompanied by morphological change from axialite-like or elliptical-shaped crystallite to banded spherulite and then non-banded spherulite. This is interesting to compare the Avrami exponents and the rate constants after Avrami model for isothermal crystallization kinetics of PET, PBT and PTT[51] (ref Table 10). At Tc = const, the rate constant (KA1/n) of PBT > PTT > PET.
PET (Mw = 84,500 g mol-1) PTT (Mw = 78,100 g mol-1) PBT (Mw = 71,500 g mol-1)
Tc (°C)
I0.5 (min)
KA1/n (min-1)
n KA1/n
(min-1)r2
I0.5
(min)KA1/n
(min-1)n
KA1/n
(min-1)r2
t0.5
(min)KA1/n
(min-1)n
KA1/n (min-1)
r2
184 1.31 0.630 1.87 0.628 0.9999 0.58 1.44 2.03 1.46 0.9994 0.30 2.83 2.11 2.86 0.9996
186 1.39 0.597 2.00 0.603 0.9995 0.64 1.26 1.75 1.27 0.9998 0.38 2.21 2.15 2.24 0.9996
188 1.45 0.557 1.73 0.562 0.9993 0.72 1.15 1.98 1.16 0.9998 0.40 2.13 2.24 2.14 0.9997
190 1.45 0.582 2.17 0.590 0.9999 0.90 0.934 2.12 0.940 0.9999 0.53 1.58 2.05 1.60 0.9996
192 1.49 0.538 1.67 0.544 0.9988 1.05 0.791 1.96 0.792 0.9999 0.53 1.55 1.80 1.57 0.9994
194 1.56 0.518 1.74 0.522 0.9994 1.35 0.621 2.03 0.626 0.9998 0.78 1.07 2.01 1.08 0.9995
196 1.72 0.478 1.87 0.487 0.9990 1.57 0.544 2.29 0.549 0.9998 0.88 0.911 1.65 0.920 0.9993
198 1.98 0.410 1.74 0.414 0.9988 2.16 0.386 2.00 0.387 0.9999 1.27 0.631 1.63 0.636 0.9993
200 2.26 0.352 1.59 0.355 0.9990 2.97 0.289 2.40 0.294 0.9992 1.53 0.542 1.95 0.547 0.9995
202 2.57 0.326 2.05 0.330 0.9997 3.69 0.228 2.12 0.228 0.9996 2.66 0.308 1.82 0.312 0.9992
204 2.84 0.288 1.83 0.302 0.9967 4.95 0.172 2.27 0.172 0.9996 3.65 0.219 1.63 0.219 0.9970
205 2.97 0.275 1.82 0.276 0.9997 5.93 0.145 2.39 0.147 0.9993
206 2.98 0.276 1.86 0.282 0.9972 6.61 0.129 2.24 0.129 0.9998 4.76 0.169 1.66 0.170 0.9912
207 3.29 0.249 1.84 0.249 0.9998
208 3.99 0.207 1.91 0.210 0.9980 7.60 0.113 2.39 0.114 0.9989 7.46 0.110 1.85 0.113 0.9971
215 4.71 0.176 1.97 0.173 0.9991
220 10.2 0.082 2.05 0.082 0.9992
Table 10. The Avrami exponents and the rate constants after Avrami model for isothermal crystallization kinetics of PET, PBT and PTT[51].
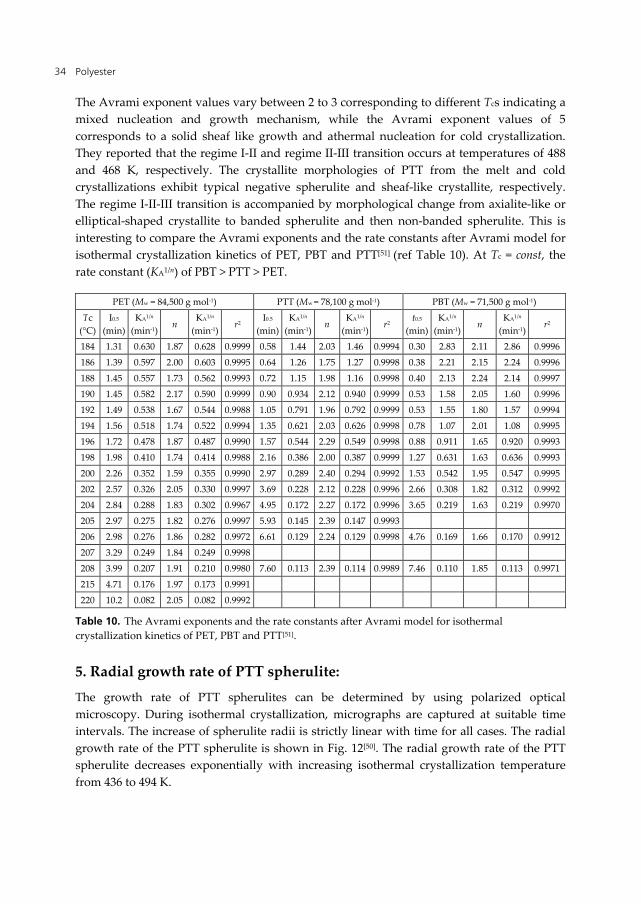
5. Radial growth rate of PTT spherulite:
The growth rate of PTT spherulites can be determined by using polarized optical microscopy. During isothermal crystallization, micrographs are captured at suitable time intervals. The increase of spherulite radii is strictly linear with time for all cases. The radial growth rate of the PTT spherulite is shown in Fig. 12[50]. The radial growth rate of the PTT spherulite decreases exponentially with increasing isothermal crystallization temperature from 436 to 494 K.
Poly(trimethylene terephthalate) – The New Generation of Engineering Thermoplastic Polyester 35
Figure 12. Plot of radial growth rate of PTT spherulites as a function of Tc as discussed in P.-D. Hong et al. (2002)[50]
6. Melting temperature and equilibrium melting temperature of PTT
In contrast to low-molecular substances, melting and crystallization of polymers cannot be observed in equilibrium. This is because the crystallization is extremely low near and below the o
mT for the polymer due to the crystal nucleation is greatly inhibited at the proximity ofomT . The rate of crystallization for semi-crystalline polymer is nucleation rather than
diffusion controlled near to omT . Hence, crystallization of a polymer can only proceed in a
temperature below omT . Quantity o
mT of a polymer can be determined experimentally by step-wise annealing procedure after Hoffman-Weeks[52]. Under this procedure, crystallization and melting of polymers proceed under non-equilibrium conditions but near to equilibrium. The sample is isothermally crystallized in a range of crystallization temperatures (Tc). Half time of crystallization (t0.5) for the polymer is determined as described in previous section. Subsequently, the sample is allowed to crystallize again at the same range of Tc’s for equivalent period of time until complete crystallization and the corresponding Tms are obtained from the peak of the endotherms from the DSC traces. The Hoffman-Weeks theory[52] facilitates calculating the equilibrium melting temperature values for polymers from the crystallization temperature. The equation is written as
om c m
1 11T T Tγ γ
= + +
(4)
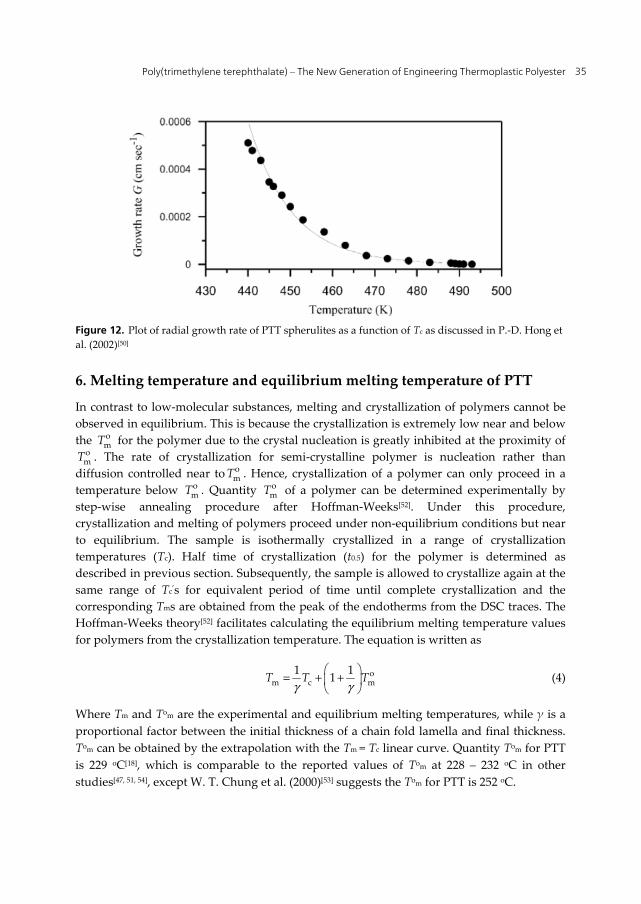
Where Tm and Tom are the experimental and equilibrium melting temperatures, while γ is a proportional factor between the initial thickness of a chain fold lamella and final thickness. Tom can be obtained by the extrapolation with the Tm = Tc linear curve. Quantity Tom for PTT is 229 oC[18], which is comparable to the reported values of Tom at 228 – 232 oC in other studies[47, 51, 54], except W. T. Chung et al. (2000)[53] suggests the Tom for PTT is 252 oC.
Polyester 36
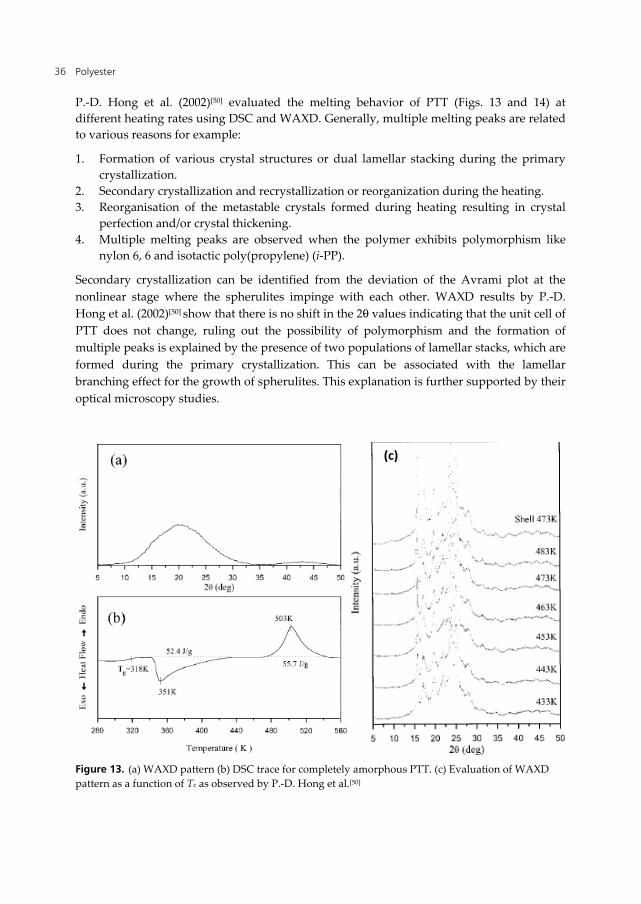
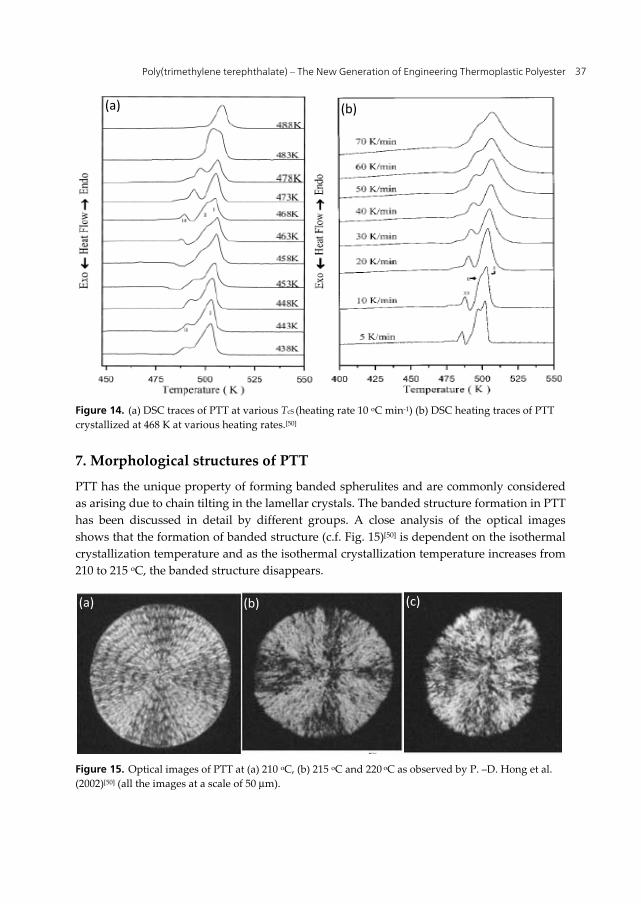
P.-D. Hong et al. (2002)[50] evaluated the melting behavior of PTT (Figs. 13 and 14) at different heating rates using DSC and WAXD. Generally, multiple melting peaks are related to various reasons for example:
1. Formation of various crystal structures or dual lamellar stacking during the primary crystallization.
2. Secondary crystallization and recrystallization or reorganization during the heating. 3. Reorganisation of the metastable crystals formed during heating resulting in crystal
perfection and/or crystal thickening. 4. Multiple melting peaks are observed when the polymer exhibits polymorphism like
nylon 6, 6 and isotactic poly(propylene) (i-PP).
Secondary crystallization can be identified from the deviation of the Avrami plot at the nonlinear stage where the spherulites impinge with each other. WAXD results by P.-D. Hong et al. (2002)[50] show that there is no shift in the 2θ values indicating that the unit cell of PTT does not change, ruling out the possibility of polymorphism and the formation of multiple peaks is explained by the presence of two populations of lamellar stacks, which are formed during the primary crystallization. This can be associated with the lamellar branching effect for the growth of spherulites. This explanation is further supported by their optical microscopy studies.
Figure 13. (a) WAXD pattern (b) DSC trace for completely amorphous PTT. (c) Evaluation of WAXD pattern as a function of Tc as observed by P.-D. Hong et al.[50]
Poly(trimethylene terephthalate) – The New Generation of Engineering Thermoplastic Polyester 37
Figure 14. (a) DSC traces of PTT at various TcS (heating rate 10 oC min-1) (b) DSC heating traces of PTT crystallized at 468 K at various heating rates.[50]
7. Morphological structures of PTT
PTT has the unique property of forming banded spherulites and are commonly considered as arising due to chain tilting in the lamellar crystals. The banded structure formation in PTT has been discussed in detail by different groups. A close analysis of the optical images shows that the formation of banded structure (c.f. Fig. 15)[50] is dependent on the isothermal crystallization temperature and as the isothermal crystallization temperature increases from 210 to 215 oC, the banded structure disappears.
Figure 15. Optical images of PTT at (a) 210 oC, (b) 215 oC and 220 oC as observed by P. –D. Hong et al. (2002)[50] (all the images at a scale of 50 μm).
Polyester 38
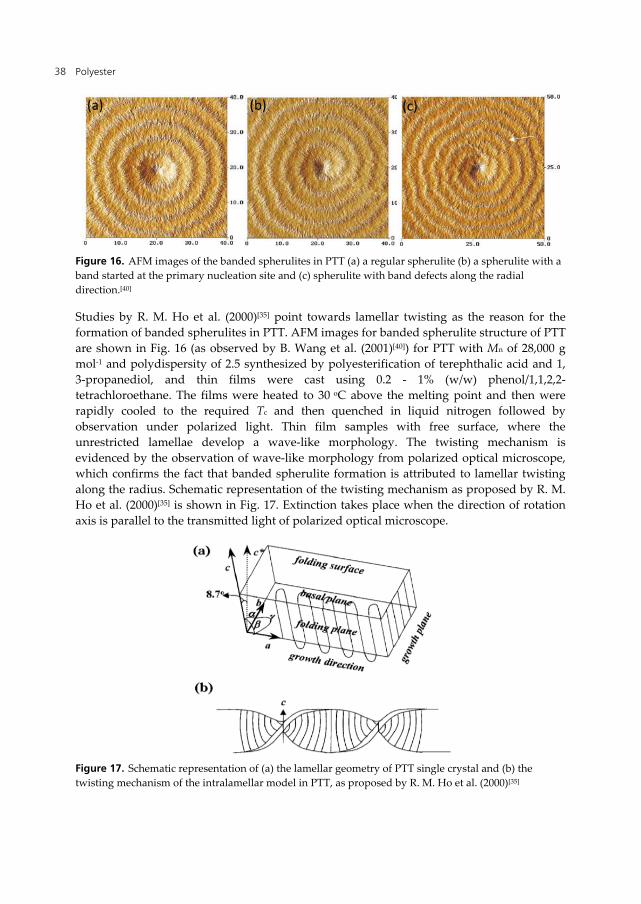
Figure 16. AFM images of the banded spherulites in PTT (a) a regular spherulite (b) a spherulite with a band started at the primary nucleation site and (c) spherulite with band defects along the radial direction.[40]
Studies by R. M. Ho et al. (2000)[35] point towards lamellar twisting as the reason for the formation of banded spherulites in PTT. AFM images for banded spherulite structure of PTT are shown in Fig. 16 (as observed by B. Wang et al. (2001)[40]) for PTT with Mn of 28,000 g mol-1 and polydispersity of 2.5 synthesized by polyesterification of terephthalic acid and 1, 3-propanediol, and thin films were cast using 0.2 - 1% (w/w) phenol/1,1,2,2-tetrachloroethane. The films were heated to 30 oC above the melting point and then were rapidly cooled to the required Tc and then quenched in liquid nitrogen followed by observation under polarized light. Thin film samples with free surface, where the unrestricted lamellae develop a wave-like morphology. The twisting mechanism is evidenced by the observation of wave-like morphology from polarized optical microscope, which confirms the fact that banded spherulite formation is attributed to lamellar twisting along the radius. Schematic representation of the twisting mechanism as proposed by R. M. Ho et al. (2000)[35] is shown in Fig. 17. Extinction takes place when the direction of rotation axis is parallel to the transmitted light of polarized optical microscope.
Figure 17. Schematic representation of (a) the lamellar geometry of PTT single crystal and (b) the twisting mechanism of the intralamellar model in PTT, as proposed by R. M. Ho et al. (2000)[35]
Poly(trimethylene terephthalate) – The New Generation of Engineering Thermoplastic Polyester 39
The shallow C-shaped and S-shaped textures observed in the crest regions as revealed by the TEM images confirm the works of A. Lustiger et al.[54] and R. M. Ho et al. (2000)[35] speculates that C-shapes and S- shapes are due to thickness limitation of thin film sections so as to form incomplete helical rotations. This helical conformation accounts for the lower modulus of PTT as compared to PET.
8. Mechanical properties
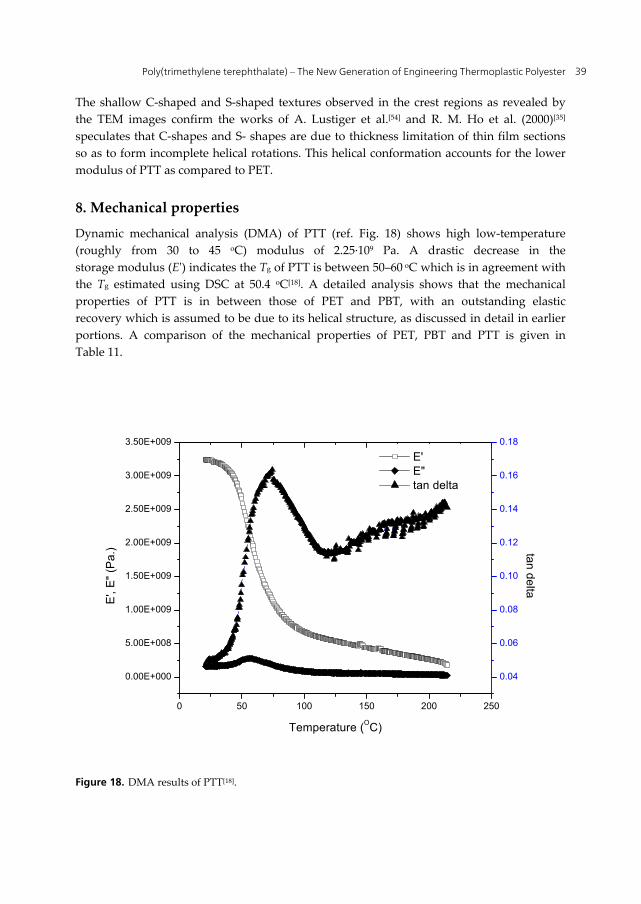
Dynamic mechanical analysis (DMA) of PTT (ref. Fig. 18) shows high low-temperature (roughly from 30 to 45 oC) modulus of 2.25·109 Pa. A drastic decrease in the storage modulus (E') indicates the Tg of PTT is between 50–60 oC which is in agreement with the Tg estimated using DSC at 50.4 oC[18]. A detailed analysis shows that the mechanical properties of PTT is in between those of PET and PBT, with an outstanding elastic recovery which is assumed to be due to its helical structure, as discussed in detail in earlier portions. A comparison of the mechanical properties of PET, PBT and PTT is given in Table 11.
0 50 100 150 200 250
0.00E+000
5.00E+008
1.00E+009
1.50E+009
2.00E+009
2.50E+009
3.00E+009
3.50E+009
E' E" tan delta
Temperature (OC)
E',
E"
(Pa
.)
0.04
0.06
0.08
0.10
0.12
0.14
0.16
0.18
tan
de
lta
Figure 18. DMA results of PTT[18].
Polyester 40
Polymer Flexural modulus
(GPa)
Tensile strength (MPa)
Elongation at break (%)
Notched impact
strength (J/m-1)Ref
Melt-spun PTT -- 7 57
Hot-press PTT 2.76 59.3 -- 48 25
PET 3.11 61.7 -- 37 25 PBT 2.34 56.5 -- 53 25
Table 11. Mechanical properties of PET, PTT, PBT
9. PTT-based blends
PTT suffers low heat distortion temperature 59 oC (at 1.8 MPa)[26], low melt viscosity of 200 Pa·s (at 260 oC at a shear rate of 200 s-1)[26] , poor optical properties, and pronounced britilleness at low temperatures. Enhancement of properties for PTT can be achieved by changing the maromolecular architecture and/or be extended by blending with existing polymers. Polymer blends allow combining the useful properties of different parent polymers to be done through physical rather than chemical means. It is a quick and economical alternative as well as a popular industrial practice as compared to direct synthesis in producing specialized polymer systems.
Table 12 summarizes selected PTT/elastomer, and PTT/thermoplastic blends followed by the reason(s) for the blending. The purpose for the blending in these cases points toward two directions: i) toughening the matrix of second component with dispersed phase of PTT and ii) increase the strength of PTT matrix with dispersed phase of the second component.
Blends Reason(s) for blending Ref. PTT/elastomer blends
PTT/ABS ABS is associated with good processability, dimensional stability, and high impact strength at lower temperatures. 57
PTT/EPDM Improve the toughness of the thermoplastic 58 PTT/PEO Improve the thermal stability 59 PTT/thermoplastic bends
PTT/PC Improve the heat distortion temperature and modify the brittle nature of PTT. 60, 62
PTT/PEI Improve the optical properties and mechanical properties 61, 65 PTT/PBT Improve the miscibility of the blends 66 Table 12. PTT-based blends
M. L. Xue et al. (2007)[57] studied the PTT/ABS blend system in detail. Blends were prepared in a 35-mm twin screw extruder at the barrel temperature between 245–255 oC at a screw
Poly(trimethylene terephthalate) – The New Generation of Engineering Thermoplastic Polyester 41
speed of 144 rpm. Two separate Tgs in the DSC thermogram indicate that the blends are phase separated in the molten state. First glass transitions is observed at lower temperatures between 40–46 oC, which is attributed to the Tg of the PTT amorphous phase, while the second glass transitions at higher temperatures between 100-103 oC is attributed to the SAN phase. Increasing the ABS content causes an increase in Tg of the PTT phase, whereas the Tg of the ABS phase decreases with the addition of PTT indicating that PTT is partially miscible with ABS and miscibility can be improved with the addition of ABS content. Decrease in Tm of the PTT phase (226 oC to 224 oC) indicates that the solubility of ABS in PTT phase slightly increases with ascending ABS content. Epoxy resin and SBM (styrene-butadiene-maleic anhydride copolymer) were used as compatibilizer. As the epoxy content is increased from 1 to 3 wt% the cold crystallization temperature (Tcc) of PTT shifts to higher temperatures while for 5 wt% of epoxy content, a decrease in Tcc of the PTT is observed. PTT/ABS blends with 3 wt% of SBM shows a similar effect to that of 1 wt % epoxy system, indicating the compatibilization of SBM to PTT/ABS blends.
Studies[58] show that PTT/EPDM blends are immiscible, which is supported by an increase in the free volume and decrease in crystallinity of PTT with increasing EPDM content and the use of ethylene propylene monomer grafted maleic anhydride as compatibilizer is found to produce significant improvement in properties by modifying the interface of the blends.
M. L. Xue et al. (2003)[60] studied the PTT/PC blend systems, which form a partially miscible pair, has a negative effect on the mechanical properties. Thereby they used epoxy containing polymer as the compatibilizer of the blends. The possibility of cross-linking reactions strengthens the interface of the blends and results in the improvement of properties. Miscibility studies using DSC on PTT/PC blends with 2.7 wt% of epoxy shows that the Tg of the PTT rich phase increases from ̴ 50 to ̴ 60 oC with increasing PC content and further addition of epoxy to the blends causes the decrease in the Tg of the PTT rich phase. DMA shows that the addition of epoxy to the blends causes a significant increase in the Tg of the PTT rich phase from around 70 to 90 oC while the Tg of the PC rich phase decreases from around 130 to around 110 oC. Morphological studies using SEM and TEM show that the addition of epoxy modifies the interface dramatically.
J. M. Huang et al. (2002)[61] studied the miscibility and melting characteristics of PTT/PEI blend systems. DSC studies show that the miscible blends show single and compositional-dependent Tg over the entire composition range. The Young’s modulus decreases continuously from around 3,200 MPa for pure PEI to around 2,200 MPa for pure PTT. The addition of PEI affects the crystallinity of PTT (decreases from around 27 % for neat PTT to around 3 % for 25 wt% blend), but the mechanism of crystal growth is seen to be unaffected. The blends shows a synergistic behavior in modulus of elasticity (which is attributed to a decrease in specific volume upon blending). Additionally synergism is observed in the yield stress of PEI rich blends, and ductile nature.
P. Krutphun et al. (2008)[66] studied the miscibility, crystallization and optical properties of PTT/PBT blends. The presence of a single and compositional dependant Tg by using DSC
Polyester 42
indicates miscibility of the blends in the molten state. Fitting the experimental Tg results with Gorden-Taylor equation shows a fitting parameter of 1.37 indicating the miscibility. The crystallinity of PTT decreases with the addition of PBT and the banded spherulite structure of PTT becomes more open as the amount of PBT in the blends is increased.
10. PTT composites and nanocomposites
Table 13 summarizes selected PTT-based micro and nanocomposites and the reason(s) behind the preparation of the composites.
PTT composites Reason(s) for the preparation of composites Ref.
PTT composites
PTT/chopped glass fiber (CGF)
1. Improvement of the thermo-mechanical properties
2. Improvement in tensile strength, impact strength and flexural strength.
67
PTT/short glass fiber (SFG)
1. Improvement of the crystallinity of PTT 68
PTT nanocomposites
PTT/clay nanocomposites
Improvement of thermal and mechanical properties by addition of small amount of filler. 69
PTT/multi-wall carbon nanotube (MWCNT)
Improvement of mechanical properties 70
Table 13. PTT based composites and nanocomposites
Recently, A. K. Mohanty et al.[67] studied the properties of bio-based PTT/chopped glass fibre composites (CGF). Glass fibre modified with PP-g-MA was used for the study. PTT/CGF composites with varying amounts of CGF (0, 15, 30 and 40 wt%) were prepared by using twin screw extruder at temperature of 230-245 oC and at the screw speed of 100 rpm. The composite pellets obtained were subjected to injection moulding at the barrel temperature of 235 oC and mould temperature at 35 oC. With the addition of CGF, the tensile strength of the bio-based PTT increases from around 50 MPa to around 110 MPa (for composites with 40 wt% of CGF). The flexural strength also increases from around 80 MPa (PTT) to around 150 MPa (PTT/40 wt% CGF). Composites with 40 wt% CGF shows very high HDT (heat distortion temperature) at around 220 oC. The impact strength shows an increase from 30 J m-1 for PTT to around 90 J m-1 for the PTT/CGF. Morphological
Poly(trimethylene terephthalate) – The New Generation of Engineering Thermoplastic Polyester 43
analysis of the tensile fractured samples indicates good dispersion of the CGF in the matrix of PTT. Thus, all these results lead to the conclusion that the PP-g-MA acts as a coupling agent improving the interfacial adhesion between the CGF and the PTT. The thermo-mechanical properties shown by the composites indicate that they can be promising materials for future automobiles and building products, and can be used as a replacement for the currently used glass-nylon composites materials.
Studies by M. Run et al. (2010)[68] on PTT/short glass fibers (SGF) composites show that the SGF acts as nucleating agents, which significantly accelerates the crystallization rate of PTT. The DSC results obtained for the increase in rate of crystallization were further confirmed by the WAXD experiments.
PTT based nanocomposites have been studied extensively by different groups. M. T. Run et al. (2007)[71] investigated the rheology, meling behavior, and crystallization of PTT/nano CaCO3 composites and shows that the presence of nano CaCO3 increases the crystallization rate of PTT. Further studies by M. Run et al. (2010)[68] adding short carbon fbres to PTT also lead to the same conclusions, where the rate of crystllization of PTT acceleates with addition of SGF.
Study by Z. J. Liu et al. (2003)[69] shows that nano-size clay layers act as nucleating agents to accelerate the crystallization of PTT, and an increase in Tg and modulus PTT/clay (98/02 parts by weight) nanocomposites were prepared by melt intercalation using a co-rotating twin screw extruder with a screw diameter of 35 mm and L/D of 48 at abarrel temperature of 230–235 oC and screw speed of 140 rpm. The clay used in the present study is an organic modified clay. The organo-modifier is methyl tallow bis(2-hydroxyethyl) ammonium, and DK2 (organo-clay) has the cation exchange capacity of 120 meq/100 g. Isothermal crystallization studies using the Avrami equation show that the Avrami exponent (n) increases from 2.52 to 2.58 as the Tc of the nanocomposite increases from 196 to 212 oC while the KA decreases from 3.63 to 0.01 min-1. XRD analysis of the organo-modified clay shows a strong diffraction peak at 2θ = 4.10o corresponding to the (001) plane. This shows exfoliation of the clay in the PTT matrix and the TEM images also confirms this. DMA studies show that the Tg shifts from ̴ 60 oC for neat PTT to ̴ 80 oC for the PTT/clay nanocomposites. Similarly a ten fold increase in E’ values is also observed which is explained on the basis of improvement in crystallization capacity of the PTT matrix.
After the discovery of carbon nanotube (CNT) by Ijima (1991)[72], extensive works have been devoted in extracting the optimum properties of the carbon nanotubes. C. S. Wu (2009)[70] studied PTT/MWCNT composites. The hydroxyl functionalized CNT behaves as anchoring sites for the PTT grafted with acrylic acid (c.f. Scheme 1). The functionalization of MWCNT improves the compatibility and dispersibility of the MWCNT in the matrix of PTT. The thermal and mechanical properties (c.f. Tables 14 and 15) show a dramatic increase leading to the conclusion that functionalized MWCNT can be used for preparing high performance PTT nanocomposites.
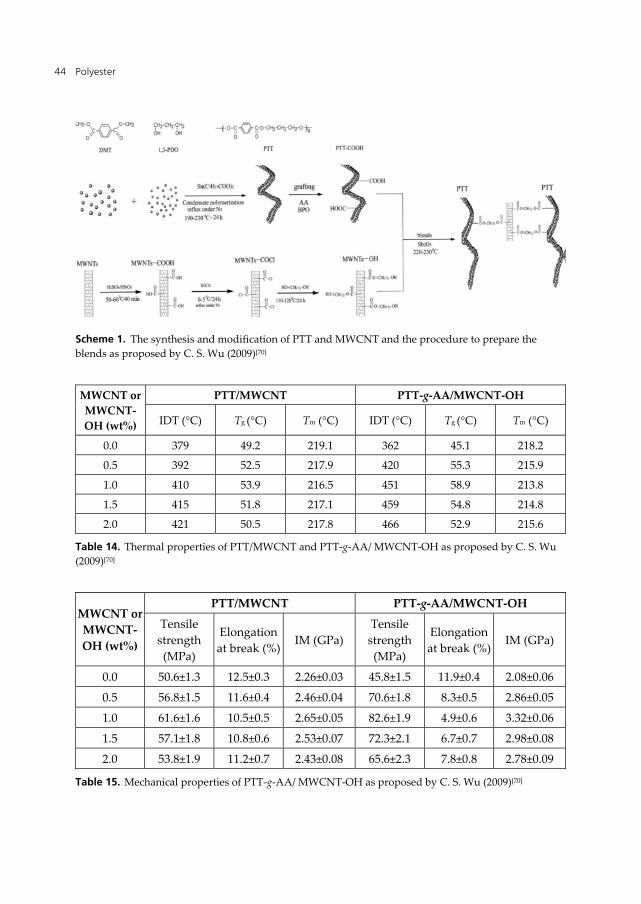
Polyester 44
Scheme 1. The synthesis and modification of PTT and MWCNT and the procedure to prepare the blends as proposed by C. S. Wu (2009)[70]
MWCNT or MWCNT-OH (wt%)
PTT/MWCNT PTT-g-AA/MWCNT-OH
IDT (°C) Tg (°C) Tm (°C) IDT (°C) Tg (°C) Tm (°C)
0.0 379 49.2 219.1 362 45.1 218.2
0.5 392 52.5 217.9 420 55.3 215.9
1.0 410 53.9 216.5 451 58.9 213.8
1.5 415 51.8 217.1 459 54.8 214.8
2.0 421 50.5 217.8 466 52.9 215.6
Table 14. Thermal properties of PTT/MWCNT and PTT-g-AA/ MWCNT-OH as proposed by C. S. Wu (2009)[70]
MWCNT or MWCNT-OH (wt%)
PTT/MWCNT PTT-g-AA/MWCNT-OH
Tensile strength (MPa)
Elongation at break (%)
IM (GPa) Tensile
strength (MPa)
Elongation at break (%)
IM (GPa)
0.0 50.6±1.3 12.5±0.3 2.26±0.03 45.8±1.5 11.9±0.4 2.08±0.06
0.5 56.8±1.5 11.6±0.4 2.46±0.04 70.6±1.8 8.3±0.5 2.86±0.05
1.0 61.6±1.6 10.5±0.5 2.65±0.05 82.6±1.9 4.9±0.6 3.32±0.06
1.5 57.1±1.8 10.8±0.6 2.53±0.07 72.3±2.1 6.7±0.7 2.98±0.08
2.0 53.8±1.9 11.2±0.7 2.43±0.08 65.6±2.3 7.8±0.8 2.78±0.09
Table 15. Mechanical properties of PTT-g-AA/ MWCNT-OH as proposed by C. S. Wu (2009)[70]
Poly(trimethylene terephthalate) – The New Generation of Engineering Thermoplastic Polyester 45
11. Conclusion
PTT has not attained much attention from the industrialists as well as from the academician before 2000 due to high production cost of PTT. The discovery of relatively cheap methods for the synthesis of propane diol by bioengineering route has reduced the production cost of PTT markedly and expedites the commercialization process. PTT crystal has triclinic unit cell, a big zigzag conformation along the c-axis which is suggested as the attributing factor of high deformability of PTT. This accounts for its high tendency to form fibers. The above discussion clearly points to the fact that PTT possesses comparable properties of polyesters and nylons. Properties of PTT can be regulated easily by adding a second component (e.g. another polymer and/or filler) into it. PTT is used in apparel, upholstery, specialty resins, and other applications in which properties such as softness, comfort stretch and recovery, dyeability, and easy care are desired. The properties of PTT surpass nylon and PET in fiber applications, PBT and PET in resin applications such as sealable closures, connectors, extrusion coatings, and blister packs, moreover the ability of PTT to be recycled without sacrificing the properties makes it a potential candidate for future engineering applications.
Author details
Chin Han Chan, Sarathchandran and Sabu Thomas Faculty of Applied Sciences, Universiti Teknologi MARA, Shah Alam, Malaysia
Sarathchandran and Sabu Thomas Centre for Nanoscience and Nanotechnology, Mahatma Gandhi University,Kottayam, Kerala, India
Acknowledgement
This work is supported by Dana Kecemerlangan (600-RMI/ST/DANA 5/3/Dst (387/2011)) from Universiti Teknologi MARA, Shah Alam, Malaysia.
12. References
[1] Polyester fiber market demand to drive global paraxylene growth: Source ICB. http://www.icis.com/Articles/2012/03/05/9537632/polyester-fiber-market-demand-to-drive-global-paraxylene.html (accessed 05 March 2012).
[2] Whinfield J R, Dickson J T. Improvements Relating to the Manufacture of Highly Polymeric Substances. British Patent 1941; 578: 079. http://www.technica.net/NF/NF1/eptt.html
Polyester 46
[3] Chuah H H. Encyclopedia vol.3, Poly(trimethylene terephthalate); 2001. DOI: 10.1002/0471440264.pst292. http://onlinelibrary.wiley.com/doi/10.1002/0471440264.pst292/abstract
[4] Doerr M L, Hammer J J, Dees J R. Poly(1,3-propylene terephthalate). US 5340909; 1994. http://www.google.com/patents/US5340909 ( accessed 23 August 1994)
[5] Kurian J V, Liang Y F. Preparation of Poly(trimethylene terephthalate). US 6281325; 2001. http://www.google.com/patents?id=gBMIAAAAEBAJ&pg=PA1&lpg=PA1&dq=US+6281325;+2001&source=bl&ots=68pM6C0wyc&sig=qIcwxaS-whBINiQ4IKzm9qfarrE&hl=en&sa=X&ei=CN1JUJmqF4PmrAfWzoCwDA&ved=0CDEQ6AEwAA#v=onepage&q=US%206281325%3B%202001&f=false ( accessed 28 August 2001).
[6] Fritz W, Eckhard S, Hans R, Ulrich T, Klaus M, Ross D K. Process of Producing Poly(trimethylene terephthalate) (PTT). EP 1046662; 2000. https://data.epo.org/publication-server/html-document?PN=EP1046662%20EP%201046662&iDocId=4939703 ( accessed 25 December 2000)
[7] Karayannidis G P, Roupakias C P, Bikiaris D N, Achilias D S. Study of Various Catalysts in the Synthesis of Poly(propylene terephthalate)and Mathematical Modeling of the Esterification Reaction. Polymer 2003; 44(4): 931-42.
[8] Fitz H, Kalle A G, Process for the Manufacture of a Linear Polyester using Stannous Oxalate as a Polycondensation Catalyst. US 3425994; 1969. http://www.prior-ip.com/patent/23318499/ (accessed 04 February 1969).
[9] Yong J S, YuRong R, Dan Z, Jing H, Yi Z, Wang G Y., Stannous oxalate: An Efficient Catalyst for Poly(trimethylene terephthalate) Synthesis, Sci China Ser B-Chem, 2008; 51 3257-262. http://www.springerlink.com/content/h36796h36k1u2h11/.
[10] Paul E E. Method for Esterifying Hindered Carboxylic Acid. EP 0331280; 1989. http://patent.ipexl.com/EP/EP0331280.html (accessed 06 September 1989).
[11] Corbiere P J, Mosse P. Compositions Derived from Polymers and Copolymers of Acrylonitrile. FR 1043435; 1953. http://worldwide.espacenet.com/publicationDetails/biblio?CC=FR&NR=1043435 (accessed 09 November 1953).
[12] Young J K, Kim J, Seong-Geun O, Solid-State Polymerization of Poly(trimethylene terephthalate):Reaction Kinetics and Prepolymer Molecular Weight Effects, Ind. Eng. Chem. Res. 2012; 51 2904−12.
[13] Lee H S. Vermaas W F. Rittmann B E. Biological Hydrogen Production: Prospects and Challenges. Trends Biotechnol. 2010 May;28(5):262-71
[14] Broun P J, Blake M S, Richard W P, Cleve E D, Pedro A J. Process for preparing 1,3-propanediol; US 5770776, 1998. http://www.patentbuddy.com/Patent/5770776 (accessed 23 June 1998).
[15] DuPont . http://npe.dupont.com/pr-renew-factsht.html (accessed 03 October 2011).
Poly(trimethylene terephthalate) – The New Generation of Engineering Thermoplastic Polyester 47
[16] Haas T, Jaeger B, Weber R, Mitchell S F, King C F. New Diol Processes: 1,3-Propanediol and 1,4-Butanediol. Appl Catal A-Gen 2005; 280(1) 83-88.
[17] Hong P D, Chung W T, Hu C F. Crystallization kinetics and morphology of poly (trimethylene terephthalate). Polymer 2002; 43 3335-43.
[18] Sarathchandran C, Thomas S, Chan C H. results yet to be published. [19] Pyda M, Boller A, Grebowicz J, Chuah H, Lebedev B V, Wunderlich B. J. Polym. Sci:
Part B: Polym. Phy 1986; 36 2499-2511. [20] Pyda M, Bartkowiak M, Wunderlich B, J. Heat Capacity of Poly (trimethylene
terephthalate). Thermal Anal.1998; 52 631. [21] Tarasov V V, Khimi F Z. Theory of the Heat Capacity of Chain and Layer Structures.
1950; 24 111. [22] Wunderlich B. Thermal Analysis. Academic Press; 1990. [23] Wunderlich B, ATHAS Data Bank WWW address: http://funnelweb.utcc.utk.edu/;athas.
Pure and Applied Chem.1995; 67 1919. [24] Hwo C, Forschner T, Lowtan R, Gwyn D, Barry C. Poly(trimethylene phthalates or
naphthalate) and Copolymers: New Opportunities in film and Packaging Applications: Presented at the Future –Pak 98 Conference, 10-12 November, 1998, Chicago.
[25] Brown H S, Casey P K, Donahue J M, Poly(trimethylene terephthalate) Polymers for Fibers. http://www.technica.net/NF/NF1/eptt.html
[26] Huang J M, Chang C F, Crystallization kinetics of poly(trimethylene terephthalate) J Polym Sci Part B: Polym Phys 2000;38(7):934–941.
[27] Lin T S, Atomistic Molecular Dynamics Simulations for the Morphology and Property Relationship of Poly (trimethylene terephthalate) fiber. PhD Thesis, National Taiwan University; 2007.
[28] Hall I H, Pass M G. Chain Conformation of Poly (Tetramethylene terephthalate) and its Change with Strain. Polymers 1976; 17: 807–816.
[29] Desborough I J, Hall I H. The Structure of Poly(trimethylene terephthalate). Polymer 1977; 18: 825.
[30] Mencik Z. The Crystal Structure of Poly(tetramethylene terephthalate). J Polym. Sci. Polym. Phys.Ed 1975; 13:2173–2181.
[31] Yokouchi M, Sakakibara Y, Chatani Y, Tdokoro H, Tanaka T, Yoda K. Structures of Two Crystalline forms Poly (butylene terephthalate) and Reversible Transition between them by Mechanical Deformation. Macromolecules 1976; 9:266.
[32] Hall I H, Pass M G, Rammo N N. The Structure and Properties of Oriented Fibres of Poly(pentamethylene terephthalate). 1. Synthesis of Polymer and Preparation of two Different Crystalline Phases J. Polym. Sci Polym. Phys. Edn 1978; 16: 1409.
[33] Desborough I J, Hall I H, Neisser J Z. The Structure of Poly (trimethylene terephthalate). Polymer 1979; 20 545.
[34] Elliott A.The Use of Toroidal Reflecting Surfaces in X-ray Diffraction Cameras. J. Sci. Instrum. 1965; 42 312.
Polyester 48
[35] Ho R M, Ke K Z, Chen M. Crystal Structure and Banded Spherulite of Poly(trimethylene terephthalate) Macromolecules2000; 33 7529-7537.
[36] Perez S, Brisse F. Structural Crystallography and Crystal Chemistry. Canadian Journal of Chemistry 1975; 53 3551.
[37] Perez S, Brisse F, Conformational Studies on Oligomethylene Glycol Derivatives and Related Compounds. 1. The Crystal and Molecular Structure of Ethylene Glycol Dibenzoate, (C16H14O4). Acta Cryst. 1976; B32: 470.
[38] Perez S, Brisse F. Trimethylene Glycol Dibezoate. Acta Cryst. 1977; B33, 3259-3262. [39] Poulin-D S, Perez S, Revol JF, Brisse F.The Crystal Structure of Poly(trimethylene
terephthalate) by X-ray and Electron Diffraction. Polymer 1979; 20: 419. [40] Wang B, Christopher Y L, Hanzlicek J, Stephen Z D C, Geil P H, Grebowicz J, Ho R M,
Poly (trimethylene terephthalate) Crystal Structure and Morphology in Different Length Scales. Polymer 2001; 41: 7171-7180.
[41] Yang Y, Sidoti G, Liu L, Geil P H, Li C Y, Cheng D Z S. Morphology and Crystal Structure of CTFMP and Bulk Polymerized Poly (trimethylene terephthalate). Polymer 2001; 42 7181-7195.
[42] Hall I H, Structure of Crystalline Polymers. London: Elsevier Applied Science 1984; 39-78.
[43] Pyda M, Boller M, Grebowicz A J, Chuah H, Lebedev B V, Wunderlich B. Heat Capacity of Poly(trimethylene terephthalate). J Polym Sci Part B: Polym Phys 1998; 36 2499.
[44] Chuah H H. Orientation and Structure Development in Poly(trimethylene terephthalate) Tensile Drawing. Macromolecules 2001; 34: 6985.
[45] Ouchi I, Hosoi M, Shimotsuma S. Infrared Spectra of Poly (ethylene 2, 6-naphthalate) and Some Related Polyesters. J Appl Polym Sci 1977; 21: 3445.
[46] Bulkin B J, Lewin M, Kim J. Crystallization Kinetics of Poly(propylene terephthalate) Studied by Rapid-Scanning Spectroscopy and FT-IR Spectroscopy. Macromolecules 1987; 20: 830.
[47] Ward I M, Wilding M A. Infra-Red and Raman Spectra of Poly(m-methylene terephthalate) Polymers. Polymer 1977; 18: 327.
[48] Yamen M, Ozkaya S, Vasanthan N. Structural and Conformational Changes during Thermally-Induced Crystallization of Poly (trimethylene terephthalate) by Infrared Spectroscopy. J Polym Sci Part B: Polym Phys 2008; 46 1497-1504.
[49] Huang J M, Chang F C. Crystallization Kinetics of Poly (trimethylene terephthalate). J Polym Sci Part B: Polym Phys 2000; 38 934
[50] Hong P D, Chung W T, Hsu C F, Crystallization Kinetics and Morphology of Poly(trimethylene terephthalate). Polymer 2002; 43 3335-3343.
[51] Dangseeyun N, Srimoaon P, Supaphol P, Nithitanakul M. Isothermal Melt-Crystallization and Melting Behavior of Three Linear Aromatic Polyesters. Thermochemica Acta 2004; 409: 63-77
[52] Hoffman J D, Weeks J. Melting Process and the Equilibrium Melting Temperature of Polychlorotrifluoroethylene J. Res. Natl. Bur. Stand. A 1962; 66: 13.
Poly(trimethylene terephthalate) – The New Generation of Engineering Thermoplastic Polyester 49
[53] Chung W T, Yeh W J, Hong P D. Melting behavior of Poly (trimethylene terephthalate). J. Appl. Polym. Sci. 2002; 83 2426-2433.
[54] Lustinger A, Lotz B, Duff T S. The Morphology of the Spherulitic Surface in Polyethylene. J. Polym. Sci. Polym. Phys. Ed. 1989; 27: 561.
[55] GrebowiczJ S, Brown H, Chuah H, Olvera J M, Wasiak A, Sajkiewicz P, Ziabicki A, Deformation of Undrawn Poly(trimethylene terephthalate) (PTT) Fibres. Polymer 2001; 42 7153-7160.
[56] Hall I H, Pass M G. Chain Conformation of Poly(trimethylene terephthalate) and its change with Strain. Polymer 1976;17: 807-816
[57] Xue M L, Yu Y L, Chuah H H, Rhee J M, Kim N H, Lee J H. Miscibility and Compatibilization of Poly(trimethylene terephthalate)/acrylonitrile- butadiene- styrene Blends. European Polymer Journal 2007; 43 3826-3837
[58] Ravikumar H B, Ranganathaiah C, Kumaraswamu G N, Thomas S, Positron Annihilation and Differential Scanning Calorimetric Study of Poly(trimethylene terephthalate) /EPDM blends. Polymer2005; 46 2372-2380.
[59] Szymczyk A , Structure and Properties of new Polyester Elastomer Composed of Poly(trimethylene terephthalate) and Poly(ethylene oxide). European Polymer Journal 2009; 45 2653-2664.
[60] Xue M L, Jing S, Chuah H H, Ya Z X. Miscibility, Morphology, and Thermal Properties of Poly(trimethylene terephthalate)/Polycarbonate Blends. J. Macromol. Sci. Part B: Physics 2004;43: 1045–1061
[61] Huang J M, Chang F C, Miscibility, Melting, and Crystallization of Poly(trimethylene terephthalate)/ Poly(ether imide) Blends. Journal of Applied Polymer Science 2002; 8 850-856.
[62] Aravind I, Grohens Y, Bourmaud A, Thomas S. Morphology, Dynamic Mechanical Thermal and Crystallization Behaviours of Poly (trimethylene terephthalate)/ Polycarbonate Blends. Industrial & Engineering Chemistry Research 2010; 49 3873, 2010.
[63] Aravind I, Jose S, Ahn K H, Thomas S. Rheology and Morphology of Poly (trimethylene terephthalate /ethylene propylene diene monomer Blends in the Presence and Absence of a Reactive Compatibilizer. Polymer Engineering and Science 2010; 50: 1945.
[64] Aravind I, Thomas S. Reactive Compatibilization of Polymer Blends. Society of Plastics Engineers: Plastics research Online 2010; DOI: 10.1002/spepro.003188.
[65] Ramiro J, Eguiaza´bal J L, Naza bal. Synergistic Mechanical Behavior and Improved Processability of Poly(ether imide) by Blending with Poly(trimethylene terephthalate). J. Polym. Adv. Technol. 2003; 14: 129–136.
[66] Krutphun P, Pitt S. Miscibility, Isothermal Crystallization/Melting Behavior, and Morphology of Ploy(trimethylene terephthalate)/Poly(butylenes terephthalate) Blends. Advances in Science and Technology 2008; 54 243-248.
[67] Mohanty A K, Liu W, Drazal L T, Misra M, Kurian J V, Miller R W. Biobased Poly(trimethylene terephthalate): Opportunity in Structural Composite Applications
Polyester 50
Sorona R&D, Bio-Based Materials, E. I. du Pont de Nemours and Company, Inc. Wilmington, Delaware, DE 19880, USA. http://speautomotive.com/SPEA_CD/SPEA2003/pdf/h05.pdf
[68] Run M, Hao Y, He Z. Studies on the isothermal crystallization kinetics and morphology of PTT/ SGF composites. Polymer Composites 2010; 31: 6 995-1002.
[69] Liu Z J, Chen K Q, Yan D Y. Crystallization, Morphology, and Dynamic Mechanical Properties of Poly(Trimethylene Terephthalate)/Clay Nanocomposites. European Polymer Journal 2003; 39: 2359–2366.
[70] Wu C S. Synthesis and Characterization of Poly (trimethylene terephthalate) Nanocomposites Incorporating Multi-Walled Carbon Nanotubes. Journal of Applied Polymer Science 2009; 114: 1633- 1642.
[71] Run M T, Yao CG, Wang Y J, Gao J G. Isothermal Crystallization Kinetics and Melting Behaviors of Nanocomposites of Poly(Trimethylene Terephthalate) Filled With Nano-CaCO3. Journal of Applied Polymer Science 2007; 106: 1557–1567.
[72] Iijima S. Helical Microtubules of Graphitic Carbon. Nature 1991; 56 354.


![Renewable resources-based PTT [poly(trimethylene ...iupac.org/publications/pac/pdf/2013/pdf/8503x0521.pdfRenewable resources-based PTT [poly(trimethylene terephthalate)] ... biobased](https://img.pdfslide.net/doc/110x75/5ad6edfa7f8b9af9068b9cb7/renewable-resources-based-ptt-polytrimethylene-iupacorgpublicationspacpdf2013pdf.jpg)