Embed Size (px)
Citation preview
Population Ecology and the Distribution
of Organisms Essential Knowledge Objectives
2.D.1 (a-c), 4.A.5 (c), 4.A.6 (e)
Ecology
• The scientific study of the interactions between organisms and the environment
• Ecological hierarchy from global ecology to organismal ecology
• Why is it important to study ecology?
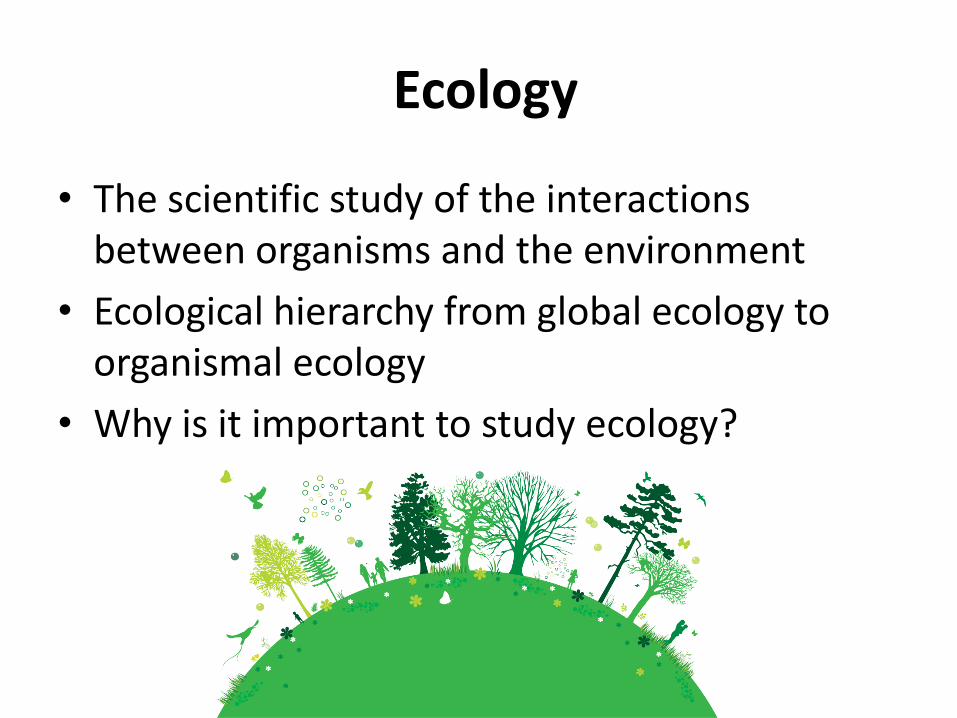
Ecological Hierarchy
• Organism
• Population
• Community
• Ecosystem
• Biome
• Biosphere
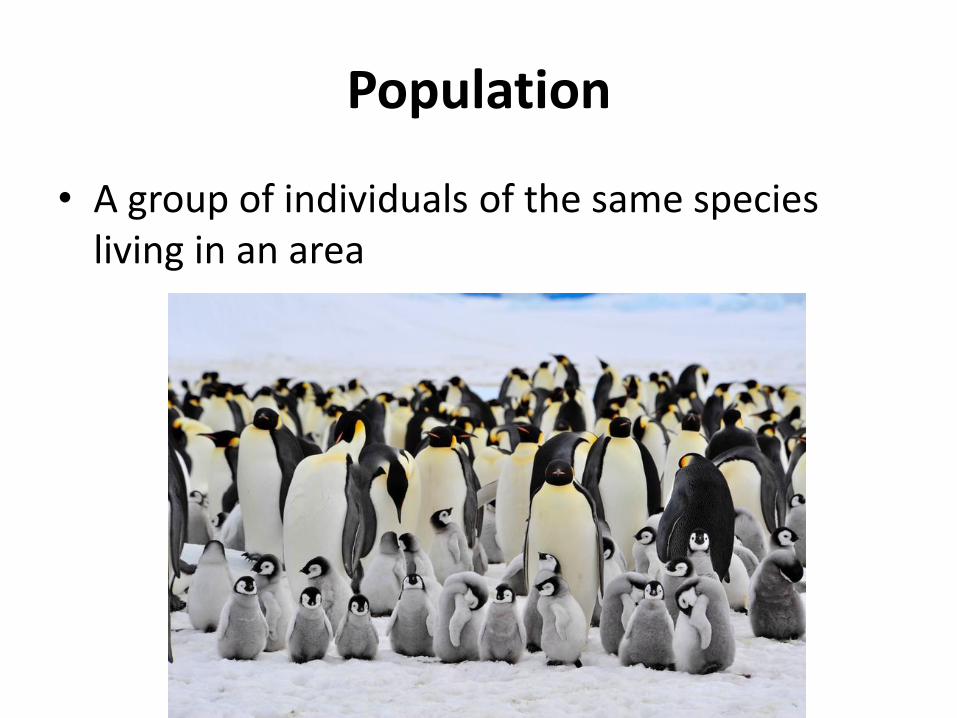
Population
• A group of individuals of the same species living in an area
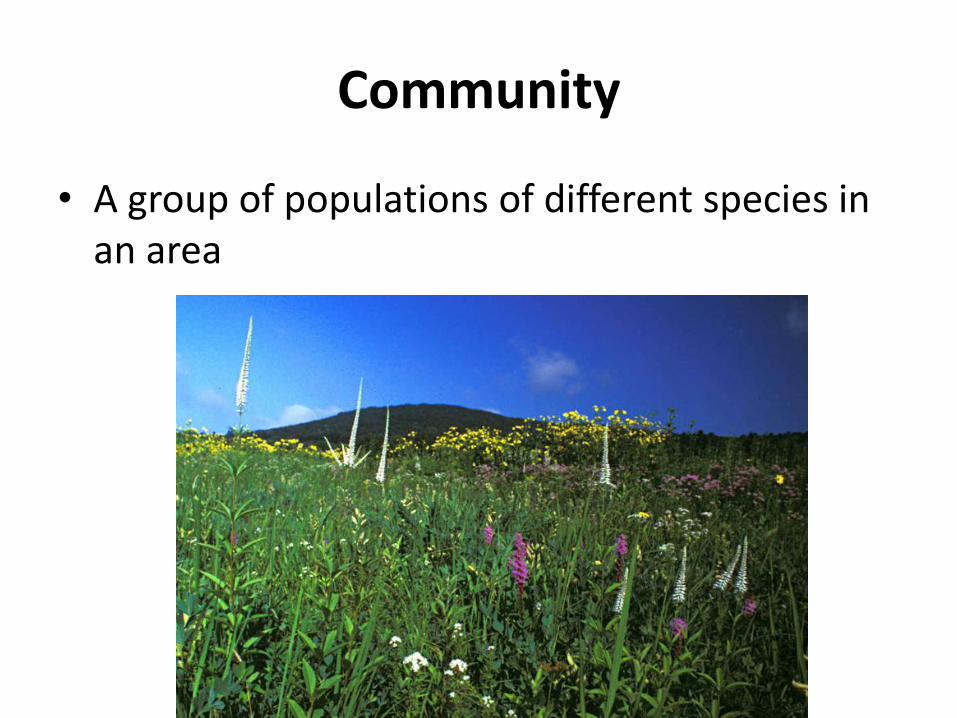
Community
• A group of populations of different species in an area
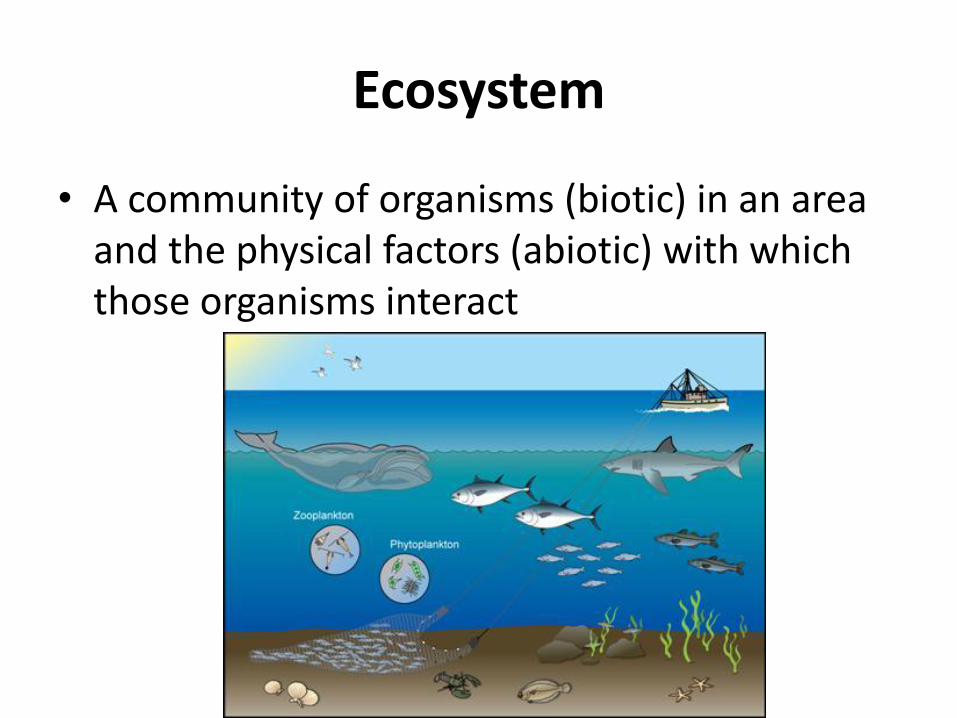
Ecosystem
• A community of organisms (biotic) in an area and the physical factors (abiotic) with which those organisms interact
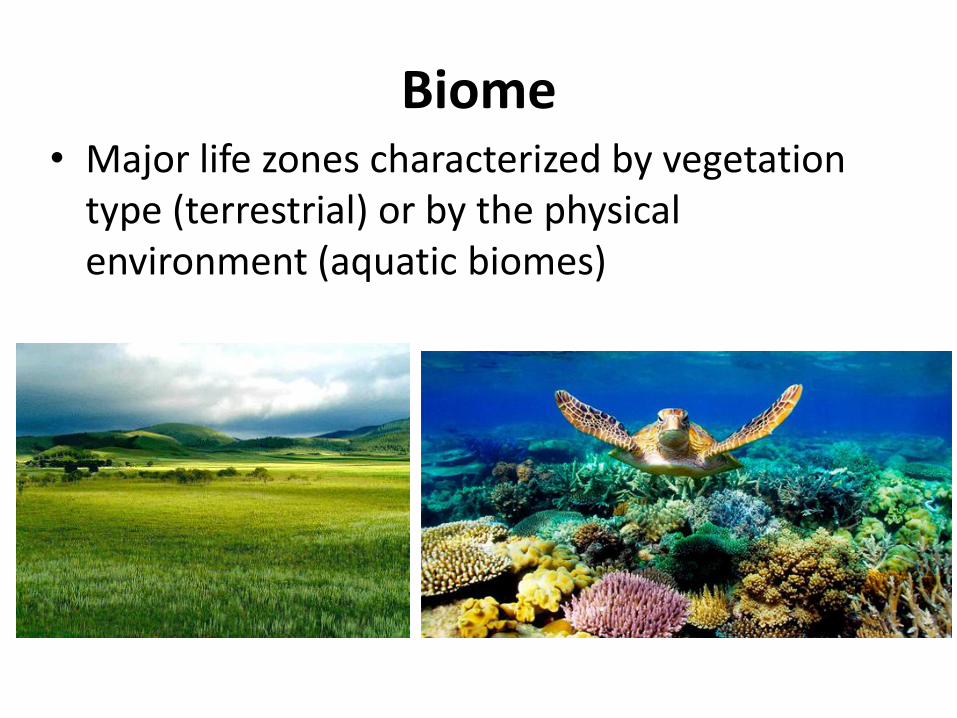
Biome • Major life zones characterized by vegetation
type (terrestrial) or by the physical environment (aquatic biomes)
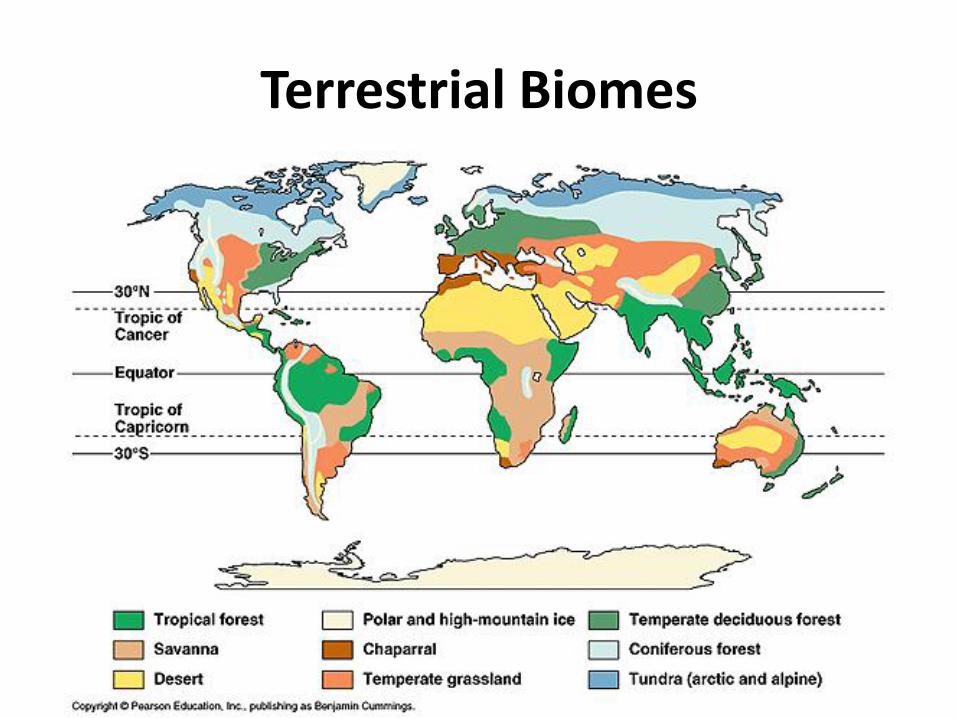
Terrestrial Biomes
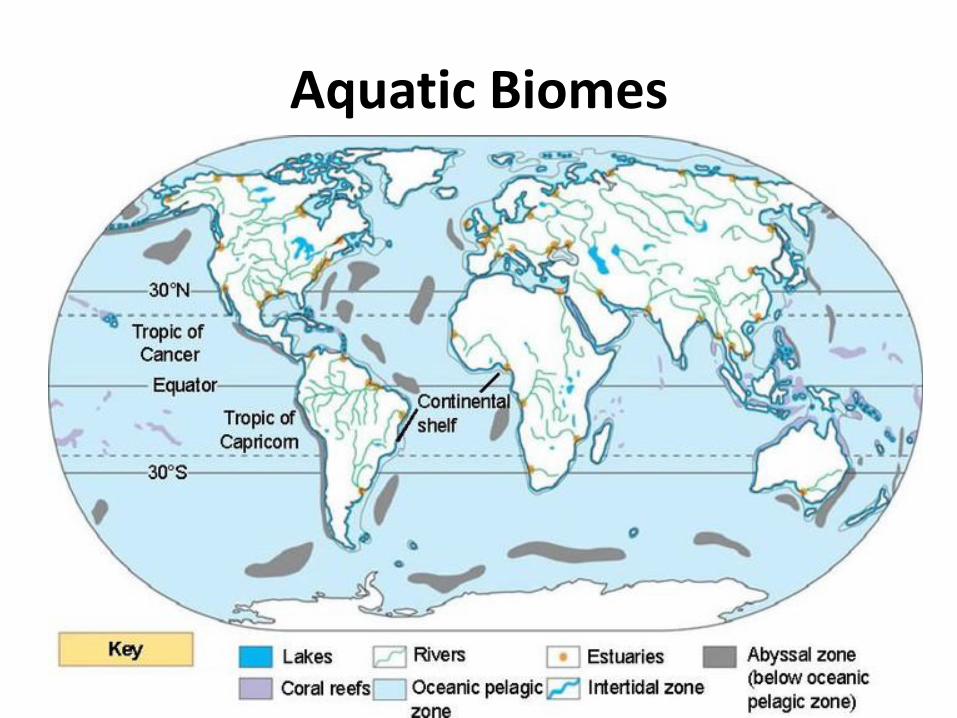
Aquatic Biomes
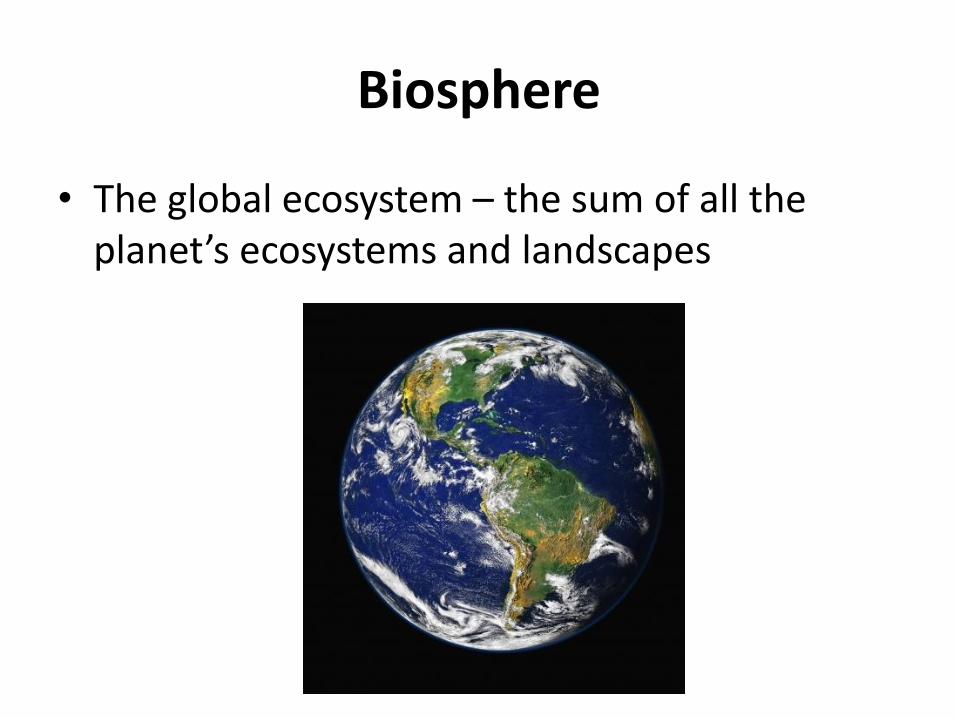
Biosphere
• The global ecosystem – the sum of all the planet’s ecosystems and landscapes
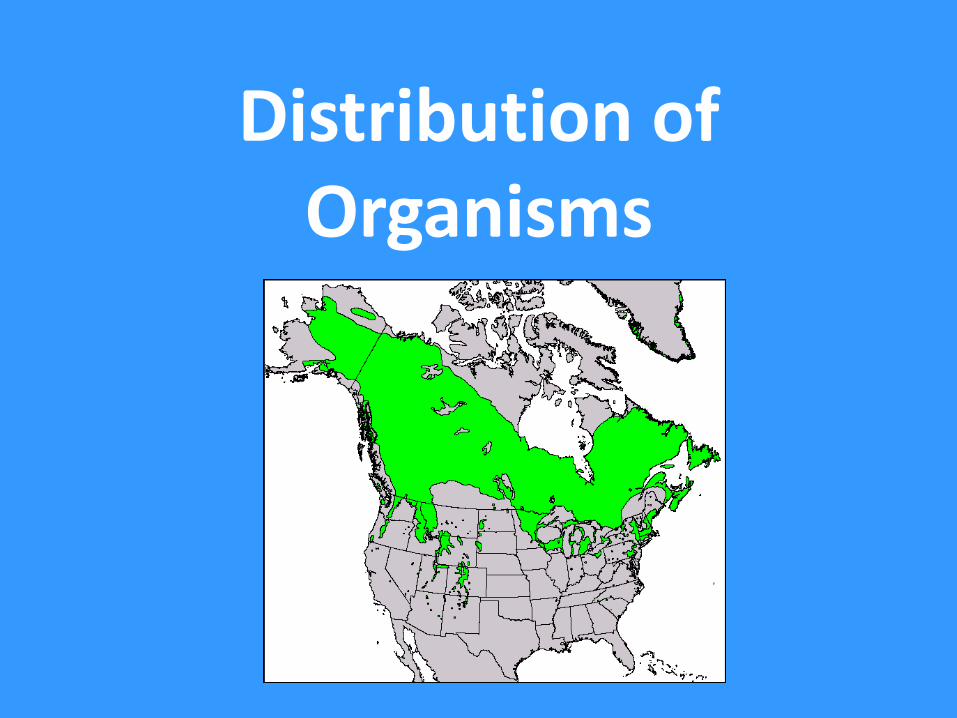
Distribution of Organisms
Distribution of Organisms
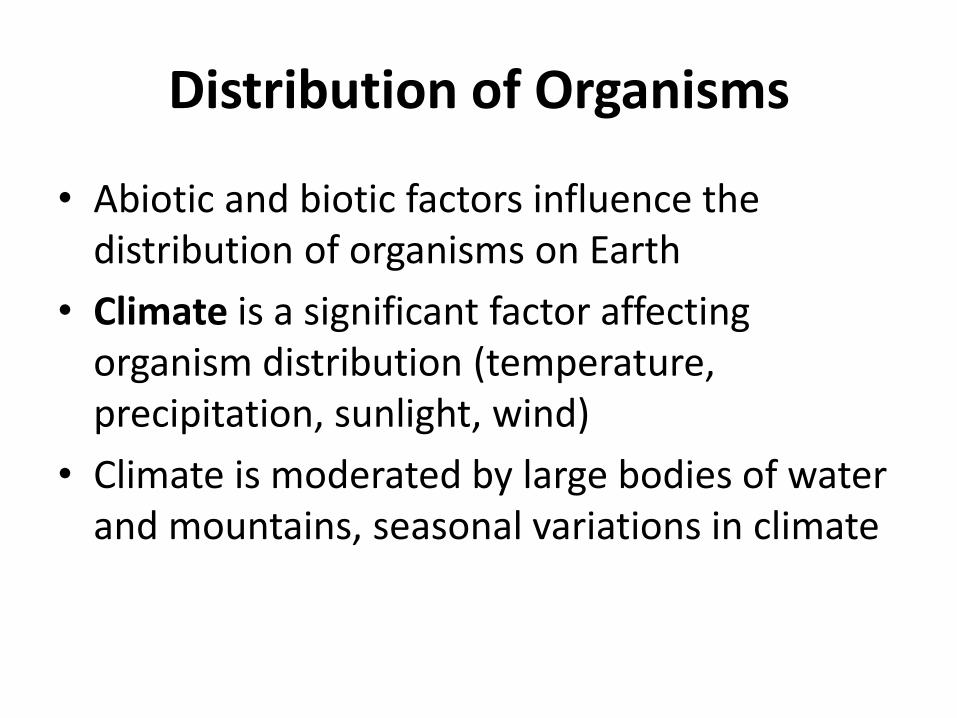
• Abiotic and biotic factors influence the distribution of organisms on Earth
• Climate is a significant factor affecting organism distribution (temperature, precipitation, sunlight, wind)
• Climate is moderated by large bodies of water and mountains, seasonal variations in climate
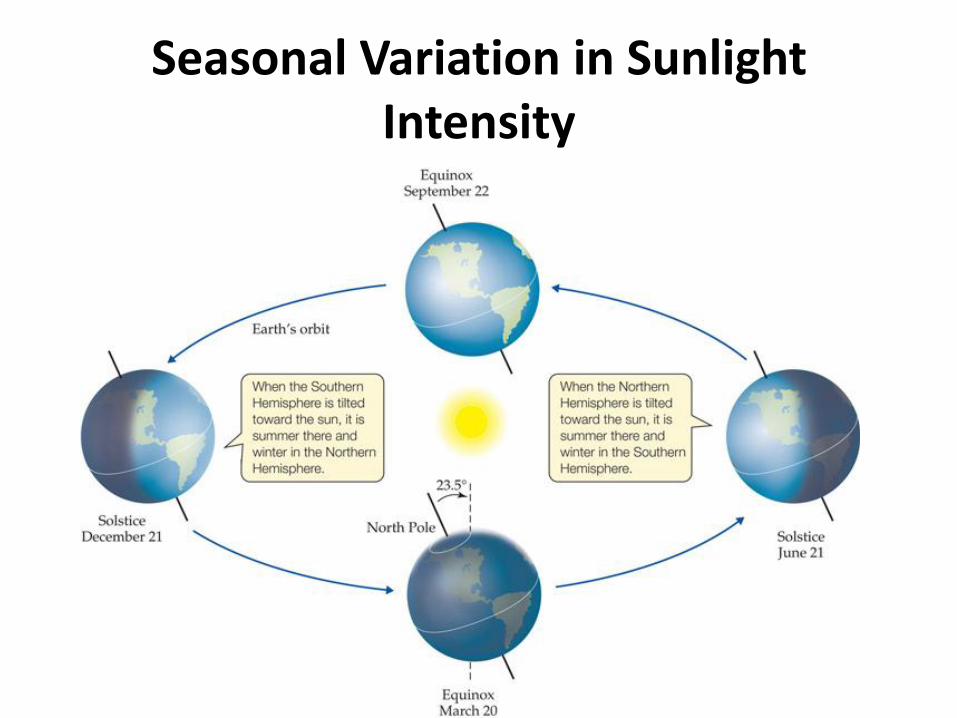
Seasonal Variation in Sunlight Intensity
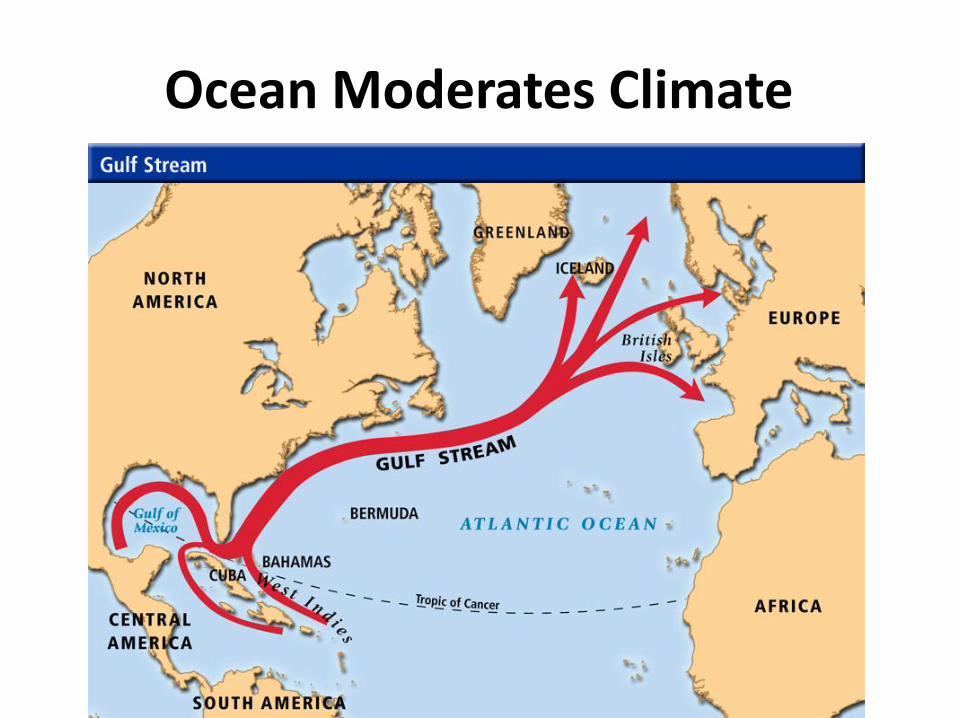
Ocean Moderates Climate
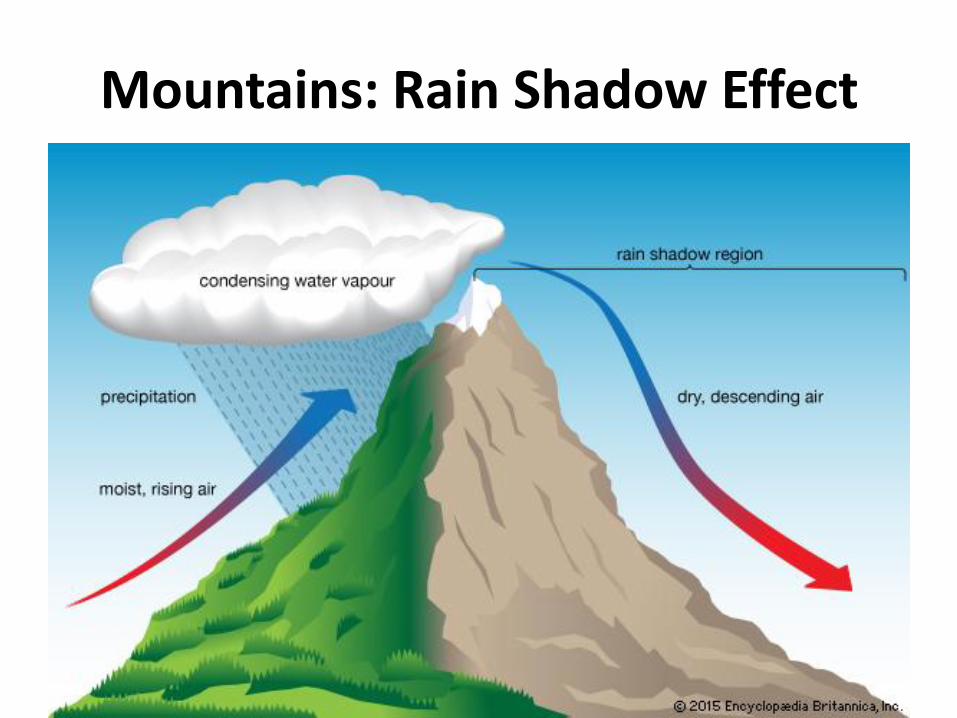
Mountains: Rain Shadow Effect
Abiotic Factors
• Non-living physical and chemical factors that affect an organisms ability to survive and reproduce
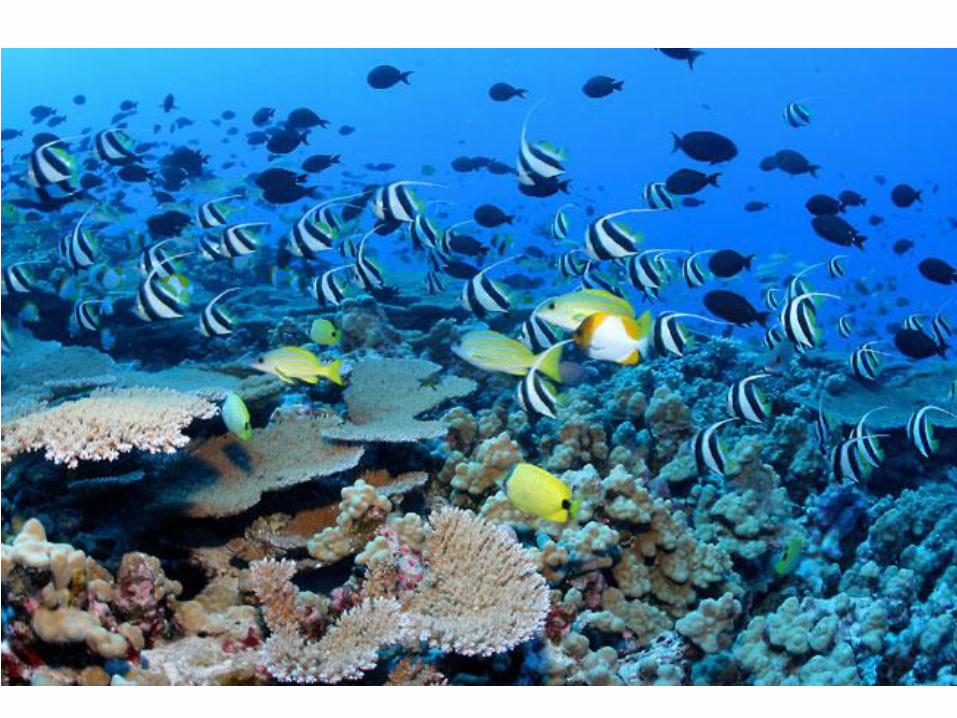
Look at the coral reef ecosystem on the next slide. Provide a few examples of abiotic factors that affect the organisms of this
ecosystem.
Biotic Factors
• Living things or their materials that directly or indirectly affect an organism in its environment
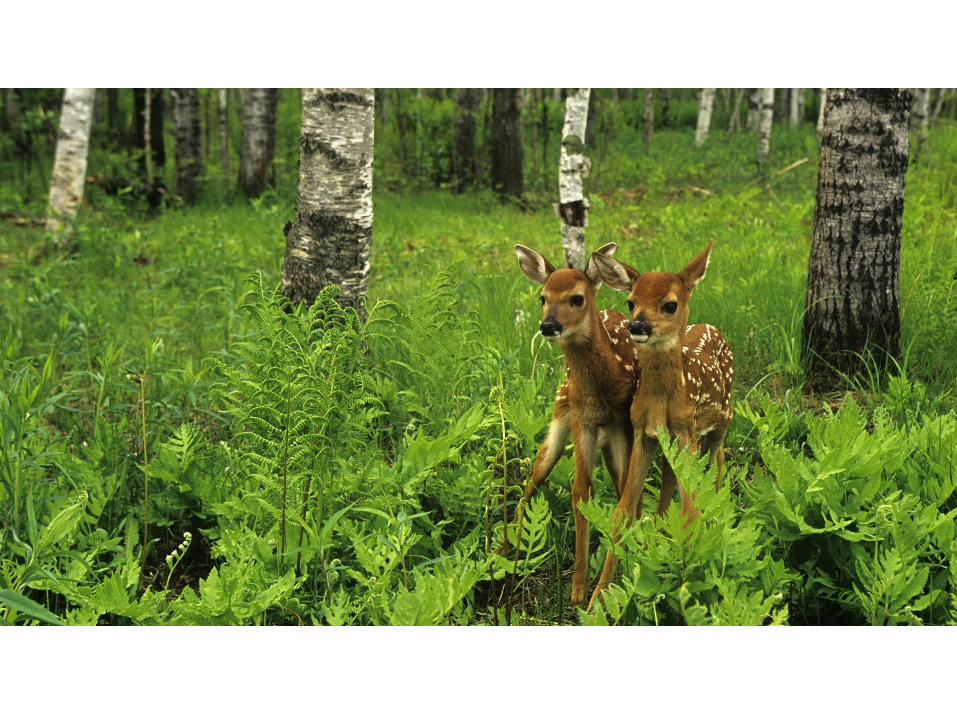
Look at the forest ecosystem on the next slide. Provide a few examples of biotic factors that
affect the organisms of this ecosystem.
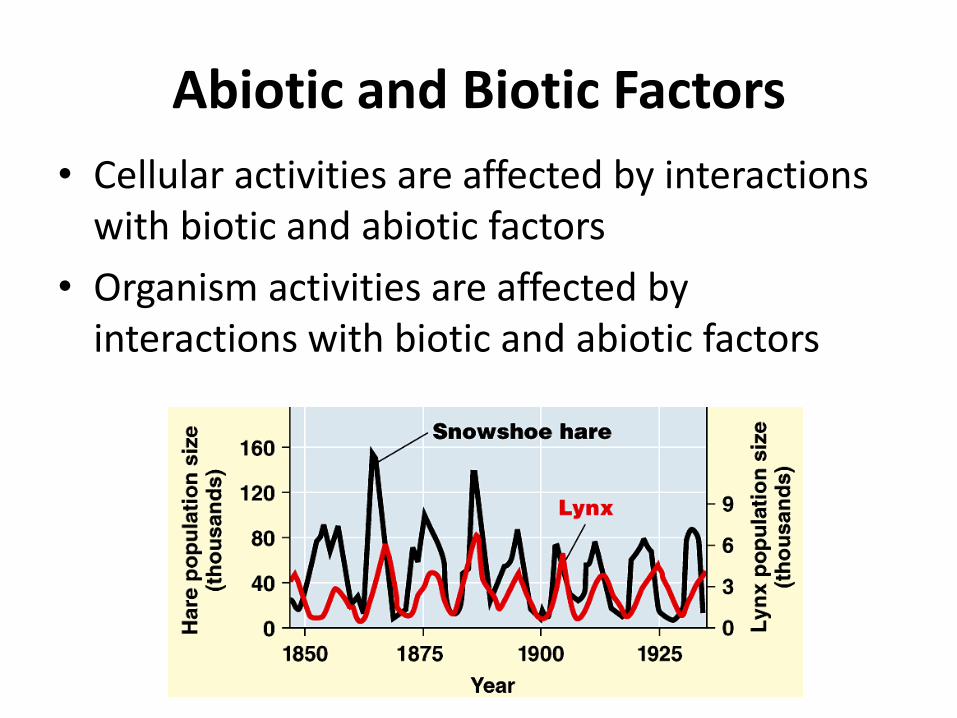
Abiotic and Biotic Factors
• Cellular activities are affected by interactions with biotic and abiotic factors
• Organism activities are affected by interactions with biotic and abiotic factors
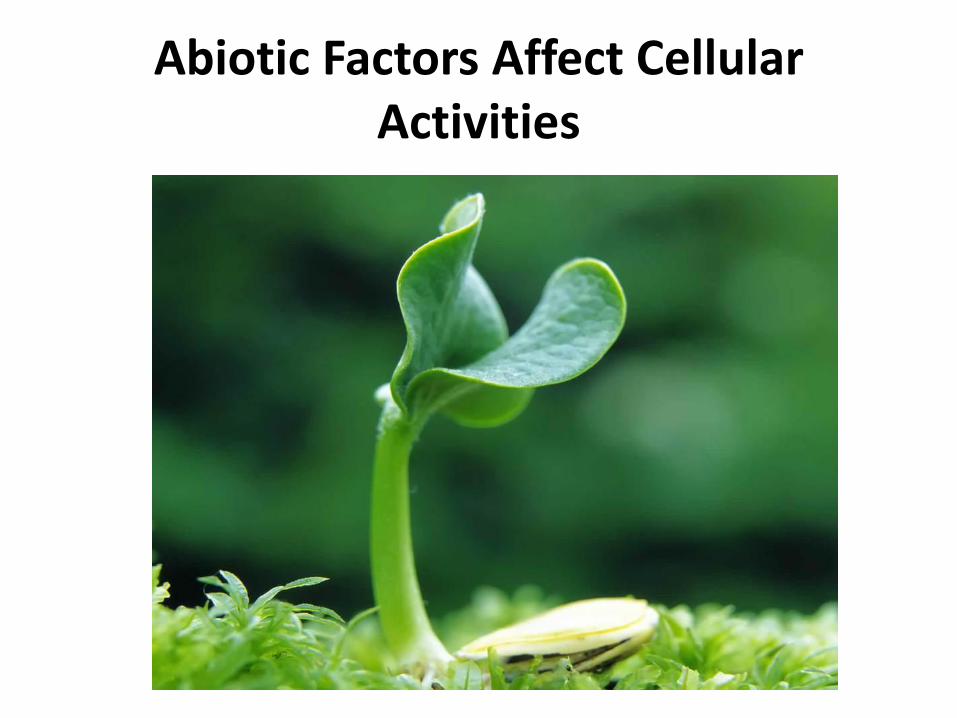
Abiotic Factors Affect Cellular Activities
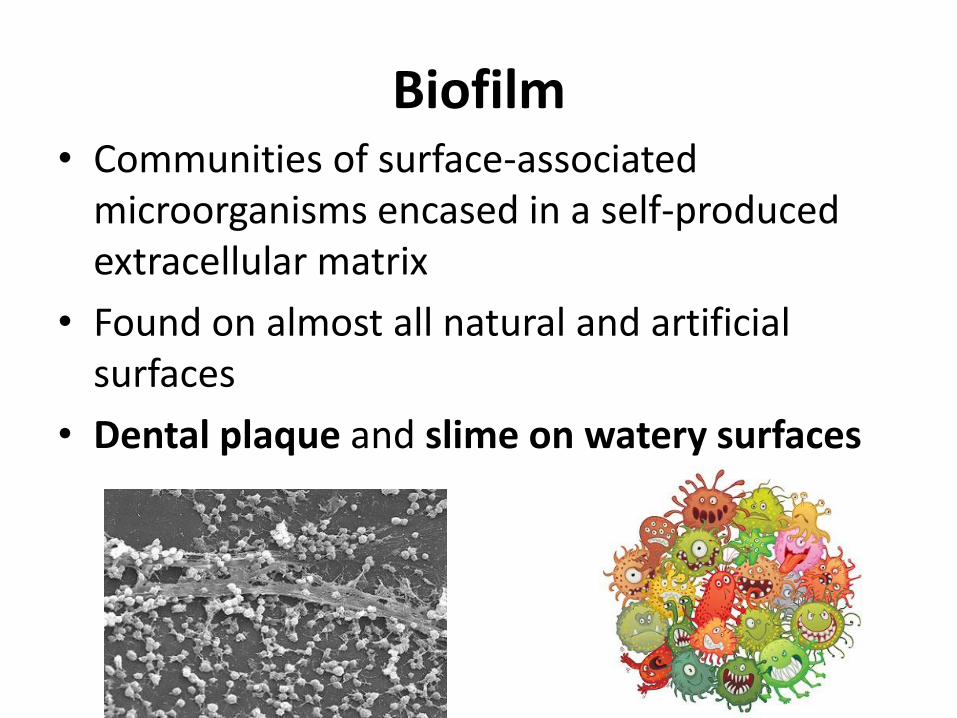
Biofilm • Communities of surface-associated
microorganisms encased in a self-produced extracellular matrix
• Found on almost all natural and artificial surfaces
• Dental plaque and slime on watery surfaces
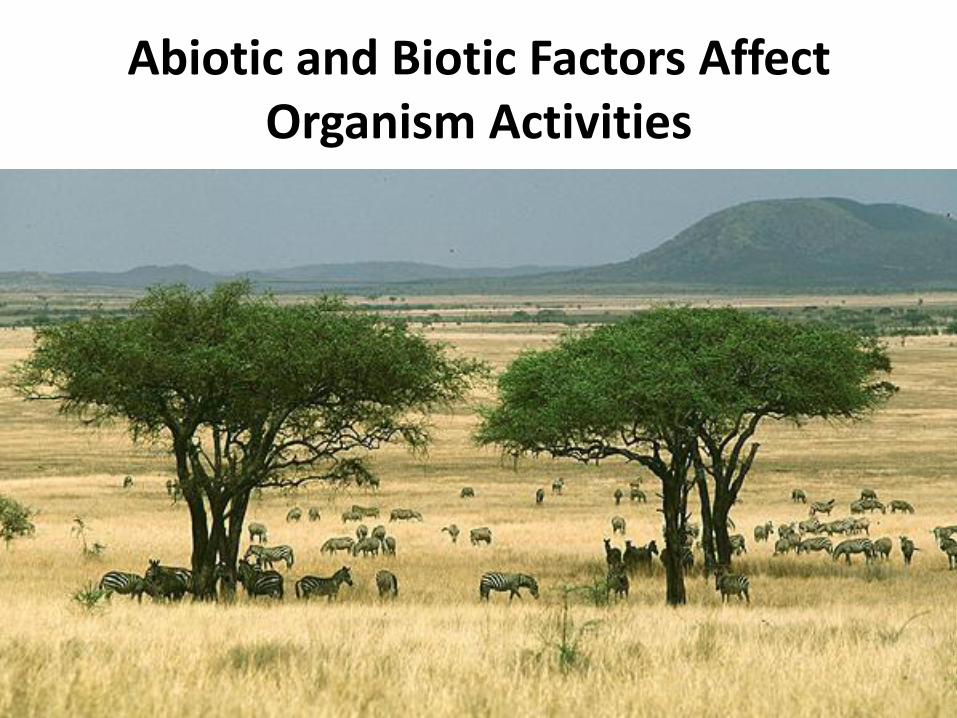
Abiotic and Biotic Factors Affect Organism Activities
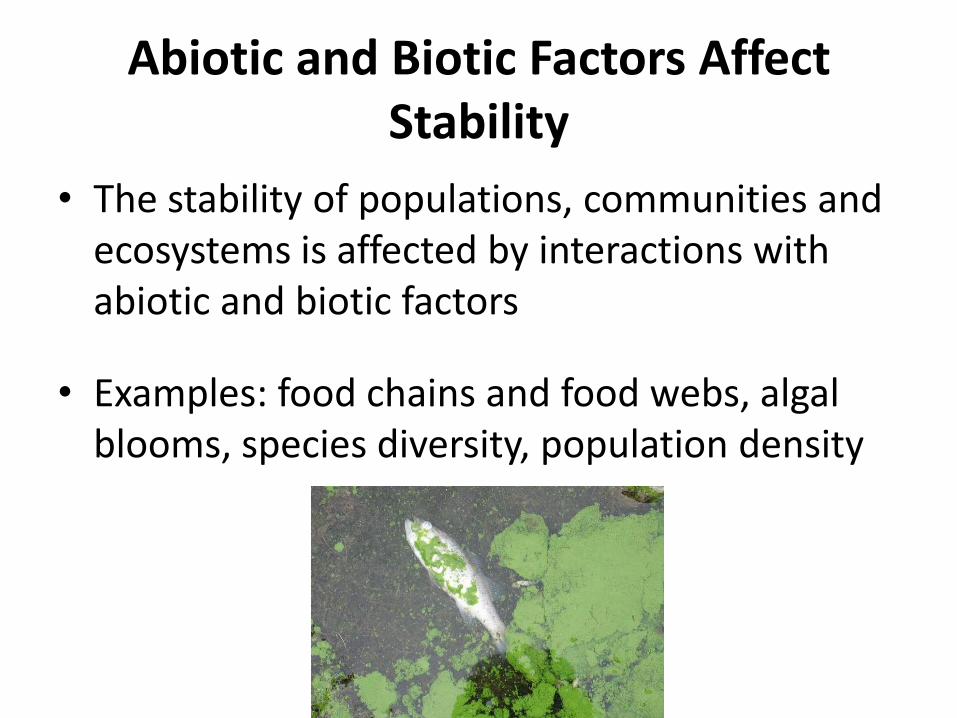
Abiotic and Biotic Factors Affect Stability
• The stability of populations, communities and ecosystems is affected by interactions with abiotic and biotic factors
• Examples: food chains and food webs, algal blooms, species diversity, population density
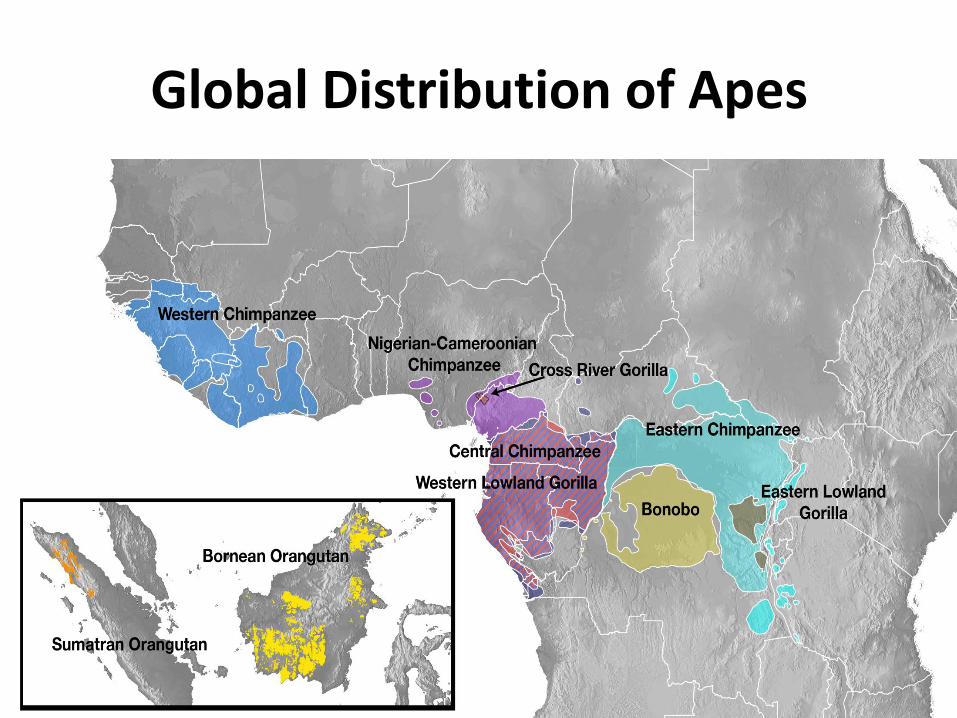
Global Distribution of Apes
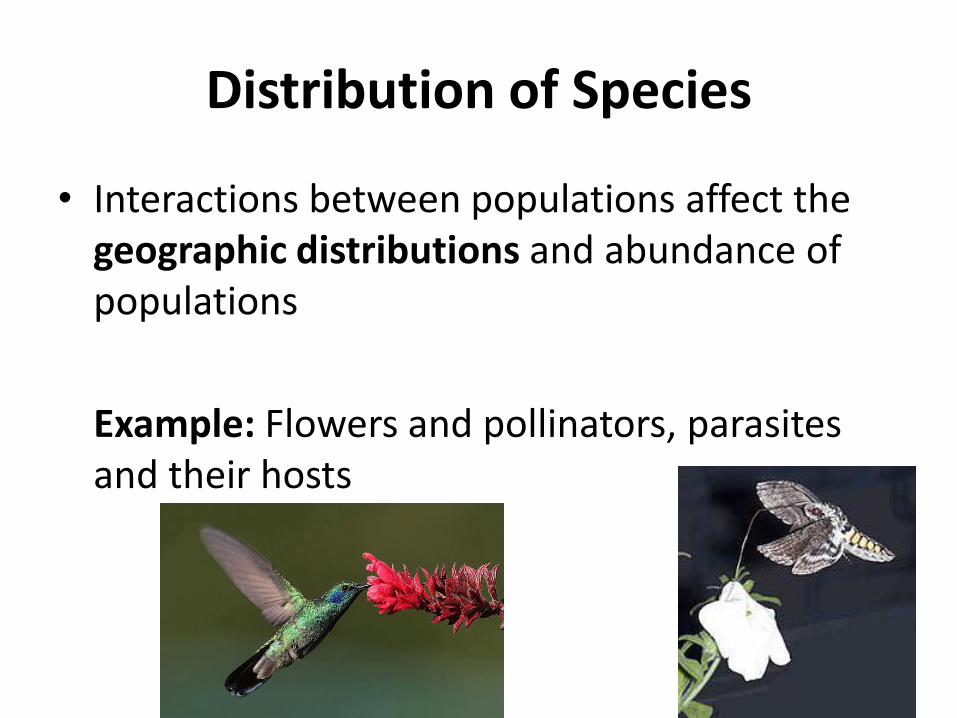
Distribution of Species
• Interactions between populations affect the geographic distributions and abundance of populations
Example: Flowers and pollinators, parasites and their hosts
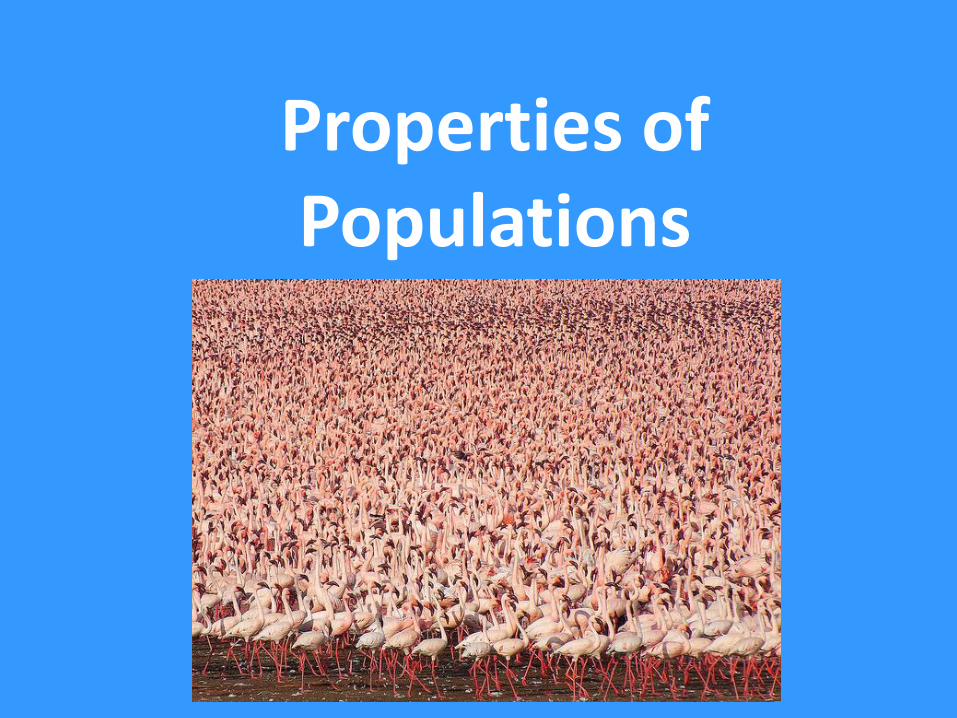
Properties of Populations
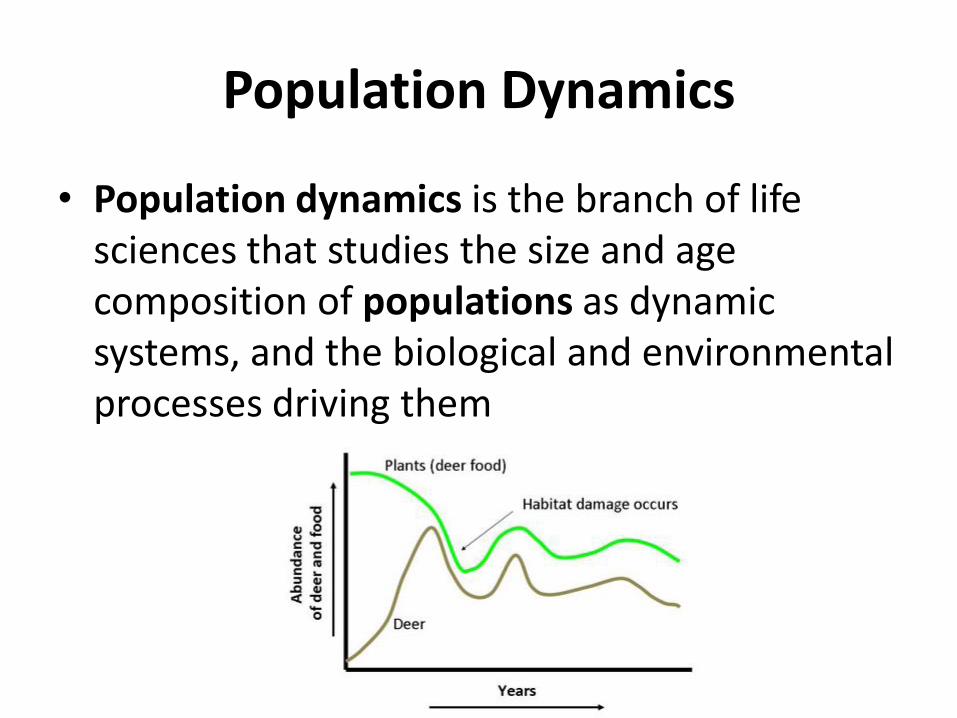
Population Dynamics
• Population dynamics is the branch of life sciences that studies the size and age composition of populations as dynamic systems, and the biological and environmental processes driving them
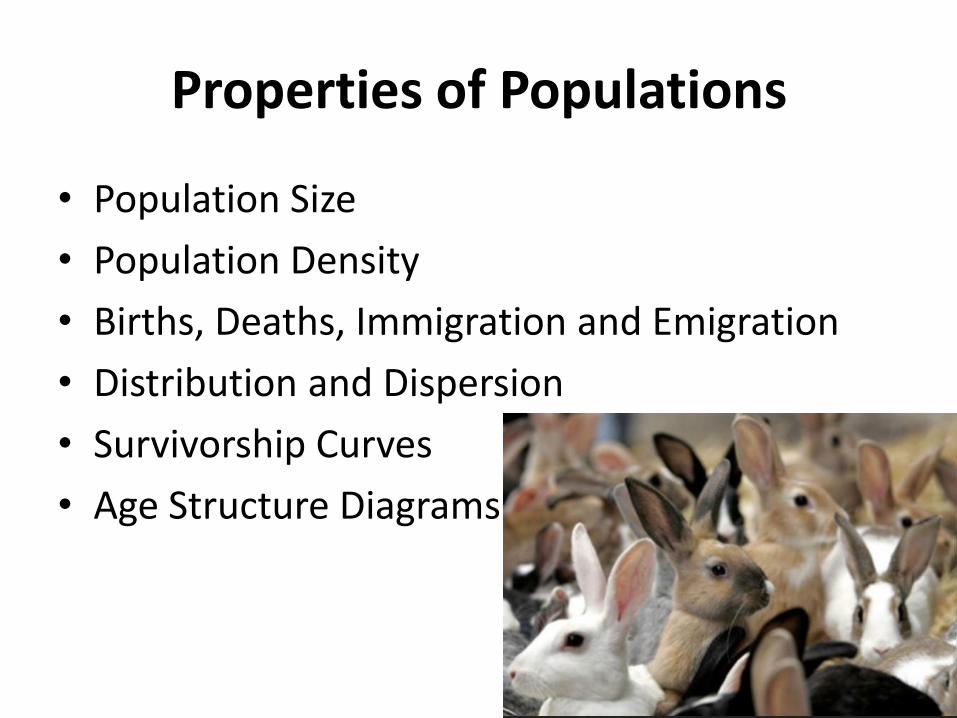
Properties of Populations
• Population Size
• Population Density
• Births, Deaths, Immigration and Emigration
• Distribution and Dispersion
• Survivorship Curves
• Age Structure Diagrams
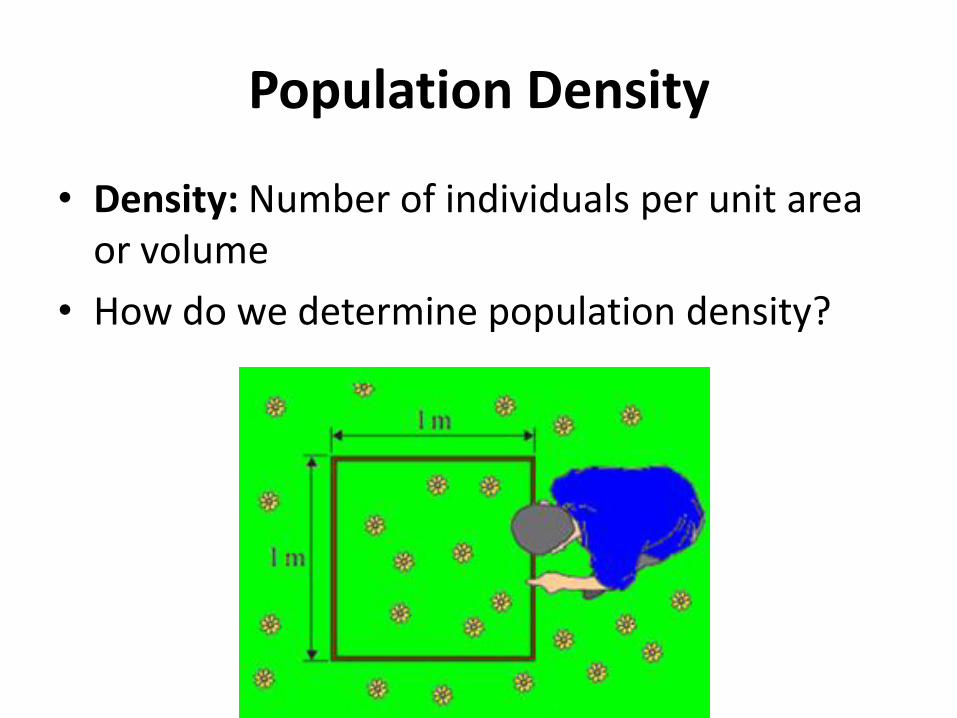
Population Density
• Density: Number of individuals per unit area or volume
• How do we determine population density?
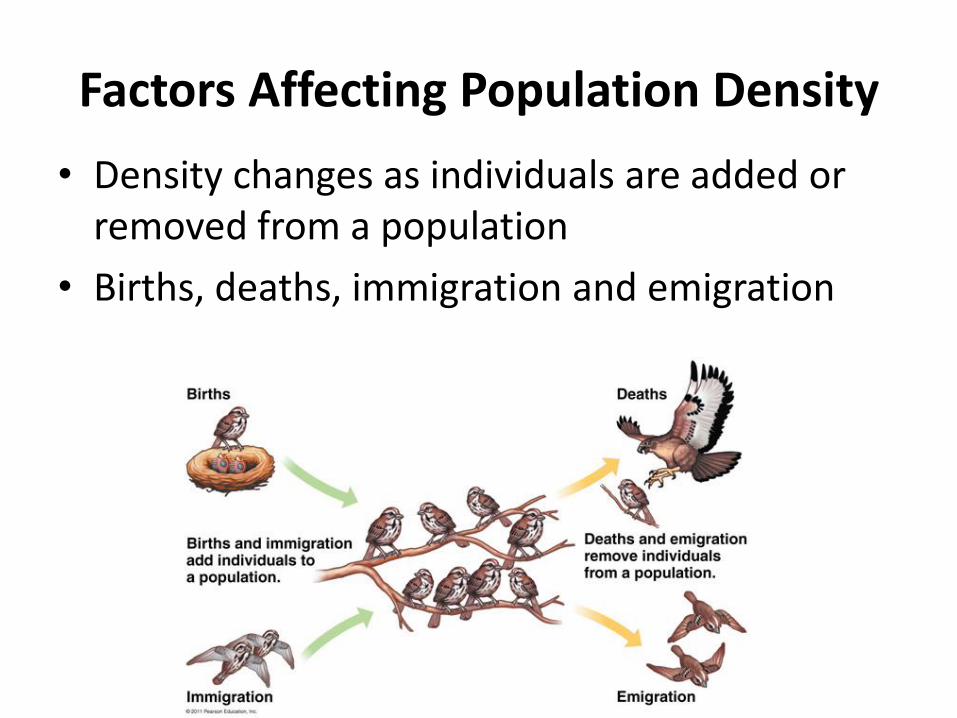
Factors Affecting Population Density
• Density changes as individuals are added or removed from a population
• Births, deaths, immigration and emigration
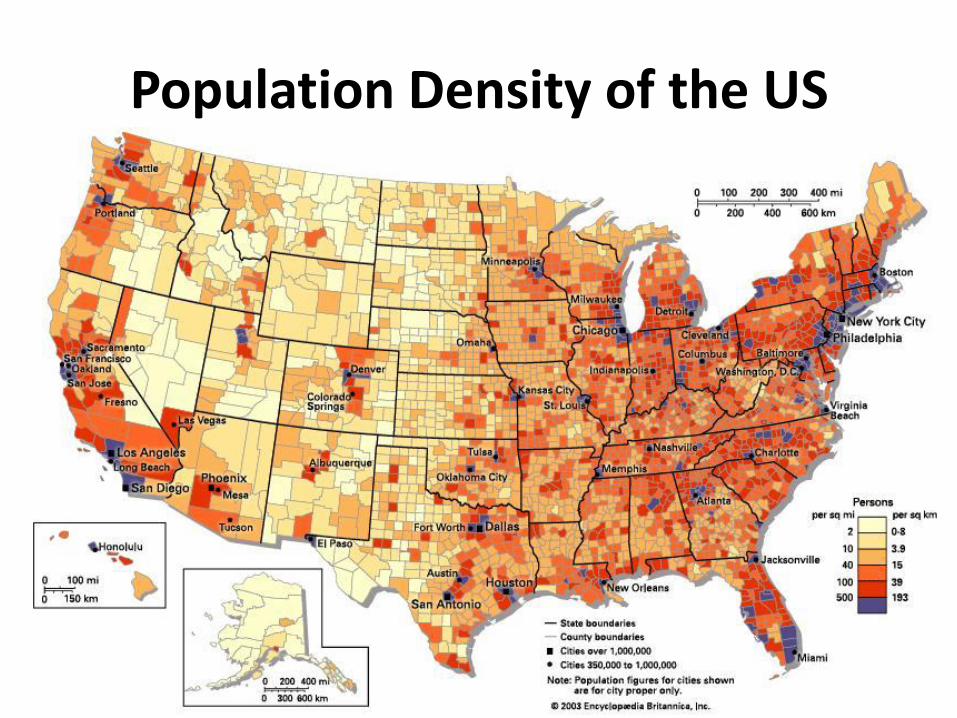
Population Density of the US
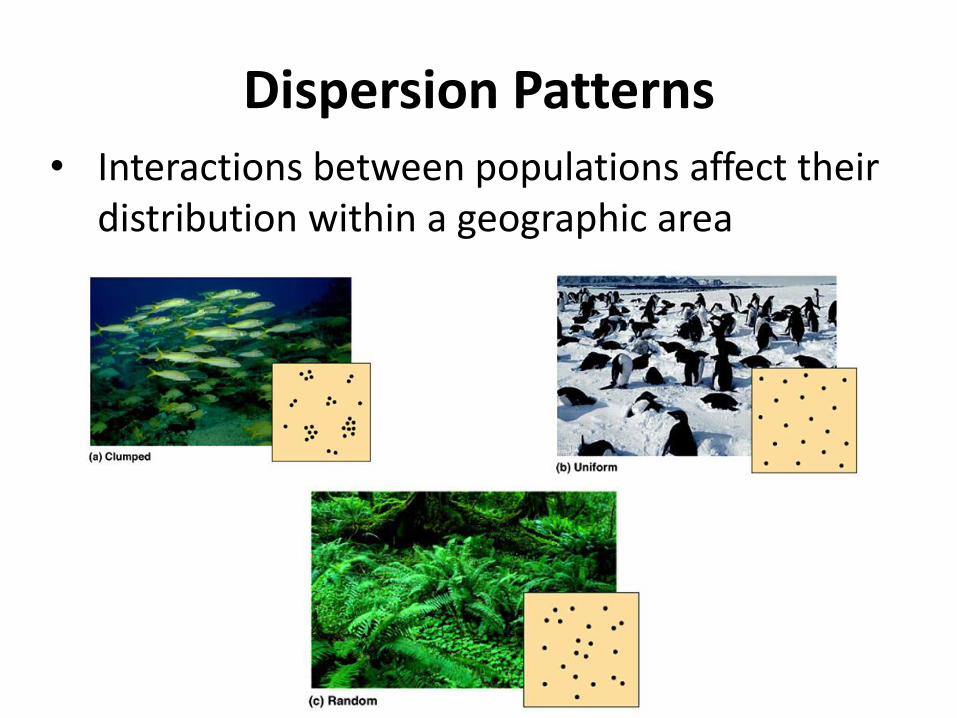
Dispersion Patterns • Interactions between populations affect their
distribution within a geographic area
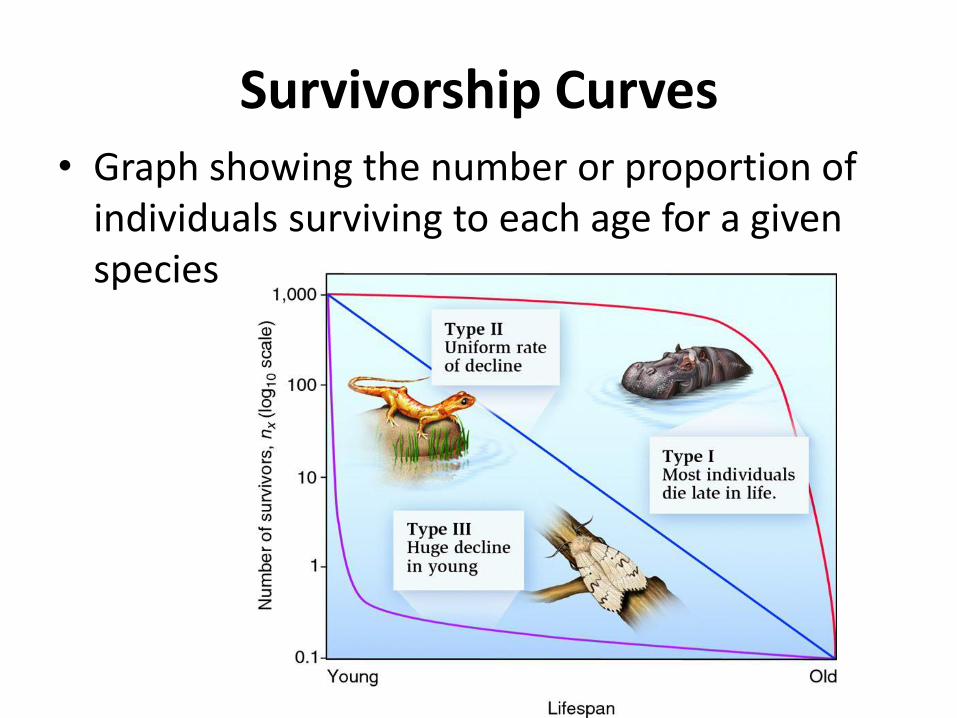
Survivorship Curves • Graph showing the number or proportion of
individuals surviving to each age for a given species
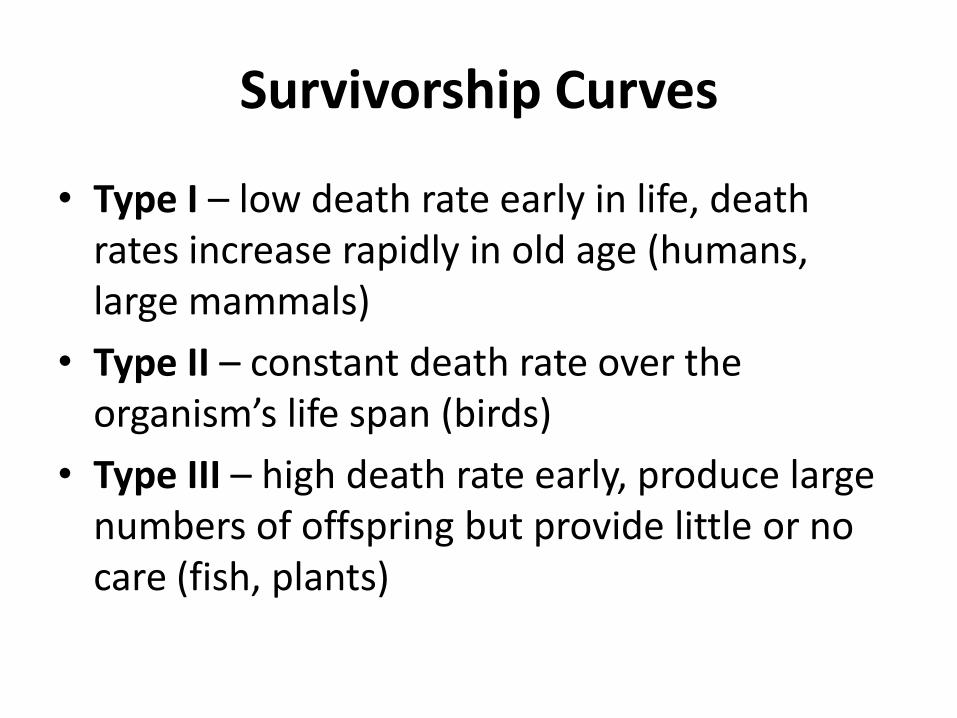
Survivorship Curves
• Type I – low death rate early in life, death rates increase rapidly in old age (humans, large mammals)
• Type II – constant death rate over the organism’s life span (birds)
• Type III – high death rate early, produce large numbers of offspring but provide little or no care (fish, plants)
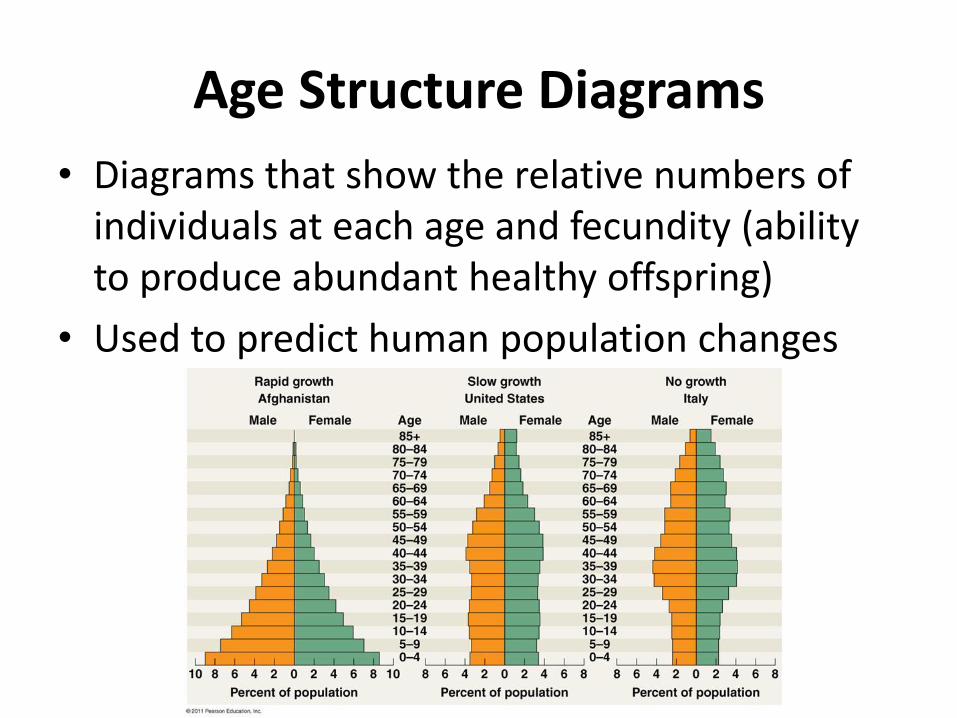
Age Structure Diagrams
• Diagrams that show the relative numbers of individuals at each age and fecundity (ability to produce abundant healthy offspring)
• Used to predict human population changes
Population Growth
Population Growth Patterns
• Mathematical models and graphical representations are used to illustrate population growth patterns and interactions
• What are two population growth patterns?
Birth Rate and Death Rate
• Birth rate (B): number of offspring produced per unit time
34/1000 = 0.034 (per capita birth rate)
• Death rate (D): number of individuals that die per unit time
16/1000 = 0.016 (per capita death rate)
• Used to estimate population growth
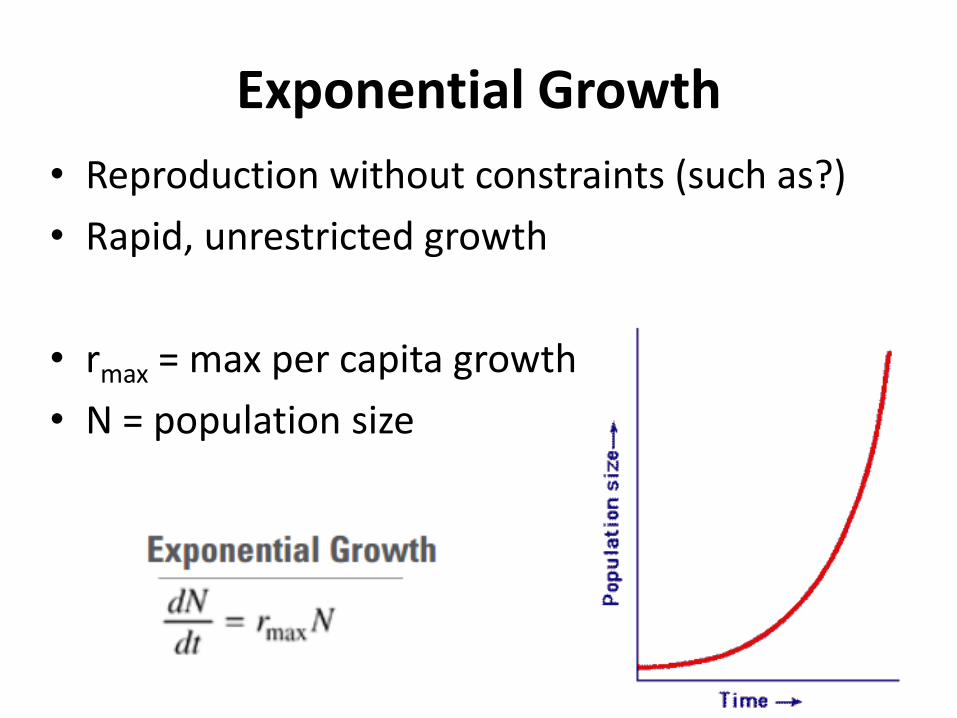
Exponential Growth
• Reproduction without constraints (such as?)
• Rapid, unrestricted growth
• rmax = max per capita growth rate
• N = population size
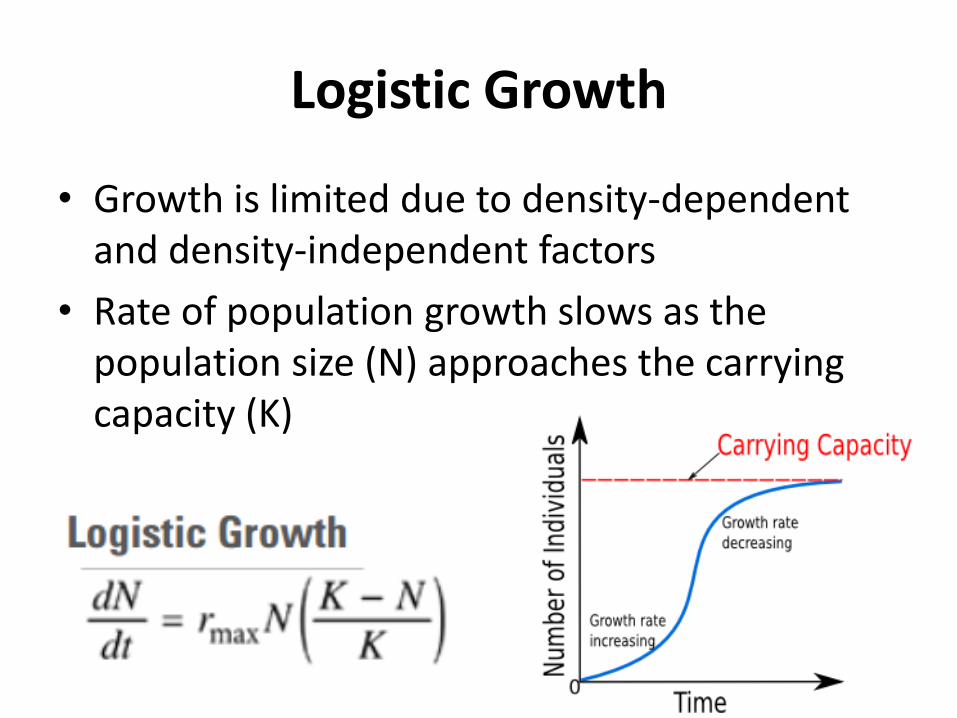
Logistic Growth
• Growth is limited due to density-dependent and density-independent factors
• Rate of population growth slows as the population size (N) approaches the carrying capacity (K)
Logistic Growth
• rmax = maximum growth rate of a population under ideal conditions
• K-N = number of individuals the environment can support
• (K-N)/K = fraction of the carrying capacity that is still available for population growth
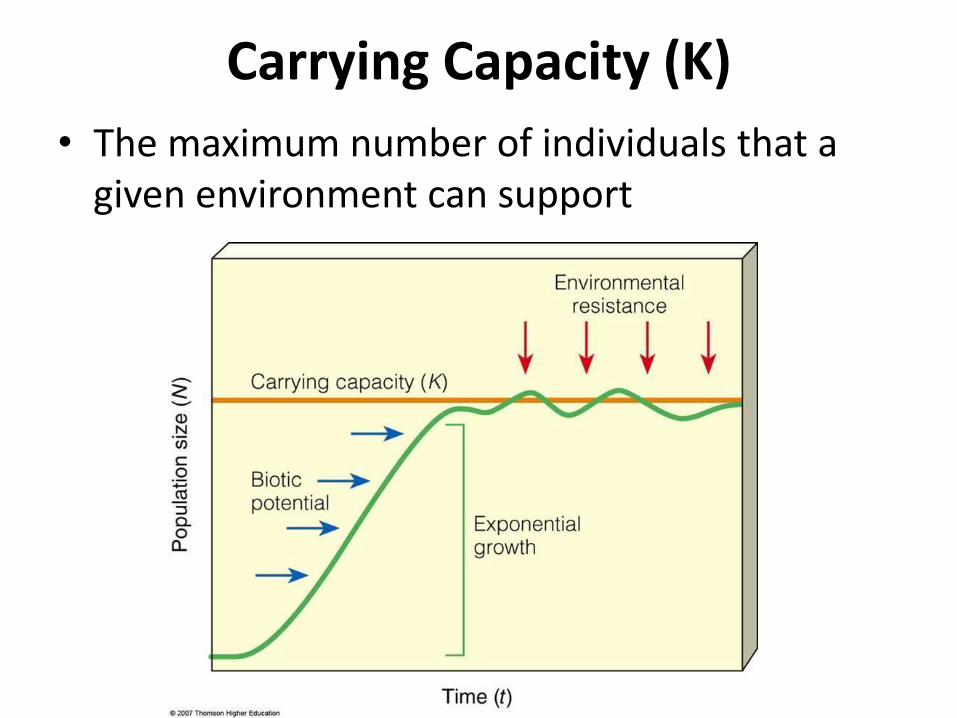
Carrying Capacity (K)
• The maximum number of individuals that a given environment can support
Limiting Factors
• Factors that prevent a population from growing any larger or cause a population to decrease
What are the two categories of limiting factors?
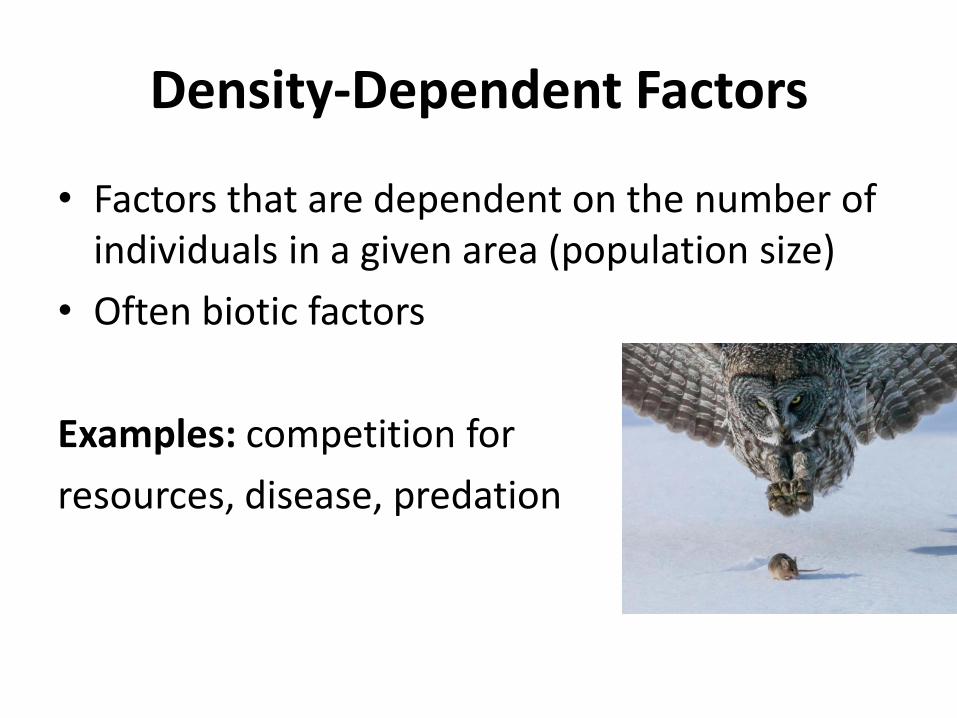
Density-Dependent Factors
• Factors that are dependent on the number of individuals in a given area (population size)
• Often biotic factors
Examples: competition for
resources, disease, predation
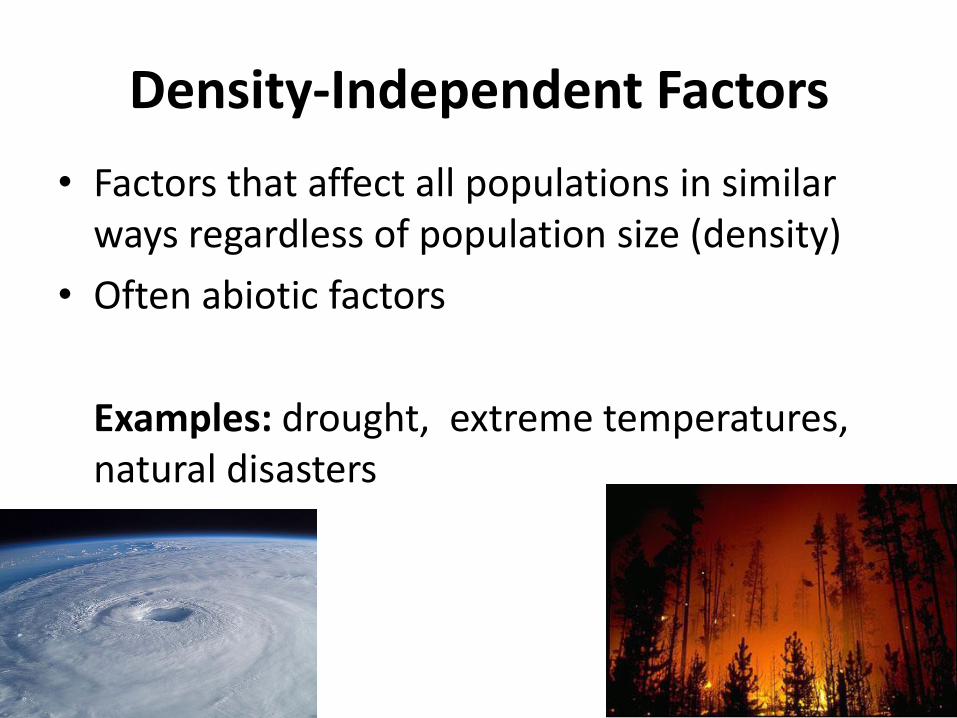
Density-Independent Factors
• Factors that affect all populations in similar ways regardless of population size (density)
• Often abiotic factors
Examples: drought, extreme temperatures, natural disasters
Trade Offs and Life Histories
• Traits that affect an organism’s schedule of reproduction and survival make up its life history
• Trade off between quantity (reproduction) and quality of offspring (survival)
• Natural selection decides
K-selection r-selection
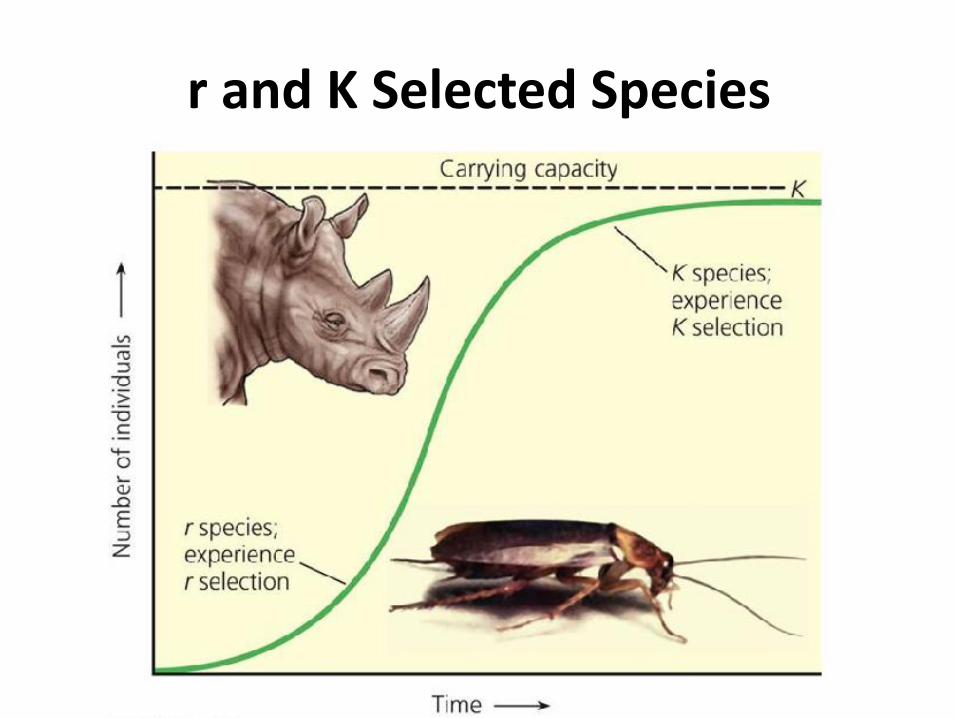
r and K Selected Species
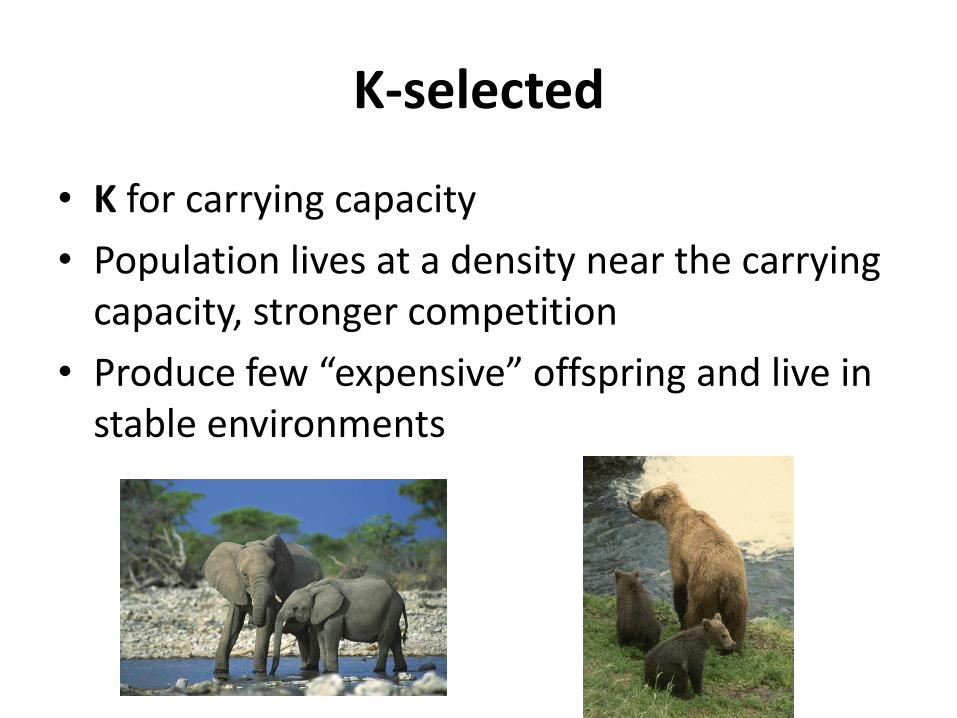
K-selected
• K for carrying capacity
• Population lives at a density near the carrying capacity, stronger competition
• Produce few “expensive” offspring and live in stable environments
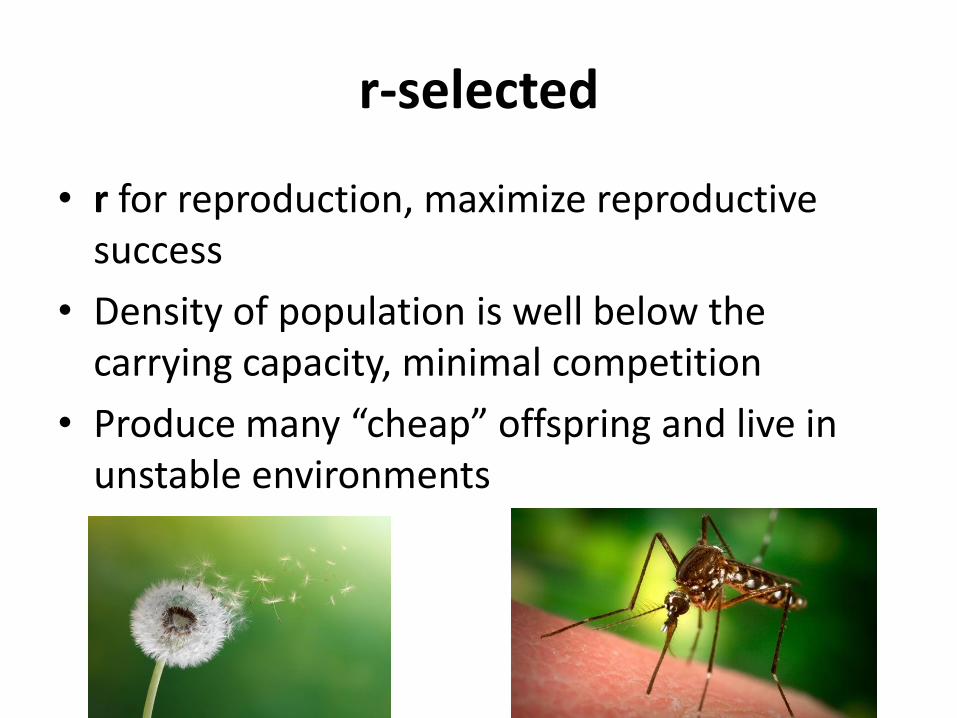
r-selected
• r for reproduction, maximize reproductive success
• Density of population is well below the carrying capacity, minimal competition
• Produce many “cheap” offspring and live in unstable environments
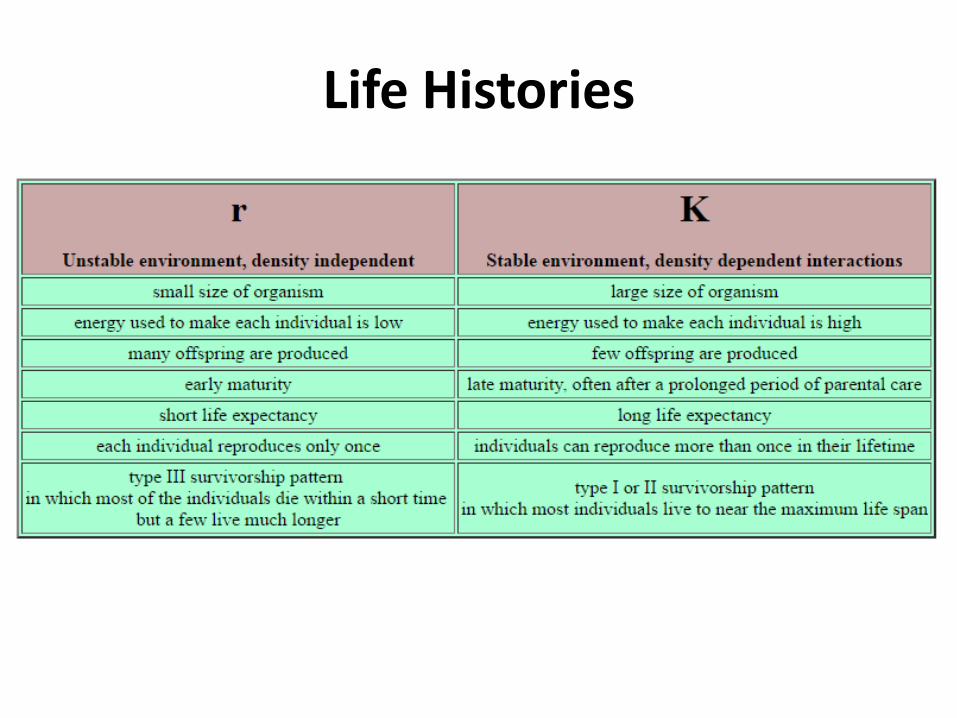
Life Histories