Embed Size (px)
Citation preview
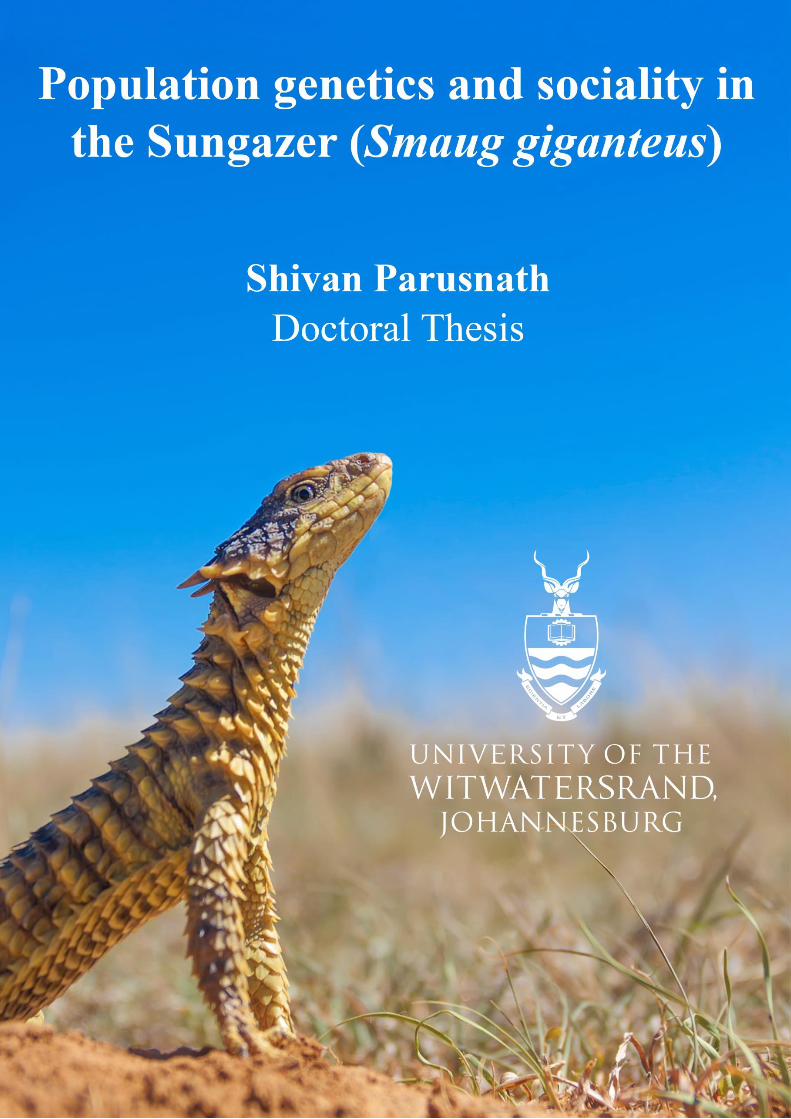
Population genetics and sociality in
the Sungazer (Smaug giganteus)
Shivan Parusnath
Doctoral Thesis
Supervisors:
Prof. Graham Alexander
Prof. Krystal Tolley
Prof. Desire Dalton
Prof. Antoinette Kotze
A thesis submitted to the Faculty of Science, University of the Witwatersrand,
Johannesburg, in fulfilment of the requirements for the degree of Doctor of
Philosophy.
30th October 2020

“My philosophy is basically this, and this is something that I live by, and I
always have, and I always will: Don't ever, for any reason, do anything, to
anyone, for any reason, ever, no matter what, no matter where, or who, or
who you are with, or where you are going, or where you've been, ever, for
any reason whatsoever.”
- Michael G. Scott
i
DECLARATION
I declare that this thesis is my own, unaided work. It is being submitted for the Degree of Doctor of
Philosophy at the University of the Witwatersrand, Johannesburg. It has not been submitted before for
any degree or examination at any other University.
All protocols were approved by the University of the Witwatersrand Animal Ethics Screening
Committee (2014/56/B; 2016/06/30/B), and the National Zoological Garden, South African National
Biodiversity Institute (NZG SANBI) Research, Ethics and Scientific Committee (P14/18). Permits to
work with Threatened or Protected Species were granted by the South African Department of
Environmental Affairs (TOPS59). Permits to collect samples in the Free State and Mpumalanga
provinces were provided by Department of Small Business Development, Tourism and Environmental
Affairs (01/34741; JM938/2017) and Mpumalanga Tourism and Parks Agency (MPB. 5519)
respectively. Research approval in terms of Section 20 of the Animal Diseases Act (35 of 1984) was
granted by the South African Department of Agriculture, Forestry and Fisheries (12/11/1/1/18). All
samples used in this project were stored at the National Zoological Garden Biobank in Pretoria.
Shivan Parusnath
30th Day of October 2020
ii
ABSTRACT
Establishing links between the evolution and ecology of a species is one of the central facets of
organismal biology. Quantifying the past and present flow of genetic material between populations
can provide insight into the landscape features and associated environmental variables that impede or
facilitate this process. An integrative approach utilising a) genetic markers that evolve at different
evolutionary rates, b) ecological niche models that indicate niche suitability across a landscape, and c)
knowledge of the life-history, social system, and morphology of a species can allow for the
formulation and testing of hypotheses of scenarios of genetic structure in a species.
The Sungazer (Smaug giganteus) is a large cordylid lizard endemic to the Highveld grasslands of
South Africa. It is unique amongst the Cordylidae family because of its adherence to primary
grassland, reliance on self-excavated burrows as long-term refuge sites, and organisation of multiple
Sungazer burrow systems into spatially discrete colonies. Young Sungazers are often seen sharing
burrows with adults, and because of this behaviour and the unique spatial organisation of colonies, the
species has long been touted as potentially exhibiting kin-based sociality. Little is known about the
dispersal ability of Sungazers, the levels of genetic differentiation within and between colonies, the
processes that influence genetic structure in the species, and the existence of kin-based sociality in the
species. The primary aim of this thesis was to investigate the population and social structure of S.
giganteus at multiple spatial and evolutionary scales, using mitochondrial DNA, nuclear DNA, and
species-specific microsatellites.
Smaug giganteus occurs in five distinct genetic populations across its distribution (Western 1,
Western 2, Central, Eastern 1, Eastern 2), that belong to three divergent phylogenetic clades (Western,
Central, Eastern). The genetic differentiation of these clades correlate spatially and temporally with
geological features that arose during the most recent uplift of the eastern Great Escarpment, ~900 m
into the Highveld grasslands, ~2.5-1.8 MYA. Within these clades, a combination of barriers such as
mountains, rivers, and isolation by distance appear to be the primary drivers of population structure.
The average Sungazer body size (snout-vent-length and mass) in each clade was significantly
different, with an increasing size gradient from west to east. This size gradient correlates with an
increase in elevation and precipitation, and decrease in temperature, and may result from local
adaption to different climatic niches in these vicariant populations.
Sungazer colonies comprise primarily of extended family members, and Sungazers are significantly
more related to individuals within the same colony than to those in other colonies. Sungazers that
share burrows tend to be immediate family members. Juveniles, in most cases, occupied burrows with
either their mother or father, and full-siblings. The behaviours of refuge sharing by adults and their
iii
offspring, combined with delayed juvenile dispersal, are indicative of parental care in the species.
Besides the sharing of burrows with nuclear family members, social structure within colonies appears
to be relatively homogenous, likely due to the frequent moves between burrows by adults during
mating periods. This is the first evidence of kin-based sociality in an African lizard.
The new insights into genetic structure in S. giganteus presented in this thesis have ramifications for
how long-term conservation and translocation strategies for S. giganteus are managed, such that the
genetic structure and health of populations are preserved. This study extends the evidence of lizard
family living to a new taxonomic group, and a new continent, elucidating the reality that kin-based
sociality may be more widespread in lizards than has long been thought. This opens the door to
studies of kin-based sociality in other cordylids and African lizards, as well as more detailed research
on the complex system of sociality in S. giganteus.
iv
ACKNOWLEDGMENTS
The research presented in this thesis would have not been possible without the assistance, cooperation
and friendliness of many, many landowners across the distribution of the Sungazer. The respect and
interest that these individuals maintain for Sungazers gives me a lot of hope that the species is in good
hands. Some of my finest memories from the past decade have been driving their dirt roads and
walking their open fields in search of Sungazers.
This project came with considerable financial costs of fieldwork, labwork, and keeping me alive.
Project funding provided by the National Zoological Gardens (previously under NRF, now under
SANBI), the Rufford Foundation (Second Grant: 13956-2), the National Geographic Society (Young
Explorer Grant: C288-14), and the Alexander Herp Lab, allowed for the collections of hundreds of
samples from the field, developing and testing microsatellite markers, and processing these samples in
the lab. Funding through the NRF Professional Development Plan allowed for me to pay for rent and
food, and live a comfortable life for the first three years of my PhD. It became a hustle after that, but
my parents, Vinesh and Sashi Parusnath (and my third parent, Prianka), were always there to help pay
bills when times got tough. I cannot be appreciative enough of their support, long after the normal
duties of parenthood had passed. I owe an immeasurable thank you to the Carnegie Corporation of
New York for a grant awarded to University of the Witwatersrand for the Next Generation of African
Scholars, which covered in full, my final year of PhD fees. To complete this PhD without fee debt is
truly a rare gift. Thank you.
My supervisors, Graham Alexander, Krystal Tolley, Desire Dalton, and Antoinette Kotze were vital
mentors to me on my journey of genetics, ecology and evolution. Each of you has imparted valuable
life lessons onto me in multifarious ways. In particular I would like to thank Krystal Tolley and
Graham Alexander who make for a supervisory dream team. Any student to have either of you
supervising them can consider themselves lucky, but to land the pair is indeed great fortune.
I think it was Tolkien that said, “in the company of friends, peril becomes adventure”. Wade Stanton-
Jones, Thilo Beck, Mareike Dinberger, Hiral Naik, Bevan Dell, Ashadee Miller, and Mimmie
Kgaditse all assisted in collecting tissue samples and making difficult decisions in the field. Thanks
for the adventures. Wade in particular, who also spent several years doing research on Sungazers, was
always a welcome field companion. Not only for the assistance, but for the great conversations about
Sungazers, and the many memories made in the field together. Special thanks must also be given to
Allan Vorster, who has welcomed me to Welkom on many occasions, to show friends, colleagues and
film crews the colony of Sungazers that he watches over. He has also shared many interesting
observations and photographs of Sungazers with me that have stimulated enthralling discussion.
v
While labwork may appear to be more comfortable and simple than fieldwork to the uninitiated, this
could not be further from the truth. It can in fact be far more terrifying. Many skilled students and
technicians at the National Zoological Gardens taught me the ropes, and were always available to help
solve problems. Almero Oosthuizen, Thabang Madisha, Antonie Kloppers, and Clearance Mnisi in
particular made labwork more accessible. My labmates at the Alexander Herp Lab at Wits provided
support in various ways throughout the PhD. In particular, Dr. Hanlie Engelbrecht went far beyond
her duties as a post-doc in assisting me with the complex statistical analyses involved in this study.
Her fervour to teach and upskill others is something that I endeavour to match. I hope to in turn pass
these lessons and skills on to others. Other staff members at Wits have also served as important
mentors to me, Stuart Sym, Dave Mycock, Marcus Byrne, and Carol Still chief among them. A
special thanks also to Rose Sephton-Poultney, who proofread my thesis before submission.
Hannes Van Wyk, Le Fras Mouton, Martin Whiting, Ed Stanley, Niels Jacobsen, Trevor McIntyre –
not only has your work been an inspiration to me, but our conversations on Sungazers over the past
several years have been invaluable in shaping my research.
Working on the Sungazer has also meant a long and difficult battle against the illegal trade of the
species, and many people from various institutes share my passion and dedication in the conservation
of these special animals. Key among these individuals are Ian Little, Bradley Gibbons, Ian
Rushworth, Chris De Beer, Zwelakhe Zondi, Hannes Botha, Andre Schlemmer, Luke Verbugt, Chris
Cooke, Gary Kyle Nicolau, Vince Egan, Michele Pfab, and Krystal Tolley. With as many decent,
caring people as these dedicated to the conservation and protection of the Sungazer in its habitat,
surely the outlook is more positive than we sometimes think it is.
I have had many mentors that have helped me tell stories of Sungazers in popular articles,
photographs, videos, interviews, and public talks. Pragna Parsotam-Kok, Noel Kok, Chloé Cipoletta,
Jannes De Villiers, Schalk Mouton, Peter Lamberti, Greg McGruder, Beata Nas and many people at
the National Geographic Society have been important allies in this endeavour. Anyone who has the
opportunity to work with these talented humans can consider themselves lucky – I certainly do.
I could not have dealt with the trauma of completing a PhD without The Office. Michael, Dwight,
Angela, Jim, Pam, Toby, Kelly, Ryan, and the rest of the Dunder Mifflin team, made anxious,
unbearable days and nights survivable. Your craft pervades realms far beyond that which you may
think. You are still the only reason that I can fall asleep most nights. Thank you. Similarly, I have
accompanied Rambalac on hundreds of hours of quiet, peaceful walks through Japan. Your dedication
to what you do is legendary. On days when the anxiety was so intense that I could hardly breathe,
your videos calmed me down and opened up my lungs. How can I thank you enough for something
vi
that most people need medication to deal with? Thank you for every adventure that you have taken me
on. Through the incredible voice of Rob Inglis, I experienced J. R. R. Tolkien’s ‘The Lord of the
Rings’ several times over whilst in the field. It often felt that my adventures in the wild country
paralleled that of Frodo Baggins and his companions on their journey to Mordor to destroy the One
Ring. The poem, ‘A Walking Song’ from the ‘Fellowship of the Ring’ was heartening to listen to after
many nights moving from town to town:
“Home is behind, the world ahead,
And there are many paths to tread
Through shadows to the edge of night,
Until the stars are all alight.
Then world behind and home ahead,
We'll wander back and home to bed.
Mist and twilight, cloud and shade,
Away shall fade! Away shall fade!”
On companions, Bianca Fizzotti, Danielle Durbach, Graham Stansell, Geoffrey Mulder, Nick Quarta,
Jolene Fisher, Joshua Weiss, Ryan van Huyssteen, Anusha Shankar, Nasreen Peer, Jason Klinkert and
Viktor Radermaker, you were a worthy Fellowship. Thank you for the support along every step of the
journey.
Finally, to my Sam. Celine Klinkert, your unwavering support and love is something that I thought
existed only in storybooks. You have shown me that reality is in fact gloriously more wonderful than
fiction. May your every hope and dream come true.
vii
TABLE OF CONTENTS
DECLARATION ............................................................................................................................................................ i
ABSTRACT ................................................................................................................................................................ ii
ACKNOWLEDGMENTS ............................................................................................................................................... iv
TABLE OF CONTENTS ............................................................................................................................................... vii
PREFACE: A PERSONAL PERSPECTIVE ON THE PHD ...................................................................................................... 1
GLOSSARY OF ABBREVIATIONS, ACRONYMS, TERMS & UNITS ....................................................................................... 3
STRUCTURE OF THE THESIS ........................................................................................................................................ 4
DETAILS OF PUBLICATIONS AND PRESENTATIONS ......................................................................................................... 5
A NOTE ON LOCATIONS ............................................................................................................................................. 6
CHAPTER 1: GENERAL INTRODUCTION ........................................................................................................................ 7
1.1. Theoretical Framework ............................................................................................................................ 7
1.2. Reptiles and genetics ............................................................................................................................... 12
1.2.1. Sociality in reptiles ............................................................................................................................ 14
1.2.2. Sociality in African lizards ................................................................................................................ 15
1.3. Problem statement of the thesis.............................................................................................................. 16
1.4. Aims and objectives ................................................................................................................................. 17
1.5. Study species ............................................................................................................................................ 18
1.5.1. Classification and biology .................................................................................................................. 19
1.5.2. Distribution ........................................................................................................................................ 19
1.5.3. Environmental niche .......................................................................................................................... 20
1.5.4. Life-history ........................................................................................................................................ 21
1.5.5. Threats ............................................................................................................................................... 21
1.5.6. Conservation status ............................................................................................................................ 24
1.6. The history of research on Smaug giganteus ......................................................................................... 25
CHAPTER 2: DEVELOPMENT OF MICROSATELLITE LOCI FOR THE SUNGAZER (SMAUG GIGANTEUS), AND THE EFFICACY OF
NON-INVASIVE SAMPLING ......................................................................................................................................... 27
2.1. Introduction ............................................................................................................................................. 27
2.2. Materials and methods ............................................................................................................................ 30
2.2.1. Microsatellite primer development .................................................................................................... 30
2.2.2. Testing suitability of tissue types for downstream applications ......................................................... 31
2.3. Results ...................................................................................................................................................... 33
2.3.1. Microsatellite loci characterisation .................................................................................................... 33
2.3.2. DNA concentration and purity ........................................................................................................... 33
2.3.3. Success in downstream application .................................................................................................... 33
2.4. Discussion ................................................................................................................................................. 36
CHAPTER 3: PHYLOGEOGRAPHY AND POPULATION GENETICS OF THE SUNGAZER (SMAUG GIGANTEUS) ............................ 40
3.1. Introduction ............................................................................................................................................. 40
3.2. Materials and methods ............................................................................................................................ 43
3.2.1. Tissue sample collection .................................................................................................................... 43
3.2.2. Morphometric data collection ............................................................................................................ 43
3.2.3. DNA extraction, PCR, and sequencing .............................................................................................. 45
3.2.4. Phylogenetic analyses ........................................................................................................................ 46
3.2.5. Population genetic structure analysis ................................................................................................. 47
3.2.6. Isolation by distance .......................................................................................................................... 50
3.2.7. Ecological niche model and visualisation in GIS ............................................................................... 51
3.3. Results ...................................................................................................................................................... 52
3.3.1. Phylogenetic analysis ......................................................................................................................... 52
3.3.2. Population genetic structure ............................................................................................................... 54
3.3.3. Isolation by distance .......................................................................................................................... 59
3.3.4. Morphometric comparison ................................................................................................................. 61
3.3.5. Ecological niche model and visualisation in GIS ............................................................................... 62
viii
3.4. Discussion ................................................................................................................................................. 65
3.5. Supplementary material ......................................................................................................................... 75
CHAPTER 4: KIN-BASED SOCIALITY IN THE SUNGAZER (SMAUG GIGANTEUS).................................................................. 76
4.1. Introduction ............................................................................................................................................. 76
4.2. Materials and methods ............................................................................................................................ 79
4.2.1. Tissue sample collection .................................................................................................................... 79
4.2.2. DNA extraction, PCR, and sequencing .............................................................................................. 80
4.2.3. Calculation of pairwise relatedness coefficients ................................................................................ 81
4.2.4. Within burrow relatedness ................................................................................................................. 81
4.2.5. Parentage estimates and relatedness of breeding partners .................................................................. 81
4.2.6. Nearest-neighbour relatedness ........................................................................................................... 82
4.2.7. Within-colony social structure ........................................................................................................... 82
4.2.8. Pairwise relatedness – within and between colonies .......................................................................... 82
4.2.9. Inbreeding analysis ............................................................................................................................ 82
4.2.10. Comparison of relatedness at different spatial scales ....................................................................... 83
4.3. Results ...................................................................................................................................................... 83
4.3.1. Within burrow relatedness ................................................................................................................. 83
4.3.2. Parentage estimates and relatedness of breeding partners .................................................................. 86
4.3.3. Nearest neighbour analysis ................................................................................................................ 89
4.3.4. Within-colony social structure ........................................................................................................... 91
4.3.5. Pairwise relatedness – within and between colonies .......................................................................... 93
4.3.6. Inbreeding analysis ............................................................................................................................ 94
4.3.7. Comparison of relatedness at different spatial scales ......................................................................... 95
4.4. Discussion ................................................................................................................................................ 95
CHAPTER 5: SYNTHESIS & DIRECTIONS FOR FUTURE RESEARCH, CONSERVATION RECOMMENDATIONS, AND FINAL
CONCLUSION ......................................................................................................................................................... 102
5.1. Synthesis and directions for future research ...................................................................................... 102
5.1.1. Understanding drivers of genetic structure in Smaug giganteus ...................................................... 102
5.1.2. Sociality in lizards ............................................................................................................................ 104
5.1.3. Non-invasive tissue sampling in S. giganteus .................................................................................. 109
5.2. Conservation recommendations ........................................................................................................... 110
5.2.1. Conservation of genetic units ........................................................................................................... 110
5.2.2. The use of genetic tools in combatting illegal trade in reptiles ........................................................ 112
5.2.3. The use of single nucleotide polymorphisms (SNPs) ...................................................................... 113
5.2.4. Understanding and mitigating the effects of habitat loss and fragmentation on S. giganteus .......... 114
5.2.5. Incorporating knowledge on sociality into translocations and captive breeding protocols. ............. 116
5.3. Final conclusion ..................................................................................................................................... 117
REFERENCES ......................................................................................................................................................... 118
POPULATION GENETICS AND SOCIALITY IN THE SUNGAZER
1
PREFACE: A PERSONAL PERSPECTIVE ON THE PHD
My interest in the Sungazer has always surpassed scientific research. The charismatic lizard captured
my attention long before I engaged in studies on its conservation, ecology and evolution. To have a
species as iconic and unique as the Sungazer occurring only in my country has long been a point of
pride for myself and many other South Africans. This was evident in talking to hundreds of
landowners over the past several years. Sungazers only inhabit about 12% of the pristine grassland
remaining across its distribution, and landowners therefore regard the presence of Sungazers on their
land as an indication of the quality of their grasslands. Another point of national pride in the Sungazer
is reflected in that the species has at least eight names in four languages that I know of. Sungazer or
Giant Dragon Lizard in English, Sonkyker, Ouvolk, Karkoerhotnot or Skurwejantjie in Afrikaans,
Mbedhla in Zulu, and Pathagalle in Sotho. These names are not generic for any other lizard, reserved
just for the Sungazer. I am not sure how many other lizards throughout the world have been given so
many names from so many different communities, or are so well known across their distribution.
Habitat loss and fragmentation are clear threats to the species, and this is apparent when searching for
Sungazers in the field, or looking at the grasslands that they inhabit through satellite imagery. But
through many years of research it became very clear that one of the most nefarious threats is not the
transformation of grassland to grow crops, which in its own way is an honest endeavour in supplying
our country with food. Instead, it is the greed of humans. It is a disheartening experience to revisit a
field site and follow a GPS point to the location of a burrow, only to find the burrow dug up, and the
Sungazers that once lived inside it, gone. CITES export numbers and frequent posts on social media
of Sungazers for sale correlated with the disappearances of Sungazers and their burrows, and it
became evident to me, the risk that poaching and laundering of wild Sungazers has on the species and
its longevity in the wild. With its late age of first reproduction and low fecundity, Sungazers can’t
keep up with persistent pilfering of their populations for the pet trade.
The microsatellite markers designed in chapter 2 of this study were developed for analysing the fine-
scale genetic structure of wild Sungazer populations and their sociality, but came to play perhaps a
bigger role in their function as tools in regulating trade. Their ability to test the relatedness of an
individual to other individuals in a population meant that they could be used to assess whether
Sungazers were captive bred before CITES permits were granted for their exportation. So before they
were ever used for the purpose that they were designed for, the microsatellite markers were used to
assess whether F2 breeding (captive bred grandchildren of wild Sungazers) could be verified in a
group of about 60 Sungazers destined for the pet trade. As might be suspected of a group of lizards
plundered from their homes, some lizards were with a parent, but for most individuals, a set of parents
POPULATION GENETICS AND SOCIALITY IN THE SUNGAZER
2
could not be assigned to them from within the ‘captive breeding colony’. No grandparents could be
assigned to any of the individuals, meaning that F2 generation captive breeding could not be verified.
This resulted in the first case that I know of, in which a CITES export permit for a reptile was rejected
in South Africa based on a lack of genetic evidence of captive breeding to the second generation.
With these cases going on throughout my Masters and Doctoral years, the battle against the illegal
trade of the Sungazer and South African reptiles in general became very personal to me. I was lucky
to be granted funding by the National Geographic Society for my PhD work, but I was considerably
luckier for their interest in me and my stories of Sungazers. I became a part of their first Young
Explorer Leadership and Development Programme in 2017, and amongst many other valuable skills
and experiences, this gave me an international stage on which I could talk about the illegal reptile
trade and the damage it is doing to our wild populations. A short TV insert about this research on
Sungazers was recorded for broadcast across Africa by National Geographic and still plays to this
day. A dream came true in having an article about the Sungazer and the genetic tools used to regulate
its trade was published in three international editions of the National Geographic magazine in 2019.
Having these stories emanate from the NGS brand without a doubt allowed the story to go further, and
be heard by more people than would have been possible without the society and their support.
Between 2017 and 2018, I also embarked on my first filmmaking endeavour. With funding and
support from Pragna Parsotum-Kok and Noel Kok from the Nature Environment and Wildlife
Filmmaking Congress (NEWF), I produced a short documentary about the illegal trade in South
African reptiles (https://youtu.be/v3TmKQ5dzKM). Producing an eight-minute documentary turned
out to be a much larger task than I had envisioned, and deadlines for the documentary often clashed
with deadlines for my PhD. Despite the stress of this experience, going through the process of
producing a documentary, even though it is only eight minutes in length, was a very important
learning curve for me. This documentary has been entered into several festivals and competitions and
aired on South Africa’s longest running TV show – 50|50 – which endeavours to tell stories of
humans and our interactions with nature. In the end, I think that the film was successful in its aim – to
get conversations started about the impacts that the pet trade has on reptiles.
Ultimately, the photographs, videos, radio interviews, popular articles, and public talks about the
Sungazer and how it is affected by the illegal reptile trade relate little to the aims and findings of this
thesis, but the victories against the illegal reptile trade would not have been possible without it. Many
of the endeavours in battling the trade and telling its story took time away from my PhD, but I hope
that in time, the collective storytelling through media endeavours, and the scientific work of this thesis
tell one cohesive story of the Sungazer and the lengths that people went through to conserve it.
POPULATION GENETICS AND SOCIALITY IN THE SUNGAZER
3
GLOSSARY OF ABBREVIATIONS, ACRONYMS, TERMS & UNITS
A260/280 ratio of absorbance at 260 nm and 280 nm
AMOVA analysis of molecular variance
ANOVA analysis of variance
AOO area of occupancy
asl above sea level
AUC area under curve
BI Bayesian Inference
bp base pairs
CITES Convention on International Trade in Endangered Species of Wild Fauna and Flora
ddH2O double distilled water
df degrees of freedom
DNA deoxyribonucleic acid
EOO extent of occurrence
g grams
GIS Geographic Information Systems
Highveld short temperate grasslands in the high elevation regions of southern Africa
IBD isolation by distance
IUCN International Union for the Conservation of Nature
FST proportion of the total genetic variance contained in a subpopulation (the S subscript)
relative to the total genetic variance (the T subscript).
km kilometre
ML Maximum Likelihood
mm millimetre
mtDNA mitochondrial DNA
MYA million years ago
NDF Non-detriment finding
nDNA nuclear DNA
ng nanogram
PCR polymerase chain reaction
r2 coefficient of determination
SAMOVA spatial analysis of molecular variance
SANBI South African National Biodiversity Institute
SVL snout-vent length
µl micro litres
POPULATION GENETICS AND SOCIALITY IN THE SUNGAZER
4
STRUCTURE OF THE THESIS
This thesis is organised into five chapters. It is bookended by general introduction and conclusion
chapters that contextualise the research of this thesis. The three central data chapters employ the use
of several molecular genetic techniques, some of which are used multiply between chapters. The
sampling methods and laboratory protocols are therefore repeated to some extent in the methods
sections of these data chapters. The thesis is structured as follows:
Chapter 1. General introduction: Theoretical framework, problem statement and study species
The theoretical framework of the thesis is outlined, and the problem statement and overarching aims
of the thesis are provided. The study species, Smaug giganteus, is introduced and aspects of the life-
history, ecology, conservation status, and research history of the species are detailed.
Chapter 2. Development of microsatellite loci for the threatened Sungazer lizard (Smaug
giganteus), and the efficacy of non-invasive sampling
I detail the development of polymorphic microsatellite markers that are integral to the investigations
of contemporary population and social structure in S. giganteus in the subsequent chapters. I quantify
DNA extracted from different tissue types and compare their success rates in microsatellite profiling
to assess whether non-invasive sampling can successfully be used in genetic studies on the species.
Chapter 3. Population structure of the Sungazer (Smaug giganteus)
I investigate the population structure of the Sungazer and identify historical and current events and
landscape features that influence gene flow between populations. A variety of techniques are
employed including phylogenetic analysis using mitochondrial and nuclear gene sequences,
population structure analyses using microsatellite markers, ecological niche modelling, and an
investigation of morphological variation between populations.
Chapter 4. Kin-based sociality in the Sungazer (Smaug giganteus)
The social system within three well-sampled Sungazer colonies is investigated. In particular, the
relatedness between Sungazers sharing burrows, between nearest neighbours, and of Sungazers within
and between colonies is quantified.
Chapter 5. Conclusion: Synthesis, future directions and conservation recommendations
I synthesise and contextualise the findings of this thesis, and highlight avenues of future research. The
applications of the findings of this thesis to conservation management are detailed, and a final
conclusion is reached.
POPULATION GENETICS AND SOCIALITY IN THE SUNGAZER
5
DETAILS OF PUBLICATIONS AND PRESENTATIONS
Manuscripts in preparation
Parusnath, S., Tolley, K.A., Dalton, D., Kotze, A., Alexander, G. J. Development of microsatellite
loci for the threatened Sungazer lizard (Smaug giganteus), and the efficacy of non-invasive sampling
for the species (In preparation for Journal of Genetics)
Parusnath, S., Tolley, K.A., Dalton, D., Kotze, A., Alexander, G. J. Phylogeography and landscape
genetics of the Sungazer lizard (Smaug giganteus) (In preparation for Ecology and Evolution)
Parusnath, S., Tolley, K.A., Dalton, D., Kotze, A., Alexander, G. J. Kin-based sociality in the African
Sungazer lizard (Smaug giganteus) (In preparation for Behavioural Ecology)
Conference presentations delivered
Parusnath, S., Cunningham, M.J., Little, I. T., Jansen, R., Alexander, G. J. 2015. Saving Smaug:
Conservation of the Sungazer (Smaug giganteus). Southern African Rufford Small Grants
Conference. Kirstenbosch Gardens, South Africa.
Parusnath, S., Dalton, D., Kotze, A., Alexander, G. J. 2016. How to save your dragon: Conservation
genetics of the Sungazer (Smaug giganteus). 7th Annual National Zoological Gardens Research
Symposium. Pretoria, South Africa (Best PhD student award)
Parusnath, S., Dalton, D., Kotze, A., Alexander, G. J. 2017. Conservation genetics of the Sungazer
(Smaug giganteus). 13th Conference of the Herpetological Association of Africa. KwaZulu-Natal,
South Africa (Best student award – second place)
Parusnath, S., Tolley, K.A., Dalton, D., Kotze, A., Alexander, G. J. 2019. Complex sociality in the
Sungazer (Smaug giganteus). 14h Conference of the Herpetological Association of Africa. Cape St.
Francis, South Africa (Best PhD student award)
POPULATION GENETICS AND SOCIALITY IN THE SUNGAZER
6
A NOTE ON LOCATIONS
Smaug giganteus is a highly sought-after species in the illegal pet trade, and is frequently poached
from the wild for this purpose. Precautions have therefore been taken to protect the locations of
Sungazer colonies sampled in this study. The precise location of sample sites on maps in this thesis
have been altered such that they cannot be used by poachers to pinpoint a specific colony. The
popular citizen science website, iNaturalist, obscures records of sensitive species by placing the
record within a 0.2 x 0.2 degree grid, and randomising the displayed location within this grid (see
www.inaturalist.org/pages/geoprivacy for more information). I have used the same system here, so
that the reader still has a visual reference of the sampling regime and approximate locations from
where the genetic stock originates. As it stands, the maps presented in this thesis do not present any
novel, detailed locations of Sungazer colonies above what is readily available online or in field
guides.
POPULATION GENETICS AND SOCIALITY IN THE SUNGAZER
7
CHAPTER 1
GENERAL INTRODUCTION
1.1. Theoretical Framework
A fundamental challenge in the study of organismal biology is establishing a link between the
evolution of species and their environments (Bohonak 1999). Species evolve alongside, and as a result
of changes in geology, climate, and other environment variables within their fundamental niche
(Darwin 1859). The partitioning and distribution of a species into its constituent populations within a
landscape are in turn determined by the processes of vicariance and dispersal (Rosen 1978, Wiley
1988, Ronquist 1997). As these processes act on a species and its populations through time and space,
so changes the genetic makeup of individuals within populations through selection, drift, and random
mutations (Lande 1976, Allendorf 1986). As populations form, expand and isolate, these processes
affect their innate genetic diversity and structure (Prugh et al. 2008, Pinho and Hey 2010). Measures
of genetic diversity and structure within and between populations therefore indicate the interaction
that a specific population has had with other populations, and how the composition of the landscape
has influenced these interactions. Examining genetic structure and differentiation between populations
can provide insight into the biotic and abiotic factors that have influenced population structure in a
species, in the past and present.
The scale at which spatial genetic variation occurs is typically proportional to the dispersal distance of
individuals (Schweizer et al. 2007, Heath et al. 2012). As geological, climatic, and anthropogenic
processes drive changes in the composition of a landscape over time, the capability of individuals to
reach and inhabit the entirety of the landscape changes. The respective ability or inability of
individuals to reach the constituent populations of a species results in an intricate network of genetic
exchange within and between these populations (Bohonak 1999, Manel et al. 2003, Avise 2009). The
dispersal ability of individuals can vary greatly both intra- and interspecifically (Slatkin 1985, Bowler
and Benton 2005, Garant et al. 2007) and can range from highly sedentary (resulting in low gene flow
and strong population structuring) to highly mobile (resulting in high gene flow and weak population
structuring) (Peterson and Denno 1998, Habel and Schmitt 2009, Avise 2009). The ability of
dispersing individuals to inhabit and navigate their environment in the past results in the various
forms of genetic structure inherent in extant populations in the present.
The interruption of dispersal patterns and therefore gene flow by means of barriers results from the
process of vicariance (Rosen 1978, Wiley 1988, Ronquist 1997). Typically, vicariance arises as the
result of geological changes such as the formation of mountain ranges, bodies of water, islands
(Macey et al. 2000, Veith et al. 2003, Hayes and Sewlal 2004, Lores and Raya 2006, Poulakakis et al.
POPULATION GENETICS AND SOCIALITY IN THE SUNGAZER
8
2012), or geoclimatic processes such as climate change or climatic gradients (Matthee et al. 2004,
Douglas et al. 2006, Bryson et al. 2012). Theoretically, if a panmictic population experiences
fragmentation through vicariance, the resulting subpopulations will be genetically identical. However,
over time, these vicariant subpopulations may diverge as a result of local adaptation or the injection of
new alleles through migration events (Whitlock and McCauley 1999, Lenormand 2002). The changes
in these subpopulations are fixed over time by genetic drift, selective pressures, and the accumulation
of different, often novel mutations in the gene pools of these populations. Eventually, the lack of
exchange of genetic information between populations, and local adaptation and fixation leads to
divergence. If divergence is sufficient, this may result in genetically differentiated populations, and
ultimately, speciation (Dobzhansky 1940, Pinho and Hey 2010, Nosil and Feder 2012). With an
understanding of vicariance events within a species distribution, and proposed dates of vicariance,
testable hypotheses can be formulated in order to investigate the effects of these events on species
population differentiation (Strange and Burr 1997, Macey et al. 2000, Van Veller et al. 2002).
For many species, genetic exchange is restricted to small distances because of the short-range
dispersal ability of individuals, even within a completely continuous and homogenous landscape
(Slatkin and Maddison 1990, Slatkin 1993, Epperson 1995). This purely spatial limitation to the
extent of gene flow between populations can lead to genetic differentiation. This mechanism is known
as isolation by distance (IBD) (Mayr 1942, Wright 1943). Isolation by distance patterns are typically
strongest for modestly mobile species, whereas species that are either highly mobile or highly
sedentary tend to exhibit weaker IBD patterns owing to higher or lower levels of differentiation
respectively (Peterson and Denno 1998). Species with lower dispersal ability therefore tend to exhibit
fine-scale spatial genetic structure (Schweizer et al. 2007, Heath et al. 2012, Pabijan et al. 2012).
In the modern era, anthropogenic landscape features such as roads (Andrews et al. 2008, Shepard et
al. 2008, Jackson and Fahrig 2011), agricultural lands (Glor et al. 2001, Kay et al. 2016, Veach et al.
2017), and urban developments (Noël et al. 2007, Krawiec et al. 2015, French et al. 2018) may also
impede gene flow between animal populations. Dispersal is typically reduced in transformed habitats,
due to the inability or unwillingness of individuals to manoeuvre between fragments (Saunders et al.
1991, Debinski and Holt 2000, Couvet 2002, Quesnelle et al. 2013). This increases geographical
isolation in populations that experience limited rates of gene flow (Slatkin 1987, Hellberg 2009,
Sexton et al. 2014), predisposing them to a loss of genetic diversity (Lacy 1987, Garner et al. 2005,
Pinsky and Palumbi 2014). As a result, many animal populations living in and around urban or other
heavily transformed areas have lower genetic diversity than population in untransformed areas (Delis
et al. 1996, Delaney et al. 2010, Munguia-Vega et al. 2013, Beninde et al. 2016). In most cases, the
effects of anthropogenic landscape changes are more perceptible in the genetic health of species with
POPULATION GENETICS AND SOCIALITY IN THE SUNGAZER
9
short generation times, because the proliferation of homozygous alleles that result from inbreeding
and lowered genetic diversity occurs more rapidly in these populations (Ewers and Didham 2006).
Conversely, species with long generation times may experience genetic lag, where the effects of
disrupted gene flow are only detected many years or decades after the cause (Metzger et al. 2009,
Uezu and Metzger 2016).
Losses in genetic variation can also occur through population bottlenecks after colonisation, through
genetic drift which causes loss of alleles and changes in allele frequencies, limited migratory options,
and inbreeding (Chakraborty and Nei 1977, Allendorf et al. 2007). Inbreeding results from the
aggregation of related individuals within isolated fragments (Benirschke 2006, Frankham 2006,
O’Grady et al. 2006), and reduces individual and population fitness. In turn, inbreeding may result in
supressed evolutionary responsiveness in the face of changing environmental conditions, and
increased population extinction (Lande 1993, Frankham and Ralls 1998, Crispo et al. 2011).
Inbreeding depression can be alleviated with very small amounts of gene flow, and an understanding
of population processes can therefore provide valuable input for conservation management strategies
that aim to aid the long-term survival of a species in its habitat (Segelbacher et al. 2010, Van Strien et
al. 2014, Bertorelle et al. 2015).
Historical patterns of gene flow between populations also affect extant inter- and intrapopulation
genetic structure to an extent. The nature of these historical scenarios, such as the number and
location of populations, and mode and pace of colonization are associated with characteristic patterns
of extant spatial genetic variation (Emerson and Hewitt 2005, Himes et al. 2008, Chiucchi and Gibbs
2010, Epps and Keyghobadi 2015). Populations that have been colonised from multiple source areas
typically show strong genetic structure, with unique alleles or haplotypes confined to distinct regions
(Nagy et al. 2003, O’Brien et al. 2009, McHugh et al. 2014). In contrast, populations that originate
from a single source typically lack genetic structure, and have geographically widespread, shared
haplotypes or alleles and high diversity (Filardi and Moyle 2005, Pulgarín-R and Burg 2012, Bradler
et al. 2015). Founding populations are typically less genetically diverse than the populations that their
constituent members originate from, having a limited representation of alleles due to the limited
subset of individuals involved in the introduction event (Nei et al. 1975, Leberg 2002, Excoffier et al.
2009). Quantifying the genetic diversity of populations can therefore provide insight into the events
that resulted in the formation of a particular population or set of subpopulations.
An effective way to study the events and mechanisms that drive the genetic differentiation of
populations is to combine various knowledge bases for a species – geography, ecology, life-history,
and genetics – in the integrative discipline of phylogeography (Avise 1987, 2000, Emerson and
Hewitt 2005). Phylogeographic studies aim to explicitly link genealogy and geography, and
POPULATION GENETICS AND SOCIALITY IN THE SUNGAZER
10
investigate the historical factors that have influenced the contemporary geographic distributions of
gene lineages (Kuchta and Meyer 2001, Wiley and Lieberman 2011). Phylogeographic analyses of
spatial genetic structuring can also be used to identify cryptic species which are morphologically
indistinguishable (Rissler and Apodaca 2007, Hughes et al. 2018), and make inferences about the
broader historical patterns for a given geographic region through comparative phylogeographic
analyses between species (Rosen 1978, Bermingham and Moritz 1998, Arbogast and Kenagy 2001).
Landscape genetics is another modern research tool that allows for the incorporation of detailed
spatial information into genetic analyses (Spear et al. 2005, Storfer et al. 2007, Wagner and Fortin
2013). This spatially-explicit technique combines the use of fast-evolving microsatellite markers with
novel statistical analyses, enabling the identification of landscape features (e.g. geological, climatic,
or anthropogenic variables) that affect population genetic structure (Wang et al. 2009, Wagner and
Fortin 2013). As such, landscape genetics can be used as an alternative to or in conjunction with
phylogeography, especially in cases where the evolutionary changes being examined are most recent
or fine scale (Wang 2010, Lind et al. 2011, Rissler 2016). Spatial genetic patterns can be visualised
through the parallel use of geographical information systems (GIS), whereby genetic data is overlaid
onto landscape variables (e.g. specific climatic datasets, landcover, vegetation type, or soil or
underlying rock type) to interrogate hypotheses of the causes of these patterns (Kozak et al. 2008,
Gurrutxaga et al. 2010, Chan et al. 2011). Identifying landscape features that facilitate or constrain
gene flow can assist in identifying priority areas for conservation (Neel 2008) through corridor design
that maximises functional connectivity (Mech and Hallett 2001, Storfer et al. 2007, Epps et al. 2007,
Braunisch et al. 2010, Christie and Knowles 2015).
Molecular genetics analyses have become a valuable tool in conservation management (Greig 1977,
Milligan et al. 1994, Crandall et al. 2000, Hoban et al. 2013, Vernesi and Bruford 2015), particularly
for threatened species (Frankham et al. 2014, Whiteley et al. 2015, Willoughby et al. 2015, Grosser et
al. 2017). The extinction risk of threatened populations and species was in the past assumed to be
related solely to environmental and demographic changes, but genetic structure and diversity are now
understood also be significant factors that influence the short and long term destiny of populations
(Lande 1993, Spielman et al. 2004, Frankham 2010, Kyriazis et al. 2019). Taxa that exhibit small,
declining population sizes may be prone to increased genetic drift and inbreeding, resulting in a loss
of genetic diversity and individual fitness over time (Willi et al. 2007, Frankham 2010, Haag et al.
2010, Rivera-Ortíz et al. 2015). In turn, this can reduce the ability of a population to adapt to changing
environmental conditions, subjecting the population to heightened extinction risk (Burkey 1989,
Lande and Shannon 1996, Spielman et al. 2004, Frankham 2010).
POPULATION GENETICS AND SOCIALITY IN THE SUNGAZER
11
The detection of decreased genetic diversity at species or population level allows for mitigation
through, for example, augmented genetic exchange or the maintenance of corridors for gene flow
(Tewksbury et al. 2002, Christie and Knowles 2015, Thatte et al. 2016). A species level study of
genetic structure can also allow for the identification of evolutionary significant units that should be
prioritised for conservation (Moritz 1994, Fraser and Bernatchez 2001, Mee et al. 2015, Carlson et al.
2016). Consideration of evolutionary distinctiveness from a systematic level can identify priority
species for conservation based on their evolutionary distinctiveness (Vane-Wright et al. 1991, Cadotte
and Jonathan Davies 2010, Tonini et al. 2016). Genetics can also serve an important function in
translocations. For example, individuals can be selected based on their genetic make-up for
translocations to minimise the probability of inbreeding and reduced genetic variation, which would
render the translocated population vulnerable to extirpation (Allendorf et al. 2007, Weeks et al. 2011,
Averill-Murray and Hagerty 2014). Additionally, based on gene flow patterns between populations,
reserves or protected areas can be established or enhanced to ensure the continued exchange of
migrants, and thus genes, between populations, or to repopulate depleted populations (Tewksbury et
al. 2002, Rouget et al. 2006, Christie and Knowles 2015). Knowledge of the population genetic
structure and diversity of species are therefore important sources of information to feed into effective
conservation management plans (Pertoldi et al. 2007, Bertorelle et al. 2015, Taylor et al. 2017).
Modern molecular techniques also offer a wide range of options in answering questions of
evolutionary changes over time (Bertorelle et al. 2015, Vieira et al. 2016, Charlesworth and
Charlesworth 2017). Depending on the scale of the intended investigation, different types of
molecular markers can quantify the relatedness between individuals, connectivity between
populations, or relatedness between species and higher level taxa. The level of detail and precision at
which genetic studies are conducted are no longer limited by technology, but rather access to the
database of genetic material and demographic information to make them possible. Mitochondrial and
nuclear gene sequences have long been used in phylogenetic studies, and are still widely utilised in
investigations of inter- and intraspecies analysis (Springer et al. 2001, Jansa et al. 2006, Lecompte et
al. 2008). Mutations occur more frequently in mitochondrial genes, accumulating 10-20 faster than in
nuclear genes (Vawter and Brown 1986, Zhao 2017). This makes mitochondrial genes more suitable
for use in resolving comparatively young evolutionary relationships (Lin and Danforth 2004,
Galewski et al. 2006, Omote et al. 2015), whereas nuclear genes may be more appropriate for the
investigation of deeper temporal divergences (Friedlander et al. 1992, Amrine-Madsen et al. 2003,
Avila et al. 2013). Ideally, a combination of mitochondrial and nuclear genes selected for a particular
situation is best for assessing phylogenetic relationships within a study system (Yoder and Yang 2000,
Overton and Rhoads 2004, Wuster et al. 2018).
POPULATION GENETICS AND SOCIALITY IN THE SUNGAZER
12
Whereas mitochondrial and nuclear gene sequences are typically employed for broad scale
investigations of genetic structure, rapidly evolving markers such as microsatellites allow for
investigations of fine-scale, contemporary patterns of genetic exchange (Schlotterer 2000, Guichoux
et al. 2011, Flanagan and Jones 2019). Microsatellites are short regions (10s – 100s of base pairs) of
DNA composed of tandem repeats of nucleotide repeats (Wright and Bentzen 1994). The rapidly
mutative and polymorphic nature of microsatellites make them ideal markers for investigations of
fine-scale population structure, (Fredsted et al. 2005, Wiens et al. 2010, Ribout et al. 2019),
assessments of relatedness between individuals (Holderegger and Wagner 2006, Wagner et al. 2006,
Hedrick et al. 2015), and parentage analysis (Dakin and Avise 2004, Flanagan and Jones 2019).
Microsatellites have also been useful in identifying poaching hotspots by isolating the geographic
origin of confiscated wildlife contraband (Mondol et al. 2015, Ogden and Linacre 2015, Wasser et al.
2015). Because microsatellites are tolerant to low quality samples and have high efficacy and
specificity with the species they were designed for (Selkoe and Toonen 2006, Schoebel et al. 2013),
they have been widely utilised over the past several decades (Hodel et al. 2016, Vieira et al. 2016).
Combining data from a combination of appropriate mitochondrial and gene sequences with
microsatellite markers can allow for the investigation of the evolutionary history of a species at
different temporal scales (Eggert et al. 2008, Charruau et al. 2011, Hui et al. 2017, Serrao et al. 2018)
1.2. Reptiles and genetics
Molecular genetic techniques are particular useful in studies of genetic population differentiation in
species that are rare, elusive, and difficult to study using traditional long-term ecological or behaviour
studies (Shaffer et al. 2015). Although molecular genetic research of wild animal populations began to
proliferate in the 1980s, these studies focused primarily on mammals and birds (Mack et al. 1986,
Sage and Wolff 1986). Genetic research on reptiles lagged behind, only gaining momentum in the
late-2000s (Shaffer et al. 2015). Reptiles are a diverse class with more than 11 000 species described
to date (Uetz et al. 2020), and occupy oceans, fresh water, and terrestrial habitat across six continents.
Reptiles range vastly in form and niche - from large apex predators, to miniscule organisms that do
not break water tension when traversing it (Seigel et al. 1987, Pianka and Vitt 2003). Home range size
and dispersal ability amongst reptile species are therefore extremely variable (Stickel and Cope 1947,
Rose 1982), and various landscape features and environmental variables may therefore influence
population structure among species differently. For example, rivers have been recognised as
significant barriers to gene flow in many reptile species (Pounds and Jackson 1981, Pellegrino et al.
2005, Paquette et al. 2007, Ratsoavina et al. 2012, Souza et al. 2013), but can also serve as important
conduits for gene flow in others (Burbrink et al. 1998, Casper 2012, McCartney-Melstad et al. 2012),
in some cases even facilitating range expansion (Smissen et al. 2013). The system of sociality within a
species can also affect the overall genetic structure of the species and its constituents populations,
POPULATION GENETICS AND SOCIALITY IN THE SUNGAZER
13
since dispersal, mating systems, and group living influence the spatial distribution of genotypes (see
Pearson et al. 2020 and references within). This can in turn lead to genetic differentiation at a local
scale. Consideration of the life-history, social system, and ecological niche of a reptile species is
therefore integral in understanding how a specific vicariant event may influence its population
structure.
A commonality amongst reptiles however, is that as an ectothermic group, climate variability spatially
and temporally are significant in determining where reptile populations do and do not occur within a
landscape (Vitt and Caldwell 2013). As such, the dispersal ability of reptiles and range of climes that
they can inhabit are often significantly different from birds and mammals within the same regions
(Tingley and Dubey 2012, Smissen et al. 2013, Rolland et al. 2018, Saladin et al. 2019). The reliance
of most species of reptiles on suitable basking spots for conductive heat transfer (Black et al. 2019)
has also been found to influence population structure in some species (Clark et al. 2008, Blair et al.
2013, Nelson-Tunley et al. 2016). Past (Matthee et al. 2004, Douglas et al. 2006, Muñoz-Mendoza et
al. 2017), present (Clark et al. 2011), and future scenarios (Araújo et al. 2006, Tolley et al. 2009,
Bickford et al. 2010, Boyle et al. 2016) of climate change will continue to be important factors in
understanding and predicting genetic structure in reptile populations.
Reptile species also vary in their response to human-mediated landscape change. Some species are
more vulnerable to becoming road kill than others (Colino-Rabanal and Lizana 2012), and this is
largely dependent on the size and mobility of the species (Shine et al. 2004, Andrews and Gibbons
2005). Roads have therefore served as important barriers to gene flow in some, leading to higher
genetic differentiation in areas isolated by roads than in continuous habitat species (Clark et al. 2010,
Griffin 2015). Agricultural areas are comprised of complex matrices of pristine habitat interspersed
with unsuitable transformed landscapes. The persistence of gene flow between populations depends
on the ability of individuals to move through this matrix (Hoehn et al. 2007, Watling et al. 2011,
Munguia-Vega et al. 2013, González-Fernández et al. 2018). For many reptile species, agricultural
land transformation results in heightened genetic differentiation between populations because of
compromised genetic exchange (Smith et al. 2009, Row et al. 2010, Sunny et al. 2015). In other
species, genetic differentiation is prevented by gene flow if patches of suitable habitat are
interconnected (Sumner et al. 2004, Meister et al. 2010). The effects of habitat transformation may
also manifest differently in species at variable temporal scales (Richmond et al. 2009). While some
long-lived species show signs of increased genetic structure in response to recent habitat modification
(Moore et al. 2008), other species may experience delayed genetic effects of habitat fragmentation
(Mccoy et al. 2010). It is therefore important to consider that contemporary levels of genetic
POPULATION GENETICS AND SOCIALITY IN THE SUNGAZER
14
structuring of species surviving in heavily fragmented areas may not necessarily reflect the ultimate
fate of these populations.
It is clear that investigations into the drivers of population structure in reptiles require knowledge and
consideration of many aspects of a species life-history. The integrative use of ecological niche models
with genetic studies on reptiles can be useful in understanding how specific environmental variables
may correlate with genetic structure for a given species (Clostio 2010, Beninde et al. 2016,
Kaliontzopoulou et al. 2018), and how these changing variables may affect a species in future
scenarios (Fuentes et al. 2010, Penman et al. 2010, Sillero and Carretero 2013). Knowledge of a
species’ genetic structure and spatial spread of genetic diversity are also important considerations
when planning conservation management strategies for threatened reptile species (Branch et al. 2003,
Thomassen et al. 2011, Vasconcelos et al. 2012). Ultimately, knowledge of genetic differentiation
between reptile populations and the factors that drive them will surpass the scope of understanding the
links between evolution and ecology for the species, and contribute towards their effective
conservation in the future.
Sociality in reptiles
Systems of social structure and behaviour have been widely studied in mammals and birds, but
reptiles have received significantly less attention in this regard (Bonnet et al. 2002, Stahlschmidt
2011). Several reasons have been put forward to explain this: social behaviours may be cryptic in
reptiles and not as openly observable as in birds and mammals (Doody et al. 2013), a bias may exist
among researchers against reptiles because of the perceived difficulty in studying them (Pawar 2003),
or researchers avoid research on reptiles simply because of a fear or dislike of them (Kellert 1993).
Despite the apparent long-standing historical bias, the last two decades have seen a burgeoning trend
towards research of social behaviour in reptiles.
Social associations in reptiles range from transient interaction between individuals, to stable
aggregations of kin groups across generations (Halliwell et al. 2017b). While egalitarian sociality
(aggregations of non-related individuals) in a wide variety of reptiles has long been acknowledged
(Kearney et al. 2001, Schutz et al. 2007, Qi et al. 2012, Strickland et al. 2014), research on fraternal
social groups has focused primarily on lizards (Gardner et al. 2016, Whiting and While 2017, While et
al. 2019). In particular, a large body of research has emerged on kin-based sociality in the
Melanesian-Australian Egerniiae subfamily (Family: Scincidae) (consisting of eight genera: Egernia,
Liopholis, Lissolepis, Bellatorias, Cyclodomorphus, Tiliqua, Tribolonotus and Corucia; While et al.
2019), hereafter referred to as the Egernia group.
POPULATION GENETICS AND SOCIALITY IN THE SUNGAZER
15
Research on sociality in the Egernia group was pioneered by Michael C. Bull, whose seminal body of
work began in the 1980s and spanned more than three decades (Godfrey and Gardner 2017). Over this
period, Bull and colleagues detailed social monogamy (Bull 1988, 2000, Bull et al. 1998, Gardner et
al. 2002), kin recognition (Main and Bull 1996, Bull et al. 2001), site fidelity (Bull and Freake 1999),
inbreeding avoidance (Bull and Cooper 1999, Gardner et al. 2012), family structure (Fuller et al.
2005), and stable aggregations (Bull et al. 1998, Gardner et al. 2001, 2007, Duffield and Bull 2002)
among other topics in the Egernia group. This body of work catalysed many more studies on sociality
in more than 20 species in the Egernia group over the next several decades (Chapple 2003, O’Connor
and Shine 2003, 2004, 2006, Stow and Sunnucks 2004, Chapple and Keogh 2005, Langkilde et al.
2007, Duckett et al. 2012, Whiting et al. 2018). The lowered cost of genetic techniques allowed for
empirical evidence to be collected on the long-term population dynamics of related individuals in
these species, and together, have brought about a new understanding of the level of complex sociality
present within lizards.
The first evidence of kin-based sociality in a species outside of the Egernia group was reported in the
North American species Xantusia vigilis (Family: Xantusidae) (Davis et al. 2011). Kin-groups in this
species form through delayed offspring dispersal as in Egernia striolata, E. stokesii, and Liopholis
whitii (Duffield and Bull 2002, Duckett et al. 2012, Halliwell et al. 2017a) amongst others. Although
the Xantusidae falls into the Scincoidae superfamily along with the Scincidae (Pyron et al. 2013), this
finding resulted in the formulation of the hypothesis that kin-based sociality may arise convergently in
lizard species with similar key life-history traits, namely viviparity, delayed offspring dispersal, and
limited refuge availability (Chapple 2003, Davis et al. 2011, While et al. 2015, Halliwell et al. 2017b).
Kin-based sociality has also since been documented within the Liolaemidae (Liolaemus leopardinus;
Brito 2017) and Agamidae (Intellagama lesueurii; Piza-Roca et al. 2019) families. Although evidence
of kin-based sociality has only been found in a single species within each family, these findings speak
to the potential presence of these behaviours outside of the Scincoidae superfamily. At least 60 other
lizard species in 16 families show some evidence of aggregative behaviour (Gardner et al. 2016), and
it is a likelihood that future research employing genetic investigations of relatedness between
individuals will continue to unveil systems of kin-based sociality in other lizard species and families.
Sociality in African lizards
Research on social structure and sociality in African lizards lags far behind the comprehensive body
of research on this topic in the Egernia group. Research has focused primarily on the Cordylidae
family, which is a sister taxon to the Scincidae and Xantusidae (Pyron et al. 2013). Species in the
Cordylidae are highly variable morphologically, but several species are characterised by large body
sizes, viviparity and aggregative behaviour (Stanley et al. 2011). Ouroborus cataphractus has
POPULATION GENETICS AND SOCIALITY IN THE SUNGAZER
16
received the majority of attention, due to the easily observable aggregations of these heavily armoured
lizards that form in rock crevices. Research over the past three decades has detailed grouping
behaviour (Mouton et al. 1999, 2014b, Visagie et al. 2002, Hayward and Mouton 2007, Mouton 2011,
Shuttleworth et al. 2013), and group fidelity (Costandius et al. 2006) in the species. Aggregative
behaviour in the species has been ascribed primarily as clustering in proximity to termitaria of their
main prey species, the Harvester Termite (Microhodotermes viator) (Shuttleworth 2006, Shuttleworth
et al. 2013), but the advantages of vigilance behaviour (Mouton et al. 1999, Hayward and Mouton
2007, Mouton 2011) and reduced mate search effort (Effenberger 2004) have also been suggested.
Aggregative behaviour in the family has also been investigated in Cordylus macropholis,
Namazonurus peersi, Platysaurus broadleyi, and Karusosaurus polyzonus (Nieuwoudt et al. 2003a,
Visagie et al. 2005, Schutz et al. 2007, Mouton 2011). In each of these species, individuals did not
aggregate in experimental scenarios where refuges were plentiful, and it is therefore possible that
aggregative behaviour in situ is simply due to limited refuge availability. Cordylus cordylus and C.
macropholis both display aggressive behaviour towards conspecifics, particularly males towards other
males (Wirminghaus 1990, Nieuwoudt et al. 2003b). This aggressive behaviour further lends credence
to the notion that these species do not preferentially aggregate, since they appear to exhibit
territoriality over refuges.
Smaug giganteus (commonly known as the Sungazer), the largest species of the Cordylidae, exhibits a
unique form of aggregation in the family. Sungazers live in self-excavated burrows in Highveld
grassland that form part of a larger colony. While burrows are often occupied by individual lizards,
they are more frequently occupied by small groups (1-7 lizards) that are frequently seen basking and
foraging together near the burrow entrance (De Waal 1978, Stoltz and Blom 1981, Jacobsen 1989,
Jacobsen et al. 1990, Van Wyk 1992). FitzSimons (1943) suggested that newborns frequently seen
with adults were their offspring. Sungazers show high site-fidelity between years (Ruddock 2000),
and some individuals have been recorded in the same burrow after more than 20 years (pers. obs.,
McIntyre 2006). Despite the observations of preferential aggregative behaviour in S. giganteus and O.
cataphractus, no research has investigated the relatedness within aggregations using genetic
techniques, precluding further questions on kin-based sociality in these species.
1.3. Problem statement of the thesis
The Sungazer is unique amongst the Cordylidae in its inhabitation of grasslands, reliance on self-
excavated burrows for shelter, and spatial organisation into spatially discrete colonies. Despite
extensive research on the life history, ecology, physiology, and conservation status of the species,
little is known about the factors that determine how Sungazers occupy their distribution. Various
POPULATION GENETICS AND SOCIALITY IN THE SUNGAZER
17
natural and anthropogenic landscape features are interspersed across the distribution of the species,
but their influences on the genetic structure of the species are unknown. The social behaviour of
Sungazers sharing burrows and colonies has long been recognised, but studies on the relatedness
between individuals in these interactions have never been done. Key aspects of the life history,
ecology and evolution of the Sungazer therefore remain unanswered, precluding a deeper
understanding of how the species has evolved to life in the grasslands.
1.4. Aims and objectives
In this thesis, I aim to utilise a combination of molecular, ecological, and morphological analytical
approaches to investigate the genetic structure of S. giganteus – from the relatedness of individuals
sharing burrows, to the characterisation of distinct genetic populations and the processes that have led
to the formulation of these populations. In detail, my aims and objectives are as follows:
1) Assess the use of non-invasive tissue sampling in genetic research on Smaug giganteus
(Chapter 2)
a) Quantify DNA concentration and purity in different tissue types from Sungazers
b) Test the efficacy of DNA extracted from each tissue type in microsatellite profiling
2) Investigate the population genetic structure of S. giganteus (Chapter 3)
a) Develop species-specific microsatellite markers
b) Conduct a phylogenetic analysis on Sungazers from across the distribution
c) Conduct population genetic analyses using several models and algorithms
d) Identify the number of unique genetic populations
3) Identify how natural and anthropogenic landscape features influence gene flow in
S. giganteus (Chapter 3)
a) Run an ecological niche model for S. giganteus
b) Identify concordance between genetic discontinuities, niche suitability, and landscape features
4) Investigate morphological differences between Sungazers from different genetic clades
(Chapter 3)
a) Measure snout-vent length and mass for adult Sungazers in three different clades
b) Quantify trends in morphology across the distribution of the species
5) Investigate the presence of kin-based sociality in S. giganteus (Chapter 4)
a) Investigate the relatedness of Sungazers sharing burrows
POPULATION GENETICS AND SOCIALITY IN THE SUNGAZER
18
b) Identify the parents of juvenile Sungazers and their location in relation to their offspring
c) Investigate the relatedness of candidate parent pairs
d) Investigate the spatial organisation of genetic structure within Sungazer colonies
e) Compare the relatedness of Sungazers within and between colonies
1.5. Study species
Smaug giganteus is an ideal model species in which to investigate population structure and sociality in
the Cordylidae for the following reasons:
1. Grassland habitat - The majority of the Cordylidae are rupicolous (Branch 1988). Smaug
giganteus is one of few cordylids to inhabit grasslands, and the only species to create and live in
burrows. It therefore presents a unique system to study in order to further understand the
adaptations that this diverse family has employed in order to inhabit different parts of sub-Saharan
Africa. Grasslands are also one of the most threatened biomes globally (Rouget et al. 2004,
Ceballos et al. 2010), and an investigation of the drivers of genetic structure in S. giganteus will
provide insights into how the loss of grasslands may affect the species.
2. High site fidelity - Sungazer burrows represent significant investments of time and energy and
therefore appear to be utilised by the same inhabitant(s) over long periods of time (at least 20
years; pers. obs., McIntyre 2006). This makes the collection of tissue samples from a known
individual possible over time simply by returning to the same burrow. Samples can also be
collectively non-invasively and the GPS location of the Sungazer taken without having to capture
or disturb the individual.
3. Colony structure - An investigation of social groupings in lizards requires an understanding of
what defines a social group for a particular species. This may be complicated in situations where
delineating where one group starts and other ends can be difficult. Sungazer burrows and the
colonies that they belong to may represent two levels at which social groups may form, and the
permanent location of burrows makes this easy to quantify spatially.
4. Life history - Sungazers have numerous life-history traits in common with lizard species that are
known to exhibit kin-based sociality. Key among these traits are live birth, late age of first
reproduction, small litter size, and long lifespan. The species also occurs in an environment in
which refuges are limited, which may promote stable aggregations. This makes it an ideal
candidate species from the Cordylidae to facilitate comparisons with other social lizard species.
POPULATION GENETICS AND SOCIALITY IN THE SUNGAZER
19
5. Conservation status - The Sungazer is a Vulnerable species (Alexander et al. 2018) due to the
severe levels of habitat and population decline resulting from crop farming, and poaching for the
pet trade. This provides a strong motivation to investigate the species’ genetic structure and the
influence of different landscape features on it, since understanding these factors may contribute
towards more effective conservation management planning for the species.
Classification and biology
The Sungazer (Smaug giganteus) is the largest (snout-vent length (SVL) > 183 mm) species of the
Cordylidae - a family of lizards endemic to sub-Saharan Africa (Branch 1988, Van Wyk 1992,
Stanley et al. 2011). A taxonomic revision of the family in 2011 assigned the species to the novel
genus Smaug, along with seven other large-bodied species previously belonging to the genus
Cordylus (Stanley et al. 2011). Smaug giganteus is estimated to have diverged from the Smaug
warreni complex approximately 20.5 MYA (Stanley and Bates 2014), and has been ranked in the top
20 most evolutionarily-distinct threatened squamate species (top 0.5% of all assessed squamate
species; Tonini et al. 2016).
The common name of ‘Sungazer’ is derived from the distinctive posture that individuals adopt when
basking, in an anterior body up position with their heads pointing upwards as if looking at the sun
(Branch 2001). One of the few cordylids to inhabit grasslands, Sungazers live in self-excavated
burrows in hard Highveld clay soil and generally restrict movements for foraging and
thermoregulation to a 1 m2 area adjacent to the entrance of their burrows (Van Wyk 1992, Ruddock
2000). Sungazers are heavily-armoured, their dorsal surfaces, head, limbs and tail covered with
ossified keeled spines (Branch 1988, Van Wyk 1988). Their limbs are relatively short and stocky
compared to other species in the family, and their morphology appears to have evolved for
mechanical defence rather than fleeing (Losos et al. 2002, Broeckhoven et al. 2015, 2018). When
approached by a predator, Sungazers descend into their burrows headfirst and anchor themselves in
the burrow using their dorsal and occipital spines, and lash out at the predator with their thick
muscular spiked tails (Marais 1984, Fogel 2000, Losos et al. 2002).
Distribution
Smaug giganteus is endemic to the Highveld grasslands of the northern Free State and southern
Mpumalanga provinces of South Africa, forming two geographically disjunct populations (Fig. 1.1).
The species has previously been reported to occur in the KwaZulu-Natal Province (Bourquin 1993,
2004, Lambiris and Bourquin 1993), but Armstrong (2011) suggests that this is incorrect.
Furthermore, Armstrong (2011) reported that records of S. giganteus in KwaZulu-Natal were the
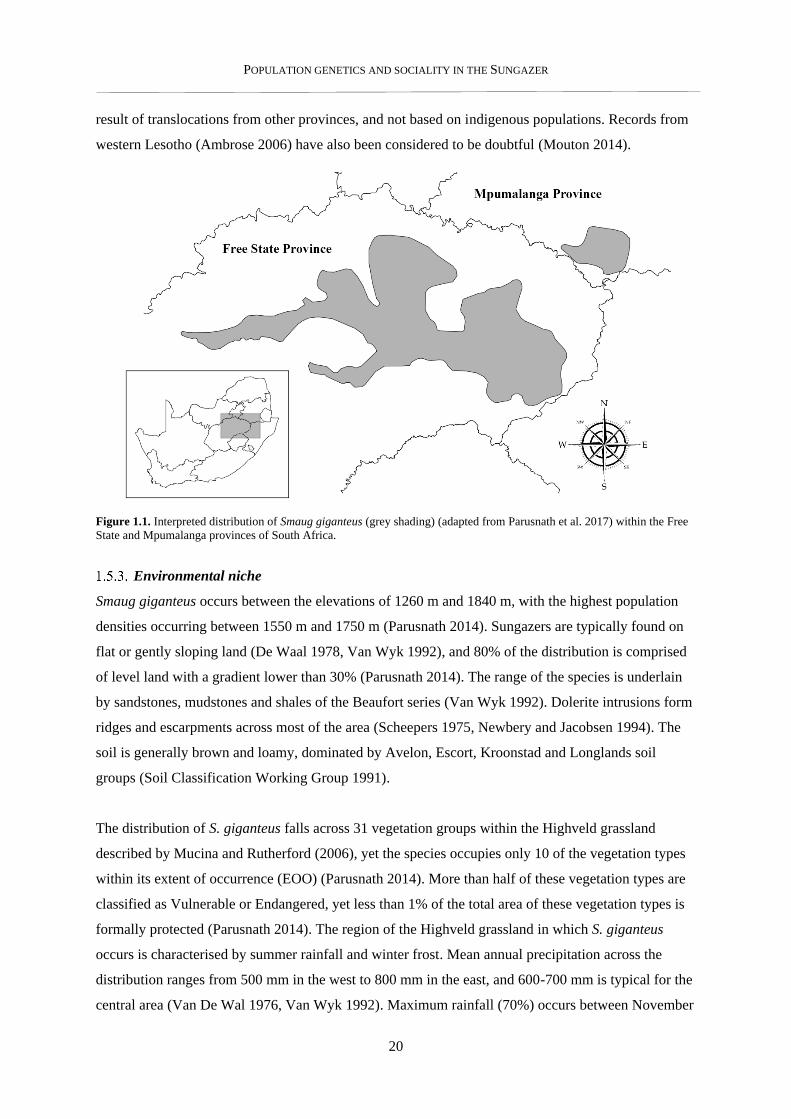
POPULATION GENETICS AND SOCIALITY IN THE SUNGAZER
20
result of translocations from other provinces, and not based on indigenous populations. Records from
western Lesotho (Ambrose 2006) have also been considered to be doubtful (Mouton 2014).
Figure 1.1. Interpreted distribution of Smaug giganteus (grey shading) (adapted from Parusnath et al. 2017) within the Free
State and Mpumalanga provinces of South Africa.
Environmental niche
Smaug giganteus occurs between the elevations of 1260 m and 1840 m, with the highest population
densities occurring between 1550 m and 1750 m (Parusnath 2014). Sungazers are typically found on
flat or gently sloping land (De Waal 1978, Van Wyk 1992), and 80% of the distribution is comprised
of level land with a gradient lower than 30% (Parusnath 2014). The range of the species is underlain
by sandstones, mudstones and shales of the Beaufort series (Van Wyk 1992). Dolerite intrusions form
ridges and escarpments across most of the area (Scheepers 1975, Newbery and Jacobsen 1994). The
soil is generally brown and loamy, dominated by Avelon, Escort, Kroonstad and Longlands soil
groups (Soil Classification Working Group 1991).
The distribution of S. giganteus falls across 31 vegetation groups within the Highveld grassland
described by Mucina and Rutherford (2006), yet the species occupies only 10 of the vegetation types
within its extent of occurrence (EOO) (Parusnath 2014). More than half of these vegetation types are
classified as Vulnerable or Endangered, yet less than 1% of the total area of these vegetation types is
formally protected (Parusnath 2014). The region of the Highveld grassland in which S. giganteus
occurs is characterised by summer rainfall and winter frost. Mean annual precipitation across the
distribution ranges from 500 mm in the west to 800 mm in the east, and 600-700 mm is typical for the
central area (Van De Wal 1976, Van Wyk 1992). Maximum rainfall (70%) occurs between November
POPULATION GENETICS AND SOCIALITY IN THE SUNGAZER
21
and March (Van Wyk 1992). Mean temperature ranges from 18 °C in the east to 24 °C in the west
during austral summer (January), from 7 °C in the east to 9 °C in the west during austral winter (July)
(Van Wyk 1992).
Life-history
Sungazers are visually-orientated, extreme ambush (sit-and-wait) foragers (Jacobsen 1989, Perry
1995, Cooper et al. 1997, Van Wyk 2000). The majority of feeding behaviour occurs near the
entrance of the burrow that the lizard occupies, seldom venturing further than a few metres from the
burrow to capture a prey item. They feed during eight months of the year (September – April), with
Coleoptera, Diplopoda, Hemiptera, Hymenoptera, Orthoptera, and Lepidoptera making up the six
major taxa present in their diet (Van Wyk 2000). Cannibalism of neonates of conspecific females has
been recorded in wild (Van Wyk 1992, 2000) and captive (Marais 1984) Sungazers.
Sungazers are active from austral spring to austral autumn and appear to brumate in their burrows
during the winter period (De Waal 1978, Van Wyk 1988). Breeding is seasonal, although females
only reproduce every two or three years, depending on resource availability (Van Wyk 1992).
Reproducing females generally give birth to 1-3 live young in the austral autumn (Van Wyk 1992).
Males and females reach sexual maturity at four to five years of age, at an average SVL of 165 mm
(Van Wyk 1992). Growth is relatively slow and lizards may only reach maximum length in their
eleventh year (Van Wyk 1992). Longevity records for Sungazers in captivity show that they can live
for up to 25 years (HAGR, 2014). Anecdotal observations from various landowners, some of whom
have kept Sungazers in enclosures in the natural environment within the distribution of the species,
have claimed maximum longevity of 35 years. The slow reproductive rate, age to maturity and long
lifespan are typical of a K-selection life-history strategy (MacArthur and Wilson 1967, Van Wyk
1992).
Threats
1.5.5.1. Habitat transformation
Just over forty percent of the primary grassland within the distribution of S. giganteus has been
transformed, predominantly for crop farming (Parusnath et al. 2017). Although Branch and Patterson
(1975) noted that Sungazer burrows reach a depth that would leave them unharmed during ploughing,
this is unlikely to be the case since the burrows tend to extend only 50 cm below ground level (Van
Wyk 1992). Branch and Patterson (1975) suggested that Sungazers might migrate into fallow fields,
but this is also unlikely to be true since there has been no evidence of Sungazer colonies inhabiting
anything other than primary grassland. Crop farming is regarded as an irreversible loss of habitat for
the species (Van Wyk 1992). Additionally, many Sungazer colonies and pristine grassland have been
POPULATION GENETICS AND SOCIALITY IN THE SUNGAZER
22
lost to the development of roads, urban built-up areas, plantations and artificial water bodies (Van
Wyk 1992, Parusnath et al. 2017). As a result, 48% of the original population of the species has been
lost due to habitat loss, and at least 39% of the remaining population lost due to the effects of habitat
fragmentation and illegal harvesting (Parusnath et al. 2017).
Translocation attempts to relocate Sungazers from areas marked for development have been largely
unsuccessful (Groenewald 1992). Groenewald (1992) reported that burrow occupancy rates as low as
10% were reported 49 days after a population of Sungazers were translocated to the Golden Gate
Highlands National Park. It was argued that this was due to predation by Yellow Mongoose (Cynictis
penicillata), Suricate (Suricata suricatta) and Secretary Bird (Sagittarius serpentarius), but is also
likely to be a result of the lizards not having suitable burrows in which to live. This latter contention is
supported by the fact that lizards generally did not make use of the artificial burrows created for them
with soil augers and travelled as far as 1000 m from the initial point of translocation (Groenewald,
1992), exposing themselves to predation. Although formal scientific studies have not been conducted
on the Golden Gate Highlands National Park since 1992, it is estimated that less than 2% of
Sungazers survived the translocation over the next two years (Groenewald, pers. comm.).
1.5.5.2. Illegal harvesting for the pet trade
Sungazers have been recorded in the international pet trade since at least 1897 (Bateman 1897) and
the species remains popular and highly sought after in the trade to this day (Auliya et al. 2016,
Parusnath et al. 2017). Species such as S. giganteus that have a restricted distribution, low
reproductive rate and high level of protection are uncommon in the reptile pet trade and command
premium prices due to their high demand (Böhm et al. 2013, Auliya et al. 2016). The high prices
demanded for Sungazers serve as an incentive for their illegal capture and exportation (Wulf Haacke
pers. comm. in McLachlan 1978, Van Wyk 1988, Auliya 2003), with cases of poaching for the
European and American trades being reported since the 1970s (Branch 1988, Van Wyk 1988).
Concerns about the effects of over collection of Sungazers for the pet trade led to the announcement
of a total ban on exports of Smaug giganteus (previously Cordylus giganteus) from South Africa
(TRAFFIC 1980). This ban was not enforced, although the species was listed on CITES Appendix II
in 1981 (UNEP 2020), and permits for the export of Sungazers are supposedly strictly regulated and
issued only under exceptional circumstances (Branch 1990).
Despite these efforts to restrict the exportation of wild-caught Sungazers, large numbers of individuals
have been exported from South Africa in the subsequent four decades (Parusnath et al. 2017). Japan,
the United States of America and Germany are the primary import countries of Sungazers,
collectively making up 74.8% of imports over the past three decades (Parusnath et al. 2017). The vast
POPULATION GENETICS AND SOCIALITY IN THE SUNGAZER
23
majority of these Sungazers are reported as produced in captivity, although no verified Sungazer
breeding facilities exist in South Africa or elsewhere in the world to supply these numbers (Loehr et
al. 2016). It is therefore widely suspected that the vast majority of Sungazers that leave South Africa
are in fact wild-caught individuals that have been laundered as captive-bred (Loehr et al. 2016, Auliya
et al. 2016, Parusnath et al. 2017).
In response to concerns that excessive poaching of Sungazers for the pet trade may be affecting
population declines in the species, a non-detriment finding (NDF) was conducted by the Scientific
Authority of South Africa in 2015 (SANBI 2015). The Scientific Authority concluded that harvest of
wild Sungazers for the pet trade would be detrimental to the species’ longevity in the wild, based on
its threatened status, level of population and habitat decline, slow reproductive rate, and low fecundity
(SANBI 2015). The ratification of this NDF by the Scientific Authority mandated the CITES
recommendation that S. giganteus may only be exported from South Africa if individuals are F2
generation captive bred. Application for CITES permits to export S. giganteus from South Africa have
since required verification of F2 captive breeding, and to my knowledge, no permits of this nature
have been granted since 2015. Sungazers still regularly appear for sale in the trade (Auliya et al. 2016,
pers. obs.), and it is unclear whether these are individuals that were exported prior to 2015, or
individuals that have been smuggled out of the country since. Sungazers have been found in the
luggage of European nationals travelling back from South Africa as recently as 2016 (Dutch News
2016).
1.5.5.3. Illegal harvesting for indigenous traditional medicine
Sungazers have historically been harvested for use in traditional Sotho and Zulu medicine across the
distribution of the species (Petersen et al. 1985). They are purchased by Sangomas (witch-doctors)
who powder dried Sungazer carcasses to make potions that purportedly allow a man to achieve
harmonious consent from his wife or girlfriend to have multiple partners (pers. obs., Peterson et al.,
1985). These potions are sold in small quantities (50 g) and sell for R200 per ‘treatment’. McLachlan
(1978) reported that three collectors have been known to collect 200 Sungazers in a day. In an
investigation of use of animal parts in traditional medicine Cunningham and Zondi (1991) noted that
the traditional medicinal trade in South Africa presented a major threat to S. giganteus. Ngwenya
(2001) subsequently reported that few traders in KwaZulu-Natal Province (outside the range of the
species, but historically known to utilise it) mentioned the use of the species, but did note that it was
in high demand. Ngwenya (2001) concluded however, that this trade could pose a problem to the
conservation of the species, given its restricted geographical distribution and threats posed by habitat
destruction.
POPULATION GENETICS AND SOCIALITY IN THE SUNGAZER
24
In recent times however, Sungazers have been found in traditional medicine markets outside of the
distribution of the species, in the neighbouring provinces of KwaZulu-Natal and Gauteng (pers. obs.,
Whiting et al. 2013). Whiting et al. (2013) found that 21.9% of traders at the Faraday market in
Johannesburg, (South Africa’s second largest traditional medicine market; at least 100km from the
closest Sungazer population) had cordylid species for sale. Five traders were recorded selling
Sungazer body parts and whole Sungazers, and recently killed Sungazers were observed on sale.
Quantifying the large-scale effects of harvesting of Sungazers for the traditional medicine trade is
difficult because of the unwillingness of traders to reveal the sources of their stock, and the turnover
rate of lizards (Whiting et al. 2013). The plight of the Sungazer is exacerbated by the fact that females
breed only biennially or triennially, depending on resource availability (Van Wyk 1992). McKinney
(1997) suggests that species with these life-history characteristics are the most at risk from
unsustainable harvesting.
Conservation status
Smaug giganteus was first classified as Vulnerable in the first South African Red Data Book -
Amphibians and Reptile (RDB-AR) McLachlan (1978), due to the scale of habitat destruction across
the distribution of the species, collection of animals for the pet trade, and for use in laboratory
dissections. The status was retained in the subsequent RDB-AR (Van Wyk 1988), chiefly because the
reassessment was based on the original data with few additions (Van Wyk 1992). The species has
since been re-listed as Vulnerable in the first assessment for the IUCN Red Data List (Groombridge
1994), and a subsequent update (Baillie and Groombridge 1996), based on criteria A2cd (suspected >
30% population reduction in the past three generations based on habitat quality and actual or potential
levels of exploitation; IUCN 2001 Red Data List Category and Criteria Version: 2.3). The
conservation status of the species was reassessed in the Atlas and Red Data List of the Reptiles of
South Africa, Lesotho and Swaziland (Mouton 2014), and the Vulnerable status for the species based
on a population reduction of 30% over the last 27 years, was inferred from habitat destruction across
the Grassland Biome.
A comprehensive conservation assessment of the species by Parusnath et al. (2017) classified the
species as Vulnerable under IUCN Red List Criteria A2acd and B2ab (ii–v), based on the small AOO
(1 149 km2), population decline of 39 % over three generations, irreversible impact of habitat
transformation, and the perceived level of exploitation for the pet trade. Under new IUCN Red List
Categories and Criteria: Version 3.1 (IUCN 2012), this assessment was reclassified as Vulnerable
under IUCN Red List Criteria A2bcd and 4bcd (Alexander et al. 2018). Although the species has
retained its Vulnerable classification since the original assessment in 1978 (McLachlan 1978), the
threats that face the species have now been quantified empirically (Parusnath et al. 2017). If current
POPULATION GENETICS AND SOCIALITY IN THE SUNGAZER
25
trends in habitat loss and fragmentation continue, S. giganteus may reach the Endangered category by
~ 2050 (Parusnath 2014)
1.6. The history of research on Smaug giganteus
The Sungazer is an iconic species in South Africa. Its charismatic appearance, threat status, and
unique morphology and habitat within the Cordylidae family have made it a popular study species
over the last half century. Subsequent to the description of the species description in 1844 by Andrew
Smith, the primary body of research on S. giganteus related to quantifying its distribution (De Waal
1978, Jacobsen 1989), and minor observations on the ecology and behaviour of the species (Branch
and Patterson 1975, Marais 1984). The conservation concerns of the species were highlighted early on
in the development plan for the conservation of South African reptiles and amphibians (McLachlan
1978, Van Wyk 1988, Dodd Jr 1989), and was classified as Vulnerable in its first International Union
for Conservation of Nature (IUCN) Red List assessment (McLachlan 1978).
Large-scale land transformation for the construction of power stations within the distribution of the
species in the 1980s necessitated the translocation of thousands of Sungazers to new areas. The
process of excavating Sungazers burrows provided opportunities to assess several aspects of the
species ecology for the first time (Petersen et al. 1985, Jacobsen et al. 1990, Groenewald 1992).
Although the translocation attempts proved to be largely unsuccessful long term, the first records of
Sungazer burrow density, burrow occupancy, and population demographics were established.
The first significant body of comprehensive research on S. giganteus was by Hannes Van Wyk in the
late 1980s and early 1990s. His doctoral thesis (Van Wyk 1992) and subsequent publications (Van
Wyk 1991, 1994, 1995, 2000) on the life history and physiology of S. giganteus were seminal to our
current understanding of the species. Through Van Wyk’s research, the feeding ecology, male and
female reproductive systems and cycles, growth rates, population dynamics, and thermoregulatory
physiology were detailed for the first time. Following on from Van Wyk’s observational studies on
Sungazer behaviour, Ruddock (2000) investigated aspects of the social structure of the Sungazer. In
particular, Ruddock reported on the movement and interactions between wild-living Sungazers, the
chemical composition of their generation glands, and behavioural responses of individuals to the
chemical signal of their own glands, and those of their conspecifics. The body of work produced by
Van Wyk and Ruddock continues to be highly influential to researchers to this day.
Concerns over the species longevity in the wild as a result of habitat transformation prompted more
conservation driven research. McIntyre (2006) investigated the effects of heavy metals on the
physiology of Sungazers in mining areas, and found that Sungazers in areas characterised by mining
POPULATION GENETICS AND SOCIALITY IN THE SUNGAZER
26
runoff had poorer body conditions and skewed sex ratios compared to Sungazers in undisturbed areas.
Parusnath (2014) conducted a comprehensive conservation assessment for the species, amid concerns
that no new empirical evidence on changes in Sungazer populations and habitat had been collected
since the initial assessment in 1978 (McLachlan 1978). The species retained its Vulnerable status in
this assessment, but empirical evidence of the threats facing the species through habitat loss and
poaching for the pet trade was quantified for the first time.
Over the past decade, a plethora of studies focused on the Sungazer and its family have produced an
updated phylogeny of the Cordylidae (Stanley et al. 2011), insight into the evolution of body armour
(Broeckhoven et al. 2015, 2017, 2018), non-invasive methods for monitoring stress (Scheun et al.
2018), thermoregulatory behaviour (Stanton-Jones et al. 2018), a system for remote monitoring of
Sungazer activity patterns (Stanton-Jones 2018), and further investigation of the enlarged generation
glands in the species (Louw et al. 2007, 2011, Mouton et al. 2014a, 2018).
Despite the significant body of work on this species, several key questions about the evolution,
ecology, and social system of S. giganteus remain unanswered. The limited use of molecular
techniques in investigating these aspects of the species has meant that the genetic structure of
Sungazer colonies and populations across the landscape are unstudied. This precludes us from
understanding how the species utilises its landscapes, and the processes that drive the formation and
maintenance of genetic populations. The lack of use of genetic tools has also precluded empirical
investigations of the complex social structure that appears to be present in the species. The research in
my thesis aims to address these gaps in our knowledge of the species. Although I do not claim to
definitively put these topics to rest, I hope that like the seminal studies on S. giganteus before me, my
research can contribute to solving a part of the complex puzzle of the biology of the Sungazer.
POPULATION GENETICS AND SOCIALITY IN THE SUNGAZER
27
CHAPTER 2
DEVELOPMENT OF MICROSATELLITE LOCI FOR THE SUNGAZER (SMAUG GIGANTEUS),
AND THE EFFICACY OF NON-INVASIVE SAMPLING
2.1. Introduction
Genetic studies of species-level systematics and population structure can employ a wide array of
molecular tools depending on the scale and scope of the investigation. Modern genetic markers can be
used to examine genetic structure and diversity of a species at many resolutions – from characterising
and identifying individuals and the relatedness between individuals, gene flow within and between
populations, to the phylogenetic relationships of divergent clades. The integrative use of molecular
markers that evolve at different rates over time can provide insight into the temporal changes in
genetic structure of a species and its populations through its history of vicariance and dispersal events.
Mutations occur 10-20 faster in mitochondrial genes than in nuclear genes (Vawter and Brown 1986,
Firth and Hurst 2017), and conserved nuclear genes are therefore utilised when older relationships
between genetic populations or clades are suspected (Zhang and Hewitt 1996, Lin and Danforth
2004), whereas mitochondrial genes are used for resolving younger evolutionary relationships.
However, for more contemporary, fine-scale investigations of genetic patters, more rapidly evolving
markers are required (Beaumont 1999, Schlotterer 2000, Vieira et al. 2016). Polymorphic
microsatellite markers have emerged as one of the most ubiquitous genetic markers over the past two
decades due to the declining costs of developing species-specific marker sets, and their power in
detecting contemporary genetic patterns (Ellegren 2004, Selkoe and Toonen 2006, Guichoux et al.
2011).
Microsatellites are short tandem repeats of nucleotide DNA motifs that are 1-6 base pairs in length
(Wright and Bentzen 1994). These regions have high mutation rates due to polymerase slippage, and
since mutations are heritable between generations, analyses of relatedness between individuals and
populations are possible at a fine-scale (Ellegren 2004). Microsatellites have therefore been employed
for myriad uses in studies of population and social structure: investigations of fine-scale genetic
structure and connectivity between populations (Fredsted et al. 2005, Wiens et al. 2010, Ribout et al.
2019), relatedness between individuals (Blouin et al. 1996, Van De Casteele et al. 2001, Wagner et al.
2006), parentage analysis (Dakin and Avise 2004, Hodel et al. 2016, Flanagan and Jones 2019) and
elucidating evidence of genetic structure resulting from human-mediated landscape changes
(Cunningham and Moritz 1998, Moore et al. 2008, Goossens et al. 2016). Microsatellites have also
found important use in wildlife trades matters: assessing parentage to confirm multigenerational
captive breeding for CITES listed species (Lyons and Natusch 2011, Hogg et al. 2018), isolating the
geographic origin of confiscated animals or animals products, and identifying poaching hotspots in
POPULATION GENETICS AND SOCIALITY IN THE SUNGAZER
28
threatened species (Mondol et al. 2015, Ogden and Linacre 2015, Wasser et al. 2015). Since
microsatellites are also effective when used with low amounts of DNA (Beebee 2008, Ford et al.
2016), they are ideal markers in studies where high-quality samples are difficult to obtain.
Genetic studies on reptiles have typically relied on the collection of blood, tissue clippings (e.g. scale,
toe, or tail clips), or whole animals (Beebee 2008, Herrel et al. 2012, Maigret 2019) for genetic source
material. Although these tissue collection techniques tend to provide large quantities of high-quality
DNA, the collection of tissue samples directly from live animals can be technically and logistically
challenging, and carry ethical and animal welfare concerns (Parris et al. 2010, McMahon et al. 2012,
Lefort et al. 2019). Drawing blood from the caudal vein of reptiles for example yields large quantities
of pure DNA, but can result in damage to muscles and the spinal cord if done improperly (Prival
2015). The effects of toe-clipping in reptiles varies amongst species, with no significant effects
observed in some (Hudson 1996, Paulissen and Meyer 2000, Borges-Landáez and Shine 2003) but
reduced mobility and lower survival rates resulting in others ( Bloch and Irschick 2005, Olivera-
Tlahuel et al. 2017).The collection of whole animals as specimens can provide a multitude of uses,
since the specimen can be deposited in museum collections for additional uses after tissue material
has been collected for genetic analysis (Rocha et al. 2014). This practise is ideally avoided however,
(Taberlet et al. 1999, Powell and Proulx 2003, Pauli et al. 2010, Smith and Wang 2014) particularly
when working with species of elevated conservation status (Russo et al. 2017) since wanton collection
of individuals may lead to local extirpation or extinction (Norton et al. 1994, Rodríguez-Estrella and
Moreno 2006, Tournant et al. 2012).
Genetic research using non-invasive sampling has become more commonplace over the last two
decade, as less harmful and invasive approaches have been tested and utilised in mainstream research
(Jones et al. 2008, Ruiz-González et al. 2013, Du Toit et al. 2017, Antognazza et al. 2019). Methods
of DNA collection are defined as non-invasive if “the source of the DNA is left behind by the animal
and can be collected without having to catch or disturb the animal” (Taberlet and Luikart 1999,
Taberlet et al. 1999). Non-invasive sampling typically involves the collection of material such as
faeces, hair, or feathers (Piggott and Taylor 2003, Russello et al. 2015, Lefort et al. 2019). Since the
animal does not need to be captured to be sampled, it is possible to collect a higher number of non-
invasive samples if the material is ubiquitous and easy to find, thereby also potentially reducing
sampling costs (Pearson et al. 2014, Russello et al. 2015, Andrews et al. 2018). In reptiles, non-
invasive sampling is facilitated primarily through the collection of shed skin. DNA derived from the
shed skin of lizards and snakes has been proven to be of sufficient quality and quantity for polymerase
chain reaction (PCR) based genotyping (Bricker et al. 1996, Clark 1998, Fetzner 1999, Horreo et al.
2015, Tawichasri et al. 2017).
POPULATION GENETICS AND SOCIALITY IN THE SUNGAZER
29
While there are merits to employing non-invasive sampling, the use of these samples in population
genetic studies can also present challenges (Russello et al. 2015, Andrews et al. 2018). For example,
unless the sample has been retrieved directly from an animal, the genetic sample cannot be linked to a
particular individual. This may not necessarily present a problem for many types of genetic studies –
for instance when investigating wide-scale genetic structure of a species or population – but can be
problematic when trying assess the relatedness between the individuals in a population. Non-invasive
samples may also provide DNA of poor quality and lower quantity relative to more traditional starting
materials such as tail clippings or blood. DNA in non-invasive samples begins to degrade shortly after
the material is deposited into the environment, typically due to exposure to high temperatures,
moisture and UV radiation. This can result in lower DNA yields and fragmentation of template DNA
from these samples (Poinar et al. 1996, Jones et al. 2008), and ultimately lower success rates in
downstream laboratory protocols (Brinkman et al. 2010, Demay et al. 2013, Lonsinger et al. 2015).
Degradation may also be exacerbated by improper storage after collection, since the enzymes that
catalyse the degradation of DNA continue to operate if steps are not taken to inhibit them (Seutin et
al. 1991, Murphy et al. 2002, Roeder et al. 2004). Testing the efficacy of non-invasive samples in
downstream laboratory applications is therefore imperative on a per species basis, since the quantity
and quality of different sizes and forms of samples such as shed skins are likely to differ between
species.
The Sungazer (Smaug giganteus) is a Vulnerable (Alexander et al. 2018), CITES Appendix II (UNEP
2020) listed species of cordylid lizard endemic to the Highveld grasslands of South Africa (De Waal
1978, Jacobsen 1989). The taxonomic status of S. giganteus within its genus and family has been
detailed using mitochondrial and nuclear gene sequences (Stanley et al. 2011, Stanley 2013), however
studies of fine-scale population genetic structure in the species have been precluded because of the
lack of availability of rapidly evolving genetic markers. Aside from understanding of how various
natural and anthropogenic landscape features influence gene flow between Sungazer populations,
insight into the genetic structure of populations would also prove important in considering effective
conservation managements for this threatened species (Segelbacher et al. 2010, Keller et al. 2015).
The lack of such genetic markers has also impeded empirical studies on sociality in the species
(Gardner et al. 2016, Whiting and While 2017). Adult Sungazers are often seen sharing burrows with
juveniles, although the relatedness of these interactions are unknown. Similarly, the colonies that
Sungazers live in appear to be spatially discrete from other colonies, and the familial nature of these
groups remain uncertain. Finally, as a CITES Appendix II listed species, only F2 generation captive-
bred Sungazers should be exported from South Africa. Without genetic markers available to conduct
relatedness analyses, hundreds of wild-caught Sungazers are believed to have been exported from
South Africa falsely labelled as captive-bred individuals (Loehr et al. 2016, Auliya et al. 2016).
POPULATION GENETICS AND SOCIALITY IN THE SUNGAZER
30
The primary aim of this chapter was to develop and test a suite of species-specific polymorphic
microsatellite markers for S. giganteus for use in studies of contemporary population genetic
structure, fine-scale social structure, and verification of F2 generation captive breeding in the species.
Since S. giganteus is a Vulnerable species with declining populations (Parusnath et al. 2017), non-
invasive tissue sampling might prove to be an effective approach in rapidly collecting tissue samples
from wild living Sungazers with minimal disturbance, stress or mortality to individuals. I tested the
feasibility of utilising shed skin samples collected from their burrows in genetic research. I quantified
and compared the quantity and purity of blood, tail clippings, and shed skin samples, and their relative
success rates in microsatellite profiling. Since shed skin samples were collected over a long period of
time and varied in the period of time in which they were stored before processing, I also compared the
success rates of shed skins in microsatellite profiling after 12, 28, 20, and 22 months of storage.
2.2. Materials and methods
Microsatellite primer development
Blood samples were collected from two captive Sungazers at the National Zoological Gardens by a
veterinarian. These samples were used to prepare a microsatellite enriched library by following the
fast isolation by Amplified Fragment Length Polymorphisms (AFLPs) of sequencing containing
repeats (FIASCO) protocol (Zane et al. 2002) using the probes: (AGGG)4, (GTG)5, (GTA)5, (AC)5,
(AAAT)5, (ATA) 5, (CT)5, and (TGC)5. The microsatellite enriched library was then sequenced on the
Illumina HiSeq2500 ® platform by Inqaba Biotech (Pretoria, Gauteng, South Africa), generating 6 357
278 paired reads. The enriched DNA was pooled and end repaired, and Illumina compatible adapters
were ligated to all fragments. The sample was indexed and size selected using AMPure XP magnetic-
bead purification (Agencourt Bioscience, Beverly, USA). The sample was quantified using a
NanoDropTM 3300 Fluorospectrometer (ThermoFisher, Waltham, MA, USA) and the fragment
distribution was checked on an Agilent 2100 BioAnalyzer (Agilent, Santa Clara, USA). The library
was sequenced on Illumina’s® MiSeq platform, following the standard manufacturer’s protocol. A
600-cycle kit was used to generate 2GB of 2x300 base pair (bp) paired end reads. I searched the
resulting reads for microsatellite motifs between 2 and 6 bp and ≥ 8 repeats in length using
MSATCOMMANDER 1.0.8 (Faircloth 2008), and identified a total of 65 536 reads containing
microsatellite repeats. I designed primers using PRIMER3 0.4.0 (http://frodo.wi.mit.edu/primer3/;
Koressaar and Remm 2007, Untergasser et al. 2012) to amplify a target region of ~250 bp including
both primers, with an optimal primer length of 20 bp (range of 18-22 bp), and optimal melting
temperature of 60 °C (range of 58-62 °C).
POPULATION GENETICS AND SOCIALITY IN THE SUNGAZER
31
I tested and optimised 40 microsatellite primer pairs on blood samples collected from 28 captive
Sungazers by a veterinarian at a private facility in South Africa. I extracted DNA using the ZR
Genomic DNA II Kit (Zymo Research) following the standard protocol for blood and hair samples.
Polymerase chain reaction amplification was conducted using a 25 μl reaction volume consisting of
12.5 μl Invitrogen Platinum Taq Mastermix (Invitrogen Life Technologies), 2.5 μl Invitrogen GC
Enhancer, 2.5 μl bovine serum albumin (BSA), 4 μl ddH2O, 0.5 μl of forward and reverse primers,
and 2.5 μl (~50 ng) genomic DNA. Polymerase chain reaction amplification was conducted under the
following conditions: denaturation for 2 min at 95 °C, 30 cycles for 30 s at 95 °C, 30 s at 50 °C and 1
min at 72 °C, extension at 72 °C for 40 min, in a T100TM Thermal Cycler (Bio-Rad Laboratories). I
pooled and analysed PCR products on an ABI 3130 Genetic Analyzer (Applied Biosystems Inc.),
using GenescanTM 500 LIZ® as a size standard. Samples were genotyped using GENEMAPPER 4.0
(Applied Biosystems Inc.) and the incidence of genotyping errors, allele dropout and null alleles were
assessed using MICRO-CHECKER 2.2.3 (Van Oosterhout et al. 2004). The number of alleles per locus,
observed heterozygosity (Ho) and expected heterozygosity (He) were calculated with GENALEX 6.5
(Peakall and Smouse 2006, 2012), while deviations from Hardy-Weinberg (HW) proportions and
gametic disequilibrium in loci were tested for using GENEPOP 4.2 (Rousset 2008). I corrected
probability values for multiple comparisons using Bonferroni adjustment for a significance level of
0.05.
Testing suitability of tissue types for downstream applications
I collected shed skin samples (n = 298) and tail clippings (n = 168) from Sungazers in 69 colonies
across the distribution of the species between March 2012 and March 2018 (Fig. 2.1). Shed skin
samples were collected from the area surrounding the entrance of Sungazer burrows, and kept dry in
1.5 ml Eppendorf tubes (Eppendorf GmbH, Hamburg, Germany) following Fetzner (1999). For tail
clippings, I captured Sungazers using standard noosing techniques (Van Wyk 1992, McIntyre and
Whiting 2012) and clipped ~3 mm sections of tissue from the large caudal spines of adults, or the
terminal tail scute in juveniles with a nail clipper. Tail clippings were stored in 99% ethanol in 1.8 ml
Nunc™ Cryogenic Tubes (ThermoFisher, Waltham, MA, USA. The area of incision on the caudal
spines were disinfected with F10SC Veterinary Disinfectant spray (Health and Hygiene (Pty) Ltd.,
South Africa) before clipping the spine, and F10 Germicidal Barrier Ointment (Health and Hygiene
(Pty) Ltd., South Africa) afterwards, before releasing the animal at the burrow it was captured from.
Blood samples (n = 28) were collected from captive Sungazers at a private facility in South Africa by
a veterinarian. Blood samples were collected from the caudal vein of Sungazers using a 23 gauge
needle and 5 ml syringe, and then stored in BD Vacutainer® tubes (BD Vacutainer Systems, Becton
Dickinson and Company, Franklin Lakes, NJ) containing an anticoagulant
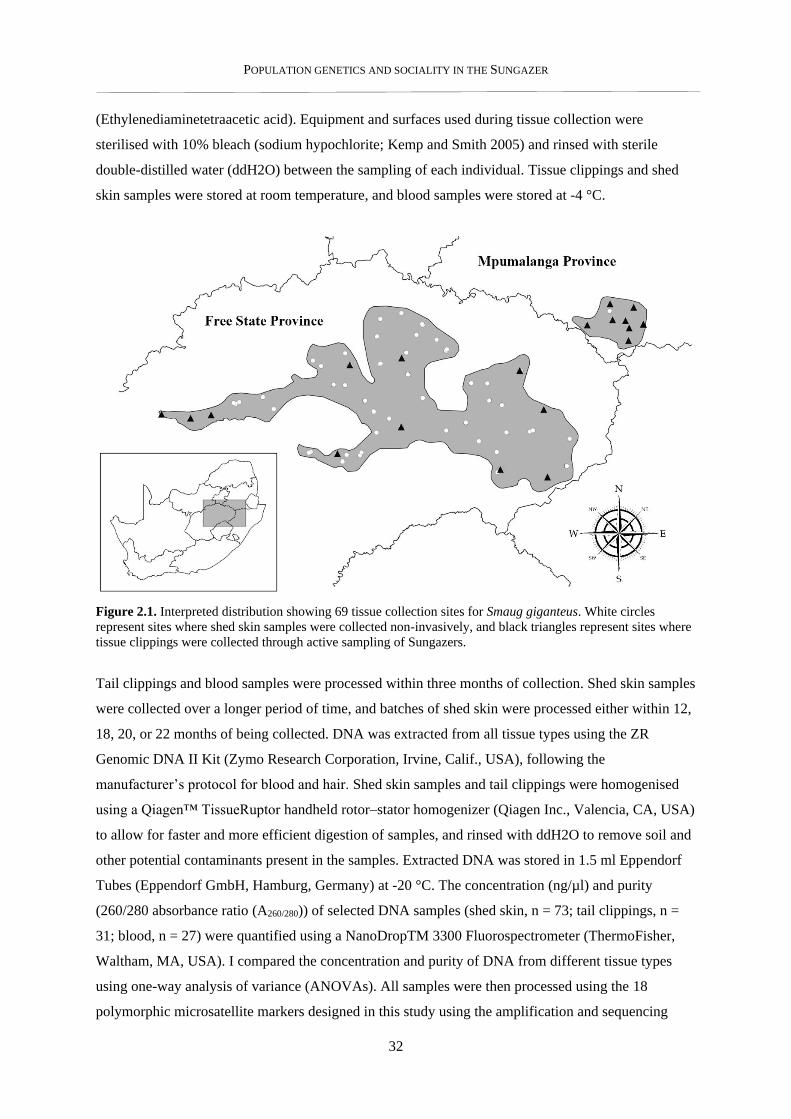
POPULATION GENETICS AND SOCIALITY IN THE SUNGAZER
32
(Ethylenediaminetetraacetic acid). Equipment and surfaces used during tissue collection were
sterilised with 10% bleach (sodium hypochlorite; Kemp and Smith 2005) and rinsed with sterile
double-distilled water (ddH2O) between the sampling of each individual. Tissue clippings and shed
skin samples were stored at room temperature, and blood samples were stored at -4 °C.
Figure 2.1. Interpreted distribution showing 69 tissue collection sites for Smaug giganteus. White circles
represent sites where shed skin samples were collected non-invasively, and black triangles represent sites where
tissue clippings were collected through active sampling of Sungazers.
Tail clippings and blood samples were processed within three months of collection. Shed skin samples
were collected over a longer period of time, and batches of shed skin were processed either within 12,
18, 20, or 22 months of being collected. DNA was extracted from all tissue types using the ZR
Genomic DNA II Kit (Zymo Research Corporation, Irvine, Calif., USA), following the
manufacturer’s protocol for blood and hair. Shed skin samples and tail clippings were homogenised
using a Qiagen™ TissueRuptor handheld rotor–stator homogenizer (Qiagen Inc., Valencia, CA, USA)
to allow for faster and more efficient digestion of samples, and rinsed with ddH2O to remove soil and
other potential contaminants present in the samples. Extracted DNA was stored in 1.5 ml Eppendorf
Tubes (Eppendorf GmbH, Hamburg, Germany) at -20 °C. The concentration (ng/µl) and purity
(260/280 absorbance ratio (A260/280)) of selected DNA samples (shed skin, n = 73; tail clippings, n =
31; blood, n = 27) were quantified using a NanoDropTM 3300 Fluorospectrometer (ThermoFisher,
Waltham, MA, USA). I compared the concentration and purity of DNA from different tissue types
using one-way analysis of variance (ANOVAs). All samples were then processed using the 18
polymorphic microsatellite markers designed in this study using the amplification and sequencing
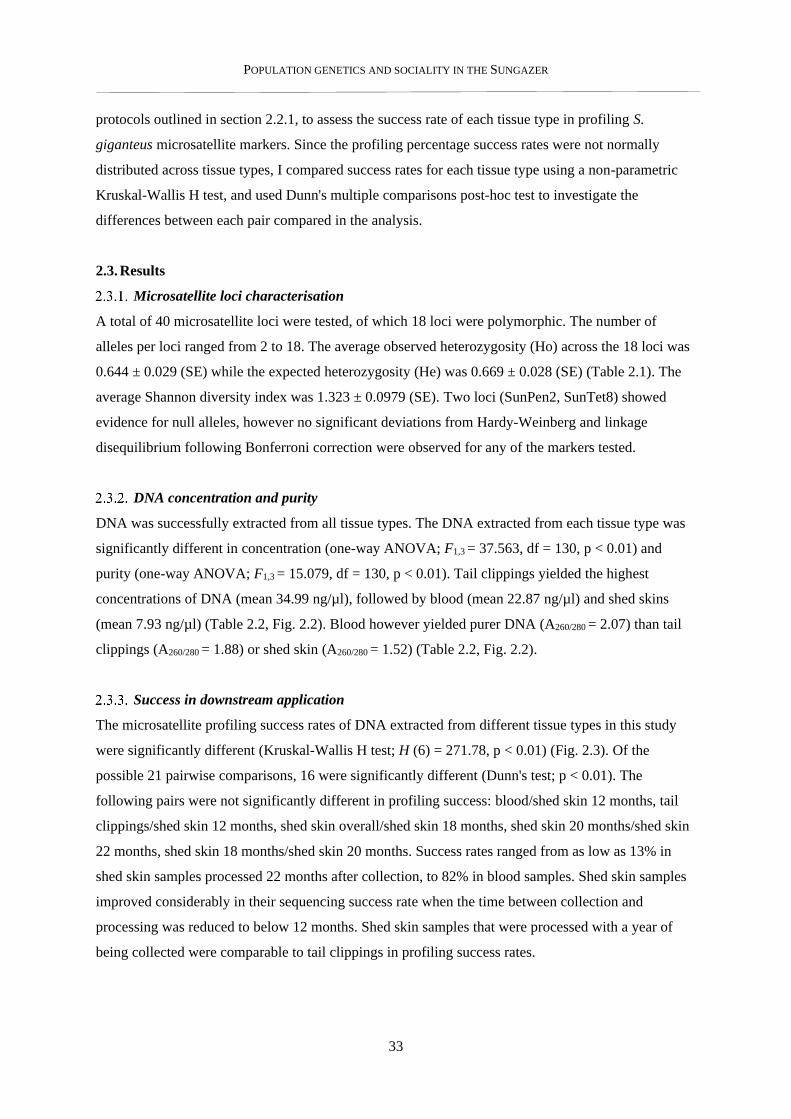
POPULATION GENETICS AND SOCIALITY IN THE SUNGAZER
33
protocols outlined in section 2.2.1, to assess the success rate of each tissue type in profiling S.
giganteus microsatellite markers. Since the profiling percentage success rates were not normally
distributed across tissue types, I compared success rates for each tissue type using a non-parametric
Kruskal-Wallis H test, and used Dunn's multiple comparisons post-hoc test to investigate the
differences between each pair compared in the analysis.
2.3. Results
Microsatellite loci characterisation
A total of 40 microsatellite loci were tested, of which 18 loci were polymorphic. The number of
alleles per loci ranged from 2 to 18. The average observed heterozygosity (Ho) across the 18 loci was
0.644 ± 0.029 (SE) while the expected heterozygosity (He) was 0.669 ± 0.028 (SE) (Table 2.1). The
average Shannon diversity index was 1.323 ± 0.0979 (SE). Two loci (SunPen2, SunTet8) showed
evidence for null alleles, however no significant deviations from Hardy-Weinberg and linkage
disequilibrium following Bonferroni correction were observed for any of the markers tested.
DNA concentration and purity
DNA was successfully extracted from all tissue types. The DNA extracted from each tissue type was
significantly different in concentration (one-way ANOVA; F1,3 = 37.563, df = 130, p < 0.01) and
purity (one-way ANOVA; F1,3 = 15.079, df = 130, p < 0.01). Tail clippings yielded the highest
concentrations of DNA (mean 34.99 ng/µl), followed by blood (mean 22.87 ng/µl) and shed skins
(mean 7.93 ng/µl) (Table 2.2, Fig. 2.2). Blood however yielded purer DNA (A260/280 = 2.07) than tail
clippings (A260/280 = 1.88) or shed skin (A260/280 = 1.52) (Table 2.2, Fig. 2.2).
Success in downstream application
The microsatellite profiling success rates of DNA extracted from different tissue types in this study
were significantly different (Kruskal-Wallis H test; H (6) = 271.78, p < 0.01) (Fig. 2.3). Of the
possible 21 pairwise comparisons, 16 were significantly different (Dunn's test; p < 0.01). The
following pairs were not significantly different in profiling success: blood/shed skin 12 months, tail
clippings/shed skin 12 months, shed skin overall/shed skin 18 months, shed skin 20 months/shed skin
22 months, shed skin 18 months/shed skin 20 months. Success rates ranged from as low as 13% in
shed skin samples processed 22 months after collection, to 82% in blood samples. Shed skin samples
improved considerably in their sequencing success rate when the time between collection and
processing was reduced to below 12 months. Shed skin samples that were processed with a year of
being collected were comparable to tail clippings in profiling success rates.
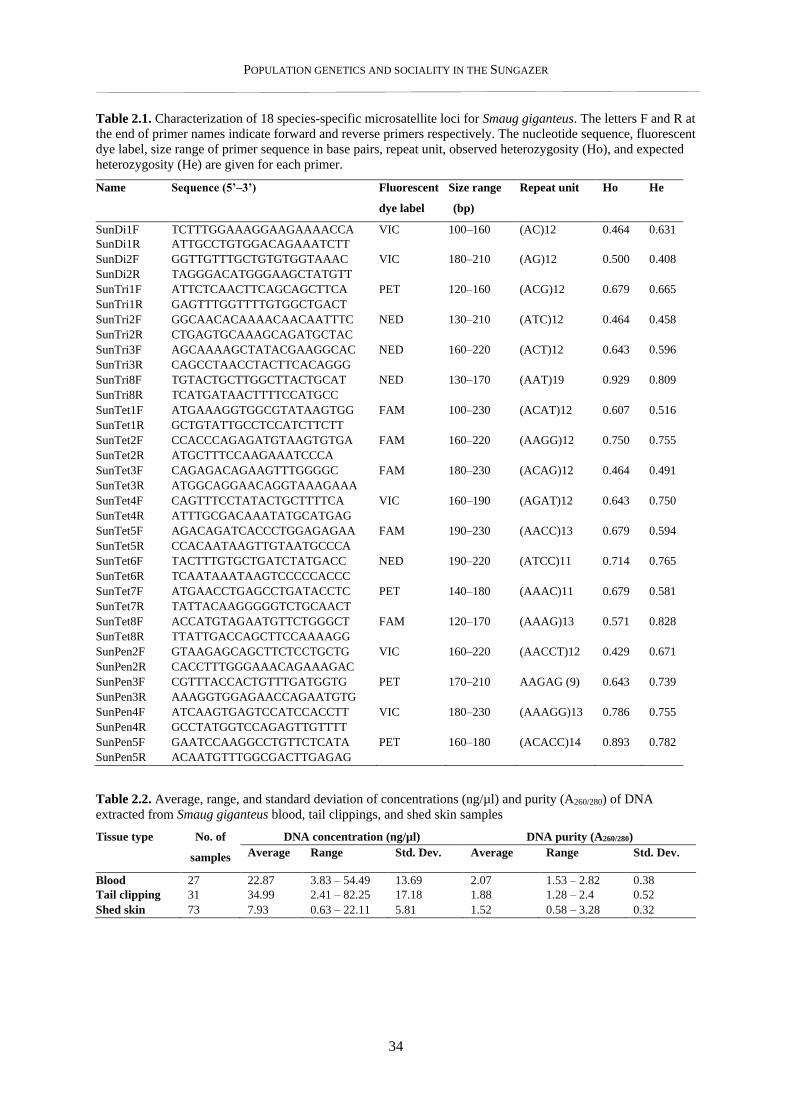
POPULATION GENETICS AND SOCIALITY IN THE SUNGAZER
34
Table 2.1. Characterization of 18 species-specific microsatellite loci for Smaug giganteus. The letters F and R at
the end of primer names indicate forward and reverse primers respectively. The nucleotide sequence, fluorescent
dye label, size range of primer sequence in base pairs, repeat unit, observed heterozygosity (Ho), and expected
heterozygosity (He) are given for each primer.
Name Sequence (5’–3’) Fluorescent
dye label
Size range
(bp)
Repeat unit Ho He
SunDi1F TCTTTGGAAAGGAAGAAAACCA VIC 100–160 (AC)12 0.464 0.631
SunDi1R ATTGCCTGTGGACAGAAATCTT
SunDi2F GGTTGTTTGCTGTGTGGTAAAC VIC 180–210 (AG)12 0.500 0.408
SunDi2R TAGGGACATGGGAAGCTATGTT
SunTri1F ATTCTCAACTTCAGCAGCTTCA PET 120–160 (ACG)12 0.679 0.665
SunTri1R GAGTTTGGTTTTGTGGCTGACT
SunTri2F GGCAACACAAAACAACAATTTC NED 130–210 (ATC)12 0.464 0.458
SunTri2R CTGAGTGCAAAGCAGATGCTAC
SunTri3F AGCAAAAGCTATACGAAGGCAC NED 160–220 (ACT)12 0.643 0.596
SunTri3R CAGCCTAACCTACTTCACAGGG
SunTri8F TGTACTGCTTGGCTTACTGCAT NED 130–170 (AAT)19 0.929 0.809
SunTri8R TCATGATAACTTTTCCATGCC
SunTet1F ATGAAAGGTGGCGTATAAGTGG FAM 100–230 (ACAT)12 0.607 0.516
SunTet1R GCTGTATTGCCTCCATCTTCTT
SunTet2F CCACCCAGAGATGTAAGTGTGA FAM 160–220 (AAGG)12 0.750 0.755
SunTet2R ATGCTTTCCAAGAAATCCCA
SunTet3F CAGAGACAGAAGTTTGGGGC FAM 180–230 (ACAG)12 0.464 0.491
SunTet3R ATGGCAGGAACAGGTAAAGAAA
SunTet4F CAGTTTCCTATACTGCTTTTCA VIC 160–190 (AGAT)12 0.643 0.750
SunTet4R ATTTGCGACAAATATGCATGAG
SunTet5F AGACAGATCACCCTGGAGAGAA FAM 190–230 (AACC)13 0.679 0.594
SunTet5R CCACAATAAGTTGTAATGCCCA
SunTet6F TACTTTGTGCTGATCTATGACC NED 190–220 (ATCC)11 0.714 0.765
SunTet6R TCAATAAATAAGTCCCCCACCC
SunTet7F ATGAACCTGAGCCTGATACCTC PET 140–180 (AAAC)11 0.679 0.581
SunTet7R TATTACAAGGGGGTCTGCAACT
SunTet8F ACCATGTAGAATGTTCTGGGCT FAM 120–170 (AAAG)13 0.571 0.828
SunTet8R TTATTGACCAGCTTCCAAAAGG
SunPen2F GTAAGAGCAGCTTCTCCTGCTG VIC 160–220 (AACCT)12 0.429 0.671
SunPen2R CACCTTTGGGAAACAGAAAGAC
SunPen3F CGTTTACCACTGTTTGATGGTG PET 170–210 AAGAG (9) 0.643 0.739
SunPen3R AAAGGTGGAGAACCAGAATGTG
SunPen4F ATCAAGTGAGTCCATCCACCTT VIC 180–230 (AAAGG)13 0.786 0.755
SunPen4R GCCTATGGTCCAGAGTTGTTTT
SunPen5F GAATCCAAGGCCTGTTCTCATA PET 160–180 (ACACC)14 0.893 0.782
SunPen5R ACAATGTTTGGCGACTTGAGAG
Table 2.2. Average, range, and standard deviation of concentrations (ng/µl) and purity (A260/280) of DNA
extracted from Smaug giganteus blood, tail clippings, and shed skin samples
Tissue type No. of
samples
DNA concentration (ng/µl) DNA purity (A260/280)
Average Range Std. Dev. Average Range Std. Dev.
Blood 27 22.87 3.83 – 54.49 13.69 2.07 1.53 – 2.82 0.38
Tail clipping 31 34.99 2.41 – 82.25 17.18 1.88 1.28 – 2.4 0.52
Shed skin 73 7.93 0.63 – 22.11 5.81 1.52 0.58 – 3.28 0.32
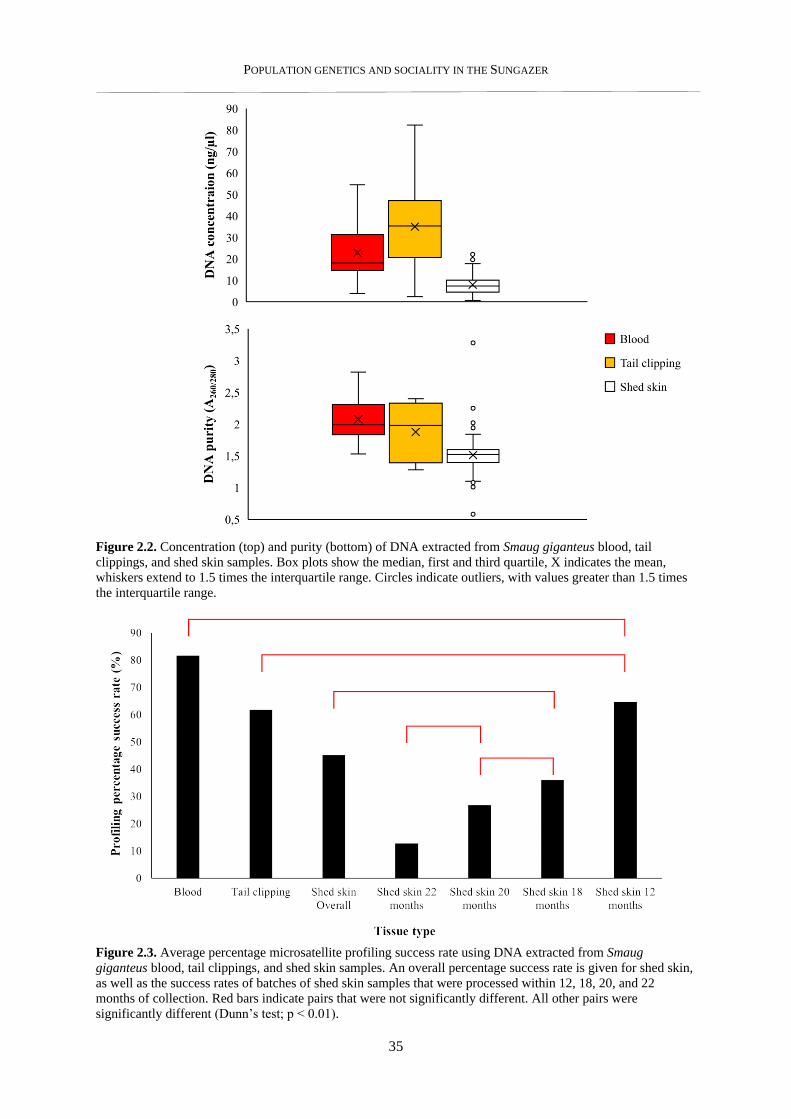
POPULATION GENETICS AND SOCIALITY IN THE SUNGAZER
35
Figure 2.2. Concentration (top) and purity (bottom) of DNA extracted from Smaug giganteus blood, tail
clippings, and shed skin samples. Box plots show the median, first and third quartile, X indicates the mean,
whiskers extend to 1.5 times the interquartile range. Circles indicate outliers, with values greater than 1.5 times
the interquartile range.
Figure 2.3. Average percentage microsatellite profiling success rate using DNA extracted from Smaug
giganteus blood, tail clippings, and shed skin samples. An overall percentage success rate is given for shed skin,
as well as the success rates of batches of shed skin samples that were processed within 12, 18, 20, and 22
months of collection. Red bars indicate pairs that were not significantly different. All other pairs were
significantly different (Dunn’s test; p < 0.01).
POPULATION GENETICS AND SOCIALITY IN THE SUNGAZER
36
2.4. Discussion
The 18 microsatellite loci isolated in this study were polymorphic and were suitable for investigations
of genetic diversity, population structure, and relatedness in S. giganteus, and are the first
microsatellite markers developed for a cordylid. The concentration and purity of DNA extracted from
Sungazer blood, tail clippings, and shed skin differed significantly, with blood and tail clippings
yielding higher levels of DNA concentration and purity on average than shed skin. Shed skin samples
generally yielded the lowest success rates in microsatellite profiling, and showed a clear decline in
sequencing success as time between collection and processing increased. Shed skin samples that were
processed within 12 months of collection, however, showed comparable sequencing success to tail
clippings, despite the significantly lower concentrations of DNA yielded. Non-invasive sampling can
therefore be used as an effective sampling approach for S. giganteus if shed skins are utilised shortly
after collection.
Since the red blood cells of reptiles are nucleated, blood samples would be expected to yield higher
concentrations of DNA than shed skin samples (Burbrink and Castoe 2009, Arikan and Çiçek 2014).
Tail clippings contain a small portion of blood along with muscle tissue and skin, and therefore have
higher concentrations of DNA than shed skin samples, but lower levels of purity than blood because
of potential contaminants present on the surface of the skin at the time of sampling. The purity values
of DNA from blood and tail clippings were within the optimal range (A260/280 = ~1.8-2.0; Horreo et al.
2015, Lucena-Aguilar et al. 2016) for pure DNA. DNA from shed skin was below the optimal range,
however A260/280 values below ~1.6 are not necessarily indicative of unsuitable DNA, rather that there
are likely to be more contaminants in the DNA. DNA from shed skin had purity values that were
significantly below (0.58) or above (3.28) the optimal value (~1.8-2), and large deviations in either
direction are indicative or contaminants in the DNA sample. The lower purity of shed skin samples is
most likely due to the contaminants present in the environment from which the samples were
collected. Although the samples were rinsed with sterile double-distilled water (ddH2O) prior to DNA
extraction, contaminants such as soil particles, microbes, or other proteins may have remained on the
tissue. The presence of outlying samples in the boxplots for concentration and purity of DNA from
shed skin samples is likely due to the potentially high differences in time these samples were exposed
to environmental conditions that degrade DNA prior to collection in the field.
The concentration of DNA extracted from reptile shed skin in my study was similar to (mean 6.15
ng/µl; Brekke et al. 2019) or higher than (mean ~1 ng/µl; Tawichasri et al. 2017, mean 1.3 ng/µl;
Horreo et al. 2015) other studies when using commercial extraction kits, but significantly lower than
yields when using a Chelex extraction kit (mean 31.2 ng/µl; Horreo et al. 2015). The DNA from
Sungazer shed skins in my study were purer than those collected by Horreo et al. (2015) (A260/280 =
POPULATION GENETICS AND SOCIALITY IN THE SUNGAZER
37
1.2), even though the shed skins collected by Horreo were collected directly from the animal. It is
important to note that the shed skin samples in my study were not collected directly from Sungazers,
whereas most other studies that use shed skin either collect from captive animals, or removed sheds
from a wild caught lizard. As a result, the samples collected in other studies would likely have
experience less exposure to the elements that degrade DNA in the field. Shed skin samples collected
directly from either captive or wild reptiles tend to yield very high concentrations of DNA that have
high amplification success rates (Feldman and Spicer 2002, Dubey et al. 2010, Horreo et al. 2015,
Ford et al. 2017, Brekke et al. 2019), even after storage for several months or years (Clark 1998,
Fetzner 1999, Jones et al. 2008). Although DNA inevitably degrades over time, storage under the
optimal conditions and using optimised laboratory procedures can reduce the rate of degradation so
that tissue samples can be successfully processed long after collection. Samples can be stored in
media that inhibit the enzymes and processes that cause the degradation of DNA. For example,
storage in media that reduce moisture (ethanol, silica gel), at lower temperatures to inhibit nuclease
activity, or in media that remove cations (EDTA, chelex) (Thomas and Gilbert 2006, Beja-Pereira et
al. 2009). Similarly, testing of different extraction methods and kits may yield significantly different
levels of amplification success using the same samples (Bhagavatula and Singh 2006). Horreo et al.
(2015) achieved significantly higher DNA concentrations using a Chelex-resin based protocol (24.2-
48 ng/µl) (Estoup et al. 1996) than DNeasy Blood & Tissue Kit (0.4-3.8 ng/µl) (Qiagen, Verlo,
Netherlands), even eleven months after initial tissue collection.
There are several factors to consider in understanding the differences in the purity and concentration
of DNA extracted from different sample types, and their respective downstream success rates. Firstly,
the exposure of each tissue type to conditions that degrade DNA prior to collection. The age of shed
skin collected from Sungazer burrows was difficult to assess since Sungazer skin is thick and
keratinous and appears to retain structural integrity long after being shed. These samples may have
been exposed to a combination of high temperature, rainfall and UV radiation prior to collection – all
of which are known to degrade DNA. As DNA degrades, it also becomes fragmented, decreasing the
chance of the necessary nucleotide sequencing bonding with the appropriate primer sequence during
PCR. Furthermore, extended exposure to environmental conditions may expose these samples to soil
particles, microbes and other proteins that inhibit PCR. Tail clippings may also have experienced
exposure to contaminants prior to collection. By comparison, blood samples were collected directly
from Sungazers and injected directly into sterile containers, minimising exposure to contaminants.
This may explain the comparatively lower success of shed skin and tail clippings in profiling
compared to blood.
POPULATION GENETICS AND SOCIALITY IN THE SUNGAZER
38
Secondly, the difference in the period of time between collection and processing samples. Shed skin
samples were collected over years of fieldwork and stored for different periods of time before being
processed, simply due to the time gap between the fieldwork and labwork components of my study.
Blood and tail clippings by comparison were processed within less than three months, since they were
collected towards the end of my fieldwork period. DNA degrades in quality and quantity over time
(Gamble 2014), and shed skin samples were in some cases processed almost a year after collection
from the field. The enzymes that degrade DNA may likely have continued the degradation process
once collected. Shorter periods of time between collection and processing of shed skin samples
yielded purer DNA and higher profiling success rates. This is an important consideration to build in to
the planning of fieldwork and labwork periods, since samples can not always be processed
immediately after collection.
Finally, the medium and conditions in which different tissue types were stored. Blood samples were
stored in tubes containing Ethylenediaminetetraacetic acid, which inhibits proteins such as nucleases
that degrade DNA (Nevarez 2009, Gamble 2014), and kept at -4 °C. Cooler temperatures are integral
in preserving DNA, since chemical and biological processes occur at slower rates as temperature
drops (Lindahl 1993, Taylor 2006). Tail clippings were stored in 99% ethanol at room temperature.
Although ethanol is a proven fluid preservative of DNA, the comparatively lower profiling success of
tail clippings may be due in part to the temperature that these samples were stored at. Storage of tail
clippings at -4 °C or lower temperatures may reduce DNA degradation even over relatively short
periods of time (Gamble 2014). Shed skins were kept dry at room temperature following Fetzner's
(1999) protocol for shed skin samples from reptiles. The samples that Fetzner used were shed skins
from captive individuals and therefore likely experienced less degradation prior to collection than my
field-collected samples. Tissue samples that are likely to have been exposed to environmental
conditions and contaminants should therefore ideally be stored in media that reduce DNA
degradation, and at as low temperatures as possible until processing.
While the collection of non-invasive DNA samples have several advantages over traditional sampling
techniques, one of the primary downsides to the non-invasive approach is the variability in DNA
concentration and quality in these samples. Non-invasive samples such as faeces, hair, and shed skin
are prone to degrade in the field prior to collection for genetic analysis. Time in the field prior to
collection, exposure to moisture, and temperature are the primary conditions that impact
DNA amplification success rates (Fernando et al. 2000, Murphy et al. 2007, Brinkman et al. 2010).
For sensitive sample types such as faeces, amplification success declines rapidly after ±3 days in the
field (Fernando et al. 2000), and continues to decline in efficacy until ±12 days, when the
amplification success rate plateaus at ±20% (Murphy et al. 2007). Similarly, DNA samples collected
POPULATION GENETICS AND SOCIALITY IN THE SUNGAZER
39
from wet environments showed significantly lower amplification success than samples from dry
environments, and were not successfully genotyped after seven days of exposure to moisture
(Brinkman et al. 2010). Reptile shed skins are keratinous (Rutland et al. 2019) and degrade less
quickly than faeces (Horreo et al. 2015), however environmental conditions in the Highveld
conditions can reach high temperatures and high levels of precipitation and may be prone to similar
levels of DNA degradation. The age of shed skin samples collected in the field can also be difficult to
ascertain, since shed skin may retain its physical form after several months in the field.
Conclusion
The microsatellite markers designed and presented in this chapter show promise as tools to investigate
fine-scale contemporary patterns of genetic structure in the Sungazer by quantifying the relatedness
between individuals and colonies. The ability of these markers to conduct relatedness and parentage
analyses also makes them suitable for verifying the F2 status of Sungazers in trade cases. Previous
studies have reported high levels of transferability of species-specific microsatellite markers across
closely related taxa (Barbará et al. 2007, Song et al. 2017) and the utility of these loci on other Smaug
species should be investigated. Non-invasive sampling through the collection of Sungazer shed skin
proves to be an effective sampling method with amplification and microsatellite sequencing, but is
less predictable for DNA quantity and quality than tail clippings and blood samples. Although shed
skin samples that were stored for more than 12 months before processing had high failure rates, this
may be mitigated through several steps: utilising careful sample collection procedures to ensure
minimal exposure of samples to moisture and high temperatures, storage in media and temperatures
that inhibits DNA degradation, and the optimisation of laboratory protocols that maximise DNA
extraction from low quality sample and reduce PCR inhibitors during amplification. With these points
taken into account, the utilisation of non-invasive sampling of Sungazer shed skins can allow for the
collection of higher number of samples at reduced field effort compared to the collection of tail clips
or blood over the same period of time.
POPULATION GENETICS AND SOCIALITY IN THE SUNGAZER
40
CHAPTER 3
PHYLOGEOGRAPHY AND POPULATION GENETICS OF THE SUNGAZER (SMAUG GIGANTEUS)
3.1. Introduction
The spatial spread of a species across its distribution and the corresponding pattern of genetic
exchange are determined by vicariance and dispersal (Rosen 1978, Wiley 1988, Ronquist 1997).
Historical vicariant events such as the formation of geological features (Macey et al. 2000, Veith et al.
2003, Hayes and Sewlal 2004, Lores and Raya 2006, Poulakakis et al. 2012), and changes in climactic
variables over time (Matthee et al. 2004, Douglas et al. 2006, Bryson et al. 2012) may have altered the
distribution of populations into their current extant pattern. The ability of individuals to disperse
between populations dictates how genetically differentiated these populations are (Peterson and
Denno 1998, Habel and Schmitt 2009, Avise 2009). Isolation of populations over long periods of time
can lead to divergence and speciation (Dobzhansky 1940, Pinho and Hey 2010, Nosil and Feder
2012). Contemporary landscape features also influence the distribution and genetic structure of
populations (Saunders et al. 1991, Debinski and Holt 2000, Couvet 2002, Martinez-Cruz et al. 2004).
Modern anthropogenic landscape transformation through agricultural and urban development
processes further isolate populations, leading to lower genetic diversity, increased genetic structure
(Slatkin 1987, Frankham et al. 2002, Reed et al. 2002), and the extinction of sub populations (Wilcox
and Murphy 1985, Fahrig 2003, Templeton et al. 2015).
Significant vicariant features may influence species in different ways. The dispersal ability of
individuals dictates to a large extent whether specific landscape features affect genetic exchange
between populations (Fahrig 1998; Walkup et al. 2017). Rivers, crop fields, and roads result in severe
genetic isolation in some species (Jackson and Fahrig 2011, Veach et al. 2017, French et al. 2018),
whereas dispersal is undisturbed in other species in the same environment (Burbrink et al. 1998,
Meister et al. 2010, Casper 2012). Ectothermic individuals may be more affected by climactic changes
than birds or mammals because of their sensitivity to thermal clines (Tingley and Dubey 2012,
Smissen et al. 2013, Rolland et al. 2018, Saladin et al. 2019). The spatial occupation of a habitat by
ectothermic species may also depend on the availability of basking sites that allow for the effective
thermoregulation of individuals in order to maintain a target temperature (Clark et al. 2008, Blair et al.
2013, Nelson-Tunley et al. 2016). The specificities of a species response to environmental changes are
therefore important to consider in organismal biology, and conservation management (Betts et al.
2014).
Quantification of the genetic structure of populations in a species can allow for insights in the
evolutionary history of a species, and how anthropogenic landscape features influence these patterns
POPULATION GENETICS AND SOCIALITY IN THE SUNGAZER
41
in the present. An integrative approach to understanding a species occupation of a landscape can be
more impactful than the use of a single technique (Diniz-Filho et al. 2009, Chan et al. 2011, Pavón-
Vázquez et al. 2018). A plethora of molecular genetic approaches are currently available that allow
for the interrogation of the genetic relatedness at various spatial and temporal scales. Slower evolving
nuclear DNA used in conjunction with faster evolving mitochondrial DNA and rapidly evolving
microsatellite markers can provide insight into how different vicariant events in a species evolutionary
history have affected gene flow between populations (Tollefsrud et al. 2009, Raeymaekers et al. 2012,
Hui et al. 2017, Kheng et al. 2018). The integrated use of geographic information systems (GIS) and
ecological niche models can also provide visual representations of genetic structure across space
(Spear et al. 2005, Clostio 2010, Hobbs et al. 2011), whether specific landscape features present
suitable areas for a species to occupy, and the utilisation or avoidance of these areas impede or allow
gene flow. Through this integrative approach, phylogeographic hypotheses can be formulated
(Strange and Burr 1997, Macey et al. 2000, Van Veller et al. 2002).
Investigations of genetic structure and diversity are particularly pertinent for threatened species, since
the extirpation of populations and reduced population density can result in the loss of rare alleles and
genetic diversity. This is particularly important for species that inhabit areas that have undergone
heavy human-mediated land transformation which result in habitat loss and fragmentation
(Lindenmayer and Fischer 2007). For many species, poor dispersal ability between discontinuous
patches that are separated by roads, crop fields or urban areas has resulted in lowered genetic diversity
and increased genetic structure (Fahrig 2003, Andrews and Jochimsen 2007, Noël et al. 2007, Kay et
al. 2016). Isolated populations are prone to inbreeding, population bottlenecks and lower effective
population size as a result of restricted genetic exchange with other populations (Nei et al. 1975,
Moore and Ali 1984, Allendorf 1986, Hedrick and Kalinowski 2000). This may lead to a supressed
evolutionary response to environmental changes within populations, and eventually the extinction of
these populations (Lande 1993, Frankham and Ralls 1998, Crispo et al. 2011). Studies of the patterns
of genetic exchange between populations in fragmented areas is therefore important in understanding
the extinction risk of a species and its populations, and the development of conservation plans that
take genetic structure and diversity into account (Branch et al. 2003, Thomassen et al. 2011,
Vasconcelos et al. 2012).
The Sungazer (Smaug giganteus) is a Vulnerable (Alexander et al. 2018) species of Cordylidae
endemic to the Highveld grasslands of the Free State and Mpumalanga provinces of South Africa (De
Waal 1978, Jacobsen 1989). The high elevation grassland (1260-1840 m asl; Parusnath 2014) that the
species occupies represent a fairly homogenous structural matrix, interspersed with perennial and non-
perennial rivers and floodplains. The northern reaches of the Drakensberg Mountain Range introduce
POPULATION GENETICS AND SOCIALITY IN THE SUNGAZER
42
dolerite intrusions and low lying ridges and escarpments along the south-eastern edge of the species
distribution (Scheepers 1975). The region is characterised by high annual rainfall and a temperate
climate, with relatively hot summers and cool winters (Van Wyk 1992). A strong climactic gradient
extends from west to east, with cooler temperatures and greater annual precipitation correlated with an
increasing elevational gradient (Scheepers 1975, Van De Wal 1976). The species distribution falls
across six vegetation bioregions (Mucina and Rutherford 2006) that harbour different assemblages of
plant species, all of which are dominated by the pioneer grass species Themeda triandra (Mucina and
Rutherford 2006). The species distribution appears is bordered by mountains and rivers, which may
present significant barriers to the dispersal of individuals and thereby limit the expansion of the
species from this area (Parusnath et al. 2017).
Sungazer populations in the Free State and Mpumalanga provinces have been noted as being
geographically disjunct (Petersen et al. 1985, Branch 1990, Parusnath et al. 2017). Anecdotal reports
have also suggested that Sungazers from the Free State Province may be considerably larger in body
size than Sungazers from the Mpumalanga Province (Stoltz and Blom 1981). The reason for the lack
of occurrence of Sungazers in the intermediate area, and differences in body size between populations
is unknown. Apart from this gap in occurrence, Sungazers occur ubiquitously but sparsely across their
distribution, occupying only 12% of the available habitat (Parusnath et al. 2017). Sungazers only dig
burrows in flat or low inclination primary grasslands in hard clay soil (Soil Classification Working
Group 1991) that is not underlain with surface-level rocks. These conditions are also ideal for crop
production, and much of the primary grassland within the distribution of the species has therefore
been transformed for the monoculture of maize, wheat, sugar, sorghum, and sunflowers (Parusnath et
al. 2017). As a result, just over half of the primary grassland and the Sungazer colonies that they
support remain intact (Parusnath et al. 2017). Many colonies now exist within disconnected islands of
grassland in a matrix of unsuitable habitat.
The effects of the strong gradient of climate and elevation, and geological and anthropogenic
landscape features on the genetic construct of S. giganteus and its constituent populations are
unstudied. This precludes an understanding of how the species has evolved across its landscape
through various dispersal and vicariance events, and how modern changes in the landscape may affect
gene flow and therefore the genetic structure of populations. In this chapter I investigated the
phylogenetic and population genetic structure of S. giganteus across its distribution. I utilised a
combination of mtDNA and nDNA gene sequences and rapidly evolving microsatellite markers so
that the evolutionary history of the species could be explored at various temporal scales. Additional to
exploratory population genetic analyses, I tested the hypotheses that allopatric Sungazer populations
from the Free State and Mpumalanga provinces are genetically distinct, and that genetic structure
POPULATION GENETICS AND SOCIALITY IN THE SUNGAZER
43
corresponds with vegetation bioregions. I compared the various scenarios of population genetic
structure using estimates of confidence to validate the most parsimonious scenario of population
differentiation in the species. I employed the use of an ecological niche model and topographic and
landcover GIS layers to assess whether genetic differentiation between populations corresponds with
landscape features. Finally, I investigated body size differences of Sungazers across phylogenetic
clades (based on the results of the phylogenetic analysis in section 3.3.1).
3.2. Materials and methods
Tissue sample collection
I collected tissue samples from 161 Sungazers in 19 colonies across the distribution of the species
(Fig. 3.1; Table 3.1) between March 2015 and March 2017. I defined a colony as an aggregation of
Sungazers clearly spatially isolated from the neighbouring aggregation by a minimum distance of 1
km. I captured Sungazers using standard noosing techniques (Van Wyk 1992, McIntyre and Whiting
2012), and clipped ~3 mm sections of tissue from the large caudal spines of adults, or the terminal tail
scute in juveniles using a sterilised pair of nail clippers. Caudal spines and tail tips were disinfected
with F10SC Veterinary Disinfectant spray (Health and Hygiene (Pty) Ltd., South Africa) before being
clipped. Blood samples were collected on FTA® filter paper (Whatman, Clifton, NJ, USA) as backup
samples from the clipped area on the tail of each Sungazer. I applied F10 Germicidal Barrier
Ointment (Health and Hygiene (Pty) Ltd., South Africa) to the area of incision on the tail after
ensuring that bleeding had ceased. I released Sungazer at the burrow from which they were captured.
Tail clippings were stored in 99% ethanol in 1.8 ml Nunc™ Cryogenic Tubes (ThermoFisher,
Waltham, MA, USA) at room temperature. Blood samples on FTA® filter paper cards were stored dry
in 0.75 ml Eppendorf Tubes (Eppendorf GmbH, Hamburg, Germany) at room temperature.
Equipment and surfaces used during tissue collection were sterilised with 10% bleach (sodium
hypochlorite; Kemp and Smith 2005) and rinsed with sterile double-distilled water (ddH2O) between
the sampling of each individual.
Morphometric data collection
I collected snout-vent length (SVL) and mass (g) for 152 adult Sungazers (adults are individuals with
SVL >165 mm; Van Wyk 1992) across the distribution of the species. Snout-vent length was
measured to the nearest 1 mm using a ruler, and mass to the nearest 1 g using a digital scale. The sex
of all individuals was established by examining lizards for the presence of generation glands in the
ventral femoral and forearm regions. Generation glands on the forearms are only present in male
lizards (Van Wyk 1992). There was no significant difference in SVL between adult male (n = 66) and
female (n = 86) Sungazers (two-sample t-test; t = 0.7, df = 151, p < 0.01), and so data from both sexes
were pooled for morphometric analyses. Based on the findings of genetic structure in S. giganteus in
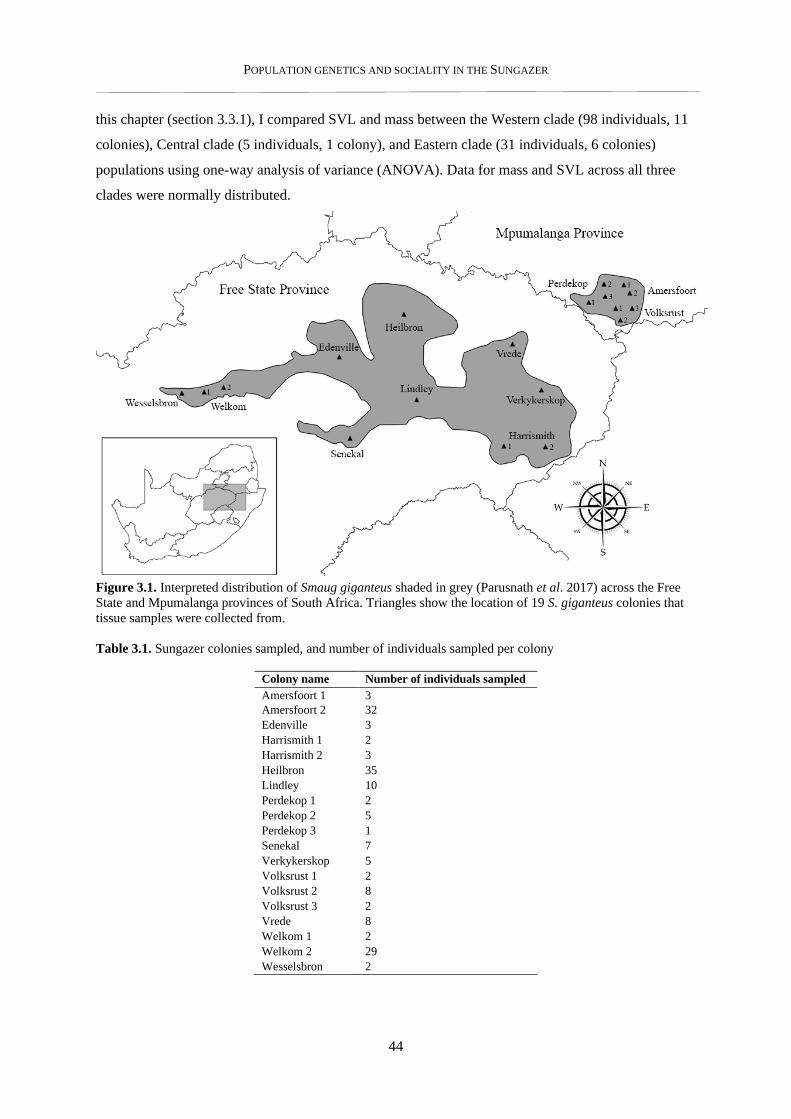
POPULATION GENETICS AND SOCIALITY IN THE SUNGAZER
44
this chapter (section 3.3.1), I compared SVL and mass between the Western clade (98 individuals, 11
colonies), Central clade (5 individuals, 1 colony), and Eastern clade (31 individuals, 6 colonies)
populations using one-way analysis of variance (ANOVA). Data for mass and SVL across all three
clades were normally distributed.
Figure 3.1. Interpreted distribution of Smaug giganteus shaded in grey (Parusnath et al. 2017) across the Free
State and Mpumalanga provinces of South Africa. Triangles show the location of 19 S. giganteus colonies that
tissue samples were collected from.
Table 3.1. Sungazer colonies sampled, and number of individuals sampled per colony
Colony name Number of individuals sampled
Amersfoort 1 3
Amersfoort 2 32
Edenville 3
Harrismith 1 2
Harrismith 2 3
Heilbron 35
Lindley 10
Perdekop 1 2
Perdekop 2 5
Perdekop 3 1
Senekal 7
Verkykerskop 5
Volksrust 1 2
Volksrust 2 8
Volksrust 3 2
Vrede 8
Welkom 1 2
Welkom 2 29
Wesselsbron 2
POPULATION GENETICS AND SOCIALITY IN THE SUNGAZER
45
DNA extraction, PCR, and sequencing
DNA was extracted from tissue clippings and blood samples using the ZR Genomic DNA II Kit
(Zymo Research Corporation, Irvine, Calif., USA), following the manufacturer’s protocol for blood
and hair. Extracted DNA was stored in 1.5 ml Eppendorf Tubes (Eppendorf GmbH, Hamburg,
Germany) at -20 °C. A total of two mitochondrial and one nuclear gene sequences (Table 3.2), and 18
species-specific polymorphic microsatellites markers (developed in Chapter 2 of this thesis) were
used to genotype all individuals. The partial sequences of the mitochondrial genes 12S (Stanley et al.
2011), and 16S (Simon et al. 1994), and the nuclear gene Kinesin Family Member 24 (KIF24) (Portik
et al. 2010) were utilized in previous studies of cordylids (Frost et al. 2001, Odierna et al. 2002, Ding
2008, Stanley et al. 2011) and were included in this study to facilitate comparisons with prior
analyses. Mitochondrial DNA evolves at rates of 5-10 times that of nuclear DNA (Brown et al. 1979,
Vawter and Brown 1986), and is reflected in the comparatively higher nucleotide sequence variation
in mtDNA gene sequences. Using both mitochondrial and nuclear DNA in combination allows for an
investigation of population structure in S. giganteus at different evolutionary time-scales (Avise
2009).
Table 3.2. Primer name, gene name, nucleotide sequence, and source of genes utilised in this study
Primer Gene Sequence (5’ – 3’) Source
16Sa 16S CGCCTGTTTATCAAAAACAT Simon et al. 1994
16Sb 16S CCGGTCTGAACTCAGATCACGT Simon et al. 1994
12SA700 12S AAACTGGGATTAGATACCCCACTAT Stanley et al. 2011
12sr600 12S GAGGGTGACGGCGGTGTGT Stanley et al. 2011
Kif24f Kif24 WGGCTGCTGRAAYTGCTGGTG Portik et al. 2010
Kif24r Kif24 SAAACGTRTCTCCMAAACGCATCC Portik et al. 2010
3.2.3.1. Mitochondrial and nuclear gene sequencing
Polymerase chain reaction was conducted with Taq DNA Polymerase 2x Master Mix RED
(Ampliqon, Odense M, Denmark) in 15 µL reaction volumes containing 1x Taq 2x Master Mix, 1.0-
2.0 mM MgCl2, 0.2 µM each forward and reverse primer, and 2.5 μl (~20 ng/μl) template DNA. The
conditions for PCR amplification were: denaturing at 95 °C for 5 min, annealing with 35 cycles at
95 °C for 30 s, 55 °C for 30 s and 72 °C for 30 s, followed by a final extension at 72 °C for 10 min in
a T100TM Thermal Cycler (Bio-Rad Laboratories, Inc. Hercules, CA). Successful PCR products were
purified with Exonuclease I and FastAP (Thermo Fisher Scientific Inc., Waltham, MA, USA). Gene
fragments were sequenced using the BigDye Terminator v3.1 Cycle Sequencing Kit (Applied
Biosystems) and visualised on 3130xl or 3500 Genetic Analysers (Applied Biosystems).
3.2.3.2. Microsatellite genotyping
Polymerase chain reaction was conducted with Invitrogen Platinum Taq DNA polymerase
(Invitrogen, Carlsbad, California), in 10 µL reaction volumes containing 1 x PCR buffer (Invitrogen),
POPULATION GENETICS AND SOCIALITY IN THE SUNGAZER
46
1.0-2.0 mM MgCl2, 0.02 mM each forward and reverse primer, 0.1mM dNTP mix, 0.25 U Invitrogen
Platinum Taq DNA polymerase, and 1 µL template DNA (~10 ng/µL). The conditions for PCR
amplification were: 5 min at 95 °C initial denaturation, 30 cycles for 30 s at 95 °C, 30 s at 45 °C, and
30 s at 72 °C, followed by a final extension at 72 °C for 40 min. The PCR was carried out in a
BOECO TC-PRO Thermal Cycler (Boeckel + Co., Hamburg, Germany). Polymerase chain reaction
products were pooled together and run against a Genescan 500 LIZ (Applied Biosystems, Foster City,
California) internal size standard on a 3130 Genetic Analyzer (Applied Biosystems, Foster City,
California). Samples were visualized using GENEMAPPER 4.0 software (Applied Biosystems, Foster
City, California) and bins were assigned to alleles and calls were then checked by eye.
Phylogenetic analyses
To assess the overall genetic structure of the species and investigate potential cryptic diversity within
Smaug giganteus, a genus-level phylogeny for Smaug was run using published data (Table 3.2;
Stanley and Bates, 2014), with Cordylosaurus subtessellatus and Platysaurus capensis as outgroup
species. Stanley and Bates (2014) included only four S. giganteus samples from three localities (Free
State Province, n = 3; Mpumalanga Province, n = 1) in their phylogeny, precluding any examination
of cryptic diversity within the species. Therefore, sequences from 14 S. giganteus individuals from
across the distribution of the species were included to investigate additional structuring within the
species. This subset was selected so that the number of S. giganteus samples per site matched that of
Stanley and Bate’s (2014) phylogeny, to avoid false signals stemming from high sample density for S.
giganteus. The phylogenetic analysis was run using 12S (Stanley et al. 2011), 16S (Kohli et al. 2014),
Kinesin Family Member 24 (KIF24) (Portik et al. 2010) partial gene sequences.
Sequences were aligned in GENEIOUS 8.1.9 (http://www.geneious.com, Kearse et al. 2012) using the
Clustal W alignment model (Thompson et al. 1994), and screened for base ambiguities. The best-
fitting evolutionary model for each gene fragment was identified using PARTITIONFINDER 1.1.1
(Lanfear et al. 2014). Phylogenetic trees were constructed in maximum likelihood (ML) and Bayesian
inference (BI) frameworks for three datasets: mitochondrial dataset, nuclear dataset, and the
concatenated mitochondrial and nuclear dataset. A partition homogeneity test (1 000 replicates) was
implemented in PAUP∗ 4.0a163 (Swofford 2002) on the concatenated dataset prior to analysis, to
assess congruence among individual topologies. The test indicated that there was no conflict in
phylogenetic signals (P = 0.11).
Maximum likelihood analyses were performed in RAxML 8.0 (Stamatakis 2014) with a
GTRGAMMA model of nucleotide evolution for all genes and partitions, with 100 random addition
replicates and partition branch lengths and parameters estimated independently for each partition.
POPULATION GENETICS AND SOCIALITY IN THE SUNGAZER
47
Nodal support of the ML tree was assessed by 1 000 bootstrap pseudoreplications (Felsenstein 1985).
Bayesian inference analyses were conducted in MRBAYES 3.2 (Ronquist et al. 2012). Four Markov
chain Monte Carlo (MCMC) chains were run in parallel for 10 000 000 generations with random
starting trees, and Markov chains were sampled every 1 000 generations. PARTITIONFINDER 1.1.1
(Lanfear et al. 2014) indicated that the best partitioning strategy and substitution models were: 12S
(F81), 16S (HKY), and Kif24 (HKY + I + G). Data were therefore portioned by gene and the
appropriate model of evolution for each gene was coded in the MRBAYES block in the input nexus
file.
TRACER 1.7 (Rambaut et al. 2018) was used to assess run length sufficiency by confirming adequate
chain mixture, convergence, and stationarity, noting if the effective sample size (ESS) values were
sufficient (>200). The ESS value indicated that a burn-in of 10% was sufficient and therefore 1 000
trees were discarded as burn-in. A 50% majority-rule consensus tree was generated from the trees
retained. Clades/nodes with bootstrap values of ≥ 70 % for ML, and posterior probability values of ≥
0.95 for BI, were considered highly supported (Huelsenbeck and Rannala 2004). The phylogenetic
tree for the total evidence dataset tree was visualised in FIGTREE 1.4.3 (Rambaut 2017).
Population genetic structure analysis
A multitude of software packages are available for use in population genetic analyses. The models
employed in these packages may use different algorithms and methodological principles to detect
barriers and assign individuals to unique genetic populations. The resultant number and configuration
of genetic populations detected may therefore differ between models. The use of multiple models,
followed by statistical model selection is therefore advised in order to confirm which model may
provide the most parsimonious pattern of genetic structure (François and Durand 2010). The results
from each analysis should also be interpreted in the context and scale of the study, and the life history
of the species being investigated.
I used GENELAND, STRUCTURE, and SAMOVA software packages to assign individual Sungazers
from 19 different sampled colonies (Fig. 3.1) to genetic populations. I compared the genetic structure
identified in each analysis with the clustering of colonies into populations as predicted by my
hypotheses. Finally, I used analyses of molecular variance (AMOVAs) in ARLEQUIN to estimate the
level of confidence in each scenario of genetic structure to confirm which scenario is the most
parsimonious explanation of genetic structure in the species. Analyses performed in STRUCTURE and
GENELAND used only microsatellite data, whereas the combined mitochondrial and nuclear gene
dataset (12S, 16S, and Kif24) were used in SAMOVA, and both microsatellite and the combined gene
dataset were used in ARLEQUIN to test the various scenarios of genetic structure.
POPULATION GENETICS AND SOCIALITY IN THE SUNGAZER
48
3.2.5.1. Bayesian clustering analyses
STRUCTURE 2.3.4 (Pritchard et al. 2000) and GENELAND 4.0.5 (Guillot et al. 2005) are two of the
most widely used Bayesian clustering software packages in population genetic studies (François and
Durand 2010). Bayesian methods infer population based on allele frequency and cluster individuals
based on their genetic values (Bolstad 2004). Each model has its own strengths and limitations.
GENELAND’s spatially explicit model allows for the detection of weaker population structure than is
detectable with STRUCTURE’S non-spatial model (Franco̧is et al. 2006, Olsen et al. 2014). STRUCTURE
offers the option of admixture models which are more flexible and robust than models without
admixture, such as in GENELAND (Durand et al. 2009, François and Durand 2010).
GENELAND 4.0.5 (Guillot et al. 2005) uses a Reversible Jump Markov Chain Monte Carlo
(RJMCMC) algorithm for the inference of number of populations, which is implemented using a
spatially explicit model that assumes the geographical location of the samples (Guillot et al. 2005). I
used the spatial model with uncorrelated allele frequencies to infer the number of populations (K) in
my dataset. I performed 10 independent runs for each value of K ranging from 1 to 10. For each
simulation, parameters were set to 10 independent runs with 500 000 MCMC iterations, thinning of
50, no filtering of null alleles, and the delta coordinate (representing the potential error for spatial
coordinates) set at 0, given that each sample was accurately recorded to the nearest 3 m with a GPS.
The 10 runs were post-processed with a burn-in of 100 iterations in order to obtain posterior
probabilities of population membership for each individual and each pixel of the spatial domain (200
pixels along the X and Y axes). These runs were checked for convergence and used to establish the
modal value of K. Based on this value, I then fixed K at 5 to estimate the other parameters included in
the model, including population membership probability of individuals, map of population
membership and posterior density of the model.
STRUCTURE 2.3.4 (Pritchard et al. 2000) infers the optimal number of populations (K) using a Markov
Chain Monte Carlo (MCMC) algorithm (Pritchard et al. 2000). I performed 10 independent runs for
each value of K ranging from 1 to 10. The parameter settings specified use of the admixture model,
with allele frequencies correlated and location information not given a priori. Each run consisted of 1
000 000 MCMC iterations, with an additional 100 000 generations discarded as burn-in. All other
settings were left as default. The K value with the greatest increase in posterior probability (ΔK;
Evanno et al. 2005) was identified as the optimum number of populations using STRUCTURE
HARVESTER 0.6.94 (Earl and von Holdt 2012).
The mathematical model used in STRUCTURE has received criticisms for assigning individuals into too
few populations, and the strong susceptibility of being influenced by sample size (Kalinowski 2011).
POPULATION GENETICS AND SOCIALITY IN THE SUNGAZER
49
To avoid these potential problems, I employed an approach of progressive partitioning of populations
(sensu Hobbs et al. 2011) to further scrutinise the dataset using STRUCTURE. This method operates on
the assumption that hierarchical clustering algorithms produce a nested series of partitions (Jain et al.
2007). Populations identified in the first round of analysis are expected to be the most differentiated,
with subsequent populations having progressively lower levels of genetic differentiation. The
progressive partitioning technique potentially allows for the identification of otherwise cryptic
populations when looking for populations at lower levels of genetic differentiation, although it has the
disadvantage of explicitly ignoring the likelihood values for the different values of K. Progressive
partitions produced by Bayesian techniques can be displayed using GIS software and compared to
identify consistent patterns of sub-structuring at different degrees of differentiation. I therefore ran
STRUCTURE first on the complete microsatellite dataset, and then again individually on the two initial
populations identified by STRUCTURE.
3.2.5.2. Spatial analyses of molecular variance
Spatial analyses of molecular variance (SAMOVA) were used to investigate geographical
structure with the software package SAMOVA 1.0 (Dupanloup et al. 2002).
SAMOVA uses geographical coordinates and corresponding sequence data to identify maximally
differentiated groups of populations in geographical space, without a priori assumptions of population
groupings. The procedure uses a simulated annealing procedure to investigate the composition of
groups (K), and maximise the proportion of genetic variation resulting from differences between
groups (FCT) (Dupanloup et al. 2002, Excoffier and Lischer 2010). The program was run for 2 to 10
differentiated populations using 100 000 permutations from 100 random initial conditions. The actual
number of populations was determined by plotting the relationship between FCT (the proportion of
total genetic variance representing differences among groups of populations) and K (number of
populations) to another, with the peak increase corresponding to the number of populations with the
highest likelihood (Dupanloup et al. 2002).
3.2.5.3. Hierarchical partitioning of molecular variance (AMOVA)
I used hierarchical analysis of molecular variance (AMOVA) in ARLEQUIN 3.5 (Excoffier and Lischer
2010) to assess the significance of the genetic partitioning of colonies into genetic populations in each
scenario of population structure. The AMOVA framework uses a priori groupings of individuals and
sample sites to assess how genetic variation is partitioned between groups. I grouped the 19 sampled
Sungazer colonies into the these a priori groups based on the results of the population structure from
STRUCTURE, GENELAND, SAMOVA and phylogenetic analysis, as well as groupings under the
hypotheses that populations from the Free State and Mpumalanga provinces are genetically distinct,
and that genetic structure of populations is correlated with the spatial organisation of vegetation
bioregions (Table 3.3). AMOVAs were performed using pairwise differences and 10,000 random
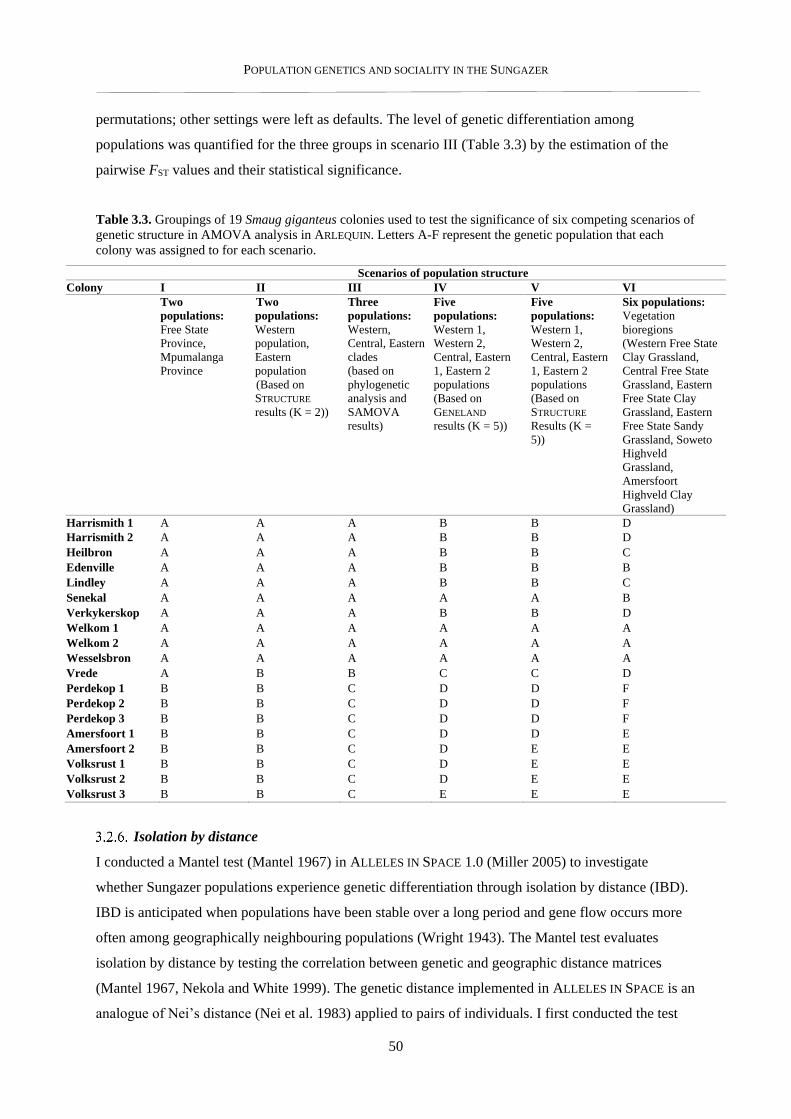
POPULATION GENETICS AND SOCIALITY IN THE SUNGAZER
50
permutations; other settings were left as defaults. The level of genetic differentiation among
populations was quantified for the three groups in scenario III (Table 3.3) by the estimation of the
pairwise FST values and their statistical significance.
Table 3.3. Groupings of 19 Smaug giganteus colonies used to test the significance of six competing scenarios of
genetic structure in AMOVA analysis in ARLEQUIN. Letters A-F represent the genetic population that each
colony was assigned to for each scenario.
Scenarios of population structure
Colony I II III IV V VI
Two
populations:
Free State
Province,
Mpumalanga
Province
Two
populations:
Western
population,
Eastern
population
(Based on
STRUCTURE
results (K = 2))
Three
populations:
Western,
Central, Eastern
clades
(based on
phylogenetic
analysis and
SAMOVA
results)
Five
populations:
Western 1,
Western 2,
Central, Eastern
1, Eastern 2
populations
(Based on
GENELAND
results (K = 5))
Five
populations:
Western 1,
Western 2,
Central, Eastern
1, Eastern 2
populations
(Based on
STRUCTURE
Results (K =
5))
Six populations:
Vegetation
bioregions
(Western Free State
Clay Grassland,
Central Free State
Grassland, Eastern
Free State Clay
Grassland, Eastern
Free State Sandy
Grassland, Soweto
Highveld
Grassland,
Amersfoort
Highveld Clay
Grassland)
Harrismith 1 A A A B B D
Harrismith 2 A A A B B D
Heilbron A A A B B C
Edenville A A A B B B
Lindley A A A B B C
Senekal A A A A A B
Verkykerskop A A A B B D
Welkom 1 A A A A A A
Welkom 2 A A A A A A
Wesselsbron A A A A A A
Vrede A B B C C D
Perdekop 1 B B C D D F
Perdekop 2 B B C D D F
Perdekop 3 B B C D D F
Amersfoort 1 B B C D D E
Amersfoort 2 B B C D E E
Volksrust 1 B B C D E E
Volksrust 2 B B C D E E
Volksrust 3 B B C E E E
Isolation by distance
I conducted a Mantel test (Mantel 1967) in ALLELES IN SPACE 1.0 (Miller 2005) to investigate
whether Sungazer populations experience genetic differentiation through isolation by distance (IBD).
IBD is anticipated when populations have been stable over a long period and gene flow occurs more
often among geographically neighbouring populations (Wright 1943). The Mantel test evaluates
isolation by distance by testing the correlation between genetic and geographic distance matrices
(Mantel 1967, Nekola and White 1999). The genetic distance implemented in ALLELES IN SPACE is an
analogue of Nei’s distance (Nei et al. 1983) applied to pairs of individuals. I first conducted the test
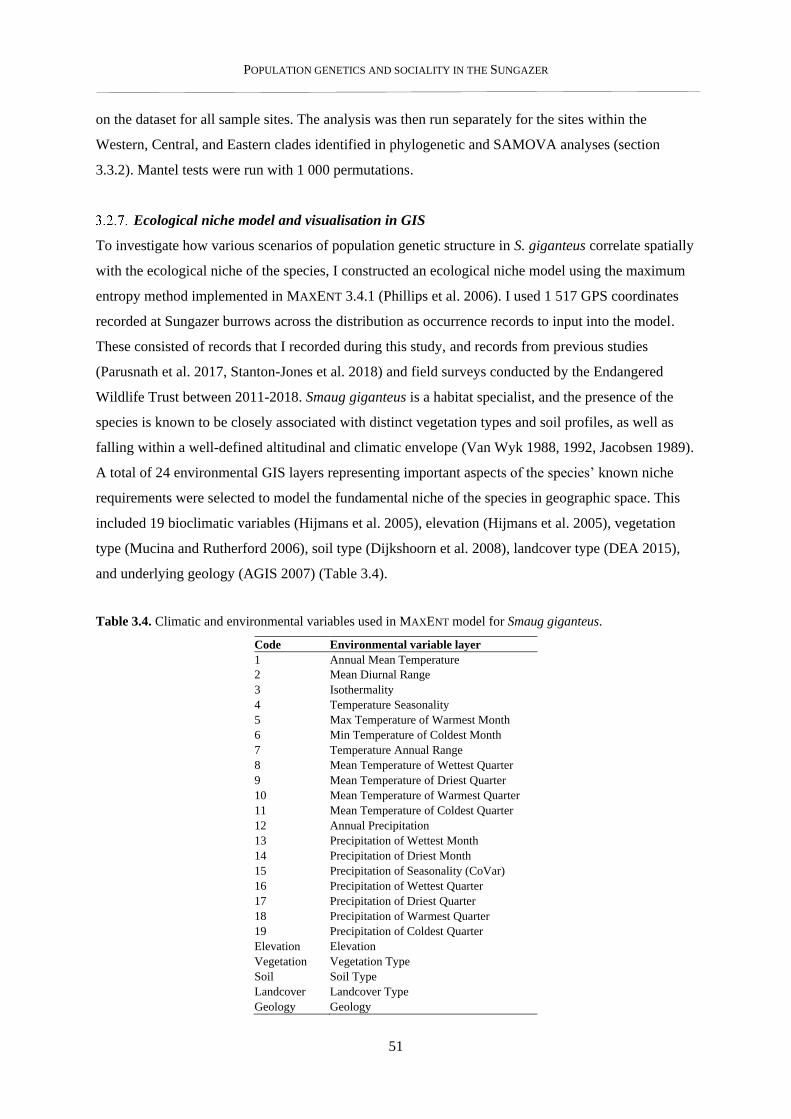
POPULATION GENETICS AND SOCIALITY IN THE SUNGAZER
51
on the dataset for all sample sites. The analysis was then run separately for the sites within the
Western, Central, and Eastern clades identified in phylogenetic and SAMOVA analyses (section
3.3.2). Mantel tests were run with 1 000 permutations.
Ecological niche model and visualisation in GIS
To investigate how various scenarios of population genetic structure in S. giganteus correlate spatially
with the ecological niche of the species, I constructed an ecological niche model using the maximum
entropy method implemented in MAXENT 3.4.1 (Phillips et al. 2006). I used 1 517 GPS coordinates
recorded at Sungazer burrows across the distribution as occurrence records to input into the model.
These consisted of records that I recorded during this study, and records from previous studies
(Parusnath et al. 2017, Stanton-Jones et al. 2018) and field surveys conducted by the Endangered
Wildlife Trust between 2011-2018. Smaug giganteus is a habitat specialist, and the presence of the
species is known to be closely associated with distinct vegetation types and soil profiles, as well as
falling within a well-defined altitudinal and climatic envelope (Van Wyk 1988, 1992, Jacobsen 1989).
A total of 24 environmental GIS layers representing important aspects of the species’ known niche
requirements were selected to model the fundamental niche of the species in geographic space. This
included 19 bioclimatic variables (Hijmans et al. 2005), elevation (Hijmans et al. 2005), vegetation
type (Mucina and Rutherford 2006), soil type (Dijkshoorn et al. 2008), landcover type (DEA 2015),
and underlying geology (AGIS 2007) (Table 3.4).
Table 3.4. Climatic and environmental variables used in MAXENT model for Smaug giganteus.
Code Environmental variable layer
1 Annual Mean Temperature
2 Mean Diurnal Range
3 Isothermality
4 Temperature Seasonality
5 Max Temperature of Warmest Month
6 Min Temperature of Coldest Month
7 Temperature Annual Range
8 Mean Temperature of Wettest Quarter
9 Mean Temperature of Driest Quarter
10 Mean Temperature of Warmest Quarter
11 Mean Temperature of Coldest Quarter
12 Annual Precipitation
13 Precipitation of Wettest Month
14 Precipitation of Driest Month
15 Precipitation of Seasonality (CoVar)
16 Precipitation of Wettest Quarter
17 Precipitation of Driest Quarter
18 Precipitation of Warmest Quarter
19 Precipitation of Coldest Quarter
Elevation Elevation
Vegetation Vegetation Type
Soil Soil Type
Landcover Landcover Type
Geology Geology
POPULATION GENETICS AND SOCIALITY IN THE SUNGAZER
52
Environmental variable layers were converted into ASCII format in ARCMAP 10.2 (ESRI Inc.,
Redlands, CA, USA) for input into MAXENT. A cell size of 0.016 (1 arc minute) was used. In order to
increase the precision of the model, the layers were cropped to a rectangle that included that species’
distribution and a surrounding buffer zone. The model was run with 10 000 background points, 5 000
iterations and 15 replicates. The selected output grid format was ‘logistic’, in which pixel values
ranged from 0 to 1. To assess model performance, I used Receiver Operating Characteristic (ROC)
curves (Fielding and Bell 1997, Phillips et al. 2004). The main advantage of ROC analysis is that the
area under the ROC curve (AUC) provides a measure of model performance, independent of any
choice of threshold (Phillips et al. 2006). To estimate the importance of environmental variables in
predicting Sungazer distribution, a jack-knife analysis was also carried out in MAXENT. In this
procedure, each variable is excluded in turn, and a model is created with the remaining variables, and
with each variable in isolation (Phillips et al. 2006).
Genetic groups identified in different analyses were plotted on a map of the species interpreted
distribution in geographic information software QGIS 3.6 (Open Source Geospatial Foundation
Project, 2019) to assess the spatial spread of these populations. The interpreted distribution showing
the population structure identified in GENELAND was also overlain onto maps showing terrain and
landcover use so that the relationship between genetic structure and landscape features could be
visualised.
3.3. Results
Phylogenetic analysis
The phylogenetic analysis recovered all S. giganteus samples as monophyletic for both ML and BI
analyses. Within S. giganteus, there is strong support for two clades: Eastern (Amersfoort, Volksrust),
and Central (Vrede). All other samples were from the Free State Province and were unresolved,
forming a large polytomy with the Eastern and Central clades. The basal node joining the Eastern and
Central clades is supported by Bayesian analysis, but not ML. Nevertheless, it is clear that all other
Free State colonies are not part of the clades encompassing the Eastern and Central populations.
While the sample sites from the Free State do not form a monophyletic clade, for ease of terminology,
these groups will be referred to as: A) Western clade (Wesselsbron, Welkom, Senekal, Edenville,
Heilbron, Lindley, Harrismith, Verkykerskop), B) Central clade (Vrede), and C) Eastern clade
(Amersfoort, Volksrust, Perdekop) (green, orange, and blue clades respectively in Fig. 3.2 and Fig.
3.3).
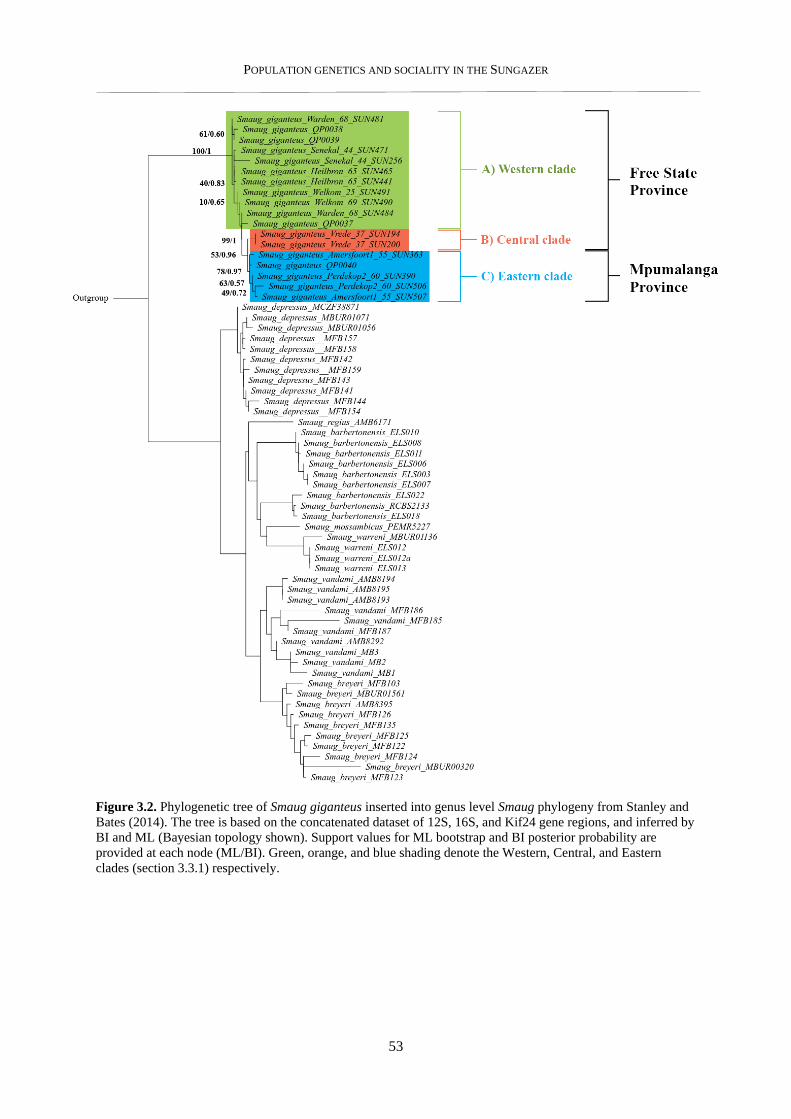
POPULATION GENETICS AND SOCIALITY IN THE SUNGAZER
53
Figure 3.2. Phylogenetic tree of Smaug giganteus inserted into genus level Smaug phylogeny from Stanley and
Bates (2014). The tree is based on the concatenated dataset of 12S, 16S, and Kif24 gene regions, and inferred by
BI and ML (Bayesian topology shown). Support values for ML bootstrap and BI posterior probability are
provided at each node (ML/BI). Green, orange, and blue shading denote the Western, Central, and Eastern
clades (section 3.3.1) respectively.
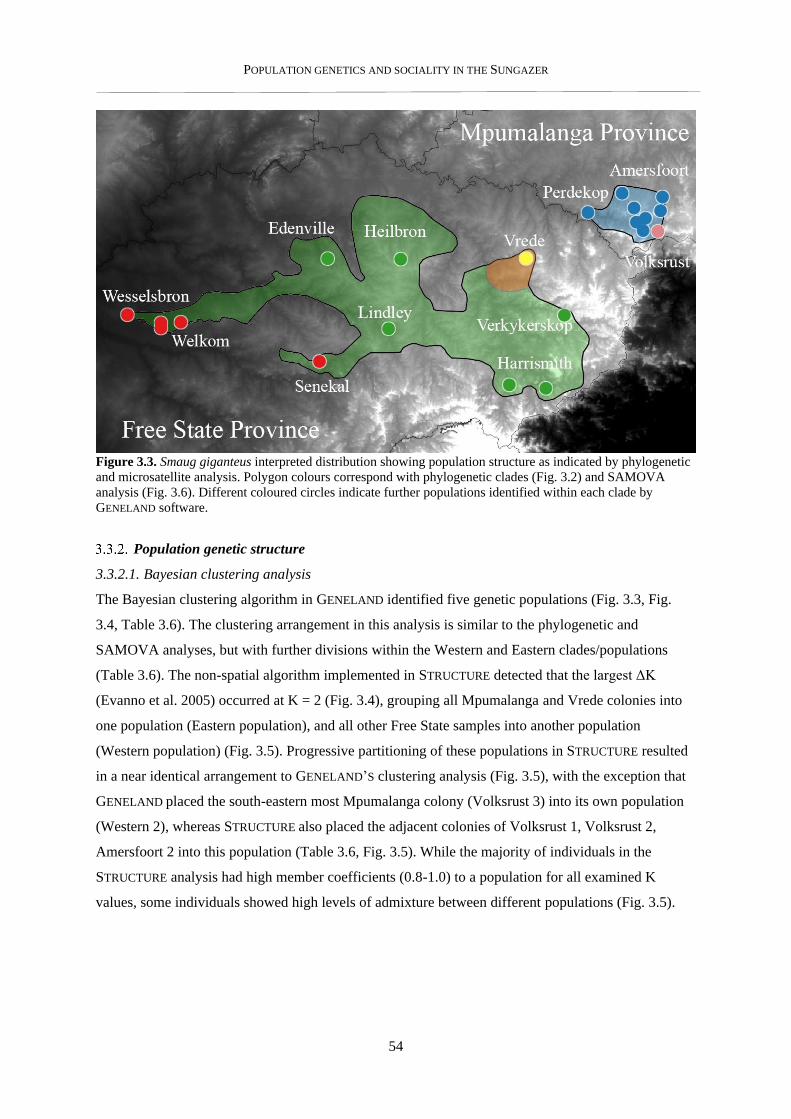
POPULATION GENETICS AND SOCIALITY IN THE SUNGAZER
54
Figure 3.3. Smaug giganteus interpreted distribution showing population structure as indicated by phylogenetic
and microsatellite analysis. Polygon colours correspond with phylogenetic clades (Fig. 3.2) and SAMOVA
analysis (Fig. 3.6). Different coloured circles indicate further populations identified within each clade by
GENELAND software.
Population genetic structure
3.3.2.1. Bayesian clustering analysis
The Bayesian clustering algorithm in GENELAND identified five genetic populations (Fig. 3.3, Fig.
3.4, Table 3.6). The clustering arrangement in this analysis is similar to the phylogenetic and
SAMOVA analyses, but with further divisions within the Western and Eastern clades/populations
(Table 3.6). The non-spatial algorithm implemented in STRUCTURE detected that the largest ΔK
(Evanno et al. 2005) occurred at K = 2 (Fig. 3.4), grouping all Mpumalanga and Vrede colonies into
one population (Eastern population), and all other Free State samples into another population
(Western population) (Fig. 3.5). Progressive partitioning of these populations in STRUCTURE resulted
in a near identical arrangement to GENELAND’S clustering analysis (Fig. 3.5), with the exception that
GENELAND placed the south-eastern most Mpumalanga colony (Volksrust 3) into its own population
(Western 2), whereas STRUCTURE also placed the adjacent colonies of Volksrust 1, Volksrust 2,
Amersfoort 2 into this population (Table 3.6, Fig. 3.5). While the majority of individuals in the
STRUCTURE analysis had high member coefficients (0.8-1.0) to a population for all examined K
values, some individuals showed high levels of admixture between different populations (Fig. 3.5).
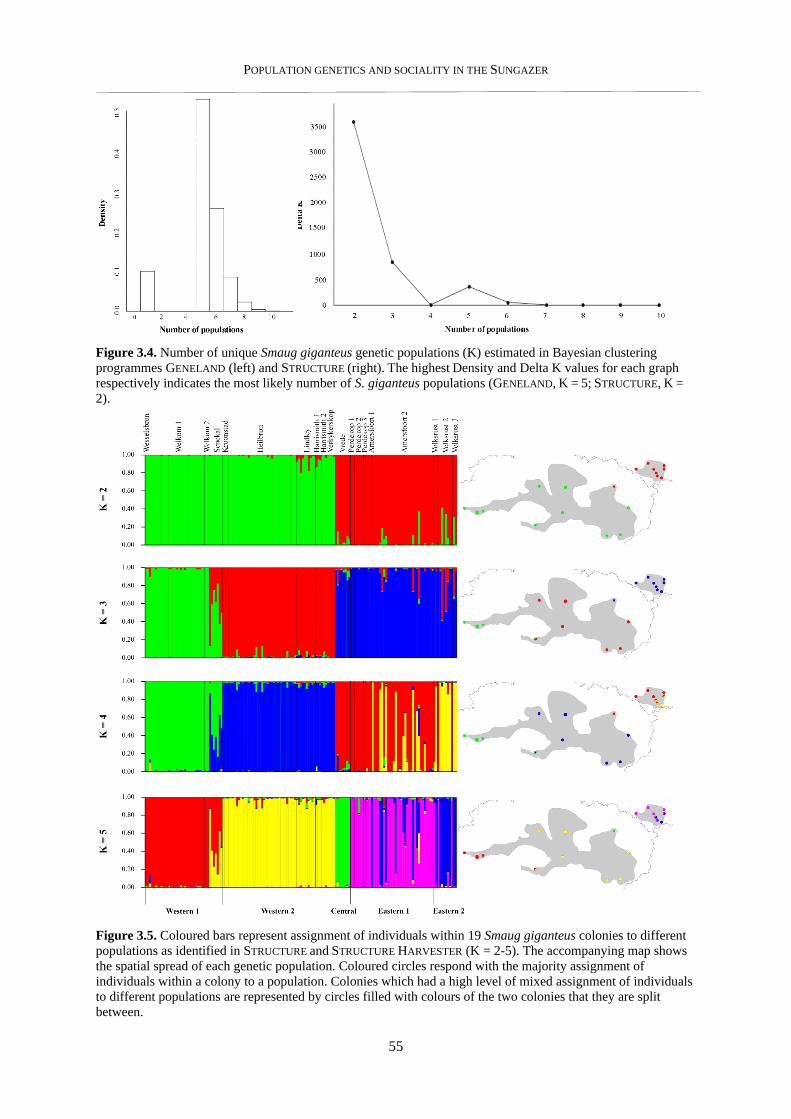
POPULATION GENETICS AND SOCIALITY IN THE SUNGAZER
55
Figure 3.4. Number of unique Smaug giganteus genetic populations (K) estimated in Bayesian clustering
programmes GENELAND (left) and STRUCTURE (right). The highest Density and Delta K values for each graph
respectively indicates the most likely number of S. giganteus populations (GENELAND, K = 5; STRUCTURE, K =
2).
Figure 3.5. Coloured bars represent assignment of individuals within 19 Smaug giganteus colonies to different
populations as identified in STRUCTURE and STRUCTURE HARVESTER (K = 2-5). The accompanying map shows
the spatial spread of each genetic population. Coloured circles respond with the majority assignment of
individuals within a colony to a population. Colonies which had a high level of mixed assignment of individuals
to different populations are represented by circles filled with colours of the two colonies that they are split
between.
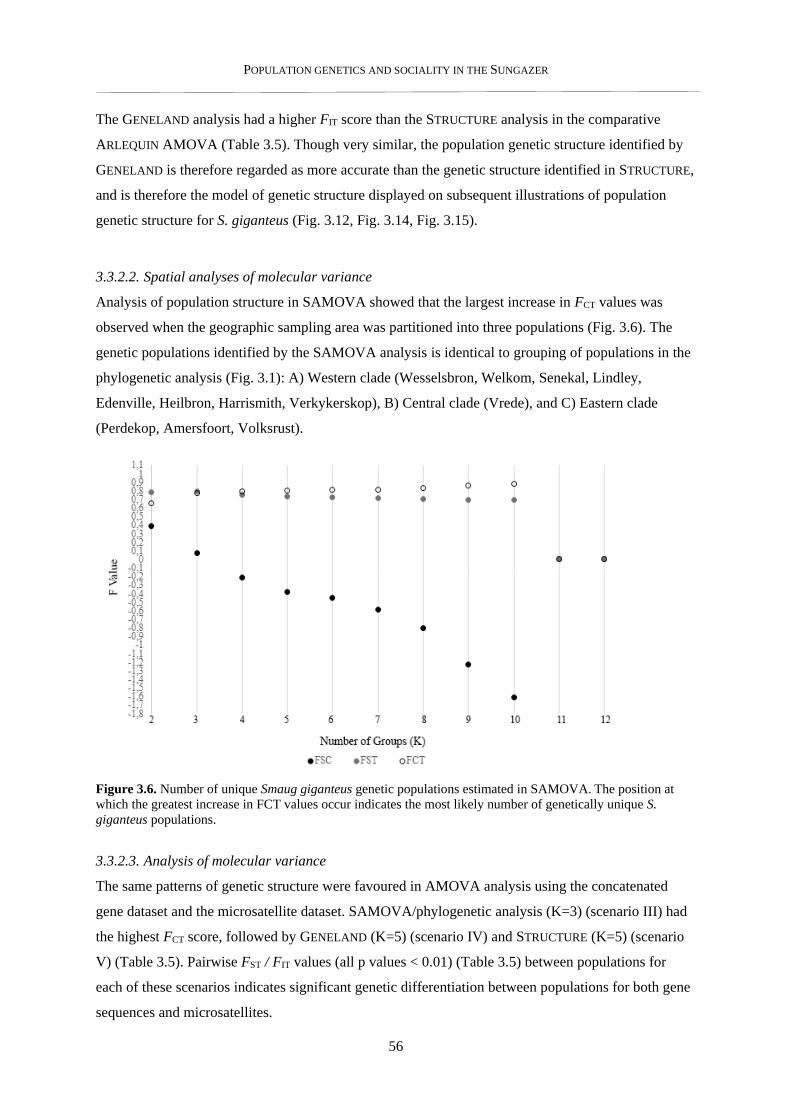
POPULATION GENETICS AND SOCIALITY IN THE SUNGAZER
56
The GENELAND analysis had a higher FIT score than the STRUCTURE analysis in the comparative
ARLEQUIN AMOVA (Table 3.5). Though very similar, the population genetic structure identified by
GENELAND is therefore regarded as more accurate than the genetic structure identified in STRUCTURE,
and is therefore the model of genetic structure displayed on subsequent illustrations of population
genetic structure for S. giganteus (Fig. 3.12, Fig. 3.14, Fig. 3.15).
3.3.2.2. Spatial analyses of molecular variance
Analysis of population structure in SAMOVA showed that the largest increase in FCT values was
observed when the geographic sampling area was partitioned into three populations (Fig. 3.6). The
genetic populations identified by the SAMOVA analysis is identical to grouping of populations in the
phylogenetic analysis (Fig. 3.1): A) Western clade (Wesselsbron, Welkom, Senekal, Lindley,
Edenville, Heilbron, Harrismith, Verkykerskop), B) Central clade (Vrede), and C) Eastern clade
(Perdekop, Amersfoort, Volksrust).
Figure 3.6. Number of unique Smaug giganteus genetic populations estimated in SAMOVA. The position at
which the greatest increase in FCT values occur indicates the most likely number of genetically unique S.
giganteus populations.
3.3.2.3. Analysis of molecular variance
The same patterns of genetic structure were favoured in AMOVA analysis using the concatenated
gene dataset and the microsatellite dataset. SAMOVA/phylogenetic analysis (K=3) (scenario III) had
the highest FCT score, followed by GENELAND (K=5) (scenario IV) and STRUCTURE (K=5) (scenario
V) (Table 3.5). Pairwise FST / FIT values (all p values < 0.01) (Table 3.5) between populations for
each of these scenarios indicates significant genetic differentiation between populations for both gene
sequences and microsatellites.
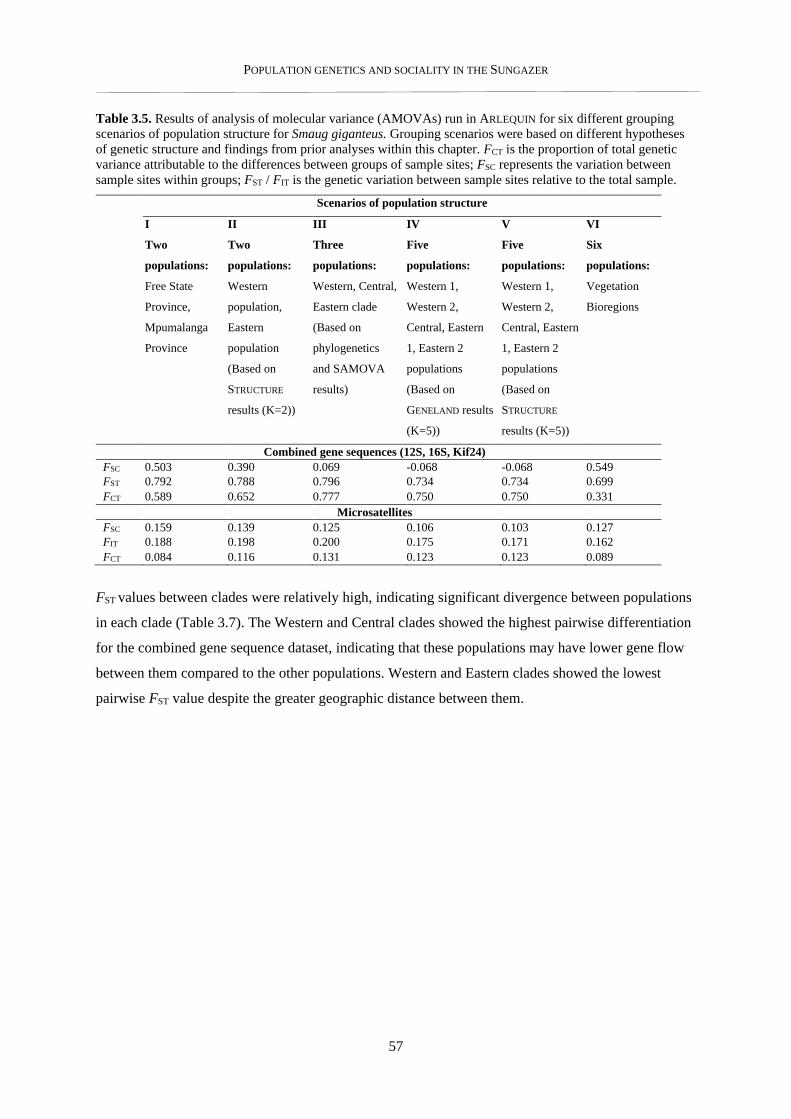
POPULATION GENETICS AND SOCIALITY IN THE SUNGAZER
57
Table 3.5. Results of analysis of molecular variance (AMOVAs) run in ARLEQUIN for six different grouping
scenarios of population structure for Smaug giganteus. Grouping scenarios were based on different hypotheses
of genetic structure and findings from prior analyses within this chapter. FCT is the proportion of total genetic
variance attributable to the differences between groups of sample sites; FSC represents the variation between
sample sites within groups; FST / FIT is the genetic variation between sample sites relative to the total sample.
Scenarios of population structure
I II III IV V VI
Two
populations:
Free State
Province,
Mpumalanga
Province
Two
populations:
Western
population,
Eastern
population
(Based on
STRUCTURE
results (K=2))
Three
populations:
Western, Central,
Eastern clade
(Based on
phylogenetics
and SAMOVA
results)
Five
populations:
Western 1,
Western 2,
Central, Eastern
1, Eastern 2
populations
(Based on
GENELAND results
(K=5))
Five
populations:
Western 1,
Western 2,
Central, Eastern
1, Eastern 2
populations
(Based on
STRUCTURE
results (K=5))
Six
populations:
Vegetation
Bioregions
Combined gene sequences (12S, 16S, Kif24)
FSC 0.503 0.390 0.069 -0.068 -0.068 0.549
FST 0.792 0.788 0.796 0.734 0.734 0.699
FCT 0.589 0.652 0.777 0.750 0.750 0.331
Microsatellites
FSC 0.159 0.139 0.125 0.106 0.103 0.127
FIT 0.188 0.198 0.200 0.175 0.171 0.162
FCT 0.084 0.116 0.131 0.123 0.123 0.089
FST values between clades were relatively high, indicating significant divergence between populations
in each clade (Table 3.7). The Western and Central clades showed the highest pairwise differentiation
for the combined gene sequence dataset, indicating that these populations may have lower gene flow
between them compared to the other populations. Western and Eastern clades showed the lowest
pairwise FST value despite the greater geographic distance between them.
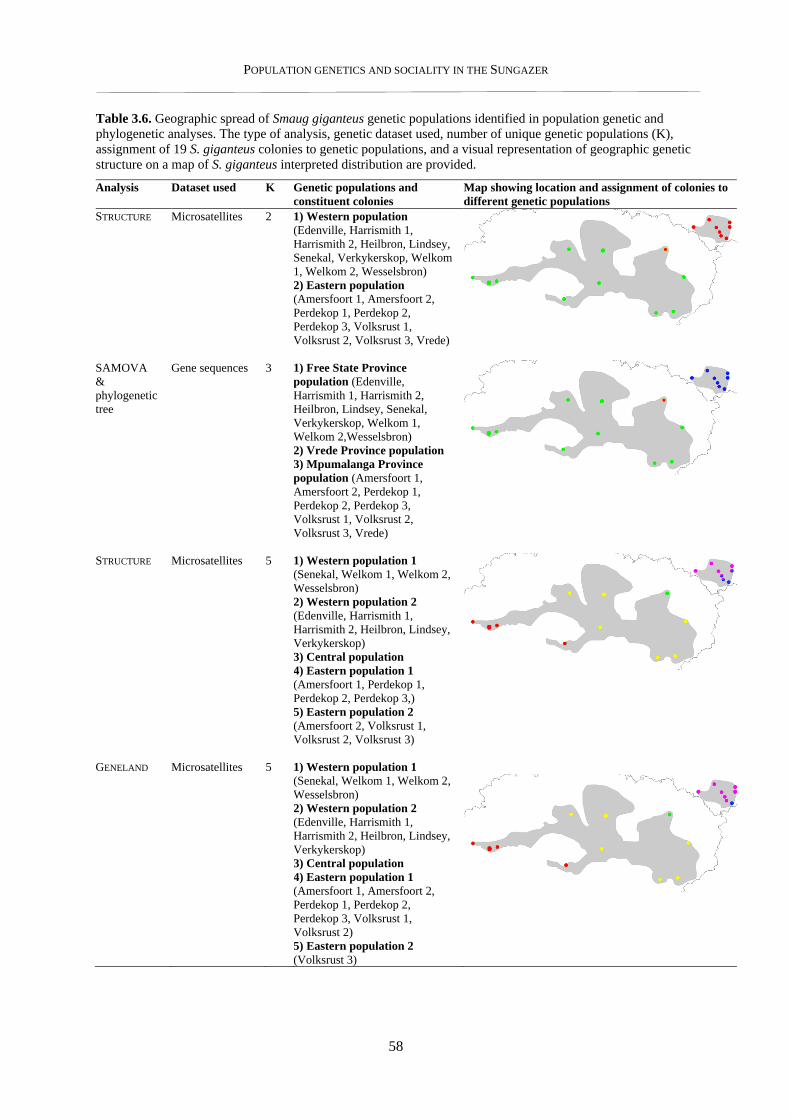
POPULATION GENETICS AND SOCIALITY IN THE SUNGAZER
58
Table 3.6. Geographic spread of Smaug giganteus genetic populations identified in population genetic and
phylogenetic analyses. The type of analysis, genetic dataset used, number of unique genetic populations (K),
assignment of 19 S. giganteus colonies to genetic populations, and a visual representation of geographic genetic
structure on a map of S. giganteus interpreted distribution are provided.
Analysis Dataset used K Genetic populations and
constituent colonies
Map showing location and assignment of colonies to
different genetic populations
STRUCTURE Microsatellites 2 1) Western population
(Edenville, Harrismith 1,
Harrismith 2, Heilbron, Lindsey,
Senekal, Verkykerskop, Welkom
1, Welkom 2, Wesselsbron)
2) Eastern population
(Amersfoort 1, Amersfoort 2,
Perdekop 1, Perdekop 2,
Perdekop 3, Volksrust 1,
Volksrust 2, Volksrust 3, Vrede)
SAMOVA
&
phylogenetic
tree
Gene sequences 3 1) Free State Province
population (Edenville,
Harrismith 1, Harrismith 2,
Heilbron, Lindsey, Senekal,
Verkykerskop, Welkom 1,
Welkom 2,Wesselsbron)
2) Vrede Province population
3) Mpumalanga Province
population (Amersfoort 1,
Amersfoort 2, Perdekop 1,
Perdekop 2, Perdekop 3,
Volksrust 1, Volksrust 2,
Volksrust 3, Vrede)
STRUCTURE Microsatellites 5 1) Western population 1
(Senekal, Welkom 1, Welkom 2,
Wesselsbron)
2) Western population 2
(Edenville, Harrismith 1,
Harrismith 2, Heilbron, Lindsey,
Verkykerskop)
3) Central population
4) Eastern population 1
(Amersfoort 1, Perdekop 1,
Perdekop 2, Perdekop 3,)
5) Eastern population 2
(Amersfoort 2, Volksrust 1,
Volksrust 2, Volksrust 3)
GENELAND Microsatellites 5 1) Western population 1
(Senekal, Welkom 1, Welkom 2,
Wesselsbron)
2) Western population 2
(Edenville, Harrismith 1,
Harrismith 2, Heilbron, Lindsey,
Verkykerskop)
3) Central population
4) Eastern population 1
(Amersfoort 1, Amersfoort 2,
Perdekop 1, Perdekop 2,
Perdekop 3, Volksrust 1,
Volksrust 2)
5) Eastern population 2
(Volksrust 3)
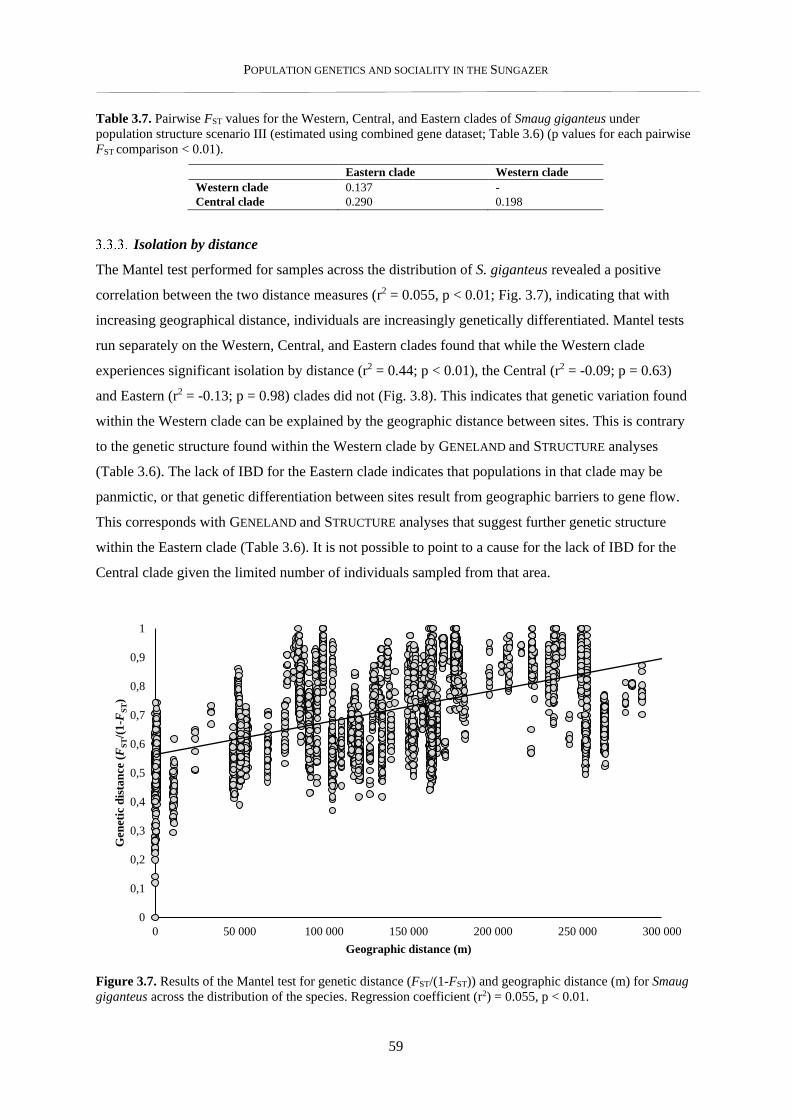
POPULATION GENETICS AND SOCIALITY IN THE SUNGAZER
59
Table 3.7. Pairwise FST values for the Western, Central, and Eastern clades of Smaug giganteus under
population structure scenario III (estimated using combined gene dataset; Table 3.6) (p values for each pairwise
FST comparison < 0.01).
Eastern clade Western clade
Western clade 0.137 -
Central clade 0.290 0.198
Isolation by distance
The Mantel test performed for samples across the distribution of S. giganteus revealed a positive
correlation between the two distance measures (r2 = 0.055, p < 0.01; Fig. 3.7), indicating that with
increasing geographical distance, individuals are increasingly genetically differentiated. Mantel tests
run separately on the Western, Central, and Eastern clades found that while the Western clade
experiences significant isolation by distance (r2 = 0.44; p < 0.01), the Central (r2 = -0.09; p = 0.63)
and Eastern (r2 = -0.13; p = 0.98) clades did not (Fig. 3.8). This indicates that genetic variation found
within the Western clade can be explained by the geographic distance between sites. This is contrary
to the genetic structure found within the Western clade by GENELAND and STRUCTURE analyses
(Table 3.6). The lack of IBD for the Eastern clade indicates that populations in that clade may be
panmictic, or that genetic differentiation between sites result from geographic barriers to gene flow.
This corresponds with GENELAND and STRUCTURE analyses that suggest further genetic structure
within the Eastern clade (Table 3.6). It is not possible to point to a cause for the lack of IBD for the
Central clade given the limited number of individuals sampled from that area.
Figure 3.7. Results of the Mantel test for genetic distance (FST/(1-FST)) and geographic distance (m) for Smaug
giganteus across the distribution of the species. Regression coefficient (r2) = 0.055, p < 0.01.
0
0,1
0,2
0,3
0,4
0,5
0,6
0,7
0,8
0,9
1
0 50 000 100 000 150 000 200 000 250 000 300 000
Gen
etic
dis
tan
ce (
FS
T/(
1-F
ST)
Geographic distance (m)
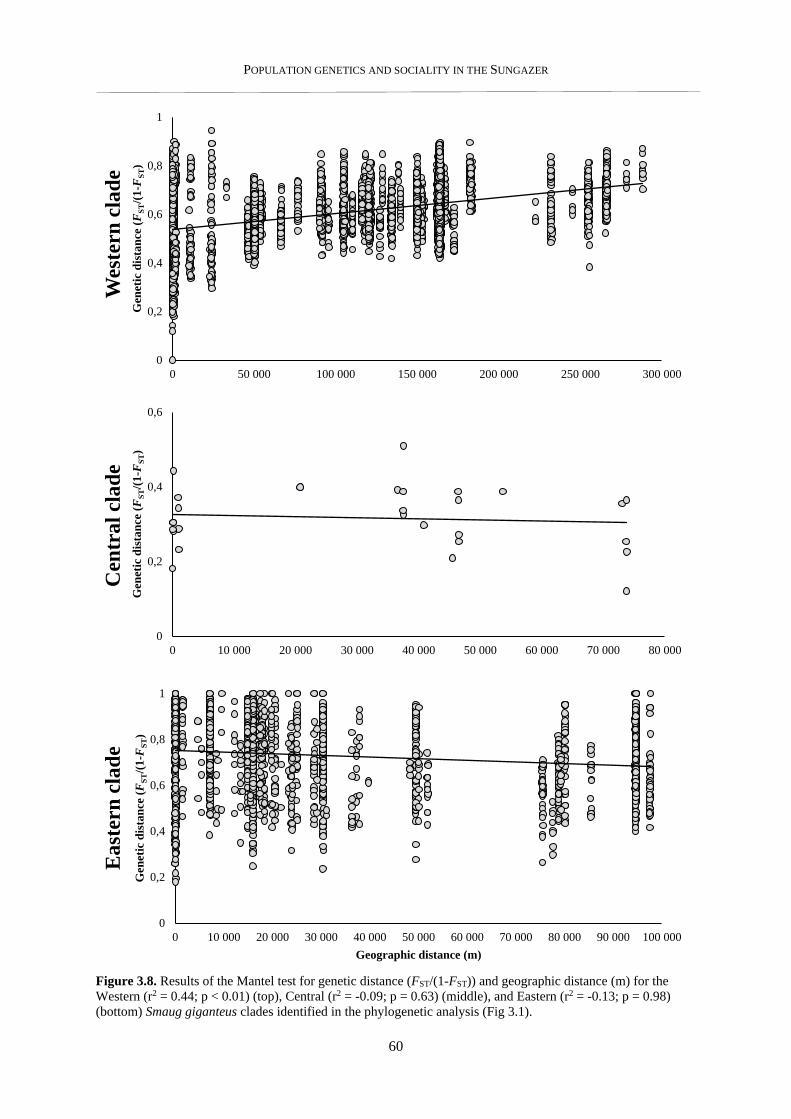
POPULATION GENETICS AND SOCIALITY IN THE SUNGAZER
60
Figure 3.8. Results of the Mantel test for genetic distance (FST/(1-FST)) and geographic distance (m) for the
Western (r2 = 0.44; p < 0.01) (top), Central (r2 = -0.09; p = 0.63) (middle), and Eastern (r2 = -0.13; p = 0.98)
(bottom) Smaug giganteus clades identified in the phylogenetic analysis (Fig 3.1).
0
0,2
0,4
0,6
0,8
1
0 50 000 100 000 150 000 200 000 250 000 300 000
Gen
etic
dis
tan
ce (
FS
T/(
1-F
ST)
Wes
tern
cla
de
0
0,2
0,4
0,6
0 10 000 20 000 30 000 40 000 50 000 60 000 70 000 80 000
Gen
etic
dis
tan
ce (
FS
T/(
1-F
ST)
Cen
tra
l cl
ad
e
0
0,2
0,4
0,6
0,8
1
0 10 000 20 000 30 000 40 000 50 000 60 000 70 000 80 000 90 000 100 000
Gen
etic
dis
tan
ce (
FS
T/(
1-F
ST)
Geographic distance (m)
East
ern
cla
de
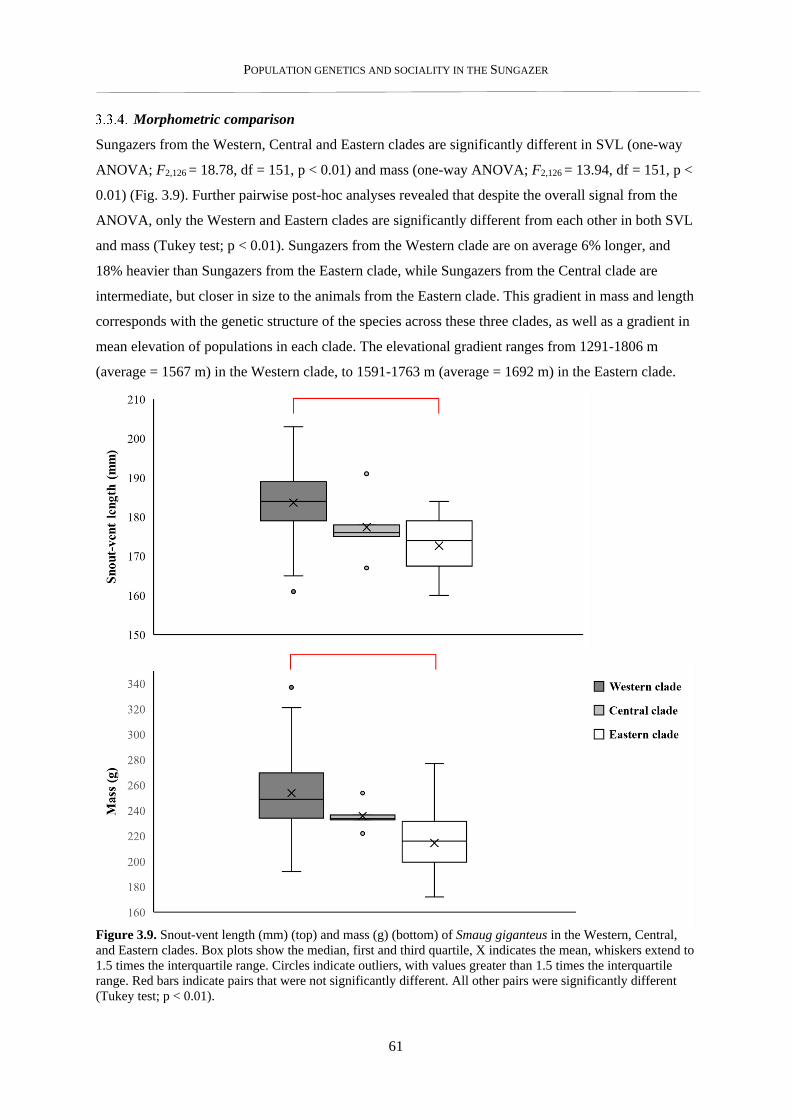
POPULATION GENETICS AND SOCIALITY IN THE SUNGAZER
61
Morphometric comparison
Sungazers from the Western, Central and Eastern clades are significantly different in SVL (one-way
ANOVA; F2,126 = 18.78, df = 151, p < 0.01) and mass (one-way ANOVA; F2,126 = 13.94, df = 151, p <
0.01) (Fig. 3.9). Further pairwise post-hoc analyses revealed that despite the overall signal from the
ANOVA, only the Western and Eastern clades are significantly different from each other in both SVL
and mass (Tukey test; p < 0.01). Sungazers from the Western clade are on average 6% longer, and
18% heavier than Sungazers from the Eastern clade, while Sungazers from the Central clade are
intermediate, but closer in size to the animals from the Eastern clade. This gradient in mass and length
corresponds with the genetic structure of the species across these three clades, as well as a gradient in
mean elevation of populations in each clade. The elevational gradient ranges from 1291-1806 m
(average = 1567 m) in the Western clade, to 1591-1763 m (average = 1692 m) in the Eastern clade.
Figure 3.9. Snout-vent length (mm) (top) and mass (g) (bottom) of Smaug giganteus in the Western, Central,
and Eastern clades. Box plots show the median, first and third quartile, X indicates the mean, whiskers extend to
1.5 times the interquartile range. Circles indicate outliers, with values greater than 1.5 times the interquartile
range. Red bars indicate pairs that were not significantly different. All other pairs were significantly different
(Tukey test; p < 0.01).
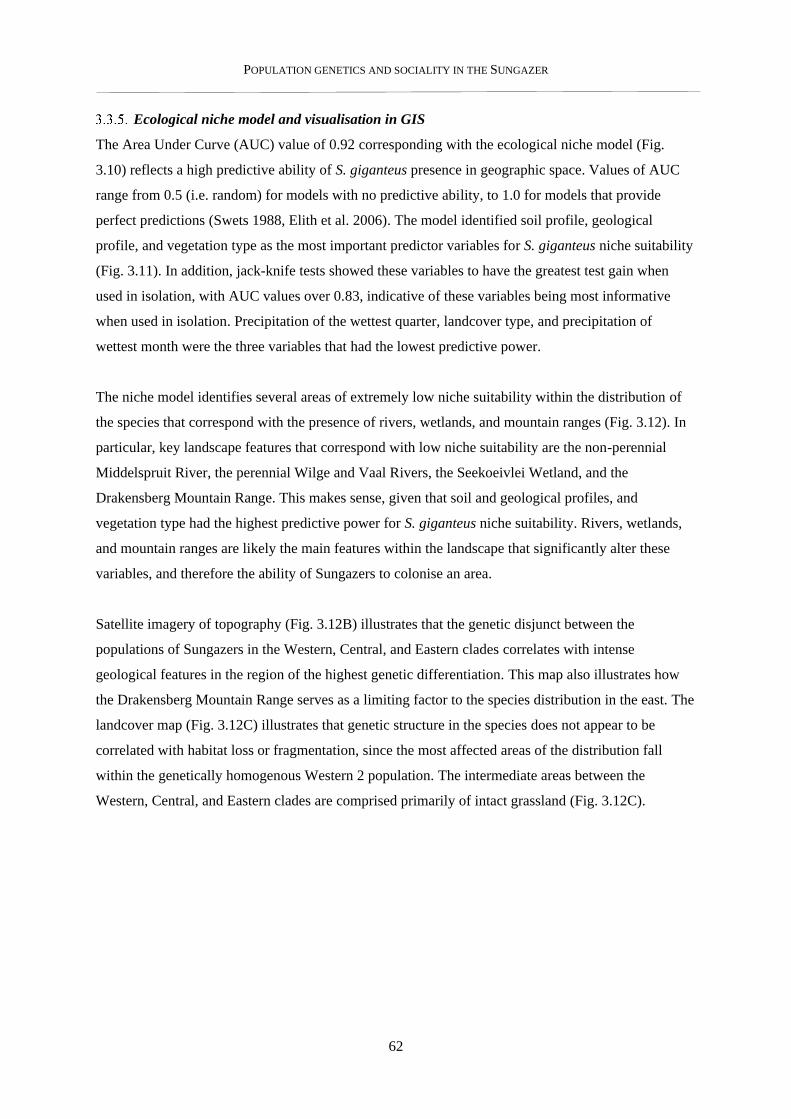
POPULATION GENETICS AND SOCIALITY IN THE SUNGAZER
62
Ecological niche model and visualisation in GIS
The Area Under Curve (AUC) value of 0.92 corresponding with the ecological niche model (Fig.
3.10) reflects a high predictive ability of S. giganteus presence in geographic space. Values of AUC
range from 0.5 (i.e. random) for models with no predictive ability, to 1.0 for models that provide
perfect predictions (Swets 1988, Elith et al. 2006). The model identified soil profile, geological
profile, and vegetation type as the most important predictor variables for S. giganteus niche suitability
(Fig. 3.11). In addition, jack-knife tests showed these variables to have the greatest test gain when
used in isolation, with AUC values over 0.83, indicative of these variables being most informative
when used in isolation. Precipitation of the wettest quarter, landcover type, and precipitation of
wettest month were the three variables that had the lowest predictive power.
The niche model identifies several areas of extremely low niche suitability within the distribution of
the species that correspond with the presence of rivers, wetlands, and mountain ranges (Fig. 3.12). In
particular, key landscape features that correspond with low niche suitability are the non-perennial
Middelspruit River, the perennial Wilge and Vaal Rivers, the Seekoeivlei Wetland, and the
Drakensberg Mountain Range. This makes sense, given that soil and geological profiles, and
vegetation type had the highest predictive power for S. giganteus niche suitability. Rivers, wetlands,
and mountain ranges are likely the main features within the landscape that significantly alter these
variables, and therefore the ability of Sungazers to colonise an area.
Satellite imagery of topography (Fig. 3.12B) illustrates that the genetic disjunct between the
populations of Sungazers in the Western, Central, and Eastern clades correlates with intense
geological features in the region of the highest genetic differentiation. This map also illustrates how
the Drakensberg Mountain Range serves as a limiting factor to the species distribution in the east. The
landcover map (Fig. 3.12C) illustrates that genetic structure in the species does not appear to be
correlated with habitat loss or fragmentation, since the most affected areas of the distribution fall
within the genetically homogenous Western 2 population. The intermediate areas between the
Western, Central, and Eastern clades are comprised primarily of intact grassland (Fig. 3.12C).
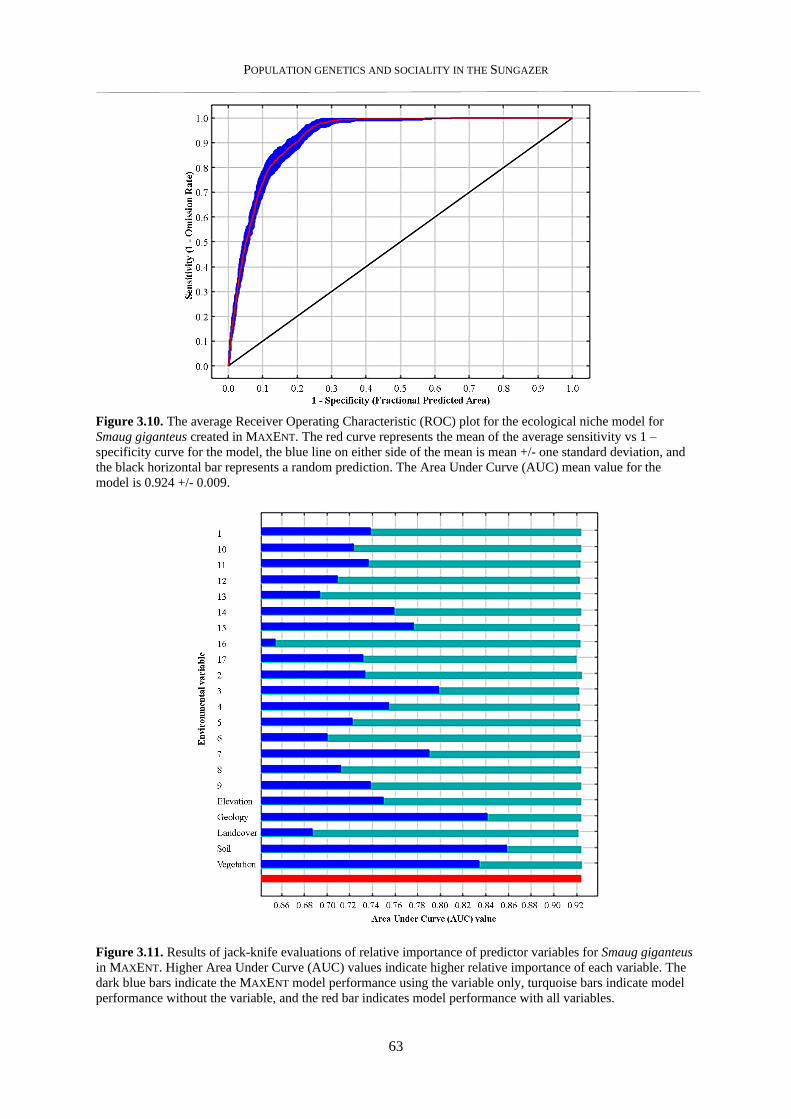
POPULATION GENETICS AND SOCIALITY IN THE SUNGAZER
63
Figure 3.10. The average Receiver Operating Characteristic (ROC) plot for the ecological niche model for
Smaug giganteus created in MAXENT. The red curve represents the mean of the average sensitivity vs 1 –
specificity curve for the model, the blue line on either side of the mean is mean +/- one standard deviation, and
the black horizontal bar represents a random prediction. The Area Under Curve (AUC) mean value for the
model is 0.924 +/- 0.009.
Figure 3.11. Results of jack-knife evaluations of relative importance of predictor variables for Smaug giganteus
in MAXENT. Higher Area Under Curve (AUC) values indicate higher relative importance of each variable. The
dark blue bars indicate the MAXENT model performance using the variable only, turquoise bars indicate model
performance without the variable, and the red bar indicates model performance with all variables.
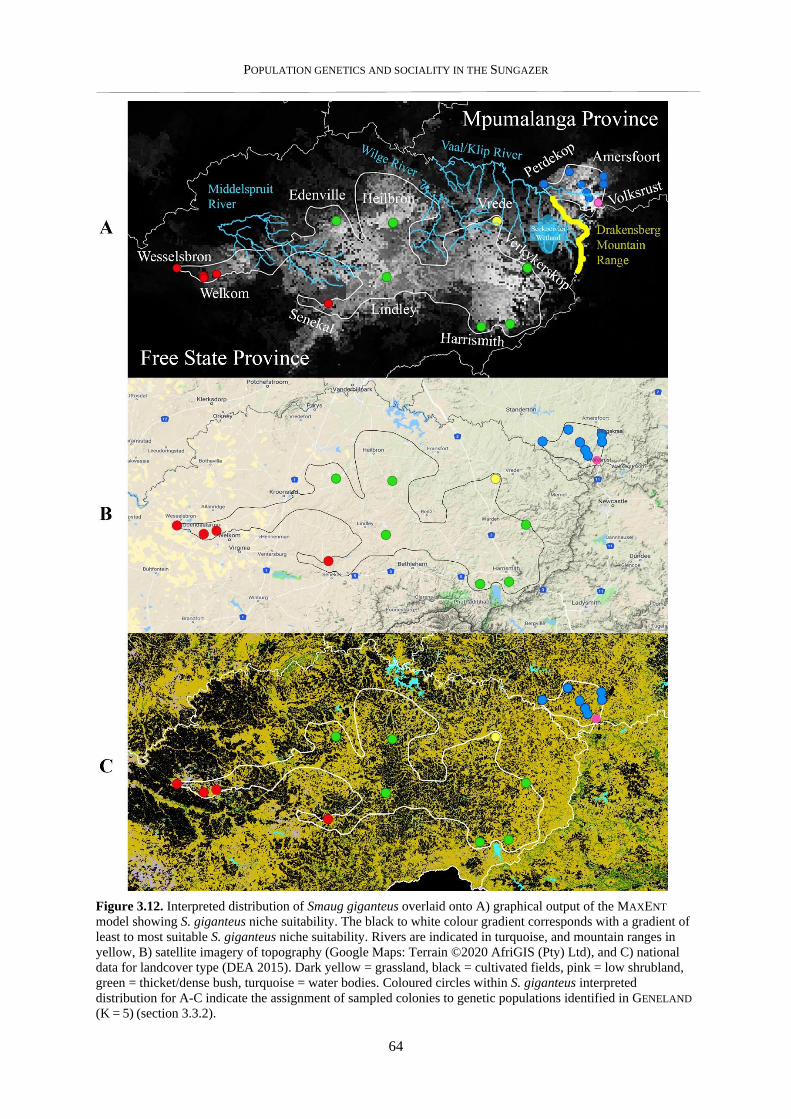
POPULATION GENETICS AND SOCIALITY IN THE SUNGAZER
64
Figure 3.12. Interpreted distribution of Smaug giganteus overlaid onto A) graphical output of the MAXENT
model showing S. giganteus niche suitability. The black to white colour gradient corresponds with a gradient of
least to most suitable S. giganteus niche suitability. Rivers are indicated in turquoise, and mountain ranges in
yellow, B) satellite imagery of topography (Google Maps: Terrain ©2020 AfriGIS (Pty) Ltd), and C) national
data for landcover type (DEA 2015). Dark yellow = grassland, black = cultivated fields, pink = low shrubland,
green = thicket/dense bush, turquoise = water bodies. Coloured circles within S. giganteus interpreted
distribution for A-C indicate the assignment of sampled colonies to genetic populations identified in GENELAND
(K = 5) (section 3.3.2).
POPULATION GENETICS AND SOCIALITY IN THE SUNGAZER
65
3.4. Discussion
Smaug giganteus occurs in five genetically differentiated populations, belonging to three divergent
phylogenetic clades. Phylogenetic analysis using mitochondrial and nuclear gene sequences showed
that the Central (Vrede) and Eastern (Amersfoort, Perdekop, Volksrust) clades are strongly supported,
whereas the Western clade (Wesselsbron, Welkom, Senekal, Edenville, Heilbron, Lindley,
Harrismith, Verkykerskop) forms a large unsupported polytomy. Population genetic analyses using
microsatellite markers indicated that the Western and Eastern clades are each comprised of two
further genetically differentiated populations – Western 1 and Western 2, and Eastern 1 and Eastern 2,
respectively. Isolation by distance, water bodies and mountains appear to be the primary drivers
behind this genetic structure. A series of separate vicariant events over time may have caused the
differentiation of clades and populations as evidenced in the detection of different numbers of
populations by molecular markers with different evolutionary rates. There is a significant and
directional difference in body size of Sungazers between the three clades. Sungazers in the cooler
high elevation eastern clade are smaller in body size than the warmer lower elevation western clade,
while animals in the central clade are intermediate in size.
Although I did not date the phylogenetic tree in this study, Stanley and Bates (2014) found divergence
between Sungazer samples belonging to the Western clade (n = 3) and the Eastern clade (n = 1) in the
early-mid Pleistocene. This timing corresponds with the most recent uplift of the eastern region of the
Great Escarpment ~900 m into the Highveld grasslands during that period approximately 2.5-1.8
MYA (Partridge and Maud 1987). This event resulted in the elevation of the northern most regions of
the Drakensberg Mountain Range, along which the political boundary between the Free State and
Mpumalanga provinces is delineated. The formation of these mountains also appears to have altered
the course of the Wilge River, and lower stretches of the Vaal River and its tributary, the Klip River,
which runs longitudinally just west of the Free State/Mpumalanga boundary. The Klip River feeds
into the Seekoeivlei wetland – the largest floodplain wetlands in the South African highland – which
is also situated just west of the provincial boundaries. The temporal and spatial correlation of
phylogenetic divergence in S. giganteus clades and the formation of these significant geological
features is highly suggestive that these mountains, rivers and wetlands have served as a barrier to gene
exchange between populations on either side of them since the late Pliocene/early-mid Pleistocene.
The Drakensberg Mountain Range and surrounding doleritic intrusions in the eastern Free State and
western Mpumalanga province (De Oliveira and Cawthorn 1999, Holmes and Barker 2006) may all
serve as physical barriers to dispersing Sungazers. Sungazers are large-bodied, heavily armoured
lizards with relatively short limbs, making them well-adapted for defending themselves from
predators within their burrows (Broeckhoven et al. 2015, Arbour and Zanno 2018), but not
POPULATION GENETICS AND SOCIALITY IN THE SUNGAZER
66
particularly well suited for fleeing from predators (Losos et al. 2002). This may also make them poor
dispersers. This morphological build viewed in combination with the sedentary lifestyle of Sungazers
suggests that they would not be able to traverse structurally complex landscapes. Thus, the eruption of
these physical barriers into the homogenous grasslands is likely to have impeded gene flow between
populations on either side of them. The low niche suitability for Sungazers in these montane,
heterogenous environments can clearly be observed in the spatial output of the ecological niche model
conducted in this study. Soil, geology, and vegetation profiles which are the most important predictors
of Sungazer niche suitability are likely to be extremely different from the grasslands in these
environments. Thus, even in the scenario that some individual Sungazers successfully navigate these
complex montane landscapes, these areas are unsuitable for Sungazers to dig burrows into, and are
therefore unlikely to survive for extended periods of time without the safety of a burrow to retreat
into.
Although Stanley and Bates (2014) did not include samples from the Central clade in their dated
phylogeny, the genetic differentiation between the Western, Central, and Eastern clades could all
possibly be explained by the same vicariant event, since the spatial partitioning of these genetic clades
are all associated with geological intrusions in that region. Similarly, the genetic differentiation
detected between the Eastern 1 and Eastern 2 genetic populations with the Eastern clade appears to be
correlated with a structurally complex landscape in that region. The escarpments and ridges that occur
between the Eastern 1 and Eastern 2 populations are at a much lower elevation than those between
clades, but may nevertheless impede gene flow between the colonies that surround it. GENELAND,
which is spatially explicit in its analysis, showed that the Eastern 2 population contains only the
Volksrust 3 colony, whereas STRUCTURE which is not spatially explicit, also included the Amersfoort
2, Volksrust 1, and Volksrust 2 colonies into this population. Several individuals in the Amersfoort 2,
Volksrust 1, and Volksrust 2 colonies showed partial assignment to both the Eastern 1 and Eastern 2
populations in the STRUCTURE analysis. This indicates that while these three may experience
admixture between the two genetic groups, the colonies on the northwest and southeast borders of the
Eastern clade do not exchange genetic material. The relative complexity of the landscape in the
Eastern clade compared to the Western clade suggests that high levels of genetic differentiation may
occur even across relatively short distance in the Eastern clade.
Mountain ranges are commonly serve as genetic barriers to reptiles (Jacobsen and Pienaar 1983,
Turner et al. 2003, Gholamifard 2011). The physical terrain may be difficult for individuals to
traverse, and the microclimate at high elevations may be unsuitable for many species to inhabit. The
majority of the Cordylidae however, are rupicolous, and in most cases mountain ranges do not
necessarily impede flow. In rupicolous species, divergence may be related to other geoclimactic
POPULATION GENETICS AND SOCIALITY IN THE SUNGAZER
67
processes. Cladogenesis in the Smaug warreni complex is suggested to have resulted primarily from
climactic cooling during the Miocene (Stanley and Bates 2014). The drop in climate may have
resulted in an increase in suitable habitat for the species complex, resulting in expansion and dispersal
into new areas. Radiation in the Platysaurus is traditionally thought to have resulted from the eastern
migration of the Kalahari sands in the Plio-Pleistocene, fragmenting populations (Broadley 1978).
Although (Scott et al. 2004) suggest that speciation events in Platysaurus occurred prior to the
ingression of the Kalahari sands and that speciation may rather be aligned with the formation of major
river systems. In Hemicordylus capensis and Cordylus cordylus, river valleys appear to serve as a
physical barriers to dispersal (Stanley 2013, Diedericks and Daniels 2014). The TweeRivier and
Breede River valleys both contain microclimate and ecological conditions that are unfavourable to
these species, and are therefore unlikely to be traversed by them, impeding gene flow. Hemicordylus
capensis and C. cordylus, like most other cordylid species, have adapted to montane habitats, and
gene flow in these species is facilitated by rather than impeded by mountains. In each of these cases, it
is clear that montane habitat does not appear to inhibit gene flow, but rather may facilitate it. The
mountain barriers detected for S. giganteus in my study are therefore likely to be rare amongst
cordylids.
The thickset heavy bodies of Sungazers also appear to limit their movements across water bodies. The
Middelspruit River, Wilge River, Vaal River (and its tributary, the Klip River), and Seekoeivlei
Wetland in particular all correlate with low niche suitability, and genetic differentiation of populations
that occur on either side of them. Loveridge (1944) noted that Sungazers appear to not be able to
swim, sinking and drowning when introduced to a body of water. Field observations suggest that
during heavy rainfall, Sungazers remain weighted at the bottom of the burrow, and do not float to the
surface even when the burrow is fully flooded (pers. obs). This is likely due to their heavily ossified
spines that serve as armour, but also make them heavy. This apparent negative buoyancy of Sungazers
might prevent them from crossing even small water bodies. The Wilge and Vaal/Klip are wide,
perennial rivers, and therefore unlikely to be traversed by Sungazers. The Seekoeivlei Wetland is also
permanently inundated, and its 12 000 hectares represent an unhabitable environment to Sungazer in
its entirety. Each of these three latter water bodies also occur in the montane habitat in the east of the
distribution, and their influence on gene flow between Sungazer populations is difficult to isolate from
the surrounding montane areas. It is likely however, that these water bodies in combination with the
montane habitat that they are associated with, present strong barriers to dispersing Sungazers.
The non-perennial Middelspruit River flows between the Western 1 and Western 2 populations in the
Western clade. The river is associated with Highveld Alluvial Vegetation (Aza 5; Mucina and
Rutherford 2006), which is seasonally flooded and underlain by coarse sand which is an unsuitable
POPULATION GENETICS AND SOCIALITY IN THE SUNGAZER
68
substrate for the construction of Sungazer burrows. The area surrounding the Middelspruit River has
been dominated by alien plants in recent times (Mucina and Rutherford 2006), and has also been
heavily transformed for use as crop fields. The genetic disjunct between the Western 1 and Western 2
populations was not detected in the phylogenetic analysis using mitochondrial and nuclear gene
sequences, only with the use of rapidly evolving microsatellite markers. This may indicate that the
non-perennial nature of this river could allow for limited dispersal of individuals over periods when
the river does not flow, such that long-term genetic isolation of populations on either side of the river
is not experienced. A significant isolation by distance signal was detected within the Western clade,
and the correlation of genetic differentiation of populations with the location of the river may not
reflect the true cause of this genetic structure. The interpretation of the Middelspruit River as a
putative barrier to gene flow therefore needs to be taken with caution.
Rivers serve as barriers to dispersal in many reptiles, both within and between species (Pounds and
Jackson 1981, Rodrigues and Juncá 2002, Pellegrino et al. 2005, Ratsoavina et al. 2012, Souza et al.
2013, Somers et al. 2017). The level of genetic differentiation between populations is often linked to
the size of the river and therefore its effectiveness as a barrier (Pounds and Jackson 1981, Hayes and
Sewlal 2004). Nevertheless, even fairly narrow rivers (~20 m wide), can serve as a significant barriers
to gene flow in species that are not adept at traversing large bodies of water (Pounds and Jackson
1981, Ratsoavina et al. 2012). Rivers appear to have resulted in several vicariant events in the
Cordylidae. Stanley and Bates (2014) suggest that the increased volume of the Limpopo River in the
late Miocene correlates with Smaug regius and S. mossambicus splitting from the rest of the Smaug
warreni species complex. Similarly, Scott et al. (2004) found that genetic differentiation between
Platysaurus mitchelli and P. m. maculatus from the rest of the Platysaurus family to be concomitant
with the flow of the Zambezi River system. In Hemicordylus capensis and Cordylus, river valleys
appear to serve as a physical barriers to dispersal (Stanley 2013, Diedericks and Daniels 2014). As
opposed to the rivers themselves, population differentiation in both species is suggested to occur due
to unfavourable microclimate and ecological conditions within the valley that reduce the likelihood of
individuals traversing them (Stanley 2013, Diedericks and Daniels 2014). It is clear that rivers and
their associated microclimates are important barriers to species in the Cordylidae. More focused
studies on the differentiation between Sungazer colonies on either side of the various rivers within the
species distribution may elucidate the specific effect that each river has on genetic structure.
Isolation by distance was detected across the distribution of S. giganteus. Further tests on each
phylogenetic clades identified in my study indicate that isolation by distance is only present in the
Western clade, and not the Central and Eastern clades. The geographic area covered by the Western
clade populations is significantly larger than the other two clades, and much more homogenous in the
POPULATION GENETICS AND SOCIALITY IN THE SUNGAZER
69
complexity of the landscape. Sungazers in this clade therefore appear to have few significant barriers
to dispersal, and the geographic distance alone between colonies may serve to limit dispersal.
Therefore the limited dispersal ability of Sungazers also lends to the genetic structuring identified
within the Western clade using population genetic analyses. Isolation by distance signals are stronger
in species that are small in body size (Jenkins et al. 2007), or poor dispersers (Pinto et al. 2019).
Ectotherms are also twice as likely to exhibit IBD patterns that endotherms, suggesting the influence
of metabolic processes on gene flow in ectothermic species (Jenkins et al. 2010). The familial nature
of Sungazer colonies (detailed in Chapter 4), high-site fidelity of individuals (Ruddock 2000, Stanton-
Jones 2018), low mobility of individuals (Losos et al. 2002), and IBD signal in the homogenous
Western clade all indicate the Sungazers are poor dispersers, and prone to the emergence of genetic
structure through distance alone.
Vegetation type was identified as an important predictor variable for Sungazer niche suitability, but
vegetations bioregions did not correlate with genetic differentiation between populations. Although
the vegetation type changes from the dryer and warmer Dry Highveld Grassland bioregion in the west
into the wetter, cooler Mesic Highveld Grassland in the east – both these vegetation types are
dominated by the grass species Themeda triandra with which S. giganteus is closely associated. It is
possible that the soil conditions and invertebrate prey assemblages associated with T. triandra are
beneficial to S. giganteus. The presence or absence of other plant species in these assemblages is
therefore less likely to have any effect of significance on the species’ distribution or genetic structure.
The level of genetic differentiation between the Western, Central, and Eastern clades identified in my
study are relatively high (FST = 0.137-0.290) (Wright 1965). The Central and Eastern clades showed
the highest genetic differentiation, despite the small geographic distance between them. Results from
population level SAMOVA analyses show that there is almost no mixing of haplotypes between these
major clades, indicating that the putative mountain, river, and wetland barriers between them may be
absolute. The genetic differentiation between the Western and Eastern clades is lower than that
between the Western and Central clades, despite the greater geographic distance between the former
two clades. This may indicate that Sungazers in the Central are the most genetically distinct from the
three clades. This population is the smallest of the three clades, and few individuals were sampled
from this area, in part due to the rarity of the species in the region. The small size of the population,
isolation from other populations, and putative age of isolation may have resulted in increased genetic
drift and lower genetic diversity in the Central clade Sungazers. Eventually, such cases may result in
population bottlenecks and local extirpation. Due to the small sample sizes, analyses of a population
bottleneck was not possible for the Central clade population. It therefore remains unknown whether
the population experiences any negative genetic effects as a result of its small population size and
POPULATION GENETICS AND SOCIALITY IN THE SUNGAZER
70
apparent isolation from other populations. More concerted sampling efforts within the Central clade
may elucidate whether Sungazers in this clade are more at risk of extinction than those in the other
clades.
There is no evidence to suggest that the genetic structure detected in my study is caused by human-
mediated processes such as habitat fragmentation. In fact, areas with the highest degree of habitat loss
and fragmentation such as the region between Heilbron, Lindley, and Harrismith had no discernible
genetic structure between them. The intermediate area between the highly differentiated Western,
Central, and Eastern clades are montane, and therefore not as intensely utilised for crop production as
the adjacent low lying grassland areas. This was corroborated with results from the ecological niche
model, which showed that landcover type had very low predictive power of niche suitability. This was
surprising since landcover change is one of the factors that has most affected Sungazer distributions
over the past century. This can be explained however, in that Sungazer colonies persist in small
patches of remaining grassland even within heavily fragmented areas. Soil and geological profiles that
are good predictors for Sungazer niche quality are also good predictors of suitability for crop farming.
This indicates the extent of optimal Sungazer habitat that has been irreversibly transformed for crop
production in the area.
The lack of genetic structure corresponding with the high level of fragmentation does not necessarily
reflect that habitat transformation does not affect gene flow in the species. Allele frequencies respond
to changes in gene flow on an evolutionary time frame rather than an ecological one, and there is
often a time-lag in the population genetic signature expected from fragmented populations (Varvio et
al. 1986, Keyghobadi 2007, Epps and Keyghobadi 2015). The large-scale agricultural land
transformation within the distribution of S. giganteus began around 1840 with the arrival of the first
Afrikaner farmers (Thompson and Berat 2014), although this only intensified around 1960 with the
introduction of tractors that revolutionised ploughing (Pingali et al. 1988). The generation length of
Sungazers is 15 years (Parusnath et al. 2017), and these two periods (1840-2018 and 1960-2018)
equate to only 12 and 4 generations respectively. Reduction in genetic diversity resulting from genetic
drift in isolated may only be detectable after 10-20 generations (Lacy 1987, Landguth et al. 2010,
Blair et al. 2012). Given the long generation time, low dispersal ability, and low fecundity of
Sungazers, increased genetic structure and lower genetic diversity resulting from habitat loss and
fragmentation may therefore only be detected in Sungazer populations within the next 8-16
generations (120-240 years). It is possible that as with other long-lived slow reproducing lizards
(Krawiec et al. 2015), high local abundance of Sungazers may cause genetic inertia that slows the
genetic impact of fragmentation from being detected above the natural effects of historical patterns of
isolation by distance. It is therefore imperative to continue monitoring the genetic structure of
POPULATION GENETICS AND SOCIALITY IN THE SUNGAZER
71
Sungazer populations within this time period, such that the manifestation of human-mediated habitat
change is recognised in future. Preventative measures should also be considered in conservation
management plans, such as restoration of fallowed grassland and the maintenance of dispersal
corridors.
Delayed temporal responses to habitat responses appear to be common in long-live species in
fragmented areas. Egernia cunninghami populations in fragmented habitats did not show signs of
increased inbreeding or lowered heterozygosity compared to natural habitats after 70+ years/14
generations (Stow and Sunnucks 2004) despite altered dispersal patterns (Stow et al. 2001).
Inbreeding avoidance behaviour is cited as an explanation of the lack of the negative genetic effects
on E. cunninghami populations in fragmented habitats (Stow and Sunnucks 2004), although it is
possible that these effects have not yet fully manifested in extant E. cunninghami populations. Other
studies on lizard species in agricultural areas have found that after 20 years/10 generations (Ctenotus
fallens, Krawiec et al. 2015), 60 years/12 generations (Eulamprus heatwolei, Lyndon-Gee et al. 2018),
60 years/15 generations (Plestiodon reynoldsi, Mccoy et al. 2010), 90 years/30-38 generations (P.
reynoldsi, Richmond et al. 2009), no significant effects on genetic structure are reported.
An important consideration in these studies is the type of marker used, and the scale at which the
study is done. Gnypetoscincus queenslandiae showed no clear impact of forest clearing on genetic
structure after 70 years/11 generations using mtDNA (Cunningham 1993, Cunningham and Moritz
1998), but similar analysis using rapidly evolving microsatellite markers found signs of declining
genetic diversity and smaller effective population sizes in fragmented areas after 80 years/12
generations (Sumner et al. 2004). Even in the latter study however, the effects of forest clearing on
genetic structure in G. queenslandiae were much lower than expected. Gnypetoscincus queenslandiae
may also be experiencing a time-lag effects. Moore et al. (2008) reported genetic differentiation
amongst populations of Sphenodon punctatus as a result of recent habitat modification after only 2-3
generations (110 years). The study on this long-lived species was conducted a finer geographic scale
than most other comparable studies on reptiles and highlights the danger of only assessing genetic
impacts of habitat fragmentation at a broad-scale. Further analyses that statistically interrogate the
link between habitat fragmentation (through variables such as road, crop and human population
density) and genetic structure in Smaug giganteus may reveal further insight into how anthropogenic
factors influence gene flow in the species.
Sungazers from the Western and Eastern clades are significantly different in body size. Individuals of
both sexes from the Western clade being longer and heavier than those from Eastern clade. The
Central clade individuals are intermediate in both length and mass, and not significantly different
POPULATION GENETICS AND SOCIALITY IN THE SUNGAZER
72
from the Western or Eastern clades. Populations in the Eastern clade are 140 m higher in elevation
than populations in the Western clade on average, mean temperatures are lower than the west by 25%
in summer, and 23% in winter, and experience 60% more annual precipitation than the Western clade
(Van Wyk 1992). This clinal trend from west to east appears to indicate that S. giganteus, like some
other squamate species, follow the inverse of Bergmann’s rule, i.e. decreasing body size within a
species with increasing elevation or possibly decreasing environmental temperature (Ashton and
Feldman 2003).
Smaller body sizes in cooler climates may be the result of selection for increased surface area to
volume ratio to allow more rapid heating and cooling (Cowles 1945, Bogert 1949, Stevenson 1985a,
1985b). Because optimal body temperature may be constant throughout the geographic range of a
species (Bogert 1949), smaller individuals in cooler environments may be able to more finely control
their body temperature behaviourally and be active for a greater proportion of the day. Such
thermoregulatory abilities may be critically important for digestion and development in squamates
that inhabit cooler areas, since many squamates swallow food items whole or in large pieces, and
retain young for long periods (Pianka and Vitt 2003, Pincheira-Donoso et al. 2008). In warmer
climates, on the other hand, thermoregulation may not be such an important factor (Shine and Madsen
1996), thereby relaxing selective pressure on an organism’s surface area to mass ratio, and permitting
squamates to attain larger sizes (Arnold and Peterson 1989).
Bergmann’s rule (and its inverse) however, is a controversial and much debated concept when applied
to ectotherms (Angilletta, Jr., and Dunham 2003, Angilletta, Jr. et al. 2004, Sears and Angilletta, Jr.
2004). An intercontinental analysis of 65 squamate species found that 6% of species supported
Bergmann’s rule, 9% follow its inverse, and the remaining 85% showed no generalised trend between
body size and climate or elevation (Pincheira-Donoso and Meiri 2013). It is prudent therefore to also
consider other explanations for the difference in body sizes of Sungazers in different clades, since
although Sungazers show a clear correlation between body size and climate/elevation, this not
necessarily imply causation in a genetic sense. Prey availability is another factor that may directly
influence body size. For example, snakes fed a high-energy diet are heavier at maturity than those fed
a low-energy diet (Ford and Seigel 1989, 1994). Sungazers in cooler areas may experience fewer food
resources, resulting in smaller body sizes. Studies of captive rearing of Sungazers from different
clades with the same diet may elucidate whether body size is in fact determined by its genotype, or
simply a morphologically plastic trait (Stillwell 2010). In the case that body size is linked to genetic
differentiation between clades, this phenotypic change may result from random genetic drift and
mutation, and not necessarily local adaptation. Further studies are required to elucidate the link or lack
thereof, between these variables.
POPULATION GENETICS AND SOCIALITY IN THE SUNGAZER
73
The findings of my study have implications for the management of this species and its habitat. The
Highveld grasslands that the species occupy are already heavily transformed, and further utilisation of
this land for agricultural, urban, or infrastructural developments threaten existing populations. Efforts
to translocate Sungazers from areas earmarked for development should take the genetic structure of
the species reported in this study into account. Translocations among populations may dampen local
adaptation or habitat-specific evolutionary potential and is not advisable (Goldberg et al. 2005). If
inter-population translocations are deemed necessary, a careful cost-benefit analysis of the results of
outbreeding versus inbreeding depression are required (Weeks et al. 2011).
Similar to other grassland species, S. giganteus is susceptible to loss of genetic diversity with
increasing habitat fragmentation and isolation (Herkert 1994, Collinge 2000, Masterson et al. 2009,
Ceballos et al. 2010). Despite the use of rapidly evolving microsatellite markers in my study, no
effects of the severe fragmentation across the species distribution was detected. While this may be a
result of a time-lag due to the long generation time and low fecundity of Sungazers, it may also be an
issue of resolution. My study considered genetic structure at species-scale, and may be too broad to
detect fine-scale genetic structure between populations. More focused, fine-scale investigations of the
genetic structure and diversity of populations within heavily fragmented areas are necessary to
elucidate the current level of genetic structure caused by habitat fragmentation in the species.
Conclusion
My results suggest that Smaug giganteus occurs in three phylogenetic clades, separated by mountain
and river barriers that limit dispersal between them. Cladogenesis is likely to have occurred as a result
of the most recent uprising of the northern reaches of the Drakensberg mountains and the associated
geological changes during the late Pliocene. Sungazers from these clades are different in body size,
with body size decreasing with higher elevations and lower temperatures. The Western and Eastern
clades are further divided into two more recent genetic populations, detected through use of rapidly
evolving microsatellite markers. The genetic break between the Western 1 and Western 2 genetic
population corresponds geographically with the non-perennial Middelspruit River, although an IBD
signal was detected within the Western clade. Further and more fine-scale research is required to
elucidate whether the river or IBD is the effector of genetic structure within that clade. Despite intense
fragmentation of primary grasslands in some areas of the species distribution, no clear effect of these
processes were detected in my analyses. This suggests that like many other species with long
generation length and low fecundity, S. giganteus may experience a temporal lag between reduced
dispersal and gene flow between populations and genetic structure. The genetic structure of the

POPULATION GENETICS AND SOCIALITY IN THE SUNGAZER
74
species and the potential future manifestation of habitat fragmentation are therefore important factors
to consider in conservation management plans for the species.
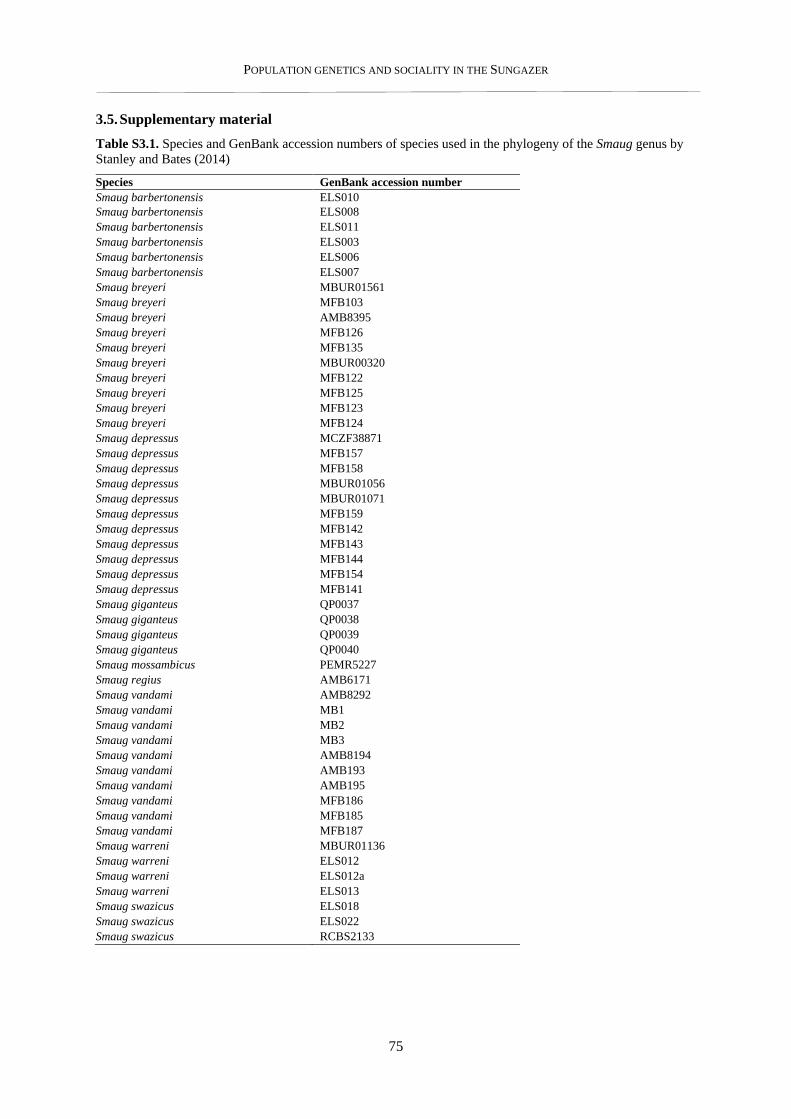
POPULATION GENETICS AND SOCIALITY IN THE SUNGAZER
75
3.5. Supplementary material
Table S3.1. Species and GenBank accession numbers of species used in the phylogeny of the Smaug genus by
Stanley and Bates (2014)
Species GenBank accession number
Smaug barbertonensis ELS010
Smaug barbertonensis ELS008
Smaug barbertonensis ELS011
Smaug barbertonensis ELS003
Smaug barbertonensis ELS006
Smaug barbertonensis ELS007
Smaug breyeri MBUR01561
Smaug breyeri MFB103
Smaug breyeri AMB8395
Smaug breyeri MFB126
Smaug breyeri MFB135
Smaug breyeri MBUR00320
Smaug breyeri MFB122
Smaug breyeri MFB125
Smaug breyeri MFB123
Smaug breyeri MFB124
Smaug depressus MCZF38871
Smaug depressus MFB157
Smaug depressus MFB158
Smaug depressus MBUR01056
Smaug depressus MBUR01071
Smaug depressus MFB159
Smaug depressus MFB142
Smaug depressus MFB143
Smaug depressus MFB144
Smaug depressus MFB154
Smaug depressus MFB141
Smaug giganteus QP0037
Smaug giganteus QP0038
Smaug giganteus QP0039
Smaug giganteus QP0040
Smaug mossambicus PEMR5227
Smaug regius AMB6171
Smaug vandami AMB8292
Smaug vandami MB1
Smaug vandami MB2
Smaug vandami MB3
Smaug vandami AMB8194
Smaug vandami AMB193
Smaug vandami AMB195
Smaug vandami MFB186
Smaug vandami MFB185
Smaug vandami MFB187
Smaug warreni MBUR01136
Smaug warreni ELS012
Smaug warreni ELS012a
Smaug warreni ELS013
Smaug swazicus ELS018
Smaug swazicus ELS022
Smaug swazicus RCBS2133
POPULATION GENETICS AND SOCIALITY IN THE SUNGAZER
76
CHAPTER 4
KIN-BASED SOCIALITY IN THE SUNGAZER (SMAUG GIGANTEUS)
4.1. Introduction
Sociality in animal populations comprises of a complex suite of behaviours that range from rare,
transient interactions between unrelated individuals, to long-term monogamy, stable aggregations, and
parental care (Ward and Webster 2016, Lukas and Clutton-Brock 2018, Kramer and Meunier 2019).
Complex social behaviours such as fraternal, kin-based sociality have traditionally been associated
with vertebrate classes such as mammals and birds (Stahlschmidt 2011, Doody et al. 2013). Reptiles,
on the other hand, have long been thought to align closely with the traditional “r-selected” strategy –
characterised by early age of first reproduction, large litter size, and minimal parent-offspring
interaction (see Dunham 1982). However, research on reptile behaviour and social structure,
particularly over the past two decades, has illuminated the level of complex kin-based sociality
present in a variety of reptile species (Gardner et al. 2016, Whiting and While 2017, While et al.
2019). In fact, recent phylogeny-based research has estimated that up to 10% of squamate reptile
species may exhibit some form of complex kin-based sociality (Halliwell et al. 2017b).
Kin-based sociality in squamates can consist of long-term stable groups, refuge sharing, pair
monogamy, and prolonged parent-offspring interaction (Bull 2000, Lanham and Bull 2000, Gardner et
al. 2001, 2016, Duffield and Bull 2002, Whiting and While 2017, Alexander 2018). While group-
living may present disadvantages to the individual such as competition for resources and inbreeding
(Leu et al. 2011), the many potential benefits of group-living may supersede these disadvantages, and
drive the evolution of complex sociality. Advantages of group-living in squamates include increased
vigilance for predator avoidance, increased offspring survival through parental care or parental
tolerance, social learning, inheritance of territory, and a reduction in conspecific aggression
(Langkilde et al. 2007, McAlpin et al. 2011, Munch et al. 2018, Riley et al. 2018, Whiting et al.
2018). Species that display kin-based sociality often share similar life-history traits, including late age
of first reproduction, long life-span (and/or generation length), large body size, live birth, and small
litter size (Pianka and Vitt 2003, Halliwell et al. 2017b, Whiting and While 2017). Although
aggregations have been reported in almost 100 squamates species (Gardner et al. 2016), this trait
appears to be more prevalent in lizards than in snakes (Halliwell et al. 2017b). This is likely a result of
the higher prevalence of live birth and stable social groupings in lizards than in snakes. Live birth in
particular appears to be an ancestral state in most squamates with stable social groups, and may be an
important precursor to the evolution of kin-based sociality in reptiles (Halliwell et al. 2017b).
POPULATION GENETICS AND SOCIALITY IN THE SUNGAZER
77
Although numerous studies have detailed the systems of egalitarian sociality in lizards (eg. Qi et al.
2012, Strickland et al. 2014), the body of work investigating fraternal sociality in lizards has been
significantly biased towards the Egerniiae subfamily (consisting of eight genera: Egernia, Liopholis,
Lissolepis, Bellatorias, Cyclodomorphus, Tiliqua, Tribolonotus and Corucia; While et al. 2019),
hereafter referred to as the Egernia group. Aside from this group, detailed studies on kin-based
sociality utilising a combination of genetic evidence and long-term population monitoring have only
been conducted on three other species in three families – Xantusia vigilis ( Xantusiidae; Davis et al.
2011, Rice and Edward 2017), Liolaemus leopardinus (Liolaemidae; Brito 2017), and Intellagama
lesueurii (Agamidae; Piza-Roca et al. 2019) . Several other species of lizard that live in stable
aggregations may also potentially exhibit kin-based sociality, however, without genetic investigations
into the relatedness of the individuals in these groups, it is challenging to ascertain the true nature of
these relationships (Gardner et al. 2016).
The Cordylidae family of lizards endemic to Africa contains several species that display aggregative
behaviour, ranging from ephemeral groups that temporarily co-occupy refuge sites, to what appear to
be long-term stable groups (Gardner et al. 2016). Studies investigating social behaviour in the family
have ranged from observations of antagonistic and territorial behaviour of lizards in captivity
(Cordylus - Wirminghaus 1990, Cordylus macropholis - Nieuwoudt et al. 2003), aggregation
behaviour in captivity (C. cordylus, C. macropholis, Ouroborus cataphractus - Visagie et al. 2005),
aggregation behaviour in wild-living lizards (O. cataphractus - Effenberger 2004), social interactions
in wild-living lizards (Smaug giganteus - Ruddock 2000), as well as the role of scent glands in social
behaviour (S. giganteus - Ruddock 2000). While these studies have illuminated several aspects of
sociality in this family, key traits of kin-based sociality, such as parent-offspring associations, are only
identifiable using molecular techniques (Gardner et al. 2016). Given that most members of the family
share many life-history characteristics (late age of first reproduction, long life-span (and/or generation
length), live birth, and small litter size) with other highly social lizard species, detailed genetic work
on this group may reveal the presence and extent of kin-based sociality in the taxon.
The Sungazer (Smaug giganteus) is a species of Cordylidae that appears to display many signs of kin-
based sociality analogous with other highly social lizard species. Smaug giganteus is an obligate
burrowing species endemic to the Highveld grasslands of South Africa (De Waal 1978, Jacobsen
1989). Individuals live in self-excavated burrow systems that form part of a colony – a discrete
aggregation of burrows spatially isolated from adjacent colonies by several kilometres (Jacobsen et al.
1990, Parusnath 2014). These burrows are significant investments in both time and energy, exposing
the animal to predation risk throughout the digging process. Sungazers of both sexes aggressively
defend their burrows against Sungazers from other burrows (Ruddock 2000), and have been recorded
POPULATION GENETICS AND SOCIALITY IN THE SUNGAZER
78
as occupying the same burrow for over a decade (pers. obs.). Branch and Patterson (1975) reported
that Sungazers live in ‘family groups’, with adult females living with offspring in their first few years.
However, without genetic evidence or direct observations of reproduction and birth, it is not possible
to confirm whether these burrows are in fact occupied by family groups, or random aggregations of
unrelated individuals. Given the evidence of aggregative behaviour and other life history traits shared
with highly social lizard species, Smaug giganteus represents an ideal candidate system to investigate
kin-based sociality in African lizards.
In this study, I investigated the system of sociality in S. giganteus using spatial and genetic data from
15 colonies across the distribution of the species. I hypothesised that Sungazers sharing burrow
systems are immediate family members (parent-offspring, sibling-sibling), and in particular, that
juveniles and adults sharing burrows are parent-offspring dyads, regardless of the sex of the adult. I
tested whether Sungazers genotyped from shed skin samples found at burrows differed in their level
of relatedness with other burrow co-inhabitants compared to Sungazers that were captured at the time
of sampling. This was to gain perspective on whether the non-present lizards were unrelated
Sungazers visiting for mating purposes, or close relatives that had since dispersed. I conducted a
parentage analysis to identify the most likely candidate parent-pair of each juvenile Sungazer in the
study. I calculated the relatedness of candidate parent-pairs to each other, to assess whether parent-
pairs are less related to each other than would be expected by chance (i.e. inbreeding avoidance).
To understand the spatial organisation of related individuals within a colony (extra-burrow system), I
firstly investigated the relatedness of nearest-neighbour pairs - hypothesising that nearest neighbour
pairs are extended family (aunts, uncles, cousins, half-siblings). Secondly, I conducted an isolation by
distance analysis for three well-sampled colonies to investigate if there is any spatial structuring
between burrows, within a colony. I hypothesised that relatedness of Sungazers within a colony is
higher than the relatedness of Sungazers between colonies, signifying that colonies are essentially
family groups, consisting of immediate and extended family members (1st and 2nd degree relatives). I
estimated inbreeding coefficients for three well-sampled colonies to investigate whether the high
levels of relatedness recorded in the study are a result of inbreeding, or the natural life-history of the
species. Finally, I compared the relatedness of Sungazers at different spatial scales – within burrows,
between nearest neighbours, within colonies, and between colonies, to assess whether there are spatial
effects of distance on relatedness at the level of the species distribution.
POPULATION GENETICS AND SOCIALITY IN THE SUNGAZER
79
4.2. Materials and methods
Tissue sample collection
I collected tissue samples from 149 Sungazers in 15 colonies across the distribution of the species,
between March 2015 and March 2017. Sungazers are inactive during the coldest of the austral winter
months (June-August), and so sampling efforts were focused on summer months. I defined a colony
as an aggregation of Sungazers clearly distinct from the neighbouring aggregations by a minimum
distance of 1 km between the closest burrows. I sampled between 2-6 individuals per colony for 13 of
the 15 colonies, and sampled the remaining three colonies more extensively (Heilbron (n = 35),
Welkom (n = 27), and Volksrust (n = 17)). Sungazers were captured using standard noosing
techniques directly at their burrow entrance (Van Wyk 1992, McIntyre and Whiting 2012). To ensure
that individuals sharing burrows at the time of sampling were all captured, I retained captured
individuals in a cotton bag, and used a Bosch® GIC 120 C cordless inspection camera (Robert Bosch
GmbH, Germany) to inspect the interior of the burrow for remaining lizards. All individuals that were
captured were checked for previous evidence of tissue sampling to avoid resampling.
I clipped ~3 mm sections of tissue from the large caudal spines of adults, or the terminal tail scute in
juveniles with a nail clipper. I collected any blood that resulted from the incision on FTA® filter paper
cards (Whatman, Clifton, NJ, USA) as duplicate samples. The area of incision on the caudal spines or
tail tips were disinfected with F10SC Veterinary Disinfectant spray (Health and Hygiene (Pty) Ltd.,
South Africa) before clipping, and F10 Germicidal Barrier Ointment (Health and Hygiene (Pty) Ltd.,
South Africa) afterwards. All captured Sungazers were weighed, sexed, and snout-vent length (SVL)
and tail-length measured. Lizards were classed by sex and age following (Van Wyk 1992): neonates
(60-90 mm SVL), juveniles (90-169 mm SVL), adult males (168-200 mm SVL), and adult females
(169-200 mm SVL). Adult males and females were differentiated by the presence or absence of
generation glands which are highly pronounced in males (Van Wyk 1992). In some cases, freshly
shed Sungazer skin was found at the entrance of burrows. These exuvia were collected for tissue
analysis in the case that they were from lizards that were not present in the burrow at the time of
sampling. Sungazers were released at their site of capture once the incision had dried, and it was
confirmed that no further bleeding would occur from the wound.
Tissue samples were stored in 99.9% ethanol in 1.8 ml Nunc™ Cryogenic Tubes (ThermoFisher,
Waltham, MA, USA) and stored at -20 ºC, while shed skin samples were stored dry in 0.75 ml
Eppendorf tubes at room temperature. Equipment and surfaces used during tissue collection were
sterilised with 10% bleach (sodium hypochlorite; Kemp and Smith 2005) and rinsed with sterile
double-distilled water (ddH2O) between the sampling of each individual.
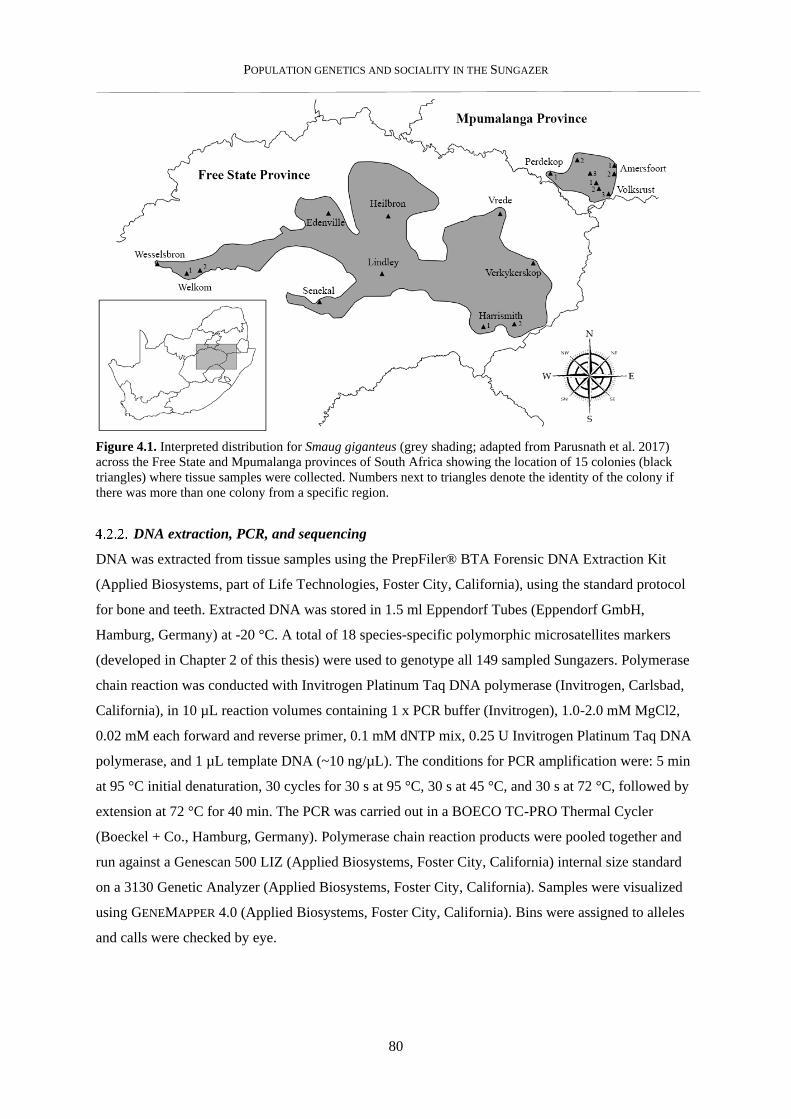
POPULATION GENETICS AND SOCIALITY IN THE SUNGAZER
80
Figure 4.1. Interpreted distribution for Smaug giganteus (grey shading; adapted from Parusnath et al. 2017)
across the Free State and Mpumalanga provinces of South Africa showing the location of 15 colonies (black
triangles) where tissue samples were collected. Numbers next to triangles denote the identity of the colony if
there was more than one colony from a specific region.
DNA extraction, PCR, and sequencing
DNA was extracted from tissue samples using the PrepFiler® BTA Forensic DNA Extraction Kit
(Applied Biosystems, part of Life Technologies, Foster City, California), using the standard protocol
for bone and teeth. Extracted DNA was stored in 1.5 ml Eppendorf Tubes (Eppendorf GmbH,
Hamburg, Germany) at -20 °C. A total of 18 species-specific polymorphic microsatellites markers
(developed in Chapter 2 of this thesis) were used to genotype all 149 sampled Sungazers. Polymerase
chain reaction was conducted with Invitrogen Platinum Taq DNA polymerase (Invitrogen, Carlsbad,
California), in 10 µL reaction volumes containing 1 x PCR buffer (Invitrogen), 1.0-2.0 mM MgCl2,
0.02 mM each forward and reverse primer, 0.1 mM dNTP mix, 0.25 U Invitrogen Platinum Taq DNA
polymerase, and 1 µL template DNA (~10 ng/µL). The conditions for PCR amplification were: 5 min
at 95 °C initial denaturation, 30 cycles for 30 s at 95 °C, 30 s at 45 °C, and 30 s at 72 °C, followed by
extension at 72 °C for 40 min. The PCR was carried out in a BOECO TC-PRO Thermal Cycler
(Boeckel + Co., Hamburg, Germany). Polymerase chain reaction products were pooled together and
run against a Genescan 500 LIZ (Applied Biosystems, Foster City, California) internal size standard
on a 3130 Genetic Analyzer (Applied Biosystems, Foster City, California). Samples were visualized
using GENEMAPPER 4.0 (Applied Biosystems, Foster City, California). Bins were assigned to alleles
and calls were checked by eye.
POPULATION GENETICS AND SOCIALITY IN THE SUNGAZER
81
Calculation of pairwise relatedness coefficients
Pairwise relatedness coefficients (R) were estimated for all possible combinations of the 149 sampled
Sungazers using the GENALEX 6.5 (Peakall and Smouse 2006, 2012) add-on in Microsoft Excel. The
QGM estimator (Queller and Goodnight 1989) was selected because it is one of the most widely used
estimators of relatedness across studies of reptile sociality (e.g. Stow and Sunnucks 2004, Fuller et al.
2005a, Moore et al. 2008, Qi et al. 2012). Values of relatedness coefficients for the QGM estimator
range between -1 and +1, and are indicative of the proportion of shared alleles which are identical by
descent between pairs of individuals. Values between -1 and 0.125 indicate 3rd degree
relatives/unrelated or distantly-related dyads, 0.125 - 0.375 indicates 2nd degree relatives/extended
family members (e.g. cousins, aunts, uncles, half-siblings), while values between 0.375 and 0.625
indicate 1st degree relatives/immediate or nuclear family members (e.g. full siblings, parents,
offspring).
Within burrow relatedness
To test the hypothesis that burrows are shared by immediate family members, I calculated the
pairwise relatedness of all burrow inhabitants in burrows shared by multiple individuals. The
relatedness of Sungazers sharing burrows with juveniles was given special attention, to test the
hypothesis that juveniles share burrows with at least one parents, regardless of the sex of the parent
(indicating parental care). I conducted an independent sample t-test by groups in STATISTICA 8.0
(Statsoft Inc., USA), to investigate whether Sungazers genotyped from shed skin alone had
significantly different pairwise relatedness values with burrow co-inhabitants compared to Sungazers
that were present in the burrow during sampling. This was to understand whether these Sungazers
were close relatives of the individuals whose burrows they were visiting, or unrelated individuals that
were visiting these for mating or other purposes.
Parentage estimates and relatedness of breeding partners
Parentage assignment for each juvenile sampled was estimated in CERVUS 3.03 (Kalinowski et al.
2007). CERVUS estimates the log-likelihood of each candidate parent as the true parent relative to an
arbitrary individual, and then calculates the difference between the two most likely parents (Delta)
(Kalinowski et al. 2007). Using the observed Sungazer population data for allele frequencies as a
baseline measure, simulation parameters were set at 10 000 offspring, with 80% of candidate parents
sampled and a total proportion of loci typed over all individuals of 0.99, mistyping error rates = 0.01
and likelihood calculation error rates = 0.01, permitting two unscored loci. Strict confidence was set
to 95% while the relaxed confidence level was 80%. After the initial run, CERVUS was re-run,
assigning each adult sharing a burrow with a juvenile as a known parent (if the pair had a relatedness
value greater than R = 0.375). Using this procedure, the software assumes the identity of one known
POPULATION GENETICS AND SOCIALITY IN THE SUNGAZER
82
parent, allowing for a more accurate estimation of the identity of the other parent. This was only
applicable to 8 juvenile-adult pairs. I compared the relatedness of candidate parent-pairs to each other,
to assess whether parent-pairs are less related to each other than would be expected by chance as a
measure of inbreeding avoidance. I conducted a regression analysis to investigate if there is a distance
effect on the relatedness of candidate parent-parent pairs. The frequency of pairwise relatedness
classes of Sungazers sharing burrows with juvenile Sungazers was plotted in a frequency diagram.
Nearest-neighbour relatedness
I compared the relatedness of each nearest neighbour pair across three well-sampled Heilbron,
Welkom, and Volksrust colonies, to investigate the relatedness of individuals occupying adjacent
burrows. I used the Distance Matrix tool in QGIS 3.6 (Open Source Geospatial Foundation Project,
2019) to calculate the identity and distance of the nearest neighbour to each Sungazer in each colony.
The frequency of different categories of relatedness coefficients (1st, 2nd, or 3rd degree) is expressed in
a frequency diagram. I then correlated relatedness coefficient with distance between pairs, to evaluate
whether distance between nearest neighbours had an effect of relatedness between the pair.
Within-colony social structure
To investigate the relationship between burrow distance and genetic relatedness, I conducted Mantel
tests (Mantel 1967) in ALLELES IN SPACE 1.0 (Miller 2005) separately for the Heilbron, Volksrust,
and Welkom colonies. The Mantel test was run using values for genetic and geographic distance with
1000 permutations. This allowed me to test whether populations conformed to isolation by distance
(IBD) by exhibiting a significant positive correlation between genetic and geographical distance.
Pairwise relatedness – within and between colonies
To test the hypothesis that Sungazer colonies consist of family groups (immediate and extended
family members), I estimated the average pairwise relatedness of Sungazers within and between 15
colonies. A regression was used to investigate the relationship between relatedness and geographic
distance between colonies. I also conducted a regression analysis to assess if colony size has an effect
on the average relatedness within a colony, for each of the 15 colonies. This analysis provides an
insight into whether smaller colonies have higher levels of relatedness due to the smaller selection of
mate choices.
Inbreeding analysis
I estimated inbreeding coefficients in INEST 2.2 (Chybicki and Burczyk 2009) individually for the
Heilbron, Welkom, and Volksrust colonies. This analysis accounts for the presence of null alleles in
the dataset, which can bias inbreeding estimates (Chybicki and Burczyk 2009). I used the Interesting
POPULATION GENETICS AND SOCIALITY IN THE SUNGAZER
83
Itemset Miner (IIM) Bayesian model, because this approach is suitable for small sample sizes
(Chybicki 2017). INEST simultaneously estimates the relative contribution of the inbreeding
coefficient (F), null allele frequencies (n) and random genotyping failure (b), and should be more
accurate than independent parameter estimations. I ran the model twice for each colony – first with
the ‘nfb’ model (null alleles, inbreeding coefficients, genotyping failures), and then with the ‘nb’
model (null alleles, genotyping failures), in order to facilitate direct comparisons between models to
infer the effect that inbreeding has on each model. Each model was run for 500 000 cycles (MCMC
iterations) with a burn-in of 50 000. The deviance information criterion (DIC) was used to ascertain
the best model. In cases where the difference in DIC (Δ DIC) exceeded a value of 2, the model with
the lower Wright’s FIS score was considered a better fit (Spiegelhalter et al. 2002).
Comparison of relatedness at different spatial scales
I conducted an analysis of variance (ANOVA) to assess whether there is a significant difference in
relatedness between Sungazers sharing burrow systems, Sungazer pairs in nearest neighbouring
burrows, Sungazers within a colony, and Sungazers between colonies. The ANOVA was run in
STATISTICA 8.0 (Statsoft Inc., USA), using R (relatedness) as the dependent variable and colony as
the independent variable.
4.3. Results
Within burrow relatedness
Sungazers sharing burrow systems had an average relatedness coefficient of R = 0.346, indicating that
burrow co-inhabitants are likely to be immediate or extended family members (Table 4.1).
Approximately half (49%) of all pairs of Sungazers sharing burrows were 1st degree relatives, 28%
were 2nd degree relatives, and the remaining 23% were distant relatives (Table 4.1). Occupancy of
burrows containing multiple Sungazers ranged from 2-5 Sungazers/burrow, with an average of 2.5
Sungazers/burrow. Fifteen burrows contained only two individuals, two burrows contained five
individuals, and a single burrow contained three individuals. Sungazers genotyped from shed skin
samples had significantly lower pairwise relatedness scores with burrow co-inhabitants (average R =
0.187) than Sungazers that were present in the burrow during sampling (average R = 0.464)
(independent sample t-test, t = -3.76, df = 37, p < 0.01). Further, the level and type of relatedness that
these Sungazers had with burrow co-inhabitants was significantly different from those present in the
burrows (Fig. 4.2). They had far fewer 1st and 2nd degree relations with Sungazers in the burrows they
were visiting, and far more 3rd degree relations – in general, they were likely to be unrelated to the
other Sungazers in the burrow.
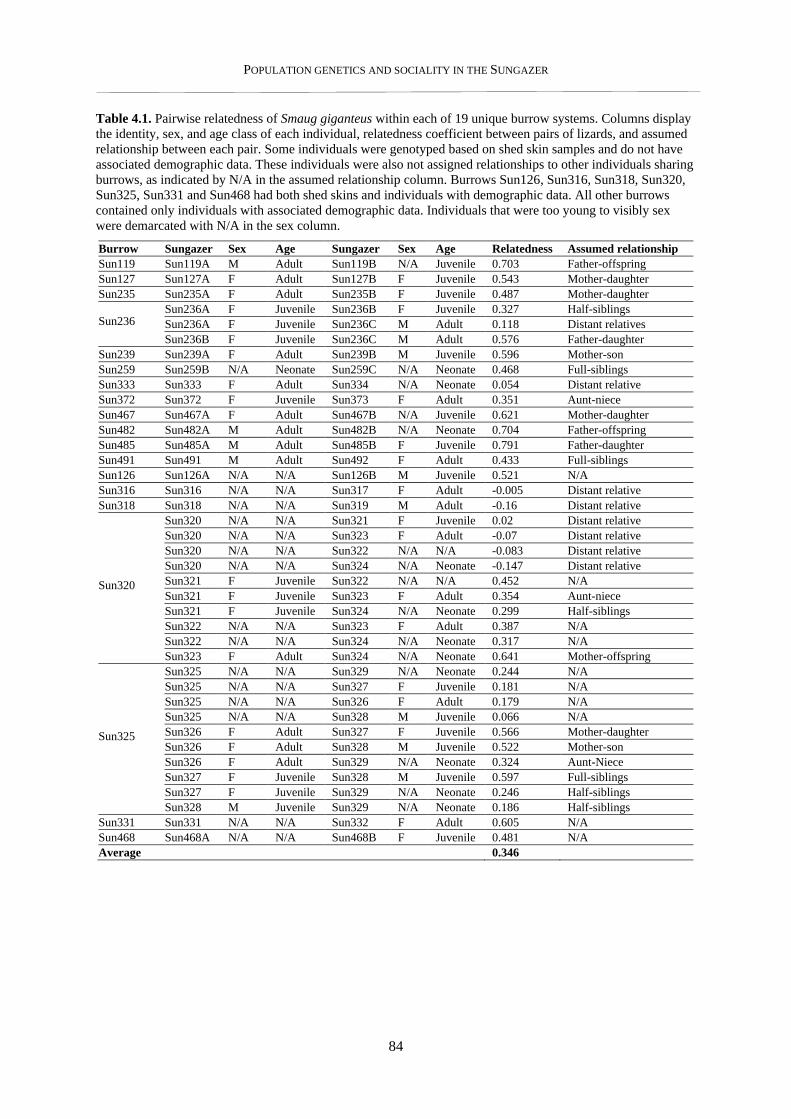
POPULATION GENETICS AND SOCIALITY IN THE SUNGAZER
84
Table 4.1. Pairwise relatedness of Smaug giganteus within each of 19 unique burrow systems. Columns display
the identity, sex, and age class of each individual, relatedness coefficient between pairs of lizards, and assumed
relationship between each pair. Some individuals were genotyped based on shed skin samples and do not have
associated demographic data. These individuals were also not assigned relationships to other individuals sharing
burrows, as indicated by N/A in the assumed relationship column. Burrows Sun126, Sun316, Sun318, Sun320,
Sun325, Sun331 and Sun468 had both shed skins and individuals with demographic data. All other burrows
contained only individuals with associated demographic data. Individuals that were too young to visibly sex
were demarcated with N/A in the sex column.
Burrow
name
Sungazer
1
Sex Age
class
Sungazer
2
Sex Age
class
Relatedness
(R)
Assumed relationship
Sun119 Sun119A M Adult Sun119B N/A Juvenile 0.703 Father-offspring
Sun127 Sun127A F Adult Sun127B F Juvenile 0.543 Mother-daughter
Sun235 Sun235A F Adult Sun235B F Juvenile 0.487 Mother-daughter
Sun236 Sun236A F Juvenile Sun236B F Juvenile 0.327 Half-siblings
Sun236A F Juvenile Sun236C M Adult 0.118 Distant relatives
Sun236B F Juvenile Sun236C M Adult 0.576 Father-daughter
Sun239 Sun239A F Adult Sun239B M Juvenile 0.596 Mother-son
Sun259 Sun259B N/A Neonate Sun259C N/A Neonate 0.468 Full-siblings
Sun333 Sun333 F Adult Sun334 N/A Neonate 0.054 Distant relative
Sun372 Sun372 F Juvenile Sun373 F Adult 0.351 Aunt-niece
Sun467 Sun467A F Adult Sun467B N/A Juvenile 0.621 Mother-daughter
Sun482 Sun482A M Adult Sun482B N/A Neonate 0.704 Father-offspring
Sun485 Sun485A M Adult Sun485B F Juvenile 0.791 Father-daughter
Sun491 Sun491 M Adult Sun492 F Adult 0.433 Full-siblings
Sun126 Sun126A N/A N/A Sun126B M Juvenile 0.521 N/A
Sun316 Sun316 N/A N/A Sun317 F Adult -0.005 Distant relative
Sun318 Sun318 N/A N/A Sun319 M Adult -0.16 Distant relative
Sun320
Sun320 N/A N/A Sun321 F Juvenile 0.02 Distant relative
Sun320 N/A N/A Sun323 F Adult -0.07 Distant relative
Sun320 N/A N/A Sun322 N/A N/A -0.083 Distant relative
Sun320 N/A N/A Sun324 N/A Neonate -0.147 Distant relative
Sun321 F Juvenile Sun322 N/A N/A 0.452 N/A
Sun321 F Juvenile Sun323 F Adult 0.354 Aunt-niece
Sun321 F Juvenile Sun324 N/A Neonate 0.299 Half-siblings
Sun322 N/A N/A Sun323 F Adult 0.387 N/A
Sun322 N/A N/A Sun324 N/A Neonate 0.317 N/A
Sun323 F Adult Sun324 N/A Neonate 0.641 Mother-offspring
Sun325
Sun325 N/A N/A Sun329 N/A Neonate 0.244 N/A
Sun325 N/A N/A Sun327 F Juvenile 0.181 N/A
Sun325 N/A N/A Sun326 F Adult 0.179 N/A
Sun325 N/A N/A Sun328 M Juvenile 0.066 N/A
Sun326 F Adult Sun327 F Juvenile 0.566 Mother-daughter
Sun326 F Adult Sun328 M Juvenile 0.522 Mother-son
Sun326 F Adult Sun329 N/A Neonate 0.324 Aunt-Niece
Sun327 F Juvenile Sun328 M Juvenile 0.597 Full-siblings
Sun327 F Juvenile Sun329 N/A Neonate 0.246 Half-siblings
Sun328 M Juvenile Sun329 N/A Neonate 0.186 Half-siblings
Sun331 Sun331 N/A N/A Sun332 F Adult 0.605 N/A
Sun468 Sun468A N/A N/A Sun468B F Juvenile 0.481 N/A
Average 0.346
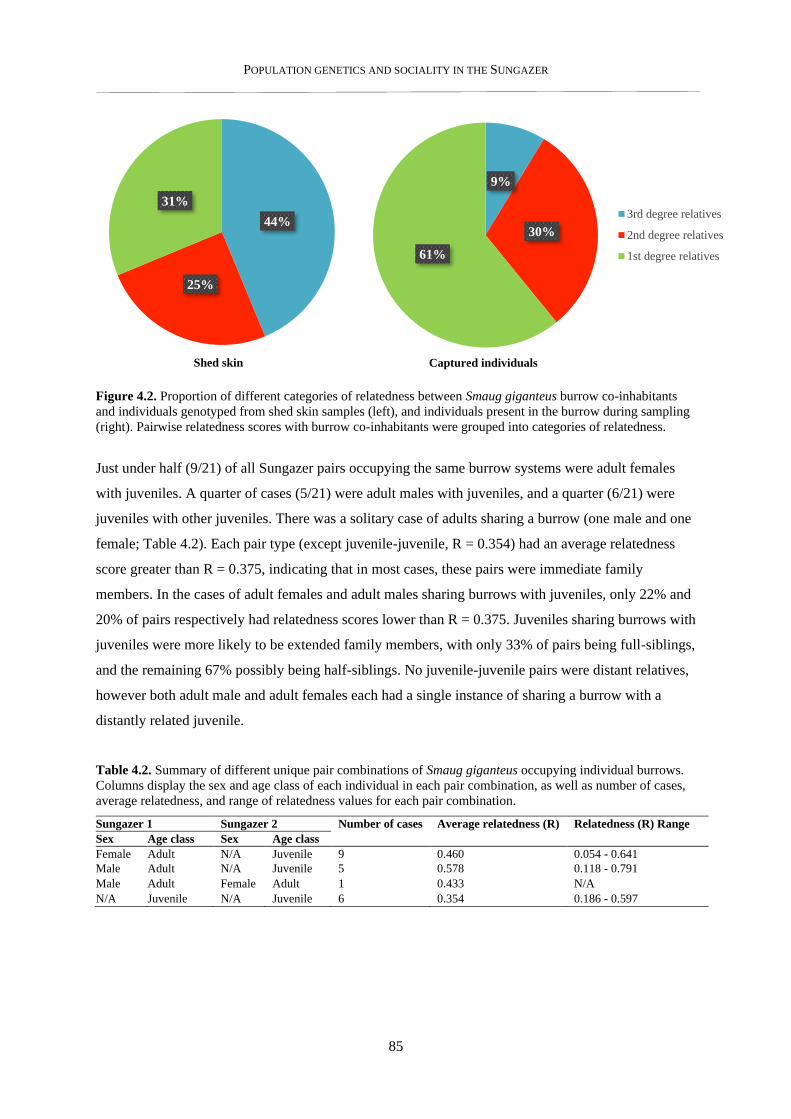
POPULATION GENETICS AND SOCIALITY IN THE SUNGAZER
85
Figure 4.2. Proportion of different categories of relatedness between Smaug giganteus burrow co-inhabitants
and individuals genotyped from shed skin samples (left), and individuals present in the burrow during sampling
(right). Pairwise relatedness scores with burrow co-inhabitants were grouped into categories of relatedness.
Just under half (9/21) of all Sungazer pairs occupying the same burrow systems were adult females
with juveniles. A quarter of cases (5/21) were adult males with juveniles, and a quarter (6/21) were
juveniles with other juveniles. There was a solitary case of adults sharing a burrow (one male and one
female; Table 4.2). Each pair type (except juvenile-juvenile, R = 0.354) had an average relatedness
score greater than R = 0.375, indicating that in most cases, these pairs were immediate family
members. In the cases of adult females and adult males sharing burrows with juveniles, only 22% and
20% of pairs respectively had relatedness scores lower than R = 0.375. Juveniles sharing burrows with
juveniles were more likely to be extended family members, with only 33% of pairs being full-siblings,
and the remaining 67% possibly being half-siblings. No juvenile-juvenile pairs were distant relatives,
however both adult male and adult females each had a single instance of sharing a burrow with a
distantly related juvenile.
Table 4.2. Summary of different unique pair combinations of Smaug giganteus occupying individual burrows.
Columns display the sex and age class of each individual in each pair combination, as well as number of cases,
average relatedness, and range of relatedness values for each pair combination.
Sungazer 1 Sungazer 2 Number of cases Average relatedness (R) Relatedness (R) Range
Sex Age class Sex Age class
Female Adult N/A Juvenile 9 0.460 0.054 - 0.641
Male Adult N/A Juvenile 5 0.578 0.118 - 0.791
Male Adult Female Adult 1 0.433 N/A
N/A Juvenile N/A Juvenile 6 0.354 0.186 - 0.597
9%
30%
61%
Captured individuals
3rd degree relatives
2nd degree relatives
1st degree relatives
44%
25%
31%
Shed skin
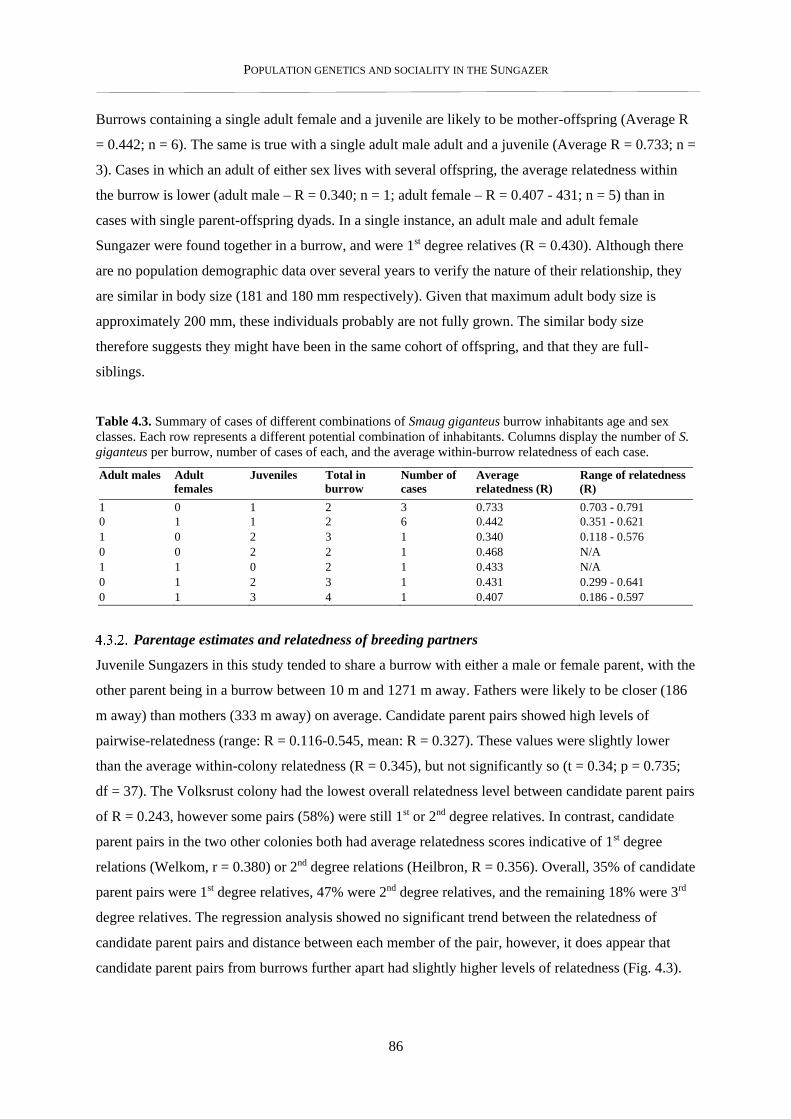
POPULATION GENETICS AND SOCIALITY IN THE SUNGAZER
86
Burrows containing a single adult female and a juvenile are likely to be mother-offspring (Average R
= 0.442; n = 6). The same is true with a single adult male adult and a juvenile (Average R = 0.733; n =
3). Cases in which an adult of either sex lives with several offspring, the average relatedness within
the burrow is lower (adult male – R = 0.340; n = 1; adult female – R = 0.407 - 431; n = 5) than in
cases with single parent-offspring dyads. In a single instance, an adult male and adult female
Sungazer were found together in a burrow, and were 1st degree relatives (R = 0.430). Although there
are no population demographic data over several years to verify the nature of their relationship, they
are similar in body size (181 and 180 mm respectively). Given that maximum adult body size is
approximately 200 mm, these individuals probably are not fully grown. The similar body size
therefore suggests they might have been in the same cohort of offspring, and that they are full-
siblings.
Table 4.3. Summary of cases of different combinations of Smaug giganteus burrow inhabitants age and sex
classes. Each row represents a different potential combination of inhabitants. Columns display the number of S.
giganteus per burrow, number of cases of each, and the average within-burrow relatedness of each case.
Adult males Adult
females
Juveniles Total in
burrow
Number of
cases
Average
relatedness (R)
Range of relatedness
(R)
1 0 1 2 3 0.733 0.703 - 0.791
0 1 1 2 6 0.442 0.351 - 0.621
1 0 2 3 1 0.340 0.118 - 0.576
0 0 2 2 1 0.468 N/A
1 1 0 2 1 0.433 N/A
0 1 2 3 1 0.431 0.299 - 0.641
0 1 3 4 1 0.407 0.186 - 0.597
Parentage estimates and relatedness of breeding partners
Juvenile Sungazers in this study tended to share a burrow with either a male or female parent, with the
other parent being in a burrow between 10 m and 1271 m away. Fathers were likely to be closer (186
m away) than mothers (333 m away) on average. Candidate parent pairs showed high levels of
pairwise-relatedness (range: R = 0.116-0.545, mean: R = 0.327). These values were slightly lower
than the average within-colony relatedness (R = 0.345), but not significantly so (t = 0.34; p = 0.735;
df = 37). The Volksrust colony had the lowest overall relatedness level between candidate parent pairs
of R = 0.243, however some pairs (58%) were still 1st or 2nd degree relatives. In contrast, candidate
parent pairs in the two other colonies both had average relatedness scores indicative of 1st degree
relations (Welkom, r = 0.380) or 2nd degree relations (Heilbron, R = 0.356). Overall, 35% of candidate
parent pairs were 1st degree relatives, 47% were 2nd degree relatives, and the remaining 18% were 3rd
degree relatives. The regression analysis showed no significant trend between the relatedness of
candidate parent pairs and distance between each member of the pair, however, it does appear that
candidate parent pairs from burrows further apart had slightly higher levels of relatedness (Fig. 4.3).
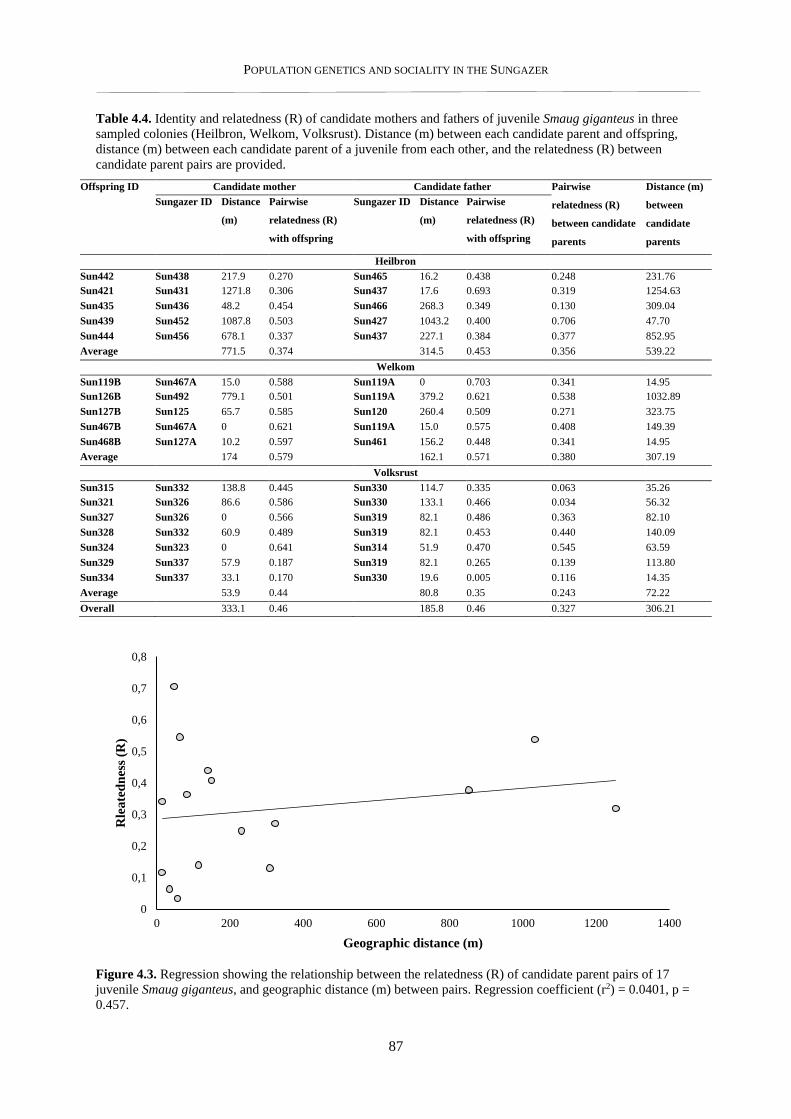
POPULATION GENETICS AND SOCIALITY IN THE SUNGAZER
87
Table 4.4. Identity and relatedness (R) of candidate mothers and fathers of juvenile Smaug giganteus in three
sampled colonies (Heilbron, Welkom, Volksrust). Distance (m) between each candidate parent and offspring,
distance (m) between each candidate parent of a juvenile from each other, and the relatedness (R) between
candidate parent pairs are provided.
Offspring ID Candidate mother Candidate father Pairwise
relatedness (R)
between candidate
parents
Distance (m)
between
candidate
parents
Sungazer ID Distance
(m)
Pairwise
relatedness (R)
with offspring
Sungazer ID Distance
(m)
Pairwise
relatedness (R)
with offspring
Heilbron
Sun442 Sun438 217.9 0.270 Sun465 16.2
0.438 0.248 231.76
Sun421 Sun431 1271.8 0.306 Sun437 17.6
0.693 0.319 1254.63
Sun435 Sun436 48.2
0.454 Sun466 268.3
0.349 0.130 309.04
Sun439 Sun452 1087.8
0.503 Sun427 1043.2 0.400 0.706 47.70
Sun444 Sun456 678.1
0.337 Sun437 227.1
0.384 0.377 852.95
Average 771.5 0.374 314.5 0.453 0.356 539.22
Welkom
Sun119B Sun467A 15.0
0.588 Sun119A 0 0.703 0.341 14.95
Sun126B Sun492 779.1
0.501 Sun119A 379.2
0.621 0.538 1032.89
Sun127B Sun125 65.7
0.585 Sun120 260.4
0.509 0.271 323.75
Sun467B Sun467A 0 0.621 Sun119A 15.0 0.575 0.408 149.39
Sun468B Sun127A 10.2
0.597 Sun461 156.2
0.448 0.341 14.95
Average 174 0.579 162.1 0.571 0.380 307.19
Volksrust
Sun315 Sun332 138.8 0.445 Sun330 114.7
0.335 0.063 35.26
Sun321 Sun326 86.6 0.586 Sun330 133.1
0.466 0.034 56.32
Sun327 Sun326 0 0.566 Sun319 82.1
0.486 0.363 82.10
Sun328 Sun332 60.9 0.489 Sun319 82.1 0.453 0.440 140.09
Sun324 Sun323 0 0.641 Sun314 51.9
0.470 0.545 63.59
Sun329 Sun337 57.9 0.187 Sun319 82.1 0.265 0.139 113.80
Sun334 Sun337 33.1
0.170 Sun330 19.6
0.005 0.116 14.35
Average 53.9 0.44 80.8 0.35 0.243 72.22
Overall
Average
333.1 0.46 185.8 0.46 0.327 306.21
Figure 4.3. Regression showing the relationship between the relatedness (R) of candidate parent pairs of 17
juvenile Smaug giganteus, and geographic distance (m) between pairs. Regression coefficient (r2) = 0.0401, p =
0.457.
0
0,1
0,2
0,3
0,4
0,5
0,6
0,7
0,8
0 200 400 600 800 1000 1200 1400
Rle
ate
dn
ess
(R)
Geographic distance (m)
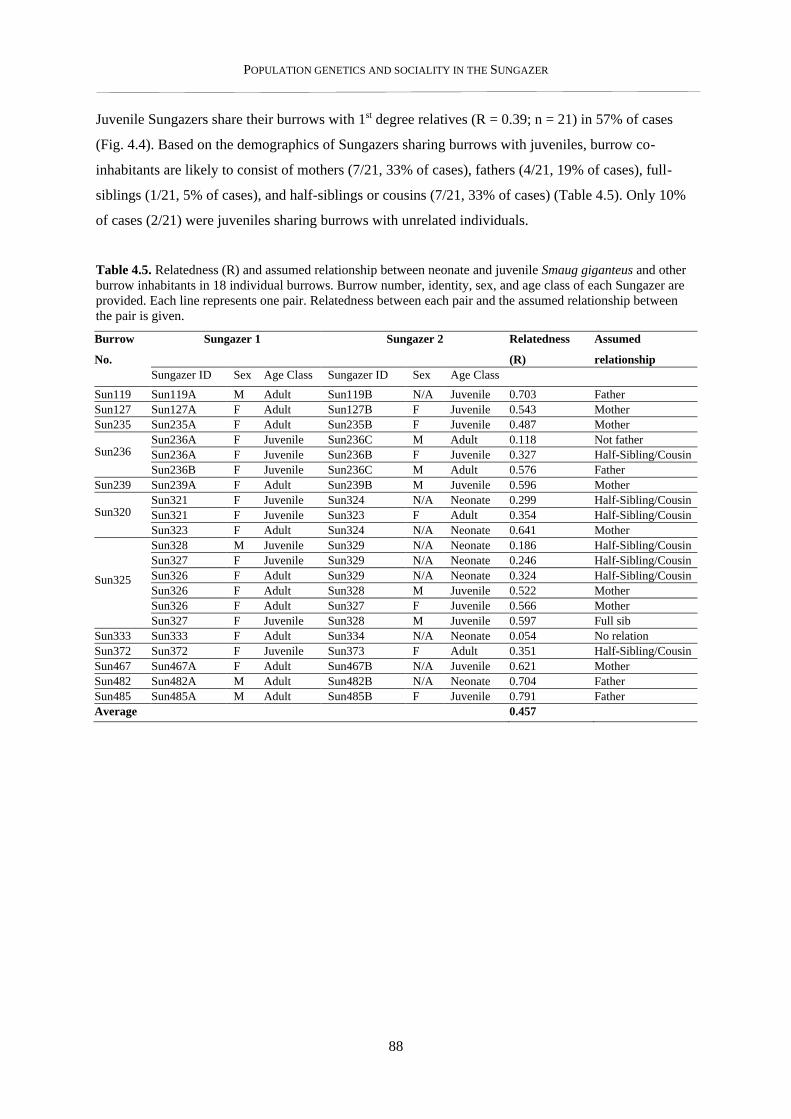
POPULATION GENETICS AND SOCIALITY IN THE SUNGAZER
88
Juvenile Sungazers share their burrows with 1st degree relatives (R = 0.39; n = 21) in 57% of cases
(Fig. 4.4). Based on the demographics of Sungazers sharing burrows with juveniles, burrow co-
inhabitants are likely to consist of mothers (7/21, 33% of cases), fathers (4/21, 19% of cases), full-
siblings (1/21, 5% of cases), and half-siblings or cousins (7/21, 33% of cases) (Table 4.5). Only 10%
of cases (2/21) were juveniles sharing burrows with unrelated individuals.
Table 4.5. Relatedness (R) and assumed relationship between neonate and juvenile Smaug giganteus and other
burrow inhabitants in 18 individual burrows. Burrow number, identity, sex, and age class of each Sungazer are
provided. Each line represents one pair. Relatedness between each pair and the assumed relationship between
the pair is given.
Burrow
No.
Sungazer 1 Sungazer 2 Relatedness
(R)
Assumed
relationship
Sungazer ID Sex Age Class Sungazer ID Sex Age Class
Sun119 Sun119A M Adult Sun119B N/A Juvenile 0.703 Father
Sun127 Sun127A F Adult Sun127B F Juvenile 0.543 Mother
Sun235 Sun235A F Adult Sun235B F Juvenile 0.487 Mother
Sun236 Sun236A F Juvenile Sun236C M Adult 0.118 Not father
Sun236A F Juvenile Sun236B F Juvenile 0.327 Half-Sibling/Cousin
Sun236B F Juvenile Sun236C M Adult 0.576 Father
Sun239 Sun239A F Adult Sun239B M Juvenile 0.596 Mother
Sun320 Sun321 F Juvenile Sun324 N/A Neonate 0.299 Half-Sibling/Cousin
Sun321 F Juvenile Sun323 F Adult 0.354 Half-Sibling/Cousin
Sun323 F Adult Sun324 N/A Neonate 0.641 Mother
Sun325
Sun328 M Juvenile Sun329 N/A Neonate 0.186 Half-Sibling/Cousin
Sun327 F Juvenile Sun329 N/A Neonate 0.246 Half-Sibling/Cousin
Sun326 F Adult Sun329 N/A Neonate 0.324 Half-Sibling/Cousin
Sun326 F Adult Sun328 M Juvenile 0.522 Mother
Sun326 F Adult Sun327 F Juvenile 0.566 Mother
Sun327 F Juvenile Sun328 M Juvenile 0.597 Full sib
Sun333 Sun333 F Adult Sun334 N/A Neonate 0.054 No relation
Sun372 Sun372 F Juvenile Sun373 F Adult 0.351 Half-Sibling/Cousin
Sun467 Sun467A F Adult Sun467B N/A Juvenile 0.621 Mother
Sun482 Sun482A M Adult Sun482B N/A Neonate 0.704 Father
Sun485 Sun485A M Adult Sun485B F Juvenile 0.791 Father
Average 0.457
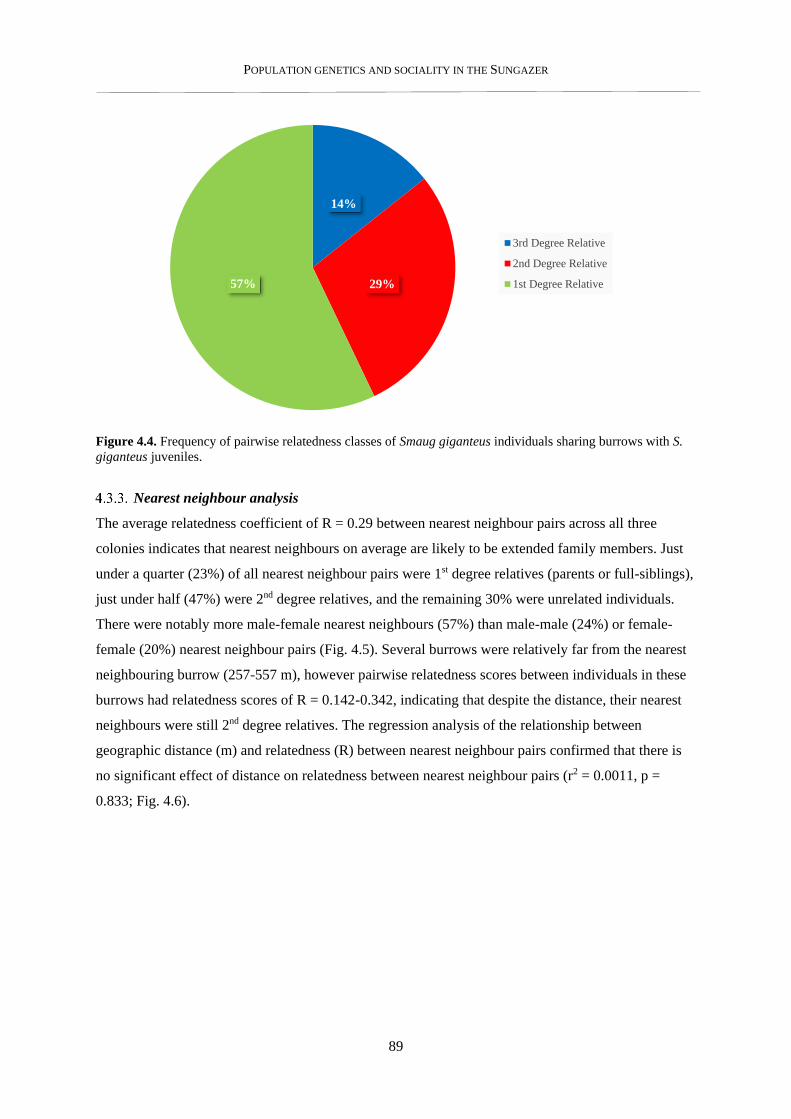
POPULATION GENETICS AND SOCIALITY IN THE SUNGAZER
89
Figure 4.4. Frequency of pairwise relatedness classes of Smaug giganteus individuals sharing burrows with S.
giganteus juveniles.
Nearest neighbour analysis
The average relatedness coefficient of R = 0.29 between nearest neighbour pairs across all three
colonies indicates that nearest neighbours on average are likely to be extended family members. Just
under a quarter (23%) of all nearest neighbour pairs were 1st degree relatives (parents or full-siblings),
just under half (47%) were 2nd degree relatives, and the remaining 30% were unrelated individuals.
There were notably more male-female nearest neighbours (57%) than male-male (24%) or female-
female (20%) nearest neighbour pairs (Fig. 4.5). Several burrows were relatively far from the nearest
neighbouring burrow (257-557 m), however pairwise relatedness scores between individuals in these
burrows had relatedness scores of R = 0.142-0.342, indicating that despite the distance, their nearest
neighbours were still 2nd degree relatives. The regression analysis of the relationship between
geographic distance (m) and relatedness (R) between nearest neighbour pairs confirmed that there is
no significant effect of distance on relatedness between nearest neighbour pairs (r2 = 0.0011, p =
0.833; Fig. 4.6).
14%
29%57%
3rd Degree Relative
2nd Degree Relative
1st Degree Relative
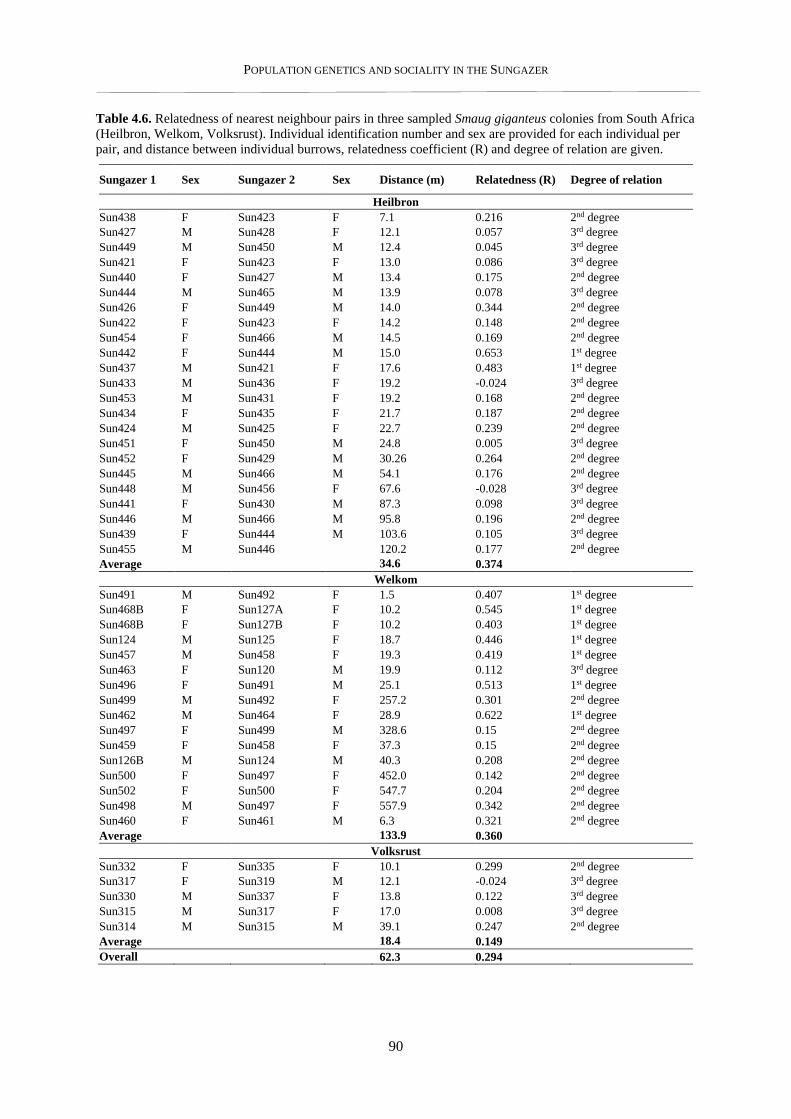
POPULATION GENETICS AND SOCIALITY IN THE SUNGAZER
90
Table 4.6. Relatedness of nearest neighbour pairs in three sampled Smaug giganteus colonies from South Africa
(Heilbron, Welkom, Volksrust). Individual identification number and sex are provided for each individual per
pair, and distance between individual burrows, relatedness coefficient (R) and degree of relation are given.
Sungazer 1 Sex Sungazer 2 Sex Distance (m) Relatedness (R) Degree of relation
Heilbron
Sun438 F Sun423 F 7.1 0.216 2nd degree
Sun427 M Sun428 F 12.1 0.057 3rd degree
Sun449 M Sun450 M 12.4 0.045 3rd degree
Sun421 F Sun423 F 13.0 0.086 3rd degree
Sun440 F Sun427 M 13.4 0.175 2nd degree
Sun444 M Sun465 M 13.9 0.078 3rd degree
Sun426 F Sun449 M 14.0 0.344 2nd degree
Sun422 F Sun423 F 14.2 0.148 2nd degree
Sun454 F Sun466 M 14.5 0.169 2nd degree
Sun442 F Sun444 M 15.0 0.653 1st degree
Sun437 M Sun421 F 17.6 0.483 1st degree
Sun433 M Sun436 F 19.2 -0.024 3rd degree
Sun453 M Sun431 F 19.2 0.168 2nd degree
Sun434 F Sun435 F 21.7 0.187 2nd degree
Sun424 M Sun425 F 22.7 0.239 2nd degree
Sun451 F Sun450 M 24.8 0.005 3rd degree
Sun452 F Sun429 M 30.26 0.264 2nd degree
Sun445 M Sun466 M 54.1 0.176 2nd degree
Sun448 M Sun456 F 67.6 -0.028 3rd degree
Sun441 F Sun430 M 87.3 0.098 3rd degree
Sun446 M Sun466 M 95.8 0.196 2nd degree
Sun439 F Sun444 M 103.6 0.105 3rd degree
Sun455 M Sun446 120.2 0.177 2nd degree
Average 34.6
0.374
Welkom
Sun491 M Sun492 F 1.5 0.407 1st degree
Sun468B F Sun127A F 10.2 0.545 1st degree
Sun468B F Sun127B F 10.2 0.403 1st degree
Sun124 M Sun125 F 18.7 0.446 1st degree
Sun457 M Sun458 F 19.3 0.419 1st degree
Sun463 F Sun120 M 19.9 0.112 3rd degree
Sun496 F Sun491 M 25.1 0.513 1st degree
Sun499 M Sun492 F 257.2 0.301 2nd degree
Sun462 M Sun464 F 28.9 0.622 1st degree
Sun497 F Sun499 M 328.6 0.15 2nd degree
Sun459 F Sun458 F 37.3 0.15 2nd degree
Sun126B M Sun124 M 40.3 0.208 2nd degree
Sun500 F Sun497 F 452.0 0.142 2nd degree
Sun502 F Sun500 F 547.7 0.204 2nd degree
Sun498 M Sun497 F 557.9 0.342 2nd degree
Sun460 F Sun461 M 6.3 0.321 2nd degree
Average 133.9
0.360
Volksrust
Sun332 F Sun335 F 10.1 0.299 2nd degree
Sun317 F Sun319 M 12.1 -0.024 3rd degree
Sun330 M Sun337 F 13.8 0.122 3rd degree
Sun315 M Sun317 F 17.0 0.008 3rd degree
Sun314 M Sun315 M 39.1 0.247 2nd degree
Average 18.4
0.149
Overall
average
Average
62.3 0.294
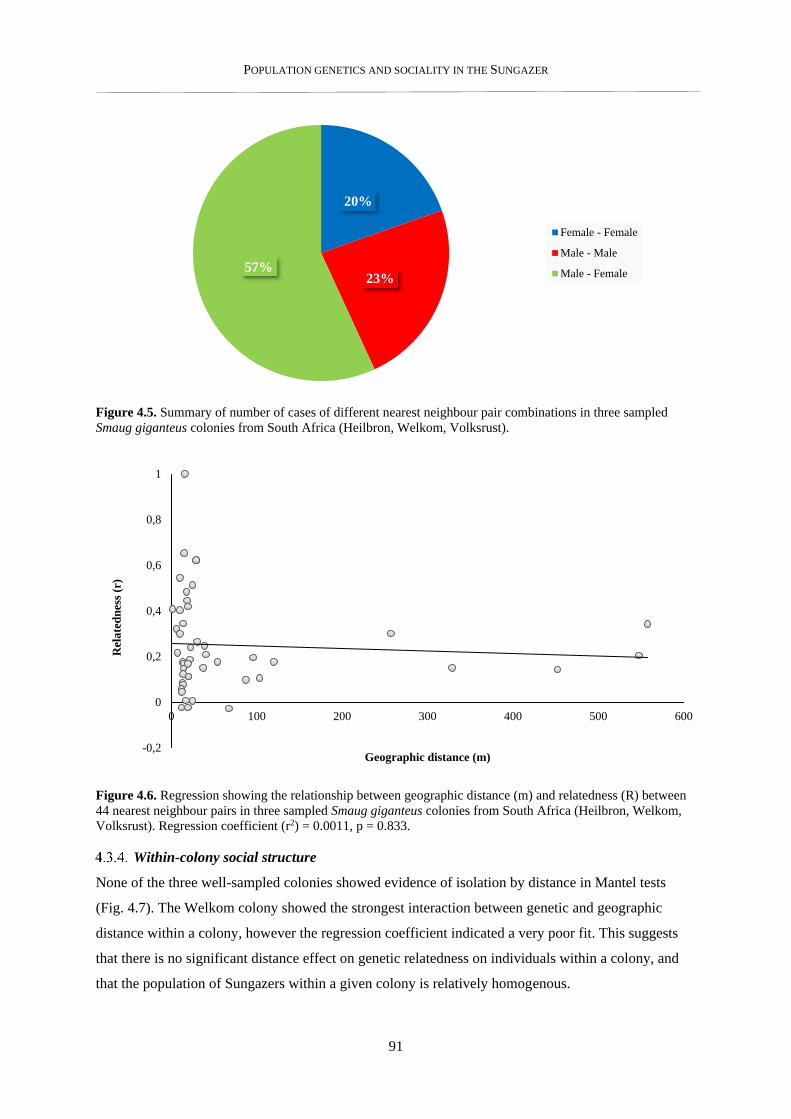
POPULATION GENETICS AND SOCIALITY IN THE SUNGAZER
91
Figure 4.5. Summary of number of cases of different nearest neighbour pair combinations in three sampled
Smaug giganteus colonies from South Africa (Heilbron, Welkom, Volksrust).
Figure 4.6. Regression showing the relationship between geographic distance (m) and relatedness (R) between
44 nearest neighbour pairs in three sampled Smaug giganteus colonies from South Africa (Heilbron, Welkom,
Volksrust). Regression coefficient (r2) = 0.0011, p = 0.833.
Within-colony social structure
None of the three well-sampled colonies showed evidence of isolation by distance in Mantel tests
(Fig. 4.7). The Welkom colony showed the strongest interaction between genetic and geographic
distance within a colony, however the regression coefficient indicated a very poor fit. This suggests
that there is no significant distance effect on genetic relatedness on individuals within a colony, and
that the population of Sungazers within a given colony is relatively homogenous.
20%
23%57%
Female - Female
Male - Male
Male - Female
-0,2
0
0,2
0,4
0,6
0,8
1
0 100 200 300 400 500 600
Rel
ate
dn
ess
(r)
Geographic distance (m)
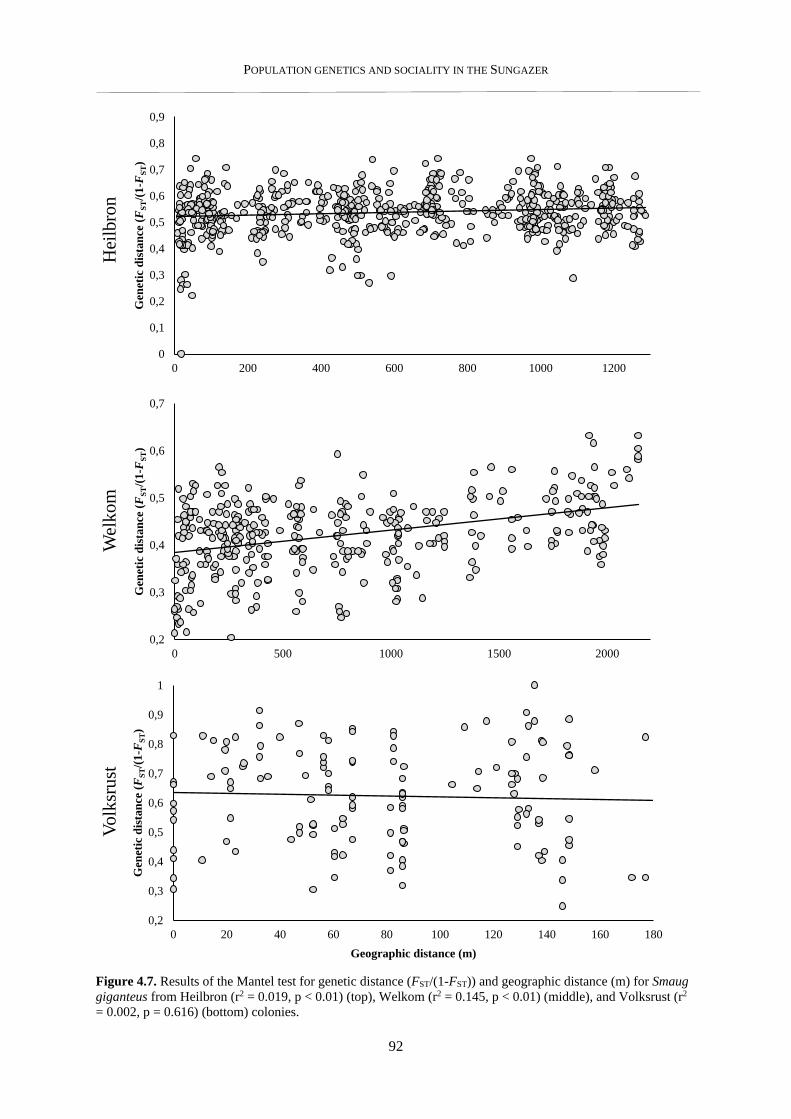
POPULATION GENETICS AND SOCIALITY IN THE SUNGAZER
92
Figure 4.7. Results of the Mantel test for genetic distance (FST/(1-FST)) and geographic distance (m) for Smaug
giganteus from Heilbron (r2 = 0.019, p < 0.01) (top), Welkom (r2 = 0.145, p < 0.01) (middle), and Volksrust (r2
= 0.002, p = 0.616) (bottom) colonies.
0
0,1
0,2
0,3
0,4
0,5
0,6
0,7
0,8
0,9
0 200 400 600 800 1000 1200
Gen
etic
dis
tan
ce (
FS
T/(
1-F
ST)
Hei
lbro
n
0,2
0,3
0,4
0,5
0,6
0,7
0 500 1000 1500 2000
Gen
etic
dis
tan
ce (
FS
T/(
1-F
ST)
Wel
kom
0,2
0,3
0,4
0,5
0,6
0,7
0,8
0,9
1
0 20 40 60 80 100 120 140 160 180
Gen
etic
dis
tan
ce (
FS
T/(
1-F
ST)
Geographic distance (m)
Volk
sru
st
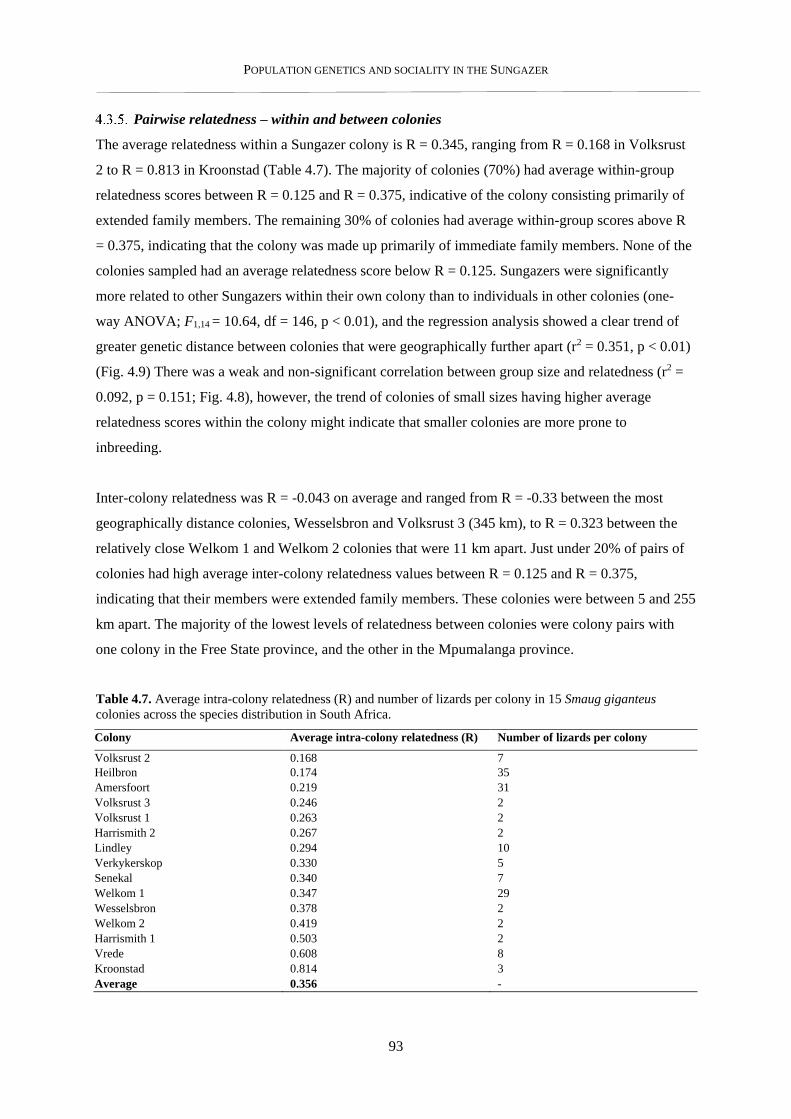
POPULATION GENETICS AND SOCIALITY IN THE SUNGAZER
93
Pairwise relatedness – within and between colonies
The average relatedness within a Sungazer colony is R = 0.345, ranging from R = 0.168 in Volksrust
2 to R = 0.813 in Kroonstad (Table 4.7). The majority of colonies (70%) had average within-group
relatedness scores between R = 0.125 and R = 0.375, indicative of the colony consisting primarily of
extended family members. The remaining 30% of colonies had average within-group scores above R
= 0.375, indicating that the colony was made up primarily of immediate family members. None of the
colonies sampled had an average relatedness score below R = 0.125. Sungazers were significantly
more related to other Sungazers within their own colony than to individuals in other colonies (one-
way ANOVA; F1,14 = 10.64, df = 146, p < 0.01), and the regression analysis showed a clear trend of
greater genetic distance between colonies that were geographically further apart (r2 = 0.351, p < 0.01)
(Fig. 4.9) There was a weak and non-significant correlation between group size and relatedness (r2 =
0.092, p = 0.151; Fig. 4.8), however, the trend of colonies of small sizes having higher average
relatedness scores within the colony might indicate that smaller colonies are more prone to
inbreeding.
Inter-colony relatedness was R = -0.043 on average and ranged from R = -0.33 between the most
geographically distance colonies, Wesselsbron and Volksrust 3 (345 km), to R = 0.323 between the
relatively close Welkom 1 and Welkom 2 colonies that were 11 km apart. Just under 20% of pairs of
colonies had high average inter-colony relatedness values between R = 0.125 and R = 0.375,
indicating that their members were extended family members. These colonies were between 5 and 255
km apart. The majority of the lowest levels of relatedness between colonies were colony pairs with
one colony in the Free State province, and the other in the Mpumalanga province.
Table 4.7. Average intra-colony relatedness (R) and number of lizards per colony in 15 Smaug giganteus
colonies across the species distribution in South Africa.
Colony Average intra-colony relatedness (R) Number of lizards per colony
Volksrust 2 0.168 7
Heilbron 0.174 35
Amersfoort 0.219 31
Volksrust 3 0.246 2
Volksrust 1 0.263 2
Harrismith 2 0.267 2
Lindley 0.294 10
Verkykerskop 0.330 5
Senekal 0.340 7
Welkom 1 0.347 29
Wesselsbron 0.378 2
Welkom 2 0.419 2
Harrismith 1 0.503 2
Vrede 0.608 8
Kroonstad 0.814 3
Average 0.356 -
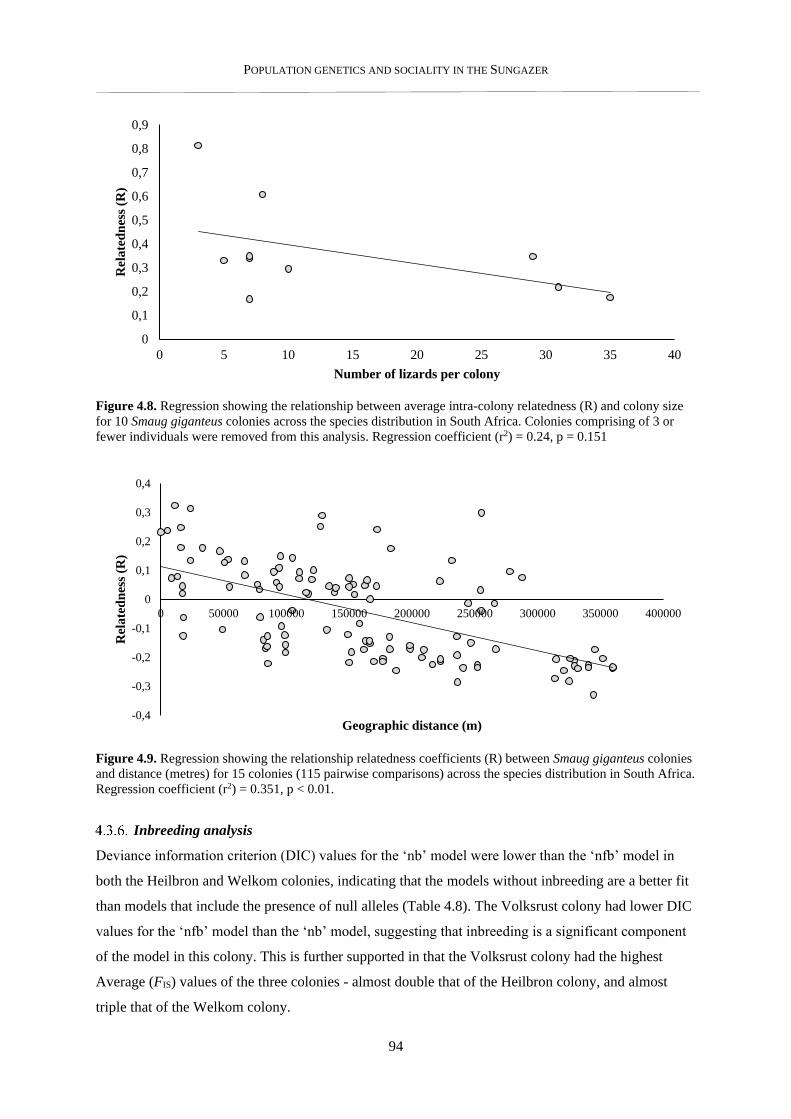
POPULATION GENETICS AND SOCIALITY IN THE SUNGAZER
94
Figure 4.8. Regression showing the relationship between average intra-colony relatedness (R) and colony size
for 10 Smaug giganteus colonies across the species distribution in South Africa. Colonies comprising of 3 or
fewer individuals were removed from this analysis. Regression coefficient (r2) = 0.24, p = 0.151
Figure 4.9. Regression showing the relationship relatedness coefficients (R) between Smaug giganteus colonies
and distance (metres) for 15 colonies (115 pairwise comparisons) across the species distribution in South Africa.
Regression coefficient (r2) = 0.351, p < 0.01.
Inbreeding analysis
Deviance information criterion (DIC) values for the ‘nb’ model were lower than the ‘nfb’ model in
both the Heilbron and Welkom colonies, indicating that the models without inbreeding are a better fit
than models that include the presence of null alleles (Table 4.8). The Volksrust colony had lower DIC
values for the ‘nfb’ model than the ‘nb’ model, suggesting that inbreeding is a significant component
of the model in this colony. This is further supported in that the Volksrust colony had the highest
Average (FIS) values of the three colonies - almost double that of the Heilbron colony, and almost
triple that of the Welkom colony.
0
0,1
0,2
0,3
0,4
0,5
0,6
0,7
0,8
0,9
0 5 10 15 20 25 30 35 40
Rel
ate
dn
ess
(R)
Number of lizards per colony
-0,4
-0,3
-0,2
-0,1
0
0,1
0,2
0,3
0,4
0 50000 100000 150000 200000 250000 300000 350000 400000
Rel
ate
dn
ess
(R)
Geographic distance (m)
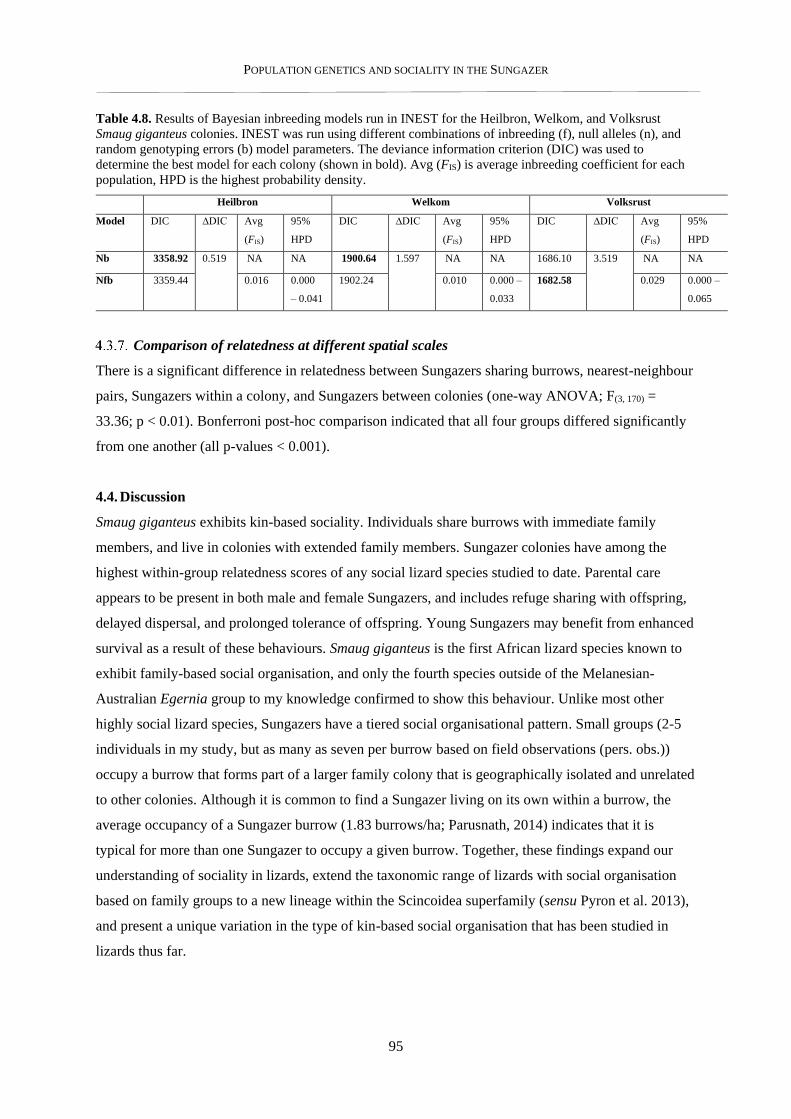
POPULATION GENETICS AND SOCIALITY IN THE SUNGAZER
95
Table 4.8. Results of Bayesian inbreeding models run in INEST for the Heilbron, Welkom, and Volksrust
Smaug giganteus colonies. INEST was run using different combinations of inbreeding (f), null alleles (n), and
random genotyping errors (b) model parameters. The deviance information criterion (DIC) was used to
determine the best model for each colony (shown in bold). Avg (FIS) is average inbreeding coefficient for each
population, HPD is the highest probability density.
Heilbron Welkom Volksrust
Model DIC ∆DIC Avg
(FIS)
95%
HPD
DIC ∆DIC Avg
(FIS)
95%
HPD
DIC ∆DIC Avg
(FIS)
95%
HPD
Nb 3358.92 0.519 NA NA 1900.64 1.597 NA NA 1686.10 3.519 NA NA
Nfb 3359.44 0.016 0.000
– 0.041
1902.24 0.010 0.000 –
0.033
1682.58 0.029 0.000 –
0.065
Comparison of relatedness at different spatial scales
There is a significant difference in relatedness between Sungazers sharing burrows, nearest-neighbour
pairs, Sungazers within a colony, and Sungazers between colonies (one-way ANOVA; F(3, 170) =
33.36; p < 0.01). Bonferroni post-hoc comparison indicated that all four groups differed significantly
from one another (all p-values < 0.001).
4.4. Discussion
Smaug giganteus exhibits kin-based sociality. Individuals share burrows with immediate family
members, and live in colonies with extended family members. Sungazer colonies have among the
highest within-group relatedness scores of any social lizard species studied to date. Parental care
appears to be present in both male and female Sungazers, and includes refuge sharing with offspring,
delayed dispersal, and prolonged tolerance of offspring. Young Sungazers may benefit from enhanced
survival as a result of these behaviours. Smaug giganteus is the first African lizard species known to
exhibit family-based social organisation, and only the fourth species outside of the Melanesian-
Australian Egernia group to my knowledge confirmed to show this behaviour. Unlike most other
highly social lizard species, Sungazers have a tiered social organisational pattern. Small groups (2-5
individuals in my study, but as many as seven per burrow based on field observations (pers. obs.))
occupy a burrow that forms part of a larger family colony that is geographically isolated and unrelated
to other colonies. Although it is common to find a Sungazer living on its own within a burrow, the
average occupancy of a Sungazer burrow (1.83 burrows/ha; Parusnath, 2014) indicates that it is
typical for more than one Sungazer to occupy a given burrow. Together, these findings expand our
understanding of sociality in lizards, extend the taxonomic range of lizards with social organisation
based on family groups to a new lineage within the Scincoidea superfamily (sensu Pyron et al. 2013),
and present a unique variation in the type of kin-based social organisation that has been studied in
lizards thus far.
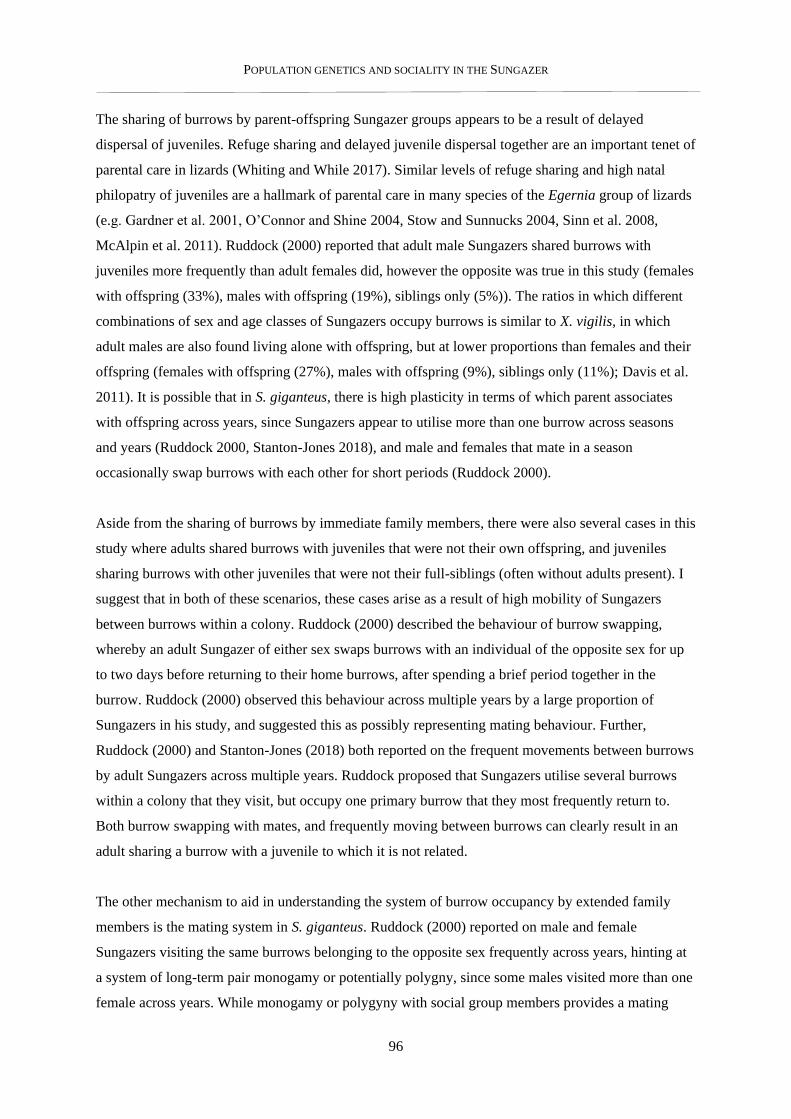
POPULATION GENETICS AND SOCIALITY IN THE SUNGAZER
96
The sharing of burrows by parent-offspring Sungazer groups appears to be a result of delayed
dispersal of juveniles. Refuge sharing and delayed juvenile dispersal together are an important tenet of
parental care in lizards (Whiting and While 2017). Similar levels of refuge sharing and high natal
philopatry of juveniles are a hallmark of parental care in many species of the Egernia group of lizards
(e.g. Gardner et al. 2001, O’Connor and Shine 2004, Stow and Sunnucks 2004, Sinn et al. 2008,
McAlpin et al. 2011). Ruddock (2000) reported that adult male Sungazers shared burrows with
juveniles more frequently than adult females did, however the opposite was true in this study (females
with offspring (33%), males with offspring (19%), siblings only (5%)). The ratios in which different
combinations of sex and age classes of Sungazers occupy burrows is similar to X. vigilis, in which
adult males are also found living alone with offspring, but at lower proportions than females and their
offspring (females with offspring (27%), males with offspring (9%), siblings only (11%); Davis et al.
2011). It is possible that in S. giganteus, there is high plasticity in terms of which parent associates
with offspring across years, since Sungazers appear to utilise more than one burrow across seasons
and years (Ruddock 2000, Stanton-Jones 2018), and male and females that mate in a season
occasionally swap burrows with each other for short periods (Ruddock 2000).
Aside from the sharing of burrows by immediate family members, there were also several cases in this
study where adults shared burrows with juveniles that were not their own offspring, and juveniles
sharing burrows with other juveniles that were not their full-siblings (often without adults present). I
suggest that in both of these scenarios, these cases arise as a result of high mobility of Sungazers
between burrows within a colony. Ruddock (2000) described the behaviour of burrow swapping,
whereby an adult Sungazer of either sex swaps burrows with an individual of the opposite sex for up
to two days before returning to their home burrows, after spending a brief period together in the
burrow. Ruddock (2000) observed this behaviour across multiple years by a large proportion of
Sungazers in his study, and suggested this as possibly representing mating behaviour. Further,
Ruddock (2000) and Stanton-Jones (2018) both reported on the frequent movements between burrows
by adult Sungazers across multiple years. Ruddock proposed that Sungazers utilise several burrows
within a colony that they visit, but occupy one primary burrow that they most frequently return to.
Both burrow swapping with mates, and frequently moving between burrows can clearly result in an
adult sharing a burrow with a juvenile to which it is not related.
The other mechanism to aid in understanding the system of burrow occupancy by extended family
members is the mating system in S. giganteus. Ruddock (2000) reported on male and female
Sungazers visiting the same burrows belonging to the opposite sex frequently across years, hinting at
a system of long-term pair monogamy or potentially polygny, since some males visited more than one
female across years. While monogamy or polygyny with social group members provides a mating
POPULATION GENETICS AND SOCIALITY IN THE SUNGAZER
97
advantage in guaranteeing mating success over several years (Graves and Duvall 1995), consistent
mating with close relatives can lead to inbreeding depression. As an inbreeding avoidance
mechanism, several fraternal lizard species that exhibit long-term pair monogamy with partners in the
same social group employ the tactics of 1) mating with other individuals from within the colony
between mating with the long-term partner (Olsson et al. 1994), 2) mating with extra-group
individuals that arrive in a colony through dispersal (Amos et al. 1993, Sillero-Zubiri et al. 1996), 3)
mating with other males during the same season, resulting in multiple paternity of offspring (Tiliqua
rugosa, Bull et al. 1998, Egernia stokesii, Gardner et al. 2002, E. saxatilis, O’Connor and Shine 2003,
E. cunninghami, Stow and Sunnucks 2004, Liopholis whitii, While et al. 2014). All three mechanisms
can result in higher heterozygosity of offspring, and counter the potentially deleterious effects of
intragroup breeding (Brooker et al. 1990, Coltman and Slate 2003, Eimes et al. 2005, Chapman et al.
2009, Whittingham and Dunn 2010, Michalczyk et al. 2011). The shed-skin samples belonging to
Sungazers that could not be found in the colony at the time of sampling were generally unrelated to
the adults occupying the burrows where the shed-skins were found. These animals may have been
dispersing adults from another colony that had since moved on from the time of sampling. These
mechanisms serve as potential explanations of the occurrence of both full-siblings and half-siblings
sharing a burrow with an adult of either sex, although long-term social studies are required to fully
understand the complexities of this system and which if any of these mechanisms are employed by S.
giganteus.
Reproductive adults of many social lizard species (T. rugosa; Bull and Cooper 1999, E. stokesii;
Gardner et al. 2001, E. cunninghami; Stow and Sunnucks 2004, Chapple and Keogh 2005) tend to
choose mates within a group that are less related to them than would be expected by chance, given the
average level of relatedness within a given social group. In contrast, Sungazers that were identified as
candidate parent pairs of offspring in this study were less related, but not significantly so, than would
be expected by chance. This could be a result of the comparatively high level of relatedness within
Sungazer colonies compared to social groups in other species. Despite the high level of relatedness
between mate pairs, inbreeding was not detected in any of the three well-sampled colonies in this
study. In addition to the mating strategies that are employed for inbreeding avoidance, cooperative
breeding animals are known to exhibit high levels of inbreeding tolerance, and it therefore may not be
possible to identify strong inbreeding costs in systems where inbreeding avoidance mechanisms have
evolved simply because inbreeding levels, and hence statistical power, are low (see Foerster et al.
2006).
Pre-copulatory inbreeding avoidance behaviour in many of the Egernia group species is attributed to
olfactory-based kin recognition (Main and Bull 1996, Michael Bull and Cooper 1999, Bull et al. 2000,
POPULATION GENETICS AND SOCIALITY IN THE SUNGAZER
98
2001). This is a functional mechanism that may be employed in S. giganteus, since the species has
highly developed generation glands that have been suggested to play a role in chemical signalling
between conspecifics (Ruddock 2000, Louw et al. 2007, 2011, Mouton et al. 2018). Mate choices of
pairs of Sungazers in my study are likely due to potential constraints on a female’s choice of social
partner within a colony, driven by limited or non-random dispersal resulting in a fine-scale genetic
structure (sensu Szulkin and Sheldon 2008, Szulkin et al. 2009). One potential benefit of increased
relatedness in a colony is the promotion of kin-selected behaviour, decreasing aggression towards
other group members, which can potentially increase survival (Kokko and Ots 2006). When coupled
with the greater relatedness of social partners compared with random mates within the population,
these results may actually suggest selection for mating with kin (e.g. via positive effects on the
inclusive fitness of the parents; Kokko and Ots 2006, Szulkin et al. 2013)
The relatedness of Sungazers in nearest neighbouring burrows was significantly different from the
average relatedness of Sungazers within a colony – although both groupings were extended family
members on average. High natal philopatry appears to lead to clustering of immediate family within
burrows, with no further discernible structure within the colony, as there was no pattern of isolation
by distance pattern detected within colonies. The clustering among related individuals in a population
observed in this study is suggested to be a first indicator of cohesive social aggregations (Fuller et al.
2005). The lack of discernible structure within a colony is likely attributed to the aforementioned
mechanisms of burrow swapping, and utilisation of several burrows by individual Sungazers.
Ruddock (2000) found that 68% of Sungazers moved between different burrows over a single month,
and 75% moved between burrows across seasons. Stanton-Jones (2018) similarly found that 60% of
Sungazers moved burrows across a season, with both studies finding that males move around
significantly more than females. Although Sungazers appear to show high-fidelity and have been
recorded occupying the same burrow for as long as 20 years (pers. obs., McIntyre 2006), it is clear
that Sungazer social behaviour is characterised by frequent movement between burrows. This high
level of mobility and utilisation of several burrows within a colony by individual Sungazers provides
a likely explanation for the lack of obvious structure within colonies, outside of immediate family
members sharing burrows.
The within-group relatedness scores recorded for Sungazer colonies in my study (R = 0.345) are
amongst the highest recorded for a social lizard species. Species belonging to the Egernia group
typically have within-group relatedness scores indicative of primarily extended family membership
(e.g. E. stokesii, R = 0.166 (Gardner et al. 2001); L. whitii, R = 0.199 (Chapple and Keogh 2005);
Bellatorias frerei, R = 0.208 (Duckett et al. 2012); E. cunninghami, R = 0.253-0.264 (Stow et al.
2001)). By comparison, the relatedness scores within colonies in my study for Sungazers indicate a
POPULATION GENETICS AND SOCIALITY IN THE SUNGAZER
99
higher composition of immediate family members than most species in the Egernia group. Xantusia
vigilis groups containing juveniles had an average relatedness score of R = 0.137 (Davis et al. 2011),
which is generally lower than values found in the Egernia group and the present study, although still
representative of a group made up primarily of extended family. By comparison, none of the S.
giganteus colonies in this study had an average relatedness score lower than R = 0.137 (as in Xantusia
vigilis, Davis et al. 2011), and only a third had average relatedness scores lower than R = 0.264 (as in
Egernia cunninghami, Stow et al. 2001). The high level of within-group relatedness recorded in these
species are generally attributed to high levels of natal philopatry and delayed juvenile dispersal that
results in high levels of relatedness between adults and offspring within a social group .The results of
my study indicate the same is likely true for S. giganteus. The higher levels of within group
relatedness in S. giganteus can possibly be attributed to the nature of the species’ refuges. Whilst most
social species of the Egernia group use rock crevices, trees, and fallen logs as refuges (Whiting and
While 2017), Sungazers depend on self-excavated burrows as refuges. These burrows are the only
available shelters from predation and a harsh climate, and are also important in daily maintenance of
optimal body temperatures (Stanton-Jones et al. 2018). The reliance on these burrows may facilitate a
high level of high site fidelity over time – leading to more closely related family members living
together over long periods.
Obligate burrowing is uncommon among highly social species, with only a few cases in the Egernia
group following a similar life-history. Liopholis kintorei is one such species, but differs in that
multiple individuals construct elaborate multi-tunnelled burrows that are occupied for up to seven
years by multiple generations of cohorts, generally with both parents (McAlpin et al. 2011). These
burrow systems are suggested to serve an important function in protecting juveniles from predation
and intraspecific aggression (McAlpin et al. 2011). Sungazer burrows are aggressively defended by
adult Sungazers of both sexes (Ruddock 2000), and aside from the protection of this valuable
resource, it is possible that the defence of a burrow is also related to the direct protection of offspring
from intraspecific aggression and cannibalism (Van Wyk 1992). Neonate Sungazers are especially
vulnerable to predation by mesopredators, since their protective spikes have not yet ossified and are
therefore more palatable to predators (Parusnath 2012). Sungazer burrows are remarkably uniform in
dimension (Van Wyk 1992), and are most likely dug only by adults, since young Sungazers are
unlikely to be able to construct burrows of such size in the hard clay-like soil that the species burrows
in. These burrows are likely constructed over several months in the wet austral summer season
(Branch and Patterson 1975), and young Sungazers would expose themselves to significant risk while
digging such a burrow over this period. Finally, although the dispersal system is not well studied in S.
giganteus, it is possible that offspring may benefit from the inheritance of territories as a result of
prolonged parental care (sensu Gardner et al. 2001). Together, these behaviours associated with
POPULATION GENETICS AND SOCIALITY IN THE SUNGAZER
100
Sungazers self-excavated burrow systems are likely to signifantly reduces infant mortality, and may
provide some insight into the evolution of kin-based sociality in the species.
Smaug giganteus, similar to all species of the Egernia group that have been studied this far, has
significantly higher levels of relatedness within colonies (‘family groups’ in Egernia) than between
colonies (Gardner et al. 2001, Stow and Sunnucks 2004, Fuller et al. 2005, Chapple and Keogh 2005,
McAlpin et al. 2011, While et al. 2014) – further supporting the hypothesis that Sungazers
preferentially group with family members. Smaug giganteus, however, appears to be unique amongst
the social lizards studied to date, since colonies appear to be discrete units that are separated by at
least ~1km, and the placement of colonies in the environment appears to be serendipitous and not
necessarily associated with any discernible features. In other social lizard species, distances between
social groups tends to be dependent on the abundance and availability of niches, and can range from
several metres to several kilometres between trees (B. frerei, Duckett et al. 2012), or several metres to
several kilometres between rock outcrops (E. stokesii, Gardner et al. 2001; L. whitii, Godfrey et al.
2006). Nevertheless, the average between-colony relatedness in S. giganteus (R = -0.043) is similar to
other social lizard species (e.g. E. cunninghami, R = -0.064 - 0.028 Stow et al. 2001; E. stokesii, R = -
0.024 Gardner et al. 2001; B. frerei, R = -0.004 Duckett et al. 2012; L. whitii, R = -0.001 (Chapple
and Keogh 2005)).
As expected, there was a significant negative relationship between colony relatedness and geographic
distance in S. giganteus. The trend of increasing genetic differentiation with genetic distance indicates
the low dispersal ability of Sungazers (also corroborated by the IBD in areas devoid of significant
physical barriers), and mirrors similar trends found in the Egernia group (Whiting and While 2017).
Some pairs of S. giganteus colonies, however, showed higher than expected levels of relatedness
given the geographic distance between them (eg. Wesselsbron – Harrismith; R = 0.299). While this
may suggest a high level of gene flow between these populations, it may also suggest the presence of
similar common alleles in these populations. Both colonies occur within the relatively homogenous
Western clade, in which conditions between colonies at the western and eastern edges of the clade
may not be significantly different enough to induce local adaptation. The colonies may also not have
been separated for long enough periods to experience high levels of genetic drift. Nevertheless, the
high pairwise relatedness of some pairs of colonies towards the southern extreme of the species
distribution might indicate that within particular areas, there is a greater degree of gene flow among
those colonies than is typical. Further investigation into gene flow in these areas may elucidate the
factors that serve to facilitate higher levels of genetic exchange between these populations.
POPULATION GENETICS AND SOCIALITY IN THE SUNGAZER
101
Conclusion
This is the first study to provide genetic evidence of kin-based sociality in an African lizard species.
Additionally, it is only the second case of kin-based sociality in lizards outside of the Melanesian-
Australian Egernia radiation of lizards. These findings open the door to further investigations of
sociality in other species in the Cordylidae family, as well as the Gerrhosauridae, the fourth and final
family within the Scincoidae superfamily in which kin-based sociality has been suspected to occur
(Whiting and While 2017). Several of these species share similar life-history traits with other social
lizards species, such as late age of first reproduction, low litter size, aggregative behaviour, and high
site-fidelity – traits that combined with low refuge availability may lead to the convergent emergence
of kin-based sociality in these species. Key among these species are O. cataphractus which has long
been known for its stable aggregative behaviour in rock crevices (Mouton et al. 1999, Visagie et al.
2005, Mouton 2011), and Matobosaurus validus and Gerrhosaurus skoogi, which may form loosely
structured colonies (Bates et al. 2013). Frequent observations of adult M. validus with juveniles may
indicate the presence of familial living in the species (Martin Whiting pers. obs.). Smaug giganteus
remains unique however, in that it is the only burrowing species within the Cordylidae, and as such
likely exhibits behaviours unique to its burrow-dependent life-history. Despite the value of these
findings, our understanding of the social structure system in S. giganteus is still in its infancy, and
lags several decades behind research on the Egernia group of lizards. As such, studies focused on
investigating particular aspects of the species social structure such as inbreeding avoidance
mechanisms, long-term population dynamics and the intricacies of social networks within colonies
will continue to unravel the complex puzzle of kin-based sociality in lizards.
POPULATION GENETICS AND SOCIALITY IN THE SUNGAZER
102
CHAPTER 5
SYNTHESIS & DIRECTIONS FOR FUTURE RESEARCH, CONSERVATION RECOMMENDATIONS, AND
FINAL CONCLUSION
5.1. Synthesis and directions for future research
Understanding drivers of genetic structure in Smaug giganteus
Smaug giganteus is unique amongst its family and genus. Most species of Cordylidae, and all other
species of Smaug, are rupicolous – inhabiting rocky outcrops and taking refuge in narrow crevices
(Branch 1988, Mouton and Van Wyk 1997). Sungazers, in contrast, are dependent on flat, primary
grasslands, where the self-excavated burrows that they are reliant on are their only refuge from
predators and a harsh climate (Branch 1988, Stanton-Jones et al. 2018). Although the other species
within Smaug are large in body size, Smaug giganteus is by far the largest. Stanley (2009) suggests
that the Cordylidae originated in east Africa and migrated southwest. In this scenario, Smaug
giganteus has migrated furthest south east amongst the Smaug species, ostensibly from mountain
ranges in the north east of its current range. The grassland habitat that the species has evolved to
occupy to may therefore be the most novel amongst the genus, requiring equally novel adaptations to
thrive within it.
The large body size of Sungazers suggest several adaptations to life in the grasslands. The
requirement of having to excavate a ~1.5 m long burrow in hard clay soils may have conferred
selective advantages onto Sungazers with larger and more heavily armoured bodies, since Sungazers
are most vulnerable to predation when out of their burrows over extended periods of time (Jacobsen et
al. 1990, Groenewald 1992). Thick thoracic armour typically evolves in small animals that increase in
body size and move into more open habitats (Stankowich and Campbell 2016). Living in a more
exposed habitat may increase predation risk, thus spurring rapid changes in morphology and
behaviour in order to adapt (Vamosi 2005, Nosil and Crespi 2006, Broeckhoven et al. 2015).
Sungazers are also free from the constraints of rock crevices in their grassland habitat, which to an
extent restrict the body sizes that rupicolous species can adopt (Mouton and Van Wyk 1997, Stanley
2009). Finally, the short muscular limbs, and thick spinose tail that the species have evolved appear to
play a significant role in the defensive behaviour that Sungazers exhibit from within their burrows.
When threatened, Sungazers retreat headfirst into their burrows, and thrust their heads and dorsal
surfaces against the upper surface of the burrow. The large occipital and thoracic spines are anchored
in place in the roof of the burrow by the force produced by their forelimbs (Losos et al. 2002). If
antagonised, the Sungazer will either swing its tail laterally (Marais 1984), or induce a sigmoidal
motion with its tail (pers. obs.), forcing its ossified spines into the hand/snout of the
researcher/predator that is trying to capture it. The weaponization of tails in amniotes typically
POPULATION GENETICS AND SOCIALITY IN THE SUNGAZER
103
evolves in response to adaptation to an open environment, or one where a single entry burrow can be
defended - both of which are characteristic of that the habitat that Sungazers occupy (Stankowich and
Campbell 2016, Arbour and Zanno 2018).
These morphological and behavioural adaptations that have allowed for Sungazers to successfully
colonise grasslands also appear to significantly limit their mobility, particularly in structurally
complex habitats. The species has not been recorded as inhabiting landscapes other than flat or gently
sloping primary grassland (Parusnath 2014). It is very likely therefore, that the rocky outcrops and
escarpments that erupted into the eastern Highveld grasslands approximately 2.5-1.8 MYA (Partridge
and Maud 1987), presented significant barriers to genetic exchange between what were once
connected populations. The high levels of genetic differentiation between the Western, Central, and
Eastern S. giganteus clades identified in my study suggest that these barriers may be absolute between
clades. Although mountains do not seem to serve as barriers to gene flow for most species within the
Cordylidae, rivers commonly do (Diedericks and Daniels 2014, Stanley and Bates 2014), even in the
most agile members of the Cordylidae, the Platysaurinae (Scott et al. 2004). Aside from the physical
barriers of rivers, the microclimates within river valleys are also generally unsuitable for the cordylid
species that occur on either side of them, precluding movement and therefore genetic exchange across
these valleys (Stanley 2013, Diedericks and Daniels 2014). It is evident from analysing the spatial
spread of niche suitability for S. giganteus that the same is true for this species. It is difficult to
ascertain the specific effect of rivers on dispersal and gene flow in the species, since most of the
putative river barriers are closely associated with geological structures that also appear to serve as
barriers. The comparatively homogenous landscape of the Western clade is the only region in which
isolation by distance was detected, indicating that in areas devoid of physical barriers, the low
mobility of dispersing individuals may still result in genetic structuring across a population through
distance alone.
The ecological niche model conducted for S. giganteus in this study provides some insight into the
parameters that correlate with niche suitability for the species. Soil profile, geological profile and
vegetation type were the strongest predictor variables for high niche suitability, and are perhaps the
variables most linked with the ability of Sungazers to dig burrows within a particular area. Given that
Sungazers are reliant on their own self-excavated burrows as refuges from predation, regions within
and outside of the distribution that differ significantly from optimal soil and geological profiles
preclude the expansion of Sungazers into those areas. The low mobility and agility of individual
Sungazers also suggests that without expansion over a landscape through the construction of burrows
over generations, it is unlikely for Sungazers to move great distances over unsuitable habitat without
being exposed to great predation risk. The habitat specialist nature of S. giganteus and the strict
POPULATION GENETICS AND SOCIALITY IN THE SUNGAZER
104
adherence to its ecological niche are therefore also important factors that restrict gene flow across
unsuitable habitats.
Transformed habitat can present as significant a barrier to dispersing reptiles as geological features,
but affect gene flow over a much more recent, and shorter temporal scale. The effects of reduced
dispersal therefore do not necessarily reflect in contemporary patterns of gene flow between
populations. Sungazers have long generation lengths and slow reproductive rates, which may make
the species particularly prone to a time-lag effect, in which current effects of a landscape feature on
dispersal only manifest genetically in future generations. The impacts of habitat transformation that
began in the distribution of the species in the early 1900s (representing fewer than 10 generations)
appear to not yet be evident in patterns of genetic structure in the species. Habitat fragmentation is
already believed to be the causal factor behind population declines in the species however, believed to
be due to edge effects such as drought stress, flooding, prey shortages, and exposure to pollution and
pesticides that are associated with small patch size (Parusnath et al. 2017). Sungazers may also be
exposed to high stochastic risk when navigating crop fields and fallow lands, since these
environments are not partial to burrow construction and may be more vulnerable to predation. It is
therefore to imperative to 1) further investigate the comparative ability of Sungazers to traverse
agricultural matrices vs natural matrices, 2) conduct more focused, fine-scale studies of gene flow in
areas particularly marred by agricultural landcover change.
Differences in body size between Sungazers from the west and east of the distribution correlate with
elevational and climactic differences. Squamates tend to be smaller in size at higher elevations and
cooler temperatures (Ashton and Feldman 2003), possibly as the result of selection for increased
surface area to volume ratio to allow more rapid heating and cooling (Cowles 1945, Bogert 1949,
Stevenson 1985a, 1985b). While it may be that selection favours smaller body sizes at higher
elevation, as per the inverse of the controversial Bergmann’s rule, it is also plausible that the observed
differences in average body size across clades result from differences in food availability, or random
genetic drift. It is difficult to definitively assign a cause to the differences in Sungazer body size
between clades, and there are several theories that require further examination before a conclusion can
be reached. Whether local adaptation, genetic drift, or food availability, understanding the driver
behind intraspecific body size differences in S. giganteus will provide further insight the adaptive
ability of cordylids in colonising different environments and habitats.
Sociality in lizards
In this thesis I report the first quantitative evidence of kin-based sociality in S. giganteus. This is the
first confirmation of kin-based sociality in an African lizard species, and only the fourth species
POPULATION GENETICS AND SOCIALITY IN THE SUNGAZER
105
outside of the Australian Egernia group (Davis et al. 2011, While et al. 2019) known to exhibit such
behaviour. Kin-based sociality has been studied in detail in 17 species belonging to the Egernia group
(While et al. 2019), and a single species from North America (Xantusia vigilis, Davis et al. 2011).
While S. giganteus, X. vigilis, and the Egernia group all belong to the Scincoidae superfamily, the
presence of kin-based sociality in each of these species is believed to result from convergent evolution
(Davis et al. 2011, While et al. 2015, 2019). Indeed, all known species with kin-based sociality share
very similar life-history traits including high site-fidelity, late age of first reproduction, low
reproductive rate, and live birth. These life-history traits are characteristic of the “k-selected” life-
history (Dunham 1982) which is usually associated with some species of birds and mammals. Lizards
that give live birth to few, large offspring per litter in environments with limited refuges may undergo
selective pressure to tolerate the sharing of refuges with their offspring in an effort to increase
survivorship, leading to the evolution of sociality in these species. Other lizard species with similar
life history traits are therefore ideal candidates in which kin-based sociality should be investigated.
Several other species within the Cordylidae may also exhibit kin-based sociality, based on similar life
history traits and anecdotal evidence of grouping behaviour. Ouroborus cataphractus and other
species within Smaug are likely candidates to next investigate for the presence of kin-based social
systems (Mouton et al. 1999, Mouton 2011, Visagie et al. 2005). The aggregative behaviour of O.
cataphractus has long been recognised and studied (Mouton et al. 1999, Visagie et al. 2002, Mouton
2011), although the selective forces behind these aggregations has been ascribed to clustering because
of nearby food sources (Shuttleworth et al. 2013). Besides the results of my thesis, no other genetic
investigations on the family have been undertaken to assess the relatedness of individuals that cluster
together. The limited use of genetic tools in investigating aspects of social behaviour in the
Cordylidae is surprising, given observations of some social aspects over the years (Van Wyk 1992,
Ruddock 2000, Stanton-Jones et al. 2018). It is possible that these stable aggregations of O.
cataphractus, like S. giganteus colonies, may represent family groups.
The remaining family within the Scincoidae in which kin-based sociality has been suspected, but not
yet investigated is the Gerrhosauridae. Many species in the Gerrhosauridae share many of the life-
history traits with the social Egernia species and S. giganteus, but are oviparous rather than viviparous
(Loveridge 1942, FitzSimons 1943, Broadley 1966, Branch 1998), and are active foragers, as opposed
to the sit-and-wait foragers as most of the Cordylidae are. Nevertheless, Matobosaurus validus and
Gerrhosaurus skoogi are believed to form loosely structured colonies (Bates et al. 2013), and
observations of juveniles frequently seen associated with adults may be suggestive of family
living (Martin Whiting pers. obs.). Sixty eight other species of lizards in 16 families are known to
show aggregative behaviour (Gardner et al. 2016), although evidence of the long-term stability of
POPULATION GENETICS AND SOCIALITY IN THE SUNGAZER
106
these aggregations is limited. Genetic studies of kinship between individuals living in aggregations
are even more limited in lizards. Given the extent of what appears to be independent evolutions of
kin-based sociality within the Scincoidae, genetic investigations of relatedness between aggregating
individuals in other lizard species may be the first step in elucidating the full extent of sociality in
lizards.
The Sungazer is an ideal model species in which to expand research on sociality in African lizards.
The high level of site-fidelity of Sungazers within colonies over decades means that long-term studies
on population dynamics and behavioural observations can be performed over time with relative ease.
New technologies such as the automated cellular PIT tag reader system (ACRS) developed by
Stanton-Jones (2018) would allow for the remote monitoring of genotyped individuals and how they
interact with each other. The ACRS systems have shown a 98.5% success rate in reporting the
emergence and retreating activities of Sungazers. Burrow systems fitted with ACRS systems can be
monitored with camera traps so that the behaviours displayed by individuals can be observed. Camera
traps could also potentially record the entry of untagged Sungazers into burrows and reveal the
frequency with which Sungazers from a different colony enter the study colony. Modern camera traps
can be accessed remotely through mobile data connectivity, to provide a live-feed, or to access images
and videos stored on the camera. Together, the technologies of the ACRS, camera traps, and
microsatellite genotyping would make for a powerful, remotely-monitored system with which many
questions could be answered, such as: 1) how long do juveniles stay with their parent before they
disperse?, 2) how far do juveniles disperse from their home burrow?, 3) are Sungazers monogamous?,
4) is there sex-biased dispersal in Sungazers, and how far do dispersing animals travel?, 5) are the
frequent movements by Sungazers between burrows for reproductive purposes?, 6) how does a male
Sungazer end up in a burrow with its offspring?
The confirmation of kin-based sociality in S. giganteus also sheds light on social behaviours observed
in the field, which allow for the formulation of hypotheses to be tested. For instance, young Sungazers
are frequently observed sitting atop an adult Sungazer while basking. Based on the findings of my
thesis, it can be assumed that in most cases these consist of offspring-parent dyads. This behaviour
may constitute a novel form of parental care in the family. The grasslands that the species occupy are
densely occupied by Themeda triandra, and generally devoid of objects to bask on or gain a vantage
point. This may be why Sungazers have evolved the iconic ‘sungazing’ posture that the species is
named for, since the elevated posture exposes their dorsal surfaces to the sunlight (Stanton-Jones et al.
2018), and allows for surveillance of predators and prey. Standing on the back of their parent may
allow a young Sungazer to gain access to sunlight, from where it can reach and maintain its target
temperature, and spot prey items. The dorsal surfaces of adults are also generally darker than
POPULATION GENETICS AND SOCIALITY IN THE SUNGAZER
107
juveniles, and young Sungazers may also benefit from conductive heating from sitting on the back of
their parent. In the iguanian lizards species Phymaturus calcogaster and P. flagellifer, juveniles have
been recorded sitting on the back of adults, a behaviour thought to facilitate visual crypsis from above
and dissuade aerial predators that are not willing to attack an adult lizard (Eisenberg and Werning
2012, Halloy et al. 2013). This may also offer a plausible explanation of this behaviour in S.
giganteus, since the defensive spikes on the bodies of juveniles are not yet ossified and therefore
makes them an easier target for predators than an adult Sungazer.
An important benefit of social living that has only recently seen investigations in reptiles is the
behaviour of social learning (Hoppitt and Laland 2013). Social learning allows for an individual to
gain a skill or solve a problem without a lengthy, asocial, trial-and-error approach to learning (Munch
et al. 2018). Experimental studies have revealed evidence of social, context-dependant learning in
several lizard species. In these studies, individuals are able to solve a task more rapidly after
observing a conspecific solving the same task prior (Kis et al 2015, Munch et al. 2018, Whiting et al.
2018). Social learning may allow for juveniles to quickly learn from conspecifics how to access
resources such as food or shelter, and increase their survival rates in challenging or novel
environments (Damas-Moreira et al. 2018). In environments with high predation pressure, juveniles
may also learn how to detect and avoid predators through interaction with adults conspecifics
(Lanham and Bull 2004, Wilkinson et al. 2010, Halliwell 2016). Juvenile Sungazers appear to
associate closely with their parents/siblings when basking outside of the burrow, and may learn
thermoregulatory behaviour, predator avoidance and hunting strategies through observation.
Observational and experimental in situ studies may reveal the extent to which juveniles rely on
learning from their parents and conspecifics, and provide further insight into mechanisms that have
evolved in this species to enhance survival in the Highveld grasslands.
The confirmation of kin-based sociality in S. giganteus also poses further questions regarding several
physiological and behavioural traits and observations in the species that can be considered in a new
light given the findings of my thesis. The generation glands that Sungazers possess are significantly
larger and have more layers than in other cordylid species (Mouton et al. 2018). Sungazers exhibit
sexual dimorphism in this regard – while both sexes possess generation glands on the ventral femoral
region, males possess a second set of generation glands on the ventral forearm surface (Van Wyk
1992). The chemical composition of the secretions from the forearm and femoral glands are
qualitatively identical (Louw et al. 2011), and the reason for the occurrence of these glands in males
and not females is unknown. Sungazers can discriminate between generation gland pheromones
produced by themselves and other individuals of the same sex (Cooper et al. 1999, Ruddock 2000)
and it has been suggested that the function of these glands is to transfer of pheromones to substrates,
POPULATION GENETICS AND SOCIALITY IN THE SUNGAZER
108
and as such are believed to function in intraspecific communication (Ruddock 2000, Mouton et al.
2010). Cooper et al. (1999) suggested that the pheromones secreted by generation glands are used to
mark territories and detect the presence of transient individuals. It has also been suggested that since
forearm glands cannot easily transfer pheromones to a substrate the way that femoral glands do, they
may serve the purpose of marking grass surrounding their burrows (Louw et al. 2011), or their own
bodies (Mouton et al. 2010). Male Sungazers visit other burrows within a colony more frequently than
females do (Stanton-Jones 2018), and although it appears that Sungazers primarily occupy one burrow
over time, the forearm generation glands in males may serve to mark routes to other burrows (sensu
Tiliqua rugosa; Leu et al. 2016). These glands could also leave a chemical signal on females mated
within a season. This highlights an interesting avenue of research, since the role of generation glands
in intraspecific communication is still not well studied in the Cordylidae (Mouton et al. 2014a).
While living in social groups can be advantageous, an obvious downside is the heightened chance of
inbreeding depression through the proliferation of deleterious homozygous alleles within a group
(Keller and Waller 2002, Charlesworth and Willis 2009). Group living species therefore require
mechanisms to avoid the harmful effects of inbreeding in order to maintain genetic health (Brooker et
al. 1990, Keane et al. 1996, Cooney and Bennett 2000, Nelson-Flower et al. 2012). Sungazers are
highly sedentary animals with high-site fidelity, and in combination with delayed dispersal of
offspring from their natal area, may be highly exposed to inbreeding, particularly in highly
fragmented areas. Although inbreeding was only detected in one colony and at a very low level, the
majority of candidate parent pairs in my study were either 1st or 2nd degree relatives. It is likely that
female Sungazers employ mechanisms to increase the heterozygosity of offspring, since individuals
with higher levels of heterozygosity experience higher rates of survival (Foerster et al. 2003,
Stapleton et al. 2007).
Several inbreeding avoidance mechanisms have been described in the Egernia group, namely multiple
mating (Uller and Olsson 2008, While et al. 2009), multiple paternity (Gardner et al. 2002, O’Connor
and Shine 2003, Stow and Sunnucks 2004), and extra-pair mating (in socially monogamous species)
(While et al. 2014). In my thesis, the occurrence of inbreeding avoidance could not be confirmed
because the assignment of candidate parents to offspring in this study was based on probability and
not direct observation of mating. In order to empirically assess if multiple paternity occurs in S.
giganteus, the following steps are required: 1) observation of in situ male-female interactions, 2)
capture of gravid females and the subsequent birthing of their young in captivity, 3) genetic profiling
of mothers, offspring, and all potential fathers. This process would allow for the detection of the use
of this mechanism in S. giganteus, and serve as an explanation of how colonies are able to
successfully live in social groups without significant levels of inbreeding.
POPULATION GENETICS AND SOCIALITY IN THE SUNGAZER
109
Non-invasive tissue sampling in S. giganteus
I initially intended to only utilise non-invasive tissue collection protocols when collecting samples for
this project. Several hundred shed-skin samples were collected from the field, but unfortunately did
not reliably yield DNA suitable for the planned analyses. Preliminary tests using shed skins collected
directly from captive Sungazers prior to commencing fieldwork proved to yield high quality DNA,
and given the available literature on the use of shed skin in genetic analyses, I built this into my data
collection for this research. I did not consider the time effects and the effects of sub-optimal storage
conditions of these samples between collection and processing. Ultimately this resulted in the
rejection of the large majority of these non-invasively collected tissue samples. Tissue samples were
then collected through traditional sample protocols of collecting tail tips to conduct the planned
analyses. In spite of this, the testing of the efficacy of various tissue types, and the effects of storage
time on their efficacy were useful analyses, and will hopefully inform future studies on effective
sampling and storage protocols.
Shed skin samples, when processed within 12 months of collection yielded similar levels of
microsatellite profiling success to tail clippings, despite having lower quantity and purity of DNA
than tail clippings. Storage of shed-skin samples in media and at temperatures that reduce DNA
degradation may improve the usability of shed-skin samples stored over longer periods of time. The
lower purity and concentration of DNA in shed-skin samples compared to scale-clippings or blood is
likely due to both contaminants present in the environment and degradation in the field prior to
collection. Nevertheless, the lower quality and quantity of DNA yielded from shed-skin samples may
be worth the trade-off. The collection of shed-skin does not require capturing lizards, and is therefore
less stressful to the animals, more time efficient, and allows for the collection of a greater number of
samples over the same time period as active sampling.
These findings may be useful in planning similar studies of rare or threatened reptiles, since it is the
first investigation to my knowledge to compare different reptile tissue types and non-invasively
collected skin samples across storage periods. These implications may also extend to other groups of
animals that may be difficult to collect tissue samples from directly, due to rarity, threat status, or
other ethical concerns. Birds, and some mammals, shed keratinous tissue that is similar in
composition to Sungazer scales, and therefore may deteriorate similarly under the conditions in which
my samples were stored in this study. Although preliminary investigations comparing the usability of
different tissue types in other groups prior to commencing large-scale collection efforts is advised, my
findings on the efficacy of different tissue types in genetic research may prove useful in guiding
sampling and lab protocols in future studies.
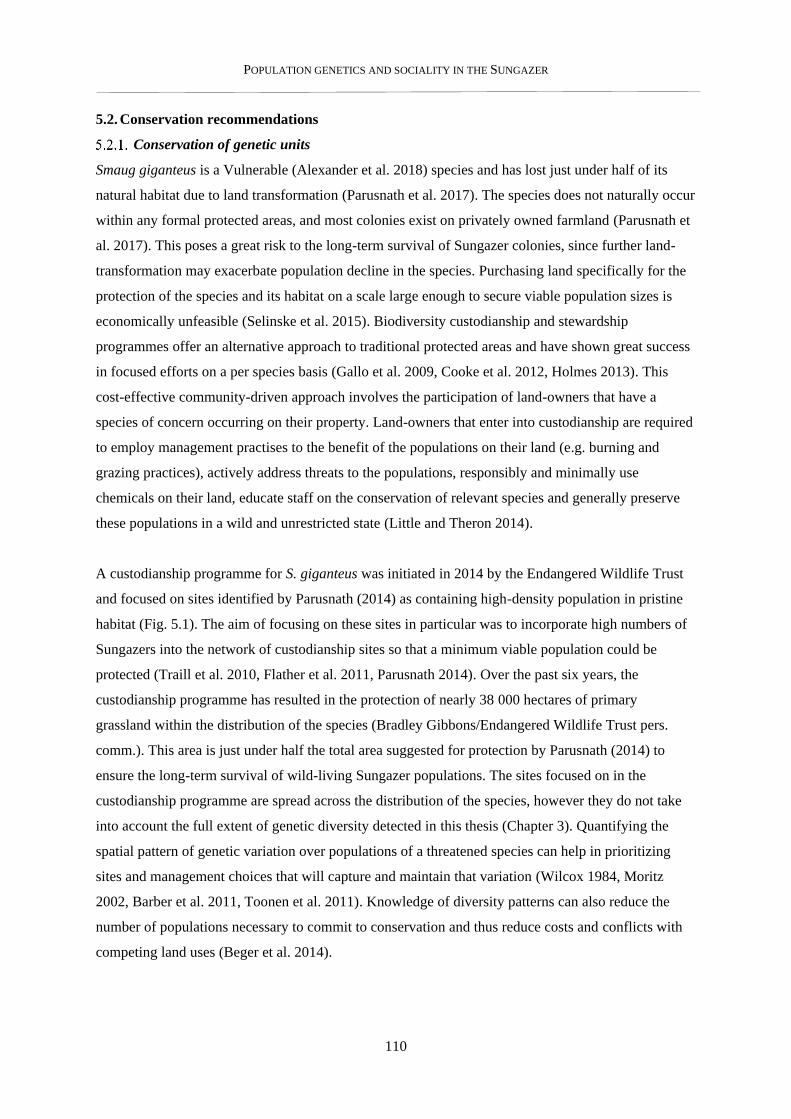
POPULATION GENETICS AND SOCIALITY IN THE SUNGAZER
110
5.2. Conservation recommendations
Conservation of genetic units
Smaug giganteus is a Vulnerable (Alexander et al. 2018) species and has lost just under half of its
natural habitat due to land transformation (Parusnath et al. 2017). The species does not naturally occur
within any formal protected areas, and most colonies exist on privately owned farmland (Parusnath et
al. 2017). This poses a great risk to the long-term survival of Sungazer colonies, since further land-
transformation may exacerbate population decline in the species. Purchasing land specifically for the
protection of the species and its habitat on a scale large enough to secure viable population sizes is
economically unfeasible (Selinske et al. 2015). Biodiversity custodianship and stewardship
programmes offer an alternative approach to traditional protected areas and have shown great success
in focused efforts on a per species basis (Gallo et al. 2009, Cooke et al. 2012, Holmes 2013). This
cost-effective community-driven approach involves the participation of land-owners that have a
species of concern occurring on their property. Land-owners that enter into custodianship are required
to employ management practises to the benefit of the populations on their land (e.g. burning and
grazing practices), actively address threats to the populations, responsibly and minimally use
chemicals on their land, educate staff on the conservation of relevant species and generally preserve
these populations in a wild and unrestricted state (Little and Theron 2014).
A custodianship programme for S. giganteus was initiated in 2014 by the Endangered Wildlife Trust
and focused on sites identified by Parusnath (2014) as containing high-density population in pristine
habitat (Fig. 5.1). The aim of focusing on these sites in particular was to incorporate high numbers of
Sungazers into the network of custodianship sites so that a minimum viable population could be
protected (Traill et al. 2010, Flather et al. 2011, Parusnath 2014). Over the past six years, the
custodianship programme has resulted in the protection of nearly 38 000 hectares of primary
grassland within the distribution of the species (Bradley Gibbons/Endangered Wildlife Trust pers.
comm.). This area is just under half the total area suggested for protection by Parusnath (2014) to
ensure the long-term survival of wild-living Sungazer populations. The sites focused on in the
custodianship programme are spread across the distribution of the species, however they do not take
into account the full extent of genetic diversity detected in this thesis (Chapter 3). Quantifying the
spatial pattern of genetic variation over populations of a threatened species can help in prioritizing
sites and management choices that will capture and maintain that variation (Wilcox 1984, Moritz
2002, Barber et al. 2011, Toonen et al. 2011). Knowledge of diversity patterns can also reduce the
number of populations necessary to commit to conservation and thus reduce costs and conflicts with
competing land uses (Beger et al. 2014).
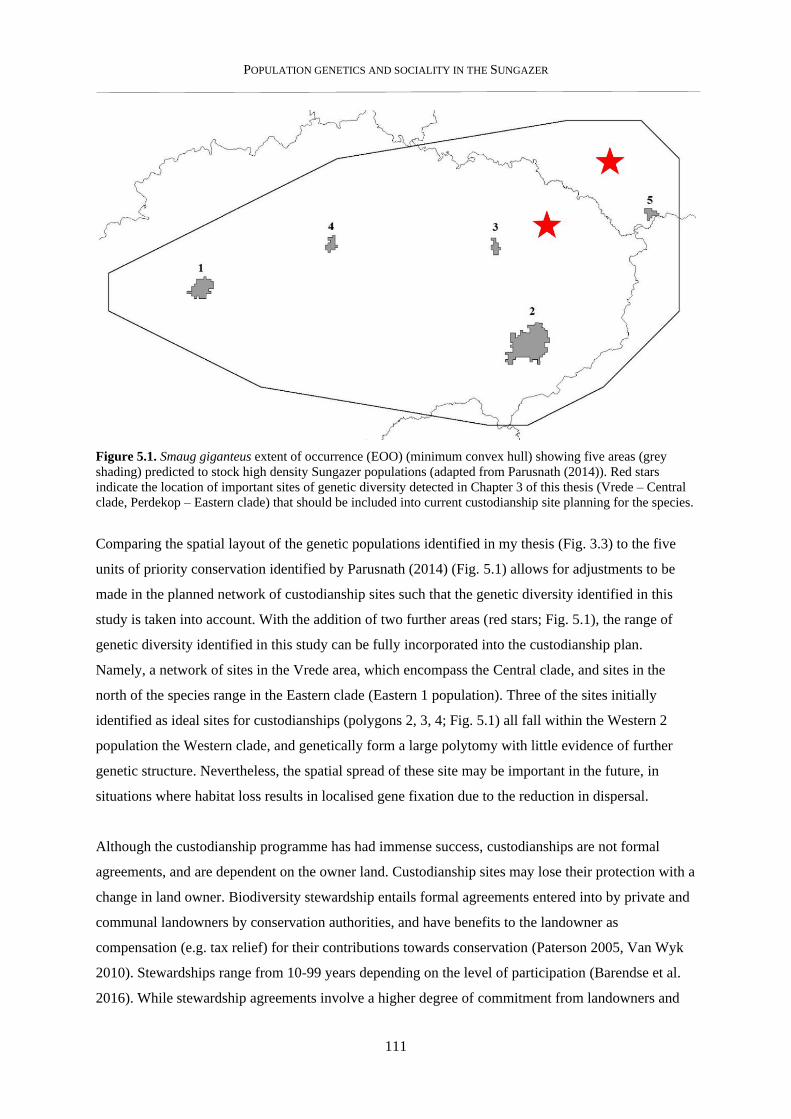
POPULATION GENETICS AND SOCIALITY IN THE SUNGAZER
111
Figure 5.1. Smaug giganteus extent of occurrence (EOO) (minimum convex hull) showing five areas (grey
shading) predicted to stock high density Sungazer populations (adapted from Parusnath (2014)). Red stars
indicate the location of important sites of genetic diversity detected in Chapter 3 of this thesis (Vrede – Central
clade, Perdekop – Eastern clade) that should be included into current custodianship site planning for the species.
Comparing the spatial layout of the genetic populations identified in my thesis (Fig. 3.3) to the five
units of priority conservation identified by Parusnath (2014) (Fig. 5.1) allows for adjustments to be
made in the planned network of custodianship sites such that the genetic diversity identified in this
study is taken into account. With the addition of two further areas (red stars; Fig. 5.1), the range of
genetic diversity identified in this study can be fully incorporated into the custodianship plan.
Namely, a network of sites in the Vrede area, which encompass the Central clade, and sites in the
north of the species range in the Eastern clade (Eastern 1 population). Three of the sites initially
identified as ideal sites for custodianships (polygons 2, 3, 4; Fig. 5.1) all fall within the Western 2
population the Western clade, and genetically form a large polytomy with little evidence of further
genetic structure. Nevertheless, the spatial spread of these site may be important in the future, in
situations where habitat loss results in localised gene fixation due to the reduction in dispersal.
Although the custodianship programme has had immense success, custodianships are not formal
agreements, and are dependent on the owner land. Custodianship sites may lose their protection with a
change in land owner. Biodiversity stewardship entails formal agreements entered into by private and
communal landowners by conservation authorities, and have benefits to the landowner as
compensation (e.g. tax relief) for their contributions towards conservation (Paterson 2005, Van Wyk
2010). Stewardships range from 10-99 years depending on the level of participation (Barendse et al.
2016). While stewardship agreements involve a higher degree of commitment from landowners and
POPULATION GENETICS AND SOCIALITY IN THE SUNGAZER
112
clerical work by conservation bodies, the long-term benefits far surpass those of custodianships
(Brown and Mitchell 2000, Gallo et al. 2009, Barendse et al. 2016). The high level of interest from
landowners in the existing custodianship programme for Sungazers is indicative of the level of
interest in the species by landowners, and perhaps efforts over the next decade can attempt to convert
landowners that are currently custodians into stewards. Given that the majority of grassland within the
distribution of the species is private property, privately protected areas through stewardships may
pose the most feasible long-term solution to protecting the species in the wild.
The use of genetic tools in combatting illegal trade in reptiles
During the course of my PhD, a non-detriment finding (NDF) on Smaug giganteus was conducted by
the Scientific Authority of South Africa (SANBI 2015) (detailed in section 1.5.5.2). The ratification
of this NDF mandated verification of F2 generation captive breeding of S. giganteus prior to receiving
a CITES permit to export the species from the country. The microsatellite markers designed in my
thesis (Chapter 2) have since been utilised in genetic tests to verify F2 captive breeding in the species.
Without evidence of F2 captive breeding in any cases thus far, no CITES permits have been granted
to export S. giganteus from South Africa since 2015. Smaug giganteus is the first South African
reptile for which an NDF has been conducted, and to my knowledge, the first species in which export
permits are no longer granted without genetic verification of captive breeding.
The importance of using genetic markers in reptile trade issues cannot be overlooked. South Africa is
home to many highly sought-after reptile species, many of which are rare, threatened, or difficult to
breed in captivity. In response to the emergence of governing bodies that seek to control and restrict
unbridled exportation of wild-caught animals from their countries of origin, the laundering of wild-
caught reptiles as captive-bred has become increasingly common (Lyons and Natusch 2011, Karanth
et al. 2014). Some reptile breeding facilities either underhandedly supplement legitimate captive
breeding with wild-caught individuals, or pose as a front for a smuggling operation (Lyons and
Natusch 2011, Welton et al. 2013, Karanth et al. 2014). The legal origin of many South African
reptiles in the international reptile is therefore often doubtful (Auliya et al. 2016). Online searches
reveal the prevalence of South African reptiles available worldwide, despite little evidence of
breeding facilities in South Africa or elsewhere that are capable of producing such numbers. The
problem remains that without the mandate of genetic proof of captive F2 breeding, wild-caught South
African reptiles will continue to be laundered and exported from the country as captive-bred animals.
Ideally, the following steps should be followed for South African reptile species threatened with over-
exploitation: 1) collection of evidence of wild-caught South African reptiles for sale through searches
of online fora, social media platforms and sales websites, 2) application of the listing of priority
POPULATION GENETICS AND SOCIALITY IN THE SUNGAZER
113
species on the appropriate CITES Appendix, 3) conduct NDFs in order to mandate proof of F2
breeding before granting permits for export of specimens from South Africa, 4) utilise genetic
markers to verify F2 breeding within a given breeding colony upon the application of export permits.
A detailed database of spatial genetic structure profiled with microsatellites or SNPs can also serve as
a reference database to identify the geographic origin of confiscated reptiles, and thereby identify
poaching hotspots and populations at risk from heavy exploitation pressures (eg. Ogden 2008,
Ghobrial et al. 2010), Welton et al. 2013, Mondol et al. 2015, Wasser et al. 2015).
The use of single nucleotide polymorphisms (SNPs)
When my study began in 2014, microsatellites were the prevailing genetic tool used in population
genetic studies. Microsatellites have several advantages in that they are tolerant to low quality
samples, and have high efficacy and specificity with the species they were designed for use with
(Selkoe and Toonen 2006, Guichoux et al. 2011). As a result of their specificity however, they do not
necessarily amplify loci in other closely related species, limiting their applicability beyond the species
they were designed for (Galbusera 2000). Scoring microsatellite alleles is a manual process and
requires significant human time contribution, and is also therefore prone to human error (Kalinowski
et al. 2007, Flanagan and Jones 2019).
In the intervening time, short nucleotide polymorphisms (SNPs) have emerged as the ‘next
generation’ marker of choice for population genetic research, and have already been shown to
overcome many limitations of microsatellites (Vignal et al. 2008, Morin et al. 2009). SNPs are
generally more informative and sensitive than microsatellites (Liu et al. 2005). For example,
Strickland et al. (2014) found no evidence for kin-based sociality in eastern water dragons
(Intellagama lesueurii) using a suite of 17 microsatellite markers, but did find evidence in the same
species using SNP data in a follow up study (Piza-Roca et al. 2019). SNPs can be scored semi-
automatically (Guichoux et al. 2011), and are therefore less prone to errors (Coates et al. 2009). They
can also cross-amplify between species within a genus more efficiently than microsatellites, making
them inherently more versatile and cost-effective (Thrasher et al. 2018). The development of SNPs for
further genetic research in the Smaug genus would allow for studies similar to my thesis without
excessive additional costs per species, and make comparative studies between species more feasible.
The use of SNPs also has important implications for trade issues, since a suite of SNPs developed for
use with a species of concern may be suitable for use within its congeners, which would be highly
advantageous for genera such as Bitis and Bradypodion that are highly targeted in the illegal reptile
trade.
POPULATION GENETICS AND SOCIALITY IN THE SUNGAZER
114
Understanding and mitigating the effects of habitat loss and fragmentation on gene flow in
S. giganteus
The high levels of habitat loss and fragmentation caused by human-mediated land transformation
within the distribution of S. giganteus (Parusnath et al. 2017) do not appear to have yet had a
perceivable effect on gene flow in the species. Although the distances travelled by dispersing
individuals is unknown, the increased distances between colonies due to land transformation,
introduction of barriers to dispersal such as crop fields and roads, and increased risk of increased edge
effects are all likely to decrease the success of dispersing Sungazers in reaching other colonies. As
detailed in the discussion of Chapter 3, effects of reduced dispersal on gene flow and therefore genetic
structure and diversity may only be detected in future decades due to the slow reproductive rate and
long generation length of S. giganteus. Given that I did not explicitly investigate the effects of habitat
fragmentation on gene flow in S. giganteus in my thesis, it is also possible that more focused studies
may detect signals that this study did not. The following suggestions are made to detect the putative
effects of fragmentation on gene flow in S. giganteus, and mitigate the potential current and future
negative effects of habitat fragmentation and loss in the species:
1) Conduct comprehensive statistics based analyses on the effects of fragmentation on gene flow
in S. giganteus. The ecological niche model conducted in Chapter 3 utilised environmental variables
that I considered to be important in predicting the distribution of S. giganteus, based on what is
presently known about the species’ life history. Key among these is the most recent national
landcover use map (DEA 2015) that details the use of land across the distribution of the species at a
fine resolution. However, in order to more rigorously investigate how specific anthropogenic
disturbances influence gene flow in S. giganteus, detailed GIS data for human population density,
road density, and crop density across the distribution of the species should be incorporated into an
ecological niche model. At the time of this study, such GIS layers were not available. If these data
become available in future, more detailed investigations on the effects of human landcover use on
gene flow in S. giganteus will be possible. Furthermore, statistical analyses that take both genetic
diversity and habitat fragmentation/anthropogenic land use into account may reveal more
comprehensive insights into how human activities affect gene flow in the species.
2) Test gene flow in heavily-fragmented vs unfragmented areas. To definitively investigate the
contemporary effects of habitat fragmentation on the genetic structure of S. giganteus, gene flow
between colonies that exist within heavily fragmented areas of the distribution such as Welkom,
Lindley, and Petrus Steyn, and colonies that exist within relatively undisturbed areas such as
Harrismith and Warden (Parusnath 2014) should be compared. These colonies all fall within the
Western 2 genetic population identified in Chapter 3. No geological barriers were detected within this
POPULATION GENETICS AND SOCIALITY IN THE SUNGAZER
115
population, and significantly reduced levels of gene flow between could therefore be assigned to the
effects of reduced gene flow from habitat fragmentation. Comparisons of genetic diversity and levels
of inbreeding between these colonies could also provide insight into the negative genetic effects of
reduced gene flow and population isolation. In Chapter 4 I found that most candidate mate pairs were
extended family members on average. Since there have been no previous measures into the
relatedness of mate pairs in the species, it is unknown whether this level of inbreeding is innate within
colonies, or a result of reduced dispersal. Future studies could also therefore investigate whether mate
pairs in less fragmented areas have lower levels of relatedness than those in more heavily fragmented
areas.
3) Grassland rehabilitation. Sungazers have only been recorded colonising primary grassland
(Jacobsen 1989, Newbery and Jacobsen 1994), despite earlier suggestions by Marais (1984) that they
may recolonise fallow lands. The inability of Sungazers to recolonise rehabilitated lands may be due
to altered soil properties that may prevent the excavation of structurally stable burrows, and reduce
water drainage of burrows during high rainfall periods. The altered assemblage of vegetation types
and associated changes in the diversity and abundance of invertebrate prey species (Jacobsen et al.
1990) may also reduce Sungazer survival rates in fallow land. Based on anecdotal reports from
several farmers, Red Grass (Themeda triandra), the dominant grass species in primary Highveld
grassland, takes between 60-100 years to recolonise fallowed land. The return of the natural
assemblage of invertebrate prey species may follow, although the time period over which that may
happen is currently unknown. Rehabilitation projects on fallow lands on which no further agricultural
use is foreseen are encouraged in order to investigate the processes and periods of time that are
required to rehabilitate fallowed lands such that they may once again be suitable for Sungazers.
Successful rehabilitation could result in the reestablishment of Sungazer colonies, reduce the distance
between colonies and improve gene flow between populations.
4) Creation of and maintenance of dispersal corridors. In addition to securing protected land for S.
giganteus, the creation and maintenance of corridors for dispersal between Sungazer colonies may be
essential in maintaining genetic diversity in the species. Dispersal corridors have been proved to be
highly successful in maintaining genetic exchange between animal populations in transformed areas
(Mech and Hallett 2001, Jellinek et al. 2004, Christie and Knowles 2015, Kay et al. 2016). The
distribution-wide custodianship programme that is currently being operated by the Endangered
Wildlife Trust presents an opportunity to build in the concept of dispersal corridors into an already
existing plan. The targeted recruitment of sites that connect disparate populations may ensure that
further land transformation does not occur within these areas, hopefully increasing the chances of
Sungazers in reaching neighbouring colonies.
POPULATION GENETICS AND SOCIALITY IN THE SUNGAZER
116
Incorporating knowledge on sociality into translocations and captive breeding protocols.
Sungazer populations have long suffered from failures to captive breed sufficient numbers to supply
the demands of the international pet trade (Loehr et al. 2017; Parusnath et al. 2017), and failures of
large-scale translocation efforts in the face of land development (Groenewald 1992). In both
scenarios, little attention is paid to the consideration of how the complex social behaviour that the
species exhibits may impact the success of these endeavours.
Animal behaviour is increasingly being considered in such approaches, as the understanding of the
impacts of social behaviour on individual and group health, longevity, and reproductivity progresses
(Anthony and Blumstein 2000). Consideration of the social structure within a population, social roles,
and social learning may lead to populations that are more likely to persist after translocations
(Goldenberg et al. 2019). In social species such as the black-tailed prairie dog (Cynomys
ludovicianus), individuals translocated with their family members experienced significantly higher
survival rates than individuals translocated without family members (Shier 2006). Detailed surveys of
Sungazer burrow occupants, occupants of neighbouring burrows, distance between burrows, and
colony size should be conducted in order to closely emulate the social structure in the original
location, prior to translocation attempts. Given that Sungazer colonies comprise primarily of
immediate and extended family members (Chapter 4), care should also be taken to avoid mixing of
Sungazers from different colonies. Aside from the potentially negative genetic effects that this may
have, it is possible that colonies are formed around extended family groups, and the introduction of a
high number of unrelated animals may lead to lower survival rates. As future studies continue to
unravel the complex sociality in this species, more knowledge can be injected into an evolving,
educated translocation protocol that will hopefully result in higher success rates of established and
thriving Sungazer colonies.
In the same vein, allowing for the creation and maintenance of social structure in captive Sungazer
groups may be a key component to successfully breeding Sungazers in captivity. Most Sungazers in
captive breeding projects, whether in private collections or zoological facilities, are not kept at
population densities that emulate what they might experience in their natural environment, nor are
they generally kept on substrates that are conducive to the construction of burrows. Access to a
secure, defendable territory appears to be an important tenet of Sungazer behaviour and social
structure, and may be key in stimulating reproductivity. In the only two verified captive breeding
successes, the Sungazers were kept in outdoor enclosures that allowed for burrow digging and
territory defence (Langerwerf 2001, Chris de Beer pers. comm.). In each case, it took several years for
the ‘colony’ to become established, before breeding commenced. I therefore suggest that to improve
the chances of captive breeding success, Sungazer captive breeding projects adhere as closely as
POPULATION GENETICS AND SOCIALITY IN THE SUNGAZER
117
possible to conditions that allow for a natural social structure form. For instance, an enclosure that
contains a substrate in which long-term burrows can be constructed at a distance of at least two metres
apart should be provided. This may provide a sense of security that Sungazers in typical, crowded
terrariums may not experience. Importantly, any captive breeding endeavours should also cater to the
natural dietary and climactic requirements of the species, since it is likely that the specific niche that
the species occupies in its natural home contains several triggers that stimulate breeding. Attention to
social structure is therefore only one of many important factors to consider in such projects. It is my
hope that with the information obtained through rigorous scientific research, the species may be more
successfully bred in captivity. Ultimately, this may limit, and perhaps stop, the pilfering of wild
specimens to supply the pet trade.
5.3. Final conclusion
This thesis provides novel insight into the population genetic structure of the grassland specialist
lizard species Smaug giganteus. I provide evidence for kin-based sociality in S. giganteus – the first
for an African lizard. These findings highlight the value of investigating the presence of kin-based
social systems in other species with similar life-history traits. This study represents the most
comprehensive population genetic study of a cordylid species to my knowledge, and considers genetic
relatedness from the scale of individuals in a burrow, to deeply divergent clades within the species.
The polymorphic species-specific microsatellite markers developed in this thesis enables the
possibility of numerous in-depth future studies on sociality and population structure in S. giganteus.
These markers have also played an important role in regulating trade in the species in South Africa,
and could be used in isolating the origin of confiscated Sungazers or their body parts, so that poaching
hotspots can be identified. The findings of my study have implications for the long-term conservation
management of the species.
The Sungazer is an iconic and enigmatic species, and is well-known globally for its unique and
striking appearance. Although the species has garnered significant attention from scientists over the
last century, limited research has focused on some of its most unique characteristics. The South
African perspective on sociality in reptiles severely lags behind research on the Australian system,
and the Sungazer is an ideal model species in which research on long-term population dynamics,
family structure, parental care, and chemical signalling can be caught up. It is my hope that this thesis
not only adds to the body of work on the Sungazer, but also serves as a springboard for future
research into this species, and its many unique and fascinating adaptations to life in the South African
grassland.
POPULATION GENETICS AND SOCIALITY IN THE SUNGAZER
118
REFERENCES
AGIS (Agricultural Geo-Referenced Information System). 2007. www.agis.agric.za. [Accessed 24
March 2019]
Alexander, G. J. 2018. Reproductive biology and maternal care of neonates in southern African
python (Python natalensis). Journal of Zoology 305:141–148.
Alexander, G. J., K. A. Tolley, M. F. Bates, and P. L. F. N. Mouton. 2018. Smaug giganteus.
https://dx.doi.org/10.2305/IUCN.UK.2018-2.RLTS.T5336A115650269.en. [Accessed 16
January 2020]
Allendorf, F. W. 1986. Genetic drift and the loss of alleles versus heterozygosity. Zoo Biology 5:181–
190.
Allendorf, F. W., G. Luikart, and S. N. Aitken. 2007. Conservation and the genetics of populations.
Mammalia 2007:189–197.
Amrine-Madsen, H., M. Scally, M. Westerman, M. J. Stanhope, C. Krajewski, and M. S. Springer.
2003. Nuclear gene sequences provide evidence for the monophyly of australidelphian
marsupials. Molecular Phylogenetics and Evolution 28:186–196.
Andrews, K., W. Gibbons, and D. Jochimsen. 2008. Ecological effects of roads on amphibians and
reptiles: a literature review. Herpetological Conservation 3:121–143.
Andrews, K. M., and J. W. Gibbons. 2005. How do highways influence snake movement? Behavioral
responses to roads and vehicles. Copeia 2005:772–782.
Andrews, K. M., and D. M. Jochimsen. 2007. Ecological effects of roads infrastructure on
herpetofauna: understanding biology and increasing communication. Pages 567–582 in C. L.
Irwin, D. Nelson, and K. P. McDermott, editors. International Conference on ecology and
transportation. Raleigh, NC: Center for Transport and the Environment, North Carolina State
University.
Andrews, K. R., M. De Barba, M. A. Russello, and L. P. Waits. 2018. Advances in using non-
invasive, archival, and environmental samples for population genomic studies. In P. Hohenlohe
and O. Rajora (Eds.), Population Genomics: Wildlife (pp. 1–37). Cham: Springer.
Angilletta, Jr., M. J., and A. E. Dunham. 2003. The temperature‐size rule in ectotherms: simple
evolutionary explanations may not be general. The American Naturalist 162:332–342.
Angilletta, Jr., M. J., P. H. Niewiarowski, A. E. Dunham, A. D. Leaché, and W. P. Porter. 2004.
Bergmann’s clines in ectotherms: illustrating a life‐history perspective with sceloporine lizards.
The American Naturalist 164:168–183.
Anthony, L. L., and D. T. Blumstein. 2000. Integrating behaviour into wildlife conservation: the
multiple ways that behaviour can reduce Ne. Biological Conservation 95:303–315.
POPULATION GENETICS AND SOCIALITY IN THE SUNGAZER
119
Antognazza, C. M., J. R. Britton, C. Potter, E. Franklin, E. A. Hardouin, C. Gutmann Roberts, M.
Aprahamian, and D. Andreou. 2019. Environmental DNA as a non-invasive sampling tool to
detect the spawning distribution of European anadromous shads (Alosa spp.). Aquatic
Conservation: Marine and Freshwater Ecosystems 29:148–152.
Araújo, M. B., W. Thuiller, and R. G. Pearson. 2006. Climate warming and the decline of amphibians
and reptiles in Europe. Journal of Biogeography 33:1712–1728.
Arbogast, B. S., and G. J. Kenagy. 2001. Comparative phylogeography as an integrative approach to
historical biogeography. Journal of Biogeography 28:819–825.
Arbour, V. M., and L. E. Zanno. 2018. The evolution of tail weaponization in amniotes. Proceedings
of the Royal Society B: Biological Sciences 285:20172299.
Arikan, H., and K. Çiçek. 2014. Haematology of amphibians and reptiles: A review. North-Western
Journal of Zoology 10:190–209.
Armstrong, A. J. 2011. Status of the Sungazer Smaug giganteus in KwaZulu-Natal province, South
Africa. African Herp News:1–4.
Arnold, S. J., and C. R. Peterson. 1989. A test for temperature effects on the ontogeny of shape in the
garter snake Thamnophis sirtalis. Physiological Zoology 62:1316–1333.
Ashton, K. G., and C. R. Feldman. 2003. Bergmann’s rule in nonavian reptiles: Turtles follow it,
lizards and snakes reverse it. Evolution 57:1151–1163.
Auliya, M. 2003. Hot trade in cool creatures - a review of the live reptile trade in the European Union
in the 1990s with a focus on Germany. TRAFFIC Europe. Brussels.
Auliya, M., S. Altherr, D. Ariano-Sanchez, E. H. Baard, C. Brown, R. M. Brown, J. C. Cantu, G.
Gentile, P. Gildenhuys, E. Henningheim, J. Hintzmann, K. Kanari, M. Krvavac, M. Lettink, J.
Lippert, L. Luiselli, G. Nilson, T. Q. Nguyen, V. Nijman, J. F. Parham, S. A. Pasachnik, M.
Pedrono, A. Rauhaus, D. R. Córdova, M. E. Sanchez, U. Schepp, M. van Schingen, N.
Schneeweiss, G. H. Segniagbeto, R. Somaweera, E. Y. Sy, O. Türkozan, S. Vinke, T. Vinke, R.
Vyas, S. Williamson, and T. Ziegler. 2016. Trade in live reptiles, its impact on wild populations,
and the role of the European market. Biological Conservation 204:103–119.
Averill-Murray, R. C., and B. E. Hagerty. 2014. Translocation relative to spatial genetic structure of
the mojave desert tortoise, Gopherus agassizii. Chelonian Conservation and Biology 13:35–41.
Avila, L. J., M. Olave, C. H. F. Perez, D. R. Perez, and M. Morando. 2013. Molecular phylogenetic
relationships of the Liolaemus rothi complex and a new species of lizard from Auca Mahuida
Volcano (Squamata: Liolaemini). Zootaxa 3608:221–238.
Avise, J. C. 1987. Intraspecific phylogeography: the mitochondrial DNA bridge between population
genetics and systematics. Annual review of ecology and systematics 18:489–522.
Avise, J. C. 2000. Phylogeography: the history and formation of species. First edition. Harvard
University Press, Cambridge, Massachusetts.
POPULATION GENETICS AND SOCIALITY IN THE SUNGAZER
120
Avise, J. C. 2009. Phylogeography: Retrospect and prospect. Journal of Biogeography 36:3–15.
Baillie, J. E. M., and B. Groombridge. 1996. 1996 IUCN Red List of Threatened Animals. IUCN,
Cambridge, United Kingdom.
Barbará, T., C. Palma-Silva, G. M. Paggi, F. Bered, M. F. Fay, and C. Lexer. 2007. Cross-species
transfer of nuclear microsatellite markers: Potential and limitations. Molecular Ecology 16:3759–
3767.
Barendse, J., D. Roux, B. Currie, N. Wilson, and C. Fabricius. 2016. A broader view of stewardship to
achieve conservation and sustainability goals in South Africa. South African Journal of Science
112:1–15.
Bateman, G. C. 1897. The Vivarium, being a practical guide to the construction, arrangement, and
management of Vivaria, containing full information as to all reptiles suitable as pets, how and
where to obtain them, and how to keep them in health. London Typing Company, London.
Bates, M. F., K. A. Tolley, S. Edwards, Z. Davids, J. M. Da Silva, and W. R. Branch. 2013. A
molecular phylogeny of the African plated lizards, genus Gerrhosaurus wiegmann, 1828
(squamata: Gerrhosauridae), with the description of two new genera. Zootaxa 3750:465–493.
Beaumont, M. A. 1999. Detecting population expansion and decline using microsatellites. Genetics
153:2013–2029.
Beebee, T. J. C. 2008. Buccal swabbing as a source of DNA from squamate reptiles. Conservation
Genetics 9:1087–1088.
Beger, M., K. A. Selkoe, E. Treml, P. H. Barber, S. Von Der Heyden, E. D. Crandall, R. J. Toonen,
and C. Riginos. 2014. Evolving coral reef conservation with genetic information. Bulletin of
Marine Science 90:159–185.
Beja-Pereira, A., R. Oliveira, P. C. Alves, M. K. Schwartz, and G. Luikart. 2009. Advancing
ecological understandings through technological transformations in non-invasive genetics.
Molecular Ecology Resources 9:1279–1301.
Beninde, J., S. Feldmeier, M. Werner, D. Peroverde, U. Schulte, A. Hochkirch, and M. Veith. 2016.
Cityscape genetics: structural vs. functional connectivity of an urban lizard population.
Molecular ecology 25:4984–5000.
Benirschke, K. 2006. Conservation and Genetics of Populations. Journal of Heredity 97:612-613.
Bermingham, E., and C. Moritz. 1998. Comparative phylogeography: concepts and applications.
Molecular Ecology 7:367–369.
Bertorelle, G., M. W. Bruford, H. C. Hauffe, A. Rizzoli, and C. Vernesi. 2015. Population genetics for
animal conservation. Cambridge University Press. Cambridge, UK.
Betts, M. G., L. Fahrig, A. S. Hadley, K. E. Halstead, J. Bowman, W. D. Robinson, J. A. Wiens, and
D. B. Lindenmayer. 2014. A species-centered approach for uncovering generalities in organism
responses to habitat loss and fragmentation. Ecography 37:517–527.
POPULATION GENETICS AND SOCIALITY IN THE SUNGAZER
121
Bhagavatula, J., and L. Singh. 2006. Genotyping faecal samples of Bengal tiger Panthera tigris tigris
for population estimation: a pilot study. BMC genetics 7:48.
Bickford, D., S. D. Howard, D. J. J. Ng, and J. A. Sheridan. 2010. Impacts of climate change on the
amphibians and reptiles of Southeast Asia. Biodiversity and Conservation 19:1043–1062.
Black, I. R. G., J. M. Berman, V. Cadena, and G. J. Tattersall. 2019. Behavioral thermoregulation in
lizards: strategies for achieving preferred temperature. Pages 13–46 in V. L. Bels and A. P.
Russell, editors. Behavior of Lizards: Evolutionary and Mechanistic Perspectives. First edition.
Boca Raton, Florida.
Blair, C., V. H. Jiménez Arcos, F. R. Mendez de la Cruz, and R. W. Murphy. 2013. Landscape
genetics of leaf-toed geckos in the tropical dry forest of northern Mexico. PLoS ONE 8:e57433.
Blair, C., D. E. Weigel, M. Balazik, A. T. H. Keeley, F. M. Walker, E. Landguth, S. Cushman, M.
Murphy, L. Waits, and N. Balkenhol. 2012. A simulation-based evaluation of methods for
inferring linear barriers to gene flow. Molecular Ecology Resources 12:822–833.
Bloch, N., and D. J. Irschick. 2005. Toe-clipping dramatically reduces clinging performance in a pad-
bearing lizard (Anolis carolinensis). Journal of Herpetology 39:288–293.
Blouin, M. S., M. Parsons, V. Lacaille, and S. Lotz. 1996. Use of microsatellite loci to classify
individuals by relatedness. Molecular Ecology 5:393–401.
Bogert, C. M. 1949. Thermoregulation in reptiles, a factor in evolution. Evolution 3:195.
Böhm, M., B. Collen, J. E. M. Baillie, P. Bowles, J. Chanson, N. Cox, G. Hammerson, M. Hoffmann,
S. R. Livingstone, M. Ram, A. G. J. Rhodin, S. N. Stuart, P. P. van Dijk, B. E. Young, L. E.
Afuang, A. Aghasyan, A. García, C. Aguilar, R. Ajtic, F. Akarsu, L. R. V. Alencar, A. Allison,
N. Ananjeva, S. Anderson, C. Andrén, D. Ariano-Sánchez, J. C. Arredondo, M. Auliya, C. C.
Austin, A. Avci, P. J. Baker, A. F. Barreto-Lima, C. L. Barrio-Amorós, D. Basu, M. F. Bates, A.
Batistella, A. Bauer, D. Bennett, W. Böhme, D. Broadley, R. Brown, J. Burgess, A. Captain, S.
Carreira, M. del R. Castañeda, F. Castro, A. Catenazzi, J. R. Cedeño-Vázquez, D. G. Chapple,
M. Cheylan, D. F. Cisneros-Heredia, D. Cogalniceanu, H. Cogger, C. Corti, G. C. Costa, P. J.
Couper, T. Courtney, J. Crnobrnja-Isailovic, P. A. Crochet, B. Crother, F. Cruz, J. C. Daltry, R. J.
R. Daniels, I. Das, A. de Silva, A. C. Diesmos, L. Dirksen, T. M. Doan, C. K. Dodd, J. S. Doody,
M. E. Dorcas, J. Duarte de Barros Filho, V. T. Egan, E. H. El Mouden, D. Embert, R. E.
Espinoza, A. Fallabrino, X. Feng, Z. J. Feng, L. Fitzgerald, O. Flores-Villela, F. G. R. França, D.
Frost, H. Gadsden, T. Gamble, S. R. Ganesh, M. A. Garcia, J. E. García-Pérez, J. Gatus, M.
Gaulke, P. Geniez, A. Georges, J. Gerlach, S. Goldberg, J. C. T. Gonzalez, D. J. Gower, T.
Grant, E. Greenbaum, C. Grieco, P. Guo, A. M. Hamilton, K. Hare, S. B. Hedges, N. Heideman,
C. Hilton-Taylor, R. Hitchmough, B. Hollingsworth, M. Hutchinson, I. Ineich, J. Iverson, F. M.
Jaksic, R. Jenkins, U. Joger, R. Jose, Y. Kaska, U. Kaya, J. S. Keogh, G. Köhler, G. Kuchling, Y.
Kumlutaş, A. Kwet, E. La Marca, W. Lamar, A. Lane, B. Lardner, C. Latta, G. Latta, M. Lau, P.
POPULATION GENETICS AND SOCIALITY IN THE SUNGAZER
122
Lavin, D. Lawson, M. LeBreton, E. Lehr, D. Limpus, N. Lipczynski, A. S. Lobo, M. A. López-
Luna, L. Luiselli, V. Lukoschek, M. Lundberg, P. Lymberakis, R. Macey, W. E. Magnusson, D.
L. Mahler, A. Malhotra, J. Mariaux, B. Maritz, O. A. V. Marques, R. Márquez, M. Martins, G.
Masterson, J. A. Mateo, R. Mathew, N. Mathews, G. Mayer, J. R. McCranie, G. J. Measey, F.
Mendoza-Quijano, M. Menegon, S. Métrailler, D. A. Milton, C. Montgomery, S. A. A. Morato,
T. Mott, A. Muñoz-Alonso, J. Murphy, T. Q. Nguyen, G. Nilson, C. Nogueira, H. Núñez, N.
Orlov, H. Ota, J. Ottenwalder, T. Papenfuss, S. Pasachnik, P. Passos, O. S. G. Pauwels, N. Pérez-
Buitrago, V. Pérez-Mellado, E. R. Pianka, J. Pleguezuelos, C. Pollock, P. Ponce-Campos, R.
Powell, F. Pupin, G. E. Quintero Díaz, R. Radder, J. Ramer, A. R. Rasmussen, C. Raxworthy, R.
Reynolds, N. Richman, E. L. Rico, E. Riservato, G. Rivas, P. L. B. da Rocha, M. O. Rödel, L.
Rodríguez Schettino, W. M. Roosenburg, J. P. Ross, R. Sadek, K. Sanders, G. Santos-Barrera, H.
H. Schleich, B. R. Schmidt, A. Schmitz, M. Sharifi, G. Shea, H. T. Shi, R. Shine, R. Sindaco, T.
Slimani, R. Somaweera, S. Spawls, P. Stafford, R. Stuebing, S. Sweet, E. Sy, H. J. Temple, M. F.
Tognelli, K. Tolley, P. J. Tolson, B. Tuniyev, S. Tuniyev, N. üzüm, G. van Buurt, M. Van Sluys,
A. Velasco, M. Vences, M. Veselý, S. Vinke, T. Vinke, G. Vogel, M. Vogrin, R. C. Vogt, O. R.
Wearn, Y. L. Werner, M. J. Whiting, T. Wiewandt, J. Wilkinson, B. Wilson, S. Wren, T. Zamin,
K. Zhou, and G. Zug. 2013. The conservation status of the world’s reptiles. Biological
Conservation 157:372–385.
Bohonak, A. J. 1999. Dispersal, gene flow and population structure. The Quarterly Review of Biology
74:21–45.
Bolstad, W. M. 2004. Introduction to Bayesian Statistics. Second edition. John Wiley & Sons, Inc,
New Jersey, USA.
Bonnet, X., R. Shine, and O. Lourdais. 2002. Taxonomic chauvinism. Trends in Ecology & Evolution
17:2000–2002.
Borges-Landáez, P.A., and R. Shine. 2003. Influence of toe-clipping on running speed in Eulamprus
quoyii, an Australian scincid lizard. Journal of Herpetology 37:592–595.
Bourquin, O. 1993. Important species docket: lizards. Internal Report, Natal Parks Board,
Pietermaritzburg.
Bourquin, O. 2004. Reptiles (Reptilia) in KwaZulu-Natal: I – diversity and distribution. Durban
Museum Novitates 29:57–103.
Bowler, D. E., and T. G. Benton. 2005. Causes and consequences of animal dispersal strategies:
Relating individual behaviour to spatial dynamics. Biological Reviews of the Cambridge
Philosophical Society 80:205–225.
Boyle, M., L. Schwanz, J. Hone, and A. Georges. 2016. Dispersal and climate warming determine
range shift in model reptile populations. Ecological Modelling 328:34–43.
POPULATION GENETICS AND SOCIALITY IN THE SUNGAZER
123
Bradler, S., N. Cliquennois, and T. R. Buckley. 2015. Single origin of the Mascarene stick insects:
Ancient radiation on sunken islands? BMC Evolutionary Biology 15:1–10.
Branch, L. C., A. M. Clark, P. E. Moler, and B. W. Bowen. 2003. Fragmented landscapes, habitat
specificity, and conservation genetics of three lizards in Florida scrub. Conservation Genetics
4:199–212.
Branch, W. R. 1988. Field guide to the snakes and other reptiles of southern Africa. Struik Publishers,
Cape Town, South Africa.
Branch, W. R. 1990. The revised South African red data book - reptiles and amphibians. Journal of
the Herpetological Association of Africa 38:32–41.
Branch, W. R. 2001. A photographic Guide to Snakes and other reptiles of Southern Africa. Second
edition. Struik Publishers, Cape Town, South Africa.
Branch, W. R., and R. W. Patterson. 1975. Notes on the ecology of the Giant Girdled Lizard,
Cordylus giganteus. Journal of Herpetology 9:364–366.
Braunisch, V., G. Segelbacher, and A. H. Hirzel. 2010. Modelling functional landscape connectivity
from genetic population structure: A new spatially explicit approach. Molecular Ecology
19:3664–3678.
Brekke, T. D., L. Shier, M. J. Hegarty, and J. F. Mulley. 2019. Shed skin as a source of DNA for
genotyping-by-sequencing (GBS) in reptiles. bioRxiv:658989.
Bricker, J., L. M. Bushar, H. K. Reinert, and L. Gelbert. 1996. Purification of high quality DNA from
shed skins. Herpetological Review 27:133.
Brinkman, T. J., M. K. Schwartz, D. K. Person, K. L. Pilgrim, and K. J. Hundertmark. 2010. Effects
of time and rainfall on PCR success using DNA extracted from deer fecal pellets. Conservation
Genetics 11:1547–1552.
Brito, E. S. 2017. Group living, parental care, age structure, and genetic relatedness in Liolaemus
leopardinus, a high-elevation lizard from the Andes of Chile. Doctoral Dissertation, Oklahoma
State University.
Broadley, D. G. 1978. A Revision of the genus Platysaurus A. Smith (Sauria: Cordylidae). National
Museums and Monuments of Rhodesia 6.
Broeckhoven, C., Y. El Adak, C. Hui, R. Van Damme, and T. Stankowich. 2018. On dangerous
ground: the evolution of body armour in cordyline lizards. Proceedings of the Royal Society B:
Biological Sciences 285:20180513.
Broeckhoven, C., G. Diedericks, and P. le F. N. Mouton. 2015. What doesn’t kill you might make you
stronger: Functional basis for variation in body armour. Journal of Animal Ecology 84:1213–
1221.
POPULATION GENETICS AND SOCIALITY IN THE SUNGAZER
124
Brooker, M. G., I. Rowley, M. Adams, and P. R. Baverstock. 1990. Promiscuity: An Inbreeding
Avoidance Mechanism in a Socially Monogamous Species ? Behavioral Ecology and
Sociobiology 26:191–199.
Brown, J., and B. Mitchell. 2000. The Stewardship Approach and its Relevance for Protected
Landscapes. The George Wright Forum 17.
Brown, W. M., M. George, and A. C. Wilson. 1979. Rapid evolution of animal mitochondrial DNA.
Proceedings of the National Academy of Sciences of the United States of America 76:1967–
1971.
Bryson, R. W., U. O. García-Vázquez, and B. R. Riddle. 2012. Relative roles of Neogene vicariance
and Quaternary climate change on the historical diversification of bunchgrass lizards (Sceloporus
scalaris group) in Mexico. Molecular Phylogenetics and Evolution 62:447–457.
Bull, C. M. 1988. Mate fidelity in an Australian lizard Trachydosaurus rugosus. Behavioral Ecology
and Sociobiology 23:45–49.
Bull, C. M. 2000. Monogamy in lizards. Behavioural Processes 51:7–20.
Bull, C. M., and S. J. B. Cooper. 1999. Relatedness and avoidance of inbreeding in the lizard, Tiliqua
rugosa. Behavioral Ecology and Sociobiology 46:367–372.
Bull, C. M., S. J. B. Cooper, and B. C. Baghurst. 1998. Social monogamy and extra-pair fertilization
in an Australian lizard, Tiliqua rugosa. Behavioral Ecology and Sociobiology 44:63–72.
Bull, C. M., and M. J. Freake. 1999. Home-range fidelity in the Australian sleepy lizard, Tiliqua
rugosa. Australian Journal of Zoology 47:125–132.
Bull, C. M., C. L. Griffin, E. J. Lanham, and G. R. Johnston. 2000. Recognition of pheromones from
group members in a gregarious Lizard, Egernia stokesii. Society for the Study of Amphibians
and Reptiles 34:92–99.
Bull, M. C., C. L. Griffin, M. Bonnett, M. G. Gardner, and S. J. Cooper. 2001. Discrimination
between related and unrelated individuals in the Australian lizard Egernia striolata. Behavioral
Ecology and Sociobiology 50:173–179.
Burbrink, F. T., and T. A. Castoe. 2009. Molecular Phylogeography of Snakes. Pages 38–77 in
Stephen J. Mullin and Richard A. Seigel, editors. Snakes: Ecology and Conservation. Cornell
University Press, Ithaca, New York.
Burbrink, F. T., C. A. Phillips, and E. J. Heske. 1998. A riparian zone in southern Illinois as a
potential dispersal corridor for reptiles and amphibians. Biological Conservation 86:107–115.
Burkey, T. V. 1989. Extinction in nature reserves: the effect of fragmentation and the importance of
migration between reserve fragments. Oikos 1989:75–81.
Cadotte, M. W., and T. Jonathan Davies. 2010. Rarest of the rare: Advances in combining
evolutionary distinctiveness and scarcity to inform conservation at biogeographical scales.
Diversity and Distributions 16:376–385.
POPULATION GENETICS AND SOCIALITY IN THE SUNGAZER
125
Carlson, E., A. J. MacDonald, A. Adamack, T. McGrath, L. I. Doucette, W. S. Osborne, B. Gruber,
and S. D. Sarre. 2016. How many conservation units are there for the endangered grassland
earless dragons? Conservation Genetics 17:761–774.
Casper, G. S. 2012. Surveys for the Northern Ring-necked Snake (Diadophis punctatus edwardsii) in
Northeastern Minnesota: Final Report. St. Paul, MN.
Van De Casteele, T., P. Galbusera, and E. Matthysen. 2001. A comparison of microsatellite-based
pairwise relatedness estimators. Molecular Ecology 10:1539–1549.
Ceballos, G., A. Davidson, R. List, J. Pacheco, P. Manzano-Fischer, G. Santos-Barrera, and J.
Cruzado. 2010. Rapid decline of a grassland system and its ecological and conservation
implications. PLoS ONE 5:e8562.
Chakraborty, R., and M. Nei. 1977. Bottleneck effects on average heterozygosity and genetic distance
with the stepwise mutation model. Evolution 31:347–356.
Chan, L. M., J. L. Brown, and A. D. Yoder. 2011. Integrating statistical genetic and geospatial
methods brings new power to phylogeography. Molecular Phylogenetics and Evolution 59:523–
537.
Chapple, D. G. 2003. Ecology, life-history, and behavior in the Australian scincid genus Egernia,
with comments on the evolution of complex sociality in lizards. Herpetological Monographs
17:145–180.
Chapple, D. G., and J. S. Keogh. 2005. Complex mating system and dispersal patterns in a social
lizard, Egernia whitii. Molecular Ecology 14:1215–1227.
Charlesworth, B., and D. Charlesworth. 2017. Population genetics from 1966 to 2016. Heredity
118:2–9.
Charlesworth, D., and J. H. Willis. 2009. The genetics of inbreeding depression. Nature Reviews
Genetics 10:783–796.
Charruau, P., C. Fernandes, P. Orozco-Terwengel, J. Peters, L. Hunter, H. Ziaie, A. Jourabchian, H.
Jowkar, G. Schaller, S. Ostrowski, P. Vercammen, T. Grange, C. Schlötterer, A. Kotze, E. M.
Geigl, C. Walzer, and P. A. Burger. 2011. Phylogeography, genetic structure and population
divergence time of cheetahs in Africa and Asia: Evidence for long-term geographic isolates.
Molecular Ecology 20:706–724.
Chiucchi, J. E., and H. L. Gibbs. 2010. Similarity of contemporary and historical gene flow among
highly fragmented populations of an endangered rattlesnake. Molecular Ecology 19:5345–5358.
Christie, M. R., and L. L. Knowles. 2015. Habitat corridors facilitate genetic resilience irrespective of
species dispersal abilities or population sizes. Evolutionary Applications 8:454–463.
Chybicki, I. J. 2017. INEST 2.2 The user manual.
Chybicki, I. J., and J. Burczyk. 2009. Simultaneous estimation of null alleles and inbreeding
coefficients. Journal of Heredity 100:106–113.
POPULATION GENETICS AND SOCIALITY IN THE SUNGAZER
126
CITES (Convention on International Trade in Endangered Species of Wild Fauna and Flora). 2020.
CITES Trade Database. https://trade.cites.org/. [Accessed 16 January 2020]
Clark, A. 1998. Reptile sheds yield high quality DNA. Herpetological Review 29:17.
Clark, R. W., W. S. Brown, R. Stechert, and K. R. Zamudio. 2008. Integrating individual behaviour
and landscape genetics: The population structure of timber rattlesnake hibernacula. Molecular
Ecology 17:719–730.
Clark, R. W., W. S. Brown, R. Stechert, and K. R. Zamudio. 2010. Roads, interrupted dispersal, and
genetic diversity in timber rattlesnakes. Conservation Biology 24:1059–1069.
Clark, R. W., M. N. Marchand, B. J. Clifford, R. Stechert, and S. Stephens. 2011. Decline of an
isolated timber rattlesnake (Crotalus horridus) population: Interactions between climate change,
disease, and loss of genetic diversity. Biological Conservation 144:886–891.
Clostio, R. W. 2010. Use of environmental variables to infer gene flow and population structure in the
gopher tortoise (Gopherus polyphemus) and predict the seroprevalence of an emerging infectious
disease. Doctoral thesis. University of New Orleans.
Coates, B. S., D. V. Sumerford, N. J. Miller, K. S. Kim, T. W. Sappington, B. D. Siegfried, and L. C.
Lewis. 2009. Comparative performance of single nucleotide polymorphism and microsatellite
markers for population genetic analysis. Journal of Heredity 100:556–564.
Colino-Rabanal, V. J., and M. Lizana. 2012. Herpetofauna and roads: a review. Basic and Applied
Herpetology 26:5–31.
Collinge, S. K. 2000. Effects of grassland fragmentation on insect species loss, colonization, and
movement patterns. Ecology 81:2211–2226.
Cooke, B., W. T. Langford, A. Gordon, and S. Bekessy. 2012. Social context and the role of
collaborative policy making for private land conservation. Journal of Environmental Planning
and Management 55:469–485.
Cooney, R., and N. C. Bennett. 2000. Inbreeding avoidance and reproductive skew in a cooperative
mammal. Proceedings of the Royal Society B: Biological Sciences 267:801–806.
Cooper, W. E., M. J. Whiting, and J. H. Van Wyk. 1997. Foraging modes of cordyliform lizards.
South African Journal of Zoology 32:9–13.
Cooper, W. E., J. H. Van Wyk, and P. L. F. N. Mouton. 1999. Discrimination between self-produced
pheromones and those produced by individuals of the same sex in the lizard Cordylus cordylus.
Journal of Chemical Ecology 25:197–208.
Costandius, E., P. L. F. N. Mouton, and A. F. Flemming. 2006. The effect of intergroup distance on
group fidelity in the group-living lizard, Cordylus cataphractus. African Journal of Herpetology
55:61–68.
Couvet, D. 2002. Deleterious effects of restricted gene flow in fragmented populations. Conservation
Biology 16:369–376.
POPULATION GENETICS AND SOCIALITY IN THE SUNGAZER
127
Cowles, R. B. 1945. Surface-mass ratio, paleoclimate and heat sterility. The American Naturalist
79:561–567.
Crandall, K. A., O. R. R. Bininda-Emonds, G. M. Mace, and R. K. Wayne. 2000. Considering
evolutionary processes in conservation biology. Trends in Ecology and Evolution 15:290–295.
Crispo, E., J. S. Moore, J. A. Lee-Yaw, S. M. Gray, and B. C. Haller. 2011. Broken barriers: Human-
induced changes to gene flow and introgression in animals: An examination of the ways in which
humans increase genetic exchange among populations and species and the consequences for
biodiversity. BioEssays 33:508–518.
Cunningham, A. B., and A. S. Zondi. 1991. Use of animal parts for the commercial trade in traditional
medicines. University of Natal, Institute of Natural Resources.
Cunningham, M. 1993. Reproductive biology of the prickly forest skink, Gnypetoscincus
queenslandiae, an endemic species from northern Queensland. Memoirs - Queensland Museum
34:131–138.
Cunningham, M., and C. Moritz. 1998. Genetic effects of forest fragmentation on a rainforest
restricted lizard (Scincidae: Gnypetoscincus queenslandiae). Biological Conservation 83:19–30.
Dakin, E. E., and J. C. Avise. 2004. Microsatellite null alleles in parentage analysis. Heredity 93:504–
509.
Damas-Moreira, I., D. Oliveira, J. L. Santos, J. L. Riley, D. J. Harris, and M. J. Whiting. 2018.
Learning from others: an invasive lizard uses social information from both conspecifics and
heterospecifics. Biology Letters 14: 20180532.
Darwin, C. 1859. On the origin of species by means of natural selection, or, The preservation of
favoured races in the struggle for life. John Murray, London.
Davis, A. R., A. Corl, Y. Surget-Groba, and B. Sinervo. 2011. Convergent evolution of kin-based
sociality in a lizard. Proceedings of the Royal Society B: Biological Sciences 278:1507–1514.
DEA (Department of Environmental Affairs). 2015. https://www.environment.gov.za/mapsgraphics.
[Accessed 16 March 2019]
Debinski, D. M., and R. D. Holt. 2000. A survey and overview of habitat fragmentation experiments.
Conservation Biology 14:342–355.
Delaney, K. S., S. P. D. Riley, and R. N. Fisher. 2010. A rapid, strong, and convergent genetic
response to urban habitat fragmentation in four divergent and widespread vertebrates. PLoS ONE
5:1–11.
Delis, P. R., H. R. Mushinsky, and E. D. McCoy. 1996. Decline of some west-central Florida anuran
populations in response to habitat degradation. Biodiversity and Conservation 5:1579–1595.
Demay, S. M., P. A. Becker, C. A. Eidson, J. L. Rachlow, T. R. Johnson, and L. P. Waits. 2013.
Evaluating DNA degradation rates in faecal pellets of the endangered pygmy rabbit. Molecular
Ecology Resources 13:654–662.
POPULATION GENETICS AND SOCIALITY IN THE SUNGAZER
128
De Waal, S. W. P. 1978. The Squamata (Reptilia) of the Orange Free State, South Africa. Doctoral
thesis. University of Natal, South Africa.
Diedericks, G., and S. R. Daniels. 2014. Ain’t no mountain high enough, ain’t no valley low enough?
Phylogeography of the rupicolous Cape girdled lizard (Cordylus cordylus) reveals a generalist
pattern. Molecular Phylogenetics and Evolution 71:234–248.
Dijkshoorn, J. A., V. W. P. van Engelen, and J. R. M. Huting. 2008. Soil and landform properties for
LADA partner countries (Argentina, China, Cuba, Senegal and The Gambia, South Africa and
Tunisia). ISRIC Report 6.
Diniz-Filho, J. A. F., J. C. Nabout, L. M. Bini, T. N. Soares, M. P. de Campus Telles, P. de Marco,
and R. G. Collevatti. 2009. Niche modelling and landscape genetics of Caryocar brasiliense
(“Pequi” tree: Caryocaraceae) in Brazilian Cerrado: An integrative approach for evaluating
central-peripheral population patterns. Tree Genetics and Genomes 5:617–627.
Dobzhansky, T. 1940. Speciation as a stage in evolutionary divergence. The American Naturalist
74:312–321.
Dodd Jr, C. K. 1989. Review: World checklist of threatened amphibians and reptiles. Herp Review
20:99.
Doody, J. S., G. M. Burghardt, and V. Dinets. 2013. Breaking the social-non-social dichotomy: a role
for reptiles in vertebrate social behavior research? Ethology 119:95–103.
Douglas, M. E., M. R. Douglas, G. W. Schuett, and L. W. Porras. 2006. Evolution of rattlesnakes
(Viperidae; Crotalus) in the warm deserts of western North America shaped by Neogene
vicariance and Quaternary climate change. Molecular Ecology 15:3353–3374.
Dubey, B., P. R. Meganathan, and I. Haque. 2010. Molecular identification of three Indian snake
species using simple PCR-RFLP method. Journal of Forensic Sciences 55:1065–1067.
Duckett, P. E., M. H. Morgan, and A. J. Stow. 2012. Tree-dwelling populations of the skink Egernia
striolata aggregate in groups of close kin. Copeia 2012:130–134.
Duffield, G. A., and M. C. Bull. 2002. Stable social aggregations in an Australian lizard, Egernia
stokesii. Naturwissenschaften 89:424–427.
Dunham, A. E. 1982. demographic and life-history variation among populations of the iguanid lizard
Urosaurus ornatus: implications for the study of life-history phenomena in lizards.
Herpetologica 38:208–221.
Dupanloup, I., S. Schneider, and L. Excoffier. 2002. A simulated annealing approach to define the
genetic structure of populations. Molecular Ecology 11:2571–2581.
Durand, E., F. Jay, O. E. Gaggiotti, and O. François. 2009. Spatial inference of admixture proportions
and secondary contact zones. Molecular Biology and Evolution 26:1963–1973.
POPULATION GENETICS AND SOCIALITY IN THE SUNGAZER
129
Dutch News. 2016. Rare lizards and snakes found in suitcase at Schiphol.
https://www.dutchnews.nl/news/2016/08/rare-lizards-and-snakes-found-in-suitcase-at-schiphol/.
[Accessed 14 January 2020]
Du Toit, Z., J. P. Grobler, A. Kotze, R. Jansen, and D. L. Dalton. 2017. Scale samples from
Temminck’s ground pangolin (Smutsia temminckii): a non-invasive source of DNA.
Conservation Genetics Resources 9:1–4.
Earl, D. A., and B. M. vonHoldt. 2012. STRUCTURE HARVESTER: A website and program for
visualizing STRUCTURE output and implementing the Evanno method. Conservation Genetics
Resources 4:359–361.
Effenberger, E. 2004. Social structure and spatial-use in a group-living lizard, Cordylus cataphractus.
Masters thesis. Stellenbosch University.
Eggert, L. S., C. A. Rasner, and D. S. Woodruff. 2008. The evolution and phylogeography of the
African elephant inferred from mitochondrial DNA sequence and nuclear microsatellite markers.
Hungarian Quarterly 49:1993–2006.
Eisenberg, T., and H. Werning. 2012. Phymaturus cf. palluma in captivity: Observations on its
reproduction and biology. Salamandra 48:198–206.
Elith, J., C. H. Graham, R. P. Anderson, M. Dudík, S. Ferrier, A. Guisan, R. J. Hijmans, F.
Huettmann, J. R. Leathwick, A. Lehmann, J. Li, L. G. Lohmann, B. A. Loiselle, G. Manion, C.
Moritz, M. Nakamura, Y. Nakazawa, J. McC. M. Overton, A. Townsend Peterson, S. J. Phillips,
K. Richardson, R. Scachetti-Pereira, R. E. Schapire, J. Soberón, S. Williams, M. S. Wisz, and N.
E. Zimmermann. 2006. Novel methods improve prediction of species’ distributions from
occurrence data. Ecography 29:129–151.
Ellegren, H. 2004. Microsatellites: Simple sequences with complex evolution. Nature Reviews
Genetics 5:435–445.
Emerson, B. C., and G. M. Hewitt. 2005. Phylogeography. Current biology 15:R367--R371.
Epperson, B. K. 1995. Spatial distributions of genotypes under isolation by distance. Genetics
140:1431–1440.
Epps, C. W., and N. Keyghobadi. 2015. Landscape genetics in a changing world: Disentangling
historical and contemporary influences and inferring change. Molecular Ecology 24:6021–6040.
Epps, C. W., J. D. Wehausen, V. C. Bleich, S. G. Torres, and J. S. Brashares. 2007. Optimizing
dispersal and corridor models using landscape genetics. Journal of Applied Ecology 44:714–724.
Estoup, A., C. R. Largiader, E. Perrot, and D. Chourrout. 1996. Rapid one-tube DNA extraction for
reliable PCR detection of fish polymorphic markers and transgenes. Molecular Marine Biology
and Biotechnology 5:295–298.
Evanno, G., S. Regnaut, and J. Goudet. 2005. Detecting the number of clusters of individuals using
the software STRUCTURE: A simulation study. Molecular Ecology 14:2611–2620.
POPULATION GENETICS AND SOCIALITY IN THE SUNGAZER
130
Ewers, R. M., and R. K. Didham. 2006. Confounding factors in the detection of species responses to
habitat fragmentation. Biological Reviews of the Cambridge Philosophical Society 81:117–142.
Excoffier, L., M. Foll, and R. J. Petit. 2009. Genetic consequences of range expansions. Annual
Review of Ecology, Evolution, and Systematics 40:481–501.
Excoffier, L., and H. E. L. Lischer. 2010. Arlequin suite ver 3.5: A new series of programs to perform
population genetics analyses under Linux and Windows. Molecular Ecology Resources 10:564–
567.
Fahrig, L. 1998. When does fragmentation of breeding habitat affect population survival? Ecological
Modelling 105:273–292.
Fahrig, L. 2003. Effects of Habitat Fragmentation on Biodiversity. Annual Review of Ecology,
Evolution, and Systematics 34:487–515.
Faircloth, B. C. 2008. MSATCOMMANDER: Detection of microsatellite repeat arrays and
automated, locus-specific primer design. Molecular Ecology Resources 8:92–94.
Feldman, C. R., and G. S. Spicer. 2002. Mitochondrial variation in sharp-tailed snakes (Contia
tenuis): evidence of a cryptic species. Journal of Herpetology 36:648–655.
Felsenstein, J. 1985. Confidence limits on phylogenies: an approach using the bootstrap. Evolution
39:783–791.
Fernando, P., M. E. Pfrender, S. E. Encalada, and R. Lande. 2000. Mitochondrial DNA variation,
phylogeography and population structure of the Asian elephant. Heredity 84:362–372.
Fetzner, J. W. J. 1999. Extracting high quality ADN from shed reptile skins: A simplified method.
Biotechniques 26:3.
Fielding, A. H., and J. F. Bell. 1997. A review of methods for the assessment of prediction errors in
conservation presence/absence models. Environmental Conservation 24:38–49.
Filardi, C. E., and R. G. Moyle. 2005. Single origin of a pan-Pacific bird group and upstream
colonization of Australasia. Nature 438:216–219.
Firth, H. V, and J. A. Hurst. 2017. Oxford Desk Reference: Clinical Genetics and Genomics. Oxford
University Press. Oxford, UK.
FitzSimons, V. F. 1943. The lizards of South Africa: Systematic account of the lizards (Sauria) of
Southern Africa. Transvaal Museum Memoirs 1:1–6.
Flanagan, S. P., and A. G. Jones. 2019. The future of parentage analysis: From microsatellites to
SNPs and beyond. Molecular Ecology 28:544–567.
Flather, C. H., G. D. Hayward, S. R. Beissinger, and P. A. Stephens. 2011. Minimum viable
populations: Is there a “magic number” for conservation practitioners? Trends in Ecology and
Evolution 26:307–316.
Foerster, K., K. Delhey, A. Johnsen, J. T. Lifjeld, and B. Kempenaers. 2003. Females increase
offspring heterozygosity and fitness through extra-pair matings. Nature 425:714–717.
POPULATION GENETICS AND SOCIALITY IN THE SUNGAZER
131
Fogel, G. 2000. Observations on the giant sungazer lizard, Cordylus giganteus, in captivity. Bulletin
of the Chicago Herpetological Society 35:277–280.
Ford, B., P. Govindarajulu, K. Larsen, and M. Russello. 2017. Evaluating the efficacy of non-invasive
genetic sampling of the Northern Pacific rattlesnake with implications for other. Conservation
Genetics Resources 9:13–15.
Ford, M. J., J. Hempelmann, M. B. Hanson, K. L. Ayres, R. W. Baird, C. K. Emmons, J. I. Lundin, G.
S. Schorr, S. K. Wasser, and L. K. Park. 2016. Estimation of a killer whale (Orcinus orca)
population’s diet using sequencing analysis of DNA from feces. PloS One 11: e0144956.
Ford, N. B., and R. A. Seigel. 1989. Phenotypic plasticity in reproductive traits: evidence from a
viviparous snake. Ecology 70:1768–1774.
Ford, N. B., and R. A. Seigel. 1994. An experimental study of the trade-offs between age and size at
maturity: effects of energy availability. Functional Ecology 8:91–96.
Foroughirad, V., A. L. Levengood, J. Mann, and C.H. Frère. 2019. Quality and quantity of genetic
relatedness data affect the analysis of social structure. Molecular ecology resources 19:1181-
1194.
Franco̧is, O., S. Ancelet, and G. Guillot. 2006. Bayesian clustering using hidden Markov random
fields in spatial population genetics. Genetics 174:805–816.
François, O., and E. Durand. 2010. Spatially explicit Bayesian clustering models in population
genetics. Molecular Ecology Resources 10:773–784.
Frankham, R. 2006. Genetics and landscape connectivity. Connectivity Conservation:72–96.
Frankham, R. 2010. Challenges and opportunities of genetic approaches to biological conservation.
Biological Conservation 143:1919–1927.
Frankham, R., C. J. A. Bradshaw, and B. W. Brook. 2014. Genetics in conservation management:
Revised recommendations for the 50/500 rules, Red List criteria and population viability
analyses. Biological Conservation 170:56–63.
Frankham, R., D. A. Briscoe, and J. D. Ballou. 2002. Introduction to conservation genetics.
Cambridge University Press. New York, USA.
Frankham, R., and K. Ralls. 1998. Conservation biology: Inbreeding leads to extinction. Nature
392:441–442.
Fraser, D. J., and L. Bernatchez. 2001. Adaptive evolutionary conservation: Towards a unified
concept for defining conservation units. Molecular Ecology 10:2741–2752.
Fredsted, T., C. Pertoldi, M. H. Schierup, and P. M. Kappeler. 2005. Microsatellite analyses reveal
fine-scale genetic structure in grey mouse lemurs (Microcebus murinus). Molecular Ecology
14:2363–2372.
French, S. S., A. C. Webb, S. B. Hudson, and E. E. Virgin. 2018. Town and country reptiles: a review
of reptilian responses to urbanization. Integrative and comparative biology 58:948–966.
POPULATION GENETICS AND SOCIALITY IN THE SUNGAZER
132
Friedlander, T. P., J. C. Regier, and C. Mitter. 1992. Nuclear gene sequences for higher level
phylogenetic analysis: 14 promising candidates. Systematic Biology 41:483–490.
Frost, D., D. Janies, P. L. F. N. Mouton, and T. Titus. 2001. A Molecular Perspective on the
Phylogeny of the Girdled Lizards (Cordylidae, Squamata). American Museum Novitates
2001.3310: 1-10.
Fuentes, M. M. P. B., M. Hamann, and C. J. Limpus. 2010. Past, current and future thermal profiles of
green turtle nesting grounds: Implications from climate change. Journal of Experimental Marine
Biology and Ecology 383:56–64.
Fuller, S. J., C. M. Bull, K. Murray, and R. J. Spencer. 2005. Clustering of related individuals in a
population of the Australian lizard, Egernia frerei. Molecular Ecology 14:1207–1213.
Galbusera, P., S. van Dongen, and E. Matthysen. 2000. Cross-species amplification of microsatellite
primers in passerine birds. Conservation Genetics 1:163-168.
Galewski, T., M. K. Tilak, S. Sanchez, P. Chevret, E. Paradis, and E. J. P. Douzery. 2006. The
evolutionary radiation of Arvicolinae rodents (voles and lemmings): Relative contribution of
nuclear and mitochondrial DNA phylogenies. BMC Evolutionary Biology 6:1–17.
Gallo, J. A., L. Pasquini, B. Reyers, and R. M. Cowling. 2009. The role of private conservation areas
in biodiversity representation and target achievement within the Little Karoo region, South
Africa. Biological Conservation 142:446–454.
Gamble, T. 2014. Collecting and preserving genetic material for herpetological research.
Herpetological Circular 41:1–50.
Garant, D., S. E. Forde, and A. P. Hendry. 2007. The multifarious effects of dispersal and gene flow
on contemporary adaptation. Functional Ecology 21:434–443.
Gardner, M. G., C. M. Bull, and S. J. B. Cooper. 2002. High levels of genetic monogamy in the
group-living Australian lizard Egernia stokesii. Molecular Ecology 11:1787–1794.
Gardner, M. G., C. M. Bull, S. J. B. Cooper, and G. A. Duffield. 2001. Genetic evidence for a family
structure in stable social aggregations of the Australian lizard Egernia stokesii. Molecular
Ecology 10:175–183.
Gardner, M. G., C. M. Bull, A. Fenner, K. Murray, and S. C. Donnellan. 2007. Consistent social
structure within aggregations of the Australian lizard, Egernia stokesii across seven disconnected
rocky outcrops. Journal of Ethology 25:263–270.
Gardner, M. G., S. S. Godfrey, A. L. Fenner, S. C. Donnellan, and C. M. Bull. 2012. Fine-scale spatial
structuring as an inbreeding avoidance mechanism in the social skink Egernia stokesii.
Australian Journal of Zoology 60:272–277.
Gardner, M. G., S. K. Pearson, G. R. Johnston, and M. P. Schwarz. 2016. Group living in squamate
reptiles: a review of evidence for stable aggregations. Biological Reviews 91:925–936.
POPULATION GENETICS AND SOCIALITY IN THE SUNGAZER
133
Garner, A., J. L. Rachlow, and J. F. Hicks. 2005. Patterns of genetic diversity and its loss in
mammalian populations. Conservation Biology 19:1215–1221.
Ghobrial, L., F. Lankester, J. A. Kiyang, A. E. Akih, S. de Vries, R. Fotso, E. L. Gadsby, P. D.
Jenkins, and M. K. Gonder. 2010. Tracing the origins of rescued chimpanzees reveals
widespread chimpanzee hunting in Cameroon. BMC Ecology 10.
Gholamifard, A. D. 2011. Endemism in the reptile fauna of Iran. Iranian Journal of Animal
Biosystematics 7:13–29.
Glor, R. E., A. S. Flecker, M. F. Benard, and A. G. Power. 2001. Lizard diversity and agricultural
disturbance in a Caribbean forest landscape. Biodiversity and Conservation 10:711–723.
Godfrey, S. S., C. M. Bull, K. Murray, and M. G. Gardner. 2006. Transmission mode and distribution
of parasites among groups of the social lizard Egernia stokesii. Parasitology Research 99:223–
230.
Godfrey, S. S., and M. G. Gardner. 2017. Lizards, ticks and contributions to Australian parasitology:
C. Michael Bull (1947–2016). International Journal for Parasitology: Parasites and Wildlife
6:295–298.
Goldenberg, S. Z., M. A. Owen, J. L. Brown, G. Wittemyer, Z. M. Oo, and P. Leimgruber. 2019.
Increasing conservation translocation success by building social functionality in released
populations. Global Ecology and Conservation 18:e00604.
González-Fernández, A., J. Manjarrez, U. García-Vázquez, M. D’Addario, and A. Sunny. 2018.
Present and future ecological niche modeling of garter snake species from the Trans-Mexican
Volcanic Belt. PeerJ 6:e4618.
Goossens, B., R. Sharma, N. Othman, C. Kun-Rodrigues, R. Sakong, M. Ancrenaz, L. N. Ambu, N.
K. Jue, R. J. O’Neill, M. W. Bruford, and L. Chikhi. 2016. Habitat fragmentation and genetic
diversity in natural populations of the Bornean elephant: Implications for conservation.
Biological Conservation 196:80–92.
Greig, J. C. 1977. Principles of genetic conservation in relation to wildlife management in Southern
Africa. International Symposium on African Wildlife, Research and Management 9:57–78.
Griffin, C. 2015. Effects of road-induced habitat fragmentation on reptile and amphibian species at
risk in North America: impacts and mitigation efforts. Institute of the Environment. University of
Ottawa, 1-55.
Groenewald, G. H. 1992. The relocation of Cordylus giganteus in the Orange Free State, South
Africa: Pitfalls and their possible prevention. Journal of the Herpetological Association of Africa
40:72–77.
Groombridge, B. 1994. 1994 IUCN Red List of Threatened Animals. IUCN, Cambridge, United
Kingdom.
POPULATION GENETICS AND SOCIALITY IN THE SUNGAZER
134
Grosser, S., J. Abdelkrim, J. Wing, B. C. Robertson, and N. J. Gemmell. 2017. Strong isolation by
distance argues for separate population management of endangered blue duck (Hymenolaimus
malacorhynchos). Conservation Genetics 18:327–341.
Guichoux, E., L. Lagache, S. Wagner, P. Chaumeil, P. Léger, O. Lepais, C. Lepoittevin, T. Malausa,
E. Revardel, F. Salin, and R. J. Petit. 2011. Current trends in microsatellite genotyping.
Molecular Ecology Resources 11:591–611.
Guillot, G., A. Estoup, F. Mortier, and J. F. Cosson. 2005. A spatial statistical model for landscape
genetics. Genetics 170:1261–1280.
Gurrutxaga, M., P. J. Lozano, and G. del Barrio. 2010. GIS-based approach for incorporating the
connectivity of ecological networks into regional planning. Journal for Nature Conservation
18:318–326.
Haag, T., A. S. Santos, D. A. Sana, R. G. Morato, L. Cullen, P. G. Crawshaw, C. De Angelo, M. S. Di
Bitetti, F. M. Salzano, and E. Eizirik. 2010. The effect of habitat fragmentation on the genetic
structure of a top predator: Loss of diversity and high differentiation among remnant populations
of Atlantic Forest jaguars (Panthera onca). Molecular Ecology 19:4906–4921.
Habel, J. C., and T. Schmitt. 2009. The genetic consequences of different dispersal behaviours in
Lycaenid butterfly species. Bulletin of Entomological Research 99:513–523.
Halliwell, B. 2016. Behaviour, ecology and social organisation in Liopholis whitii: insights into the
evolutionary origins of sociality. Doctoral thesis. School of Biological Sciences, University of
Tasmania.
Halliwell, B., T. Uller, D. G. Chapple, M. G. Gardner, E. Wapstra, and G. M. While. 2017a. Habitat
saturation promotes delayed dispersal in a social reptile. Behavioral Ecology 28:515–522.
Halliwell, B., T. Uller, B. R. Holland, and G. M. While. 2017b. Live bearing promotes the evolution
of sociality in reptiles. Nature communications 8:2030.
Halloy, M., C. Robles, M. Salica, R. Semhan, V. Juárez Heredia, and N. Vicente. 2013. Estudios de
comportamiento y ecología de lagartijas de los géneros Liolaemus y Phymaturus (Iguania:
Liolaemini). Cuadernos de herpetología 27:15–26.
Hayes, F. E., and J. N. Sewlal. 2004. The Amazon river as a dispersal barrier to passerine birds:
effects of river width, habitat and taxonomy. Journal of Biogeography 31:1809–1818.
Hayward, J., and P. L. F. N. Mouton. 2007. Group location in the group-living lizard, Cordylus
cataphractus: The significance of occupancy and a group signal. Amphibia Reptilia 28:329–335.
Heath, S., A. W. Schrey, K. G. Ashton, H. R. Mushinsky, and E. D. McCoy. 2012. Contrasting
genetic differentiation of a poorly dispersing lizard in connected and fragmented scrub habitats.
Journal of Herpetology 46:602–607.
Hedrick, P. P. W., R. C. Lacy, and C. S. Baker. 2015. Measuring relatedness between inbred
individuals. Journal of Heredity 106:20–25.
POPULATION GENETICS AND SOCIALITY IN THE SUNGAZER
135
Hedrick, P. W., and S. T. Kalinowski. 2000. Inbreeding Depression in Conservation Biology. Annual
review of ecology and systematics 31:139–162.
Hellberg, M. E. 2009. Gene flow and isolation among populations of marine animals. Annual Review
of Ecology, Evolution, and Systematics 40:291–310.
Herkert, J. 1994. The effects of habitat fragmentation on midwestern grassland bird communities.
Ecological Applications 4:461–471.
Herrel, A., G. J. Measey, B. Vanhooydonck, and K. A. Tolley. 2012. Got it clipped? the effect of tail
clipping on tail gripping performance in chameleons. Journal of Herpetology 46:91–93.
Hijmans, R. J., S. E. Cameron, J. L. Parra, P. G. Jones, and A. Jarvis. 2005. Very high resolution
interpolated climate surfaces for global land areas. International Journal of Climatology
25:1965–1978.
Himes, C. M. T., M. H. Gallardo, and G. J. Kenagy. 2008. Historical biogeography and post-glacial
recolonization of South American temperate rain forest by the relictual marsupial Dromiciops
gliroides. Journal of Biogeography 35:1415–1424.
Hoban, S. M., H. C. Hauffe, S. Pérez-Espona, J. W. Arntzen, G. Bertorelle, J. Bryja, K. Frith, O. E.
Gaggiotti, P. Galbusera, J. A. Godoy, A. R. Hoelzel, R. A. Nichols, C. R. Primmer, I. R. Russo,
G. Segelbacher, H. R. Siegismund, M. Sihvonen, C. Vernesi, C. Vilà, and M. W. Bruford. 2013.
Bringing genetic diversity to the forefront of conservation policy and management. Conservation
Genetics Resources 5:593–598.
Hobbs, G. I., E. A. Chadwick, M. W. Bruford, and F. M. Slater. 2011. Bayesian clustering techniques
and progressive partitioning to identify population structuring within a recovering otter
population in the UK. Journal of Applied Ecology 48:1206–1217.
Hodel, R. G. J., M. C. Segovia-Salcedo, J. B. Landis, A. A. Crowl, M. Sun, X. Liu, M. A.
Gitzendanner, N. A. Douglas, C. C. Germain-Aubrey, S. Chen, D. E. Soltis, and P. S. Soltis.
2016. the report of my death was an exaggeration: a review for researchers using microsatellites
in the 21st century. Applications in Plant Sciences 4:1600025.
Hoehn, M., S. D. Sarre, and K. Henle. 2007. The tales of two geckos: Does dispersal prevent
extinction in recently fragmented populations? Molecular Ecology 16:3299–3312.
Hogg, C. J., S. Dennison, G. J. Frankham, M. Hinds, and R. N. Johnson. 2018. Stopping the spin
cycle: genetics and bio-banking as a tool for addressing the laundering of illegally caught
wildlife as ‘captive-bred.’ Conservation Genetics Resources 10:237–246.
Holderegger, R., and H. H. Wagner. 2006. A brief guide to Landscape Genetics. Landscape Ecology
21:793–796.
Holmes, G. 2013. What role do private protected areas have in conserving global biodiversity?
Sustainability Research Institute (SRI):1–26.
POPULATION GENETICS AND SOCIALITY IN THE SUNGAZER
136
Holmes, P., and C. Barker. 2006. Geological and geomorphological controls on the physical
landscape of the free state. South African Geographical Journal 88:3–10.
Hoppitt, W., and K. N. Laland. 2013 .Social learning: an introduction to mechanisms, methods, and
models. Princeton University Press. Princeton, USA.
Horreo, J. L., M. L. Peláez, and P. S. Fitze. 2015. Skin sheds as a useful DNA source for lizard
conservation. Phyllomedusa 14:73–77.
Hudson, S. 1996. Natural toe loss in southeastern Australian skinks: implications for marking lizards
by toe-clipping. Journal of Herpetology 30:106–110.
Huelsenbeck, J. P., and B. Rannala. 2004. Frequentist properties of bayesian posterior probabilities of
phylogenetic trees under simple and complex substitution models. Systematic Biology 53:904–
913.
Hughes, D. F., K. A. Tolley, M. Behangana, W. Lukwago, M. Menegon, J. M. Dehling, J. Stipala, C.
R. Tilbury, A. M. Khan, C. Kusamba, and E. Greenbaum. 2018. Cryptic diversity in
Rhampholeon boulengeri (Sauria: Chamaeleonidae), a pygmy chameleon from the Albertine Rift
biodiversity hotspot. Molecular Phylogenetics and Evolution 122:125–141.
Hui, M., A. Nuryanto, and M. Kochzius. 2017. Concordance of microsatellite and mitochondrial DNA
markers in detecting genetic population structure in the boring giant clam Tridacna crocea across
the Indo-Malay Archipelago. Marine Ecology 38:1–11.
IUCN (International Union for Conservation of Nature). 2012. IUCN Red List Categories and
Criteria: Version 3.1. Second edition. Gland, Switzerland and Cambridge, UK.
Jackson, N. D., and L. Fahrig. 2011. Relative effects of road mortality and decreased connectivity on
population genetic diversity. Biological Conservation 144:3143–3148.
Jacobsen, N. H. G. 1989. A herpetological survey of the Transvaal. Doctoral thesis. University of
Natal, Pietermaritzburg, Kwazulu-Natal, South Africa.
Jacobsen, N. H. G., R. E. Newbery, and W. Petersen. 1990. On the ecology and conservation status of
Cordylus giganteus A. Smith in the Transvaal. South African Journal of Zoology 25:61–66.
Jacobsen, N. H. G., and U. D. V Pienaar. 1983. New reptile records from the Kruger National Park.
Koedoe 26:135–144.
Jain, A.K., M.N. Murty, and P.J. Flynn. 2007. Data clustering: a review. ACM Computing Surveys
31:264–323.
Jansa, S., F. Barker, and L. Heaney. 2006. The pattern and timing of diversification of Philippine
endemic rodents: Evidence from mitochondrial and nuclear gene sequences. Systematic Biology
55:73–88.
Jellinek, S., D. A. Driscoll, and J. B. Kirkpatrick. 2004. Environmental and vegetation variables have
a greater influence than habitat fragmentation in structuring lizard communities in remnant urban
bushland. Austral Ecology 29:294–304.
POPULATION GENETICS AND SOCIALITY IN THE SUNGAZER
137
Jenkins, D. G., C. R. Brescacin, C. V. Duxbury, J. A. Elliott, J. A. Evans, K. R. Grablow, M.
Hillegass, B. N. Lyon, G. A. Metzger, M. L. Olandese, D. Pepe, G. A. Silvers, H. N. Suresch, T.
N. Thompson, C. M. Trexler, G. E. Williams, N. C. Williams, and S. E. Williams. 2007. Does
size matter for dispersal distance? Global Ecology and Biogeography 16:415–425.
Jenkins, D. G., M. Carey, J. Czerniewska, J. Fletcher, T. Hether, A. Jones, S. Knight, J. Knox, T.
Long, M. Mannino, M. McGuire, A. Riffle, S. Segelsky, L. Shappell, A. Sterner, T. Strickler, and
R. Tursi. 2010. A meta-analysis of isolation by distance: Relic or reference standard for
landscape genetics? Ecography 33:315–320.
Jones, R., J. Cable, and M. W. Bruford. 2008. An evaluation of non-invasive sampling for genetic
analysis in northern European reptiles. The Herpetological Journal 18:32–39.
Kalinowski, S. T. 2011. The computer program STRUCTURE does not reliably identify the main
genetic clusters within species: Simulations and implications for human population structure.
Heredity 106:625–632.
Kalinowski, S. T., M. L. Taper, and T. C. Marshall. 2007. Revising how the computer program
CERVUS accommodates genotyping error increases success in paternity assignment. Molecular
Ecology 16:1099–1106.
Kaliontzopoulou, A., C. Pinho, and F. Martínez-Freiría. 2018. Where does diversity come from?
Linking geographical patterns of morphological, genetic, and environmental variation in wall
lizards. BMC Evolutionary Biology 18:124.
Karanth, K. U., N. S. Kumar, and D. Vasudev. 2014. Photographic database informs management of
conflict tigers. Oryx 48:484.
Kay, G. M., D. A. Driscoll, D. B. Lindenmayer, S. A. Pulsford, and A. Mortelliti. 2016. Pasture height
and crop direction influence reptile movement in an agricultural matrix. Agriculture, Ecosystems
and Environment 235:164–171.
Keane, B., S. R. Creel, and P. M. Waser. 1996. No evidence of inbreeding avoidance or inbreeding
depression in a social carnivore. Behavioral Ecology 7:480–489.
Kearney, M. R., R. Shine, and D. Pearson. 2001. Why do geckos group? An analysis of “social”
aggregations in two species of Australian lizards. Herpetologica 57:411–422.
Kearse, M., R. Moir, A. Wilson, S. Stones-Havas, M. Cheung, S. Sturrock, S. Buxton, A. Cooper, S.
Markowitz, C. Duran, T. Thierer, B. Ashton, P. Meintjes, and A. Drummond. 2012. Geneious
Basic: An integrated and extendable desktop software platform for the organization and analysis
of sequence data. Bioinformatics 28:1647–1649.
Keller, D., R. Holderegger, M. J. van Strien, and J. Bolliger. 2015. How to make landscape genetics
beneficial for conservation management? Conservation Genetics 16:503–512.
Keller, L. F., and D. M. Waller. 2002. Inbreeding effects in wild populations. Trends in Ecology and
Evolution 17:230–241.
POPULATION GENETICS AND SOCIALITY IN THE SUNGAZER
138
Kellert, S. R. 1993. The biological basis for human values of nature. Pages 42–69 in S. R. Kellert and
E. O. Wilson, editors. The Biophilia Hypothesis. Island Press, Washington, D. C.
Kemp, B. M., and D. G. Smith. 2005. Use of bleach to eliminate contaminating DNA from the surface
of bones and teeth. Forensic Science International 154:53–61.
Keyghobadi, N. 2007. The genetic implications of habitat fragmentation for animals. Canadian
Journal of Zoology 85:1049–1064.
Kheng, V., J. M. Zichello, D. N. Lumbantobing, S. Z. S. Lawalata, N. Andayani, and D. J. Melnick.
2018. Phylogeography, population structure, and conservation of the Javan Gibbon (Hylobates
moloch). International Journal of Primatology 39:5–26.
Kis, A., L. Huber, and A. Wilkinson. 2015. Social learning by imitation in a reptile (Pogona
vitticeps). Animal Cognition 18:325–331.
Kohli, M. K., T. Schneider, O. Müller, and J. L. Ware. 2014. Counting the spots: A molecular and
morphological phylogeny of the spotted darner Boyeria (Odonata: Anisoptera: Aeshnidae) with
an emphasis on European taxa. Systematic Entomology 39:190–195.
Kokko, H., and I. Ots. 2006. When not to avoid inbreeding. Evolution 60:467.
Koressaar, T., and M. Remm. 2007. Enhancements and modifications of primer design program
Primer3. Bioinformatics 23:1289–1291.
Kozak, K. H., C. H. Graham, and J. J. Wiens. 2008. Integrating GIS-based environmental data into
evolutionary biology. Trends in Ecology and Evolution 23:141–148.
Kramer, J., and J. Meunier. 2019. The other facets of family life and their role in the evolution of
animal sociality. Biological Reviews 94:199–215.
Krawiec, J., S. L. Krauss, R. A. Davis, and P. B. S. Spencer. 2015. Weak genetic structuring suggests
historically high genetic connectivity among recently fragmented urban populations of the
scincid lizard, Ctenotus fallens. Australian Journal of Zoology 63:279–286.
Kuchta, S. R., and D. Meyer. 2001. A genealogical view of geographical variation. Molecular
Ecology 10:2569–2576.
Kyriazis, C. C., R. K. Wayne, and K. E. Lohmueller. 2019. High genetic diversity can contribute to
extinction in small populations. bioRxiv:678524.
Lacy, R. C. 1987. Loss of genetic diversity from managed populations: interacting effects of drift,
mutation, immigration, selection, and population subdivision. Conservation Biology 1:143–158.
Lambiris, A. J. L., and O. Bourquin. 1993. Conservation importance of worm-lizards and lizards in
Natal. Internal Report. Pietermaritzburg.
Lande, R. 1976. Natural selection and random genetic drift in phenotypic evolution. Evolution
30:314–334.
Lande, R. 1993. Risks of population extinction from demographic and environmental stochasticity
and random catastrophes. The American Naturalist 142:911–927.
POPULATION GENETICS AND SOCIALITY IN THE SUNGAZER
139
Lande, R., and S. Shannon. 1996. The role of genetic variation in adaptation and population
persistence in a changing environment. Evolution 50:434–437.
Landguth, E. L., S. A. Cushman, M. K. Schwartz, K. S. McKelvey, M. Murphy, and G. Luikart. 2010.
Quantifying the lag time to detect barriers in landscape genetics. Molecular Ecology 19:4179–
4191.
Lanfear, R., B. Calcott, D. Kainer, C. Mayer, and A. Stamatakis. 2014. Selecting optimal partitioning
schemes for phylogenomic datasets. BMC Evolutionary Biology 14:82.
Langerwerf, B. 2001. Keeping and breeding Sungazers. Reptile Magazine June:59-65.
Langkilde, T., D. O’Connor, and R. Shine. 2007. Benefits of parental care: Do juvenile lizards obtain
better-quality habitat by remaining with their parents? Austral Ecology 32:950–954.
Lanham, E. J., and C. M. Bull. 2000. Maternal care and infanticide in the Australian skink, Egernia
stokesii. Herpetological Review 31:151–152.
Lanham, E. J., and C. M. Bull. 2004. Enhanced vigilance in groups in Egernia stokesii, a lizard with
stable social aggregations. Journal of Zoology 263:95–99.
Leberg, P. L. 2002. Estimating allelic richness: Effects of sample size and bottlenecks. Molecular
Ecology 11:2445–2449.
Lecompte, E., K. Aplin, C. Denys, F. Catzeflis, M. Chades, and P. Chevret. 2008. Phylogeny and
biogeography of African Murinae based on mitochondrial and nuclear gene sequences, with a
new tribal classification of the subfamily. BMC Evolutionary Biology 8:1–21.
Lefort, M.-C., R. H. Cruickshank, K. Descovich, N. J. Adams, A. Barun, A. Emami-Khoyi, J. Ridden,
V. R. Smith, R. Sprague, B. R. Waterhouse, and S. Boyer. 2019. Blood, sweat and tears: a review
of non-invasive DNA sampling. bioRxiv:385120.
Lenormand, T. 2002. Gene flow and the limits to natural selection. Trends in Ecology & Evolution
17:183–189.
Leu, S. T., G. Jackson, J. F. Roddick, and C. M. Bull. 2016. Lizard movement tracks: variation in path
re-use behaviour is consistent with a scent-marking function. PeerJ 4:e1844.
Leu, S. T., P. M. Kappeler, and C. M. Bull. 2011. Pair-living in the absence of obligate biparental care
in a lizard: Trading-off sex and food? Ethology 117:758–768.
Lin, C. P., and B. N. Danforth. 2004. How do insect nuclear and mitochondrial gene substitution
patterns differ? Insights from Bayesian analyses of combined datasets. Molecular Phylogenetics
and Evolution 30:686–702.
Lind, A. J., P. Q. Spinks, G. M. Fellers, and H. B. Shaffer. 2011. Rangewide phylogeography and
landscape genetics of the Western U.S. endemic frog Rana boylii (Ranidae): Implications for the
conservation of frogs and rivers. Conservation Genetics 12:269–284.
Lindahl, T. 1993. Instability and decay of the primary structure of DNA. Nature 362:709–715.
POPULATION GENETICS AND SOCIALITY IN THE SUNGAZER
140
Lindenmayer, D., and J. Fischer. 2007. Habitat fragmentation and landscape change: an ecological
and conservation synthesis. Island Press. Washington DC, USA.
Little, I. T., and C. Theron. 2014. Guidelines for custodianship in South Africa - Rewarding
conservation friendly farming:1–15.
Liu, N., L. Chen, S. Wang, C. Oh, and H. Zhao. 2005. Comparison of single-nucleotide
polymorphisms and microsatellites in inference of population structure. BMC Genetics 6:S26.
Loehr, V., S. Parusnath, and F. Gilchrist. 2016. Bogus captive-breeding of the South African
Sungazer lizard Smaug giganteus. Traffic Bulletin 28.
Lonsinger, R. C., E. M. Gese, S. J. Dempsey, B. M. Kluever, T. R. Johnson, and L. P. Waits. 2015.
Balancing sample accumulation and DNA degradation rates to optimize non-invasive genetic
sampling of sympatric carnivores. Molecular Ecology Resources 15:831–842.
Lores, G. E. F., and J. P. I. Raya. 2006. The Andes Mountain Range uplift as a vicariant event in the
Pimeliinae (Coleoptera : Tenebrionidae) in Southern South America. Cahiers scientifiques du
Muséum d’histoire naturelle de Lyon - Centre de conservation et d’étude des collections 10:95–
102.
Losos, J. B., P. L. F. N. Mouton, R. Bickel, I. Cornelius, and L. Ruddock. 2002. The effect of body
armature on escape behaviour in cordylid lizards. Animal Behaviour 64:313–321.
Louw, S., B. V. Burger, and M. Le Roux. 2007. Lizard Epidermal Gland Secretions I: Chemical
Characterization of the Femoral Gland Secretion of the Sungazer, Cordylus giganteus. Journal of
chemical ecology 33:1806–1818.
Louw, S., B. V. Burger, M. Le Roux, and J. H. Van Wyk. 2011. Lizard epidermal gland secretions. II.
Chemical characterization of the generation gland secretion of the Sungazer, Cordylus giganteus.
Journal of Natural Products 74:1364–1369.
Loveridge, A. 1944. Revision of the African lizards of the family Cordylidae. Bulletin of the Museum
of Comparative Zoology. Museum of Comparative Zoology at Harvard College.
Lucena-Aguilar, G., A. M. Sánchez-López, C. Barberán-Aceituno, J. A. Carrillo-Ávila, J. A. López-
Guerrero, and R. Aguilar-Quesada. 2016. DNA source selection for downstream applications
based on DNA quality indicators analysis. Biopreservation and Biobanking 14:264–270.
Lukas, D., and T. Clutton-Brock. 2018. Social complexity and kinship in animal societies. Ecology
Letters 21:1129–1134.
Lyndon-Gee, F., J. Sumner, Y. Hu, C. Ciofi, and T. S. Jessop. 2018. Abundance and genetic diversity
responses of a lizard (Eulamprus heatwolei) to logging disturbance. Australian Journal of
Zoology 65:362–371.
Lyons, J. A., and D. J. D. Natusch. 2011. Wildlife laundering through breeding farms: Illegal harvest,
population declines and a means of regulating the trade of green pythons (Morelia viridis) from
Indonesia. Biological Conservation 144:3073–3081.
POPULATION GENETICS AND SOCIALITY IN THE SUNGAZER
141
MacArthur, R. H., and E. O. Wilson. 1967. Island biogeography. Princeton, USA.
Macey, J. R., J. A. Schulte, H. G. Kami, N. B. Ananjeva, A. Larson, and T. J. Papenfuss. 2000.
Testing hypotheses of vicariance in the agamid lizard Laudakia caucasia from mountain ranges
on the Northern Iranian plateau. Molecular Phylogenetics and Evolution 14:479–483.
Mack, A. L., F. B. Gill, R. Colburn, and C. Spolsky. 1986. Mitochondrial DNA: A Source of Genetic
Markers for Studies of Similar Passerine Bird Species. The Auk 103:676–681.
Maigret, T. A. 2019. Snake scale clips as a source of high quality DNA suitable for RAD sequencing.
Conservation Genetics Resources 11:373–375.
Main, A. R., and C. M. Bull. 1996. Mother-offspring recognition in two Australian lizards, Tiliqua
rugosa and Egernia stokesii. Animal Behaviour 52:193–200.
Manel, S., M. K. Schwartz, G. Luikart, and P. Taberlet. 2003. Landscape genetics: Combining
landscape ecology and population genetics. Trends in Ecology and Evolution 18:189–197.
Mantel, N. 1967. The detection of disease clustering and a generalized regression approach. Cancer
Research 27:209–220.
Marais, J. 1984. Notes on the giant girdled lizard Cordylus giganteus A. Smith. British Herpetological
Society Bulletin 10:30–33.
Martinez-Cruz, B., J. A. Godoy, and J. J. Negro. 2004. Population genetics after fragmentation: The
case of the endangered Spanish imperial eagle (Aquila adalberti). Molecular Ecology 13:2243–
2255.
Masterson, G. P. R., B. Maritz, D. Mackay, and G. J. Alexander. 2009. The impacts of past cultivation
on the reptiles in a South African grassland. African Journal of Herpetology 58:71–84.
Matthee, C. A., C. R. Tilbury, and T. Townsend. 2004. A phylogenetic review of the African leaf
chameleons: Genus Rhampholeon (Chamaeleonidae): The role of vicariance and climate change
in speciation. Proceedings of the Royal Society B: Biological Sciences 271:1967–1975.
Mayr, E. 1942. Systematics and the origin of species Columbia University Press. New York 334.
McAlpin, S., P. Duckett, and A. Stow. 2011. Lizards cooperatively tunnel to construct a long-term
home for family members. PLoS ONE 6:4–7.
McCartney-Melstad, E., T. Waller, P. A. Micucci, M. Barros, J. Draque, G. Amato, and M. Mendez.
2012. Population structure and gene flow of the yellow anaconda (Eunectes notaeus) in Northern
Argentina. PLoS ONE 7.
Mccoy, E. D., J. Q. Richmond, H. R. Mushinsky, E. J. Britt, and J. S. Godley. 2010. Long generation
time delays the genetic response to habitat fragmentation in the threatened Florida sand skink.
Journal of Herpetology 44:641–644.
McHugh, A., C. Yablonsky, G. Binford, and I. Agnarsson. 2014. Molecular phylogenetics of
Caribbean Micrathena (Araneae: Araneidae) suggests multiple colonisation events and single
island endemism. Invertebrate Systematics 28:337–349.
POPULATION GENETICS AND SOCIALITY IN THE SUNGAZER
142
McIntyre, T. 2006. Impact of gold mining on Cordylus giganteus and recommendations for
conservation and management. Masters thesis. University of the Witwatersrand.
McIntyre, T., and M. J. Whiting. 2012. Increased metal concentrations in giant sungazer lizards
(Smaug giganteus) from mining areas in South Africa. Archives of Environmental
Contamination and Toxicology 63:574–585.
McKinney, M. L. 1997. Extinction vulnerability and selectivity: Combining ecological and
paleontological views. Annual Review of Ecology and Systematics 28:495–516.
McLachlan, G. R. 1978. South African Red Data Book - Reptiles and Amphibians. Cooperative
Scientific Programmes: CSIR.
McMahon, C. R., R. Harcourt, P. Bateson, and M. A. Hindell. 2012. Animal welfare and decision
making in wildlife research. Biological Conservation 153:254–256.
Mech, S. G., and J. G. Hallett. 2001. Evaluating the effectiveness of corridors: A genetic approach.
Conservation Biology 15:467–474.
Mee, J. A., L. Bernatchez, J. D. Reist, S. M. Rogers, and E. B. Taylor. 2015. Identifying designatable
units for intraspecific conservation prioritization: A hierarchical approach applied to the lake
whitefish species complex (Coregonus spp.). Evolutionary Applications 8:423–441.
Meister, Ba., U. Hofer, S. Ursenbacher, and B. Baur. 2010. Spatial genetic analysis of the grass snake,
Natrix natrix (Squamata: Colubridae), in an intensively used agricultural landscape. Biological
Journal of the Linnean Society 101:51–58.
Menegon, M., C. Bracebridge, N. Owen, and S. P. Loader. 2011. Herpetofauna of Montane Areas of
Tanzania. 4. Amphibians and Reptiles of Mahenge Mountains, with comments on biogeography,
diversity, and conservation. Fieldiana Life and Earth Sciences 4:103–111.
Metzger, J. P., A. C. Martensen, M. Dixo, L. C. Bernacci, M. C. Ribeiro, A. M. G. Teixeira, and R.
Pardini. 2009. Time-lag in biological responses to landscape changes in a highly dynamic
Atlantic forest region. Biological Conservation 142:1166–1177.
Michael Bull, C., and S. J. B. Cooper. 1999. Relatedness and avoidance of inbreeding in the lizard,
Tiliqua rugosa. Behavioral Ecology and Sociobiology 46:367–372.
Miller, M. P. 2005. Alleles In Space (AIS): computer software for the joint analysis of interindividual
spatial and genetic information. Journal of Heredity 96:722–724.
Milligan, B. G., J. Leebens-Mack, and A. E. Strand. 1994. Conservation genetics: Beyond the
maintenance of marker diversity. Molecular Ecology 3:423–435.
Mondol, S., V. Sridhar, P. Yadav, S. Gubbi, and U. Ramakrishnan. 2015. Tracing the geographic
origin of traded leopard body parts in the Indian subcontinent with DNA-based assignment tests.
Conservation Biology 29:556–564.
Moore, J. A., H. C. Miller, C. H. Daugherty, and N. J. Nelson. 2008. Fine-scale genetic structure of a
long-lived reptile reflects recent habitat modification. Molecular Ecology 17:4630–4641.
POPULATION GENETICS AND SOCIALITY IN THE SUNGAZER
143
Moore, J., and R. Ali. 1984. Are dispersal and inbreeding avoidance related? Animal Behaviour
32:94–112.
Morin, P. A., K. K. Martien, and B. L. Taylor. 2009. Assessing statistical power of SNPs for
population structure and conservation studies. Molecular Ecology Resources 9:66–73.
Moritz, C. 1994. Defining “Evolutionarily Significant Units” for conservation. Trends in Ecology and
Evolution 9:373–375.
Mouton, P. L. F. N. 2011. Aggregation behaviour of lizards in the arid western regions of South
Africa. African Journal of Herpetology 60:155–170.
Mouton, P. L. F. N. 2014. Smaug giganteus (Smith, 1844). Page 209 in M. F. Bates, W. R. Branch, A.
M. Bauer, M. Burger, J. Marais, G. J. Alexander, and M. S. De Villiers, editors. Atlas and Red
List of the Reptiles of South Africa, Lesotho and Swaziland. First edition. South African
National Biodiversity Institute, Pretoria.
Mouton, P. L. F. N., A. Flemming, M. Bates, and C. Broeckhoven. 2018. The relationship between
generation gland morphology and armour in Dragon Lizards (Smaug): A reassessment of
ancestral states for the Cordylidae. Amphibia Reptilia 39:457–470.
Mouton, P. L. F. N., A. F. Flemming, and C. Broeckhoven. 2014a. Generation gland morphology in
cordylid lizards: An evolutionary perspective. Journal of Morphology 275:456–464.
Mouton, P. L. F. N., A. F. Flemming, and E. M. Kanga. 1999. Grouping behaviour, tail-biting
behaviour and sexual dimorphism in the armadillo lizard (Cordylus cataphractus) from South
Africa. Journal of Zoology 249:1–10.
Mouton, P. L. F. N., J. L. Glover, and A. F. Flemming. 2014b. Solitary individuals in populations of
the group-living lizard Ouroborus cataphractus : voluntary or forced? African Zoology 49:307–
310.
Mouton, P. L. F. N., D. A. J. Van Rensburg, and J. H. Van Wyk. 2010. Epidermal glands in cordylid
lizards, with special reference to generation glands. Zoological Journal of the Linnean Society
158:312–324.
Mouton, P. L. F. N., and J. H. Van Wyk. 1997. Adaptive radiation in cordyliform lizards: An
overview. African Journal of Herpetology 46:78–88.
Mucina, L., and M. C. Rutherford. 2006. The vegetation of South Africa, Lesotho and Swaziland.
Page Strelitzia 19. South African National Biodiversity Institute, Pretoria.
Munch, K. L., D. W. A. Noble, E. Wapstra, and G. M. While. 2018. Mate familiarity and social
learning in a monogamous lizard. Oecologia 188:1–10.
Munguia-Vega, A., R. Rodriguez-Estrella, W. W. Shaw, and M. Culver. 2013. Localized extinction of
an arboreal desert lizard caused by habitat fragmentation. Biological Conservation 157:11–20.
Muñoz-Mendoza, C., G. D’Elía, A. Panzera, M. A. Méndez T., A. Villalobos-Leiva, J. W. Sites, and
P. F. Victoriano. 2017. Geography and past climate changes have shaped the evolution of a
POPULATION GENETICS AND SOCIALITY IN THE SUNGAZER
144
widespread lizard from the Chilean hotspot. Molecular Phylogenetics and Evolution 116:157–
171.
Murphy, M. A., K. C. Kendall, A. Robinson, and L. P. Waits. 2007. The impact of time and field
conditions on brown bear (Ursus arctos) faecal DNA amplification. Conservation Genetics
8:1219–1224.
Murphy, M. A., L. P. Waits, K. C. Kendall, S. K. Wasser, J. A. Higbee, and R. Bogden. 2002. An
evaluation of long-term preservation methods for brown bear (Ursus arctos) faecal DNA
samples. Conservation Genetics 3:435–440.
Nagy, Z. T., U. Joger, M. Wink, F. Glaw, and M. Vences. 2003. Multiple colonization of Madagascar
and Socotra by colubrid snakes: Evidence from nuclear and mitochondrial gene phylogenies.
Proceedings of the Royal Society B: Biological Sciences 270:2613–2621.
Neel, M. C. 2008. Conservation planning and genetic diversity. Pages 281–296 in S. P. Carroll and C.
W. Fox, editors. Conservation Biology: Evolution in Action. Oxford University Press, Inc, New
York.
Nei, M., T. Maruyama, and R. Chakraborty. 1975. The bottleneck effect and genetic variability in
populations. Evolution 29:1–10.
Nei, M., F. Tajima, and T. Yoshio. 1983. Accuracy of estimated phylogenetic trees from molecular
data. Journal of Molecular Evolution 19:153–170.
Nekola, J. C., and P. S. White. 1999. The distance decay of similarity in biogeography and ecology.
Journal of Biogeography 26:867–878.
Nelson-Flower, M. J., P. A. R. Hockey, C. O’Ryan, and A. R. Ridley. 2012. Inbreeding avoidance
mechanisms: Dispersal dynamics in cooperatively breeding southern pied babblers. Journal of
Animal Ecology 81:876–883.
Nelson-Tunley, M., M. Morgan-Richards, and S. A. Trewick. 2016. Genetic diversity and gene flow
in a rare New Zealand skink despite fragmented habitat in a volcanic landscape. Biological
Journal of the Linnean Society 119:37–51.
Nevarez, J. 2009. Chapter 8 - Lizards. Pages 164–206 in M. A. Mitchell and T. N. Tully, editors.
Manual of Exotic Pet Practice. W.B. Saunders, Saint Louis.
Newbery, R. E., and N. H. G. Jacobsen. 1994. Conservation plan: Cordylus giganteus. Unpublished
report to the Chief Directorate of Nature and Environmental Conservation.
Ngwenya, M. P. 2001. Implications of the Medicinal Trade for Nature Conservation in KwaZulu-
Natal. Unpublished Ezimvelo KZN wildlife report no. NA/124/04.
Nieuwoudt, C. J., P. L. F. N. Mouton, and A. F. Flemming. 2003a. Aggregation behaviour and
movement patterns in the large-scaled girdled lizard, Cordylus macropholis. Amphibia Reptilia
24:345–357.
POPULATION GENETICS AND SOCIALITY IN THE SUNGAZER
145
Nieuwoudt, C. J., P. L. F. N. Mouton, and A. F. Flemming. 2003b. Adult male aggression towards
juvenile males in the large-scaled girdled lizard, Cordylus macropholis. Journal of the
Herpetological Association of Africa 52:53–59.
Noël, S., M. Ouellet, P. Galois, and F. J. Lapointe. 2007. Impact of urban fragmentation on the
genetic structure of the eastern red-backed salamander. Conservation Genetics 8:599–606.
Norton, D. A., J. M. Lord, D. R. Given, and P. J. De Lange. 1994. Over-collecting: an overlooked
factor in the decline of plant taxa. Taxon 43:181–185.
Nosil, P., and B. J. Crespi. 2006. Experimental evidence that predation promotes divergence in
adaptive radiation. Proceedings of the National Academy of Sciences of the United States of
America 103:9090–9095.
Nosil, P., and J. L. Feder. 2012. Genomic divergence during speciation: Causes and consequences.
Philosophical Transactions of the Royal Society B: Biological Sciences 367:332–342.
O’Brien, J., C. Mariani, L. Olson, A. L. Russell, L. Say, A. D. Yoder, and T. J. Hayden. 2009.
Multiple colonisations of the western Indian Ocean by Pteropus fruit bats (Megachiroptera:
Pteropodidae): The furthest islands were colonised first. Molecular Phylogenetics and Evolution
51:294–303.
O’Connor, D. E., and R. Shine. 2003. Lizards in “nuclear families”: A novel reptilian social system in
Egernia saxatilis (Scincidae). Molecular Ecology 12:743–752.
O’Connor, D. E., and R. Shine. 2004. Parental care protects against infanticide in the lizard Egernia
saxatilis (Scincidae). Animal Behaviour 68:1361–1369.
O’Connor, D. E., and R. Shine. 2006. Kin discrimination in the social lizard Egernia saxatilis
(Scincidae). Behavioral Ecology 17:206–211.
O’Grady, J. J., B. W. Brook, D. H. Reed, J. D. Ballou, D. W. Tonkyn, and R. Frankham. 2006.
Realistic levels of inbreeding depression strongly affect extinction risk in wild populations.
Biological Conservation 133:42–51.
Odierna, G., A. Canapa, F. Andreone, G. Aprea, M. Barucca, T. Capriglione, and E. Olmo. 2002. A
phylogenetic analysis of cordyliformes (Reptilia: Squamata): Comparison of molecular and
karyological data. Molecular Phylogenetics and Evolution 23:37–42.
Ogden, R. 2008. Fisheries forensics: The use of DNA tools for improving compliance, traceability
and enforcement in the fishing industry. Fish and Fisheries 9:462–472.
Ogden, R., and A. Linacre. 2015. Wildlife forensic science: A review of genetic geographic origin
assignment. Forensic Science International: Genetics 18:152–159.
De Oliveira, D. P. S., and R. G. Cawthorn. 1999. Dolerite intrusion morphology at Mujba Colliery,
northeast Karoo Basin, Republic of South Africa. International Journal of Coal Geology 41:333–
349.
POPULATION GENETICS AND SOCIALITY IN THE SUNGAZER
146
Olivera-Tlahuel, C., H. A. Pérez-Mendoza, J. Jaime Zúñiga-Vega, L. C. Rubio-Rocha, B. C. Bock, R.
I. Rojas-González, J. G. Zamora-Abrego, E. Alzate, A. M. Ortega-León, R. J. Maceda-Cruz, F.
R. Méndez-de la Cruz, H. H. Siliceo-Cantero, and R. Serna-Lagunes. 2017. Effect of toe-clipping
on the survival of several lizard species. Herpetological Journal 27:266–275.
Olsen, M. T., L. W. Andersen, R. Dietz, J. Teilmann, T. Härkönen, and H. R. Siegismund. 2014.
Integrating genetic data and population viability analyses for the identification of harbour seal
(Phoca vitulina) populations and management units. Molecular Ecology 23:815–831.
Omote, K., C. Nishida, T. Takenaka, K. Saito, R. Shimura, S. Fujimoto, T. Sato, and R. Masuda.
2015. Recent fragmentation of the endangered Blakiston’s fish owl (Bubo blakistoni) population
on Hokkaido Island, Northern Japan, revealed by mitochondrial dna and microsatellite analyses.
Zoological Letters 1:16.
Van Oosterhout, C., W. F. Hutchinson, D. P. M. Wills, and P. Shipley. 2004. MICRO-CHECKER:
Software for identifying and correcting genotyping errors in microsatellite data. Molecular
Ecology Notes 4:535–538.
Overton, L. C., and D. D. Rhoads. 2004. Molecular phylogenetic relationships based on mitochondrial
and nuclear gene sequences for the Todies (Todus, Todidae) of the Caribbean. Molecular
Phylogenetics and Evolution 32:524–538.
Pabijan, M., K. C. Wollenberg, and M. Vences. 2012. Small body size increases the regional
differentiation of populations of tropical mantellid frogs (Anura: Mantellidae). Journal of
Evolutionary Biology 25:2310–2324.
Paquette, S. R., S. M. Behncke, S. H. O’Brien, R. A. Brenneman, E. E. Louis, and F. J. Lapointe.
2007. Riverbeds demarcate distinct conservation units of the radiated tortoise (Geochelone
radiata) in southern Madagascar. Conservation Genetics 8:797–807.
Parris, K. M., S. C. McCall, M. A. McCarthy, B. A. Minteer, K. Steele, S. Bekessy, and F. Medvecky.
2010. Assessing ethical trade-offs in ecological field studies. Journal of Applied Ecology
47:227–234.
Partridge, T. C., and R. R. Maud. 1987. Ceomorphic evolution of southern Africa since the Mesozoic.
South African Journal of Geology 90:179–208.
Parusnath, S. 2012. Natural history note: Smaug giganteus A. Smith, 1844 Predation. African Herp
News 58:13–15.
Parusnath, S. 2014. A conservation assessment of the Sungazer (Smaug giganteus). Masters thesis.
University of the Witwatersrand, South Africa.
Parusnath, S., I. T. Little, M. J. Cunningham, R. Jansen, and G. J. Alexander. 2017. The desolation of
Smaug: The human-driven decline of the Sungazer lizard (Smaug giganteus). Journal for Nature
Conservation 36:48–57.
POPULATION GENETICS AND SOCIALITY IN THE SUNGAZER
147
Paterson, A. 2005. Tax incentives - valuable tools for biodiversity conservation in South Africa. South
African Law Journal 122:182–216.
Pauli, J. N., J. P. Whiteman, M. D. Riley, and A. D. Middleton. 2010. Defining non-invasive
approaches for sampling of vertebrates. Conservation Biology 24:349–352.
Paulissen, M. A., and H. A. Meyer. 2000. The effect of toe-clipping on the gecko Hemidactylus
turcicus. Journal of Herpetology 34:282–285.
Pavón-Vázquez, C. J., U. O. García-Vázquez, R. W. Bryson, M. Feria-Ortiz, N. L. Manríquez-Morán,
and A. N. M. de Oca. 2018. Integrative species delimitation in practice: Revealing cryptic
lineages within the short-nosed skink Plestiodon brevirostris (Squamata: Scincidae). Molecular
Phylogenetics and Evolution 129:242–257.
Pawar, S. 2003. Taxonomic Chauvinism and the Methodologically Challenged. BioScience 53:861.
Peakall, R., and P. E. Smouse. 2006. GenAlEx 6: Genetic analysis in Excel. Population genetic
software for teaching and research. Molecular Ecology Notes 6:288–295.
Peakall, R., and P. E. Smouse. 2012. GenAlEx 6.5: Genetic analysis in Excel. Population genetic
software for teaching and research - an update. Bioinformatics 28:2537–2539.
Pearson, S. K., S. S. Tobe, D. A. Fusco, C. M. Bull, and M. G. Gardner. 2014. Piles of scats for piles
of DNA: Deriving DNA of lizards from their faeces. Australian Journal of Zoology 62:507–514.
Pearson, S. K., G. R. Johnston, C. M. Bull, A. L. Fenner, and M. G. Gardner. 2020. Fine‐scale genetic
structuring in a group‐living lizard, the gidgee skink (Egernia stokesii). Austral Ecology 45: 435–
443.
Pellegrino, K. C. M., M. T. Rodrigues, A. N. Waite, M. Morando, Y. Y. Yassuda, and J. W. Sites.
2005. Phylogeography and species limits in the Gymnodactylus darwinii complex (Gekkonidae,
Squamata): Genetic structure coincides with river systems in the Brazilian Atlantic Forest.
Biological Journal of the Linnean Society 85:13–26.
Penman, T. D., D. A. Pike, J. K. Webb, and R. Shine. 2010. Predicting the impact of climate change
on Australia’s most endangered snake, Hoplocephalus bungaroides. Diversity and Distributions
16:109–118.
Perry, G. 1995. The evolutionary ecology of lizard foraging: a comparative study. University of
Texas.
Pertoldi, C., R. Bijlsma, and V. Loeschcke. 2007. Conservation genetics in a globally changing
environment: Present problems, paradoxes and future challenges. Biodiversity and Conservation
16:4147–4163.
Petersen, W., R. E. Newbery, and N. H. G. Jacobsen. 1985. Cordylus giganteus is alive and well and
living at Rietpoort. Fauna & Flora 42:26–29.
Peterson, M. A., and R. F. Denno. 1998. The influence of dispersal and diet breadth on patterns of
genetic isolation by distance in phytophagous insects. The American Naturalist 152:428–446.
POPULATION GENETICS AND SOCIALITY IN THE SUNGAZER
148
Phillips, S. J., R. P. Anderson, and R. E. Schapire. 2006. Maximum entropy modeling of species
geographic distributions. Ecological Modelling 190:231–259.
Phillips, S. J., M. Dudík, and R. E. Schapire. 2004. A maximum entropy approach to species
distribution modeling. Proceedings of the 21st international conference on machine learning.
Pianka, E. R., and L. J. Vitt. 2003. Lizards: windows to the evolution of diversity. University of
California Press, Berkeley, California.
Piggott, M. P., and A. C. Taylor. 2003. Remote collection of animal DNA and its applications in
conservation management and understanding the population biology of rare and cryptic species.
Wildlife Research 30:1–13.
Pincheira-Donoso, D., D. J. Hodgson, and T. Tregenza. 2008. The evolution of body size under
environmental gradients in ectotherms: Why should Bergmann’s rule apply to lizards? BMC
Evolutionary Biology 8:68.
Pincheira-Donoso, D., and S. Meiri. 2013. An intercontinental analysis of climate-driven body size
clines in reptiles: no support for patterns, no signals of processes. Evolutionary Biology 40:562–
578.
Pingali, P., Y. Bigot, and H. P. Binswanger. 1988. Agricultural Mechanization and the Evolution of
Farming Systems in Sub-Saharan Africa. Johns Hopkins University Press. Baltimore, USA.
Pinho, C., and J. Hey. 2010. Divergence with gene flow: models and data. Annual Review of
Ecology, Evolution, and Systematics 41:215–230.
Pinsky, M. L., and S. R. Palumbi. 2014. Meta-analysis reveals lower genetic diversity in overfished
populations. Molecular Ecology 23:29–39.
Pinto, B. J., G. R. Colli, T. E. Higham, A. P. Russell, D. P. Scantlebury, L. J. Vitt, and T. Gamble.
2019. Population genetic structure and species delimitation of a widespread, Neotropical dwarf
gecko. Molecular Phylogenetics and Evolution 133:54–66.
Piza-Roca, C., K. Strickland, N. Kent, and C. H. Frere. 2019. Presence of kin-biased social
associations in a lizard with no parental care: the eastern water dragon (Intellagama lesueurii).
Behavioral Ecology 30:1406–1415.
Poinar, H. N., M. Höss, J. L. Bada, and S. Pääbo. 1996. Amino acid racemization and the preservation
of ancient DNA. Science 272:864–866.
Portik, D. M., A. M. Bauer, and T. R. Jackman. 2010. The phylogenetic affinities of Trachylepis
sulcata nigra and the intraspecific evolution of coastal melanism in the western rock skink.
African Zoology 45:147–159.
Poulakakis, N., M. Russello, D. Geist, and A. Caccone. 2012. Unravelling the peculiarities of island
life: Vicariance, dispersal and the diversification of the extinct and extant giant Galápagos
tortoises. Molecular Ecology 21:160–173.
POPULATION GENETICS AND SOCIALITY IN THE SUNGAZER
149
Pounds, J. A., and J. F. Jackson. 1981. Riverine barriers to gene flow and the differentiation of fence
lizard populations. Evolution 35:516.
Powell, R. A., and G. Proulx. 2003. Trapping and marking terrestrial mammals for research:
Integrating ethics, performance criteria, techniques, and common sense. ILAR Journal 44:259–
276.
Pritchard, J. K., M. Stephens, and P. Donnelly. 2000. Inference of population structure using
multilocus genotype data. Genetics 155:945–959.
Prival, D. B. 2015. Lateral vessel puncture: a new method for drawing blood from small snakes.
Herpetological Review 46:347–349.
Prugh, L. R., K. E. Hodges, A. R. E. Sinclair, and J. S. Brashares. 2008. Effect of habitat area and
isolation on fragmented animal populations. Proceedings of the National Academy of Sciences
105:20770–20775.
Pulgarín-R, P. C., and T. M. Burg. 2012. Genetic signals of demographic expansion in downy
woodpecker (Picoides pubescens) after the last North American glacial maximum. PLoS ONE 7.
Pyron, R. A., F. T. Burbrink, and J. J. Wiens. 2013. A phylogeny and revised classification of
Squamata, including 4161 species of lizards and snakes. BMC Evolutionary Biology 13:93.
Qi, Y., D. W. A. A. Noble, J. Fu, and M. J. Whiting. 2012. Spatial and social organization in a
burrow-dwelling lizard (Phrynocephalus vlangalii) from China. PLoS ONE 7:41130.
Queller, D. C., and K. F. Goodnight. 1989. Estimating relatedness using genetic markers. Evolution
43:258–275.
Quesnelle, P. E., L. Fahrig, and K. E. Lindsay. 2013. Effects of habitat loss, habitat configuration and
matrix composition on declining wetland species. Biological Conservation 160:200–208.
Raeymaekers, J. A. M., L. Lens, F. Van Den Broeck, S. Van Dongen, and F. A. M. Volckaert. 2012.
Quantifying population structure on short timescales. Molecular Ecology 21:3458–3473.
Rambaut, A. 2017. FigTree-version 1.4. 3, a graphical viewer of phylogenetic trees. Computer
program distributed by the author, website: http://tree. bio. ed. ac. uk/software/figtree. [Accessed
14 January 2020]
Rambaut, A., A. J. Drummond, D. Xie, G. Baele, and M. A. Suchard. 2018. Posterior summarisation
in Bayesian phylogenetics using Tracer 1.7. Systematic Biology 00:1–3.
Ratsoavina, F. M., M. Vences, and E. E. Louis. 2012. Phylogeny and phylogeography of the
Malagasy leaf-tailed geckos in the Uroplatus ebenaui group. African Journal of Herpetology
61:143–158.
Reed, J. M., L. S. Mills, J. B. Dunning, E. S. Menges, K. S. McKelvey, R. Frye, S. R. Beissinger, M.
C. Anstett, and P. Miller. 2002. Emerging issues in population viability analysis. Conservation
Biology 16:7–19.
POPULATION GENETICS AND SOCIALITY IN THE SUNGAZER
150
Ribout, C., A. Villers, S. Ruault, V. Bretagnolle, D. Picard, K. Monceau, and B. Gauffre. 2019. Fine-
scale genetic structure in a high dispersal capacity raptor, the Montagu’s harrier (Circus
pygargus), revealed by a set of novel microsatellite loci. Genetica 147:69–78.
Rice, A., and S. Edward. 2017. Conservation genetic assessment of the island night lizard, Xantusia
riversiana, under contemporary and future environmental conditions. Doctoral thesis. University
of California Riverside & San Diego State University.
Richmond, J. Q., D. T. Reid, K. G. Ashton, and K. R. Zamudio. 2009. Delayed genetic effects of
habitat fragmentation on the ecologically specialized Florida sand skink (Plestiodon reynoldsi).
Conservation Genetics 10:1281–1297.
Riley, J. L., D. W. A. Noble, R. W. Byrne, and M. J. Whiting. 2018. Early social environment
influences the behaviour of a family-living lizard. Royal Society Open Science 4: 161082.
Rissler, L. J. 2016. Union of phylogeography and landscape genetics. Proceedings of the National
Academy of Sciences 113:8079–8086.
Rissler, L. J., and J. J. Apodaca. 2007. Adding more ecology into species delimitation: Ecological
niche models and phylogeography help define cryptic species in the black salamander (Aneides
flavipunctatus). Systematic Biology 56:924–942.
Rivera-Ortíz, F. A., R. Aguilar, M. D. C. Arizmendi, M. Quesada, and K. Oyama. 2015. Habitat
fragmentation and genetic variability of tetrapod populations. Animal Conservation 18:249–258.
Rocha, L. A., A. Aleixo, G. Allen, F. Almeda, C. C. Baldwin, M. V. L. Barclay, J. M. Bates, A. M.
Bauer, F. Benzoni, C. M. Berns, M. L. Berumen, D. C. Blackburn, S. Blum, F. Bolaños, R. C. K.
Bowie, R. Britz, R. M. Brown, C. D. Cadena, K. Carpenter, L. M. Ceríaco, P. Chakrabarty, G.
Chaves, J. H. Choat, K. D. Clements, B. B. Collette, A. Collins, J. Coyne, J. Cracraft, T. Daniel,
M. R. De Carvalho, K. De Queiroz, F. Di Dario, R. Drewes, J. P. Dumbacher, A. Engilis, M. V.
Erdmann, W. Eschmeyer, C. R. Feldman, B. L. Fisher, J. Fjeldså, P. W. Fritsch, J. Fuchs, A.
Getahun, A. Gill, M. Gomon, T. Gosliner, G. R. Graves, C. E. Griswold, R. Guralnick, K. Hartel,
K. M. Helgen, H. Ho, D. T. Iskandar, T. Iwamoto, Z. Jaafar, H. F. James, D. Johnson, D.
Kavanaugh, N. Knowlton, E. Lacey, H. K. Larson, P. Last, J. M. Leis, H. Lessios, J. Liebherr, M.
Lowman, D. L. Mahler, V. Mamonekene, K. Matsuura, G. C. Mayer, H. Mays, J. McCosker, R.
W. McDiarmid, J. McGuire, M. J. Miller, R. Mooi, R. D. Mooi, C. Moritz, P. Myers, M. W.
Nachman, R. A. Nussbaum, D. Ó. Foighil, L. R. Parenti, J. F. Parham, E. Paul, G. Paulay, J.
Pérez-Eḿan, A. Pérez-Matus, S. Poe, J. Pogonoski, D. L. Rabosky, J. E. Randall, J. D. Reimer,
D. R. Robertson, M. O. Rödel, M. T. Rodrigues, P. Roopnarine, L. Rüber, M. J. Ryan, F.
Sheldon, G. Shinohara, A. Short, W. B. Simison, W. F. Smith-Vaniz, V. G. Springer, M.
Stiassny, J. G. Tello, C. W. Thompson, T. Trnski, P. Tucker, T. Valqui, M. Vecchione, E.
Verheyen, P. C. Wainwright, T. A. Wheeler, W. T. White, K. Will, J. T. Williams, G. Williams,
POPULATION GENETICS AND SOCIALITY IN THE SUNGAZER
151
E. O. Wilson, K. Winker, R. Winterbottom, and C. C. Witt. 2014. Specimen collection: An
essential tool. Science 344:814–815.
Rodrigues, M. T., and F. A. Juncá. 2002. Herpetofauna of the quaternary sand dunes of the middle
Rio São Francisco: Bahia: Brazil. VII.: Typhlops amoipira sp. nov., a possible relative of
Typhlops yonenagae (Serpentes, Typhlopidae). Papéis Avulsos de Zoologia 42:325–333.
Rodríguez-Estrella, R., and M. C. B. Moreno. 2006. Rare, fragile species, small populations, and the
dilemma of collections. Biodiversity and Conservation 15:1621–1625.
Roeder, A. D., F. I. Archer, H. N. Poinar, and P. A. Morin. 2004. A novel method for collection and
preservation of faeces for genetic studies. Molecular Ecology Notes 4:761–764.
Rolland, J., D. Silvestro, D. Schluter, A. Guisan, O. Broennimann, and N. Salamin. 2018. The impact
of endothermy on the climatic niche evolution and the distribution of vertebrate diversity. Nature
Ecology and Evolution 2:459–464.
Ronquist, F. 1997. Dispersal-vicariance analysis: A new approach to the quantification of historical
biogeography. Systematic Biology 46:195–03.
Ronquist, F., M. Teslenko, P. Van Der Mark, D. L. Ayres, A. Darling, S. Höhna, B. Larget, L. Liu, M.
A. Suchard, and J. P. Huelsenbeck. 2012. Mrbayes 3.2: Efficient bayesian phylogenetic inference
and model choice across a large model space. Systematic Biology 61:539–542.
Rose, B. 1982. Lizard home ranges: methodology and functions. Journal of Herpetology 16:253–269.
Rosen, D. E. 1978. Vicariant patterns and historical explanation in biogeography. Systematic Zoology
27:159–188.
Rouget, M., R. M. Cowling, A. T. Lombard, A. T. Knight, and G. I. H. Kerley. 2006. Designing large-
scale conservation corridors for pattern and process. Conservation Biology 20:549–561.
Rouget, M., B. Reyers, Z. Jonas, P. Desmet, A. Driver, K. Maze, B. Egoh, and R. M. Cowling. 2004.
South African National Spatial Biodiversity Assessment - Volume 1 : Terrestrial Component
1:88. Strelitzia 17, South African National Biodiversity Institute, Pretoria.
Rousset, F. 2008. genepop’007: a complete re-implementation of the genepop software for Windows
and Linux. Molecular ecology resources 8:103–106.
Row, J. R., G. Blouin-Demers, and S. C. Lougheed. 2010. Habitat distribution influences dispersal
and fine-scale genetic population structure of eastern foxsnakes (Mintonius gloydi) across a
fragmented landscape. Molecular Ecology 19:5157–5171.
Ruddock, L. 2000. Social structure of the lizard, Cordylus giganteus. University of Stellenbosch,
Stellenbosch, South Africa.
Ruiz-González, A., M. J. Madeira, E. Randi, F. Urra, and B. J. Gómez-Moliner. 2013. Non-invasive
genetic sampling of sympatric marten species (Martes martes and Martes foina): Assessing
species and individual identification success rates on faecal DNA genotyping. European Journal
of Wildlife Research 59:371–386.
POPULATION GENETICS AND SOCIALITY IN THE SUNGAZER
152
Russello, M. A., M. D. Waterhouse, P. D. Etter, and E. A. Johnson. 2015. From promise to practice:
pairing non-invasive sampling with genomics in conservation. PeerJ 3:e1106.
Russo, D., L. Ancillotto, A. C. Hughes, A. Galimberti, and E. Mori. 2017. Collection of voucher
specimens for bat research: conservation, ethical implications, reduction, and alternatives.
Mammal Review 47:237–246.
Rutland, C. S., P. Cigler, and V. Kubale Dvojmoč. 2019. Reptilian skin and its special histological
structures. Veterinary Anatomy and Physiology. InTech.
Sage, R. D., and J. Wolff. 1986. Pleistocene glaciations, fluctuating ranges, and low genetic
variability in a large mammal (Ovis dalli). Evolution 40:1092–1095.
Saladin, B., W. Thuiller, C. H. Graham, S. Lavergne, L. Maiorano, N. Salamin, and N. E.
Zimmermann. 2019. Environment and evolutionary history shape phylogenetic turnover in
European tetrapods. Nature Communications 10:1–9.
SANBI (South African National Biodiversity Institute). 2015. Non-detriment finding for Smaug
giganteus (Sungazer). Unpublished report. Issued by the Scientific Authority of South Africa.
Saunders, D. A., R. J. Hobbs, and C. R. Margules. 1991. Biological consequences of ecosystem
fragmentation: a review. Conservation Biology 5:18–32.
Scheepers, J. C. 1975. The plant ecology of the Kroonstad and Bethlehem areas of the Highveld
Agricultural Region: Appendices. University of Pretoria.
Scheun, J., D. Greeff, and A. Ganswindt. 2018. Non-invasive monitoring of glucocorticoid metabolite
concentrations in urine and faeces of the Sungazer (Smaug giganteus). PeerJ 2018:1–15.
Schlotterer, C. 2000. Evolutionary dynamics of microsatellite DNA. Chromosoma 109:365–371.
Schoebel, C. N., S. Brodbeck, D. Buehler, C. Cornejo, J. Gajurel, H. Hartikainen, D. Keller, M. Leys,
Š. Říčanová, G. Segelbacher, S. Werth, and D. Csencsics. 2013. Lessons learned from
microsatellite development for nonmodel organisms using 454 pyrosequencing. Journal of
Evolutionary Biology 26:600–611.
Schutz, L., D. Stuart-Fox, and M. J. Whiting. 2007. Does the lizard Platysaurus broadleyi aggregate
because of social factors? Journal of Herpetology 41:354–359.
Schweizer, M., L. Excoffier, and G. Heckel. 2007. Fine-scale genetic structure and dispersal in the
common vole (Microtus arvalis). Molecular Ecology 16:2463–2473.
Scott, I. A. W., J. S. Keogh, and M. J. Whiting. 2004. Shifting sands and shifty lizards: Molecular
phylogeny and biogeography of African flat lizards (Platysaurus). Molecular Phylogenetics and
Evolution 31:618–629.
Sears, M. W., and M. J. Angilletta, Jr. 2004. Body size clines in Sceloporus lizards: Proximate
mechanisms and demographic constraints. Integrative and Comparative Biology 44:433–442.
POPULATION GENETICS AND SOCIALITY IN THE SUNGAZER
153
Segelbacher, G., S. A. Cushman, B. K. Epperson, M. J. Fortin, O. Francois, O. J. Hardy, R.
Holderegger, P. Taberlet, L. P. Waits, and S. Manel. 2010. Applications of landscape genetics in
conservation biology: Concepts and challenges. Conservation Genetics 11:375–385.
Seigel, R. A., J. T. Collins, and S. S. Novak. 1987. Snakes: ecology and evolutionary biology.
Macmillan. New York, USA.
Selinske, M. J., J. Coetzee, K. Purnell, and A. T. Knight. 2015. Understanding the motivations,
satisfaction, and retention of landowners in private land conservation programs. Conservation
Letters 8:282–289.
Selkoe, K. A., and R. J. Toonen. 2006. Microsatellites for ecologists: A practical guide to using and
evaluating microsatellite markers. Ecology Letters 9:615–629.
Serrao, N. R., S. M. Reid, and C. C. Wilson. 2018. Conservation genetics of redside dace
(Clinostomus elongatus): phylogeography and contemporary spatial structure. Conservation
Genetics 19:409–424.
Seutin, G., B. N. White, and P. T. Boag. 1991. Preservation of avian blood and tissue samples for
DNA analyses. Canadian Journal of Zoology 69:82–90.
Sexton, J. P., S. B. Hangartner, and A. A. Hoffmann. 2014. Genetic isolation by environment or
distance: Which pattern of gene flow is most common? Evolution 68:1–15.
Shaffer, H. B., M. Gidiş, E. McCartney-Melstad, K. M. Neal, H. M. Oyamaguchi, M. Tellez, and E.
M. Toffelmier. 2015. Conservation genetics and genomics of amphibians and reptiles. Annual
Review of Animal Biosciences 3:113–138.
Shepard, D. B., A. R. Kuhns, M. J. Dreslik, and C. A. Phillips. 2008. Roads as barriers to animal
movement in fragmented landscapes. Animal Conservation 11:288–296.
Shier, D. M. 2006. Effect of family support on the success of translocated black-tailed prairie dogs.
Conservation Biology 20:1780–1790.
Shine, R. D., and T. Madsen. 1996. Is thermoregulation unimportant for most reptiles? An example
using water pythons (Liasis fuscus) in Tropical Australia. Physiological Zoology 69:252–269.
Shine, R., M. Lemaster, M. Wall, T. Langkilde, and R. Mason. 2004. Why did the snake cross the
road? Effects of roads on movement and location of mates by garter snakes (Thamnophis sirtalis
parietalis). Ecology and Society 9.
Shuttleworth, C. 2006. Ecological relationships between the armadillo lizard, Cordylus cataphractus ,
and the southern harvester termite, Microhodotermes viator. Master of Science. University of
Stellenbosch.
Shuttleworth, C., P. L. F. N. Mouton, and A. van Niekerk. 2013. Climate and the evolution of group-
living behaviour in the armadillo lizard (Ouroborus cataphractus). African Zoology 48:367–373.
POPULATION GENETICS AND SOCIALITY IN THE SUNGAZER
154
Sillero, N., and M. A. Carretero. 2013. Modelling the past and future distribution of contracting
species. The Iberian lizard Podarcis carbonelli (Squamata: Lacertidae) as a case study.
Zoologischer Anzeiger 252:289–298.
Simon, C., F. Frati, A. Beckenbach, B. Crespi, H. Liu, and P. Flook. 1994. Evolution, weighting, and
phylogenetic utility of mitochondrial gene sequences and a compilation of conserved polymerase
chain reaction primers. Annals of the entomological Society of America 87:651–701.
Sinn, D. L., G. M. While, and E. Wapstra. 2008. Maternal care in a social lizard: links between female
aggression and offspring fitness. Animal Behaviour 76:1249–1257.
Slatkin, M. 1985. Gene flow in natural populations. Annual review of ecology and systematics
16:393–430.
Slatkin, M. 1987. Gene flow and the geographic structure of natural populations. Science 236:787–
792.
Slatkin, M. 1993. Isolation by distance in equilibrium and non-equilibrium populations. Evolution
47:264–279.
Slatkin, M., and W. P. Maddison. 1990. Detecting isolation by distance using phylogenies of genes.
Genetics 126:249–260.
Smissen, P. J., J. Melville, J. Sumner, and T. S. Jessop. 2013. Mountain barriers and river conduits:
Phylogeographical structure in a large, mobile lizard (Varanidae: Varanus varius) from eastern
Australia. Journal of Biogeography 40:1729–1740.
Smith, A. L., M. G. Gardner, A. L. Fenner, and C. M. Bull. 2009. Restricted gene flow in the
endangered pygmy bluetongue lizard (Tiliqua adelaidensis) in a fragmented agricultural
landscape. Wildlife Research 36:466–478.
Smith, O., and J. Wang. 2014. When can non-invasive samples provide sufficient information in
conservation genetics studies? Molecular Ecology Resources 14:1011–1023.
Soil Classification Working Group. 1991. Soil Classification: A Taxonomic System for South Africa.
Department of Agricultural Development.
Somers, C. M., C. F. Graham, J. A. Martino, T. R. Frasier, S. L. Lance, L. E. Gardiner, and R. G.
Poulin. 2017. Conservation genetics of the eastern yellow-bellied racer (Coluber constrictor
flaviventris) and bullsnake (Pituophis catenifer sayi): River valleys are critical features for
snakes at northern range limits. PLoS ONE 12:1–14.
Song, W., D. Zhu, Y. Lv, and W. Wang. 2017. Isolation and characterization of 37 polymorphic
microsatellite loci of Megalobrama hoffmanni by next-generation sequencing technology and
cross-species amplification in related species. Journal of Genetics 96:39–45.
Souza, S. M., M. T. Rodrigues, and M. Cohn-Haft. 2013. Are Amazonia rivers biogeographic barriers
for lizards? A study on the geographic variation of the spectacled lizard Leposoma osvaldoi
Avila-Pires (Squamata, Gymnophthalmidae). Journal of Herpetology 47:511–519.
POPULATION GENETICS AND SOCIALITY IN THE SUNGAZER
155
Spear, S. F., C. R. Peterson, M. D. Matocq, and A. Storfer. 2005. Landscape genetics of the blotched
tiger salamander (Ambystoma tigrinum melanostictum). Molecular Ecology 14:2553–2564.
Spiegelhalter, D. J., N. G. Best, B. P. Carlin, and A. Van Der Linde. 2002. Bayesian measures of
model complexity and fit. Journal of the Royal Statistical Society: Series B (Statistical
Methodology) 64:583–639.
Spielman, D., B. W. Brook, and R. Frankham. 2004. Most species are not driven to extinction before
genetic factors impact them. Proceedings of the National Academy of Sciences 101:15261–
15264.
Springer, M. S., R. W. DeBry, C. Douady, H. M. Amrine, O. Madsen, W. W. De Jong, and M. J.
Stanhope. 2001. Mitochondrial versus nuclear gene sequences in deep-level mammalian
phylogeny reconstruction. Molecular Biology and Evolution 18:132–143.
Stahlschmidt, Z. R. 2011. Taxonomic chauvinism revisited: Insight from parental care research. PLoS
ONE 6:6–9.
Stamatakis, A. 2014. RAxML version 8: A tool for phylogenetic analysis and post-analysis of large
phylogenies. Bioinformatics 30:1312–1313.
Stankowich, T., and L. A. Campbell. 2016. Living in the danger zone: Exposure to predators and the
evolution of spines and body armor in mammals. Evolution; international journal of organic
evolution 70:1501–1511.
Stanley, E. L. 2009. Evolutionary relationships within the family Cordylidae (Squamata). Masters
thesis. Villanova University.
Stanley, E. L. 2013. Systematics and morphological diversification of the Cordylidae (Squamata).
Doctoral thesis. American Museum of Natural History.
Stanley, E. L., and M. F. Bates. 2014. Here be dragons: a phylogenetic and biogeographical study of
the Smaug warreni species complex (Squamata: Cordylidae) in southern Africa. Zoological
Journal of the Linnean Society 172:892–909.
Stanley, E. L., A. M. Bauer, T. R. Jackman, W. R. Branch, and P. L. F. N. Mouton. 2011. Between a
rock and a hard polytomy: Rapid radiation in the rupicolous girdled lizards (Squamata:
Cordylidae). Molecular Phylogenetics and Evolution 58:53–70.
Stanton-Jones, W. K. 2018. The development and use of an automated cellular PIT tag reader system
for assessing the activity patterns of the Sungazer (Smaug giganteus). Masters thesis. University
of the Witwatersrand, South Africa.
Stanton-Jones, W. K., S. Parusnath, and G. J. Alexander. 2018. The impact of posture and basking
orientation on thermoregulation in the Sungazer (Smaug giganteus). Journal of Thermal Biology
75:45–53.
POPULATION GENETICS AND SOCIALITY IN THE SUNGAZER
156
Stapleton, M. K., O. Kleven, J. T. Lifjeld, and R. J. Robertson. 2007. Female tree swallows
(Tachycineta bicolor) increase offspring heterozygosity through extrapair mating. Behavioral
Ecology and Sociobiology 61:1725–1733.
Stevenson, R. D. 1985a. Body size and limits to the daily range of body temperature in terrestrial
ectotherms. The American Naturalist 125:102–117.
Stevenson, R. D. 1985b. The relative importance of behavioral and physiological adjustments
controlling body temperature in terrestrial ectotherms. The American Naturalist 126:362–386.
Stickel, W. H., and J. B. Cope. 1947. The home ranges and wanderings of snakes. American Society
of Ichthyologists and Herpetologists 1947:127–136.
Stillwell, R. C. 2010. Are latitudinal clines in body size adaptive? Oikos 119:1387–1390.
Stoltz, L. P., and J. Blom. 1981. Ekologiese aspekte van die ouvolk (Cordylus giganteus) in die
Oranje Vrystaat. Interne Verslag, Afdeling Natuurbewaring, OVS.
Storfer, A., M. A. Murphy, J. S. Evans, C. S. Goldberg, S. Robinson, S. F. Spear, R. Dezzani, E.
Delmelle, L. Vierling, and L. P. Waits. 2007. Putting the “landscape” in landscape genetics.
Heredity 98:128–142.
Stow, A. J., and P. Sunnucks. 2004. Inbreeding avoidance in Cunningham’s skinks (Egernia
cunninghami) in natural and fragmented habitat. Molecular Ecology 13:443–447.
Stow, A. J., P. Sunnucks, D. A. Briscoe, and M. G. Gardner. 2001. The impact of habitat
fragmentation on dispersal of Cunningham’s skink (Egernia cunninghami): Evidence from allelic
and genotypic analyses of microsatellites. Molecular Ecology 10:867–878.
Strange, R. M., and B. M. Burr. 1997. Intraspecific phylogeography of north american highland
fishes: a test of the pleistocene vicariance hypothesis. Evolution 51:885.
Strickland, K., R. Gardiner, A. J. Schultz, and C. H. Frère. 2014. The social life of eastern water
dragons: Sex differences, spatial overlap and genetic relatedness. Animal Behaviour 97:53–61.
Van Strien, M. J., D. Keller, R. Holderegger, J. Ghazoul, F. Kienast, and J. Bolliger. 2014. Landscape
genetics as a tool for conservation planning: Predicting the effects of landscape change on gene
flow. Ecological Applications 24:327–339.
Sumner, J., T. Jessop, D. Paetkau, and C. Moritz. 2004. Limited effect of anthropogenic habitat
fragmentation on molecular diversity in a rain forest skink, Gnypetoscincus queenslandiae.
Molecular Ecology 13:259–269.
Sunny, A., O. Monroy-Vilchis, M. M. Zarco-González, G. D. Mendoza-Martínez, and D. Martínez-
Gómez. 2015. Genetic diversity and genetic structure of an endemic Mexican Dusky Rattlesnake
(Crotalus triseriatus) in a highly modified agricultural landscape: implications for conservation.
Genetica 143:705–716.
Swets, J. A. 1988. Measuring the accuracy of diagnostic systems. Science 240:1285–1293.
POPULATION GENETICS AND SOCIALITY IN THE SUNGAZER
157
Swofford, D. L. 2002. PAUP*: phylogenetic analysis using parsimony (* and other methods).
Sunderland, MA. Sinauer Associates.
Szulkin, M., and B. C. Sheldon. 2008. Dispersal as a means of inbreeding avoidance in a wild bird
population. Proceedings of the Royal Society B: Biological Sciences 275:703–711.
Szulkin, M., K. V. Stopher, J. M. Pemberton, and J. M. Reid. 2013. Inbreeding avoidance, tolerance,
or preference in animals? Trends in Ecology and Evolution 28:205–211.
Szulkin, M., P. Zelazowski, G. Nicholson, and B. C. Sheldon. 2009. Inbreeding avoidance under
different null models of random mating in the great tit. Journal of Animal Ecology 78:778–788.
Taberlet, P., and G. Luikart. 1999. Non-invasive genetic sampling and individual identification.
Biological Journal of the Linnean Society 68:41–55.
Taberlet, P., G. Luikart, and L. P. Waits. 1999. Noninvasive genetic sampling: Look before you leap.
Trends in Ecology and Evolution 14:323–327.
Tawichasri, P., N. Laopichienpong, L. Chanhome, R. Phatcharakullawarawat, W. Singchat, T.
Koomgun, T. Prasongmaneerut, W. Rerkamnuaychoke, S. Sillapaprayoon, N. Muangmai, S.
Suntrarachun, S. Baicharoen, S. Peyachoknagul, and K. Srikulnath. 2017. Using blood and non-
invasive shed skin samples to identify sex of caenophidian snakes based on multiplex PCR assay.
Zoologischer Anzeiger 271:6–14.
Taylor, H. R., N. Dussex, and Y. van Heezik. 2017. Bridging the conservation genetics gap by
identifying barriers to implementation for conservation practitioners. Global Ecology and
Conservation 10:231–242.
Taylor, M. J. 2006. Biology of cell survival in the cold: The basis for biopreservation of tissues and
organs. CRC Press Boca Raton:15–62.
Templeton, A. R., K. Shaw, E. Routman, and S. K. Davis. 2015. The genetic consequences of habitat
fragmentation. Annals of the Missouri Botanical Garden:13–27.
Tewksbury, J. J., D. J. Levey, N. M. Haddad, S. Sargent, J. L. Orrock, A. Weldon, B. J. Danielson, J.
Brinkerhoff, E. I. Damschen, and P. Townsend. 2002. Corridors affect plants, animals, and their
interactions in fragmented landscapes. Proceedings of the National Academy of Sciences
99:12923–12926.
Thatte, P., A. Joshi, S. Vaidyanathan, and U. Ramakrishnan. 2016. Protected corridors preserve tiger
genetic diversity and minimize extinction into the next century. bioRxiv 3323:081117.
Thomas, M., and P. Gilbert. 2006. Postmortem damage of mitochondrial DNA. Pages 91–115 Human
Mitochondrial DNA and the Evolution of Homo sapiens. Springer.
Thomassen, H. A., T. Fuller, W. Buermann, B. Milá, C. M. Kieswetter, P. Jarrín-V., S. E. Cameron,
E. Mason, R. Schweizer, J. Schlunegger, J. Chan, O. Wang, M. Peralvo, C. J. Schneider, C. H.
Graham, J. P. Pollinger, S. Saatchi, R. K. Wayne, and T. B. Smith. 2011. Mapping evolutionary
POPULATION GENETICS AND SOCIALITY IN THE SUNGAZER
158
process: A multi-taxa approach to conservation prioritization. Evolutionary Applications 4:397–
413.
Thompson, J. D., D. G. Higgins, and T. J. Gibson. 1994. CLUSTAL W: improving the sensitivity of
progressive multiple sequence alignment through sequence weighting, position-specific gap
penalties and weight matrix choice. Nucleic acids research 22:4673–4680.
Thompson, L., and L. Berat. 2014. A history of South Africa, Fourth Edition. Yale University Press.
London, UK.
Thrasher, D. J., B. G. Butcher, L. Campagna, M. S. Webster, and I. J. Lovette. 2018. Double-digest
RAD sequencing outperforms microsatellite loci at assigning paternity and estimating
relatedness: A proof of concept in a highly promiscuous bird. Molecular Ecology Resources
18:953–965.
Tingley, R., and S. Dubey. 2012. Disparity in the timing of vertebrate diversification events between
the northern and southern hemispheres. BMC Evolutionary Biology 12:244.
Tollefsrud, M. M., J. H. Sønstebø, C. Brochmann, Johnsen, T. Skrøppa, and G. G. Vendramin. 2009.
Combined analysis of nuclear and mitochondrial markers provide new insight into the genetic
structure of North European Picea abies. Heredity 102:549–562.
Tolley, K. A., J. S. Makokha, D. T. Houniet, B. L. Swart, and C. A. Matthee. 2009. The potential for
predicted climate shifts to impact genetic landscapes of lizards in the South African Cape
Floristic Region. Molecular Phylogenetics and Evolution 51:120–130.
Tonini, J. F. R., K. H. Beard, R. B. Ferreira, W. Jetz, and R. A. Pyron. 2016. Fully-sampled
phylogenies of squamates reveal evolutionary patterns in threat status. Biological Conservation
204:23–31.
Tournant, P., L. Joseph, K. Goka, and F. Courchamp. 2012. The rarity and overexploitation paradox:
Stag beetle collections in Japan. Biodiversity and Conservation 21:1425–1440.
TRAFFIC. 1980. South Africa to ban export of Sungazer. Traffic International Bulletin 2:41.
Traill, L. W., B. W. Brook, R. R. Frankham, and C. J. A. Bradshaw. 2010. Pragmatic population
viability targets in a rapidly changing world. Biological Conservation 143:28–34.
Turner, D. S., P. A. Holm, E. B. Wirt, and C. R. Schwalbe. 2003. Amphibians and Reptiles of the
Whetstone Mountains, Arizona. The Southwestern Naturalist 48:347–355.
Uetz, P., P. Freed, and J. Hošek (eds.). 2020. The Reptile Database, http://www.reptile-database.org.
[Accessed 27 October 2020]Uezu, A., and J. P. Metzger. 2016. Time-lag in responses of birds to
Atlantic forest fragmentation: Restoration opportunity and urgency. PLoS ONE 11:1–16.
Uller, T., and M. Olsson. 2008. Multiple paternity in reptiles: Patterns and processes. Molecular
Ecology 17:2566–2580.
POPULATION GENETICS AND SOCIALITY IN THE SUNGAZER
159
UNEP (United Nations Environment Programme). 2020. The Species+ Website. Nairobi, Kenya.
Compiled by UNEP-WCMC, Cambridge, UK. www.speciesplus.net. [Accessed 14 January
2020]
Untergasser, A., I. Cutcutache, T. Koressaar, J. Ye, B. C. Faircloth, M. Remm, and S. G. Rozen. 2012.
Primer3-new capabilities and interfaces. Nucleic Acids Research 40:e115.
Vamosi, S. M. 2005. On the role of enemies in divergence and diversification of prey: A review and
synthesis. Canadian Journal of Zoology 83:894–910.
Van De Wal, R. W. E. 1976. Die neerslagklimaat van die Oranje-Vrystaat. Masters thesis. University
of the Orange Free State, Bloemfontein.
Van Wyk, E. 2010. Tax incentives for biodiversity conservation in the Western Cape. Meditari
Accountancy Research 18:58–75.
Van Wyk, J. H. 1988. Sungazer or Giant Girdled Lizard (Cordylus giganteus). South African Red
Data Book –Reptiles and Amphibians. South African National Scientific Programmes Report No.
151. Committee for Nature Conservation National Programme for Ecosystem Research, Pretoria,
South Africa.
Van Wyk, J. H. 1991. Biennial reproduction in the female viviparous lizard Cordylus giganteus.
Amphibia-Reptilia 12:329–342.
Van Wyk, J. H. 1992. Life history and physiological ecology of the lizard, Cordylus giganteus.
Doctoral thesis. University of Cape Town, South Africa.
Van Wyk, J. H. 1994. Physiological changes during the female reproductive cycle of the viviparous
lizard Cordylus giganteus (Sauria: Cordylidae). Herpetologica:480–493.
Van Wyk, J. H. 1995. The male reproductive cycle of the lizard, Cordylus giganteus (Sauria:
Cordylidae). Journal of Herpetology 29:522.
Van Wyk, J. H. 2000. Seasonal variation in stomach contents and diet composition in the large girdled
lizard, Cordylus giganteus (Reptilia: Cordylidae) in the Highveld grasslands of the north-eastern
Free State, South Africa. African Zoology 35:9–27.
Vane-Wright, R. I., C. J. Humphries, and P. H. Williams. 1991. What to protect? Systematics and the
agony of choice. Biological Conservation 55:235–254.
Varvio, S., R. Chakraborty, and M. Nei. 1986. Genetic variation in subdivided populations and
conservation genetics. Heredity 57:189–198.
Vasconcelos, R., J. C. Brito, S. B. Carvalho, S. Carranza, and D. James Harris. 2012. Identifying
priority areas for island endemics using genetic versus specific diversity - The case of terrestrial
reptiles of the Cape Verde Islands. Biological Conservation 153:276–286.
Vawter, L., and W. M. Brown. 1986. Nuclear and mitochondrial DNA comparisons reveal extreme
rate variation in the molecular clock. Science 234:194–196.
POPULATION GENETICS AND SOCIALITY IN THE SUNGAZER
160
Veach, V., A. Moilanen, and E. Di Minin. 2017. Threats from urban expansion, agricultural
transformation and forest loss on global conservation priority areas. PLoS ONE 12:1–14.
Veith, M., J. F. Schmidtler, J. Kosuch, I. Baran, and A. Seitz. 2003. Palaeoclimatic changes explain
Anatolian mountain frog evolution: A test for alternating vicariance and dispersal events.
Molecular Ecology 12:185–199.
Van Veller, M. G. P., D. J. Kornet, and M. Zandee. 2002. A posteriori and a priori methodologies for
testing hypotheses of causal processes in vicariance biogeography. Cladistics 18:207–217.
Vernesi, C., and M. W. Bruford. 2015. Recent developments in molecular tools for conservation.
Population Genetics for Animal Conservation. Cambridge University Press. Cambridge, UK.
Vieira, M. L. C., L. Santini, A. L. Diniz, and C. de F. Munhoz. 2016. Microsatellite markers: What
they mean and why they are so useful. Genetics and Molecular Biology 39:312–328.
Vignal, A., D. Milan, M. SanCristobal, and A. Eggen. 2008. A review on SNPs and other types of
molecular markers. Genetics, selection, evolution 40:241–264.
Visagie, L., P. L. F. N. Mouton, and D. Bauwens. 2005. Experimental analysis of grouping behaviour
in cordylid lizards. Herpetological Journal 15:91–96.
Visagie, L., P. L. F. N. Mouton, and A. F. Flemming. 2002. Intergroup-movement in a group-living
lizard, Cordylus cataphractus, from South Africa. African Journal of Herpetology 51:75–80.
Vitt, L. J., and J. P. Caldwell. 2013. Herpetology: an introductory biology of amphibians and reptiles.
Fourth edition. Academic press. London, UK.
Wagner, A. P., S. Creel, and S. T. Kalinowski. 2006. Estimating relatedness and relationships using
microsatellite loci with null alleles. Heredity 97:336–345.
Wagner, H. H., and M.-J. Fortin. 2013. A conceptual framework for the spatial analysis of landscape
genetic data. Conservation Genetics 14:253–261.
Wang, I. J. 2010. Recognizing the temporal distinctions between landscape genetics and
phylogeography. Molecular Ecology 19:2605–2608.
Wang, I. J., W. K. Savage, and H. Bradley Shaffer. 2009. Landscape genetics and least-cost path
analysis reveal unexpected dispersal routes in the California tiger salamander (Ambystoma
californiense). Molecular Ecology 18:1365–1374.
Ward, A., and M. Webster. 2016. Sociality: The behaviour of group-living animals. Springer
International Publishing. Switzerland.
Wasser, S. K., L. Brown, C. Mailand, S. Mondol, W. Clark, C. Laurie, and B. S. Weir. 2015. Genetic
assignment of large seizures of elephant ivory reveals Africa’s major poaching hotspots. Science
349:84–87.
Watling, J. I., A. J. Nowakowski, M. A. Donnelly, and J. L. Orrock. 2011. Meta-analysis reveals the
importance of matrix composition for animals in fragmented habitat. Global Ecology and
Biogeography 20:209–217.
POPULATION GENETICS AND SOCIALITY IN THE SUNGAZER
161
Weeks, A. R., C. M. Sgro, A. G. Young, R. Frankham, N. J. Mitchell, K. A. Miller, M. Byrne, D. J.
Coates, M. D. B. Eldridge, P. Sunnucks, M. F. Breed, E. A. James, and A. A. Hoffmann. 2011.
Assessing the benefits and risks of translocations in changing environments: A genetic
perspective. Evolutionary Applications 4:709–725.
Welton, L. J., C. D. Siler, C. W. Linkem, A. C. Diesmos, M. L. Diesmos, E. Sy, and R. M. Brown.
2013. Dragons in our midst: Phyloforensics of illegally traded Southeast Asian monitor lizards.
Biological Conservation 159:7–15.
While, G. M., D. G. Chapple, M. G. Gardner, T. Uller, and M. J. Whiting. 2015. Egernia lizards.
Current Biology 25:R593–R595.
While, G. M., M. G. Gardner, D. G. Chapple, and M. J. Whiting. 2019. Stable social grouping in
lizards. Behavior of Lizards:321–339.
While, G. M., T. Uller, G. Bordogna, and E. Wapstra. 2014. Promiscuity resolves constraints on
social mate choice imposed by population viscosity. Molecular Ecology 23:721–732.
While, G. M., T. Uller, and E. Wapstra. 2009. Family conflict and the evolution of sociality in
reptiles. Behavioral Ecology 20:245–250.
Whiteley, A. R., S. W. Fitzpatrick, W. C. Funk, and D. A. Tallmon. 2015. Genetic rescue to the
rescue. Trends in Ecology and Evolution 30:42–49.
Whiting, M. J., and G. M. While. 2017. Sociality in lizards. In D. R. Rubenstein, P. Abbot (Eds.)
Comparative social evolution (pp. 390–426), Cambridge University Press. Cambridge, UK.
Whiting, M. J., V. L. Williams, and T. J. Hibbitts. 2013. Animals traded for traditional medicine at the
faraday market in South Africa: Species diversity and conservation implications. Animals in
Traditional Folk Medicine: Implications for Conservation 284:421–473.
Whiting, M. J., F. Xu, F. Kar, J. L. Riley, R. W. Byrne, and D. W. A. Noble. 2018. Evidence for
social learning in a family living lizard. Frontiers in Ecology and Evolution 6:70.
Whitlock, M. C., and D. E. McCauley. 1999. Indirect measures of gene flow and migration: FST does
not equal to 1/(4Nm + 1). Heredity 82:117–125.
Wiens, J. J., C. A. Kuczynski, X. Hua, and D. S. Moen. 2010. An expanded phylogeny of treefrogs
(Hylidae) based on nuclear and mitochondrial sequence data. Molecular Phylogenetics and
Evolution 55:871–882.
Wilcox, B. A. 1984. In situ conservation of genetic resources: determinants of minimum area
requirements. National Parks: Conservation and Development:639–647.
Wilcox, B. A., and D. D. Murphy. 1985. Conservation strategy: the effects of fragmentation on
extinction. The American Naturalist 125:879–887.
Wiley, E. O. 1988. Vicariance biogeography. Annual Review of Ecology and Systematics 19:513–
542.
POPULATION GENETICS AND SOCIALITY IN THE SUNGAZER
162
Wiley, E. O., and B. S. Lieberman. 2011. Phylogenetics: theory and practice of phylogenetic
systematics. Second edition. John Wiley & Sons, Inc., Hoboken, New Jersey.
Willi, Y., J. Van Buskirk, B. Schmid, and M. Fischer. 2007. Genetic isolation of fragmented
populations is exacerbated by drift and selection. Journal of Evolutionary Biology 20:534–542.
Willoughby, J. R., M. Sundaram, B. K. Wijayawardena, S. J. A. Kimble, Y. Ji, N. B. Fernandez, J. D.
Antonides, M. C. Lamb, N. J. Marra, and J. A. DeWoody. 2015. The reduction of genetic
diversity in threatened vertebrates and new recommendations regarding IUCN conservation
rankings. Biological Conservation 191:495–503.
Wilkinson, A., I. Mandl, T. Bugnyar, and L. Huber. 2010. Gaze following in the red-footed tortoise
(Geochelone carbonaria). Animal Cognition 13:765–769.
Wirminghaus, J. O. 1990. Observations on the behaviour of the cape girdled lizard Cordylus cordylus
(Reptilia: Cordylidae). Journal of Natural History 24:1617–1627.
Wright, J. M., and P. Bentzen. 1994. Microsatellites: genetic markers for the future. Reviews in Fish
Biology and Fisheries 4:384–388.
Wright, S. 1943. Isolation by distance. Genetics 28:114–138.
Wright, S. 1965. The interpretation of population structure by f-statistics with special regard to
systems of mating. Evolution 19:395–420.
Wuster, W., L. Chirio, J.-F. Trape, I. Ineich, K. Jackson, E. Greenbaum, C. Barron, C. Kusamba, Z. T.
Nagy, R. Storey, and others. 2018. Integration of nuclear and mitochondrial gene sequences and
morphology reveals unexpected diversity in the forest cobra (Naja melanoleuca) species complex
in Central and West Africa (Serpentes: Elapidae). Zootaxa 4455:68–98.
Yoder, A. D., and Z. Yang. 2000. Estimation of primate speciation dates using local molecular clocks.
Molecular Biology and Evolution 17:1081–1090.
Zane, L., L. Bargelloni, and T. Patarnello. 2002. Strategies for microsatellite isolation: A review.
Molecular Ecology 11:1–16.
Zhang, D., and G. M. Hewitt. 1996. Nuclear Integrations: Challenges for mtDNA Markers. Trends in
Ecology & Evolution 11:247–251.
Zhao, Z. 2017. A phylogenetic analysis of the tent tortoise Psammobates tentorius (Bell, 1828)
species complex, using molecular and morphological markers. Doctoral thesis. Department of
Zoology and Entomology, University of the Free State.
“I can’t do this, Sam”.
“I know. It’s all wrong. By rights, we shouldn’t even be here. But we are.
It’s like in the great stories, Mr. Frodo. The ones that really mattered. Full of
darkness and danger they were, and sometimes you didn’t want to know the
end… because how could the end be happy? How could the world go back
to the way it was when so much bad happened? But in the end, it’s only a
passing thing, this shadow. Even darkness must pass. A new day will come,
and when the sun shines it will shine out the clearer. Those were the stories
that stayed with you, that meant something. Even if you were too small to
understand why. But I think, Mr. Frodo, I do understand. I know now. Folk
in those stories had lots of chances of turning back, only they didn’t. They
kept going, because they were holding on to something”.
“What are we holding on to, Sam?”
“That there’s some good in this world, Mr. Frodo. And it’s worth fighting
for”.