Embed Size (px)
Citation preview
Portfolio and Strategic Asset Allocation ReviewThe table below illustrates the plan's current target allocation and potential passive asset allocation.
Your plan's assets and liabilities are reviewed periodically during the year and we make changes as needed. We will continue to monitor your plan
and adjust its allocation as necessary.
InvestmentAdvisor Investment Option
CurrentAllocation
PotentialAllocation
Large U.S. Equity 33.00% 33.00%Large Value
Edge Asset Management, Inc. Equity Income Separate Account-R6 3, 12 6.80% 0.00%Principal Global Investors LargeCap Value Separate Account-R6 6.80% 0.00%
Large BlendPrincipal Global Investors LargeCap S&P 500 Index Separate Account-R6 2, 8, 28 5.80% 33.00%
Large GrowthT. Rowe Price/Brown Advisory LargeCap Growth I Separate Account-R6 3, 22 13.60% 0.00%
Small/Mid U.S. Equity 6.00% 6.00%Mid Cap Value
Principal Global/Barrow Hanley MidCap Value III Separate Account-R6 1 2.00% 0.00%Mid Cap Blend
Principal Global Investors MidCap S&P 400 Index Separate Account-R6 1, 2, 10, 26 0.00% 4.00%Mid Cap Growth
Robert Baird/William Blair MidCap Growth III Separate Account-R6 1, 13, 22, 31 2.00% 0.00%Small Value
DFA/Vaughan Nelson/LA Capital SmallCap Value II Separate Account-R6 1, 15, 22 1.00% 0.00%Small Blend
Principal Global Investors SmallCap S&P 600 Index Separate Account-R6 1, 2, 9, 26 0.00% 2.00%Small Growth
AB/CCI/Brown/Emerald SmallCap Growth I Separate Account-R6 1, 3, 22, 33 1.00% 0.00%International Equity 13.00% 13.00%Diversified Emerging Markets
Principal Global Investors International Emerging Markets Separate Account-R6 4 1.60% 1.60%Foreign Large Value
Causeway / Barrow Hanley Overseas Separate Account-R6 4, 15, 22 11.40% 11.40%
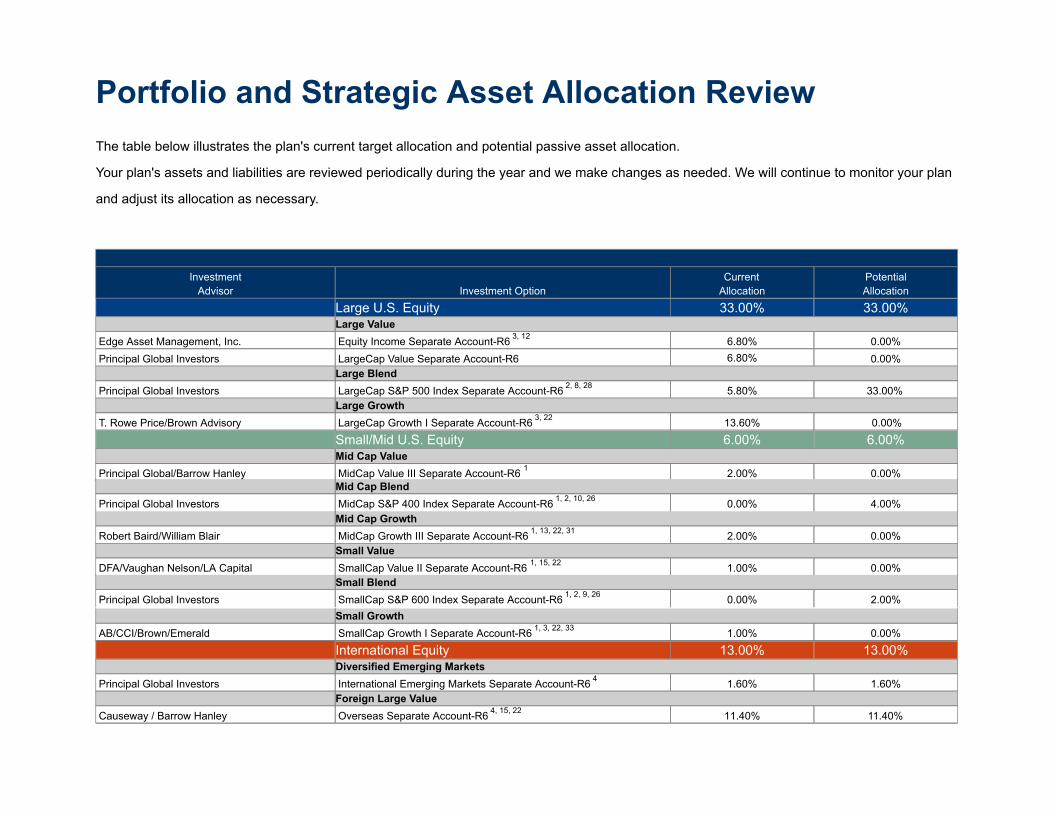
Portfolio and Strategic Asset Allocation Review
InvestmentAdvisor Investment Option
CurrentAllocation
PotentialAllocation
Real Estate 6.00% 6.00%Owned Real Estate
Principal Real Estate Inv U.S. Property Separate Account-R6 25 6.00% 6.00%Balanced/Asset Allocation 2.00% 2.00%Allocation--30% to 50% Equity
Multiple Sub-Advisors Diversified Real Asset Separate Account-R6 3, 12, 24, 28 2.00% 2.00%Fixed Income 40.00% 40.00%High Yield Bond
JP Morgan / Neuberger Berman High Yield I Separate Account-R6 5, 15, 18, 19 4.00% 4.00%Intermediate-Term Bond
Mellon Capital Mgmt Bond Market Index Separate Account-R6 2, 18, 19 9.00% 9.00%Principal Global Investors Core Plus Bond Separate Account-I2 18, 19, 28, 36 27.00% 27.00%
Please see important information at the end of this presentation.
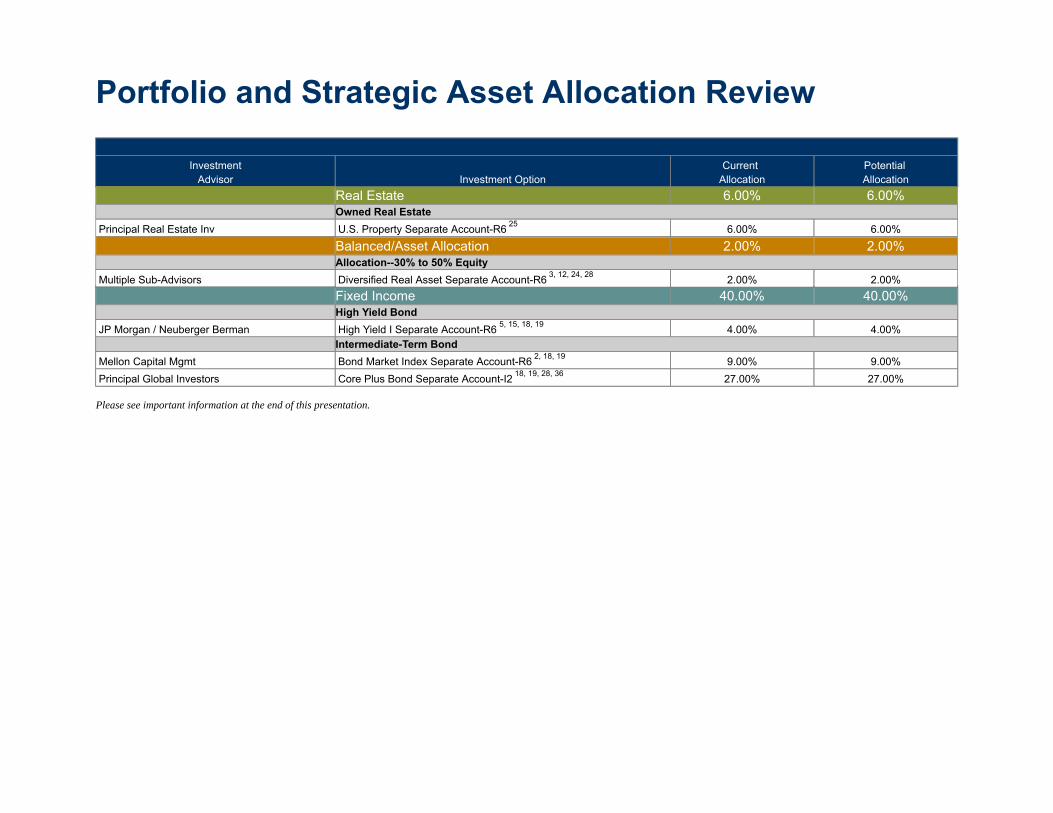
Important InformationSeparate Accounts are available through a group annuity contract with Principal Life Insurance Company. Insurance products and plan administrative, ifapplicable, services are provided by Principal Life Insurance Company, a member of the Principal Financial Group, Des Moines, IA 50392. See the fact sheetfor the full name of the Separate Account. Certain investment options may not be available in all states or U.S. commonwealths. Principal Life InsuranceCompany reserves the right to defer payments or transfers from Principal Life Separate Accounts as described in the group annuity contracts providing access tothe Separate Accounts or as required by applicable law. Such deferment will be based on factors that may include situations such as: unstable or disorderlyfinancial markets; investment conditions which do not allow for orderly investment transactions; or investment, liquidity, and other risks inherent in real estate(such as those associated with general and local economic conditions). If you elect to allocate funds to a Separate Account, you may not be able to immediatelywithdraw them.
+ This is not a sub-advised investment option. Guarantees are backed by all the assets in the Principal Life general account.
++ Investment options sub-advised by Principal Global Investors.
Investment Advisory Services are provided by Principal Financial Advisors, Inc., a registered investment advisor and wholly owned subsidiary of the PrincipalFinancial Group®.
No investment strategy, such as diversification or asset allocation, can guarantee a profit or protect against loss in periods of declining value.
Asset allocation strategies are developed using Separate Accounts available through a group annuity contract of Principal Life Insurance Company.
Before directing retirement funds to a separate account, investors should carefully consider the investment objectives, risks, charges and expenses of theseparate account as well as their individual risk tolerance, time horizon and goals. For additional information contact us at 1-800-547-7754 or by visitingprincipal.com.
Investment options are subject to investment risk. Shares or unit values will fluctuate and investments, when redeemed, may be worth more or less than theiroriginal cost. This does not apply, however, to the guaranteed portions of group annuity contracts issued by Principal Life that constitute guaranteed benefitpolicies as defined in ERISA §401(b)(2)(B).
This report includes investment options that contain information from a variety of sources. A primary source is Morningstar which provides holdingsinformation, operations data, and rankings or statistics proprietary to Morningstar. Morningstar is generally the source of information on mutual fundsunaffiliated with the Principal.
(C) 2016 Morningstar, Inc. All Rights Reserved. Part of the mutual fund data contained herein: (1) is proprietary to Morningstar and/or its content providers:(2) may not be copied or distributed; and (3) is not warranted to be accurate, complete, or timely. Neither Morningstar nor its content providers are responsiblefor any damages or losses arising from any use of this information.
Compliance number: t14092601zk
1. Small-cap and mid-cap investment options are subject to more fluctuation in value and may have additional risks than other investment options with stocksof larger, more stable companies.
2. Each index based investment option is invested in the stocks or bonds of the index it tracks. Performance of indexes reflects the unmanaged results for themarket segment the selected stocks or bonds represent. There is no assurance an index based investment option will match the performance of the index tracked.

3. This Separate Account invests solely in the Institutional class shares of the Principal Funds. All voting rights associated with ownership of shares in themutual fund are the rights of the Separate Account, not of contract holders investing in the Separate Account. For further information on the underlying mutualfund, see the prospectus of the fund.
4. International and global investment options are subject to additional risk due to fluctuating exchange rates, foreign accounting and financial policies, andother economic and political environments.
5. High yield investment options are subject to greater credit risk and volatility that is associated with high yield bonds.
6. This investment option is not guaranteed by the Federal Deposit Insurance Corporation (FDIC), or any other government agency. Although this investmentoption seeks to preserve the value of an investment, it is possible to lose money by investing in this portfolio.
8. S&P 500 is a trademark of The McGraw-Hill Companies, Inc., and has been licensed for use by Principal Life Insurance Company and PrincipalManagement Corporation. The product is not sponsored, endorsed, sold or promoted by Standard & Poor's and Standard & Poor's makes no representationregarding the advisability of investing in the product.
12. These calculated returns reflect the historical performance of the oldest share class of the fund, adjusted to reflect a portion of the fees and expenses of thisshare class. For time periods prior to inception date of the fund, predecessor performance is reflected. Please see the fund's prospectus for more information onspecific expenses, and the fund's most recent shareholder report for actual date of first sale. Expenses are deducted from income earned by the fund. As a result,dividends and investment results will differ for each share class.
13. This Separate Account invests solely in the Institutional class shares of the Principal Funds. All voting rights associated with ownership of shares in themutual fund are the rights of the Separate Account, not of contract holder investing in the Separate Account. For further information on the underlying mutualfund see the prospectus of the fund.
15. This Separate Account invests solely in the Institutional class shares of the Principal Funds. All voting rights associated with ownership of shares in themutual fund are the rights of the Separate Account, not of contract holders investing in the Separate Account. For further information on the underlying mutualfund, see the prospectus of the fund.
16. Equity investment options involve greater risk, including heightened volatility, than fixed-income investment options. Fixed-income investment options aresubject to interest rate risk, and their value will decline as interest rates rise.
17. Asset allocation does not guarantee a profit or protect against a loss. Investing in real estate, small-cap, international, and high-yield investment optionsinvolves additional risks.
18. Fixed-income investment options are subject to interest rate risk, and their value will decline as interest rates rise. Neither the principal of bond investmentoptions nor their yields are guaranteed by the U.S. government.
19. Fixed-income and asset allocation investment options that invest in mortgage securities are subject to increased risk due to real estate exposure.
22. This Separate Account invests solely in the Institutional class share of a mutual fund (Fund) from Principal Funds, Inc. The manager of the Fund, PrincipalManagement Corporation, invests between 10% and 40% of the Fund's assets in common stocks in an attempt to match or exceed the performance of the Fund'sbenchmark index for performance.
24. Fixed-income investment options are subject to interest rate risk, and their value will decline as interest rates rise. Neither the principal of bond investmentoptions nor their yields are guaranteed by the U.S. or any other government entity. Concentrating investments in natural resources industries can be affectedsignificantly by events relating to those industries, such as variations in the commodities markets, weather, disease, embargoes, international, political andeconomic developments, the success of exploration projects, tax and other government regulations and other factors. Investment in derivatives entails specificrisks relating to liquidity, leverage and credit that may reduce returns and/or increase volatility. REIT securities are subject to risk factors associated with thereal estate industry and tax factors of REIT registration. An MLP that invests in a particular industry (e.g., oil and gas) may be harmed by detrimental economicevents within that industry. As partnerships, MLPs may be subject to less regulation (and less protection for investors) under state laws than corporations. Inaddition, MLPs may be subject to state taxation in certain jurisdictions, which may reduce the amount of income paid by an MLP to its investors.
25. This investment option is subject to investment and liquidity risk and other risks inherent in real estate such as those associated with general and localeconomic conditions. If you elect to contribute funds into the U.S. Property Separate Account, withdrawals may be delayed for up to 3 years.
27. The net return experienced may be negative if the costs to maintain and operate the Money Market Separate Account exceed returns. Participants may alsosee negative returns if plan expenses, if applicable, are netted or deducted from their accounts.
28. The risks associated with derivative investments include that the underlying security, interest rate, market index, or other financial asset will not move in thedirection the Investment Adviser and/or Sub-Advisor anticipated, the possibility that there may be no liquid secondary market, the risk that adverse pricemovements in an instrument can result in a loss substantially greater than a fund's initial investment, the possibility that the counterparty may fail to perform itsobligations; and the inability to close out certain hedged positions to avoid adverse tax consequences.
31. Effective January 13, 2014, this portfolio is sub-advised by Baird and William Baird and William Blair. Prior to January 13, 2014, this portfolio wassub-advised by Turner and Jacobs Levy. The portfolio has had various sub-advisors since its inception. Performance results displayed reflect all sub-advisorsmanaging this portfolio during the time periods displayed.
33. Effective April 25, 2014, Emerald was added as an additional sub-advisor. Performance results displayed reflect all sub-advisors managing this portfolioduring the time periods displayed.
36. Formerly known as Bond and Mortgage Separate Account.
Benchmark Descriptions
Balanced Strategy Composite Index is composed of 30% Russell 1000 Index, 4% Russell 2500 Index, 14% MSCI EAFE Index, 3% MSCI Emerging MarketsIndex, 4% MSCI World Index, 5% NAREIT Equity Index, and 40% Barclays Capital Aggregate Bond Index.
Barclays Aggregate Bond Index represents securities that are domestic, taxable, and dollar denominated. The index covers the U.S. investment grade fixed ratebond market, with index components for government and corporate securities, mortgage pass-through securities, and asset-backed securities. These majorsectors are subdivided into more specific indices that are calculated and reported on a regular basis.
Barclays Treasury Bellwethers 3 Month Index is composed of public obligations of the U. S. Treasury with a maturity of three months.
Barclays U.S. Corporate High Yield Index is an unmanaged index constructed to mirror the characteristics of the high yield bond market.
Barclays US Corp High Yld 2% Issuer Capped Index is an unmanaged index comprised of fixed rate, non-investment grade debt securities that are dollardenominated. The index limits the maximum exposure to any one issuer to 2%.
Blended Real Asset Index through September 30, 2011, is as follows: 75% NFI-ODCE Equal-Weight and 25% MSCI US REIT Index. The NFI-ODCEEqual-Weight is the NCREIF Fund Index-Open End Diversified Core Equity. It is a fund-level equal-weighted, time-weighted return index and includesproperty investments at ownership share, cash balances and Leverage. The return series is net of the average fee charged by accounts that make up the index.The MSCI US REIT Index is a capitalization-weighted benchmark index of most actively traded Real Estate Investment Trusts (REITs), designed to measure realestate performance. Effective October 1, 2011, the Blended Real Asset Index is comprised of 100% Consumer Price Index (CPI) plus 1.5%. Consumer PriceIndex is a measure that examines the weighted average of prices of a basket of consumer goods and services, such as transportation, food and medical care. TheCPI is calculated by taking price changes for each item in the predetermined basket of goods and averaging them; the goods are weighted according to theirimportance. Changes in CPI are used to assess price changes associated with the cost of living.
Conservative Strategy Composite Index is composed of 11% Russell 1000 Index, 4% MSCI EAFE Index, 2% MSCI World Index, 3% NAREIT Equity Index, 60%Barclays Capital Aggregate Bond Index, and 20% Merrill Lynch US Treasury 1-3 year Index.
Diversified Real Asset Blended Index is composed of 35% Barclays U.S. Treasury TIPS Index, 20% S&P Global Infrastructure Index, 20% S&P Global NaturalResources Index, 15% Bloomberg Commodity Index, and 10% FTSE EPRA/NAREIT Developed Markets Index.
FTSE EPRA/NAREIT Developed Index is designed to represent general trends in eligible real estate equities worldwide.
FTSE EPRA/NAREIT Developed Index NR is designed to represent general trends in eligible real estate equities worldwide.
Growth Strategy Composite Index is composed of 41% Russell 1000 Index, 6% Russell 2500 Index, 17% MSCI EAFE Index, 4% MSCI Emerging Markets Index,6% MSCI World Index, 6% NAREIT Equity Index, and 20% Barclays Capital Aggregate Bond Index.
Moderate Strategy Composite Index is composed of 20% Russell 1000 Index, 3% Russell 2500 Index, 9% MSCI EAFE Index, 2% MSCI Emerging Markets Index,3% MSCI World Index, 3% NAREIT Equity Index, and 60% Barclays Capital Aggregate Bond Index.
MSCI - EAFE Index NDTR D is listed for foreign stock funds (EAFE refers to Europe, Australia, and Far East). Widely accepted as a benchmark forinternational stock performance, the EAFE Index is an aggregate of 21 individual country indexes.
MSCI - Emerging Markets NDTR D Index measures equity market performance in the global emerging markets. It consists of 26 emerging market countries inEurope, Latin America and the Pacific Basin.
MSCI EAFE Value Index is a subset of the MSCI EAFE Index, which is an unmanaged index that measures the stock returns of companies in developedeconomies outside of North America. The MSCI EAFE Value Index consists of securities classified by MSCI as most representing the value style.
MSCI US REIT Index is a capitalization-weighted benchmark index of most actively traded Real Estate Investment Trusts (REITs), designed to measure realestate performance.
NFI-ODCE Equal-Weight is the NCREIF Fund Index - Open End Diversified Core Equity. It is a fund-level equal-weighted, time-weighted return index andincludes property investments at ownership share, cash balances and leverage. The return series is net of the average fee charged by accounts that make up theindex.
Russell 1000 Growth Index is a market-capitalization weighted index of those firms in the Russell 1000 with higher price-to-book ratios and higher forecastedgrowth values.
Russell 1000 Index consists of the 1000 largest companies within the Russell 3000 index. Also known as the Market-Oriented Index, because it represents thegroup of stocks from which most active money managers choose.
Russell 1000 Value Index is a market-capitalization weighted index of those firms in the Russell 1000 with lower price-to-book ratios and lower forecastedgrowth values.
Russell 2000 Growth Index is a market-weighted total return index that measures the performance of companies within the Russell 2000 Index having higherprice-to-book ratio and higher forecasted growth values.
Russell 2000 Index consists of the smallest 2000 companies in the Russell 3000 Index, representing approximately 10% of the Russell 3000 total marketcapitalization.
Russell 2000 Value Index is a market-weighted total return index that measures the performance of companies within the Russell 2000 Index having lowerprice-to-book ratios and lower forecasted growth values.
Russell Midcap Growth Index is a market-weighted total return index that measures the performance of companies within the Russell Midcap Index havinghigher price-to-book ratios and higher forecasted growth values.
Russell Midcap Index includes firms 201 through 1000, based on market capitalization, from the Russell 3000 Index.
Russell Midcap Value Index is a market-weighted total return index that measures the performance of companies within the Russell Midcap index having lowerprice-to-book ratios and lower forecasted growth values.
Standard & Poor's 1500 Total Market Stock Index is an index of small, medium and large stocks. It is comprised of stocks from the Standard & Poor's 500, 400and 600 stock indices.
Standard & Poor's 500 Index is a market capitalization-weighted index of 500 widely held stocks often used as a proxy for the stock market.
The Russell 3000 Index is constructed to provide a comprehensive barometer of the broad market and accounts for nearly 98% of the total value of all equitytraded on the U.S. exchanges. It measures the stocks that are also members of either the Russell 1000 or the Russell 2000 indexes.