Embed Size (px)
Citation preview
PORTFOLIO USCAN REPORT
Portfolio detailsPortfolio name: Blend Managed Portfolio 5
Portfolio currency: GBP
Fund range: Unit Trust/OEIC
Report generated date: 01.07.2020
Performance start date: 26.02.2014
Performance end date: 30.06.2020
Selected benchmark: Weighted Sector Average
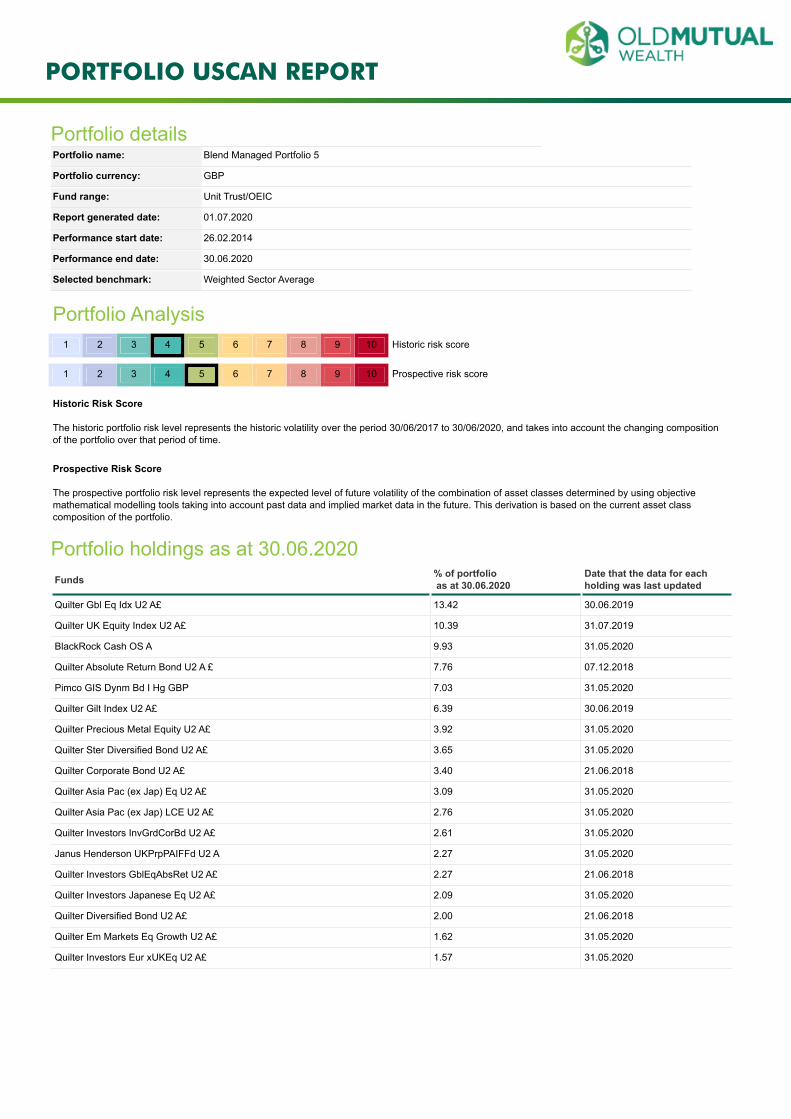
Portfolio Analysis1 2 3 4 5 6 7 8 9 10 Historic risk score
1 2 3 4 5 6 7 8 9 10 Prospective risk score
Historic Risk Score
The historic portfolio risk level represents the historic volatility over the period 30/06/2017 to 30/06/2020, and takes into account the changing compositionof the portfolio over that period of time.
Prospective Risk Score
The prospective portfolio risk level represents the expected level of future volatility of the combination of asset classes determined by using objectivemathematical modelling tools taking into account past data and implied market data in the future. This derivation is based on the current asset classcomposition of the portfolio.
Portfolio holdings as at 30.06.2020Funds % of portfolio
as at 30.06.2020Date that the data for eachholding was last updated
Quilter Gbl Eq Idx U2 A£ 13.42 30.06.2019
Quilter UK Equity Index U2 A£ 10.39 31.07.2019
BlackRock Cash OS A 9.93 31.05.2020
Quilter Absolute Return Bond U2 A £ 7.76 07.12.2018
Pimco GIS Dynm Bd I Hg GBP 7.03 31.05.2020
Quilter Gilt Index U2 A£ 6.39 30.06.2019
Quilter Precious Metal Equity U2 A£ 3.92 31.05.2020
Quilter Ster Diversified Bond U2 A£ 3.65 31.05.2020
Quilter Corporate Bond U2 A£ 3.40 21.06.2018
Quilter Asia Pac (ex Jap) Eq U2 A£ 3.09 31.05.2020
Quilter Asia Pac (ex Jap) LCE U2 A£ 2.76 31.05.2020
Quilter Investors InvGrdCorBd U2 A£ 2.61 31.05.2020
Janus Henderson UKPrpPAIFFd U2 A 2.27 31.05.2020
Quilter Investors GblEqAbsRet U2 A£ 2.27 21.06.2018
Quilter Investors Japanese Eq U2 A£ 2.09 31.05.2020
Quilter Diversified Bond U2 A£ 2.00 21.06.2018
Quilter Em Markets Eq Growth U2 A£ 1.62 31.05.2020
Quilter Investors Eur xUKEq U2 A£ 1.57 31.05.2020
PORTFOLIO USCAN REPORT
Portfolio detailsPortfolio name: Blend Managed Portfolio 5
Fund range: Unit Trust/OEIC
Portfolio holdings (continued)Funds % of portfolio
as at 30.06.2020Date that the data for eachholding was last updated
Quilter Investors EmgMktEqInc U2 A£ 1.56 08.06.2018
Quilter UK Eq Large-Cap Inc U2 A£ 1.49 30.04.2020
Quilter Investors EmgMktEqty U2 A£ 1.44 28.06.2018
Quilter Investors UKEqOpps U2 A£ 1.17 30.04.2020
Quilter UK Equity U2 A£ 1.16 30.06.2019
Quilter UK Equity Growth U2 A£ 1.07 31.07.2019
Quilter China Equity U2 A£ 1.04 31.05.2020
Quilter Investors EurxUKEqGth U2 A£ 0.98 31.05.2020
Quilter Eur (ex UK) Eq Income U2 A£ 0.96 31.07.2019
Quilter Nat Rs Eq U2 A£ 0.68 30.06.2019
Quilter Sterling Corp Bond U2 A£ 0.68 31.07.2019
Quilter Investors EmgMktBond U2 A£ 0.60 31.07.2019
Quilter Investors Asia Pacific U2 A 0.58 31.05.2018
Quilter UK Equity Income U2 A£ 0.42 30.06.2019
PORTFOLIO USCAN REPORT
Portfolio detailsPortfolio name: Blend Managed Portfolio 5
Fund range: Unit Trust/OEIC
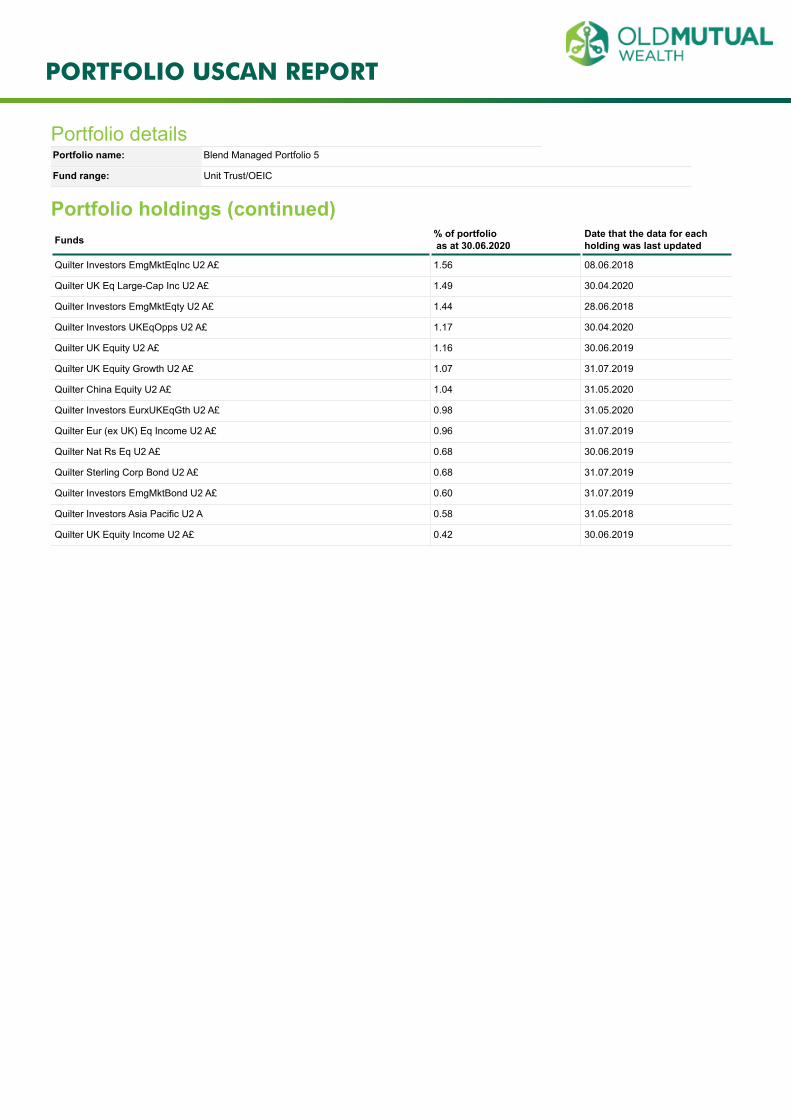
Split by asset classPORTFOLIO: BENCHMARK:
Powered by data from FE
Fixed Interest (22.42%)Unknown (19.01%)UK Equities (15.19%)Asia Pac. Equities (11.88%)Money Market (9.91%)North American Equities (9.21%)European Equities (5.81%)Other (4.46%)Property (1.87%)Int'l Equities (0.24%)
Powered by data from FE
Fixed Interest (25.32%)UK Equities (15.15%)Asia Pac. Equities (13.03%)Money Market (12.37%)Other (12.20%)North American Equities (6.05%)European Equities (5.75%)Unknown (4.60%)Int'l Equities (3.63%)Property (1.90%)
Portfolio breakdown per holding
Name Fixe
dIn
tere
st% U
nkno
wn
% UK
Equi
ties
% Asi
aPa
cific
Equi
ties
% Mon
eyM
arke
t% N
orth
Am
eric
anEq
uitie
s% Eu
rope
anEq
uitie
s% O
ther
% Prop
erty
% Inte
rnat
iona
lEq
uitie
s% To
tal
held
%
BlackRock Cash OS A - - - - 9.93 - - - - - 9.93
Janus Henderson UKPrpPAIFFd U2A - - - - 0.40 - - - 1.87 - 2.27
Pimco GIS Dynm Bd I Hg GBP 8.28 - - - -1.25 - - - - - 7.03
Quilter Absolute Return Bond U2 A£ - 7.76 - - - - - - - - 7.76
Quilter Asia Pac (ex Jap) Eq U2 A£ 0.24 - 0.03 2.68 0.09 - 0.05 - - - 3.09
Quilter Asia Pac (ex Jap) LCE U2A£ - - - 2.69 0.01 - - - - 0.06 2.76
Quilter China Equity U2 A£ - - - 1.02 0.01 0.01 - - - - 1.04
Quilter Corporate Bond U2 A£ - 3.40 - - - - - - - - 3.40
Quilter Diversified Bond U2 A£ - 2.00 - - - - - - - - 2.00
Quilter Em Markets Eq Growth U2A£ - - - 1.24 0.03 - 0.12 0.05 - 0.18 1.62
Quilter Eur (ex UK) Eq Income U2A£ - - - - 0.01 - 0.95 - - - 0.96
Quilter Gbl Eq Idx U2 A£ - - - 2.17 -0.16 9.17 2.24 - - - 13.42
Quilter Gilt Index U2 A£ 6.39 - - - - - - - - - 6.39
Quilter Investors Asia Pacific U2 A - 0.58 - - - - - - - - 0.58
Quilter Investors EmgMktBond U2A£ 0.60 - - - 0.00 - - - - - 0.60
Quilter Investors EmgMktEqInc U2A£ - 1.56 - - - - - - - - 1.56
Quilter Investors EmgMktEqty U2A£ - 1.44 - - - - - - - - 1.44
Quilter Investors Eur xUKEq U2 A£ - - 0.13 - 0.03 0.02 1.39 - - - 1.57
Quilter Investors EurxUKEqGth U2A£ - - 0.02 - 0.02 - 0.94 - - - 0.98
Quilter Investors GblEqAbsRet U2A£ - 2.27 - - - - - - - - 2.27
Quilter Investors InvGrdCorBd U2A£ 2.55 - - - 0.06 - - 0.00 - - 2.61
Subtotal 18.06 19.01 0.18 9.80 9.18 9.20 5.69 0.05 1.87 0.24 73.28
PORTFOLIO USCAN REPORT
Portfolio detailsPortfolio name: Blend Managed Portfolio 5
Fund range: Unit Trust/OEIC
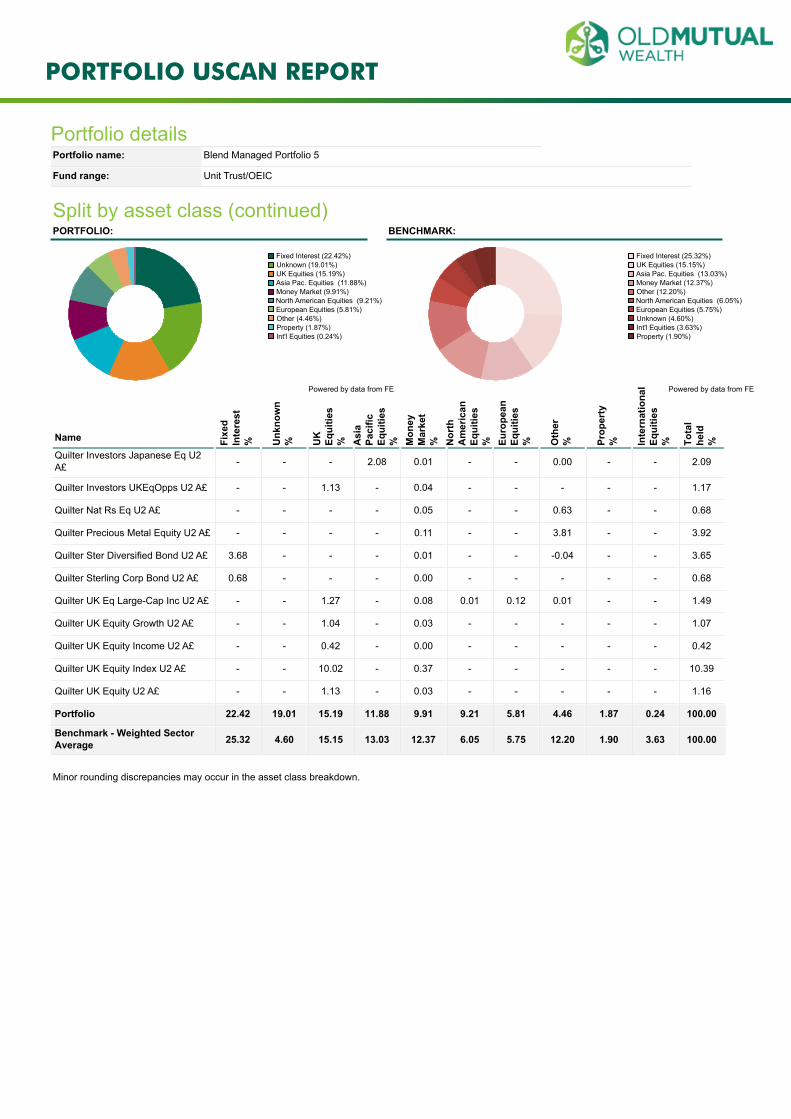
Split by asset class (continued)PORTFOLIO: BENCHMARK:
Powered by data from FE
Fixed Interest (22.42%)Unknown (19.01%)UK Equities (15.19%)Asia Pac. Equities (11.88%)Money Market (9.91%)North American Equities (9.21%)European Equities (5.81%)Other (4.46%)Property (1.87%)Int'l Equities (0.24%)
Powered by data from FE
Fixed Interest (25.32%)UK Equities (15.15%)Asia Pac. Equities (13.03%)Money Market (12.37%)Other (12.20%)North American Equities (6.05%)European Equities (5.75%)Unknown (4.60%)Int'l Equities (3.63%)Property (1.90%)
Name Fixe
dIn
tere
st% U
nkno
wn
% UK
Equi
ties
% Asi
aPa
cific
Equi
ties
% Mon
eyM
arke
t% N
orth
Am
eric
anEq
uitie
s% Eu
rope
anEq
uitie
s% O
ther
% Prop
erty
% Inte
rnat
iona
lEq
uitie
s% To
tal
held
%
Quilter Investors Japanese Eq U2A£ - - - 2.08 0.01 - - 0.00 - - 2.09
Quilter Investors UKEqOpps U2 A£ - - 1.13 - 0.04 - - - - - 1.17
Quilter Nat Rs Eq U2 A£ - - - - 0.05 - - 0.63 - - 0.68
Quilter Precious Metal Equity U2 A£ - - - - 0.11 - - 3.81 - - 3.92
Quilter Ster Diversified Bond U2 A£ 3.68 - - - 0.01 - - -0.04 - - 3.65
Quilter Sterling Corp Bond U2 A£ 0.68 - - - 0.00 - - - - - 0.68
Quilter UK Eq Large-Cap Inc U2 A£ - - 1.27 - 0.08 0.01 0.12 0.01 - - 1.49
Quilter UK Equity Growth U2 A£ - - 1.04 - 0.03 - - - - - 1.07
Quilter UK Equity Income U2 A£ - - 0.42 - 0.00 - - - - - 0.42
Quilter UK Equity Index U2 A£ - - 10.02 - 0.37 - - - - - 10.39
Quilter UK Equity U2 A£ - - 1.13 - 0.03 - - - - - 1.16
Portfolio 22.42 19.01 15.19 11.88 9.91 9.21 5.81 4.46 1.87 0.24 100.00
Benchmark - Weighted SectorAverage 25.32 4.60 15.15 13.03 12.37 6.05 5.75 12.20 1.90 3.63 100.00
Minor rounding discrepancies may occur in the asset class breakdown.
PORTFOLIO USCAN REPORT
Portfolio detailsPortfolio name: Blend Managed Portfolio 5
Fund range: Unit Trust/OEIC
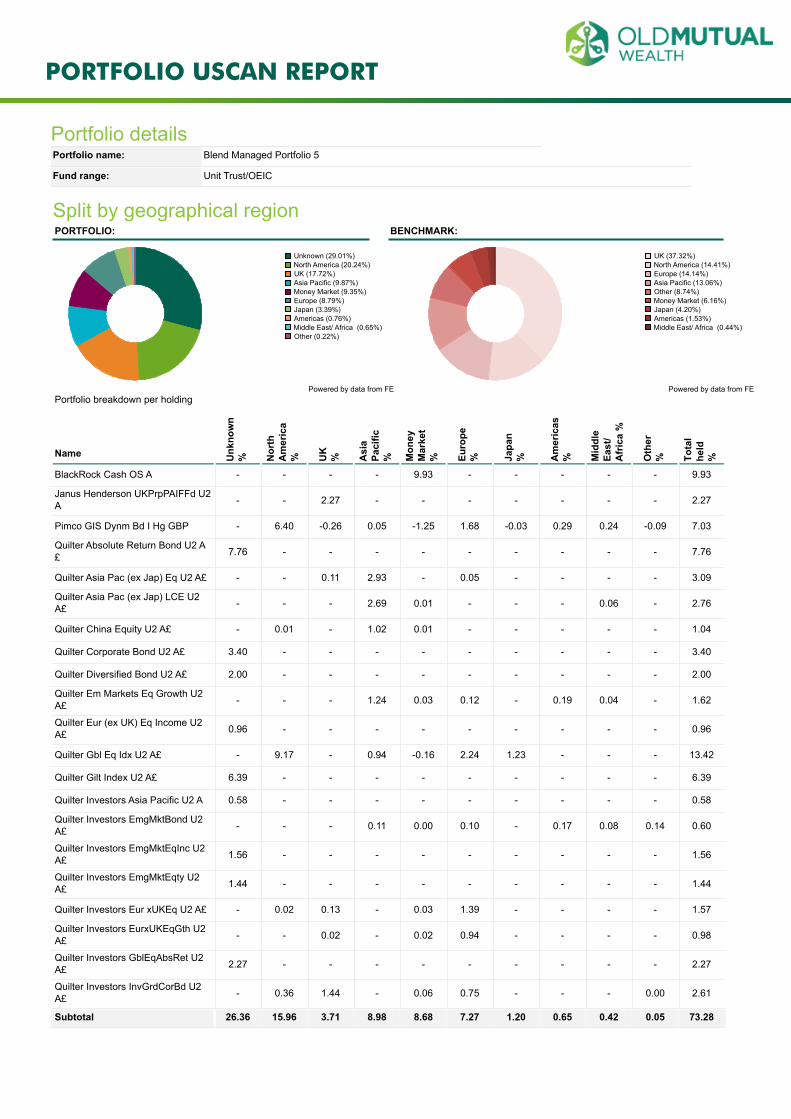
Split by geographical regionPORTFOLIO: BENCHMARK:
Powered by data from FE
Unknown (29.01%)North America (20.24%)UK (17.72%)Asia Pacific (9.87%)Money Market (9.35%)Europe (8.79%)Japan (3.39%)Americas (0.76%)Middle East/ Africa (0.65%)Other (0.22%)
Powered by data from FE
UK (37.32%)North America (14.41%)Europe (14.14%)Asia Pacific (13.06%)Other (8.74%)Money Market (6.16%)Japan (4.20%)Americas (1.53%)Middle East/ Africa (0.44%)
Portfolio breakdown per holding
Name Unk
now
n% N
orth
Am
eric
a% U
K% A
sia
Paci
fic% M
oney
Mar
ket
% Euro
pe% Ja
pan
% Am
eric
as% M
iddl
eEa
st/
Afr
ica
%
Oth
er% To
tal
held
%
BlackRock Cash OS A - - - - 9.93 - - - - - 9.93
Janus Henderson UKPrpPAIFFd U2A - - 2.27 - - - - - - - 2.27
Pimco GIS Dynm Bd I Hg GBP - 6.40 -0.26 0.05 -1.25 1.68 -0.03 0.29 0.24 -0.09 7.03
Quilter Absolute Return Bond U2 A£ 7.76 - - - - - - - - - 7.76
Quilter Asia Pac (ex Jap) Eq U2 A£ - - 0.11 2.93 - 0.05 - - - - 3.09
Quilter Asia Pac (ex Jap) LCE U2A£ - - - 2.69 0.01 - - - 0.06 - 2.76
Quilter China Equity U2 A£ - 0.01 - 1.02 0.01 - - - - - 1.04
Quilter Corporate Bond U2 A£ 3.40 - - - - - - - - - 3.40
Quilter Diversified Bond U2 A£ 2.00 - - - - - - - - - 2.00
Quilter Em Markets Eq Growth U2A£ - - - 1.24 0.03 0.12 - 0.19 0.04 - 1.62
Quilter Eur (ex UK) Eq Income U2A£ 0.96 - - - - - - - - - 0.96
Quilter Gbl Eq Idx U2 A£ - 9.17 - 0.94 -0.16 2.24 1.23 - - - 13.42
Quilter Gilt Index U2 A£ 6.39 - - - - - - - - - 6.39
Quilter Investors Asia Pacific U2 A 0.58 - - - - - - - - - 0.58
Quilter Investors EmgMktBond U2A£ - - - 0.11 0.00 0.10 - 0.17 0.08 0.14 0.60
Quilter Investors EmgMktEqInc U2A£ 1.56 - - - - - - - - - 1.56
Quilter Investors EmgMktEqty U2A£ 1.44 - - - - - - - - - 1.44
Quilter Investors Eur xUKEq U2 A£ - 0.02 0.13 - 0.03 1.39 - - - - 1.57
Quilter Investors EurxUKEqGth U2A£ - - 0.02 - 0.02 0.94 - - - - 0.98
Quilter Investors GblEqAbsRet U2A£ 2.27 - - - - - - - - - 2.27
Quilter Investors InvGrdCorBd U2A£ - 0.36 1.44 - 0.06 0.75 - - - 0.00 2.61
Subtotal 26.36 15.96 3.71 8.98 8.68 7.27 1.20 0.65 0.42 0.05 73.28
PORTFOLIO USCAN REPORT
Portfolio detailsPortfolio name: Blend Managed Portfolio 5
Fund range: Unit Trust/OEIC
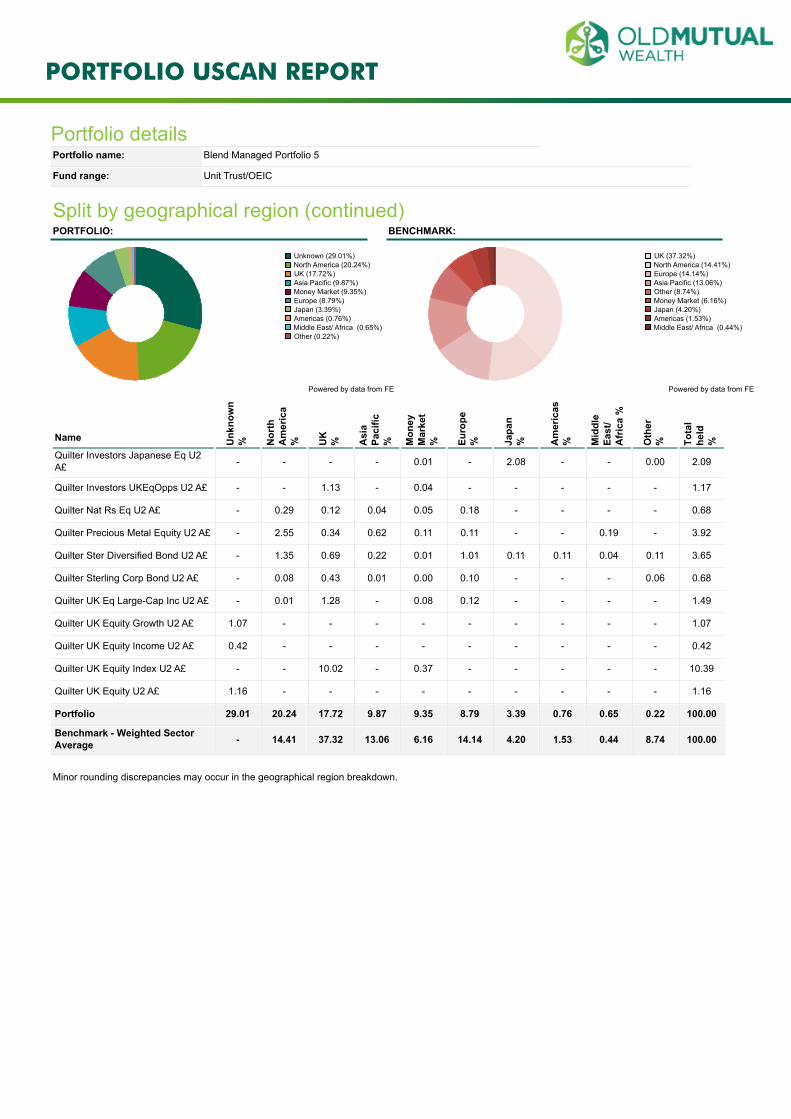
Split by geographical region (continued)PORTFOLIO: BENCHMARK:
Powered by data from FE
Unknown (29.01%)North America (20.24%)UK (17.72%)Asia Pacific (9.87%)Money Market (9.35%)Europe (8.79%)Japan (3.39%)Americas (0.76%)Middle East/ Africa (0.65%)Other (0.22%)
Powered by data from FE
UK (37.32%)North America (14.41%)Europe (14.14%)Asia Pacific (13.06%)Other (8.74%)Money Market (6.16%)Japan (4.20%)Americas (1.53%)Middle East/ Africa (0.44%)
Name Unk
now
n% N
orth
Am
eric
a% U
K% A
sia
Paci
fic% M
oney
Mar
ket
% Euro
pe% Ja
pan
% Am
eric
as% M
iddl
eEa
st/
Afr
ica
%
Oth
er% To
tal
held
%
Quilter Investors Japanese Eq U2A£ - - - - 0.01 - 2.08 - - 0.00 2.09
Quilter Investors UKEqOpps U2 A£ - - 1.13 - 0.04 - - - - - 1.17
Quilter Nat Rs Eq U2 A£ - 0.29 0.12 0.04 0.05 0.18 - - - - 0.68
Quilter Precious Metal Equity U2 A£ - 2.55 0.34 0.62 0.11 0.11 - - 0.19 - 3.92
Quilter Ster Diversified Bond U2 A£ - 1.35 0.69 0.22 0.01 1.01 0.11 0.11 0.04 0.11 3.65
Quilter Sterling Corp Bond U2 A£ - 0.08 0.43 0.01 0.00 0.10 - - - 0.06 0.68
Quilter UK Eq Large-Cap Inc U2 A£ - 0.01 1.28 - 0.08 0.12 - - - - 1.49
Quilter UK Equity Growth U2 A£ 1.07 - - - - - - - - - 1.07
Quilter UK Equity Income U2 A£ 0.42 - - - - - - - - - 0.42
Quilter UK Equity Index U2 A£ - - 10.02 - 0.37 - - - - - 10.39
Quilter UK Equity U2 A£ 1.16 - - - - - - - - - 1.16
Portfolio 29.01 20.24 17.72 9.87 9.35 8.79 3.39 0.76 0.65 0.22 100.00
Benchmark - Weighted SectorAverage - 14.41 37.32 13.06 6.16 14.14 4.20 1.53 0.44 8.74 100.00
Minor rounding discrepancies may occur in the geographical region breakdown.
PORTFOLIO USCAN REPORT
Portfolio detailsPortfolio name: Blend Managed Portfolio 5
Fund range: Unit Trust/OEIC
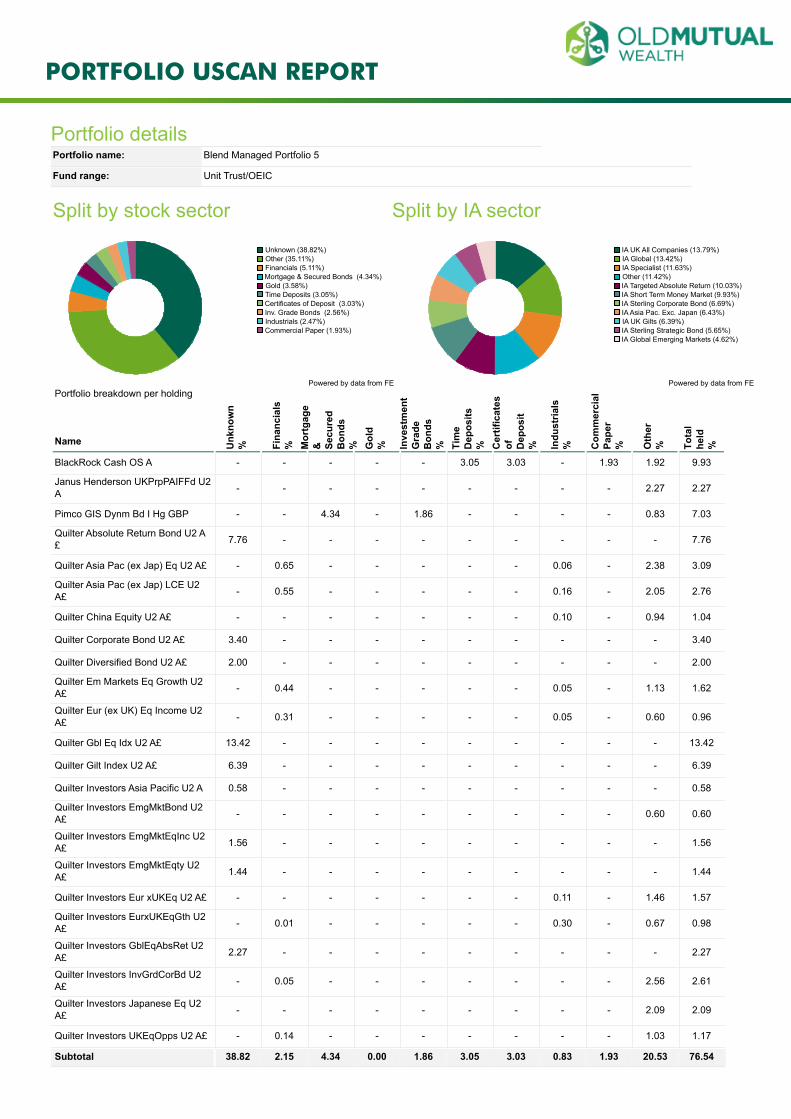
Split by stock sector Split by IA sector
Powered by data from FE
Unknown (38.82%)Other (35.11%)Financials (5.11%)Mortgage & Secured Bonds (4.34%)Gold (3.58%)Time Deposits (3.05%)Certificates of Deposit (3.03%)Inv. Grade Bonds (2.56%)Industrials (2.47%)Commercial Paper (1.93%)
Powered by data from FE
IA UK All Companies (13.79%)IA Global (13.42%)IA Specialist (11.63%)Other (11.42%)IA Targeted Absolute Return (10.03%)IA Short Term Money Market (9.93%)IA Sterling Corporate Bond (6.69%)IA Asia Pac. Exc. Japan (6.43%)IA UK Gilts (6.39%)IA Sterling Strategic Bond (5.65%)IA Global Emerging Markets (4.62%)
Portfolio breakdown per holding
Name Unk
now
n% Fi
nanc
ials
% Mor
tgag
e& Se
cure
dB
onds
% Gol
d% In
vest
men
tG
rade
Bon
ds% Ti
me
Dep
osits
% Cer
tific
ates
of Dep
osit
% Indu
stria
ls% C
omm
erci
alPa
per
% Oth
er% To
tal
held
%
BlackRock Cash OS A - - - - - 3.05 3.03 - 1.93 1.92 9.93
Janus Henderson UKPrpPAIFFd U2A - - - - - - - - - 2.27 2.27
Pimco GIS Dynm Bd I Hg GBP - - 4.34 - 1.86 - - - - 0.83 7.03
Quilter Absolute Return Bond U2 A£ 7.76 - - - - - - - - - 7.76
Quilter Asia Pac (ex Jap) Eq U2 A£ - 0.65 - - - - - 0.06 - 2.38 3.09
Quilter Asia Pac (ex Jap) LCE U2A£ - 0.55 - - - - - 0.16 - 2.05 2.76
Quilter China Equity U2 A£ - - - - - - - 0.10 - 0.94 1.04
Quilter Corporate Bond U2 A£ 3.40 - - - - - - - - - 3.40
Quilter Diversified Bond U2 A£ 2.00 - - - - - - - - - 2.00
Quilter Em Markets Eq Growth U2A£ - 0.44 - - - - - 0.05 - 1.13 1.62
Quilter Eur (ex UK) Eq Income U2A£ - 0.31 - - - - - 0.05 - 0.60 0.96
Quilter Gbl Eq Idx U2 A£ 13.42 - - - - - - - - - 13.42
Quilter Gilt Index U2 A£ 6.39 - - - - - - - - - 6.39
Quilter Investors Asia Pacific U2 A 0.58 - - - - - - - - - 0.58
Quilter Investors EmgMktBond U2A£ - - - - - - - - - 0.60 0.60
Quilter Investors EmgMktEqInc U2A£ 1.56 - - - - - - - - - 1.56
Quilter Investors EmgMktEqty U2A£ 1.44 - - - - - - - - - 1.44
Quilter Investors Eur xUKEq U2 A£ - - - - - - - 0.11 - 1.46 1.57
Quilter Investors EurxUKEqGth U2A£ - 0.01 - - - - - 0.30 - 0.67 0.98
Quilter Investors GblEqAbsRet U2A£ 2.27 - - - - - - - - - 2.27
Quilter Investors InvGrdCorBd U2A£ - 0.05 - - - - - - - 2.56 2.61
Quilter Investors Japanese Eq U2A£ - - - - - - - - - 2.09 2.09
Quilter Investors UKEqOpps U2 A£ - 0.14 - - - - - - - 1.03 1.17
Subtotal 38.82 2.15 4.34 0.00 1.86 3.05 3.03 0.83 1.93 20.53 76.54
PORTFOLIO USCAN REPORT
Portfolio detailsPortfolio name: Blend Managed Portfolio 5
Fund range: Unit Trust/OEIC
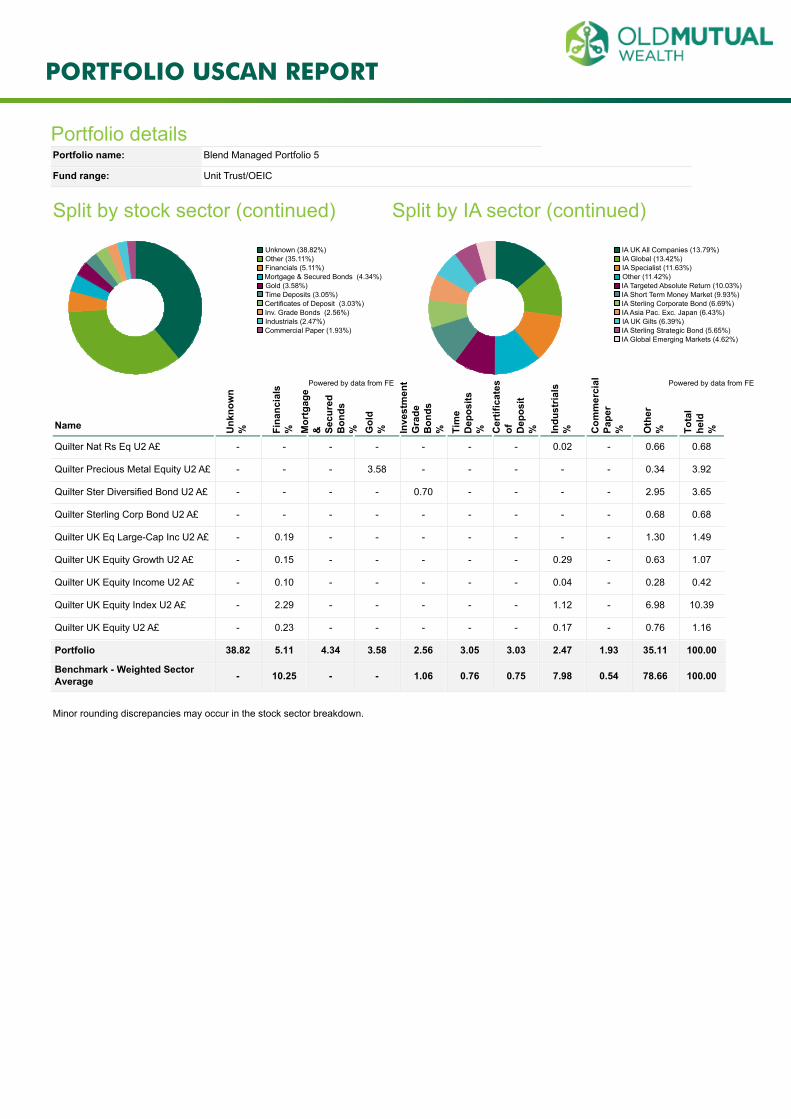
Split by stock sector (continued) Split by IA sector (continued)
Powered by data from FE
Unknown (38.82%)Other (35.11%)Financials (5.11%)Mortgage & Secured Bonds (4.34%)Gold (3.58%)Time Deposits (3.05%)Certificates of Deposit (3.03%)Inv. Grade Bonds (2.56%)Industrials (2.47%)Commercial Paper (1.93%)
Powered by data from FE
IA UK All Companies (13.79%)IA Global (13.42%)IA Specialist (11.63%)Other (11.42%)IA Targeted Absolute Return (10.03%)IA Short Term Money Market (9.93%)IA Sterling Corporate Bond (6.69%)IA Asia Pac. Exc. Japan (6.43%)IA UK Gilts (6.39%)IA Sterling Strategic Bond (5.65%)IA Global Emerging Markets (4.62%)
Name Unk
now
n% Fi
nanc
ials
% Mor
tgag
e& Se
cure
dB
onds
% Gol
d% In
vest
men
tG
rade
Bon
ds% Ti
me
Dep
osits
% Cer
tific
ates
of Dep
osit
% Indu
stria
ls% C
omm
erci
alPa
per
% Oth
er% To
tal
held
%
Quilter Nat Rs Eq U2 A£ - - - - - - - 0.02 - 0.66 0.68
Quilter Precious Metal Equity U2 A£ - - - 3.58 - - - - - 0.34 3.92
Quilter Ster Diversified Bond U2 A£ - - - - 0.70 - - - - 2.95 3.65
Quilter Sterling Corp Bond U2 A£ - - - - - - - - - 0.68 0.68
Quilter UK Eq Large-Cap Inc U2 A£ - 0.19 - - - - - - - 1.30 1.49
Quilter UK Equity Growth U2 A£ - 0.15 - - - - - 0.29 - 0.63 1.07
Quilter UK Equity Income U2 A£ - 0.10 - - - - - 0.04 - 0.28 0.42
Quilter UK Equity Index U2 A£ - 2.29 - - - - - 1.12 - 6.98 10.39
Quilter UK Equity U2 A£ - 0.23 - - - - - 0.17 - 0.76 1.16
Portfolio 38.82 5.11 4.34 3.58 2.56 3.05 3.03 2.47 1.93 35.11 100.00
Benchmark - Weighted SectorAverage - 10.25 - - 1.06 0.76 0.75 7.98 0.54 78.66 100.00
Minor rounding discrepancies may occur in the stock sector breakdown.
PORTFOLIO USCAN REPORT
Portfolio detailsPortfolio name: Blend Managed Portfolio 5
Fund range: Unit Trust/OEIC
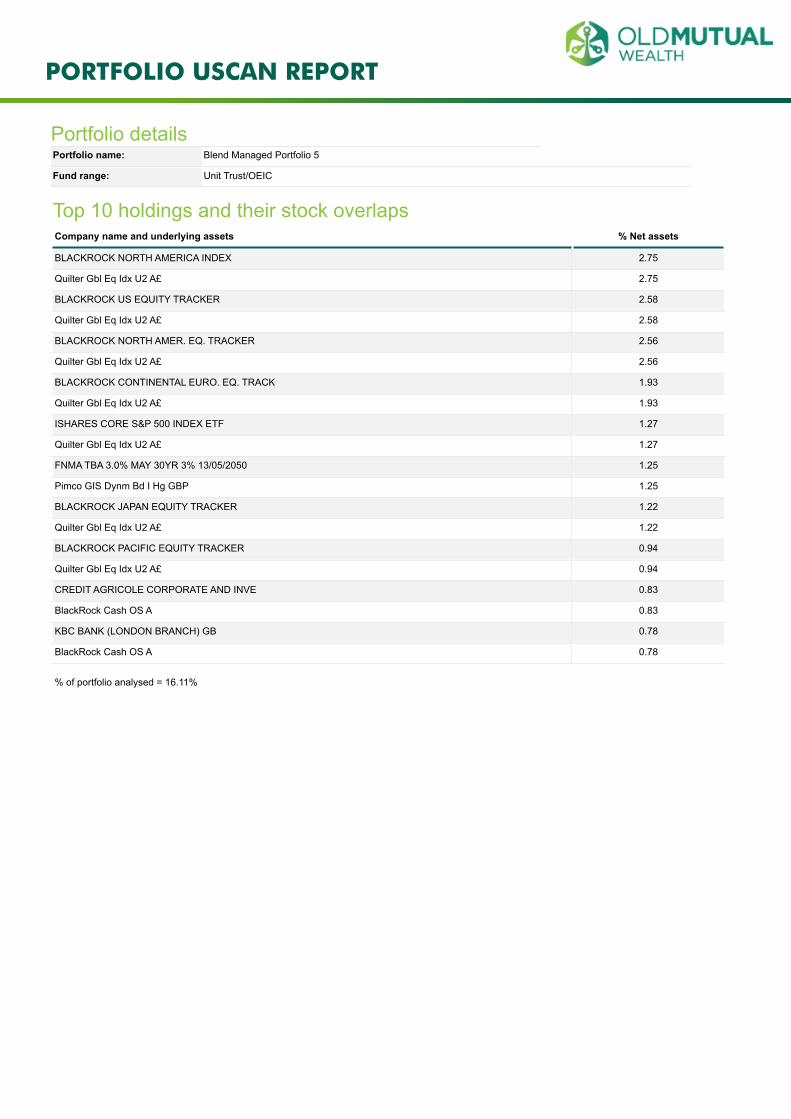
Top 10 holdings and their stock overlapsCompany name and underlying assets % Net assets
BLACKROCK NORTH AMERICA INDEX 2.75
Quilter Gbl Eq Idx U2 A£ 2.75
BLACKROCK US EQUITY TRACKER 2.58
Quilter Gbl Eq Idx U2 A£ 2.58
BLACKROCK NORTH AMER. EQ. TRACKER 2.56
Quilter Gbl Eq Idx U2 A£ 2.56
BLACKROCK CONTINENTAL EURO. EQ. TRACK 1.93
Quilter Gbl Eq Idx U2 A£ 1.93
ISHARES CORE S&P 500 INDEX ETF 1.27
Quilter Gbl Eq Idx U2 A£ 1.27
FNMA TBA 3.0% MAY 30YR 3% 13/05/2050 1.25
Pimco GIS Dynm Bd I Hg GBP 1.25
BLACKROCK JAPAN EQUITY TRACKER 1.22
Quilter Gbl Eq Idx U2 A£ 1.22
BLACKROCK PACIFIC EQUITY TRACKER 0.94
Quilter Gbl Eq Idx U2 A£ 0.94
CREDIT AGRICOLE CORPORATE AND INVE 0.83
BlackRock Cash OS A 0.83
KBC BANK (LONDON BRANCH) GB 0.78
BlackRock Cash OS A 0.78
% of portfolio analysed = 16.11%
PORTFOLIO USCAN REPORT
Portfolio detailsPortfolio name: Blend Managed Portfolio 5
Fund range: Unit Trust/OEIC
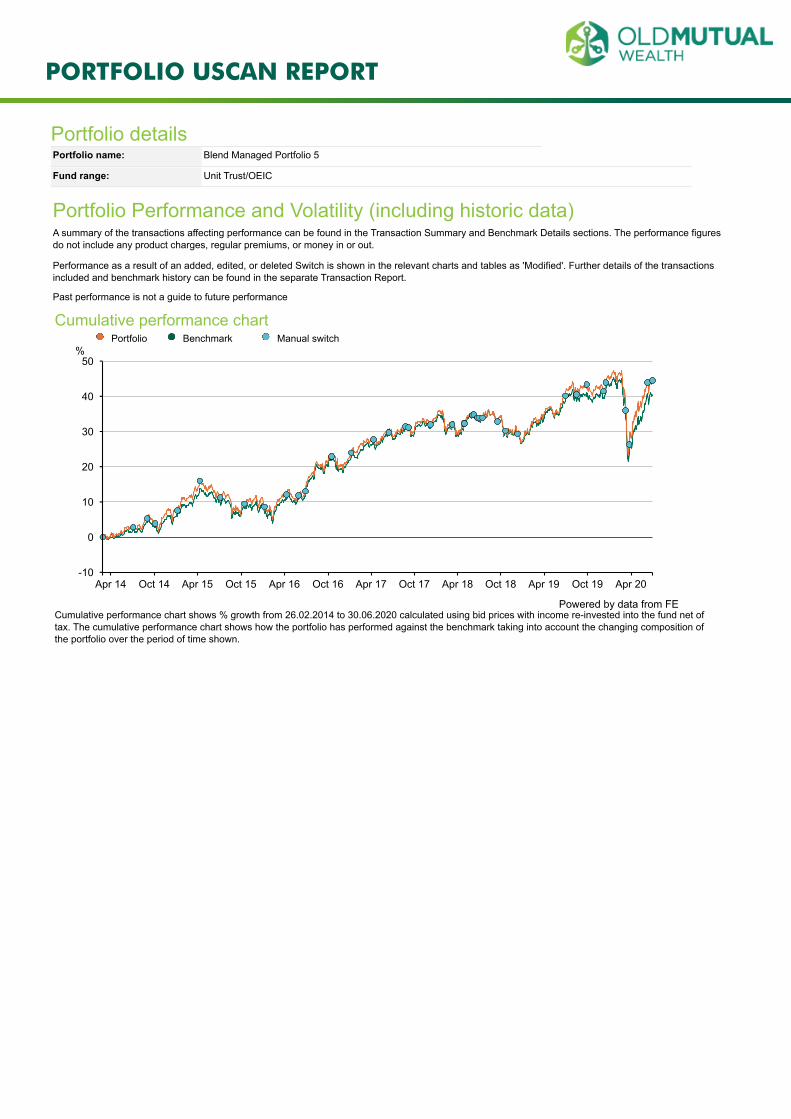
Portfolio Performance and Volatility (including historic data)A summary of the transactions affecting performance can be found in the Transaction Summary and Benchmark Details sections. The performance figuresdo not include any product charges, regular premiums, or money in or out.
Performance as a result of an added, edited, or deleted Switch is shown in the relevant charts and tables as 'Modified'. Further details of the transactionsincluded and benchmark history can be found in the separate Transaction Report.
Past performance is not a guide to future performance
Cumulative performance chartPortfolio Benchmark Manual switch
-10
0
10
20
30
40
50
Apr 14 Oct 14 Apr 15 Oct 15 Apr 16 Oct 16 Apr 17 Oct 17 Apr 18 Oct 18 Apr 19 Oct 19 Apr 20
Powered by data from FE
%
Cumulative performance chart shows % growth from 26.02.2014 to 30.06.2020 calculated using bid prices with income re-invested into the fund net oftax. The cumulative performance chart shows how the portfolio has performed against the benchmark taking into account the changing composition ofthe portfolio over the period of time shown.
PORTFOLIO USCAN REPORT
Portfolio detailsPortfolio name: Blend Managed Portfolio 5
Fund range: Unit Trust/OEIC
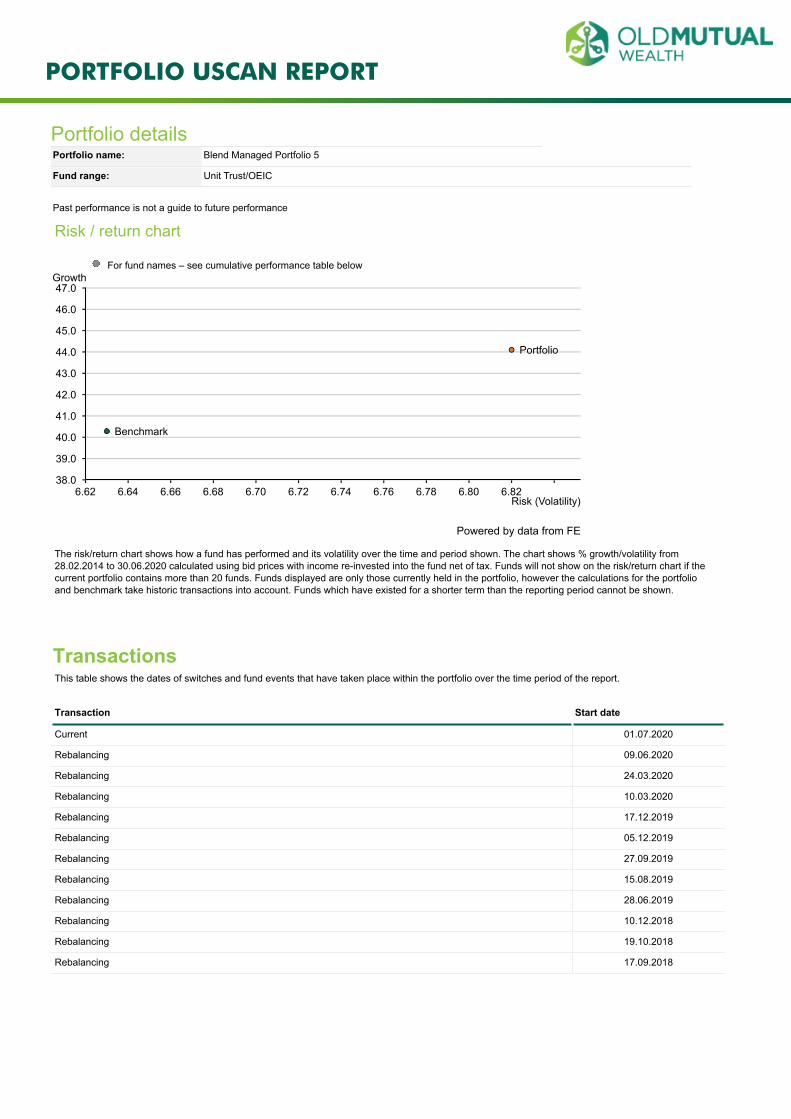
Past performance is not a guide to future performance
Risk / return chart
For fund names – see cumulative performance table below
38.0
39.0
40.0
41.0
42.0
43.0
44.0
45.0
46.0
47.0
6.62 6.64 6.66 6.68 6.70 6.72 6.74 6.76 6.78 6.80 6.82
Portfolio
Benchmark
Powered by data from FE
Growth
Risk (Volatility)
The risk/return chart shows how a fund has performed and its volatility over the time and period shown. The chart shows % growth/volatility from28.02.2014 to 30.06.2020 calculated using bid prices with income re-invested into the fund net of tax. Funds will not show on the risk/return chart if thecurrent portfolio contains more than 20 funds. Funds displayed are only those currently held in the portfolio, however the calculations for the portfolioand benchmark take historic transactions into account. Funds which have existed for a shorter term than the reporting period cannot be shown.
TransactionsThis table shows the dates of switches and fund events that have taken place within the portfolio over the time period of the report.
Transaction Start date
Current 01.07.2020
Rebalancing 09.06.2020
Rebalancing 24.03.2020
Rebalancing 10.03.2020
Rebalancing 17.12.2019
Rebalancing 05.12.2019
Rebalancing 27.09.2019
Rebalancing 15.08.2019
Rebalancing 28.06.2019
Rebalancing 10.12.2018
Rebalancing 19.10.2018
Rebalancing 17.09.2018
PORTFOLIO USCAN REPORT
Portfolio detailsPortfolio name: Blend Managed Portfolio 5
Fund range: Unit Trust/OEIC
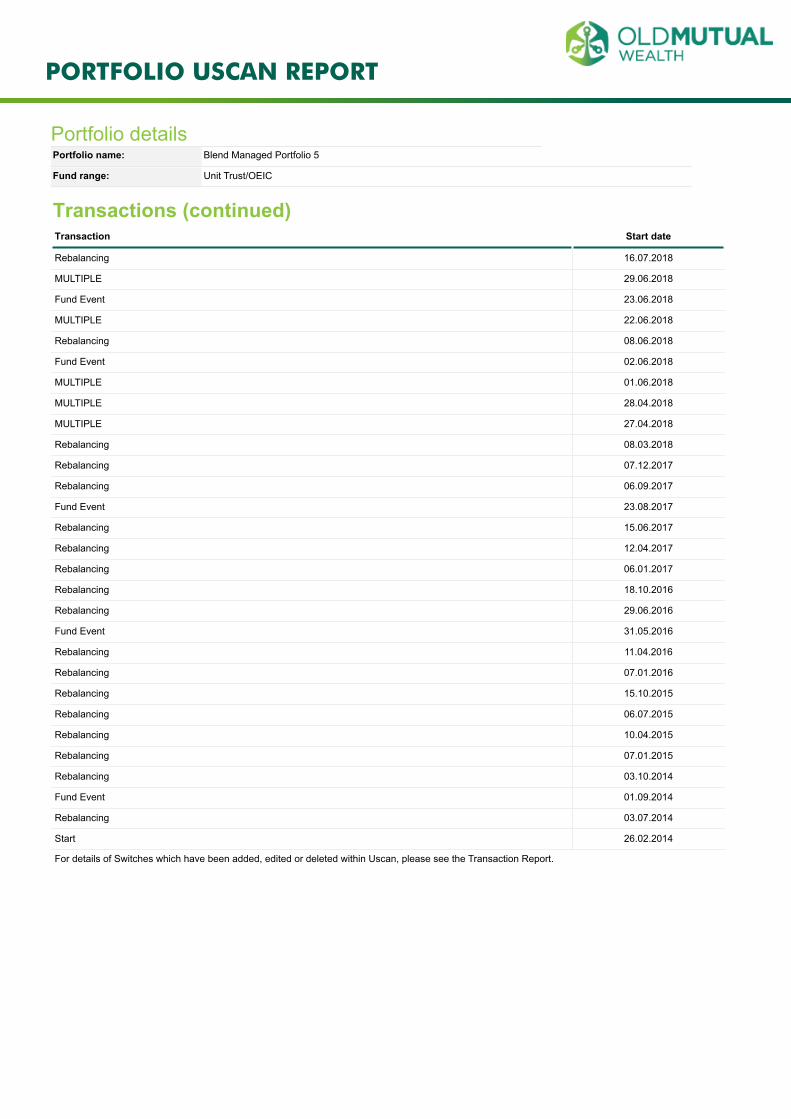
Transactions (continued)Transaction Start date
Rebalancing 16.07.2018
MULTIPLE 29.06.2018
Fund Event 23.06.2018
MULTIPLE 22.06.2018
Rebalancing 08.06.2018
Fund Event 02.06.2018
MULTIPLE 01.06.2018
MULTIPLE 28.04.2018
MULTIPLE 27.04.2018
Rebalancing 08.03.2018
Rebalancing 07.12.2017
Rebalancing 06.09.2017
Fund Event 23.08.2017
Rebalancing 15.06.2017
Rebalancing 12.04.2017
Rebalancing 06.01.2017
Rebalancing 18.10.2016
Rebalancing 29.06.2016
Fund Event 31.05.2016
Rebalancing 11.04.2016
Rebalancing 07.01.2016
Rebalancing 15.10.2015
Rebalancing 06.07.2015
Rebalancing 10.04.2015
Rebalancing 07.01.2015
Rebalancing 03.10.2014
Fund Event 01.09.2014
Rebalancing 03.07.2014
Start 26.02.2014
For details of Switches which have been added, edited or deleted within Uscan, please see the Transaction Report.
PORTFOLIO USCAN REPORT
Portfolio detailsPortfolio name: Blend Managed Portfolio 5
Fund range: Unit Trust/OEIC
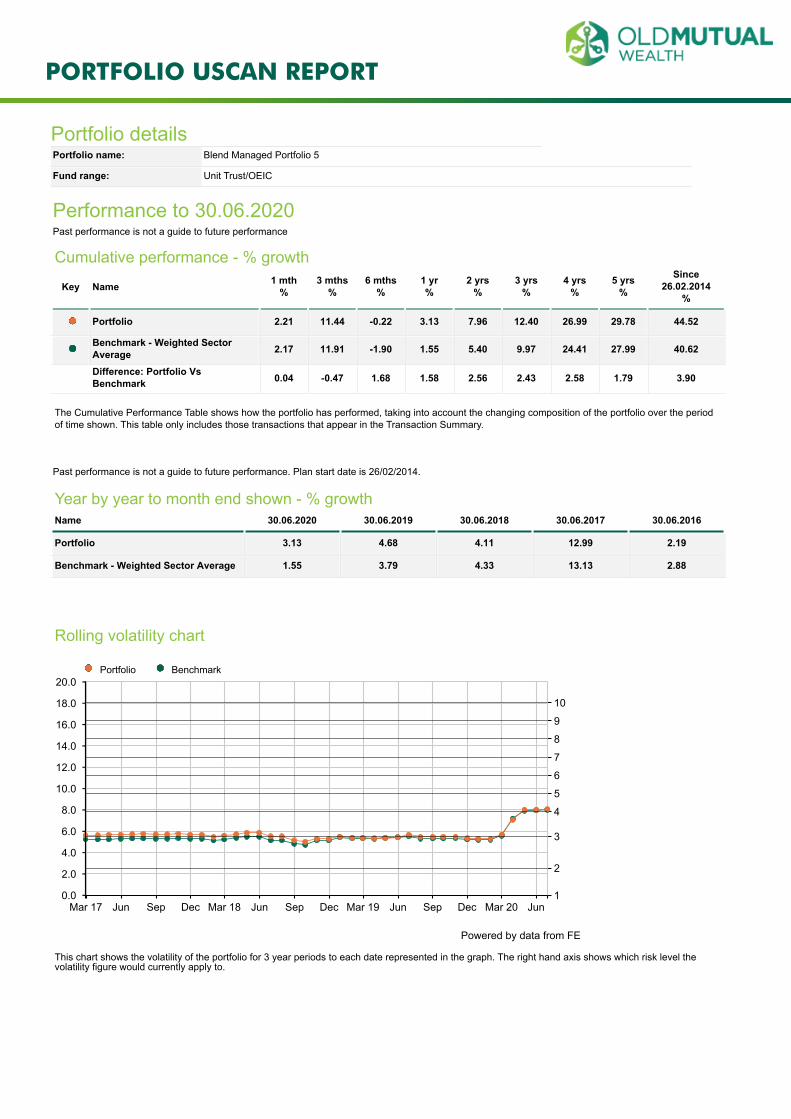
Performance to 30.06.2020Past performance is not a guide to future performance
Cumulative performance - % growth
Key Name 1 mth%
3 mths%
6 mths%
1 yr%
2 yrs%
3 yrs%
4 yrs%
5 yrs%
Since26.02.2014
%
Portfolio 2.21 11.44 -0.22 3.13 7.96 12.40 26.99 29.78 44.52
Benchmark - Weighted SectorAverage 2.17 11.91 -1.90 1.55 5.40 9.97 24.41 27.99 40.62
Difference: Portfolio VsBenchmark 0.04 -0.47 1.68 1.58 2.56 2.43 2.58 1.79 3.90
The Cumulative Performance Table shows how the portfolio has performed, taking into account the changing composition of the portfolio over the periodof time shown. This table only includes those transactions that appear in the Transaction Summary.
Past performance is not a guide to future performance. Plan start date is 26/02/2014.
Year by year to month end shown - % growthName 30.06.2020 30.06.2019 30.06.2018 30.06.2017 30.06.2016
Portfolio 3.13 4.68 4.11 12.99 2.19
Benchmark - Weighted Sector Average 1.55 3.79 4.33 13.13 2.88
Rolling volatility chart
Portfolio Benchmark
1
2
3
4
5
6
7
8
9
10
0.0
2.0
4.0
6.0
8.0
10.0
12.0
14.0
16.0
18.0
20.0
Mar 17 Jun Sep Dec Mar 18 Jun Sep Dec Mar 19 Jun Sep Dec Mar 20 Jun
Powered by data from FE
This chart shows the volatility of the portfolio for 3 year periods to each date represented in the graph. The right hand axis shows which risk level thevolatility figure would currently apply to.
PORTFOLIO USCAN REPORT
Portfolio detailsPortfolio name: Blend Managed Portfolio 5
Fund range: Unit Trust/OEIC
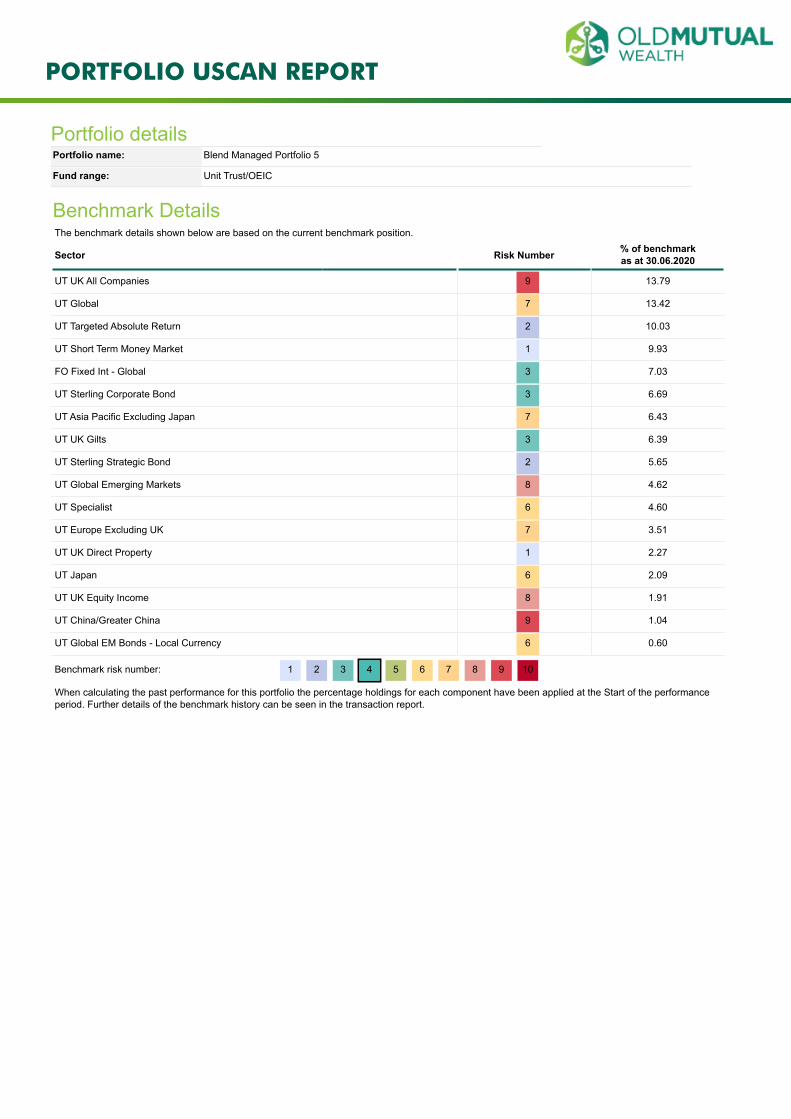
Benchmark DetailsThe benchmark details shown below are based on the current benchmark position.
Sector Risk Number % of benchmarkas at 30.06.2020
UT UK All Companies 9 13.79
UT Global 7 13.42
UT Targeted Absolute Return 2 10.03
UT Short Term Money Market 1 9.93
FO Fixed Int - Global 3 7.03
UT Sterling Corporate Bond 3 6.69
UT Asia Pacific Excluding Japan 7 6.43
UT UK Gilts 3 6.39
UT Sterling Strategic Bond 2 5.65
UT Global Emerging Markets 8 4.62
UT Specialist 6 4.60
UT Europe Excluding UK 7 3.51
UT UK Direct Property 1 2.27
UT Japan 6 2.09
UT UK Equity Income 8 1.91
UT China/Greater China 9 1.04
UT Global EM Bonds - Local Currency 6 0.60
Benchmark risk number: 1 2 3 4 5 6 7 8 9 10
When calculating the past performance for this portfolio the percentage holdings for each component have been applied at the Start of the performanceperiod. Further details of the benchmark history can be seen in the transaction report.
PORTFOLIO USCAN REPORT
Portfolio detailsPortfolio name: Blend Managed Portfolio 5
Fund range: Unit Trust/OEIC
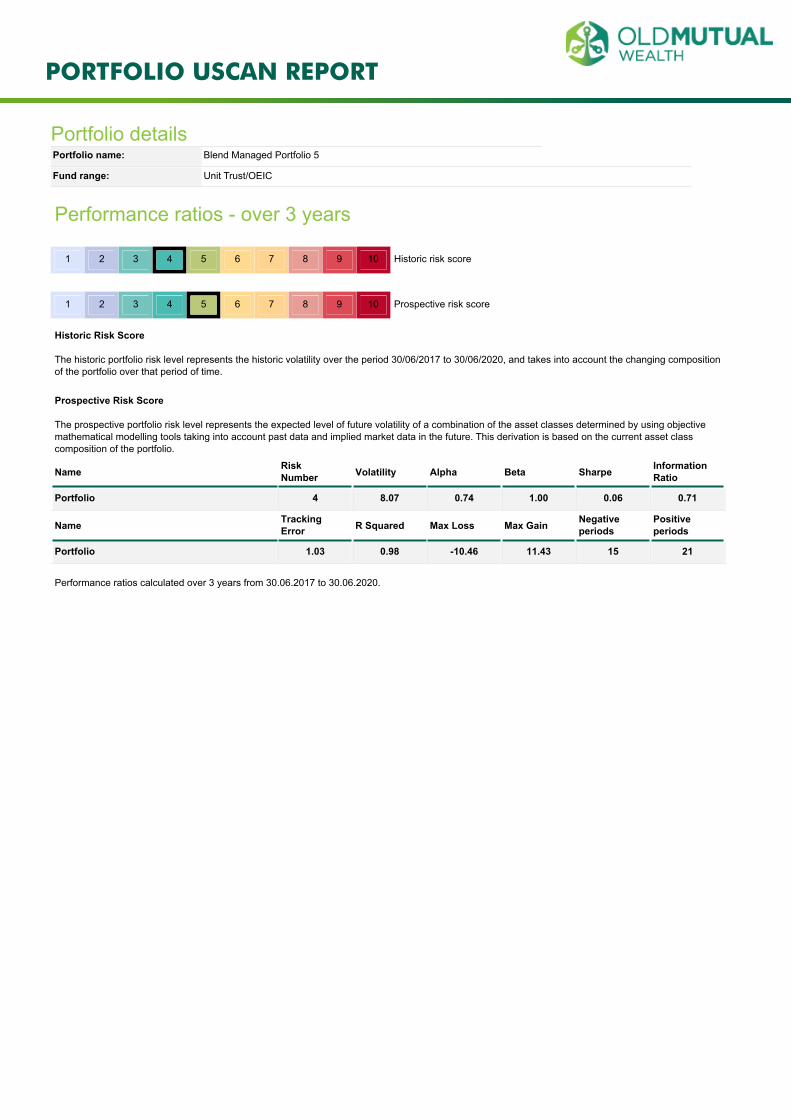
Performance ratios - over 3 years
1 2 3 4 5 6 7 8 9 10 Historic risk score
1 2 3 4 5 6 7 8 9 10 Prospective risk score
Historic Risk Score
The historic portfolio risk level represents the historic volatility over the period 30/06/2017 to 30/06/2020, and takes into account the changing compositionof the portfolio over that period of time.
Prospective Risk Score
The prospective portfolio risk level represents the expected level of future volatility of a combination of the asset classes determined by using objectivemathematical modelling tools taking into account past data and implied market data in the future. This derivation is based on the current asset classcomposition of the portfolio.
Name RiskNumber Volatility Alpha Beta Sharpe Information
Ratio
Portfolio 4 8.07 0.74 1.00 0.06 0.71
Name TrackingError R Squared Max Loss Max Gain Negative
periodsPositiveperiods
Portfolio 1.03 0.98 -10.46 11.43 15 21
Performance ratios calculated over 3 years from 30.06.2017 to 30.06.2020.
PORTFOLIO USCAN REPORT
Portfolio detailsPortfolio name: Blend Managed Portfolio 5
Fund range: Unit Trust/OEIC
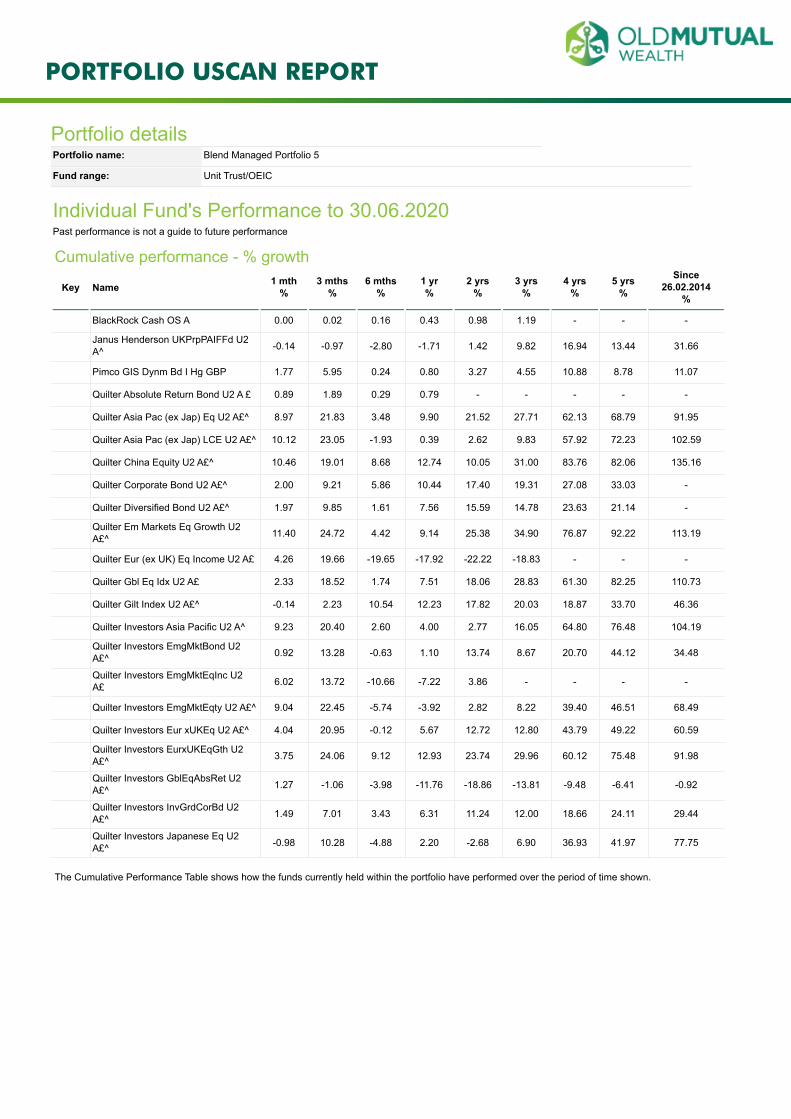
Individual Fund's Performance to 30.06.2020Past performance is not a guide to future performance
Cumulative performance - % growth
Key Name 1 mth%
3 mths%
6 mths%
1 yr%
2 yrs%
3 yrs%
4 yrs%
5 yrs%
Since26.02.2014
%
BlackRock Cash OS A 0.00 0.02 0.16 0.43 0.98 1.19 - - -
Janus Henderson UKPrpPAIFFd U2A^ -0.14 -0.97 -2.80 -1.71 1.42 9.82 16.94 13.44 31.66
Pimco GIS Dynm Bd I Hg GBP 1.77 5.95 0.24 0.80 3.27 4.55 10.88 8.78 11.07
Quilter Absolute Return Bond U2 A £ 0.89 1.89 0.29 0.79 - - - - -
Quilter Asia Pac (ex Jap) Eq U2 A£^ 8.97 21.83 3.48 9.90 21.52 27.71 62.13 68.79 91.95
Quilter Asia Pac (ex Jap) LCE U2 A£^ 10.12 23.05 -1.93 0.39 2.62 9.83 57.92 72.23 102.59
Quilter China Equity U2 A£^ 10.46 19.01 8.68 12.74 10.05 31.00 83.76 82.06 135.16
Quilter Corporate Bond U2 A£^ 2.00 9.21 5.86 10.44 17.40 19.31 27.08 33.03 -
Quilter Diversified Bond U2 A£^ 1.97 9.85 1.61 7.56 15.59 14.78 23.63 21.14 -
Quilter Em Markets Eq Growth U2A£^ 11.40 24.72 4.42 9.14 25.38 34.90 76.87 92.22 113.19
Quilter Eur (ex UK) Eq Income U2 A£ 4.26 19.66 -19.65 -17.92 -22.22 -18.83 - - -
Quilter Gbl Eq Idx U2 A£ 2.33 18.52 1.74 7.51 18.06 28.83 61.30 82.25 110.73
Quilter Gilt Index U2 A£^ -0.14 2.23 10.54 12.23 17.82 20.03 18.87 33.70 46.36
Quilter Investors Asia Pacific U2 A^ 9.23 20.40 2.60 4.00 2.77 16.05 64.80 76.48 104.19
Quilter Investors EmgMktBond U2A£^ 0.92 13.28 -0.63 1.10 13.74 8.67 20.70 44.12 34.48
Quilter Investors EmgMktEqInc U2A£ 6.02 13.72 -10.66 -7.22 3.86 - - - -
Quilter Investors EmgMktEqty U2 A£^ 9.04 22.45 -5.74 -3.92 2.82 8.22 39.40 46.51 68.49
Quilter Investors Eur xUKEq U2 A£^ 4.04 20.95 -0.12 5.67 12.72 12.80 43.79 49.22 60.59
Quilter Investors EurxUKEqGth U2A£^ 3.75 24.06 9.12 12.93 23.74 29.96 60.12 75.48 91.98
Quilter Investors GblEqAbsRet U2A£^ 1.27 -1.06 -3.98 -11.76 -18.86 -13.81 -9.48 -6.41 -0.92
Quilter Investors InvGrdCorBd U2A£^ 1.49 7.01 3.43 6.31 11.24 12.00 18.66 24.11 29.44
Quilter Investors Japanese Eq U2A£^ -0.98 10.28 -4.88 2.20 -2.68 6.90 36.93 41.97 77.75
The Cumulative Performance Table shows how the funds currently held within the portfolio have performed over the period of time shown.
PORTFOLIO USCAN REPORT
Portfolio detailsPortfolio name: Blend Managed Portfolio 5
Fund range: Unit Trust/OEIC
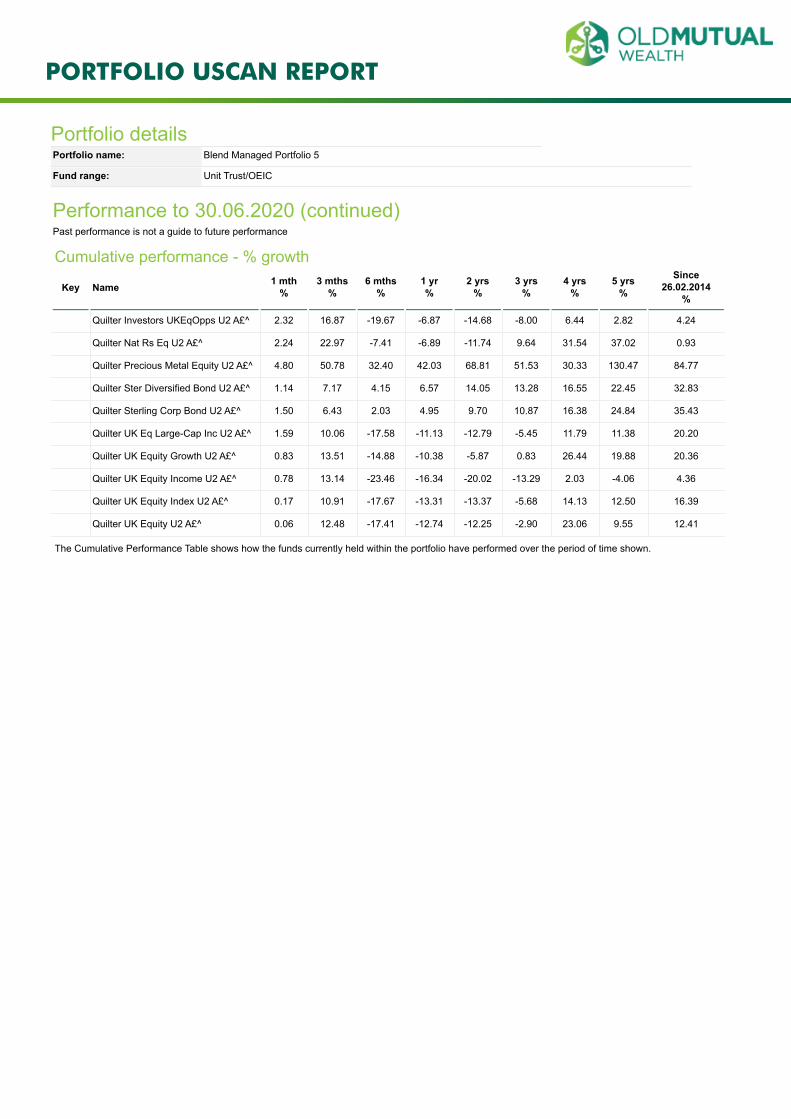
Performance to 30.06.2020 (continued)Past performance is not a guide to future performance
Cumulative performance - % growth
Key Name 1 mth%
3 mths%
6 mths%
1 yr%
2 yrs%
3 yrs%
4 yrs%
5 yrs%
Since26.02.2014
%
Quilter Investors UKEqOpps U2 A£^ 2.32 16.87 -19.67 -6.87 -14.68 -8.00 6.44 2.82 4.24
Quilter Nat Rs Eq U2 A£^ 2.24 22.97 -7.41 -6.89 -11.74 9.64 31.54 37.02 0.93
Quilter Precious Metal Equity U2 A£^ 4.80 50.78 32.40 42.03 68.81 51.53 30.33 130.47 84.77
Quilter Ster Diversified Bond U2 A£^ 1.14 7.17 4.15 6.57 14.05 13.28 16.55 22.45 32.83
Quilter Sterling Corp Bond U2 A£^ 1.50 6.43 2.03 4.95 9.70 10.87 16.38 24.84 35.43
Quilter UK Eq Large-Cap Inc U2 A£^ 1.59 10.06 -17.58 -11.13 -12.79 -5.45 11.79 11.38 20.20
Quilter UK Equity Growth U2 A£^ 0.83 13.51 -14.88 -10.38 -5.87 0.83 26.44 19.88 20.36
Quilter UK Equity Income U2 A£^ 0.78 13.14 -23.46 -16.34 -20.02 -13.29 2.03 -4.06 4.36
Quilter UK Equity Index U2 A£^ 0.17 10.91 -17.67 -13.31 -13.37 -5.68 14.13 12.50 16.39
Quilter UK Equity U2 A£^ 0.06 12.48 -17.41 -12.74 -12.25 -2.90 23.06 9.55 12.41
The Cumulative Performance Table shows how the funds currently held within the portfolio have performed over the period of time shown.
PORTFOLIO USCAN REPORT
Portfolio detailsPortfolio name: Blend Managed Portfolio 5
Fund range: Unit Trust/OEIC
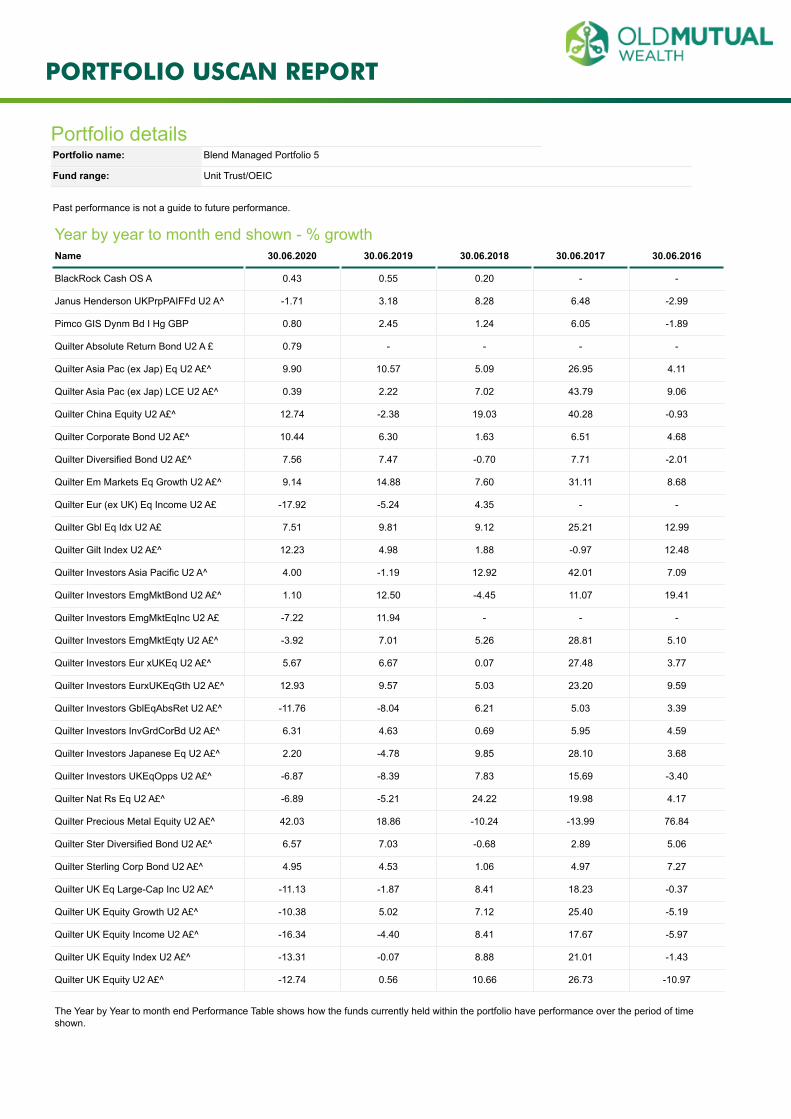
Past performance is not a guide to future performance.
Year by year to month end shown - % growthName 30.06.2020 30.06.2019 30.06.2018 30.06.2017 30.06.2016
BlackRock Cash OS A 0.43 0.55 0.20 - -
Janus Henderson UKPrpPAIFFd U2 A^ -1.71 3.18 8.28 6.48 -2.99
Pimco GIS Dynm Bd I Hg GBP 0.80 2.45 1.24 6.05 -1.89
Quilter Absolute Return Bond U2 A £ 0.79 - - - -
Quilter Asia Pac (ex Jap) Eq U2 A£^ 9.90 10.57 5.09 26.95 4.11
Quilter Asia Pac (ex Jap) LCE U2 A£^ 0.39 2.22 7.02 43.79 9.06
Quilter China Equity U2 A£^ 12.74 -2.38 19.03 40.28 -0.93
Quilter Corporate Bond U2 A£^ 10.44 6.30 1.63 6.51 4.68
Quilter Diversified Bond U2 A£^ 7.56 7.47 -0.70 7.71 -2.01
Quilter Em Markets Eq Growth U2 A£^ 9.14 14.88 7.60 31.11 8.68
Quilter Eur (ex UK) Eq Income U2 A£ -17.92 -5.24 4.35 - -
Quilter Gbl Eq Idx U2 A£ 7.51 9.81 9.12 25.21 12.99
Quilter Gilt Index U2 A£^ 12.23 4.98 1.88 -0.97 12.48
Quilter Investors Asia Pacific U2 A^ 4.00 -1.19 12.92 42.01 7.09
Quilter Investors EmgMktBond U2 A£^ 1.10 12.50 -4.45 11.07 19.41
Quilter Investors EmgMktEqInc U2 A£ -7.22 11.94 - - -
Quilter Investors EmgMktEqty U2 A£^ -3.92 7.01 5.26 28.81 5.10
Quilter Investors Eur xUKEq U2 A£^ 5.67 6.67 0.07 27.48 3.77
Quilter Investors EurxUKEqGth U2 A£^ 12.93 9.57 5.03 23.20 9.59
Quilter Investors GblEqAbsRet U2 A£^ -11.76 -8.04 6.21 5.03 3.39
Quilter Investors InvGrdCorBd U2 A£^ 6.31 4.63 0.69 5.95 4.59
Quilter Investors Japanese Eq U2 A£^ 2.20 -4.78 9.85 28.10 3.68
Quilter Investors UKEqOpps U2 A£^ -6.87 -8.39 7.83 15.69 -3.40
Quilter Nat Rs Eq U2 A£^ -6.89 -5.21 24.22 19.98 4.17
Quilter Precious Metal Equity U2 A£^ 42.03 18.86 -10.24 -13.99 76.84
Quilter Ster Diversified Bond U2 A£^ 6.57 7.03 -0.68 2.89 5.06
Quilter Sterling Corp Bond U2 A£^ 4.95 4.53 1.06 4.97 7.27
Quilter UK Eq Large-Cap Inc U2 A£^ -11.13 -1.87 8.41 18.23 -0.37
Quilter UK Equity Growth U2 A£^ -10.38 5.02 7.12 25.40 -5.19
Quilter UK Equity Income U2 A£^ -16.34 -4.40 8.41 17.67 -5.97
Quilter UK Equity Index U2 A£^ -13.31 -0.07 8.88 21.01 -1.43
Quilter UK Equity U2 A£^ -12.74 0.56 10.66 26.73 -10.97
The Year by Year to month end Performance Table shows how the funds currently held within the portfolio have performance over the period of timeshown.
PORTFOLIO USCAN REPORT
Portfolio detailsPortfolio name: Blend Managed Portfolio 5
Fund range: Unit Trust/OEIC
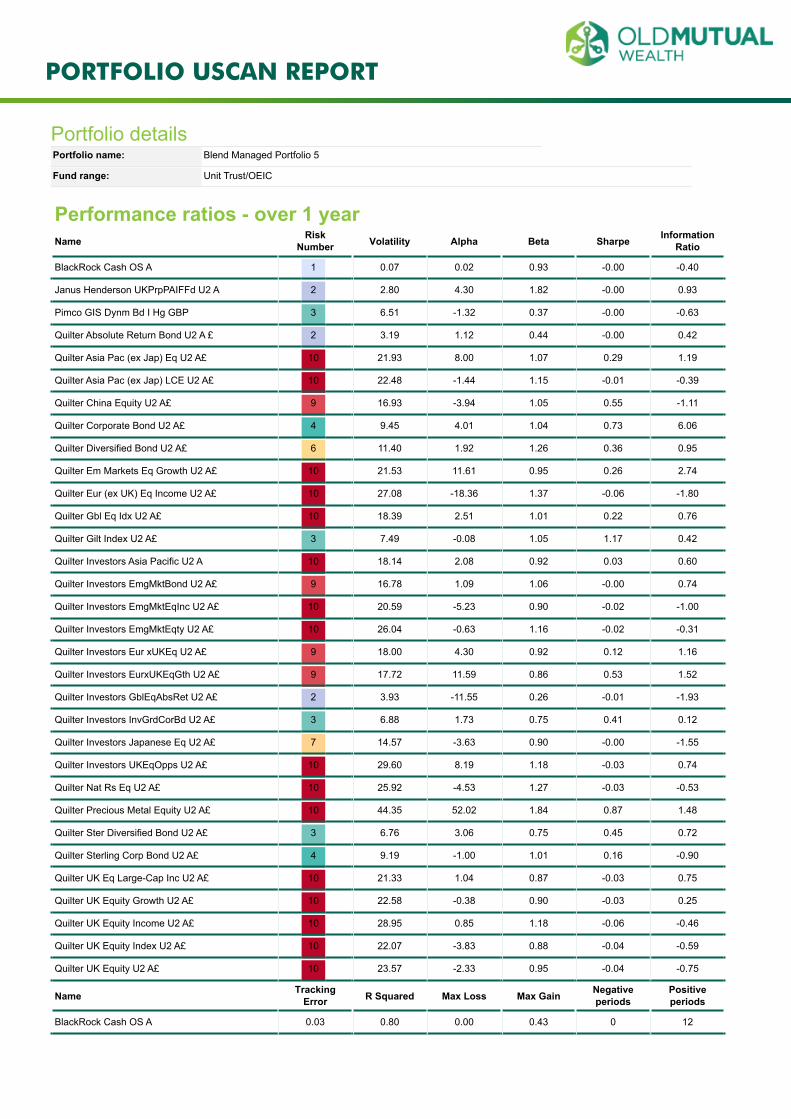
Performance ratios - over 1 yearName Risk
Number Volatility Alpha Beta Sharpe InformationRatio
BlackRock Cash OS A 1 0.07 0.02 0.93 -0.00 -0.40
Janus Henderson UKPrpPAIFFd U2 A 2 2.80 4.30 1.82 -0.00 0.93
Pimco GIS Dynm Bd I Hg GBP 3 6.51 -1.32 0.37 -0.00 -0.63
Quilter Absolute Return Bond U2 A £ 2 3.19 1.12 0.44 -0.00 0.42
Quilter Asia Pac (ex Jap) Eq U2 A£ 10 21.93 8.00 1.07 0.29 1.19
Quilter Asia Pac (ex Jap) LCE U2 A£ 10 22.48 -1.44 1.15 -0.01 -0.39
Quilter China Equity U2 A£ 9 16.93 -3.94 1.05 0.55 -1.11
Quilter Corporate Bond U2 A£ 4 9.45 4.01 1.04 0.73 6.06
Quilter Diversified Bond U2 A£ 6 11.40 1.92 1.26 0.36 0.95
Quilter Em Markets Eq Growth U2 A£ 10 21.53 11.61 0.95 0.26 2.74
Quilter Eur (ex UK) Eq Income U2 A£ 10 27.08 -18.36 1.37 -0.06 -1.80
Quilter Gbl Eq Idx U2 A£ 10 18.39 2.51 1.01 0.22 0.76
Quilter Gilt Index U2 A£ 3 7.49 -0.08 1.05 1.17 0.42
Quilter Investors Asia Pacific U2 A 10 18.14 2.08 0.92 0.03 0.60
Quilter Investors EmgMktBond U2 A£ 9 16.78 1.09 1.06 -0.00 0.74
Quilter Investors EmgMktEqInc U2 A£ 10 20.59 -5.23 0.90 -0.02 -1.00
Quilter Investors EmgMktEqty U2 A£ 10 26.04 -0.63 1.16 -0.02 -0.31
Quilter Investors Eur xUKEq U2 A£ 9 18.00 4.30 0.92 0.12 1.16
Quilter Investors EurxUKEqGth U2 A£ 9 17.72 11.59 0.86 0.53 1.52
Quilter Investors GblEqAbsRet U2 A£ 2 3.93 -11.55 0.26 -0.01 -1.93
Quilter Investors InvGrdCorBd U2 A£ 3 6.88 1.73 0.75 0.41 0.12
Quilter Investors Japanese Eq U2 A£ 7 14.57 -3.63 0.90 -0.00 -1.55
Quilter Investors UKEqOpps U2 A£ 10 29.60 8.19 1.18 -0.03 0.74
Quilter Nat Rs Eq U2 A£ 10 25.92 -4.53 1.27 -0.03 -0.53
Quilter Precious Metal Equity U2 A£ 10 44.35 52.02 1.84 0.87 1.48
Quilter Ster Diversified Bond U2 A£ 3 6.76 3.06 0.75 0.45 0.72
Quilter Sterling Corp Bond U2 A£ 4 9.19 -1.00 1.01 0.16 -0.90
Quilter UK Eq Large-Cap Inc U2 A£ 10 21.33 1.04 0.87 -0.03 0.75
Quilter UK Equity Growth U2 A£ 10 22.58 -0.38 0.90 -0.03 0.25
Quilter UK Equity Income U2 A£ 10 28.95 0.85 1.18 -0.06 -0.46
Quilter UK Equity Index U2 A£ 10 22.07 -3.83 0.88 -0.04 -0.59
Quilter UK Equity U2 A£ 10 23.57 -2.33 0.95 -0.04 -0.75
Name TrackingError R Squared Max Loss Max Gain Negative
periodsPositiveperiods
BlackRock Cash OS A 0.03 0.80 0.00 0.43 0 12
PORTFOLIO USCAN REPORT
Portfolio detailsPortfolio name: Blend Managed Portfolio 5
Fund range: Unit Trust/OEIC
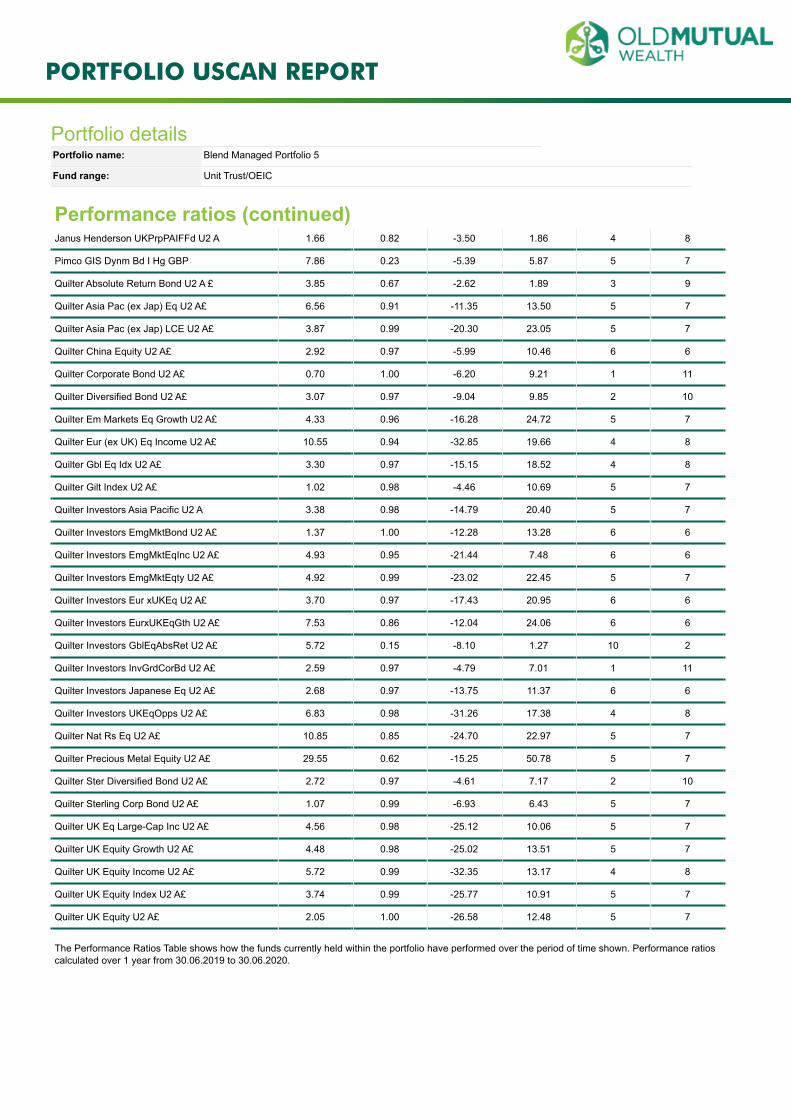
Performance ratios (continued)Janus Henderson UKPrpPAIFFd U2 A 1.66 0.82 -3.50 1.86 4 8
Pimco GIS Dynm Bd I Hg GBP 7.86 0.23 -5.39 5.87 5 7
Quilter Absolute Return Bond U2 A £ 3.85 0.67 -2.62 1.89 3 9
Quilter Asia Pac (ex Jap) Eq U2 A£ 6.56 0.91 -11.35 13.50 5 7
Quilter Asia Pac (ex Jap) LCE U2 A£ 3.87 0.99 -20.30 23.05 5 7
Quilter China Equity U2 A£ 2.92 0.97 -5.99 10.46 6 6
Quilter Corporate Bond U2 A£ 0.70 1.00 -6.20 9.21 1 11
Quilter Diversified Bond U2 A£ 3.07 0.97 -9.04 9.85 2 10
Quilter Em Markets Eq Growth U2 A£ 4.33 0.96 -16.28 24.72 5 7
Quilter Eur (ex UK) Eq Income U2 A£ 10.55 0.94 -32.85 19.66 4 8
Quilter Gbl Eq Idx U2 A£ 3.30 0.97 -15.15 18.52 4 8
Quilter Gilt Index U2 A£ 1.02 0.98 -4.46 10.69 5 7
Quilter Investors Asia Pacific U2 A 3.38 0.98 -14.79 20.40 5 7
Quilter Investors EmgMktBond U2 A£ 1.37 1.00 -12.28 13.28 6 6
Quilter Investors EmgMktEqInc U2 A£ 4.93 0.95 -21.44 7.48 6 6
Quilter Investors EmgMktEqty U2 A£ 4.92 0.99 -23.02 22.45 5 7
Quilter Investors Eur xUKEq U2 A£ 3.70 0.97 -17.43 20.95 6 6
Quilter Investors EurxUKEqGth U2 A£ 7.53 0.86 -12.04 24.06 6 6
Quilter Investors GblEqAbsRet U2 A£ 5.72 0.15 -8.10 1.27 10 2
Quilter Investors InvGrdCorBd U2 A£ 2.59 0.97 -4.79 7.01 1 11
Quilter Investors Japanese Eq U2 A£ 2.68 0.97 -13.75 11.37 6 6
Quilter Investors UKEqOpps U2 A£ 6.83 0.98 -31.26 17.38 4 8
Quilter Nat Rs Eq U2 A£ 10.85 0.85 -24.70 22.97 5 7
Quilter Precious Metal Equity U2 A£ 29.55 0.62 -15.25 50.78 5 7
Quilter Ster Diversified Bond U2 A£ 2.72 0.97 -4.61 7.17 2 10
Quilter Sterling Corp Bond U2 A£ 1.07 0.99 -6.93 6.43 5 7
Quilter UK Eq Large-Cap Inc U2 A£ 4.56 0.98 -25.12 10.06 5 7
Quilter UK Equity Growth U2 A£ 4.48 0.98 -25.02 13.51 5 7
Quilter UK Equity Income U2 A£ 5.72 0.99 -32.35 13.17 4 8
Quilter UK Equity Index U2 A£ 3.74 0.99 -25.77 10.91 5 7
Quilter UK Equity U2 A£ 2.05 1.00 -26.58 12.48 5 7
The Performance Ratios Table shows how the funds currently held within the portfolio have performed over the period of time shown. Performance ratioscalculated over 1 year from 30.06.2019 to 30.06.2020.
PORTFOLIO USCAN REPORT
Portfolio detailsPortfolio name: Blend Managed Portfolio 5
Fund range: Unit Trust/OEIC
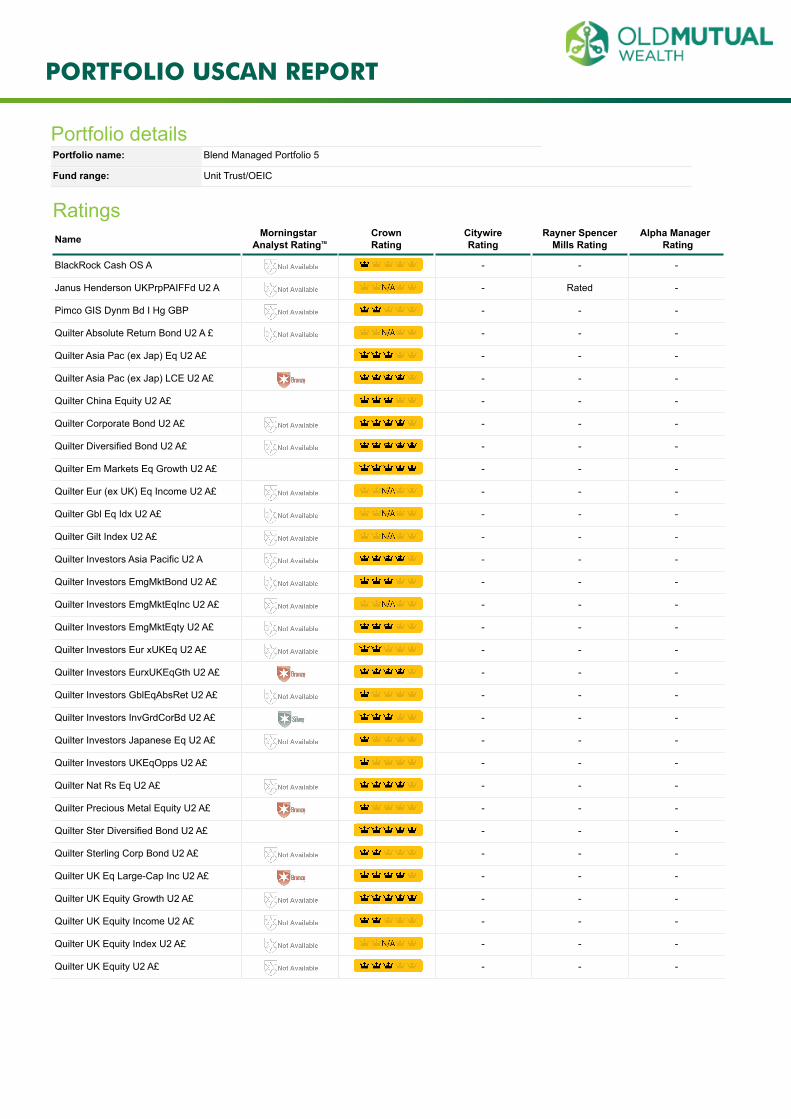
RatingsName Morningstar
Analyst RatingTM
CrownRating
CitywireRating
Rayner SpencerMills Rating
Alpha Manager Rating
BlackRock Cash OS A - - -
Janus Henderson UKPrpPAIFFd U2 A - Rated -
Pimco GIS Dynm Bd I Hg GBP - - -
Quilter Absolute Return Bond U2 A £ - - -
Quilter Asia Pac (ex Jap) Eq U2 A£ - - -
Quilter Asia Pac (ex Jap) LCE U2 A£ - - -
Quilter China Equity U2 A£ - - -
Quilter Corporate Bond U2 A£ - - -
Quilter Diversified Bond U2 A£ - - -
Quilter Em Markets Eq Growth U2 A£ - - -
Quilter Eur (ex UK) Eq Income U2 A£ - - -
Quilter Gbl Eq Idx U2 A£ - - -
Quilter Gilt Index U2 A£ - - -
Quilter Investors Asia Pacific U2 A - - -
Quilter Investors EmgMktBond U2 A£ - - -
Quilter Investors EmgMktEqInc U2 A£ - - -
Quilter Investors EmgMktEqty U2 A£ - - -
Quilter Investors Eur xUKEq U2 A£ - - -
Quilter Investors EurxUKEqGth U2 A£ - - -
Quilter Investors GblEqAbsRet U2 A£ - - -
Quilter Investors InvGrdCorBd U2 A£ - - -
Quilter Investors Japanese Eq U2 A£ - - -
Quilter Investors UKEqOpps U2 A£ - - -
Quilter Nat Rs Eq U2 A£ - - -
Quilter Precious Metal Equity U2 A£ - - -
Quilter Ster Diversified Bond U2 A£ - - -
Quilter Sterling Corp Bond U2 A£ - - -
Quilter UK Eq Large-Cap Inc U2 A£ - - -
Quilter UK Equity Growth U2 A£ - - -
Quilter UK Equity Income U2 A£ - - -
Quilter UK Equity Index U2 A£ - - -
Quilter UK Equity U2 A£ - - -
PORTFOLIO USCAN REPORT
Portfolio detailsPortfolio name: Blend Managed Portfolio 5
Fund range: Unit Trust/OEIC
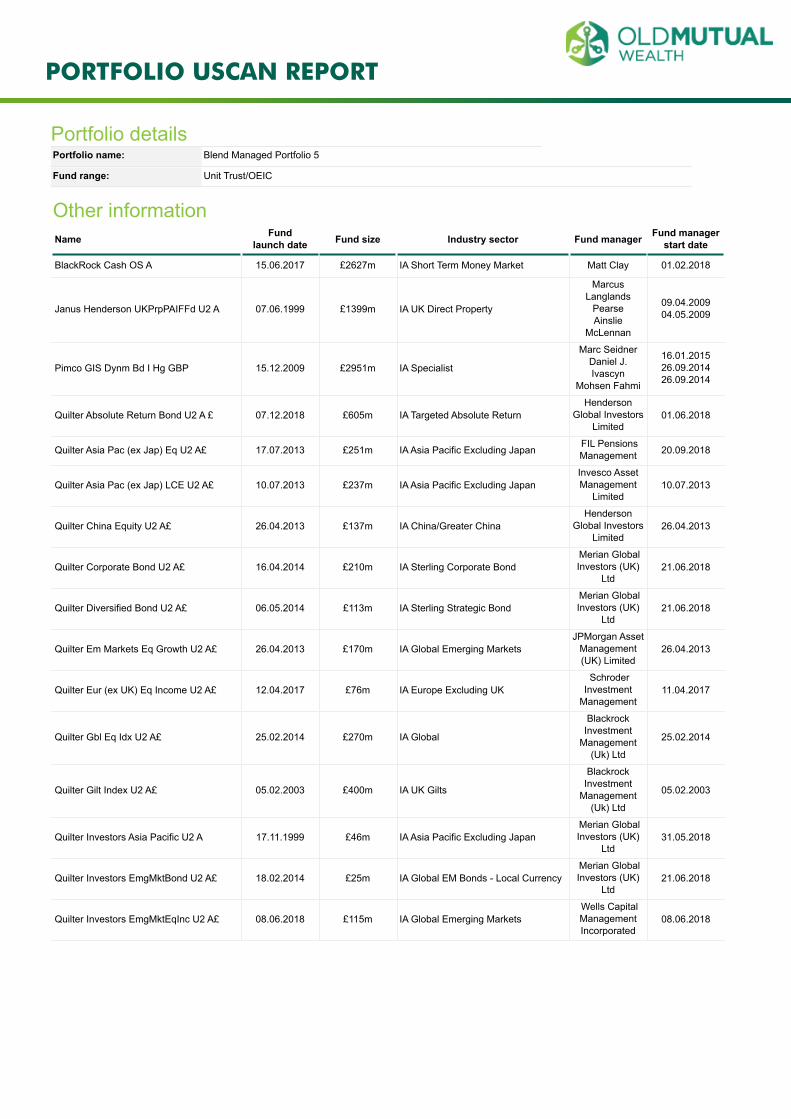
Other informationName Fund
launch date Fund size Industry sector Fund manager Fund managerstart date
BlackRock Cash OS A 15.06.2017 £2627m IA Short Term Money Market Matt Clay 01.02.2018
Janus Henderson UKPrpPAIFFd U2 A 07.06.1999 £1399m IA UK Direct Property
MarcusLanglands
PearseAinslie
McLennan
09.04.200904.05.2009
Pimco GIS Dynm Bd I Hg GBP 15.12.2009 £2951m IA Specialist
Marc SeidnerDaniel J.Ivascyn
Mohsen Fahmi
16.01.201526.09.201426.09.2014
Quilter Absolute Return Bond U2 A £ 07.12.2018 £605m IA Targeted Absolute ReturnHenderson
Global InvestorsLimited
01.06.2018
Quilter Asia Pac (ex Jap) Eq U2 A£ 17.07.2013 £251m IA Asia Pacific Excluding Japan FIL PensionsManagement 20.09.2018
Quilter Asia Pac (ex Jap) LCE U2 A£ 10.07.2013 £237m IA Asia Pacific Excluding JapanInvesco AssetManagement
Limited10.07.2013
Quilter China Equity U2 A£ 26.04.2013 £137m IA China/Greater ChinaHenderson
Global InvestorsLimited
26.04.2013
Quilter Corporate Bond U2 A£ 16.04.2014 £210m IA Sterling Corporate Bond Merian GlobalInvestors (UK)
Ltd21.06.2018
Quilter Diversified Bond U2 A£ 06.05.2014 £113m IA Sterling Strategic Bond Merian GlobalInvestors (UK)
Ltd21.06.2018
Quilter Em Markets Eq Growth U2 A£ 26.04.2013 £170m IA Global Emerging MarketsJPMorgan Asset
Management(UK) Limited
26.04.2013
Quilter Eur (ex UK) Eq Income U2 A£ 12.04.2017 £76m IA Europe Excluding UK SchroderInvestment
Management11.04.2017
Quilter Gbl Eq Idx U2 A£ 25.02.2014 £270m IA Global
BlackrockInvestment
Management(Uk) Ltd
25.02.2014
Quilter Gilt Index U2 A£ 05.02.2003 £400m IA UK Gilts
BlackrockInvestment
Management(Uk) Ltd
05.02.2003
Quilter Investors Asia Pacific U2 A 17.11.1999 £46m IA Asia Pacific Excluding Japan Merian GlobalInvestors (UK)
Ltd31.05.2018
Quilter Investors EmgMktBond U2 A£ 18.02.2014 £25m IA Global EM Bonds - Local Currency Merian GlobalInvestors (UK)
Ltd21.06.2018
Quilter Investors EmgMktEqInc U2 A£ 08.06.2018 £115m IA Global Emerging Markets Wells CapitalManagementIncorporated
08.06.2018
PORTFOLIO USCAN REPORT
Portfolio detailsPortfolio name: Blend Managed Portfolio 5
Fund range: Unit Trust/OEIC
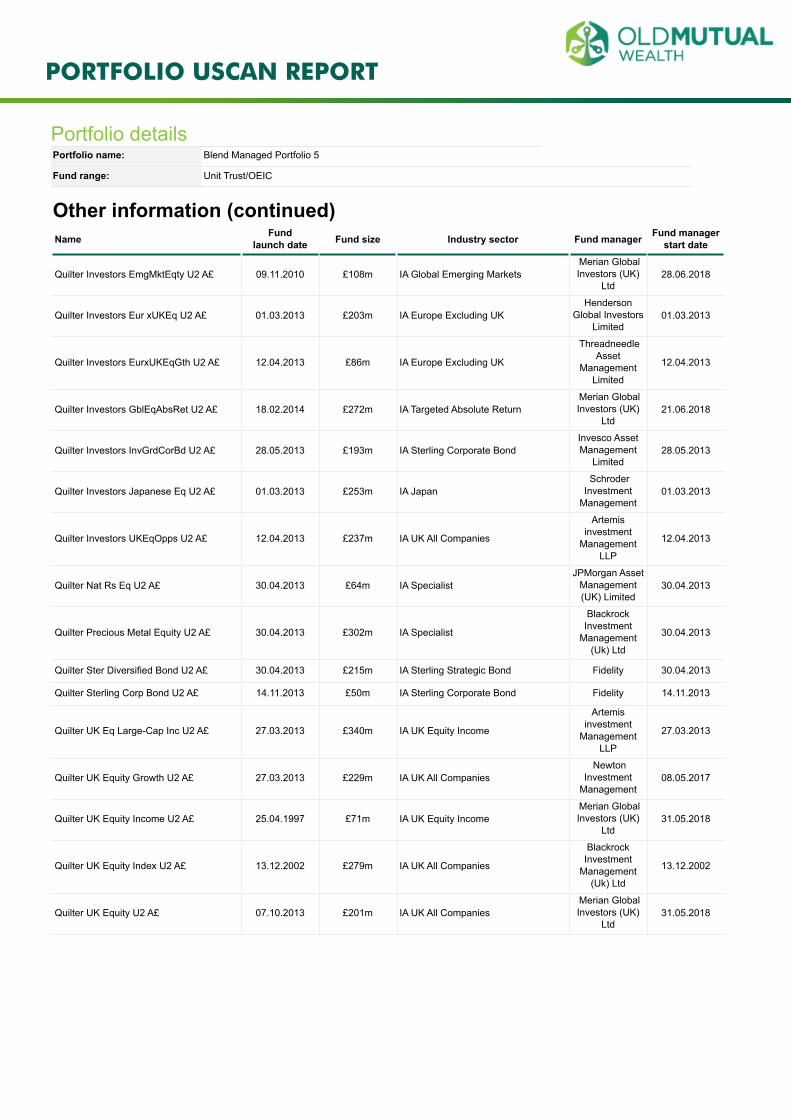
Other information (continued)Name Fund
launch date Fund size Industry sector Fund manager Fund managerstart date
Quilter Investors EmgMktEqty U2 A£ 09.11.2010 £108m IA Global Emerging Markets Merian GlobalInvestors (UK)
Ltd28.06.2018
Quilter Investors Eur xUKEq U2 A£ 01.03.2013 £203m IA Europe Excluding UKHenderson
Global InvestorsLimited
01.03.2013
Quilter Investors EurxUKEqGth U2 A£ 12.04.2013 £86m IA Europe Excluding UK
ThreadneedleAsset
ManagementLimited
12.04.2013
Quilter Investors GblEqAbsRet U2 A£ 18.02.2014 £272m IA Targeted Absolute Return Merian GlobalInvestors (UK)
Ltd21.06.2018
Quilter Investors InvGrdCorBd U2 A£ 28.05.2013 £193m IA Sterling Corporate BondInvesco AssetManagement
Limited28.05.2013
Quilter Investors Japanese Eq U2 A£ 01.03.2013 £253m IA Japan SchroderInvestment
Management01.03.2013
Quilter Investors UKEqOpps U2 A£ 12.04.2013 £237m IA UK All Companies
Artemisinvestment
ManagementLLP
12.04.2013
Quilter Nat Rs Eq U2 A£ 30.04.2013 £64m IA SpecialistJPMorgan Asset
Management(UK) Limited
30.04.2013
Quilter Precious Metal Equity U2 A£ 30.04.2013 £302m IA Specialist
BlackrockInvestment
Management(Uk) Ltd
30.04.2013
Quilter Ster Diversified Bond U2 A£ 30.04.2013 £215m IA Sterling Strategic Bond Fidelity 30.04.2013
Quilter Sterling Corp Bond U2 A£ 14.11.2013 £50m IA Sterling Corporate Bond Fidelity 14.11.2013
Quilter UK Eq Large-Cap Inc U2 A£ 27.03.2013 £340m IA UK Equity Income
Artemisinvestment
ManagementLLP
27.03.2013
Quilter UK Equity Growth U2 A£ 27.03.2013 £229m IA UK All Companies Newton
InvestmentManagement
08.05.2017
Quilter UK Equity Income U2 A£ 25.04.1997 £71m IA UK Equity Income Merian GlobalInvestors (UK)
Ltd31.05.2018
Quilter UK Equity Index U2 A£ 13.12.2002 £279m IA UK All Companies
BlackrockInvestment
Management(Uk) Ltd
13.12.2002
Quilter UK Equity U2 A£ 07.10.2013 £201m IA UK All Companies Merian GlobalInvestors (UK)
Ltd31.05.2018
PORTFOLIO USCAN REPORT
Portfolio detailsPortfolio name: Blend Managed Portfolio 5
Fund range: Unit Trust/OEIC
Important InformationThis communication is designed for use by professional financial advisers. It is not intended as a promotion of a particular fund, or funds.
Past performance for the funds marked ^ has been based on prices that include simulated values.
All performances are inclusive of any net reinvested income and exclusive of any reinvested rebates.
Please refer to www.oldmutualwealth.co.uk/glossary for further information about the terms used in this document.
All the performance information shown is in the fund currency indicated on the first page of this report.
The performance figures do not include any product charges; relevant additional charges will affect the return from any particular product.
For ISA the performance does not allow for tax reclaims that have been available at various times in the past.
Holdings in cash deposit are displayed on these reports where applicable however, 0% performance and volatility is assumed. Cash deposit holdings are notincluded when calculating a portfolio's prospective risk score.
Fund % growth is calculated using bid prices with income re-invested back into the fund net of tax. For fund or sector average benchmarks the % growth is alsocalculated net of tax.
Any benchmark against which the fund is compared has been selected by the Financial Adviser and Old Mutual Wealth have not verified that the benchmark isappropriate for the fund.
As funds in the following sectors do not meet and pre-set parameters, it may be inappropriate to compare them on a like-for-like basis. Unit trust and OEICsectors: Unclassified, IA Specialist. Life and Pension sectors: ABI Specialist, ABI Unclassified.
Unit prices, and the income from units, may fall as well as rise. An investor may not get back the amount invested.
Switches
The report shows how the portfolio has performed over the period shown, where it is currently invested, and the portfolio’s risk level. The past performance andrisk assessment calculations include any fund switches made during the reporting period, as well as any fund events such as fund mergers. These figures do notinclude any product charges, regular premiums, or money in and money out transactions.
Switches may be based on actual transactions from a client's plan or example transactions that a Financial Adviser has created/added.
Any changes made to switches are the responsibility of the Financial Adviser.
Any incomplete transactions on your client's plan are excluded from appearing i.e. where a trade has not settled.
Corrective transactions are included in the report where a switch may have originally been submitted incorrectly.
Performance Calculation Methodologies
1) Historic Portfolio Positions Excluded – Start Date Methodology
If the portfolio excludes transactions, then it is assumed that the current portfolio holding has existed throughout the requested time period.
This means that when calculating the past performance for this selected portfolio the specified percentage holdings per fund in the portfolio are assumed to beheld at the start of the performance period as opposed to the end of the performance period. This means that we have derived the relative percentage holdings inthe constituent funds at the end date based on the actual performance of the constituent funds over the performance period to arrive at the specified percentageholdings on the start date.
2) Historic Portfolio Positions Included
If the portfolio includes transactions, then the report will track the portfolio performance taking into account the changes in portfolio composition over therequested time period.
This means that when calculating past performance, the specified percentage holdings per fund in the portfolio upon completion of each transaction are assumedto be held from the transaction date. Performance calculations are applied from this date until the date of the next transaction or as in the case of the most recentone, until the date the report is run. This means that the investment holdings at the end of the performance period i.e. between two transaction dates, will havemoved away from the initial allocation split depending on the relative performance of the constituent assets.
Information Source: FE
This FE sourced information is provided to you by Old Mutual Wealth and is used at your own risk. FE take care to ensure that theinformation provided is correct. Neither FE or Old Mutual Wealth warrants, presents nor guarantees the contents of the information,nor do they accept any responsibility for error, inaccuracies, omissions or any inconsistencies herein.
PORTFOLIO USCAN REPORT
Portfolio Risk Numbers:HistoricThis is based on historic volatility, as measured by standard deviation of returns, of the portfolio of funds over the past 3 years. The historic volatility is thentranslated to the portfolio risk level which is a whole number ranging from 1 (least risky) to 10 (most risky). This translation is consistent with the methodologyused in Old Mutual Wealth's online portfolio construction tools and is based on Modern Portfolio Theory.
ProspectiveThe portfolio risk level represents the expected level of future volatility of the combination of asset classes determined by using objective mathematical modellingtools taking into account past data and implied market data about the future.
Fund Risk Number:The fund risk score is based on historic volatility, as measured by standard deviation of returns, of the fund over the indicated time period.
The historic volatility is then translated to the fund risk level which is a whole number ranging from 1 (least risky) to 10 (most risky). Fund risk scores provide aretrospective view of a fund's volatility, which may vary widely over different time periods, and are not necessarily indicative of a fund's future volatility.
Ratings:The Crown Ratings are assigned by Financial Express Holdings Limited and are for reference only. The Crown Ratings are compiled using three keymeasurements of an underlying fund's performance - alpha, volatility and consistency. An underlying fund will have higher crown rating, if it has superiorconsistent performance in relation to risk, relative to their peer groups. One crown being the lowest rating, and five crowns being the highest. No crowns meansthe underlying fund has not been rated. These ratings will be reviewed by Financial Express Holdings Limited on a regular basis.
Citywire Ratings: Source & Copyright 1999 - 2007: Citywire Financial Publishers Limited. Citywire Fund Manager Ratings are basedare based on the risk-adjusted track records of individual fund managers over three years. The Citywire Fund Manager Ratings arebased on the performance of the fund manager across all the funds he or she has managed at any point during the last three years -not just the funds they are currently managing. More details at www.citywire.co.uk
Morningstar provides independent fund ratings which aim to be predictive in nature. The ratings are determined following in-depthqualitative and quantitative analysis. Funds are reviewed regularly and ratings adjusted to reflect any changes in investment style orapproach. From time to time a fund rating may be subject to review, in which case the rating becomes suspended. Funds which arenot rated by Morningstar are shown as NR (Not rated).
FE Alpha Manager Ratings are a quant-based fund manager ratings system, calculated by looking at the performance of the IndividualFund Managers across all of the funds they have managed over the last decade. They are based on 3 components:a. Risk adjusted alpha (with track record length bias)b. Consistent outperformance of a benchmark overallc. Out/UnderperformanceFor more information visit www.trustnet.com/AlphaManager
A fund rating from Rayner Spencer Mills is based on the use of both quantitative and qualitative research, with the latter providing aforward-looking view of the manager’s ability to deliver strong, consistent performance. This qualitative view is gained through face toface meetings with fund managers and is a key part of their methodology.
Rather than have differing categories of rating their approach is to rate a fund, providing additional information on their fund and sectorfactsheets enabling advisers to make the most appropriate selection for their clients. Full fund information is available on their websiteat www.raynerspencermills.co.uk together with their fund methodology document.
For more information on the investment terms used, please go to the glossary at www.oldmutualwealth.co.uk/glossary.
Calls may be monitored and recorded for training purposes and to avoid misunderstandings.
Old Mutual Wealth provides you with access to its investment platform. Within this platform you can open an ISA and Collective Investment Account provided byOld Mutual Wealth Ltd, a Collective Retirement Account and Collective Investment Bond provided by Old Mutual Wealth Life & Pensions Ltd and access anexisting Offshore Collective Investment Bond, distributed by Old Mutual Wealth Ltd but provided by Old Mutual International (Guernsey) Limited.
Old Mutual Wealth Ltd and Old Mutual Wealth Life & Pensions Ltd are registered in England & Wales under numbers 1680071 and 4163431 respectively.Registered Office at Old Mutual House, Portland Terrace, Southampton SO14 7EJ, United Kingdom.
Old Mutual Wealth Life & Pensions Ltd are authorised by the Prudential Regulation Authority and are regulated by the Financial Conduct Authority and thePrudential Regulation Authority. Old Mutual Wealth Ltd is authorised and regulated by the Financial Conduct Authority. Their Financial Services register numbersare 207977 and 165359 respectively. VAT number for all above companies is 386 1301 59.
Old Mutual International (Guernsey) Limited is regulated by the Guernsey Financial Services Commission and is licensed to write long-term business under theInsurance Business (Bailiwick of Guernsey) Law 2002. Registered number 2424. Registered Office at The Beehive, PO Box 121, Collings Road, St Peter Port,Guernsey GY1 3HE, Channel Islands.
Report Reference: E8EC8D145018