Embed Size (px)
Citation preview
Imaging: PET and SPECT
Positron Emission Tomography
Single Photon Emission Computed Tomography
PET and SPECTProperties of ideal imaging nuclides, biological, chemical , physical
Production of radionuclidesNuclear fissionCharged particle bombardment
The Tc-99m Generator
ChemistryChelators vs organic chemistry
Delivery strategiesBlood brain barrierMetabolic pathwaysChemical affinity
Clinical applicationsTumor imaging and stagingCardiac imagingGene therapyBrain functionDopamine pathways, addiction

Imaging
Image removed due to copyright restrictions.
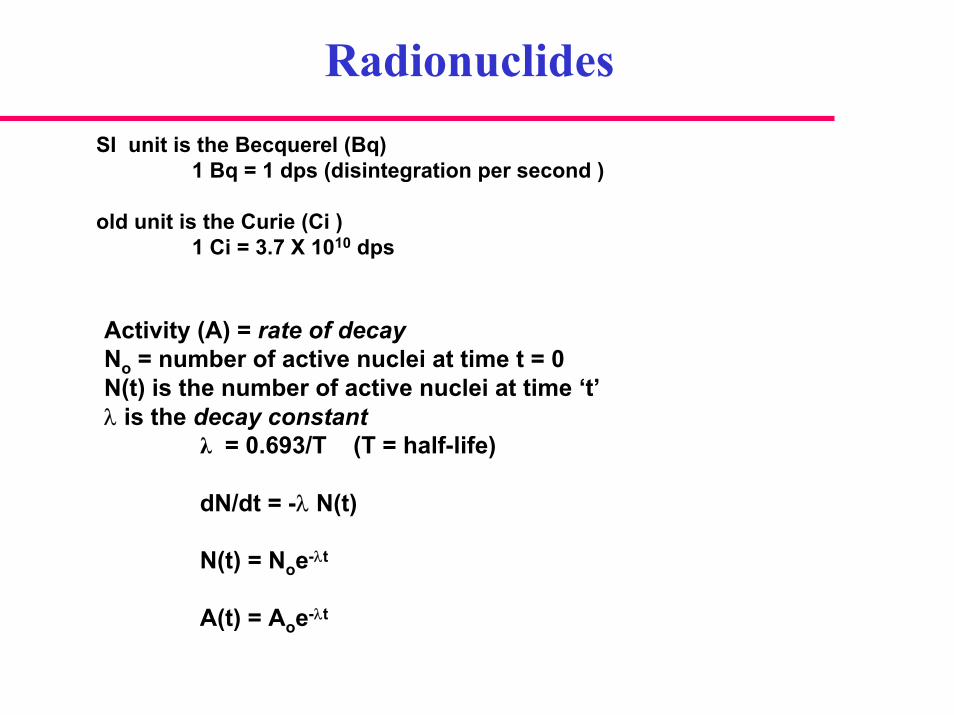
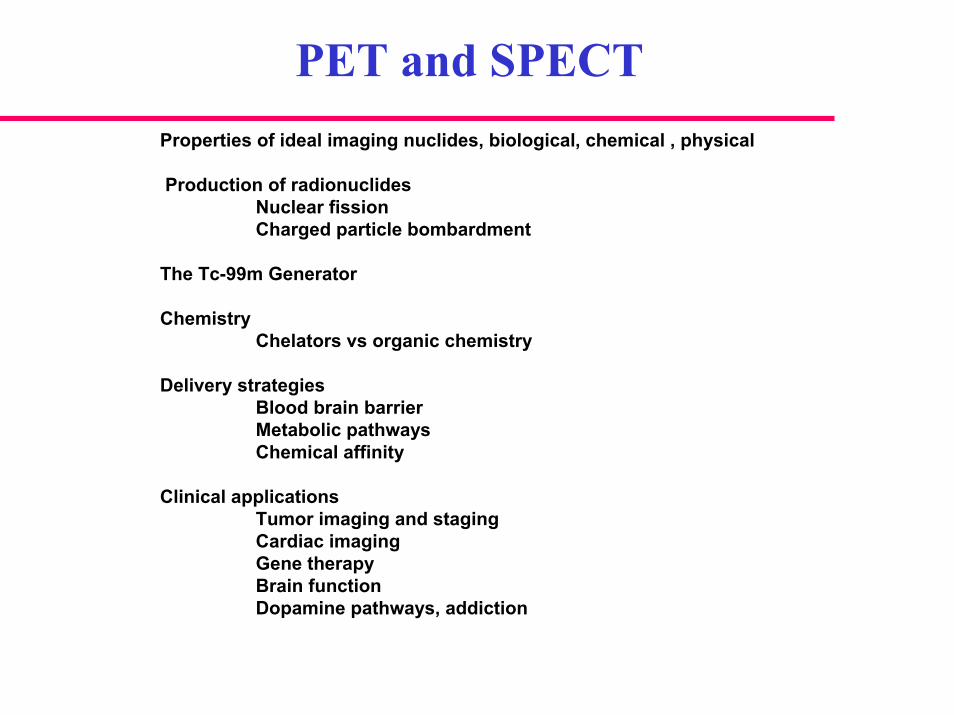
RadionuclidesSI unit is the Becquerel (Bq)
1 Bq = 1 dps (disintegration per second )
old unit is the Curie (Ci )1 Ci = 3.7 X 10¹⁰ dps
Activity (A) = rate of decay No = number of active nuclei at time t = 0N(t) is the number of active nuclei at time ‘t’λ is the decay constant
λ = 0.693/T (T = half-life)
dN/dt = -λ N(t)
N(t) = Noe-λt
A(t) = Aoe-λt
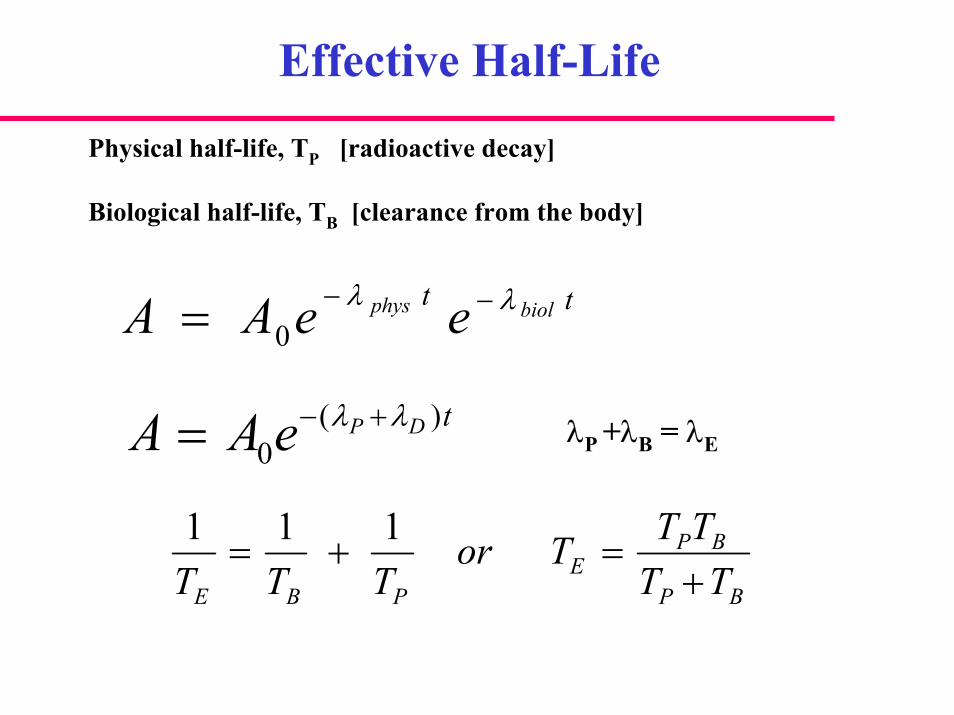
Effective Half-Life
Physical half-life, TP [radioactive decay]
Biological half-life, TB [clearance from the body]
tt biolphys eeAA λλ −−= 0
tDPeAA )(0
λλ +−= λP +λB = λE
BP
BPE
PBE TTTTTor
TTT +=+=
111
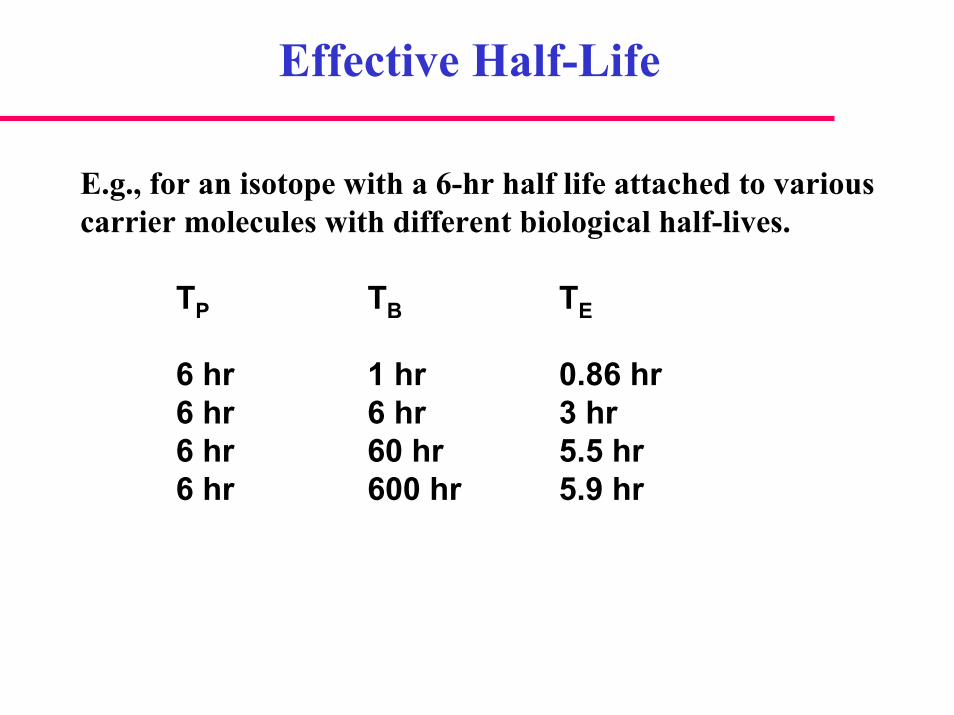
Effective Half-Life
E.g., for an isotope with a 6-hr half life attached to various carrier molecules with different biological half-lives.
TP TB TE
6 hr 1 hr 0.86 hr6 hr 6 hr 3 hr6 hr 60 hr 5.5 hr6 hr 600 hr 5.9 hr
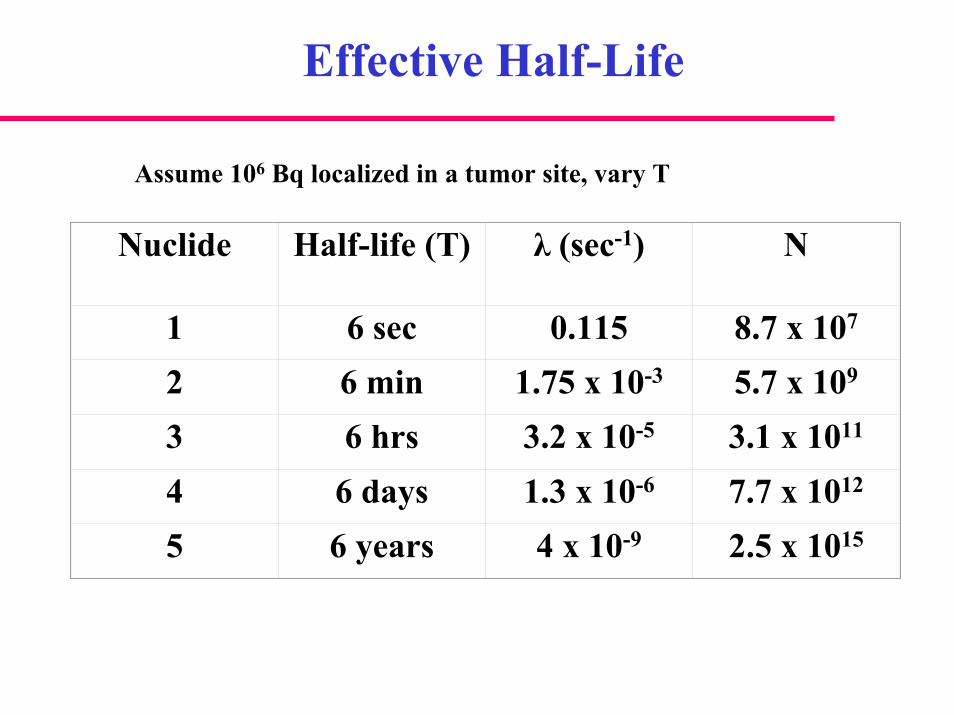
Effective Half-Life
Assume 106 Bq localized in a tumor site, vary T
Nuclide Half-life (T) λ (sec-1) N
1 6 sec 0.115 8.7 x 10⁷
2 6 min 1.75 x 10⁻³ 5.7 x 10⁹
3 6 hrs 3.2 x 10⁻⁵ 3.1 x 10¹¹
4 6 days 1.3 x 10⁻⁶ 7.7 x 10¹²
5 6 years 4 x 10⁻⁹ 2.5 x 10¹⁵
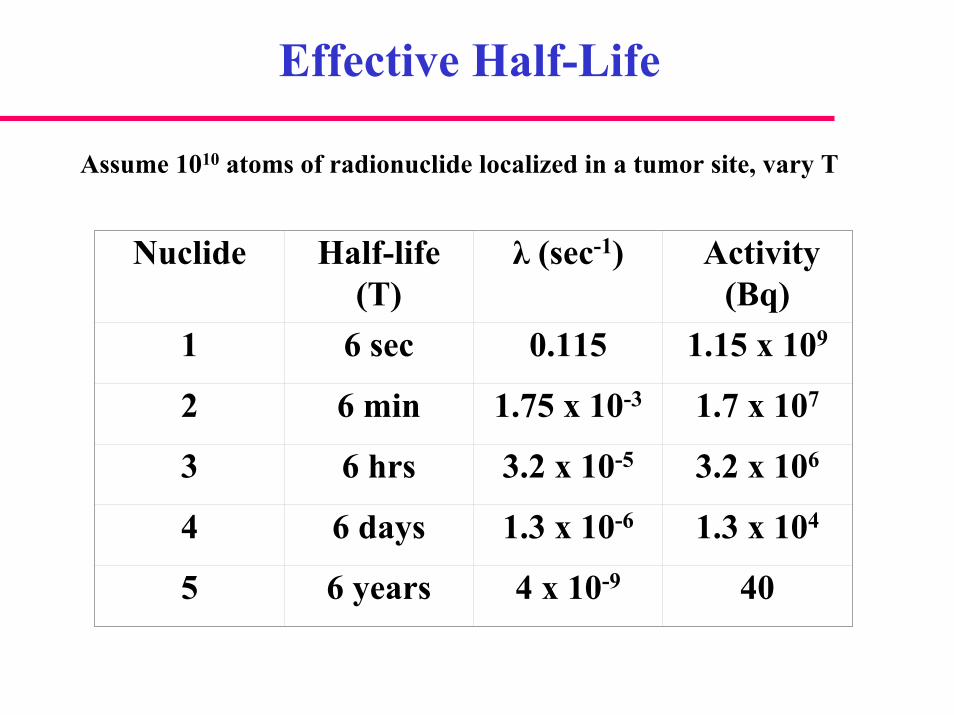
Effective Half-Life
Assume 1010 atoms of radionuclide localized in a tumor site, vary T
Nuclide Half-life (T)
λ (sec-1) Activity (Bq)
1 6 sec 0.115 1.15 x 10⁹
2 6 min 1.75 x 10⁻³ 1.7 x 10⁷
3 6 hrs 3.2 x 10⁻⁵ 3.2 x 10⁶
4 6 days 1.3 x 10⁻⁶ 1.3 x 10⁴
5 6 years 4 x 10⁻⁹ 40
Production of Radionuclides
Reactor production, Nuclear fission
• Heavy nuclides (A > 230) capture a neutron; tend to fission
• Daughter nuclides of ~ half the parent mass are produced
• Possible to purify nuclides carrier free (chemically different)
• Nuclides generally neutron rich and decay by β- emission
Production of Radionuclides
Image removed due to copyright restrictions.
Production of Radionuclides
Image removed due to copyright restrictions.
Production of Radionuclides
Cyclotron production: Charged particle bombardment
• Accelerates charged particles to high energies
• Nuclear reactions have threshold energies
• The product is different than the target
• Nuclides can be produced carrier-free
Production of Radionuclides
Image removed due to copyright restrictions.
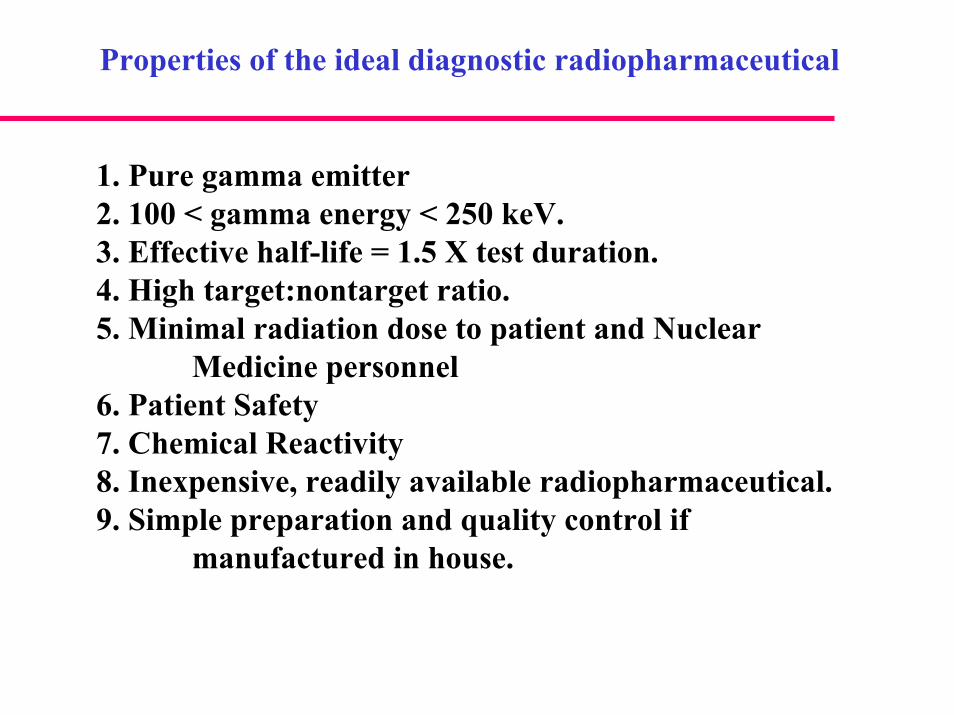
Properties of the ideal diagnostic radiopharmaceutical
1. Pure gamma emitter 2. 100 < gamma energy < 250 keV.3. Effective half-life = 1.5 X test duration. 4. High target:nontarget ratio. 5. Minimal radiation dose to patient and Nuclear
Medicine personnel6. Patient Safety7. Chemical Reactivity8. Inexpensive, readily available radiopharmaceutical. 9. Simple preparation and quality control if
manufactured in house.
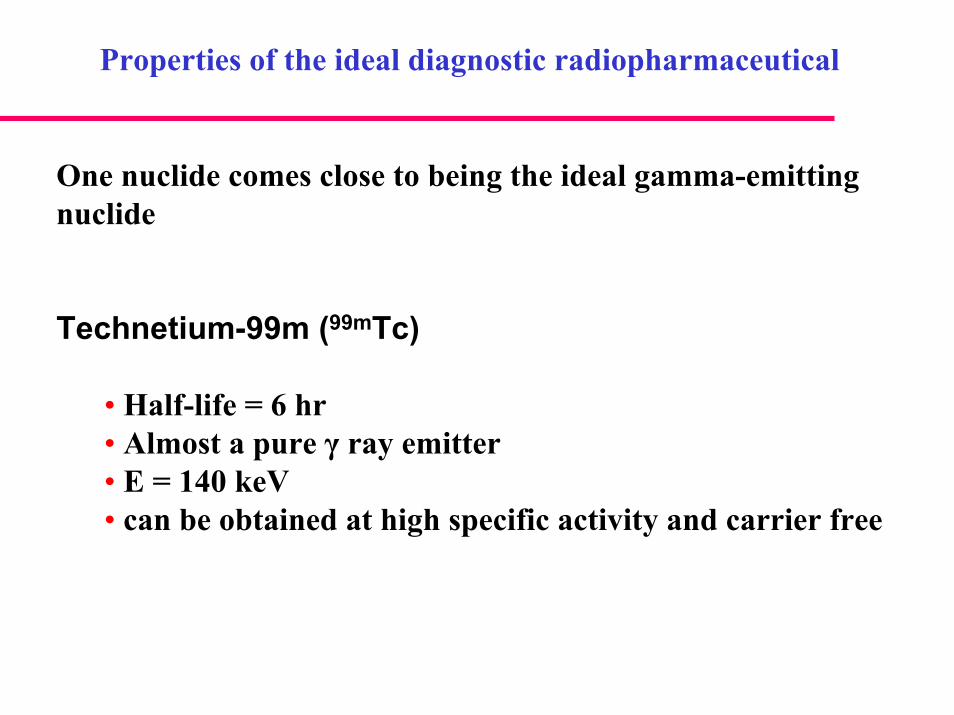
Properties of the ideal diagnostic radiopharmaceutical
One nuclide comes close to being the ideal gamma-emitting nuclide
Technetium-99m (99mTc)
• Half-life = 6 hr• Almost a pure γ ray emitter• E = 140 keV• can be obtained at high specific activity and carrier free
Nuclides
99mTc
99mTc is a decay product of the fission product 99Mo
Image removed due to copyright restrictions.
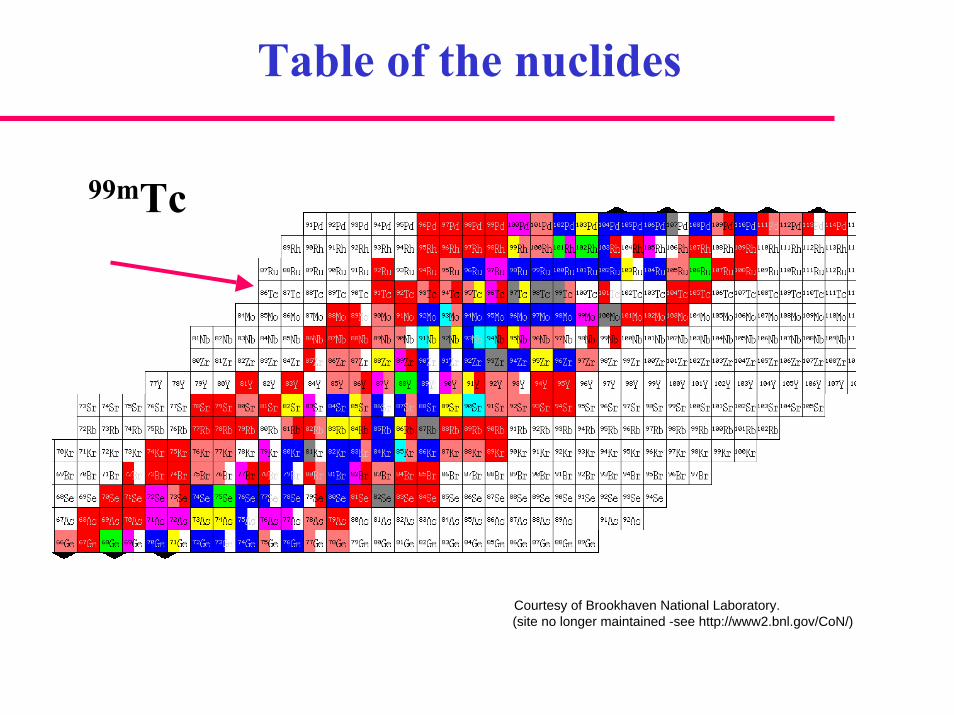
Table of the nuclides
99mTc
Courtesy of Brookhaven National Laboratory.(site no longer maintained -see http://www2.bnl.gov/CoN/)
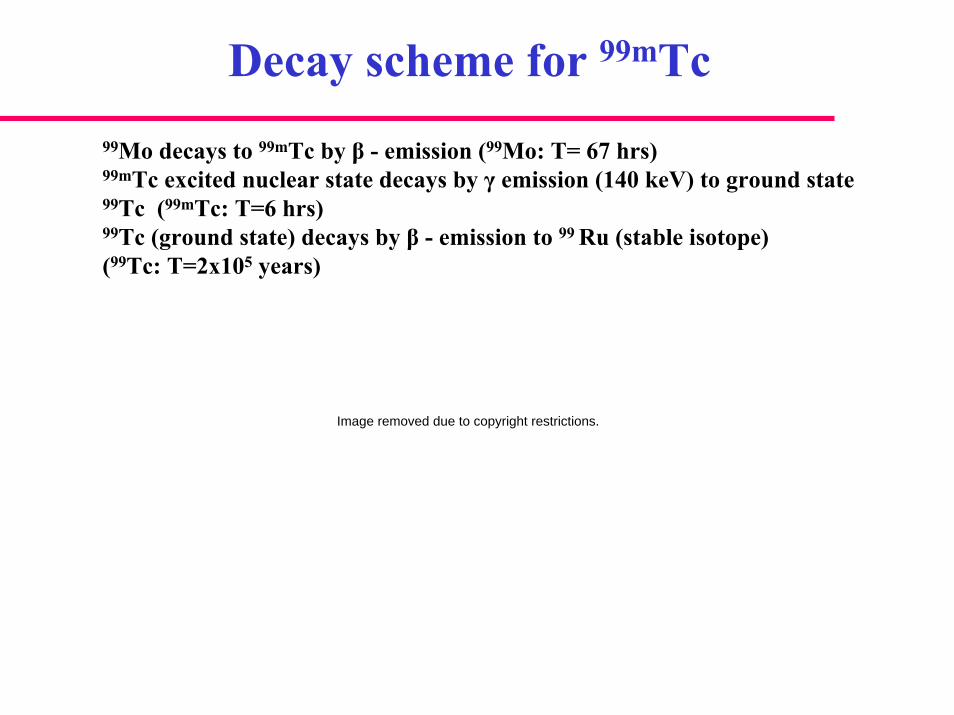
Decay scheme for 99mTc99Mo decays to 99mTc by β - emission (99Mo: T= 67 hrs)99mTc excited nuclear state decays by γ emission (140 keV) to ground state 99Tc (99mTc: T=6 hrs)99Tc (ground state) decays by β - emission to 99 Ru (stable isotope) (99Tc: T=2x10⁵ years)
Image removed due to copyright restrictions.
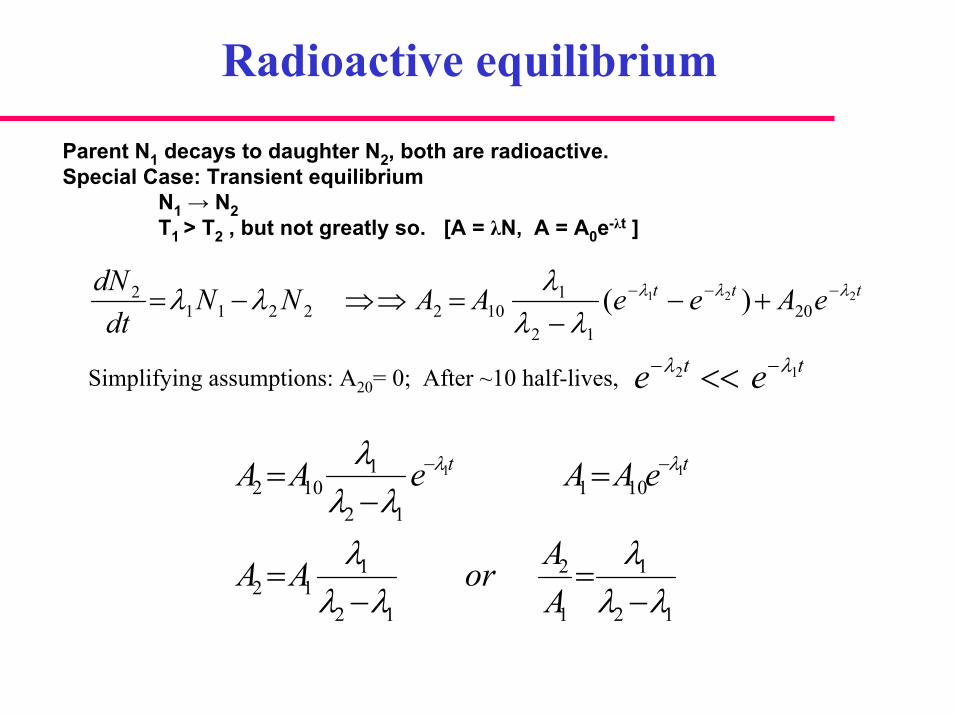
Radioactive equilibrium
Parent N1 decays to daughter N2, both are radioactive.Special Case: Transient equilibrium
N1 → N2T1 > T2 , but not greatly so. [A = λN, A = A0e-λt ]
ttt eAeeAANNdt
dN221
2012
11022211
2 )( λλλ
λλλλλ −−− +−−
=⇒⇒−=
Simplifying assumptions: A20= 0; After ~10 half-lives, tt ee 12 λλ −− <<
12
1
1
2
12
112
10112
1102
11
λλλ
λλλλλ
λ λλ
−=
−=
=−
= −−
AAorAA
eAAeAA tt
Radioactive Decay
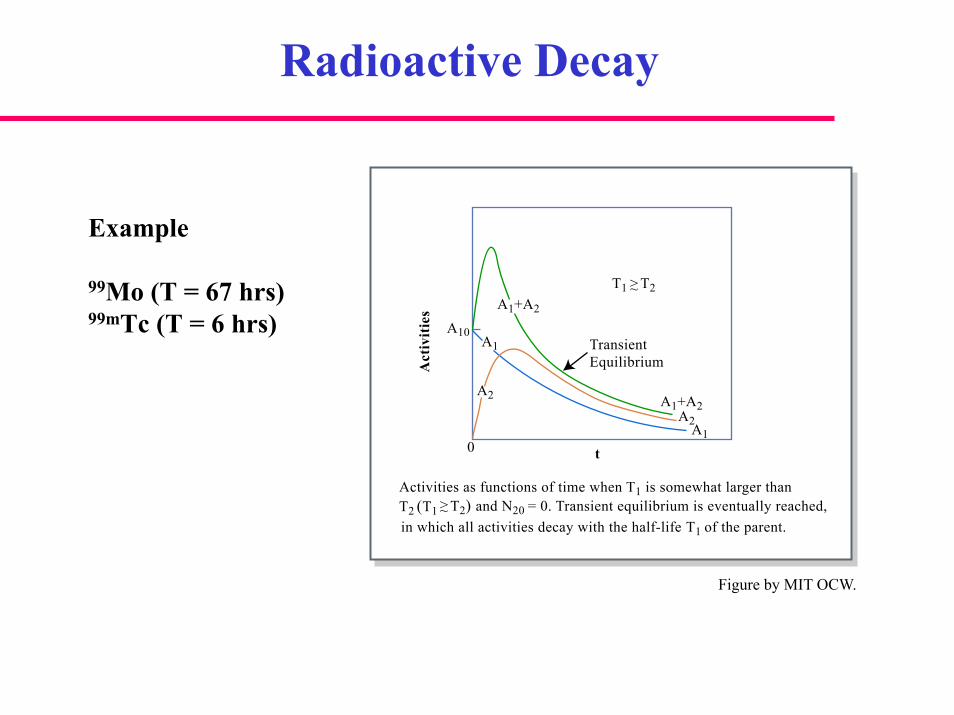
Example
99Mo (T = 67 hrs) 99mTc (T = 6 hrs)
0
A10
t
Act
iviti
es
Activities as functions of time when T1 is somewhat larger than T2 (T1
A2
A2
A1
A1
A1+A2
A1+A2
T1 T2>~
T2) and N20 = 0. Transient equilibrium is eventually reached,in which all activities decay with the half-life T1 of the parent.
>~
TransientEquilibrium
Figure by MIT OCW.
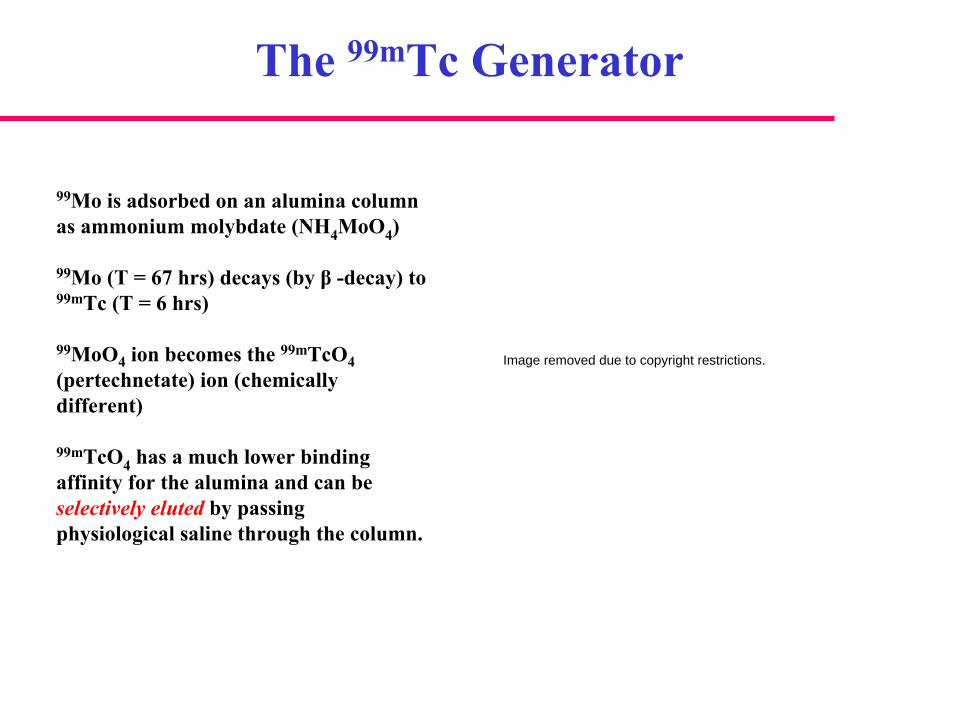
The 99mTc Generator
99Mo is adsorbed on an alumina column as ammonium molybdate (NH4MoO4)
99Mo (T = 67 hrs) decays (by β -decay) to 99mTc (T = 6 hrs)
99MoO4 ion becomes the 99mTcO4(pertechnetate) ion (chemically different)
99mTcO4 has a much lower binding affinity for the alumina and can be selectively eluted by passing physiological saline through the column.
Image removed due to copyright restrictions.
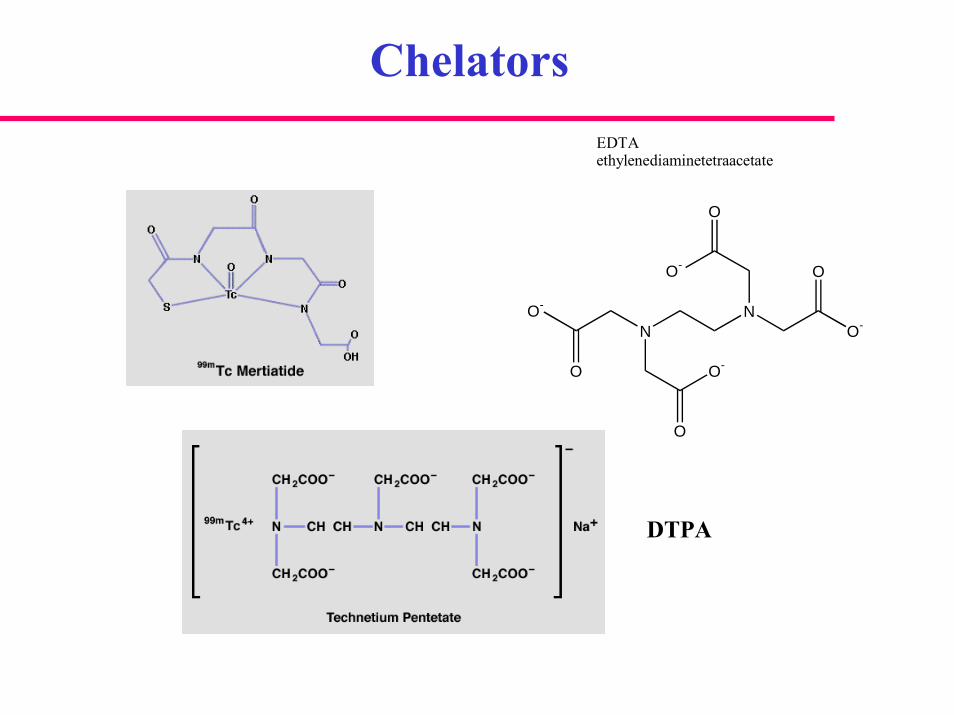
Chelators
NN
O-
OO-
O
O-
O
O-
O
EDTAethylenediaminetetraacetate
DTPA
Chelators
Image removed due to copyright restrictions.
Production of Radionuclides
Cyclotron production
• Products are proton rich, neutron deficient
• Decay by β+ decay
• Positron emitters
Image removed due to copyright restrictions.
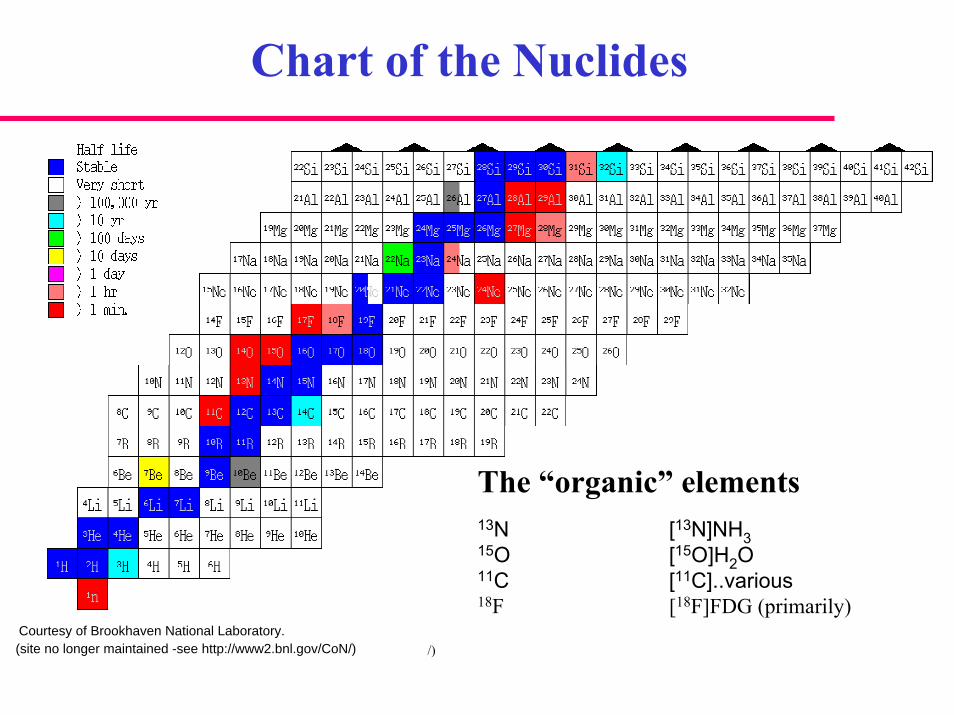
Chart of the Nuclides
The “organic” elements13N [13N]NH315O [15O]H2O11C [11C]..various18F [18F]FDG (primarily)
/)Courtesy of Brookhaven National Laboratory.(site no longer maintained -see http://www2.bnl.gov/CoN/)
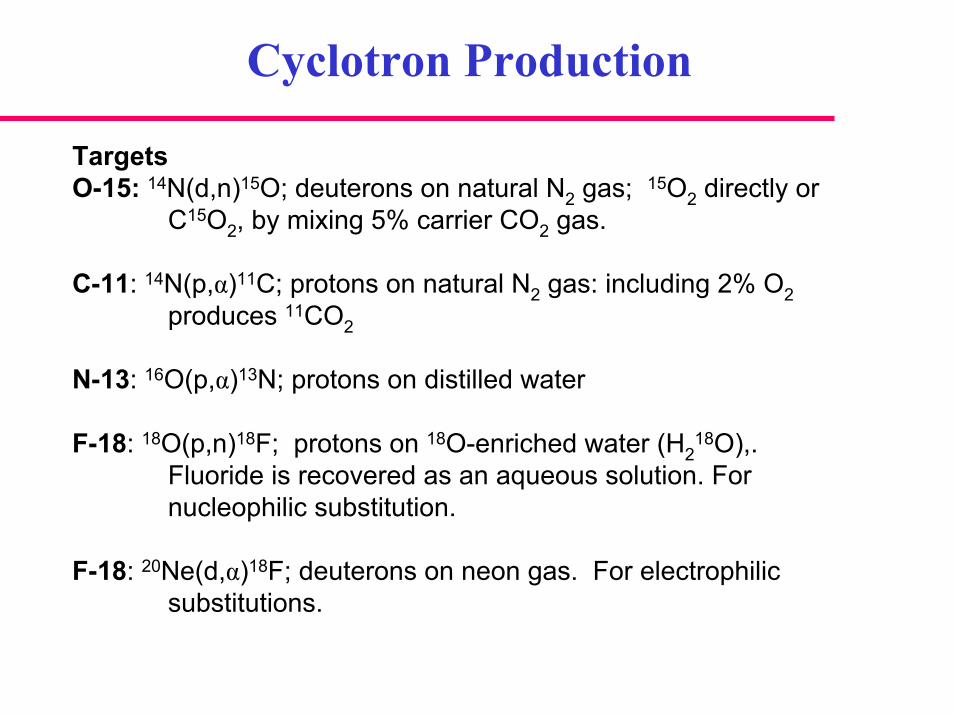
Cyclotron Production
TargetsO-15: 14N(d,n)15O; deuterons on natural N2 gas; 15O2 directly or
C15O2, by mixing 5% carrier CO2 gas.
C-11: 14N(p,α)11C; protons on natural N2 gas: including 2% O2produces 11CO2
N-13: 16O(p,α)13N; protons on distilled water
F-18: 18O(p,n)18F; protons on 18O-enriched water (H218O),.
Fluoride is recovered as an aqueous solution. For nucleophilic substitution.
F-18: 20Ne(d,α)18F; deuterons on neon gas. For electrophilic substitutions.
PET Radiopharmaceuticals
Image removed due to copyright restrictions.
PET Radiopharmaceuticals
• 11CO2 from the target is converted into a highly reactivemethylating agent: 11CH3I or 11CH3Tf • Elapsed time is 12 minutes.. • The radiochemical yield, based on 11CO2 is about 90%. • Specific activities of more than 6 Ci/µmol (220 GBq/µmol) can be obtained.• 11C-Methylation of various precursors is performed in the second reaction vessel within a few minutes.• After methylation, the reaction product is separated via a semi preparative Radio-HPLC, purified via a solid phase extraction unit, followed by formulation of the radiotracer as an injectable saline solution.
Delivery strategies
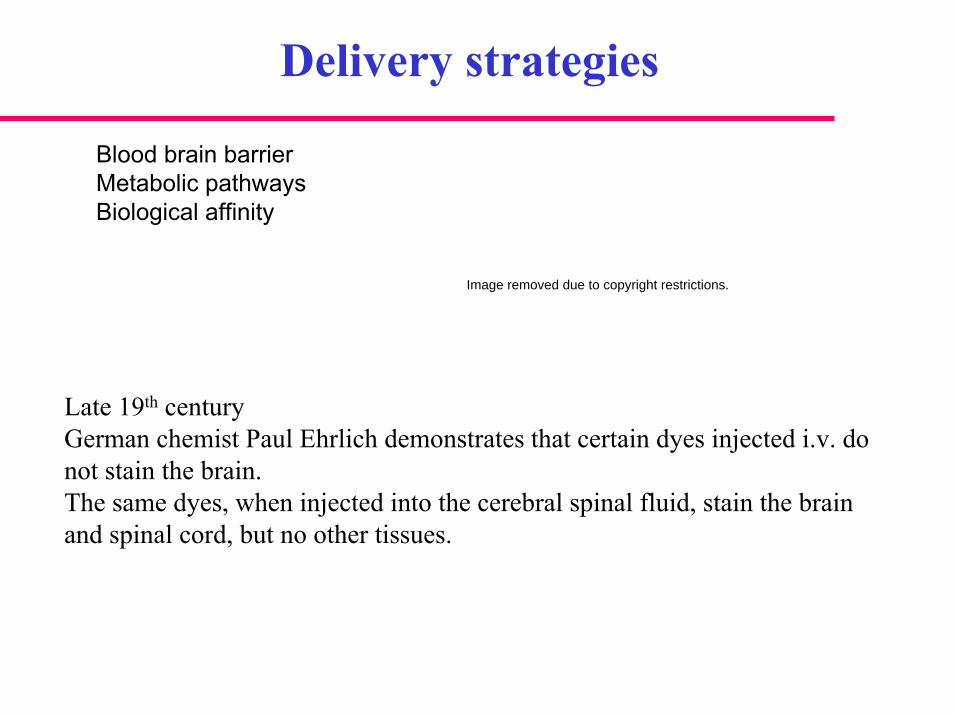
Blood brain barrierMetabolic pathwaysBiological affinity
Late 19th centuryGerman chemist Paul Ehrlich demonstrates that certain dyes injected i.v. do not stain the brain. The same dyes, when injected into the cerebral spinal fluid, stain the brain and spinal cord, but no other tissues.
Image removed due to copyright restrictions.
The Blood-Brain Barrier
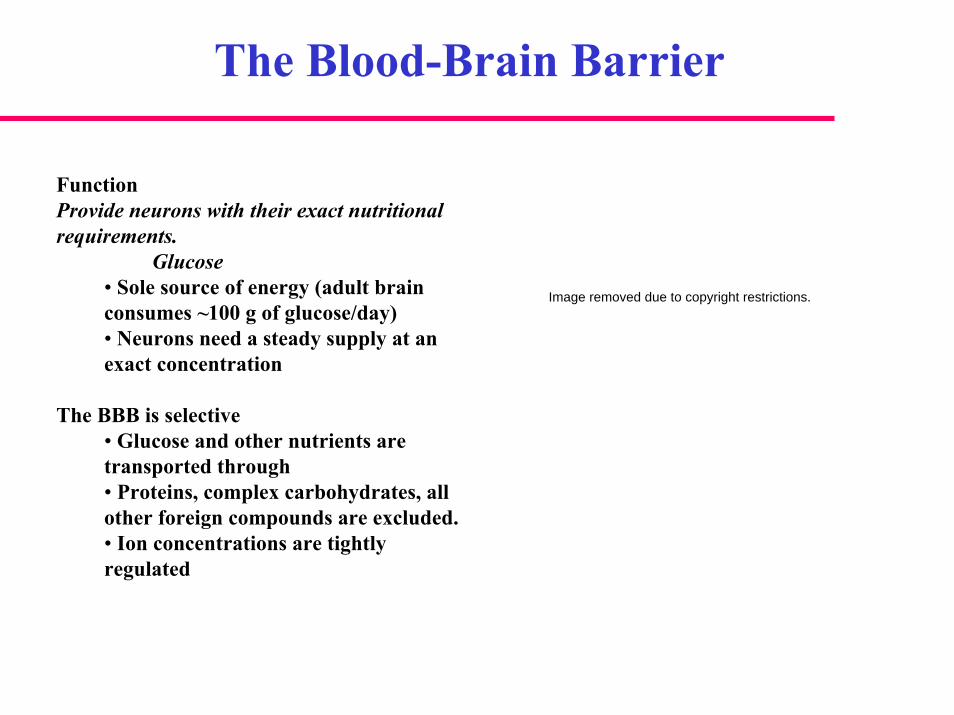
FunctionProvide neurons with their exact nutritional requirements.
Glucose• Sole source of energy (adult brain consumes ~100 g of glucose/day)• Neurons need a steady supply at an exact concentration
The BBB is selective• Glucose and other nutrients are transported through • Proteins, complex carbohydrates, all other foreign compounds are excluded.• Ion concentrations are tightly regulated
Image removed due to copyright restrictions.
Drug Delivery
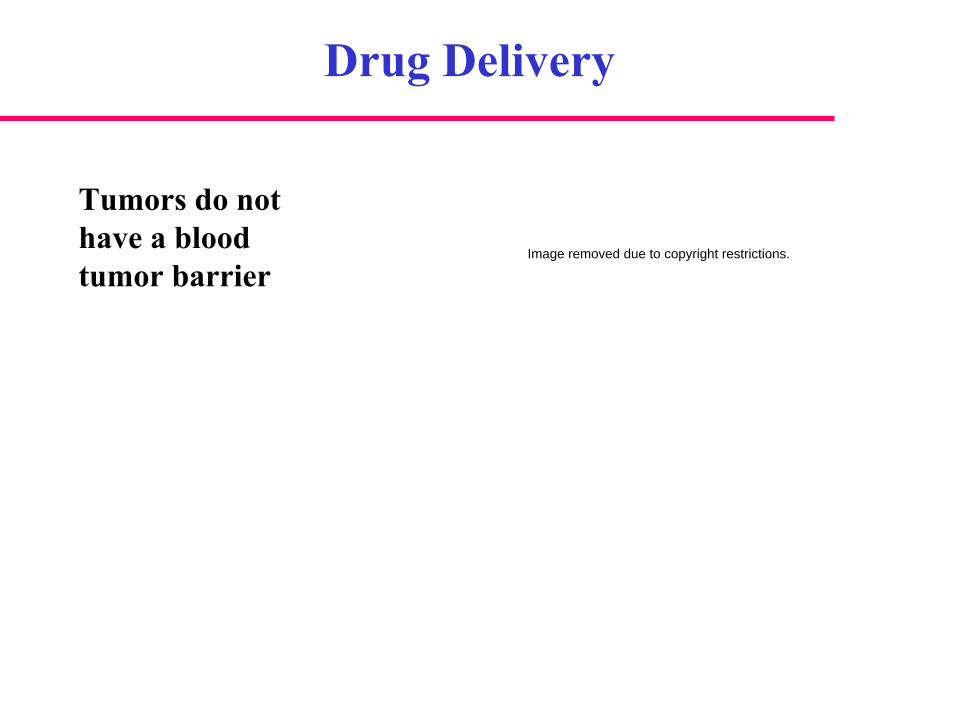
Tumors do not have a blood tumor barrier
Image removed due to copyright restrictions.
Delivery Strategies: Metabolic pathways
O
OH
H
OH
H
H
H
FHOH
OH
O
OH
H
OH
H
H
H
OHHOH
OH
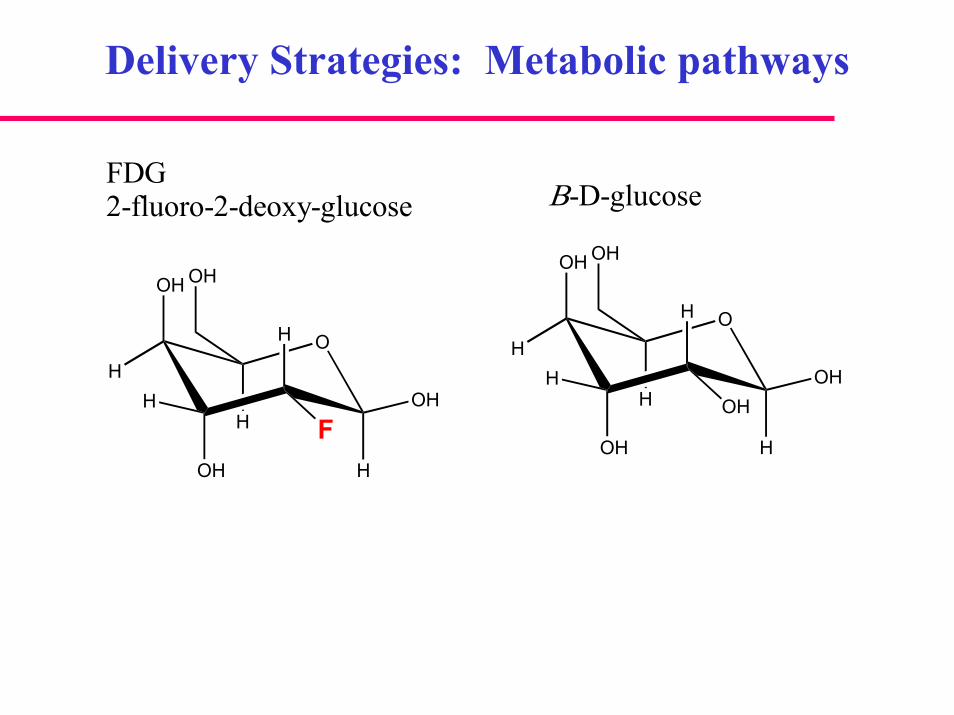
FDG2-fluoro-2-deoxy-glucose Β-D-glucose
Delivery Strategies: Metabolic pathways
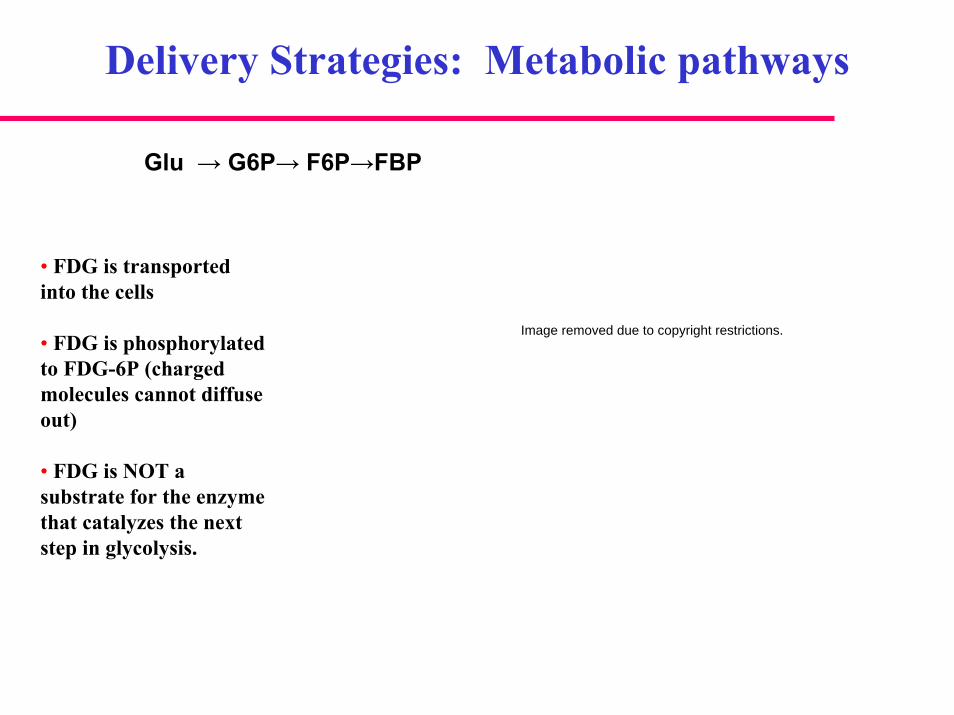
Glu → G6P→ F6P→FBP
• FDG is transported into the cells
• FDG is phosphorylatedto FDG-6P (charged molecules cannot diffuse out)
• FDG is NOT a substrate for the enzyme that catalyzes the next step in glycolysis.
Image removed due to copyright restrictions.

Mapping Human Brain Function
18F-FDG PET scans show different patterns of glucose metabolism related to various tasks.
Image removed due to copyright restrictions.
FDG in Oncology
• FDG transport into tumors occurs at a higher rate than in the surrounding normal tissues.• FDG is de-phosphorylated and can then leave the cell.• The dephosphorylation occurs at a slower rate in tumors.
Applications of FDG•Locating unknown primaries•Differentiation of tumor from normal tissue•Pre-operative staging of disease (lung, breast, colorectal, melanoma, H&N, pancreas)•Recurrence vs necrosis•Recurrence vs post-operative changes (limitations with FDG)•Monitoring response to therapy
Delivery Strategies: Metabolic pathways
H2N CH C
CH2
OH
O
CH2
S
CH3
O
HOH
FH
HH
HO
HN
N
O
O
I
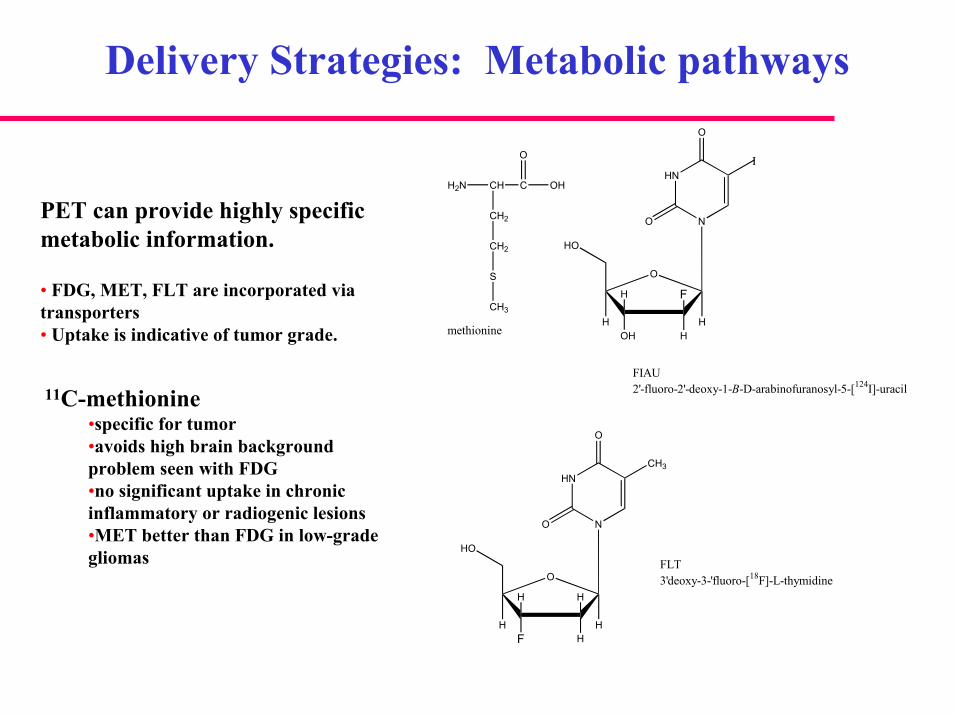
FIAU2'-fluoro-2'-deoxy-1-B-D-arabinofuranosyl-5-[124I]-uracil
O
HF
HH
HH
HO
HN
N
O
O
CH3
FLT3'deoxy-3-'fluoro-[18F]-L-thymidine
methionine
PET can provide highly specific metabolic information.
• FDG, MET, FLT are incorporated via transporters• Uptake is indicative of tumor grade.
11C-methionine•specific for tumor•avoids high brain background problem seen with FDG•no significant uptake in chronic inflammatory or radiogenic lesions•MET better than FDG in low-gradegliomas
Functional imaging of gliomas
Imaging objectives
• Location and relation to surrounding brain activity
• Biological activity = malignancy
• Response to therapy
Image removed due to copyright restrictions.
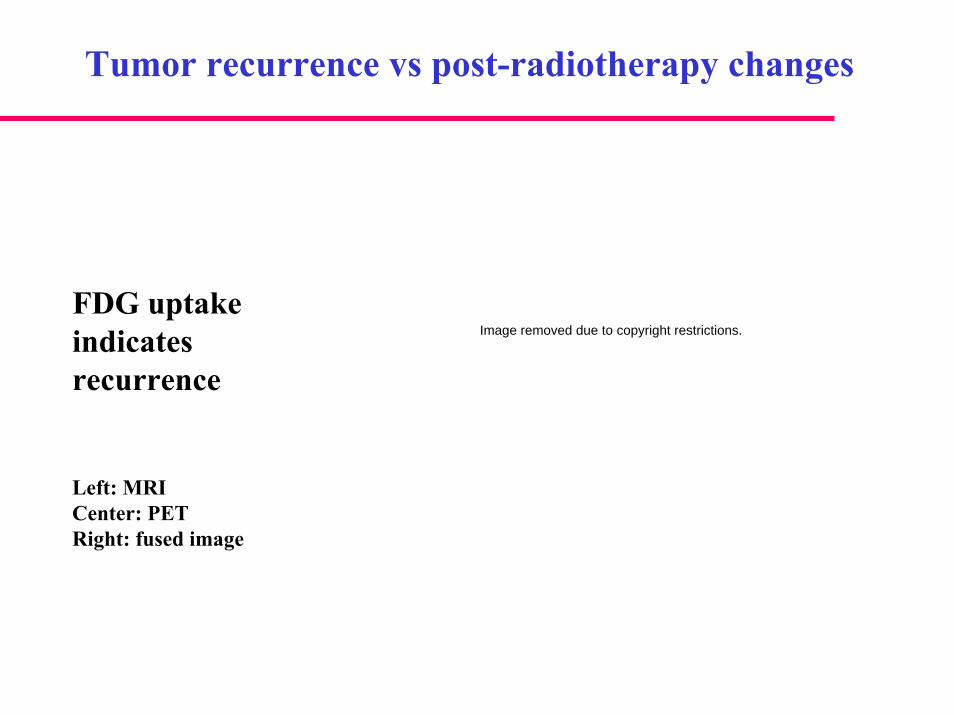
Tumor recurrence vs post-radiotherapy changes
FDG uptake indicates recurrence
Left: MRICenter: PETRight: fused image
Image removed due to copyright restrictions.
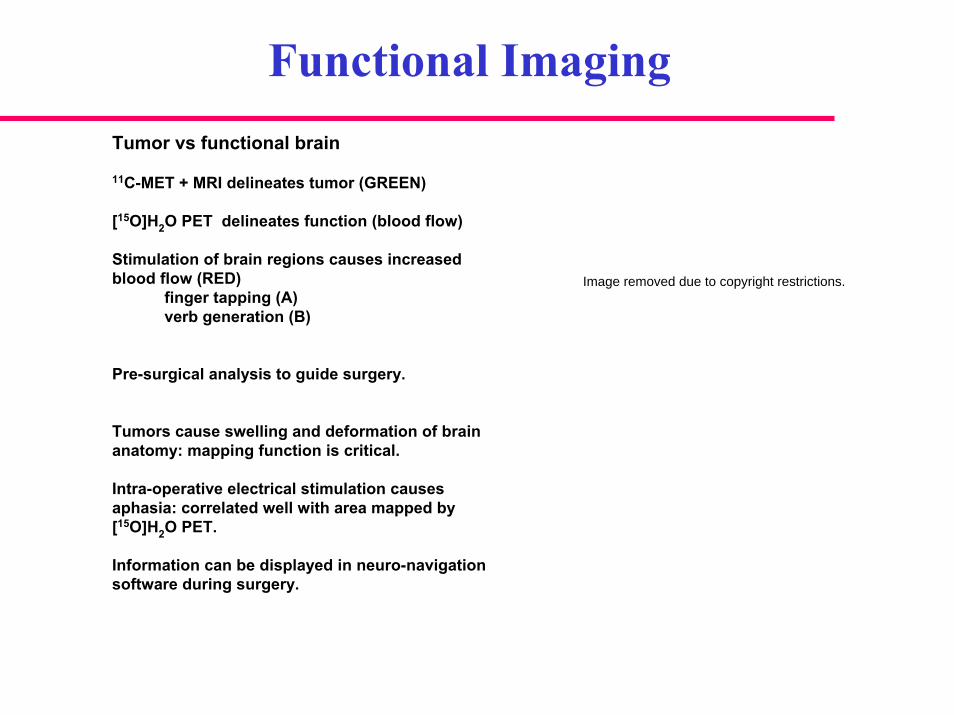
Functional ImagingTumor vs functional brain
11C-MET + MRI delineates tumor (GREEN)
[15O]H2O PET delineates function (blood flow)
Stimulation of brain regions causes increased blood flow (RED)
finger tapping (A)verb generation (B)
Pre-surgical analysis to guide surgery.
Tumors cause swelling and deformation of brain anatomy: mapping function is critical.
Intra-operative electrical stimulation causes aphasia: correlated well with area mapped by [15O]H2O PET.
Information can be displayed in neuro-navigation software during surgery.
Image removed due to copyright restrictions.
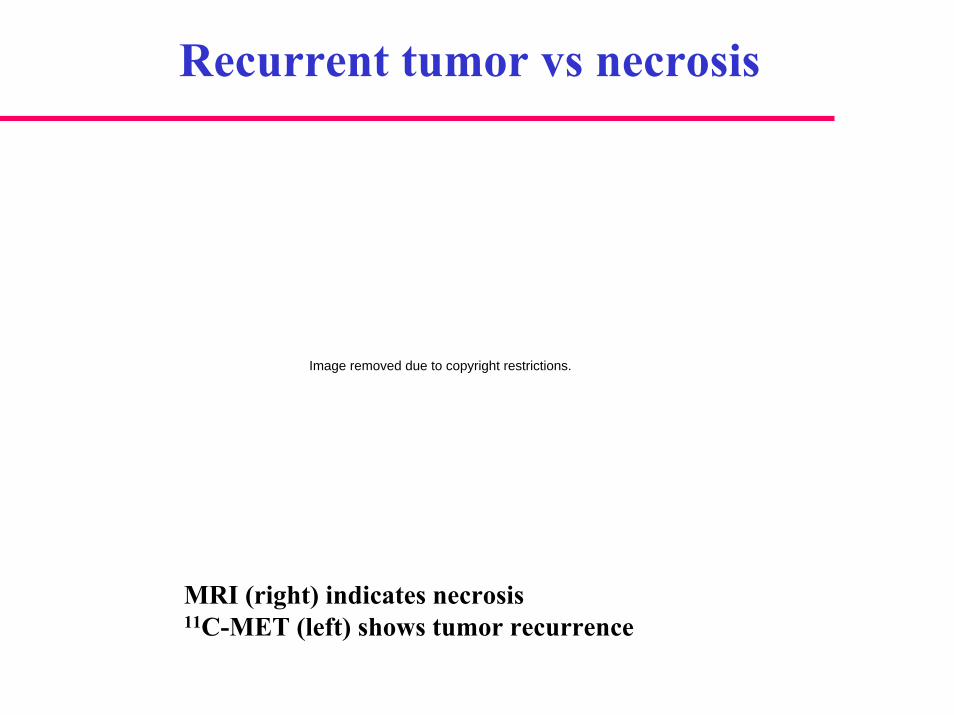
Recurrent tumor vs necrosis
MRI (right) indicates necrosis11C-MET (left) shows tumor recurrence
Image removed due to copyright restrictions.
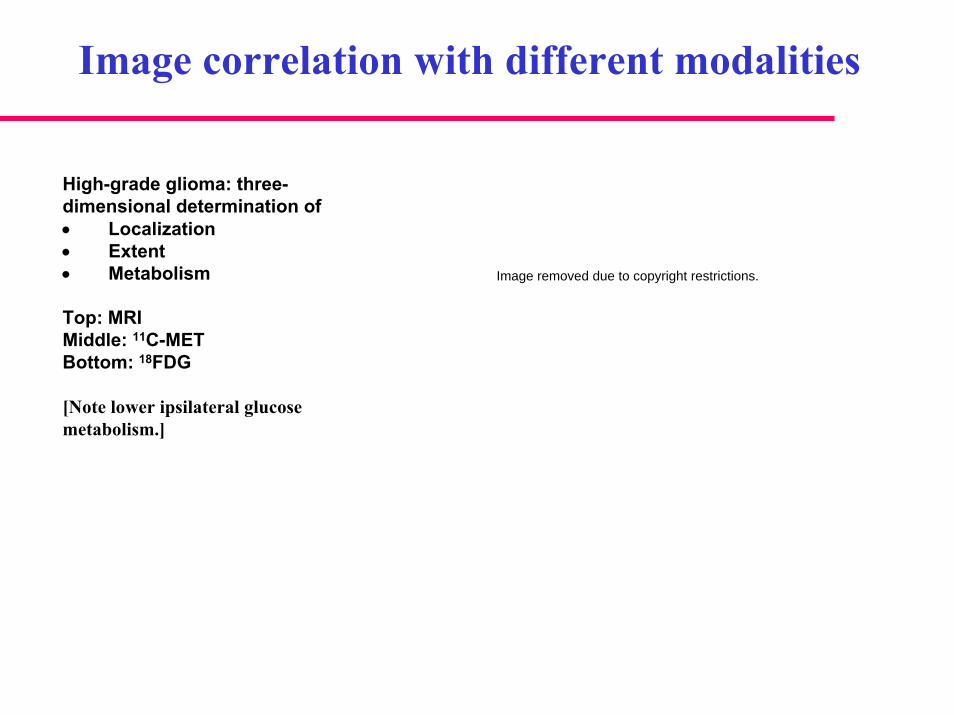
Image correlation with different modalities
High-grade glioma: three-dimensional determination of • Localization• Extent• Metabolism
Top: MRI Middle: 11C-METBottom: 18FDG
[Note lower ipsilateral glucose metabolism.]
Image removed due to copyright restrictions.
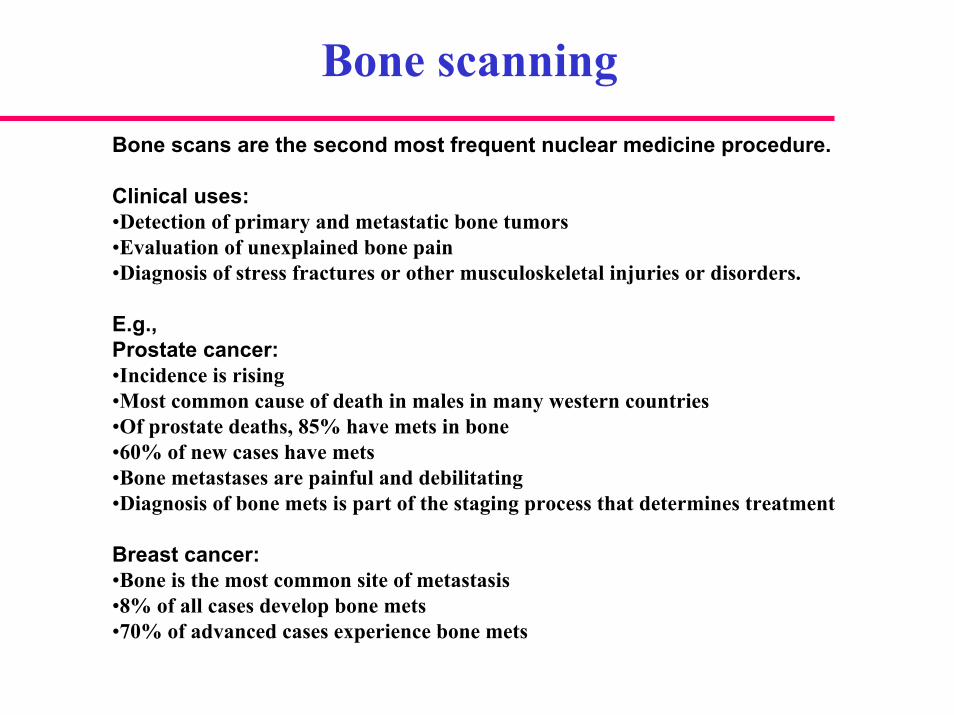
Bone scanningBone scans are the second most frequent nuclear medicine procedure.
Clinical uses:•Detection of primary and metastatic bone tumors•Evaluation of unexplained bone pain•Diagnosis of stress fractures or other musculoskeletal injuries or disorders.
E.g., Prostate cancer:•Incidence is rising•Most common cause of death in males in many western countries•Of prostate deaths, 85% have mets in bone•60% of new cases have mets•Bone metastases are painful and debilitating •Diagnosis of bone mets is part of the staging process that determines treatment
Breast cancer:•Bone is the most common site of metastasis•8% of all cases develop bone mets•70% of advanced cases experience bone mets
Bone
Bone is a living tissue comprised of a crystalline matrix ofhydroxyapatite Ca5(PO4)3OH in a collagen matrix.
Osteoblasts: responsible for new bone formation, repair of damaged sites, lay down new crystalline hydroxyapatite.
Osteoclasts: responsible for bone resorption, dissolve bone.Osteoclasts are more active in metastatic tumor sites.
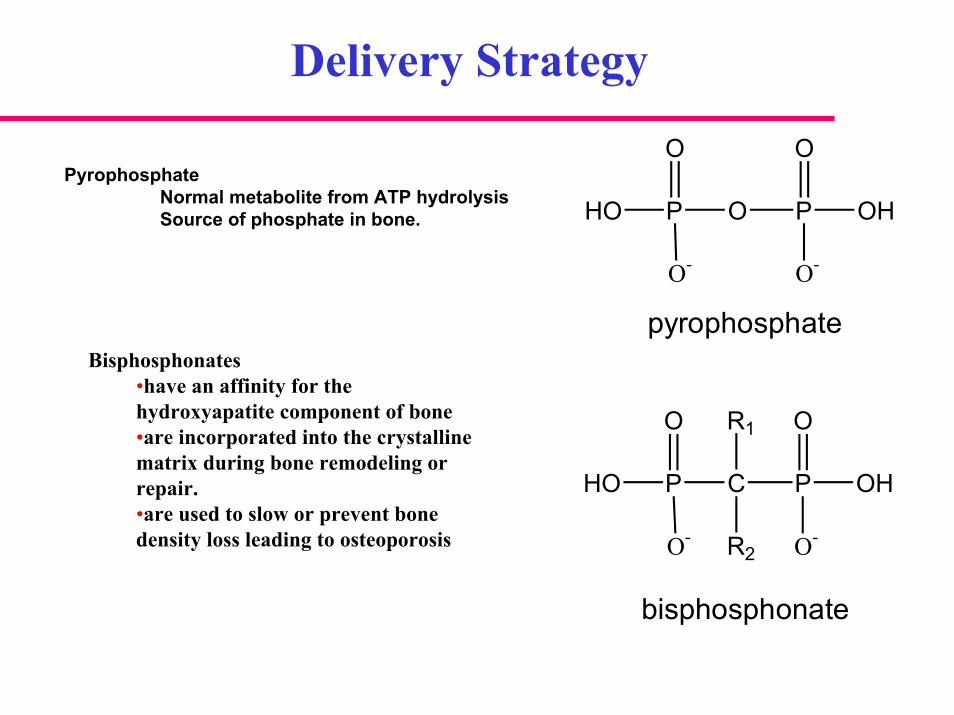
Delivery Strategy
P O PHO
O-
OH
O
O-
O
P C PHO
O-
OH
O
O-
O R1
R2
pyrophosphate
bisphosphonate
PyrophosphateNormal metabolite from ATP hydrolysisSource of phosphate in bone.
Bisphosphonates •have an affinity for thehydroxyapatite component of bone•are incorporated into the crystalline matrix during bone remodeling or repair.•are used to slow or prevent bone density loss leading to osteoporosis
Bone Scans
Normal pediatric bone image
Image removed due to copyright restrictions.
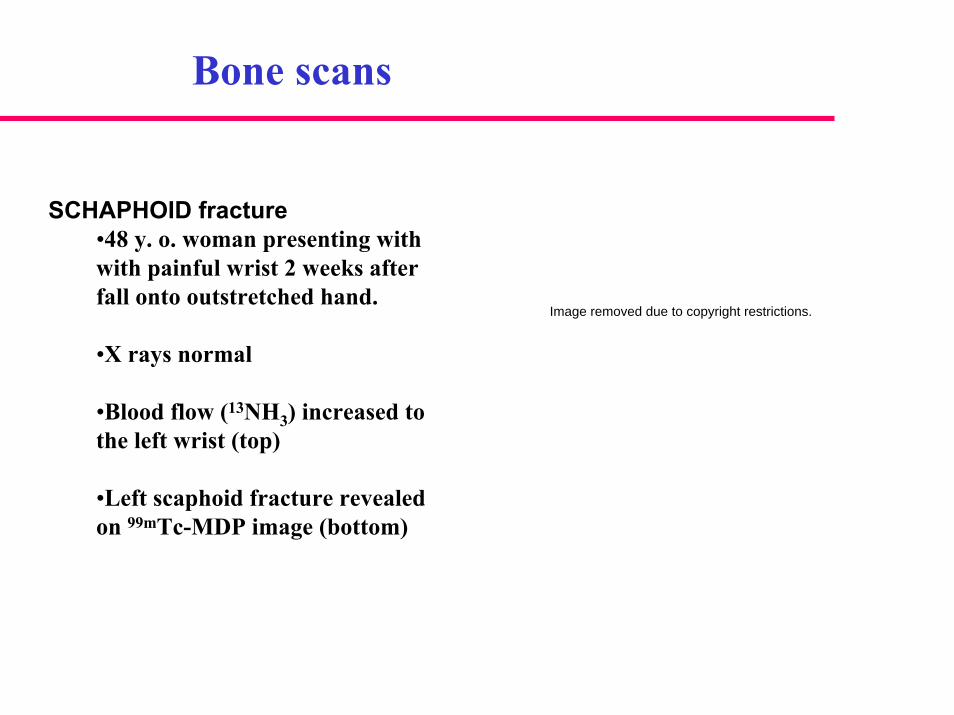
Bone scans
SCHAPHOID fracture •48 y. o. woman presenting with with painful wrist 2 weeks after fall onto outstretched hand.
•X rays normal
•Blood flow (13NH3) increased to the left wrist (top)
•Left scaphoid fracture revealed on 99mTc-MDP image (bottom)
Image removed due to copyright restrictions.
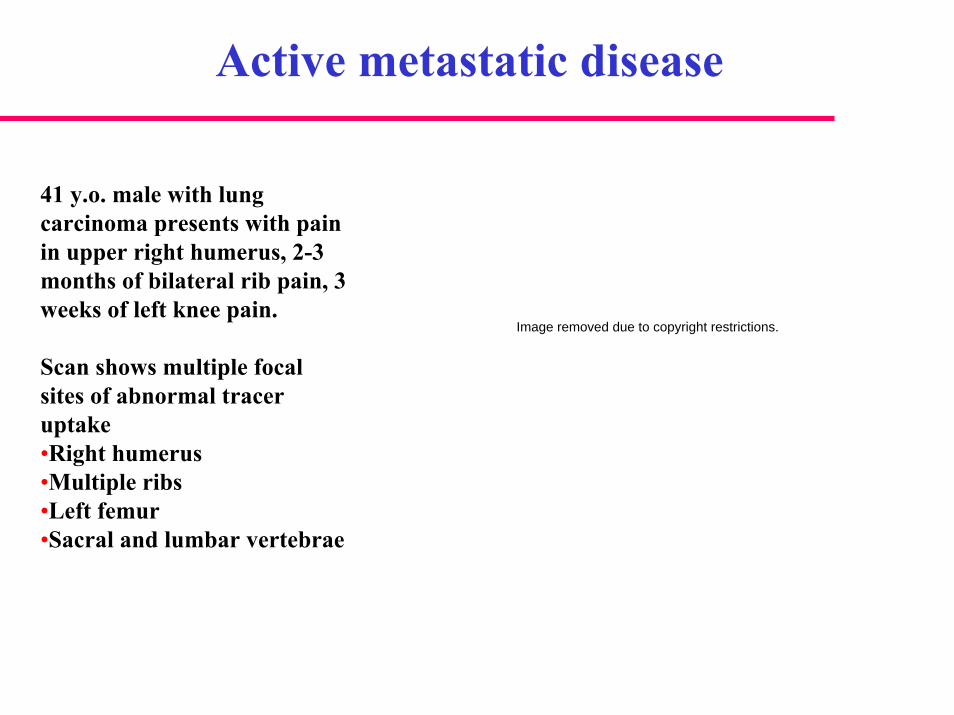
Active metastatic disease
41 y.o. male with lung carcinoma presents with pain in upper right humerus, 2-3 months of bilateral rib pain, 3 weeks of left knee pain.
Scan shows multiple focal sites of abnormal tracer uptake•Right humerus•Multiple ribs•Left femur•Sacral and lumbar vertebrae
Image removed due to copyright restrictions.
Coronary artery disease
Use PET and/or SPECT imaging to assess information on:
• perfusion
• metabolism
• distinguish viable from non-viable myocardium.
Cardiac Imaging
Image removed due to copyright restrictions.
The Cardiac Stress Test
Exercise causes•Increased HR, contractility, BP•Increased O2 demand•Coronary vasodilationIncreased myocardial blood flow
Image removed due to copyright restrictions.
Gene Therapy
Image removed due to copyright restrictions.
Gene TherapyUse of PET to confirm vector gene expression
Specific retention of FIAU PET signal at 68 hrs (left) indicates phosphorylationby HSV TK.
Same area shows necrosis after treatment with ganciclovir (right).
Image removed due to copyright restrictions.
PET in studies of substance abuse
Drugs of abuse
• Why are they pleasurable?• What brain changes reinforce usage and lead to addiction?
Brain Function
Changes in specific components of this system present in various disease states.
Parkinsons Diseaseagingsubstance abusedepression.
Image removed due to copyright restrictions.
Brain Function
Quantitative PET
•Signal intensity in regions of interest is monitored as a function of time.
•Concurrent sampling of arterial blood allows correlation of signal to blood concentration.
•Pharmacologic doses of antagonist block PET tracer uptake.
Image removed due to copyright restrictions.
Drug Addiction
•Cocaine: one of the most reinforcing drugs of abuse•Cocaine binds to the DA re-uptake transporter (DAT)•DAT blockade results in increased DA concentrations.Effect is greatest in brain regions rich in DA neurons (e.g., basal ganglia).
Image removed due to copyright restrictions.
Drug Addiction
Control 1 week de-tox 3 months de-tox
FDG PET: Low frontal metabolism may underlie the loss of control in cocaine addiction.
Image removed due to copyright restrictions.

Drug Addiction
Image removed due to copyright restrictions.
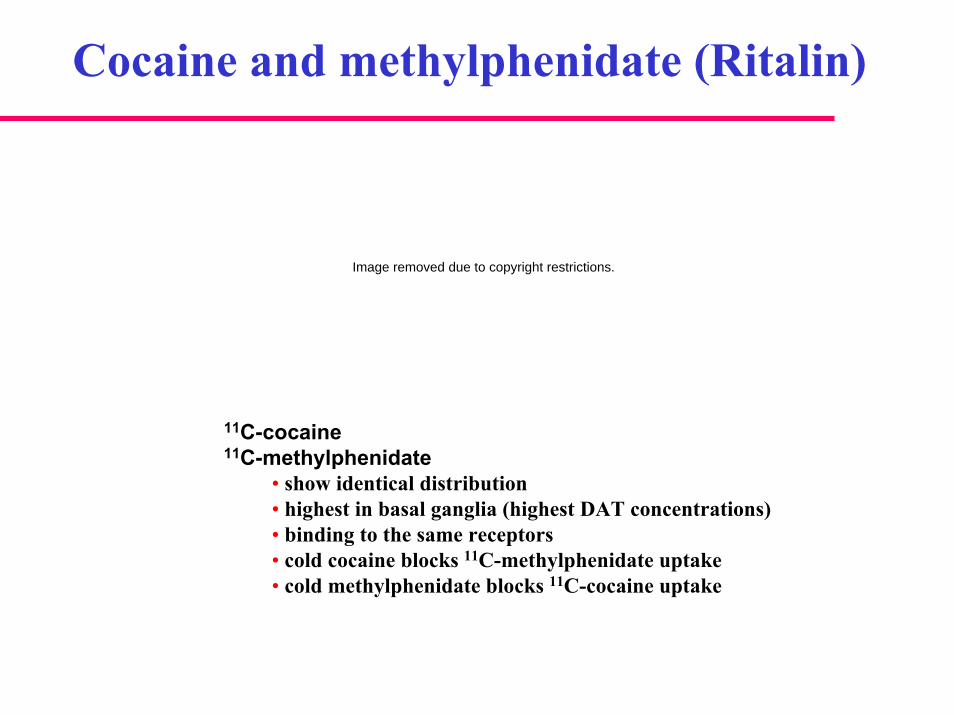
Cocaine and methylphenidate (Ritalin)
11C-cocaine11C-methylphenidate
• show identical distribution• highest in basal ganglia (highest DAT concentrations)• binding to the same receptors• cold cocaine blocks 11C-methylphenidate uptake• cold methylphenidate blocks 11C-cocaine uptake
Image removed due to copyright restrictions.
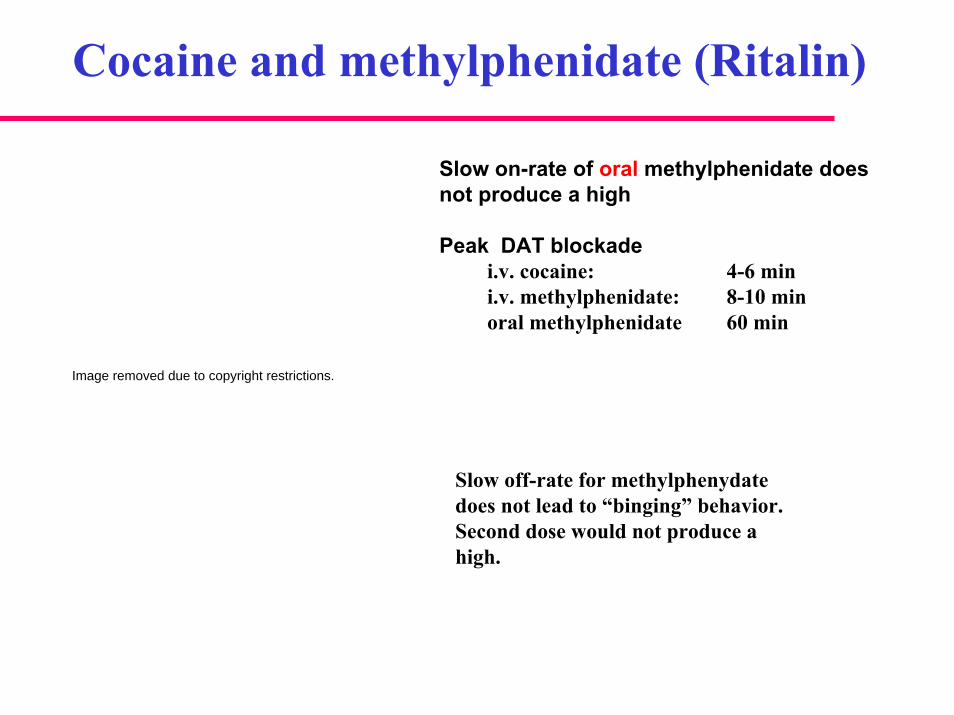
Cocaine and methylphenidate (Ritalin)
Slow on-rate of oral methylphenidate does not produce a high
Peak DAT blockadei.v. cocaine: 4-6 mini.v. methylphenidate: 8-10 minoral methylphenidate 60 min
Slow off-rate for methylphenydatedoes not lead to “binging” behavior. Second dose would not produce a high.
Image removed due to copyright restrictions.