Embed Size (px)
Citation preview
PTD
Hpaao
D
F
A
1
ositron Emissionomography/Computed Tomographyavid W. Townsend, PhD
Accurate anatomical localization of functional abnormalities obtained with the use ofpositron emission tomography (PET) is known to be problematic. Although tracers such as18F-fluorodeoxyglucose (18F-FDG) visualize certain normal anatomical structures, the spa-tial resolution is generally inadequate for accurate anatomic localization of pathology.Combining PET with a high-resolution anatomical imaging modality such as computedtomography (CT) can resolve the localization issue as long as the images from the twomodalities are accurately coregistered. However, software-based registration techniqueshave difficulty accounting for differences in patient positioning and involuntary movementof internal organs, often necessitating labor-intensive nonlinear mapping that may notconverge to a satisfactory result. Acquiring both CT and PET images in the same scannerobviates the need for software registration and routinely provides accurately alignedimages of anatomy and function in a single scan. A CT scanner positioned in line with a PETscanner and with a common patient couch and operating console has provided a practicalsolution to anatomical and functional image registration. Axial translation of the couchbetween the 2 modalities enables both CT and PET data to be acquired during a singleimaging session. In addition, the CT images can be used to generate essentially noiselessattenuation correction factors for the PET emission data. By minimizing patient movementbetween the CT and PET scans and accounting for the axial separation of the two modal-ities, accurately registered anatomical and functional images can be obtained. Since theintroduction of the first PET/CT prototype more than 6 years ago, numerous patients withcancer have been scanned on commercial PET/CT devices worldwide. The commercialdesigns feature multidetector spiral CT and high-performance PET components. Experiencehas demonstrated an increased level of accuracy and confidence in the interpretation of thecombined study as compared with studies acquired separately, particularly in distinguish-ing pathology from normal, physiologic tracer uptake and precisely localizing abnormalfoci. Combined PET/CT scanners represent an important evolution in technology that hashelped to bring molecular imaging to the forefront in cancer diagnosis, staging and therapymonitoring.Semin Nucl Med 38:152-166 © 2008 Elsevier Inc. All rights reserved.
ictasaoopoadr
istorically, instrumentation for tomographic imaging offunction (single-photon emission computed tomogra-
hy [SPECT], positron emission tomography [PET]) evolvedlong a path somewhat different from that of anatomical im-ging devices (computed tomography [CT] and magnetic res-nance imaging [MRI]) and the corresponding clinical stud-
epartments of Medicine and Radiology, University of Tennessee MedicalCenter, Knoxville, TN.
inancial support for the original PET/CT development was provided byNCI Grant CA 65856.
ddress reprint requests to David W. Townsend, PhD, Departments of Med-icine and Radiology, University of Tennessee Medical Center, 1924Alcoa Highway, Knoxville, TN 37920-6999. E-mail: dtownsend@mc.
autmck.edu
52 0001-2998/08/$-see front matter © 2008 Elsevier Inc. All rights reserved.doi:10.1053/j.semnuclmed.2008.01.003
es were performed and interpreted separately in differentlinical services, ie, nuclear medicine and radiology, respec-ively. Despite this segregation, the usefulness of combiningnatomical and functional planar images was evident to phy-icians even in the 1960s, preceding the invention of CT. Thelignment of tomographic images is a complex procedurewing to the large number of degrees of freedom and, with-ut some common features, such coregistration, may beroblematic. In addition to simple visual alignment or the usef stereotactic frames that are undesirable or inconvenient in diagnostic setting, sophisticated image fusion software waseveloped from the late 1980s onwards.1 For (relatively)igid objects, such as the brain, software can successfully
lign images from MR, CT, and PET, whereas in more flexible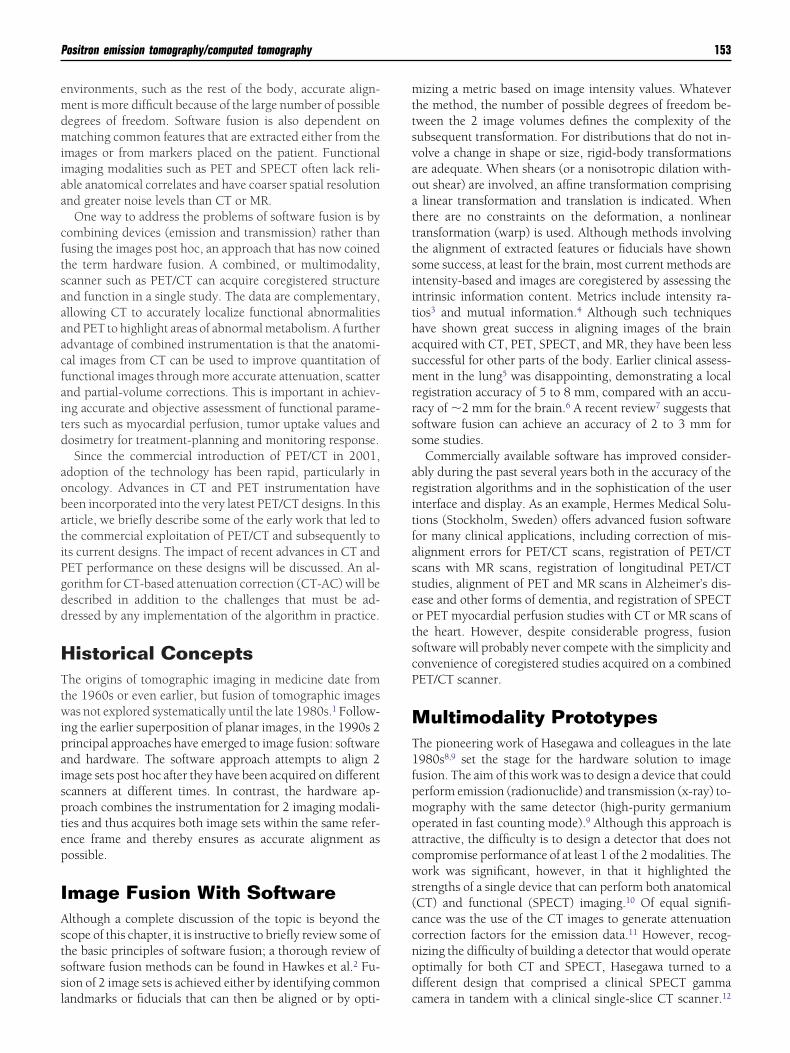
emdmiiaa
cftsaaaacfaitd
aobatiPgdd
HTtwipaisptep
IAstssl
mttsvaoatttsiithasmrrss
aritfasseotscP
MT1fpmoacws(ccnod
Positron emission tomography/computed tomography 153
nvironments, such as the rest of the body, accurate align-ent is more difficult because of the large number of possibleegrees of freedom. Software fusion is also dependent onatching common features that are extracted either from the
mages or from markers placed on the patient. Functionalmaging modalities such as PET and SPECT often lack reli-ble anatomical correlates and have coarser spatial resolutionnd greater noise levels than CT or MR.
One way to address the problems of software fusion is byombining devices (emission and transmission) rather thanusing the images post hoc, an approach that has now coinedhe term hardware fusion. A combined, or multimodality,canner such as PET/CT can acquire coregistered structurend function in a single study. The data are complementary,llowing CT to accurately localize functional abnormalitiesnd PET to highlight areas of abnormal metabolism. A furtherdvantage of combined instrumentation is that the anatomi-al images from CT can be used to improve quantitation ofunctional images through more accurate attenuation, scatternd partial-volume corrections. This is important in achiev-ng accurate and objective assessment of functional parame-ers such as myocardial perfusion, tumor uptake values andosimetry for treatment-planning and monitoring response.Since the commercial introduction of PET/CT in 2001,
doption of the technology has been rapid, particularly inncology. Advances in CT and PET instrumentation haveeen incorporated into the very latest PET/CT designs. In thisrticle, we briefly describe some of the early work that led tohe commercial exploitation of PET/CT and subsequently tots current designs. The impact of recent advances in CT andET performance on these designs will be discussed. An al-orithm for CT-based attenuation correction (CT-AC) will beescribed in addition to the challenges that must be ad-ressed by any implementation of the algorithm in practice.
istorical Conceptshe origins of tomographic imaging in medicine date from
he 1960s or even earlier, but fusion of tomographic imagesas not explored systematically until the late 1980s.1 Follow-
ng the earlier superposition of planar images, in the 1990s 2rincipal approaches have emerged to image fusion: softwarend hardware. The software approach attempts to align 2mage sets post hoc after they have been acquired on differentcanners at different times. In contrast, the hardware ap-roach combines the instrumentation for 2 imaging modali-ies and thus acquires both image sets within the same refer-nce frame and thereby ensures as accurate alignment asossible.
mage Fusion With Softwarelthough a complete discussion of the topic is beyond thecope of this chapter, it is instructive to briefly review some ofhe basic principles of software fusion; a thorough review ofoftware fusion methods can be found in Hawkes et al.2 Fu-ion of 2 image sets is achieved either by identifying common
andmarks or fiducials that can then be aligned or by opti- cizing a metric based on image intensity values. Whateverhe method, the number of possible degrees of freedom be-ween the 2 image volumes defines the complexity of theubsequent transformation. For distributions that do not in-olve a change in shape or size, rigid-body transformationsre adequate. When shears (or a nonisotropic dilation with-ut shear) are involved, an affine transformation comprisinglinear transformation and translation is indicated. When
here are no constraints on the deformation, a nonlinearransformation (warp) is used. Although methods involvinghe alignment of extracted features or fiducials have shownome success, at least for the brain, most current methods arentensity-based and images are coregistered by assessing thentrinsic information content. Metrics include intensity ra-ios3 and mutual information.4 Although such techniquesave shown great success in aligning images of the braincquired with CT, PET, SPECT, and MR, they have been lessuccessful for other parts of the body. Earlier clinical assess-ent in the lung5 was disappointing, demonstrating a local
egistration accuracy of 5 to 8 mm, compared with an accu-acy of �2 mm for the brain.6 A recent review7 suggests thatoftware fusion can achieve an accuracy of 2 to 3 mm forome studies.
Commercially available software has improved consider-bly during the past several years both in the accuracy of theegistration algorithms and in the sophistication of the usernterface and display. As an example, Hermes Medical Solu-ions (Stockholm, Sweden) offers advanced fusion softwareor many clinical applications, including correction of mis-lignment errors for PET/CT scans, registration of PET/CTcans with MR scans, registration of longitudinal PET/CTtudies, alignment of PET and MR scans in Alzheimer’s dis-ase and other forms of dementia, and registration of SPECTr PET myocardial perfusion studies with CT or MR scans ofhe heart. However, despite considerable progress, fusionoftware will probably never compete with the simplicity andonvenience of coregistered studies acquired on a combinedET/CT scanner.
ultimodality Prototypeshe pioneering work of Hasegawa and colleagues in the late980s8,9 set the stage for the hardware solution to imageusion. The aim of this work was to design a device that coulderform emission (radionuclide) and transmission (x-ray) to-ography with the same detector (high-purity germanium
perated in fast counting mode).9 Although this approach isttractive, the difficulty is to design a detector that does notompromise performance of at least 1 of the 2 modalities. Theork was significant, however, in that it highlighted the
trengths of a single device that can perform both anatomicalCT) and functional (SPECT) imaging.10 Of equal signifi-ance was the use of the CT images to generate attenuationorrection factors for the emission data.11 However, recog-izing the difficulty of building a detector that would operateptimally for both CT and SPECT, Hasegawa turned to aifferent design that comprised a clinical SPECT gamma
amera in tandem with a clinical single-slice CT scanner.12
TWtubaifiCrnm
edttotcsAavC(tectsp
tTarrca
CIcc2xoutPccsmipf5cMrHFtGcopad2
APMAewaas1anfa
Fvoct(
154 D.W. Townsend
he CT scanner (9800 Quick; GE Healthcare, Milwaukee,I) was positioned in front of, and aligned with, a scintilla-
ion camera (600 XR/T; GE Healthcare). The same bed wassed to acquire both studies and the images were registeredy taking into account the axial displacement between the CTnd SPECT imaging fields of view (FOV). After radiotracernjection and usual uptake period, the patient was imagedrst in the CT scanner and then in the SPECT scanner. TheT data were used to generate the SPECT attenuation-cor-
ection factors. The combined device was used for a limitedumber of clinical studies, for example, activity measure-ents for radiation dosimetry in brain tumor patients.13
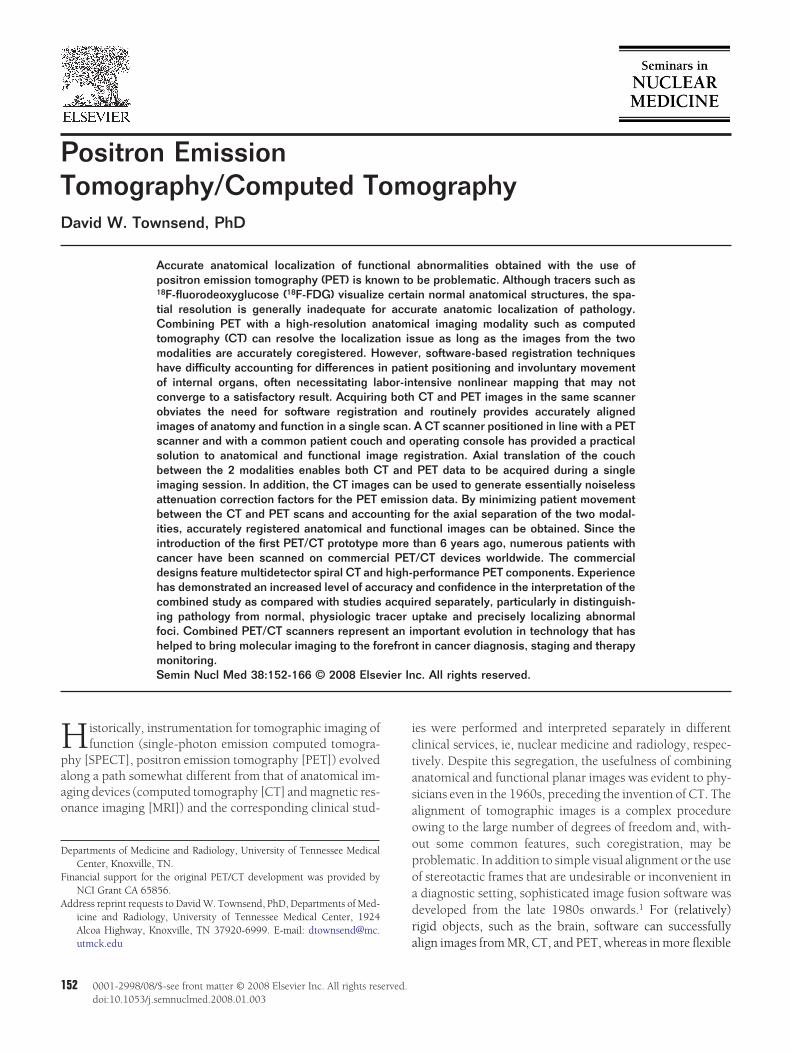
The proposal to combine PET with CT was made in thearly 1990s by Townsend, Nutt and coworkers indepen-ently of the Hasegawa work. The suggestion was also madeo use the CT images to generate the PET attenuation correc-ion factors.14 The first prototype PET/CT scanner becameperational in 1998,15 designed and built by CTI PET Sys-ems in Knoxville, TN (now Siemens Molecular Imaging) andlinically evaluated at the University of Pittsburgh. The de-ign incorporated a single-slice spiral CT scanner (SomatomR.SP; Siemens Medical Solutions, Forchheim, Germany)nd a rotating ECAT ART scanner (CTI PET Systems, Knox-ille, TN). The PET detectors were mounted on the rear of theT support and the entire assembly rotated as a single unit
Fig. 1). The data processing included an algorithm16 to scalehe CT images from x-ray energy to PET annihilation photonnergy (511 keV) and generate the appropriate attenuationorrection factors (as discussed below). Over 300 cancer pa-ients were scanned on the prototype and the findings pre-ented in a series of publications.17-19 The results from the
CT
CT console PET consoleFused image viewer
PET
igure 1 The first PET/CT prototype evaluated clinically at the Uni-ersity of Pittsburgh. The CT and PET components were mountedn a single rotating support and the data acquired from 2 separateonsoles. The CT images were transferred to the PET console andhen used for CT-based attenuation correction and localization.Color version of figure is available online.)
rototype demonstrated the utility of high-resolution ana- h
omic images accurately registered with functional images.he coregistered anatomy localized functional abnormalitiesnd clarified equivocal situations, thus improving the accu-acy and confidence of the scan interpretation. The use of aapidly-acquired, low-noise CT scan in place of a lengthyonventional PET transmission scan improved image qualitynd reduced scan time.
urrent PET/CT Instrumentationn 1999, GE Healthcare launched a dual-head scintillationamera combined with a low-power x-ray tube and detectors,alled the Hawkeye (GE Healthcare).20,21 This design featuresrectangular sodium iodide camera heads with a 350-W
-ray tube. The Hawkeye was the first commercial scanner toffer combined anatomical and functional imaging in a singlenit. Then, less than 2 years after the first Hawkeye installa-ion, PET/CT scanners incorporating clinical CT and clinicalET performance became commercially available. The firstommercial PET/CT scanner to be announced was the Dis-overy LS (GE Healthcare) in early 2001. This was followedeveral months thereafter by the release of the Biograph (Sie-ens Medical Solutions), and then somewhat later by the
ntroduction of the Gemini (Philips Medical Systems). In theast 6 years, PET/CT designs from all vendors have evolvedollowing advances in CT and PET instrumentation. By 2007,
vendors worldwide offered PET/CT designs: GE Health-are, Hitachi Medical, Philips Medical Systems, Toshibaedical Corporation, and Siemens Medical Solutions. Cur-
ent designs offered by Siemens Molecular Imaging, GEealthcare, and Philips Medical Systems are summarized inig. 2. A recent addition to PET/CT designs is the Gemini TF,he first commercial time-of-flight (TOF) PET scanner.22 Theemini TF has yttrium-doped LSO (LYSO) detectors and isombined with a 16- or 64-slice CT scanner. All designsther than the Discovery LS offer a 70-cm-diameter patientort for both CT and PET. All Gemini and Biograph designscquire PET data in 3D mode only, whereas the Discoveryesign includes retractable septa and can acquire data in bothD and 3D mode.
dvances inerformance for CT and PETultidetector CT Scanners
fter the appearance of single-slice spiral CT scanners in thearly 1990s,23 CT performance has experienced a resurgenceith the advent of multi-detector arrays (MDCT). This was
ccompanied by increases in x-ray power (60 kW or greater)nd computer capacity for data processing and image recon-truction. Dual- and 4-slice CT scanners first appeared about998, with scan times of 500 ms, followed by 16-slice (2002)nd, more recently, 64-slice (2004) devices. The increasingumber of detector rows (slices) has been accompanied byaster rotation times so that state-of-the-art scanners can nowchieve a full rotation in as little as 330 ms. Spatial resolution
as improved from �10 lines pairs (lp)/cm in 1990 to 25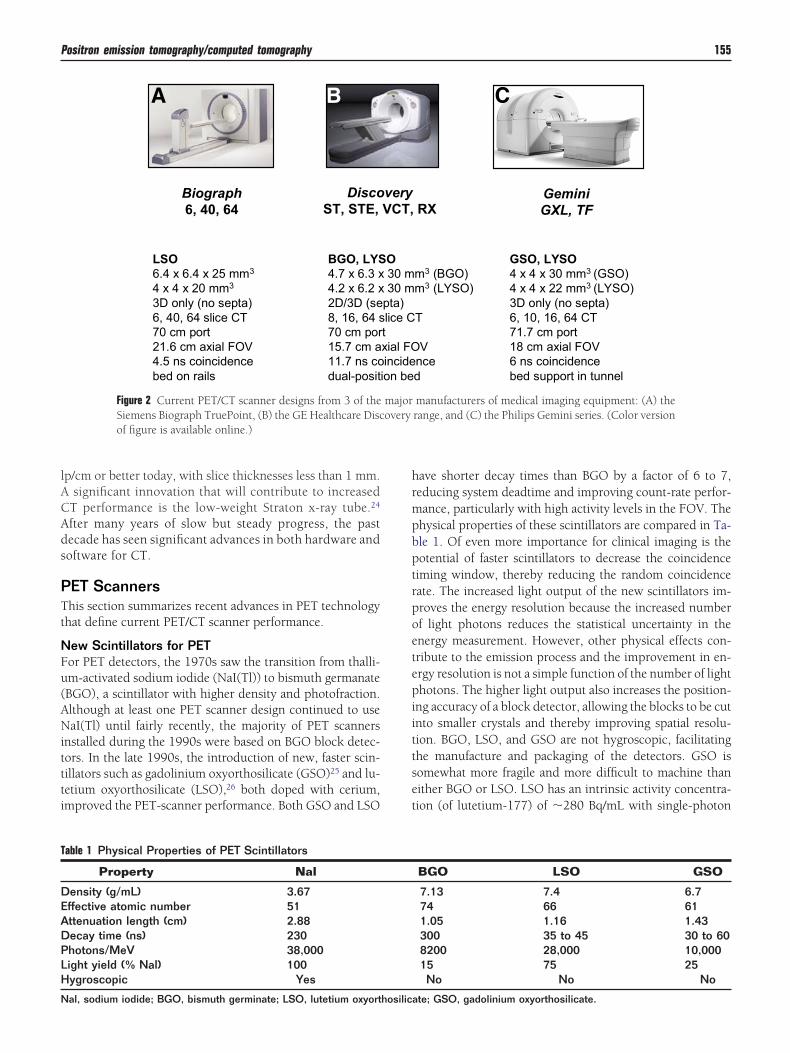
lACAds
PTt
NFu(ANittti
hrmpbptrpoetepiittset
T
DEADPLH
N
Positron emission tomography/computed tomography 155
p/cm or better today, with slice thicknesses less than 1 mm.significant innovation that will contribute to increased
T performance is the low-weight Straton x-ray tube.24
fter many years of slow but steady progress, the pastecade has seen significant advances in both hardware andoftware for CT.
ET Scannershis section summarizes recent advances in PET technology
hat define current PET/CT scanner performance.
ew Scintillators for PETor PET detectors, the 1970s saw the transition from thalli-m-activated sodium iodide (NaI(Tl)) to bismuth germanateBGO), a scintillator with higher density and photofraction.lthough at least one PET scanner design continued to useaI(Tl) until fairly recently, the majority of PET scanners
nstalled during the 1990s were based on BGO block detec-ors. In the late 1990s, the introduction of new, faster scin-illators such as gadolinium oxyorthosilicate (GSO)25 and lu-etium oxyorthosilicate (LSO),26 both doped with cerium,mproved the PET-scanner performance. Both GSO and LSO
DiscoST, STE,
BGO, LYS4.7 x 6.3 x4.2 x 6.2 x2D/3D (se8, 16, 64 s70 cm por15.7 cm a11.7 ns codual-posit
Biograph6, 40, 64
LSO6.4 x 6.4 x 25 mm3
4 x 4 x 20 mm3
3D only (no septa)6, 40, 64 slice CT70 cm port21.6 cm axial FOV4.5 ns coincidencebed on rails
A B
Figure 2 Current PET/CT scanner designs from 3 of theSiemens Biograph TruePoint, (B) the GE Healthcare Discof figure is available online.)
able 1 Physical Properties of PET Scintillators
Property Nal
ensity (g/mL) 3.67ffective atomic number 51ttenuation length (cm) 2.88ecay time (ns) 230hotons/MeV 38,000ight yield (% Nal) 100ygroscopic Yes
al, sodium iodide; BGO, bismuth germinate; LSO, lutetium oxyorthosilic
ave shorter decay times than BGO by a factor of 6 to 7,educing system deadtime and improving count-rate perfor-ance, particularly with high activity levels in the FOV. Thehysical properties of these scintillators are compared in Ta-le 1. Of even more importance for clinical imaging is theotential of faster scintillators to decrease the coincidenceiming window, thereby reducing the random coincidenceate. The increased light output of the new scintillators im-roves the energy resolution because the increased numberf light photons reduces the statistical uncertainty in thenergy measurement. However, other physical effects con-ribute to the emission process and the improvement in en-rgy resolution is not a simple function of the number of lighthotons. The higher light output also increases the position-
ng accuracy of a block detector, allowing the blocks to be cutnto smaller crystals and thereby improving spatial resolu-ion. BGO, LSO, and GSO are not hygroscopic, facilitatinghe manufacture and packaging of the detectors. GSO isomewhat more fragile and more difficult to machine thanither BGO or LSO. LSO has an intrinsic activity concentra-ion (of lutetium-177) of �280 Bq/mL with single-photon
RX
m3 (BGO)m3 (LYSO)
T
Vnced
GeminiGXL, TF
GSO, LYSO4 x 4 x 30 mm3 (GSO)4 x 4 x 22 mm3 (LYSO)3D only (no septa)6, 10, 16, 64 CT71.7 cm port18 cm axial FOV6 ns coincidencebed support in tunnel
C
manufacturers of medical imaging equipment: (A) therange, and (C) the Philips Gemini series. (Color version
BGO LSO GSO
7.13 7.4 6.774 66 611.05 1.16 1.43300 35 to 45 30 to 608200 28,000 10,00015 75 25No No No
veryVCT,
O 30 m 30 mpta)lice Ctxial FOincideion be
majorovery
ate; GSO, gadolinium oxyorthosilicate.
eacc
SPisiptsttr2uwoibbpi2mqibtksiwamW(tpa
aati3acaroaeamm
shbaLps�
STs(rTTaotttFtseontrm
Ftdpwswmet
156 D.W. Townsend
missions in the 88- to 400-keV energy range. Such a radio-ctive component is of little consequence for coincidenceounting at 511 keV, except maybe at very low emissionount rates.
ensitivityET is intrinsically a three-dimensional (3D) imaging modal-
ty, replacing absorptive physical collimation required foringle-photon imaging with the electronic collimation of co-ncidence detection. The first multi-ring PET scanners incor-orated septa, lead or tungsten annular shields mounted be-ween the detector rings. The purpose of the septa was tohield the detectors from photons that scattered out of theransverse plane, restricting the use of electronic collimationo within the plane. Such septa result in inefficient use of theadiation emitted from the patient, but limit scatter and allow-dimensional (2D) image reconstruction algorithms to besed. The availability beginning in 1990 of BGO scannersith retractable septa encouraged the use of 3D methodol-gy, at least for the brain, where a 5-fold increase in sensitiv-ty could be realized even with accompanying increases inoth scatter fraction and randoms.27 The situation for wholeody imaging is far less favorable, in part because of theresence of significant activity just outside the imaging FOV
n most bed positions. Instead, particularly for large patients,D imaging has been recommended even though higher ad-inistered activities of fluorodeoxyglucose (FDG) are re-
uired to obtain adequate count rates. This situation changedn the late 1990s with the introduction of LSO- and GSO-ased scanners that could be operated with short coincidenceime windows (4.5–6 ns) and higher threshold (400-450eV) energy windows compared with those of a typical BGOcanner, 10 to 12 ns and 350 keV, respectively. Significantlymproved whole-body image quality has been achieved in 3Dith a 10 mCi (370 MBq) injection of FDG. Since the LSO
nd GSO scanners have no septa and acquire data in 3Dode only, no comparison can be made with 2D operation.ithin the past several years, a limited number of LYSO
lutetium-yttrium oxyorthosilicate)-based scanners with re-ractable septa have been evaluated in 2D and 3D and recentublications suggest that 3D is now preferred over 2D oper-tion.28,29
The sensitivity of a scanner can also be improved by theddition of more detector material, both in terms of thicknessnd axial extent. For example, for LSO a 50% increase inhickness (from 20 to 30 mm) results in a 40% increase inntrinsic sensitivity. However, increasing the axial extent by0% results in a 78% increase in volume sensitivity (for 3Dcquisition with no septa). Thus, the latter makes more effi-ient use of the increased volume of LSO, although there willlso be an increase in the number of photomutlipler tubesequired (and hence increased cost). Following an injectionf a radiotracer such as FDG, the patient potentially receivesradiation dose from all annihilation photons, not just thosemitted within the scanner FOV. Therefore, the greater thexial extent (ie, the larger the FOV), the more effective use isade of the emitted radiation and the more efficient use is
ade of a given volume of scintillator. For most PET/CT ecanners, axial PET coverage is �16 cm, with one designaving an axial extent of 18 cm.22 The most recent design toe announced has an extended FOV covering 21.8 cm axi-lly. The latter comprises more than 32,000, 4 � 4 � 20 mmSO crystal elements and images 109 2-mm thick transaxiallanes per bed position. Data acquisition is fully 3D and thecanner has a peak noise-equivalent count rate (NECR) of160 kcps.30,31
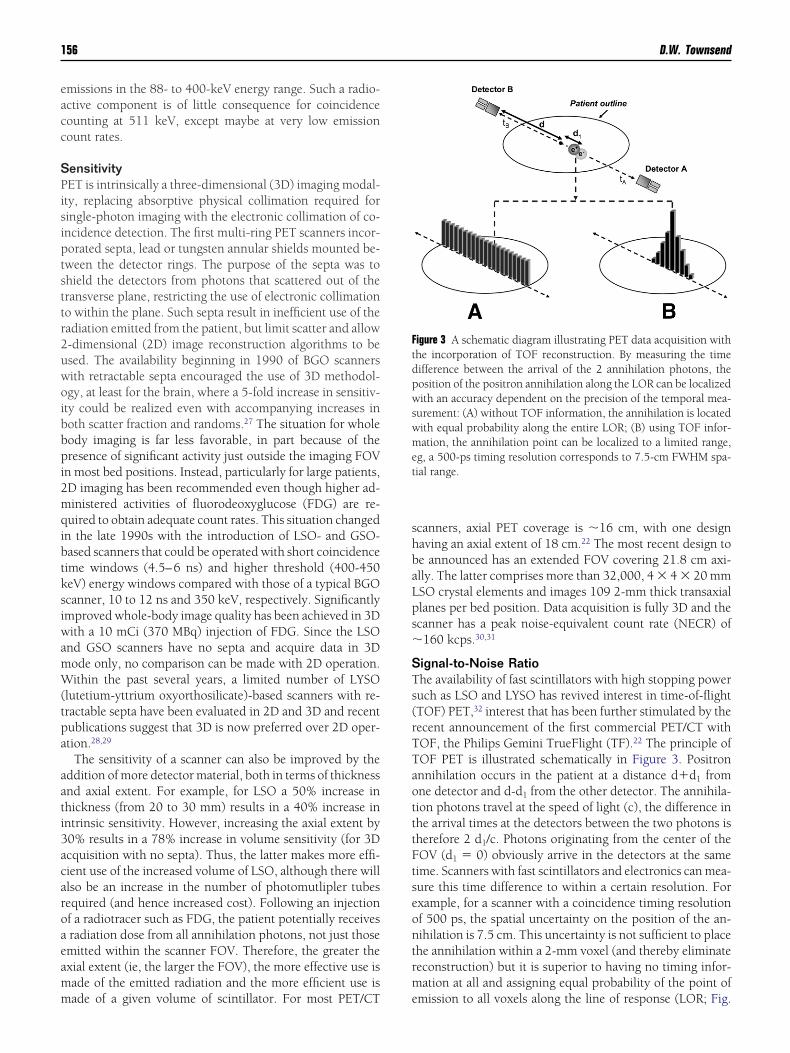
ignal-to-Noise Ratiohe availability of fast scintillators with high stopping poweruch as LSO and LYSO has revived interest in time-of-flightTOF) PET,32 interest that has been further stimulated by theecent announcement of the first commercial PET/CT withOF, the Philips Gemini TrueFlight (TF).22 The principle ofOF PET is illustrated schematically in Figure 3. Positronnnihilation occurs in the patient at a distance d�d1 fromne detector and d-d1 from the other detector. The annihila-ion photons travel at the speed of light (c), the difference inhe arrival times at the detectors between the two photons isherefore 2 d1/c. Photons originating from the center of theOV (d1 � 0) obviously arrive in the detectors at the sameime. Scanners with fast scintillators and electronics can mea-ure this time difference to within a certain resolution. Forxample, for a scanner with a coincidence timing resolutionf 500 ps, the spatial uncertainty on the position of the an-ihilation is 7.5 cm. This uncertainty is not sufficient to placehe annihilation within a 2-mm voxel (and thereby eliminateeconstruction) but it is superior to having no timing infor-ation at all and assigning equal probability of the point of
igure 3 A schematic diagram illustrating PET data acquisition withhe incorporation of TOF reconstruction. By measuring the timeifference between the arrival of the 2 annihilation photons, theosition of the positron annihilation along the LOR can be localizedith an accuracy dependent on the precision of the temporal mea-
urement: (A) without TOF information, the annihilation is locatedith equal probability along the entire LOR; (B) using TOF infor-ation, the annihilation point can be localized to a limited range,
g, a 500-ps timing resolution corresponds to 7.5-cm FWHM spa-ial range.
mission to all voxels along the line of response (LOR; Fig.
3aTsstddctcwwptstniAT
RTroer
srbmfeiaqroaatuScirgiwshid
mooth
Positron emission tomography/computed tomography 157
A). Instead, the most probable location of the annihilation ist the center of the uncertainty distribution (Fig. 3B). TheOF information is incorporated directly into the recon-truction algorithm, leading to an improvement in theignal-to-noise ratio (SNR). The increase in SNR is propor-ional to �(D/�d), where D is the diameter of the activityistribution and �d is the spatial uncertainty. For a 40-cmiameter uniform distribution of activity and a 7.5-cm un-ertainty, the increase in SNR is a factor of �2.3. As the TOFemporal resolution improves, the spatial uncertainty de-reases and the SNR increases by a larger factor. TOF PETas first exploited in the early 1980s32 with scintillators thatere fast but did not have good stopping power for 511-keVhotons. Interest declined until the recent emergence of scin-illators that are both fast and sensitive. The new TOF PETcanners, based on LSO or LYSO, must demonstrate goodiming resolution that is stable over time so as to avoid theeed for frequent detector re-calibration. Although promis-
ng, the clinical impact of TOF PET has yet to be established.more detailed review of the published contributions to
OF development can be found in.33
econstruction Algorithmshere has been significant progress over recent years in imageeconstruction methods through the introduction clinicallyf statistically based algorithms. Previously, one of the earli-st and most widely used 3D reconstruction methods was the
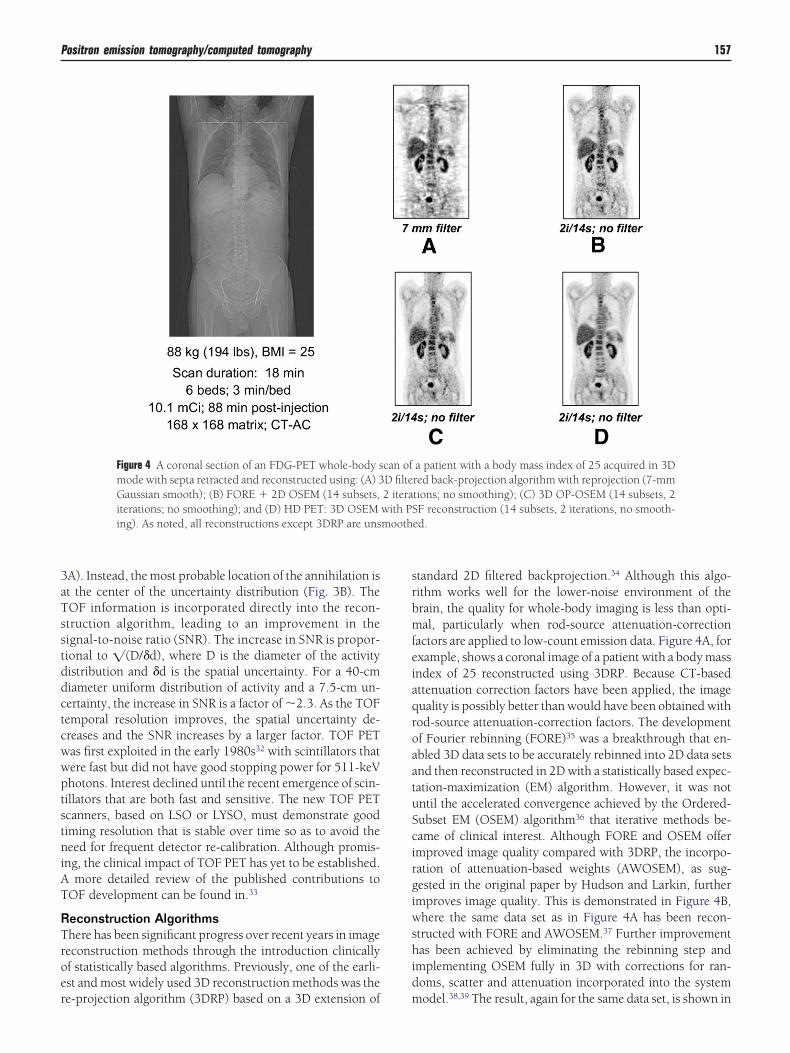
Figure 4 A coronal section of an FDG-PET whole-body smode with septa retracted and reconstructed using: (A) 3Gaussian smooth); (B) FORE � 2D OSEM (14 subsets,iterations; no smoothing); and (D) HD PET: 3D OSEMing). As noted, all reconstructions except 3DRP are uns
e-projection algorithm (3DRP) based on a 3D extension of m
tandard 2D filtered backprojection.34 Although this algo-ithm works well for the lower-noise environment of therain, the quality for whole-body imaging is less than opti-al, particularly when rod-source attenuation-correction
actors are applied to low-count emission data. Figure 4A, forxample, shows a coronal image of a patient with a body massndex of 25 reconstructed using 3DRP. Because CT-basedttenuation correction factors have been applied, the imageuality is possibly better than would have been obtained withod-source attenuation-correction factors. The developmentf Fourier rebinning (FORE)35 was a breakthrough that en-bled 3D data sets to be accurately rebinned into 2D data setsnd then reconstructed in 2D with a statistically based expec-ation-maximization (EM) algorithm. However, it was notntil the accelerated convergence achieved by the Ordered-ubset EM (OSEM) algorithm36 that iterative methods be-ame of clinical interest. Although FORE and OSEM offermproved image quality compared with 3DRP, the incorpo-ation of attenuation-based weights (AWOSEM), as sug-ested in the original paper by Hudson and Larkin, furthermproves image quality. This is demonstrated in Figure 4B,here the same data set as in Figure 4A has been recon-
tructed with FORE and AWOSEM.37 Further improvementas been achieved by eliminating the rebinning step and
mplementing OSEM fully in 3D with corrections for ran-oms, scatter and attenuation incorporated into the system
a patient with a body mass index of 25 acquired in 3Dred back-projection algorithm with reprojection (7-mmtions; no smoothing); (C) 3D OP-OSEM (14 subsets, 2F reconstruction (14 subsets, 2 iterations, no smooth-
ed.
can ofD filte2 iterawith PS
odel.38,39 The result, again for the same data set, is shown in
FDhpiptnt4
sIbqirTatibvRspiil
CAAinT(tmlcmbultt
Ebntte1p
es
psknaE
a�dtyfcgti�tsad
sfna(matta�iC“ttcw
mdssti
158 D.W. Townsend
igure 4C. Finally, in a recent development termed, “High-efinition (HD)” PET, the detector spatial response functionas also been included in the reconstruction model.40 Theoint spread function (PSF) varies throughout the FOV ow-
ng to the oblique penetration of the detectors by annihilationhotons (ie, the depth of-interaction effect). By measuringhis variability and then modeling the PSF, improved andear-uniform spatial resolution can be achieved throughouthe FOV; the improvement can be seen by comparing FigureC with the PSF reconstruction in Figure 4D.The images in Figure 4 are reconstructed with clinical
oftware provided by a specific vendor (Siemens Molecularmaging). Of course, most major vendors provide compara-le software capable of producing clinical images of highuality. The VUE Point algorithm (GE Health care) is an
mplementation of 3D OSEM that includes corrections forandoms, scatter, and attenuation and also z-axis smoothing.he Gemini TF (Philips Medical Systems) has TOF capabilitynd therefore the TOF information must be incorporated intohe reconstruction.22 For their Gemini scanner, Philips havemplemented a distributed list-mode TOF algorithm that isased on a TOF list-mode Maximum Likelihood approach de-eloped by Popescu and coworkers.41 They previously used aow-Action Maximum-Likelihood algorithm (RAMLA).42 Thecatter correction algorithm requires modification to incor-orate TOF information. The greatest unresolved effect on
mage quality, and a challenge to reconstruction algorithms,s now patient size, a significant problem given the currentevels of obesity among the US population.
T-Basedttenuation-Correction Factorsrecognized strength of PET/CT is the availability of CT
mages for attenuation correction of the PET data,16,43 elimi-ating the need for an additional, lengthy transmission scan.he use of the CT to generate attenuation-correction factorsACFs) reduces statistical noise. Because the linear attenua-ion coefficients (�) are energy-dependent, the CT scan at aean x-ray energy of �70 keV must be scaled to the annihi-
ation �-ray energy (511 keV). The mean energy of a poly-hromatic x-ray beam is defined as the energy of a monochro-atic beam that would give the same � as the polychromatic
eam integrated over energy.44 The polychromatic beam alsondergoes beam hardening, the preferential interaction of
ower-energy photons as the beam traverses the body causinghe mean energy to increase and the corresponding � valueso decrease.
nergy scaling algorithm for CT. The attenuation of x-raysy tissue depends on the density and the effective atomicumber (Zeff) of the absorber material. At CT x-ray energies,he physical processes by which photons are attenuated arehe photoelectric effect and Compton scattering. The photo-lectric probability varies approximately as Zeff
4 and scales as/E3, where E is the photon energy. The Compton scattering
robability has little dependence on Zeff and decreases lin-arly with 1/E. The � for a given material is expressed by theum of the two components:
��E� � �e��c�E� � �ph�E, Zeff��
where �e is the electron density and �ph and �c are thehotoelectric and Compton cross sections per electron, re-pectively. However, at photon energies above about 100eV in soft tissue, the photoelectric contribution is essentiallyegligible compared with the Compton-scatter contributionnd therefore the expressions for the �-values at x-ray energy
x and �-ray energy E� are:
��Ex� � �e��c�Ex� � �ph�Ex, Zeff����E�� � �e �c�E��
As a consequence of the 2 separate contributions to �(Ex),single measurement of �(Ex) will not uniquely determine(E�) because, for example, an increase in Zeff could offset aecrease in �e and result in no change in �(Ex). In general,herefore, a simple energy scaling of �(Ex) is insufficient toield �(E�). By restricting the problem to biological tissuesor which Zeff are all fairly comparable and noting that theontribution from �ph is relatively small even at x-ray ener-ies, changes in �(Ex) are primarily caused by changes inissue electron density. Thus, for the limited range of biolog-cal tissues, a single scaling factor can be used to convert(Ex) to �(E�) for lung, liver, fat, muscle, and other soft
issues. For spongiosa and cortical bone, however, the samecale factor will not apply because of the significant calciumnd phosphorous content of bone that result in a higher Zeff
ifferent from those of soft tissues.This issue has been addressed16 by segmenting bone from
oft tissue at a specific threshold and applying different scaleactors to the two different tissue classifications—bone andonbone—corresponding to different values of Zeff. Kinahannd coworkers adopted a threshold of 300 Hounsfield unitsHU).16 Subsequently, Watson and coworkers44 proposed aixture model in which all tissues with � less than �(water)
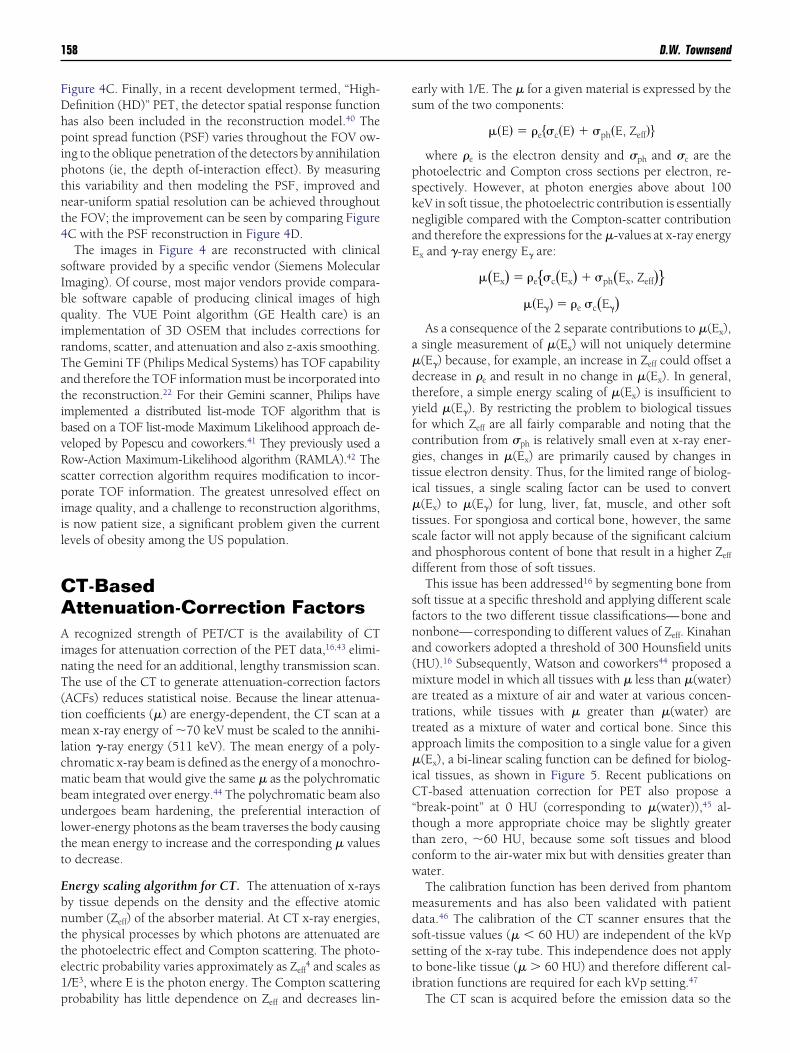
re treated as a mixture of air and water at various concen-rations, while tissues with � greater than �(water) arereated as a mixture of water and cortical bone. Since thispproach limits the composition to a single value for a given(Ex), a bi-linear scaling function can be defined for biolog-
cal tissues, as shown in Figure 5. Recent publications onT-based attenuation correction for PET also propose a
break-point” at 0 HU (corresponding to �(water)),45 al-hough a more appropriate choice may be slightly greaterhan zero, �60 HU, because some soft tissues and bloodonform to the air-water mix but with densities greater thanater.The calibration function has been derived from phantomeasurements and has also been validated with patientata.46 The calibration of the CT scanner ensures that theoft-tissue values (� � 60 HU) are independent of the kVpetting of the x-ray tube. This independence does not applyo bone-like tissue (� � 60 HU) and therefore different cal-bration functions are required for each kVp setting.47
The CT scan is acquired before the emission data so the
Aado(gS
tttc
ACAkefotmtcrcnwaraoit
tb
F(kit
Positron emission tomography/computed tomography 159
CFs can be generated for the entire volume. The CT imagesre first rebinned to the spatial resolution of the emissionata. The images are next scaled voxel-by-voxel to the energyf the emission data by applying the bi-linear scaling functionFig. 5). The scaled CT images are then forward projected toenerate ACFs that match the sampling of the emission data.ince the introduction of the PET/CT scanner, CT-based at-
igure 5 The bi-linear scaling function used to convert CT numbersHounsfield Units, HU) to linear attenuation coefficients (�) at 511eV. The attenuation-correction factors are generated by reproject-
ng the �-map at 511 keV. w � water and cb � cortical bone; k ishe concentration of the components of the mixture.
A
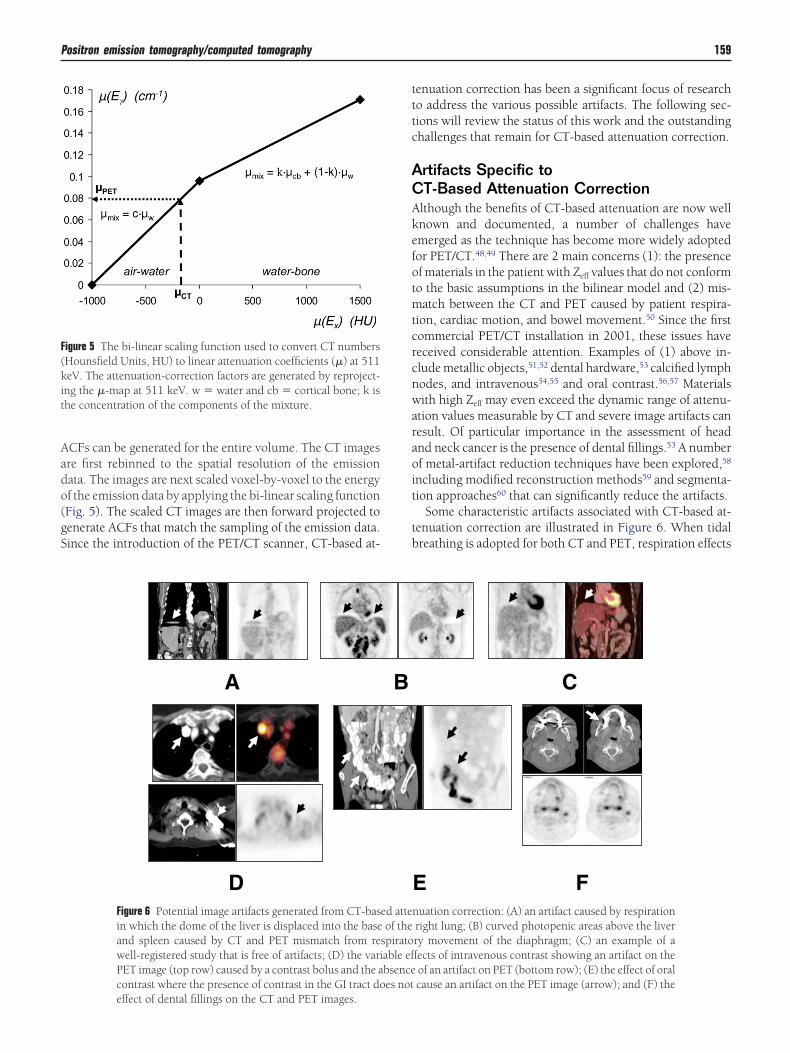
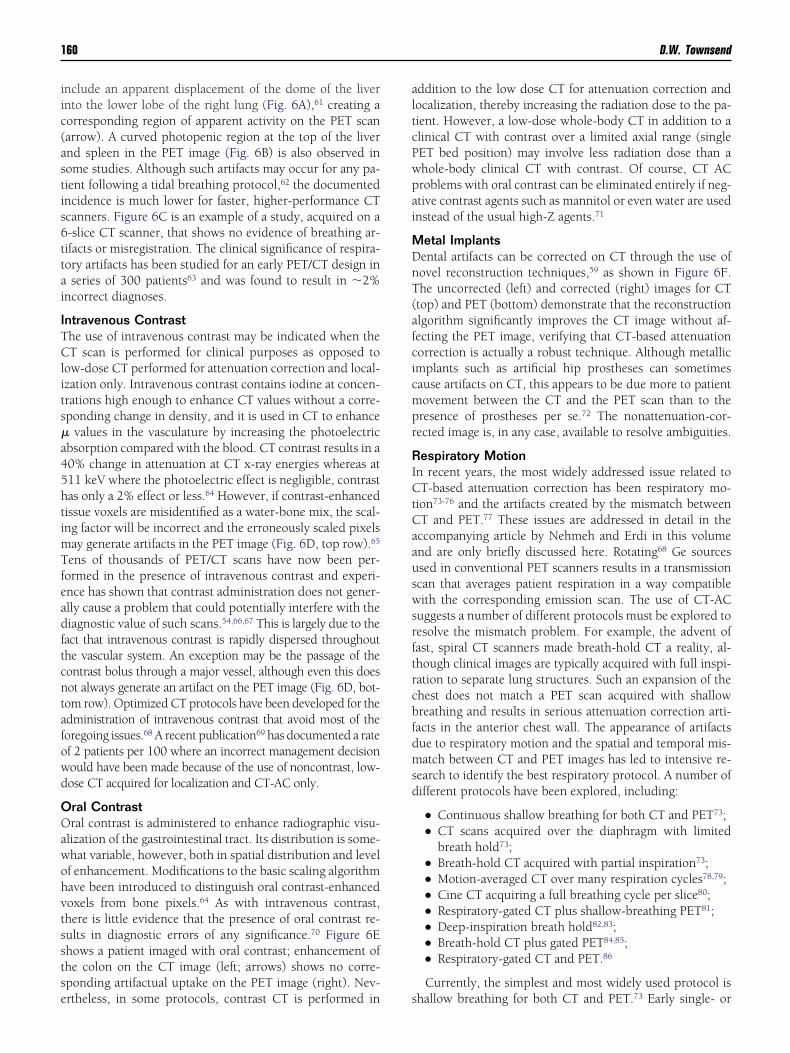
DFigure 6 Potential image artifacts generated from CT-basin which the dome of the liver is displaced into the baseand spleen caused by CT and PET mismatch from rewell-registered study that is free of artifacts; (D) the variPET image (top row) caused by a contrast bolus and the acontrast where the presence of contrast in the GI tract do
effect of dental fillings on the CT and PET images.enuation correction has been a significant focus of researcho address the various possible artifacts. The following sec-ions will review the status of this work and the outstandinghallenges that remain for CT-based attenuation correction.
rtifacts Specific toT-Based Attenuation Correction
lthough the benefits of CT-based attenuation are now wellnown and documented, a number of challenges havemerged as the technique has become more widely adoptedor PET/CT.48,49 There are 2 main concerns (1): the presencef materials in the patient with Zeff values that do not conformo the basic assumptions in the bilinear model and (2) mis-atch between the CT and PET caused by patient respira-
ion, cardiac motion, and bowel movement.50 Since the firstommercial PET/CT installation in 2001, these issues haveeceived considerable attention. Examples of (1) above in-lude metallic objects,51,52 dental hardware,53 calcified lymphodes, and intravenous54,55 and oral contrast.56,57 Materialsith high Zeff may even exceed the dynamic range of attenu-
tion values measurable by CT and severe image artifacts canesult. Of particular importance in the assessment of headnd neck cancer is the presence of dental fillings.53 A numberf metal-artifact reduction techniques have been explored,58
ncluding modified reconstruction methods59 and segmenta-ion approaches60 that can significantly reduce the artifacts.
Some characteristic artifacts associated with CT-based at-enuation correction are illustrated in Figure 6. When tidalreathing is adopted for both CT and PET, respiration effects
C
FEnuation correction: (A) an artifact caused by respirationright lung; (B) curved photopenic areas above the liverry movement of the diaphragm; (C) an example of afects of intravenous contrast showing an artifact on theof an artifact on PET (bottom row); (E) the effect of oralcause an artifact on the PET image (arrow); and (F) the
B
ed atteof the
spiratoable efbsencees not
iic(astis6ttai
ITClits�a45htimTfeadftcntafowd
OOawohvtsstse
altcPwpai
MDnT(afcicmpr
RICtCaauswsrftrcbfdmsd
160 D.W. Townsend
nclude an apparent displacement of the dome of the livernto the lower lobe of the right lung (Fig. 6A),61 creating aorresponding region of apparent activity on the PET scanarrow). A curved photopenic region at the top of the livernd spleen in the PET image (Fig. 6B) is also observed inome studies. Although such artifacts may occur for any pa-ient following a tidal breathing protocol,62 the documentedncidence is much lower for faster, higher-performance CTcanners. Figure 6C is an example of a study, acquired on a-slice CT scanner, that shows no evidence of breathing ar-ifacts or misregistration. The clinical significance of respira-ory artifacts has been studied for an early PET/CT design inseries of 300 patients63 and was found to result in �2%
ncorrect diagnoses.
ntravenous Contrasthe use of intravenous contrast may be indicated when theT scan is performed for clinical purposes as opposed to
ow-dose CT performed for attenuation correction and local-zation only. Intravenous contrast contains iodine at concen-rations high enough to enhance CT values without a corre-ponding change in density, and it is used in CT to enhance
values in the vasculature by increasing the photoelectricbsorption compared with the blood. CT contrast results in a0% change in attenuation at CT x-ray energies whereas at11 keV where the photoelectric effect is negligible, contrastas only a 2% effect or less.64 However, if contrast-enhancedissue voxels are misidentified as a water-bone mix, the scal-ng factor will be incorrect and the erroneously scaled pixels
ay generate artifacts in the PET image (Fig. 6D, top row).65
ens of thousands of PET/CT scans have now been per-ormed in the presence of intravenous contrast and experi-nce has shown that contrast administration does not gener-lly cause a problem that could potentially interfere with theiagnostic value of such scans.54,66,67 This is largely due to the
act that intravenous contrast is rapidly dispersed throughouthe vascular system. An exception may be the passage of theontrast bolus through a major vessel, although even this doesot always generate an artifact on the PET image (Fig. 6D, bot-om row). Optimized CT protocols have been developed for thedministration of intravenous contrast that avoid most of theoregoing issues.68 A recent publication69 has documented a ratef 2 patients per 100 where an incorrect management decisionould have been made because of the use of noncontrast, low-ose CT acquired for localization and CT-AC only.
ral Contrastral contrast is administered to enhance radiographic visu-
lization of the gastrointestinal tract. Its distribution is some-hat variable, however, both in spatial distribution and levelf enhancement. Modifications to the basic scaling algorithmave been introduced to distinguish oral contrast-enhancedoxels from bone pixels.64 As with intravenous contrast,here is little evidence that the presence of oral contrast re-ults in diagnostic errors of any significance.70 Figure 6Ehows a patient imaged with oral contrast; enhancement ofhe colon on the CT image (left; arrows) shows no corre-ponding artifactual uptake on the PET image (right). Nev-
rtheless, in some protocols, contrast CT is performed in sddition to the low dose CT for attenuation correction andocalization, thereby increasing the radiation dose to the pa-ient. However, a low-dose whole-body CT in addition to alinical CT with contrast over a limited axial range (singleET bed position) may involve less radiation dose than ahole-body clinical CT with contrast. Of course, CT ACroblems with oral contrast can be eliminated entirely if neg-tive contrast agents such as mannitol or even water are usednstead of the usual high-Z agents.71
etal Implantsental artifacts can be corrected on CT through the use ofovel reconstruction techniques,59 as shown in Figure 6F.he uncorrected (left) and corrected (right) images for CTtop) and PET (bottom) demonstrate that the reconstructionlgorithm significantly improves the CT image without af-ecting the PET image, verifying that CT-based attenuationorrection is actually a robust technique. Although metallicmplants such as artificial hip prostheses can sometimesause artifacts on CT, this appears to be due more to patientovement between the CT and the PET scan than to theresence of prostheses per se.72 The nonattenuation-cor-ected image is, in any case, available to resolve ambiguities.
espiratory Motionn recent years, the most widely addressed issue related toT-based attenuation correction has been respiratory mo-
ion73-76 and the artifacts created by the mismatch betweenT and PET.77 These issues are addressed in detail in theccompanying article by Nehmeh and Erdi in this volumend are only briefly discussed here. Rotating68 Ge sourcessed in conventional PET scanners results in a transmissioncan that averages patient respiration in a way compatibleith the corresponding emission scan. The use of CT-AC
uggests a number of different protocols must be explored toesolve the mismatch problem. For example, the advent ofast, spiral CT scanners made breath-hold CT a reality, al-hough clinical images are typically acquired with full inspi-ation to separate lung structures. Such an expansion of thehest does not match a PET scan acquired with shallowreathing and results in serious attenuation correction arti-acts in the anterior chest wall. The appearance of artifactsue to respiratory motion and the spatial and temporal mis-atch between CT and PET images has led to intensive re-
earch to identify the best respiratory protocol. A number ofifferent protocols have been explored, including:
● Continuous shallow breathing for both CT and PET73;● CT scans acquired over the diaphragm with limited
breath hold73;● Breath-hold CT acquired with partial inspiration73;● Motion-averaged CT over many respiration cycles78,79;● Cine CT acquiring a full breathing cycle per slice80;● Respiratory-gated CT plus shallow-breathing PET81;● Deep-inspiration breath hold82,83;● Breath-hold CT plus gated PET84,85;● Respiratory-gated CT and PET.86
Currently, the simplest and most widely used protocol is
hallow breathing for both CT and PET.73 Early single- or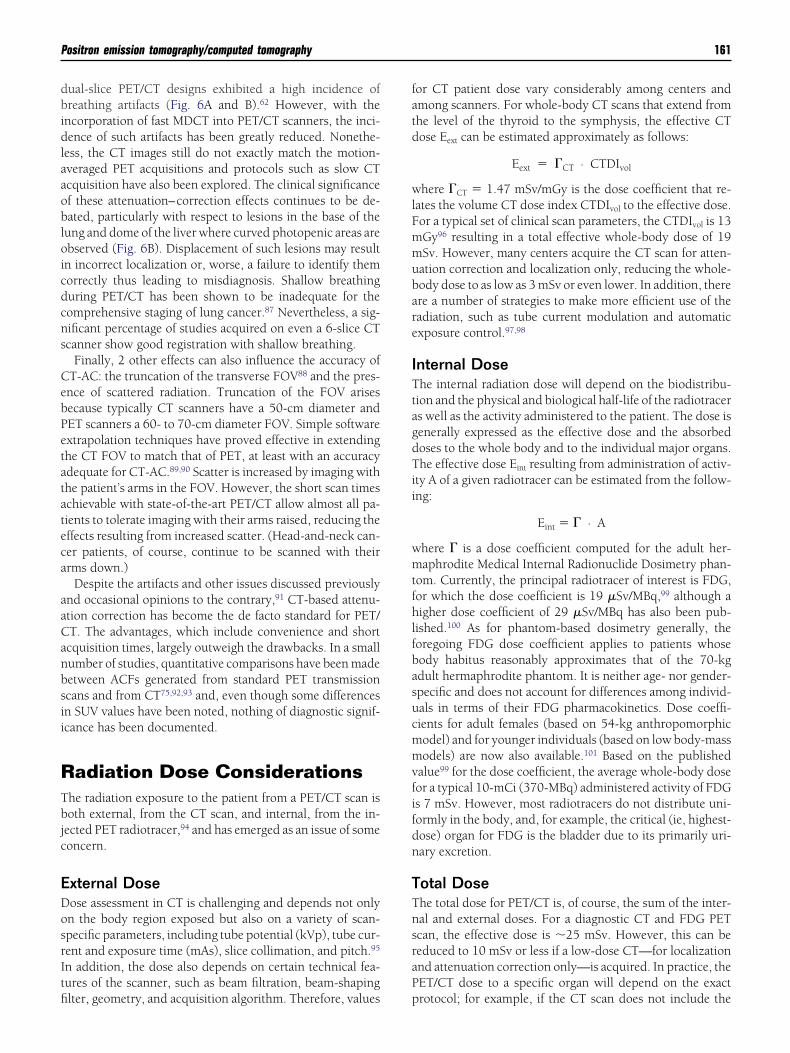
dbidlaaobloicdcns
CebPetatateca
aaCanbsii
RTbjc
EDosrItfi
fatd
wlFmmubare
ITtagdTii
wmtfhlfbasucmmvfifdn
TTnsraP
Positron emission tomography/computed tomography 161
ual-slice PET/CT designs exhibited a high incidence ofreathing artifacts (Fig. 6A and B).62 However, with the
ncorporation of fast MDCT into PET/CT scanners, the inci-ence of such artifacts has been greatly reduced. Nonethe-
ess, the CT images still do not exactly match the motion-veraged PET acquisitions and protocols such as slow CTcquisition have also been explored. The clinical significancef these attenuation–correction effects continues to be de-ated, particularly with respect to lesions in the base of the
ung and dome of the liver where curved photopenic areas arebserved (Fig. 6B). Displacement of such lesions may resultn incorrect localization or, worse, a failure to identify themorrectly thus leading to misdiagnosis. Shallow breathinguring PET/CT has been shown to be inadequate for theomprehensive staging of lung cancer.87 Nevertheless, a sig-ificant percentage of studies acquired on even a 6-slice CTcanner show good registration with shallow breathing.
Finally, 2 other effects can also influence the accuracy ofT-AC: the truncation of the transverse FOV88 and the pres-nce of scattered radiation. Truncation of the FOV arisesecause typically CT scanners have a 50-cm diameter andET scanners a 60- to 70-cm diameter FOV. Simple softwarextrapolation techniques have proved effective in extendinghe CT FOV to match that of PET, at least with an accuracydequate for CT-AC.89,90 Scatter is increased by imaging withhe patient’s arms in the FOV. However, the short scan timeschievable with state-of-the-art PET/CT allow almost all pa-ients to tolerate imaging with their arms raised, reducing theffects resulting from increased scatter. (Head-and-neck can-er patients, of course, continue to be scanned with theirrms down.)
Despite the artifacts and other issues discussed previouslynd occasional opinions to the contrary,91 CT-based attenu-tion correction has become the de facto standard for PET/T. The advantages, which include convenience and shortcquisition times, largely outweigh the drawbacks. In a smallumber of studies, quantitative comparisons have been madeetween ACFs generated from standard PET transmissioncans and from CT75,92,93 and, even though some differencesn SUV values have been noted, nothing of diagnostic signif-cance has been documented.
adiation Dose Considerationshe radiation exposure to the patient from a PET/CT scan isoth external, from the CT scan, and internal, from the in-
ected PET radiotracer,94 and has emerged as an issue of someoncern.
xternal Doseose assessment in CT is challenging and depends not onlyn the body region exposed but also on a variety of scan-pecific parameters, including tube potential (kVp), tube cur-ent and exposure time (mAs), slice collimation, and pitch.95
n addition, the dose also depends on certain technical fea-ures of the scanner, such as beam filtration, beam-shaping
lter, geometry, and acquisition algorithm. Therefore, values por CT patient dose vary considerably among centers andmong scanners. For whole-body CT scans that extend fromhe level of the thyroid to the symphysis, the effective CTose Eext can be estimated approximately as follows:
Eext � �CT · CTDIvol
here �CT � 1.47 mSv/mGy is the dose coefficient that re-ates the volume CT dose index CTDIvol to the effective dose.or a typical set of clinical scan parameters, the CTDIvol is 13Gy96 resulting in a total effective whole-body dose of 19Sv. However, many centers acquire the CT scan for atten-ation correction and localization only, reducing the whole-ody dose to as low as 3 mSv or even lower. In addition, therere a number of strategies to make more efficient use of theadiation, such as tube current modulation and automaticxposure control.97,98
nternal Dosehe internal radiation dose will depend on the biodistribu-
ion and the physical and biological half-life of the radiotracers well as the activity administered to the patient. The dose isenerally expressed as the effective dose and the absorbedoses to the whole body and to the individual major organs.he effective dose Eint resulting from administration of activ-
ty A of a given radiotracer can be estimated from the follow-ng:
Eint � � · A
here � is a dose coefficient computed for the adult her-aphrodite Medical Internal Radionuclide Dosimetry phan-
om. Currently, the principal radiotracer of interest is FDG,or which the dose coefficient is 19 �Sv/MBq,99 although aigher dose coefficient of 29 �Sv/MBq has also been pub-
ished.100 As for phantom-based dosimetry generally, theoregoing FDG dose coefficient applies to patients whoseody habitus reasonably approximates that of the 70-kgdult hermaphrodite phantom. It is neither age- nor gender-pecific and does not account for differences among individ-als in terms of their FDG pharmacokinetics. Dose coeffi-ients for adult females (based on 54-kg anthropomorphicodel) and for younger individuals (based on low body-massodels) are now also available.101 Based on the published
alue99 for the dose coefficient, the average whole-body doseor a typical 10-mCi (370-MBq) administered activity of FDGs 7 mSv. However, most radiotracers do not distribute uni-ormly in the body, and, for example, the critical (ie, highest-ose) organ for FDG is the bladder due to its primarily uri-ary excretion.
otal Dosehe total dose for PET/CT is, of course, the sum of the inter-al and external doses. For a diagnostic CT and FDG PETcan, the effective dose is �25 mSv. However, this can beeduced to 10 mSv or less if a low-dose CT—for localizationnd attenuation correction only—is acquired. In practice, theET/CT dose to a specific organ will depend on the exact
rotocol; for example, if the CT scan does not include the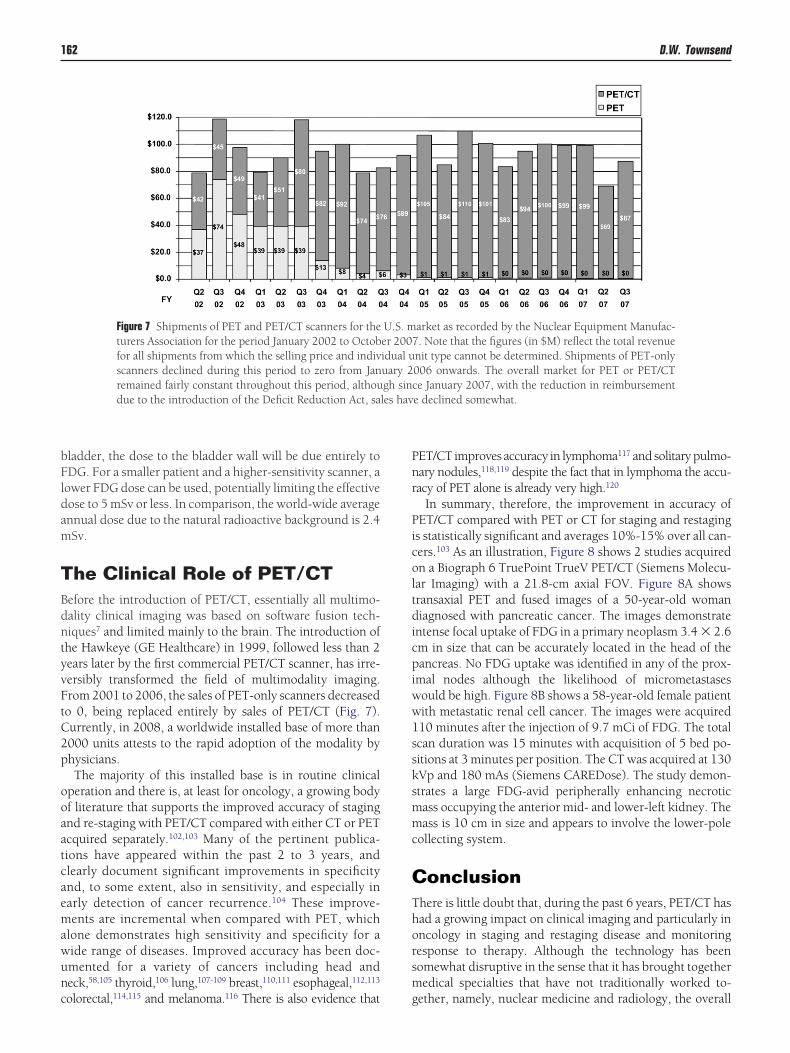
bFldam
TBdntyvFtC2p
ooaatcaemawunc
Pnr
Picoltdicpiww1ssksmmc
CThorsm
les hav
162 D.W. Townsend
ladder, the dose to the bladder wall will be due entirely toDG. For a smaller patient and a higher-sensitivity scanner, a
ower FDG dose can be used, potentially limiting the effectiveose to 5 mSv or less. In comparison, the world-wide averagennual dose due to the natural radioactive background is 2.4Sv.
he Clinical Role of PET/CTefore the introduction of PET/CT, essentially all multimo-ality clinical imaging was based on software fusion tech-iques7 and limited mainly to the brain. The introduction ofhe Hawkeye (GE Healthcare) in 1999, followed less than 2ears later by the first commercial PET/CT scanner, has irre-ersibly transformed the field of multimodality imaging.rom 2001 to 2006, the sales of PET-only scanners decreasedo 0, being replaced entirely by sales of PET/CT (Fig. 7).urrently, in 2008, a worldwide installed base of more than000 units attests to the rapid adoption of the modality byhysicians.The majority of this installed base is in routine clinical
peration and there is, at least for oncology, a growing bodyf literature that supports the improved accuracy of stagingnd re-staging with PET/CT compared with either CT or PETcquired separately.102,103 Many of the pertinent publica-ions have appeared within the past 2 to 3 years, andlearly document significant improvements in specificitynd, to some extent, also in sensitivity, and especially inarly detection of cancer recurrence.104 These improve-ents are incremental when compared with PET, which
lone demonstrates high sensitivity and specificity for aide range of diseases. Improved accuracy has been doc-mented for a variety of cancers including head andeck,58,105 thyroid,106 lung,107-109 breast,110,111 esophageal,112,113
Figure 7 Shipments of PET and PET/CT scanners for theturers Association for the period January 2002 to Octobfor all shipments from which the selling price and indivscanners declined during this period to zero from Janremained fairly constant throughout this period, althoudue to the introduction of the Deficit Reduction Act, sa
olorectal,114,115 and melanoma.116 There is also evidence that g
ET/CT improves accuracy in lymphoma117 and solitary pulmo-ary nodules,118,119 despite the fact that in lymphoma the accu-acy of PET alone is already very high.120
In summary, therefore, the improvement in accuracy ofET/CT compared with PET or CT for staging and restaging
s statistically significant and averages 10%-15% over all can-ers.103 As an illustration, Figure 8 shows 2 studies acquiredn a Biograph 6 TruePoint TrueV PET/CT (Siemens Molecu-ar Imaging) with a 21.8-cm axial FOV. Figure 8A showsransaxial PET and fused images of a 50-year-old womaniagnosed with pancreatic cancer. The images demonstrate
ntense focal uptake of FDG in a primary neoplasm 3.4 � 2.6m in size that can be accurately located in the head of theancreas. No FDG uptake was identified in any of the prox-
mal nodes although the likelihood of micrometastasesould be high. Figure 8B shows a 58-year-old female patientith metastatic renal cell cancer. The images were acquired10 minutes after the injection of 9.7 mCi of FDG. The totalcan duration was 15 minutes with acquisition of 5 bed po-itions at 3 minutes per position. The CT was acquired at 130Vp and 180 mAs (Siemens CAREDose). The study demon-trates a large FDG-avid peripherally enhancing necroticass occupying the anterior mid- and lower-left kidney. Theass is 10 cm in size and appears to involve the lower-pole
ollecting system.
onclusionhere is little doubt that, during the past 6 years, PET/CT hasad a growing impact on clinical imaging and particularly inncology in staging and restaging disease and monitoringesponse to therapy. Although the technology has beenomewhat disruptive in the sense that it has brought togetheredical specialties that have not traditionally worked to-
arket as recorded by the Nuclear Equipment Manufac-. Note that the figures (in $M) reflect the total revenue
nit type cannot be determined. Shipments of PET-only006 onwards. The overall market for PET or PET/CTce January 2007, with the reduction in reimbursemente declined somewhat.
U.S. mer 2007idual uuary 2gh sin
ether, namely, nuclear medicine and radiology, the overall
itabaatra
ADIc
R
kVp an
Positron emission tomography/computed tomography 163
mpact has been positive. To meet the demand for cross-raining of both the technologists who operate the devicesnd the physicians who interpret the studies, guidelines haveeen published121 and new standards established, leading tosomewhat different situation today from the way radiologynd nuclear medicine have traditionally functioned. Thisrend is likely to continue as other multimodality deviceseach the clinic, including SPECT/CT (introduced in 2004)nd MR/PET (currently under development).
cknowledgmentsr. Townsend is a senior consultant with Siemens Molecular
maging, Knoxville, TN, that manufactures and markets aombined PET/CT scanner.
eferences1. Levin DN, Pelizzari CA, Chen GT, et al: Retrospective geometric cor-
relation of MR, CT, and PET images. Radiology 169:817-823, 19882. Hawkes DJ, Hill DL, Hallpike L, et al: Coregistration of structural and
functional images, in Valk P, Bailey DL, Townsend DW, et al (eds):Positron Emission Tomography: Basic Science and Clinical Practice.New York, Springer-Verlag, 2003, pp 181-198
3. Woods RP, Mazziotta JC, Cherry SR: MRI-PET registration with auto-mated algorithm. J Comput Assist Tomogr 17:536-546, 1993
4. Maes F, Collignon A, Vandermeulen D, et al: Multimodality imageregistration by maximization of mutual information. IEEE Trans MedImaging 16:187-198, 1997
AFigure 8 Two studies acquired on a Biograph 6 TruePoinrow) and fused images (bottom row). (A) A 50-year-old wacquired 94 minutes after injection of 10.3 mCi of FDGbed positions at 2 minutes per position. The CT was acqyear-old female patient with metastatic renal cell canceminutes after injection of 9.7 mCi of FDG. The total scaat 3 minutes per position. The CT was acquired at 130
5. Wahl RL, Quint LE, Cieslak RD, et al: “Anatometabolic” tumor imag-
ing: Fusion of FDG PET with CT or MRI to localize foci of increasedactivity. J Nucl Med 34:1190-1197, 1993
6. West J, Fitzpatrick JM, Wang MY, et al: Comparison and evaluation ofretrospective intermodality brain image registration techniques.J Comput Assist Tomogr 21:554-566, 1997
7. Hutton BF, Braun M: Software for image registration: Algorithms,accuracy, efficacy. Semin Nucl Med 33:180-192, 2003
8. Hasegawa BH, Gingold EL, Reilly SM, et al: Description of a simulta-neous emission-transmission CT system. Proc SPIE 1231:50-60, 1990
9. Hasegawa BH, Stebler B, Rutt BK, et al: A prototype high-purity ger-manium detector system with fast photon-counting circuitry for med-ical imaging. Med Phys 18:900-909, 1991
10. Lang TF, Hasegawa BH, Liew SC, et al: Description of a prototypeemission-transmission computed tomography imaging system. J NuclMed 33:1881-1887, 1992
11. Hasegawa BH, Lang TF, Brown EL, et al. Object specific attenuationcorrection of SPECT with correlated dual-energy X-ray CT. IEEETrans Nucl Sci NS-40:1242-1252, 1993
12. Blankespoor SC, Wu X, Kalki K, et al: Attenuation correction ofSPECT using X-ray CT on an emission-transmission CT system: Myo-cardial perfusion assessment. IEEE Trans Nucl Sci 43:2263-2274,1996
13. Tang HR, Da Silva AJ, Matthay KK, et al: Neuroblastoma imagingusing a combined CT scanner-scintillation camera and 131I-MIBG.J Nucl Med 42:237-47, 2001
14. Beyer T, Kinahan PE, Townsend DW, et al: The use of X-ray CT forattenuation correction of PET data. Nuclear Science Symposium andMedical Imaging Conference, 1994, 1994 IEEE Conference Record4:1573-1577 vol. 4, 1994
15. Beyer T, Townsend DW, Brun T, et al: A combined PET/CT scanner
BV PET/CT scanner. Transaxial sections are for PET (topwith a diagnosis of pancreatic cancer. The images were
otal scan duration was 10 minute with acquisition of 5t 130 kVp and 180 mAs (Siemens CAREDose). (B) A 58an unknown primary. The images were acquired 110ion was 15 minutes with acquisition of 5 bed positionsd 180 mAs (Siemens CAREDose).
t Trueoman
. The tuired ar fromn durat
for clinical oncology. J Nucl Med 41:1369-1379, 2000
164 D.W. Townsend
16. Kinahan PE, Townsend DW, Beyer T, et al: Attenuation correction fora combined 3D PET/CT scanner. Med Phys 25:2046-2053, 1998
17. Charron M, Beyer T, Bohnen NN, et al: Image analysis in patients withcancer studied with a combined PET and CT scanner. Clin Nucl Med25:905-10, 2000
18. Kluetz PG, Meltzer CC, Villemagne VL, et al: Combined PET/CT im-aging in oncology. Impact on patient management. Clin Positron Im-aging 3:223-230, 2000
19. Meltzer CC, Luketich JD, Friedman D, et al: Whole-body FDGpositron emission tomographic imaging for staging esophageal cancercomparison with computed tomography. Clin Nucl Med 25:882-887,2000
20. Patton JA, Delbeke D, Sandler MP: Image fusion using an integrated,dual-head coincidence camera with X-ray tube-based attenuationmaps. J Nucl Med 41:1364-1368, 2000
21. Bocher M, Balan A, Krausz Y, et al: Gamma camera-mounted anatom-ical X-ray tomography: Technology, system characteristics and firstimages. Eur J Nucl Med 27:619-627, 2000
22. Surti S, Kuhn A, Werner ME, et al: Performance of philips gemini TFPET/CT scanner with special consideration for its time-of-flight imag-ing capabilities. J Nucl Med 48:471-480, 2007
23. Kalender WA, Seissler W, Klotz E, et al: Spiral volumetric CT withsingle-breath-hold technique, continuous transport, and continuousscanner rotation. Radiology 176:181-183, 1990
24. Schardt P, Deuringer J, Freudenberger J, et al: New x-ray tube perfor-mance in computed tomography by introducing the rotating envelopetube technology. Med Phys 31:2699-2706, 2004
25. Takagi K, Fukazawa T: Cerium-activated Gd2SiO5 single crystal scin-tillator. App Phys Lett 42:43-45, 1983
26. Melcher CL, Schweitzer JS: Cerium-doped lutetium oxyorthosilicate:A fast, efficient new scintillator. IEEE Trans Nucl Sci 39:502-505,1992
27. Townsend DW, Isoardi RA, Bendriem B. Volume imaging tomo-graphs, in Bendriem B, Townsend DW (eds): The Theory and Practiceof 3D PET. Dordrecht, Kluwer Academic Publishers, 1998, pp 111-132
28. Kemp BJ, Kim C, Williams JJ, et al, National Electrical ManufacturersAssociation (NEMA): NEMA NU 2-2001 performance measurementsof an LYSO-based PET/CT system in 2D and 3D acquisition modes.J Nucl Med 47:1960-1967, 2006
29. Strobel K, Rudy M, Treyer V, et al: Objective and subjective compar-ison of standard 2-D and fully 3-D reconstructed data on a PET/CTsystem. Nucl Med Commun 28:555-559, 2007
30. Jakoby BW, Bercier Y, Watson CC, et al: Physical performance andclinical workflow of a new LSO HI-REZ PET/CT scanner. NuclearScience Symposium Conference Record, 2006 IEEE 5:3130-3134,2006
31. Townsend DW, Jakoby B, Long MJ, et al. Performance and clinicalworkflow of a new combined PET/CT scanner. J Nucl Med 48:437P,2007
32. Budinger TF: Time-of-flight positron emission tomography: Statusrelative to conventional PET. J Nucl Med 24:73-78, 1983
33. Muehllehner G, Karp JS: Positron emission tomography. Phys MedBiol 51:R117-37, 2006
34. Kinahan PE, Rodgers JG: Analytic 3D image reconstruction using alldetected events. IEEE Trans Nucl Sci 36:964-968, 1989
35. Defrise M, Kinahan PE, Townsend DW, Michel C, Sibomana M, New-port DF: Exact and approximate rebinning algorithms for 3-D PETdata. IEEE Trans Med Imaging 16:145-158, 1997
36. Hudson H, Larkin R: Accelerated image reconstruction using orderedsubsets of projection data. IEEE Trans Med Imaging 13:601-609,1994
37. Comtat C, Kinahan PE, Defrise M, et al: Fast reconstruction of 3D PETdata with accurate statistical modeling. IEEE Trans Nucl Sci 45:1083-1089, 1998
38. Comtat C, Bataille F, Michel C, et al: OSEM-3D reconstruction strat-egies for the ECAT HRRT. Nuclear Science Symposium ConferenceRecord, 2004 IEEE 6:3492-3496, 2004
39. Liu X, Comtat C, Michel C, et al: Comparison of 3-D reconstruction
with 3D-OSEM and with FORE�OSEM for PET. IEEE Trans MedImaging 20:804-814, 2001
40. Panin VY, Kehren F, Michel C, et al: Fully 3-D PET reconstructionwith system matrix derived from point source measurements. IEEETrans Med Imaging 25:907-921, 2006
41. Popescu LM, Matej S, Lewitt RM. Iterative image reconstruction usinggeometrically ordered subsets with list-mode data. Nuclear ScienceSymposium Conference Record, 2004 IEEE 6:3536–3540, 2004
42. Daube-Witherspoon ME, Matej S, Karp JS, et al: Application of therow action maximum likelihood algorithm with spherical basis func-tions to clinical PET imaging. IEEE Trans Nucl Sci 48:24-30, 2001
43. Kinahan PE, Hasegawa BH, Beyer T: X-ray-based attenuation correc-tion for positron emission tomography/computed tomography scan-ners. Semin Nucl Med 33:166-179, 2003
44. Watson CC, Townsend DW, Bendriem B. PET/CT systems, in Wer-nick M, Aarsvold J (eds): Emission Tomography. London, ElsevierScience, 2004, pp 195-212
45. Burger C, Goerres G, Schoenes S, et al: PET attenuation coefficientsfrom CT images: Experimental evaluation of the transformation of CTinto PET 511-keV attenuation coefficients. Eur J Nucl Med Mol Im-aging 29:922-927, 2002
46. Watson CC, Rappoport V, Faul D, et al: A method for calibrating theCT-based attenuation correction of PET in human tissue. IEEE TransNucl Sci 53:102-107, 2006
47. Carney JP, Townsend DW, Rappoport V, et al: Method for transform-ing CT images for attenuation correction in PET/CT imaging. MedPhys 33:976-983, 2006
48. Cohade C, Wahl RL: Applications of positron emission tomography/computed tomography image fusion in clinical positron emission to-mography-clinical use, interpretation methods, diagnostic improve-ments. Semin Nucl Med 33:228-237, 2003
49. Bockisch A, Beyer T, Antoch G, et al: Positron emission tomography/computed tomography–imaging protocols, artifacts, and pitfalls. MolImaging Biol 6:188-199, 2004
50. Nakamoto Y, Chin BB, Cohade C, et al: PET/CT: Artifacts caused bybowel motion. Nucl Med Commun 25:221-225, 2004
51. Cohade C, Osman M, Marshall L, et al: Metallic object artifacts onPET-CT: Clinical and phantom studies. J Nucl Med 43:308P, 2002
52. Goerres GW, Ziegler SI, Burger C, et al: Artifacts at PET and PET/CTcaused by metallic hip prosthetic material. Radiology 226:577-584,2003
53. Kamel EM, Burger C, Buck A, et al: Impact of metallic dental implantson CT-based attenuation correction in a combined PET/CT scanner.Eur Radiol 13:724-728, 2003
54. Yau YY, Coel M, Chan WS, et al: Application of IV contrast in PET-CT:Does it really produce attenuation correction error. J Nucl Med 44:272P, 2003
55. Antoch G, Freudenberg LS, Beyer T, et al: To enhance or not toenhance? 18F-FDG and CT contrast agents in dual-modality 18F-FDG PET/CT. J Nucl Med 45:56S-65S, 2004 (suppl 1)
56. Carney JP, Beyer T, Brasse D, et al: Clinical PET/CT scanning usingoral CT contrast agents. J Nucl Med 45:57P, 2002
57. Cohade C, Osman M, Nakamoto Y, et al: Initial experience with oralcontrast in PET/CT: Phantom and clinical studies. J Nucl Med 44:412-416, 2003
58. Schafers KP, Raupach R, Beyer T: Combined 18F-FDG-PET/CT im-aging of the head and neck. An approach to metal artifact correction.Nuklearmedizin 45:219-222, 2006
59. Lemmens C, Nuyts J, Faul D, et al: Suppression of metal streak arti-facts in CT using a MAP reconstruction procedure. IEEE MIC Confer-ence Record 6:3431-3437, 2006
60. Mirzaei S, Guerchaft M, Bonnier C, et al: Use of segmented CT trans-mission map to avoid metal artifacts in PET images by a PET-CTdevice. BMC Nucl Med 5:3, 2005
61. Sarikaya I, Yeung HW, Erdi Y, et al: Respiratory artefact causing mal-positioning of liver dome lesion in right lower lung. Clin Nucl Med28:943-944, 2003
62. Romer W, Chung M, Chan A, et al: Single-detector helical CT in
1
1
1
1
1
1
1
1
Positron emission tomography/computed tomography 165
PET-CT: Assessment of image quality. AJR Am J Roentgenol182:1571-1577, 2004
63. Osman MM, Cohade C, Nakamoto Y, et al: Clinically significant inac-curate localization of lesions with PET/CT: Frequency in 300 patients.J Nucl Med 44:240-243, 2003
64. Carney JP, Townsend DW: CT-based attenuation correction forPET/CT scanners, in von Schulthess GK (ed): Molecular AnatomicImaging: PET-CT and SPECT-CT Integrated Modality Imaging. Lip-pincott, Williams and Wilkins, 2006, pp 54-62
65. Antoch G, Freudenberg LS, Egelhof T, et al: Focal tracer uptake: Apotential artifact in contrast-enhanced dual-modality PET/CT scans.J Nucl Med 43:1339-1342, 2002
66. Berthelsen AK, Holm S, Loft A, et al: PET/CT with intravenous con-trast can be used for PET attenuation correction in cancer patients. EurJ Nucl Med Mol Imaging 32:1167-1175, 2005
67. Mawlawi O, Erasmus JJ, Munden RF, et al: Quantifying the effect of IVcontrast media on integrated PET/CT: Clinical evaluation. AJR Am JRoentgenol 186:308-319, 2006
68. Brechtel K, Klein M, Vogel M, et al: Optimized contrast-enhanced CTprotocols for diagnostic whole-body 18F-FDG PET/CT: Technical as-pects of single-phase versus multiphase CT imaging. J Nucl Med 47:470-476, 2006
69. Gollub MJ, Hong R, Sarasohn DM, et al: Limitations of CT duringPET/CT. J Nucl Med 48:1583-1591, 2007
70. Otsuka H, Graham MM, Kubo A, et al: The effect of oral contrast onlarge bowel activity in FDG-PET/CT. Ann Nucl Med 19:101-108,2005
71. Antoch G, Kuehl H, Kanja J, et al: Dual-modality PET/CT scanningwith negative oral contrast agent to avoid artifacts: Introduction andevaluation. Radiology 230:879-885, 2004
72. Kaneta T, Takanami K, Wakayama Y, et al: High-density materials donot always induce artifacts on PET/CT: What is responsible for thedifference? Nucl Med Commun 28:495-499, 2007
73. Beyer T, Antoch G, Blodgett T, et al: Dual-modality PET/CT imaging:The effect of respiratory motion on combined image quality in clinicaloncology. Eur J Nucl Med Mol Imaging 30:588-596, 2003
74. Osman MM, Cohade C, Nakamoto Y, et al: Respiratory motion arti-facts on PET emission images obtained using CT attenuation correc-tion on PET-CT. Eur J Nucl Med Mol Imaging 30:603-606, 2003
75. Papathanassiou D, Becker S, Amir R, et al: Respiratory motion artefactin the liver dome on FDG PET/CT: Comparison of attenuation cor-rection with CT and a caesium external source. Eur J Nucl Med MolImaging 32:1422-1428, 2005
76. Bacharach SL: PET/CT attenuation correction: Breathing lessons.J Nucl Med 48:677-679, 2007
77. Beyer T, Rosenbaum S, Veit P, et al: Respiration artifacts in whole-body (18)F-FDG PET/CT studies with combined PET/CT tomographsemploying spiral CT technology with 1 to 16 detector rows. Eur J NuclMed Mol Imaging 32:1429-1439, 2005
78. Pan T, Mawlawi O, Nehmeh SA, et al: Attenuation correction of PETimages with respiration-averaged CT images in PET/CT. J Nucl Med46:1481-1487, 2005
79. Chi PC, Mawlawi O, Nehmeh SA, et al: Design of respiration averagedCT for attenuation correction of the PET data from PET/CT. Med Phys34:2039-2047, 2007
80. Alessio AM, Kohlmyer S, Branch K, et al: Cine CT for attenuationcorrection in cardiac PET/CT. J Nucl Med 48:794-801, 2007
81. Pan T, Lee TY, Rietzel E, et al: 4D-CT imaging of a volume influencedby respiratory motion on multi-slice CT. Med Phys 31:333-340, 2004
82. Meirelles GS, Erdi YE, Nehmeh SA, et al: Deep-inspiration breath-hold PET/CT: Clinical findings with a new technique for detection andcharacterization of thoracic lesions. J Nucl Med 48:712-719, 2007
83. Nehmeh SA, Erdi YE, Meirelles GS, et al: Deep-inspiration breath-hold PET/CT of the thorax. J Nucl Med 48:22-26, 2007
84. Dawood M, Buther F, Lang N, et al: Respiratory gating in positronemission tomography: A quantitative comparison of different gatingschemes. Med Phys 34:3067, 2007
85. Martinez-Moller A, Zikic D, Botnar RM, et al: Dual cardiac-respiratory 1
gated PET: Implementation and results from a feasibility study. EurJ Nucl Med Mol Imaging 34:1447-1454, 2007
86. Nagel CC, Bosmans G, Dekker AL, et al: Phased attenuation correctionin respiration correlated computed tomography/positron emitted to-mography. Med Phys 33:1840-1847, 2006
87. Allen-Auerbach M, Yeom K, Park J, et al: Standard PET/CT of the chestduring shallow breathing is inadequate for comprehensive staging oflung cancer. J Nucl Med 47:298-301, 2006
88. Beyer T, Bockisch A, Kuhl H, et al: Whole-body 18F-FDG PET/CT inthe presence of truncation artifacts. J Nucl Med 47:91-99, 2006
89. Carney JP, Townsend DW, Kinahan PE, et al. CT-based attenuationcorrection: The effects of imaging with the arms in the field of view[abstract]. J Nucl Med Soc Nucl Med 42S:56P-57P, 2001
90. Mawlawi O, Pan T, Cody DD, et al: Evaluation of a new CT truncationcorrection algorithm for accurate quantification of PET/CT images[abstract]. J Nucl Med 45S:413P, 2004
91. Zaidi H: Is radionuclide transmission scanning obsolete for dual-mo-dality PET/CT systems? Eur J Nucl Med Mol Imaging 34:815-818,2007
92. Nakamoto Y, Osman M, Cohade C, et al: PET/CT: Comparison ofquantitative tracer uptake between germanium and CT transmissionattenuation-corrected images. J Nucl Med 43:1137-1143, 2002
93. van Dalen JA, Visser EP, Vogel WV, et al: Impact of ge-68/Ga-68-based versus CT-based attenuation correction on PET. Med Phys 34:889-897, 2007
94. Brix G, Beyer T. PET/CT: Dose-escalated image fusion? Nuklearmedi-zin 44:S51-S57, 2005 (suppl 1)
95. ICRP 87: Managing Patient Dose in Computed Tomography. Oxford,New York, Published for the International Commission on Radiolog-ical Protection by Pergamon, 2000
96. Brix G, Lechel U, Glatting G, et al: Radiation exposure of patientsundergoing whole-body dual-modality 18F-FDG PET/CT examina-tions. J Nucl Med 46:608-613, 2005
97. Kalender WA, Wolf H, Suess C, et al: Dose reduction in CT by on-linetube current control: Principles and validation on phantoms and ca-davers. Eur Radiol 9:323-328, 1999
98. Kachelriess M, Watzke O, Kalender WA: Generalized multi-dimen-sional adaptive filtering for conventional and spiral single-slice, multi-slice, and cone-beam CT. Med Phys 28:475-490, 2001
99. ICRP 53: Radiation Dose to Patients from Radiopharmaceuticals: Ad-dendum 2 to ICRP Publication 53. Oxford, New York, Published forthe International Commission on Radiological Protection by Perga-mon, 1999
00. Deloar HM, Fujiwara T, Shidahara M, et al: Estimation of absorbeddose for 2-[F-18]fluoro-2-deoxy-D-glucose using whole-bodypositron emission tomography and magnetic resonance imaging. EurJ Nucl Med 25:565-574, 1998
01. Hays MT, Watson EE, Thomas SR, et al: MIRD dose estimate reportno. 19: Radiation absorbed dose estimates from (18)F-FDG. J NuclMed 43:210-214, 2002
02. Czernin J, Auerbach MA. Clinical PET/CT imaging: Promises andmisconceptions. Nuklearmedizin 44:S18-S23, 2005 (suppl 1)
03. Czernin J, Allen-Auerbach M, Schelbert HR: Improvements in cancerstaging with PET/CT: Literature-based evidence as of september 2006.J Nucl Med 48:78S-88S, 2007 (suppl 1)
04. Israel O, Kuten A: Early detection of cancer recurrence: 18F-FDGPET/CT can make a difference in diagnosis and patient care. J NuclMed 48:28S-35S, 2007 (suppl 1)
05. Chen YK, Su CT, Ding HJ, et al: Clinical usefulness of fused PET/CTcompared with PET alone or CT alone in nasopharyngeal carcinomapatients. Anticancer Res 26:1471-1477, 2006
06. Palmedo H, Bucerius J, Joe A, et al: Integrated PET/CT in differenti-ated thyroid cancer: Diagnostic accuracy and impact on patient man-agement. J Nucl Med 47:616-624, 2006
07. Osman MM, Cohade C, Leal J, et al: Direct comparison of FDG-PETand PET-CT imaging in staging and re-staging patients with lungcancer. J Nucl Med 43:151P, 2002
08. Lardinois D, Weder W, Hany TF, et al: Staging of non-small-cell lung
1
1
1
1
1
1
1
1
1
1
1
1
1
166 D.W. Townsend
cancer with integrated positron-emission tomography and computedtomography. N Engl J Med 348:2500-2507, 2003
09. Cerfolio RJ, Bryant AS, Ojha B: Restaging patients with N2 (stage IIIa)non-small cell lung cancer after neoadjuvant chemoradiotherapy: Aprospective study. J Thorac Cardiovasc Surg 131:1229-1235, 2006
10. Fueger BJ, Weber WA, Quon A, et al: Performance of 2-deoxy-2-[F-18]fluoro-D-glucose positron emission tomography and integratedPET/CT in restaged breast cancer patients. Mol Imaging Biol 7:369-376, 2005
11. Tatsumi M, Cohade C, Mourtzikos KA, et al: Initial experience withFDG-PET/CT in the evaluation of breast cancer. Eur J Nucl Med MolImaging 33:254-262, 2006
12. Bar-Shalom R, Guralnik L, Tsalic M, et al: The additional value ofPET/CT over PET in FDG imaging of oesophageal cancer. Eur J NuclMed Mol Imaging 32:918-924, 2005
13. Guo H, Zhu H, Xi Y, et al: Diagnostic and prognostic value of 18F-FDG PET/CT for patients with suspected recurrence from squamouscell carcinoma of the esophagus. J Nucl Med 48:1251-1258, 2007
14. Cohade C, Osman M, Leal J, Wahl RL: Direct comparison of (18)F-FDG PET and PET/CT in patients with colorectal carcinoma. J NuclMed 44:1797-1803, 2003
15. Kim JH, Czernin J, Allen-Auerbach MS, et al: Comparison between
18F-FDG PET, in-line PET/CT, and software fusion for restaging ofrecurrent colorectal cancer. J Nucl Med 46:587-595, 2005
16. Reinhardt MJ, Joe AY, Jaeger U, et al: Diagnostic performance of wholebody dual modality 18F-FDG PET/CT imaging for N- and M-stagingof malignant melanoma: Experience with 250 consecutive patients.J Clin Oncol 24:1178-1187, 2006
17. Freudenberg LS, Antoch G, Schutt P, et al: FDG-PET/CT in re-stagingof patients with lymphoma. Eur J Nucl Med Mol Imaging 31:325-329,2004
18. Yi CA, Lee KS, Kim BT, et al: Tissue characterization of solitary pul-monary nodule: Comparative study between helical dynamic CT andintegrated PET/CT. J Nucl Med 47:443-450, 2006
19. Kim SK, Allen-Auerbach M, Goldin J, et al: Accuracy of PET/CT incharacterization of solitary pulmonary lesions. J Nucl Med 48:214-220, 2007
20. Alavi A, Mavi A, Basu S, Fischman A: Is PET-CT the only option? EurJ Nucl Med Mol Imaging 34:819-821, 2007
21. Coleman RE, Delbeke D, Guiberteau MJ, et al: Concurrent PET/CTwith an integrated imaging system: Intersociety dialogue from thejoint working group of the American college of radiology, the societyof nuclear medicine, and the society of computed body tomography
and magnetic resonance. J Nucl Med 46:1225-1239, 2005