Embed Size (px)
Citation preview
Possibilities for Analysing Stratigraphic Data
Possibilities for Analysing Stratigraphic Data
Irmela Herzog, Bonn
Introduction
More than 25 years after the first publication on the principles of archaeological stratigraphy by Edward Harris (Harris, 1975; www:harrismatrix) many archaeologists consider the corresponding methods of excavation, recording and analysis as a matter of course (Renfrew / Bahn 1996, 102; Roskams 2001, 110). Even in Germany, a small Harris matrix can be found on the cover of a new book on methods in archaeology (Eggert 2001). In my view there is no other appropriate way to record and analyse deeply stratified sites in urban areas.This paper presents a new computer program for Harris matrix generation which draws not only on my experiences with my first Harris program created more than ten years ago (Herzog / Scollar 1991; Herzog 1993), but provides new possibilities for data exploration and presentation. My aim is to assist the analysis and display of stratigraphic relationships in datasets of 500 contexts or more. According to the MAP 2 standard established by English Heritage in 1991, for small projects, i.e. ones with less than 500 stratigraphic units, the Harris matrix is created manually (Watson 2000, 152). Personally, even in the case of 200 or 300 contexts, a special program for Harris matrix design is helpful, but with more than 500 stratigraphic units, such a program becomes mandatory, in order to maintain control of the data set. Some of the currently available computer programs for Harris matrix generation are based on a graph editor (Ryan 1995; www:gnet; www:ArchEd), where the user may position the boxes manually. When the matrix covers about 100 sheets of letter paper, a graph editor is uncomfortable, because it is very difficult to obtain an overview for the whole matrix, even on a big computer screen. The insertion of a new stratigraphic unit may demand a change of the positions of nearly all the other contexts in the diagram, so graph editor assisted layout can be very tedious or errors may not be detected. Therefore, it is the purpose of my program to lay out the Harris matrix automatically taking all the available chronological information into account. In addition, a database to record all relevant data for each stratigraphic unit is combined with powerful checking and exploration tools.
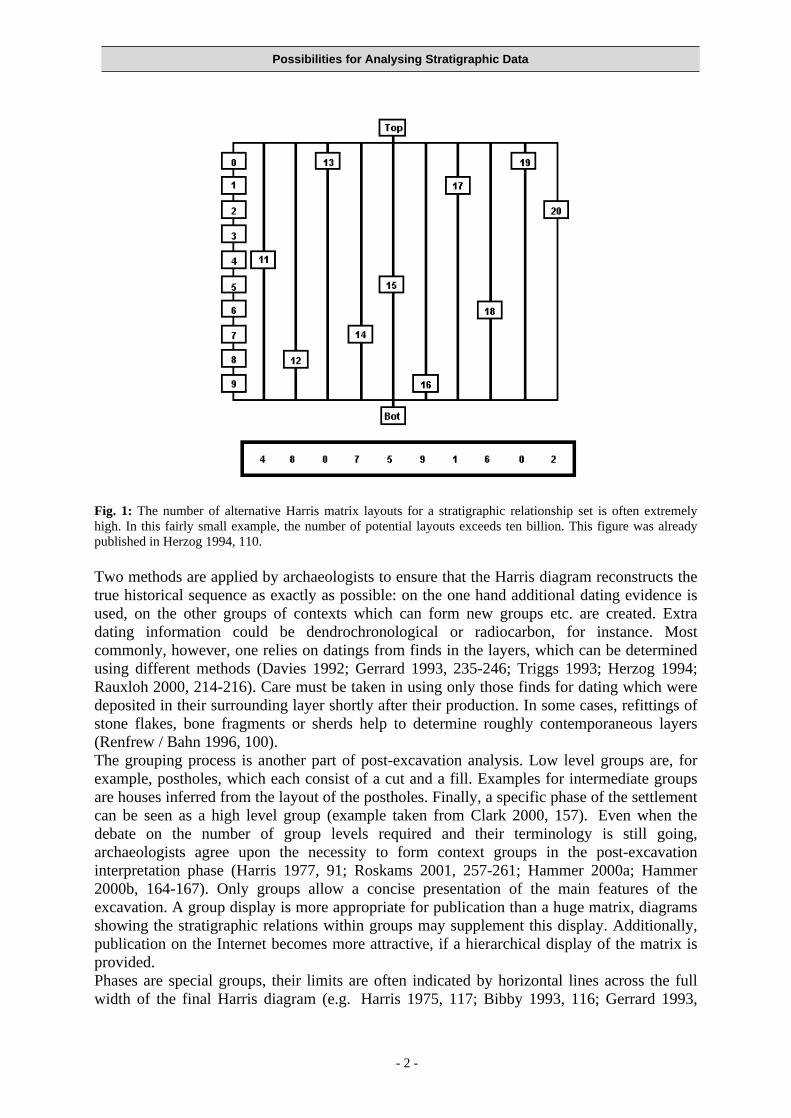
Mathematically speaking, the stratigraphic contexts and their earlier / later relationships form a partially ordered set. As the expression partially ordered implies the stratigraphic relationship network does not establish a relative chronological sequence including all contexts, let alone an absolute chronology. Archaeologically speaking the so-called multilinear or floating sequences (Harris 1984, 128) may lead to a diagram that displays two nearly contemporary layers on widely different levels, although no stratigraphic relationship was omitted from the matrix. When considering typical examples of datasets with 500 layers or more, the number of correct diagrams which can be generated from a single set of stratigraphic relations is excessive (Herzog 1994, 109; Triggs 1993, 252; Fig. 1). The Harris diagram presenting the stratigraphic units of a large excavation is normally one of millions of possible layouts that can be created on the basis of the stratigraphic relationships.
- 1 -
Possibilities for Analysing Stratigraphic Data
Fig. 1: The number of alternative Harris matrix layouts for a stratigraphic relationship set is often extremely high. In this fairly small example, the number of potential layouts exceeds ten billion. This figure was already published in Herzog 1994, 110.
Two methods are applied by archaeologists to ensure that the Harris diagram reconstructs the true historical sequence as exactly as possible: on the one hand additional dating evidence is used, on the other groups of contexts which can form new groups etc. are created. Extra dating information could be dendrochronological or radiocarbon, for instance. Most commonly, however, one relies on datings from finds in the layers, which can be determined using different methods (Davies 1992; Gerrard 1993, 235-246; Triggs 1993; Herzog 1994; Rauxloh 2000, 214-216). Care must be taken in using only those finds for dating which were deposited in their surrounding layer shortly after their production. In some cases, refittings of stone flakes, bone fragments or sherds help to determine roughly contemporaneous layers (Renfrew / Bahn 1996, 100).The grouping process is another part of post-excavation analysis. Low level groups are, for example, postholes, which each consist of a cut and a fill. Examples for intermediate groups are houses inferred from the layout of the postholes. Finally, a specific phase of the settlement can be seen as a high level group (example taken from Clark 2000, 157). Even when the debate on the number of group levels required and their terminology is still going, archaeologists agree upon the necessity to form context groups in the post-excavation interpretation phase (Harris 1977, 91; Roskams 2001, 257-261; Hammer 2000a; Hammer 2000b, 164-167). Only groups allow a concise presentation of the main features of the excavation. A group display is more appropriate for publication than a huge matrix, diagrams showing the stratigraphic relations within groups may supplement this display. Additionally, publication on the Internet becomes more attractive, if a hierarchical display of the matrix is provided.Phases are special groups, their limits are often indicated by horizontal lines across the full width of the final Harris diagram (e.g. Harris 1975, 117; Bibby 1993, 116; Gerrard 1993,
- 2 -
Possibilities for Analysing Stratigraphic Data
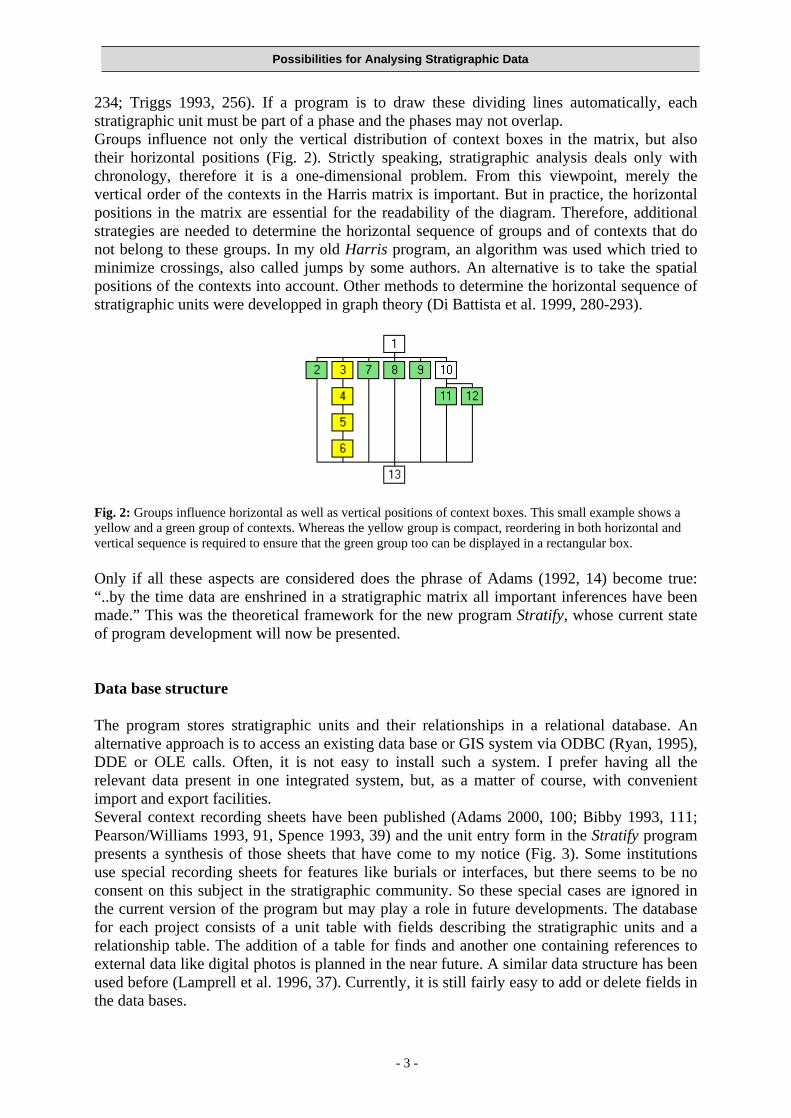
234; Triggs 1993, 256). If a program is to draw these dividing lines automatically, each stratigraphic unit must be part of a phase and the phases may not overlap. Groups influence not only the vertical distribution of context boxes in the matrix, but also their horizontal positions (Fig. 2). Strictly speaking, stratigraphic analysis deals only with chronology, therefore it is a one-dimensional problem. From this viewpoint, merely the vertical order of the contexts in the Harris matrix is important. But in practice, the horizontal positions in the matrix are essential for the readability of the diagram. Therefore, additional strategies are needed to determine the horizontal sequence of groups and of contexts that do not belong to these groups. In my old Harris program, an algorithm was used which tried to minimize crossings, also called jumps by some authors. An alternative is to take the spatial positions of the contexts into account. Other methods to determine the horizontal sequence of stratigraphic units were developped in graph theory (Di Battista et al. 1999, 280-293).
Fig. 2: Groups influence horizontal as well as vertical positions of context boxes. This small example shows a yellow and a green group of contexts. Whereas the yellow group is compact, reordering in both horizontal and vertical sequence is required to ensure that the green group too can be displayed in a rectangular box.
Only if all these aspects are considered does the phrase of Adams (1992, 14) become true: “..by the time data are enshrined in a stratigraphic matrix all important inferences have been made.” This was the theoretical framework for the new program Stratify, whose current state of program development will now be presented.
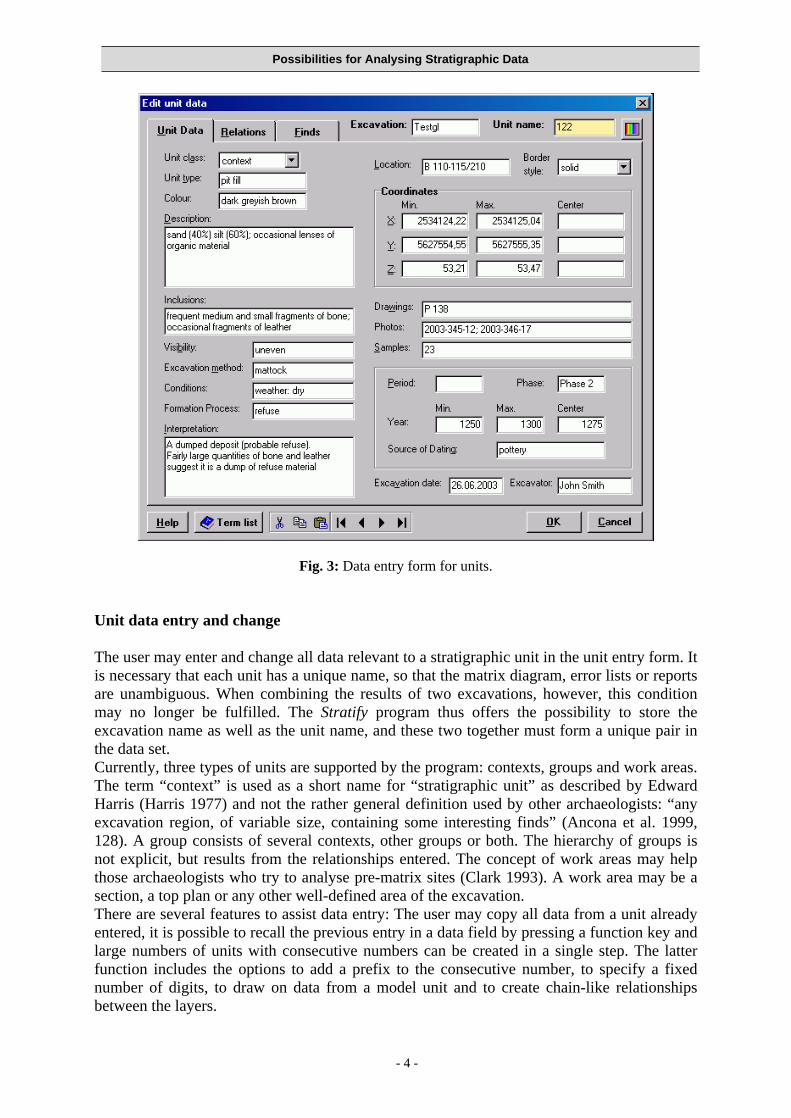
Data base structure The program stores stratigraphic units and their relationships in a relational database. An alternative approach is to access an existing data base or GIS system via ODBC (Ryan, 1995), DDE or OLE calls. Often, it is not easy to install such a system. I prefer having all the relevant data present in one integrated system, but, as a matter of course, with convenient import and export facilities. Several context recording sheets have been published (Adams 2000, 100; Bibby 1993, 111; Pearson/Williams 1993, 91, Spence 1993, 39) and the unit entry form in the Stratify program presents a synthesis of those sheets that have come to my notice (Fig. 3). Some institutions use special recording sheets for features like burials or interfaces, but there seems to be no consent on this subject in the stratigraphic community. So these special cases are ignored in the current version of the program but may play a role in future developments. The database for each project consists of a unit table with fields describing the stratigraphic units and a relationship table. The addition of a table for finds and another one containing references to external data like digital photos is planned in the near future. A similar data structure has been used before (Lamprell et al. 1996, 37). Currently, it is still fairly easy to add or delete fields in the data bases.
- 3 -
Possibilities for Analysing Stratigraphic Data
Fig. 3: Data entry form for units.
Unit data entry and change
The user may enter and change all data relevant to a stratigraphic unit in the unit entry form. It is necessary that each unit has a unique name, so that the matrix diagram, error lists or reports are unambiguous. When combining the results of two excavations, however, this condition may no longer be fulfilled. The Stratify program thus offers the possibility to store the excavation name as well as the unit name, and these two together must form a unique pair in the data set. Currently, three types of units are supported by the program: contexts, groups and work areas. The term “context” is used as a short name for “stratigraphic unit” as described by Edward Harris (Harris 1977) and not the rather general definition used by other archaeologists: “any excavation region, of variable size, containing some interesting finds” (Ancona et al. 1999, 128). A group consists of several contexts, other groups or both. The hierarchy of groups is not explicit, but results from the relationships entered. The concept of work areas may help those archaeologists who try to analyse pre-matrix sites (Clark 1993). A work area may be a section, a top plan or any other well-defined area of the excavation. There are several features to assist data entry: The user may copy all data from a unit already entered, it is possible to recall the previous entry in a data field by pressing a function key and large numbers of units with consecutive numbers can be created in a single step. The latter function includes the options to add a prefix to the consecutive number, to specify a fixed number of digits, to draw on data from a model unit and to create chain-like relationships between the layers.
- 4 -
Possibilities for Analysing Stratigraphic Data
Additionally, a term file may be used. The term file offers the opportunity to store for each text field a list of approved terms and their descriptions. An example file mainly reproduces terms and corresponding explanations given by Adams and Roskams (Adams 2000, 98-99; Roskams 2001, 193). This term file may be created on the fly, while entering the data, and can be reused in other projects. If the user enters date intervals for periods or phases, these data will be copied automatically into the unit entry form on selection of the corresponding phase or period term. Thus, the term file helps to prevent typing mistakes and may assist first-time users in choosing a term. The term file also plays a role when creating a thematic Harris diagram, but this will be shown later. I am aware that a thesaurus with all the functions and possibilities laid down in the German DIN norm for thesauri (DIN 1463, 1987) would be a more professional solution to this problem. As the term list is not a central feature of the program, but just one of many functions, I did not put that much effort into it.
Entering and changing relations
The new program supports “earlier than”, “later than”, “contemporary” and “equal” relationships as the old Harris matrix program did. Programs that do not provide for some method of stratigraphic correlation, i.e. no contemporary or equal relationships, ignore an important part of stratigraphic analysis as defined by Edward Harris (Harris 1989, 36; but: www:stratigraf). Additionally, a “part of” relationship is supported. Each stratigraphic unit may be part of one and only one group, which may be part of another group and so on. Moreover, a context may belong to one or several work areas. The new program offers the possibility to comment each relationship so that the reliability of the relation or the corresponding physical relation may be documented. This comment field may also be used to give reasons for contemporary relationships as suggested by Jablonka (Jablonka 2000, 113).
Checking the data
Quite a few checking functions are implemented by Stratify; some of them were already part of the Bonn Harris program (Herzog 1993), others are new. Filter functions similar to those available in database systems like MS Access restrict the list of contexts currently displayed to those fulfilling certain conditions. For example, all units belonging to a certain excavation or a selected group may be shown, or all units without any earlier/later relations. Several filter conditions may be combined, for example to list all units located in sector A or sector B.
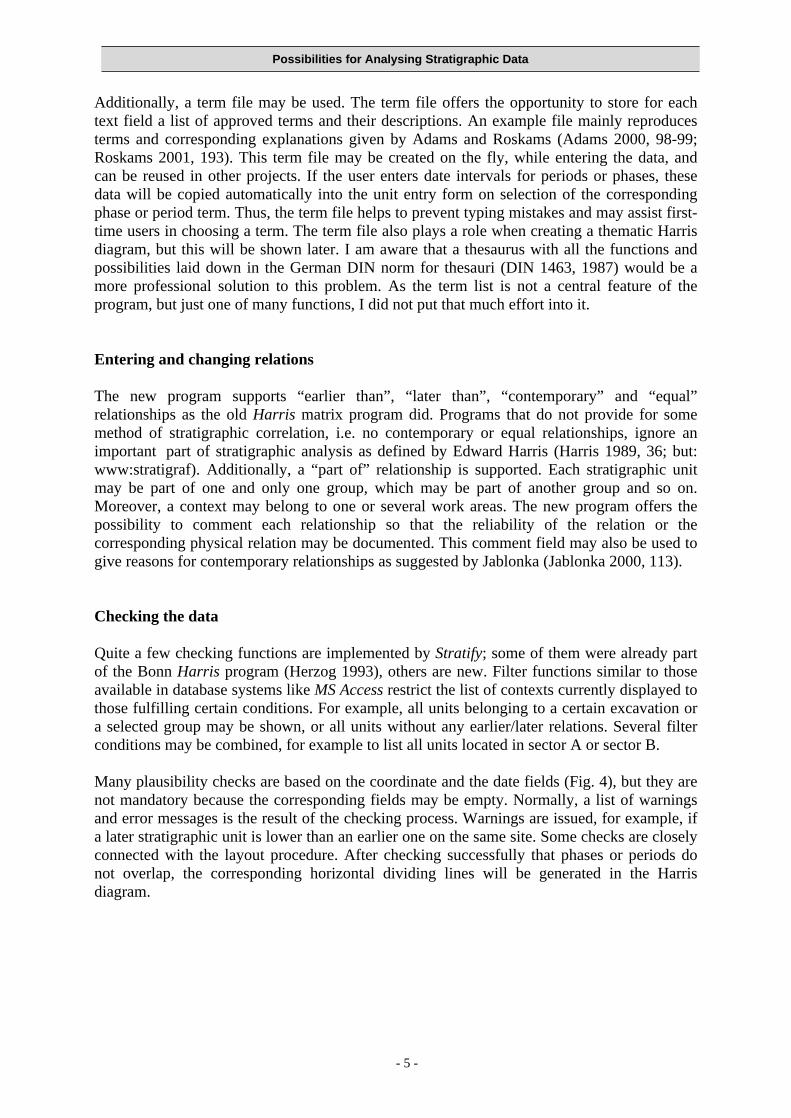
Many plausibility checks are based on the coordinate and the date fields (Fig. 4), but they are not mandatory because the corresponding fields may be empty. Normally, a list of warnings and error messages is the result of the checking process. Warnings are issued, for example, if a later stratigraphic unit is lower than an earlier one on the same site. Some checks are closely connected with the layout procedure. After checking successfully that phases or periods do not overlap, the corresponding horizontal dividing lines will be generated in the Harris diagram.
- 5 -
Possibilities for Analysing Stratigraphic Data
Fig. 4: Form with checking options, some of which control the Harris diagram layout.
Thematic unit colours and border styles
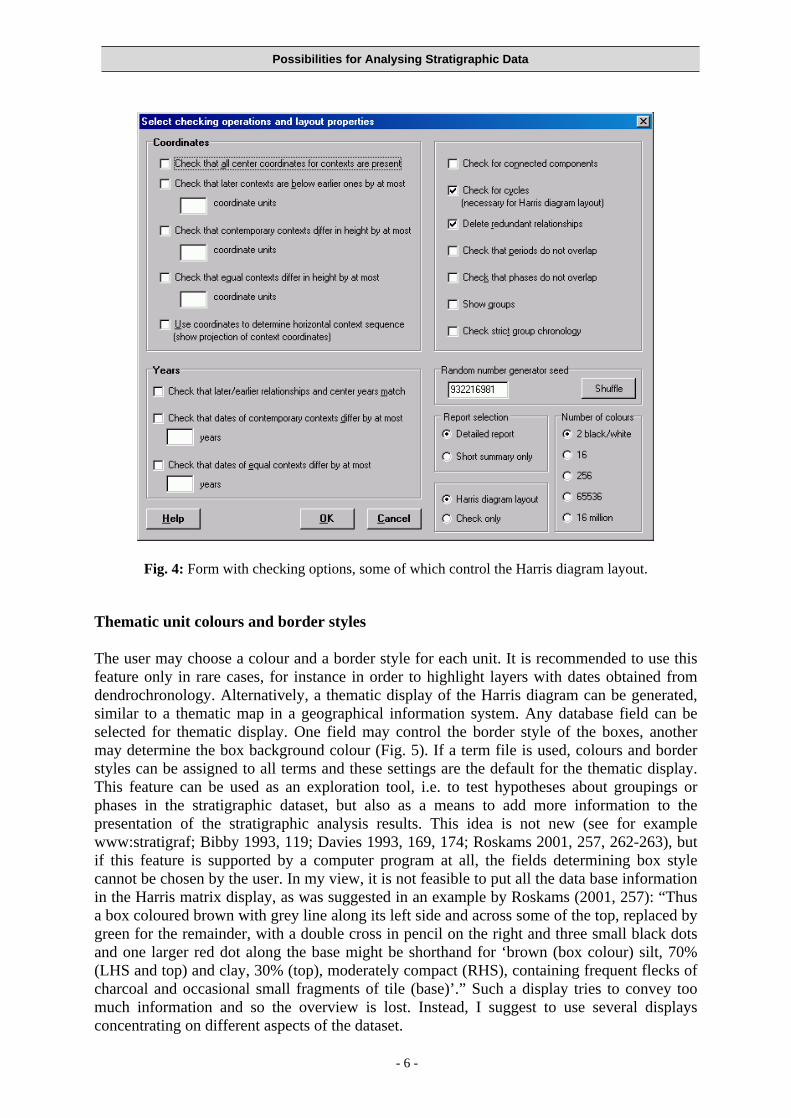
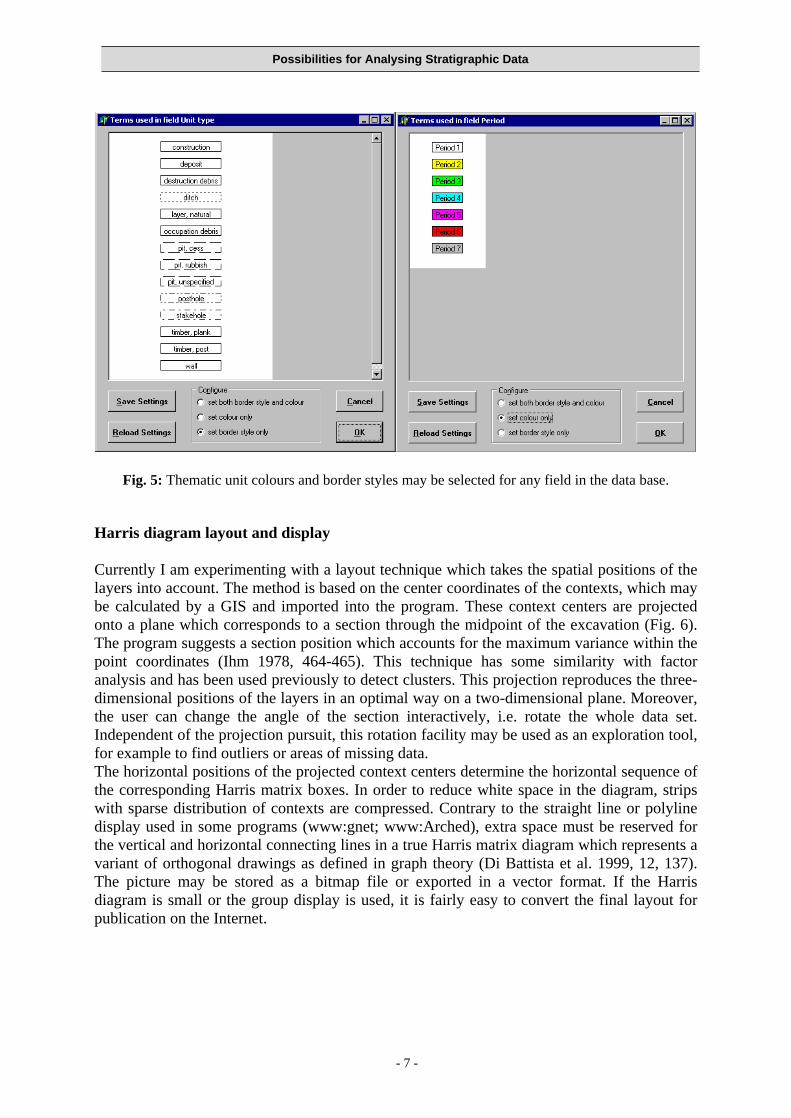
The user may choose a colour and a border style for each unit. It is recommended to use this feature only in rare cases, for instance in order to highlight layers with dates obtained from dendrochronology. Alternatively, a thematic display of the Harris diagram can be generated, similar to a thematic map in a geographical information system. Any database field can be selected for thematic display. One field may control the border style of the boxes, another may determine the box background colour (Fig. 5). If a term file is used, colours and border styles can be assigned to all terms and these settings are the default for the thematic display. This feature can be used as an exploration tool, i.e. to test hypotheses about groupings or phases in the stratigraphic dataset, but also as a means to add more information to the presentation of the stratigraphic analysis results. This idea is not new (see for example www:stratigraf; Bibby 1993, 119; Davies 1993, 169, 174; Roskams 2001, 257, 262-263), but if this feature is supported by a computer program at all, the fields determining box style cannot be chosen by the user. In my view, it is not feasible to put all the data base information in the Harris matrix display, as was suggested in an example by Roskams (2001, 257): “Thus a box coloured brown with grey line along its left side and across some of the top, replaced by green for the remainder, with a double cross in pencil on the right and three small black dots and one larger red dot along the base might be shorthand for ‘brown (box colour) silt, 70% (LHS and top) and clay, 30% (top), moderately compact (RHS), containing frequent flecks of charcoal and occasional small fragments of tile (base)’.” Such a display tries to convey too much information and so the overview is lost. Instead, I suggest to use several displays concentrating on different aspects of the dataset.
- 6 -
Possibilities for Analysing Stratigraphic Data
Fig. 5: Thematic unit colours and border styles may be selected for any field in the data base.
Harris diagram layout and display
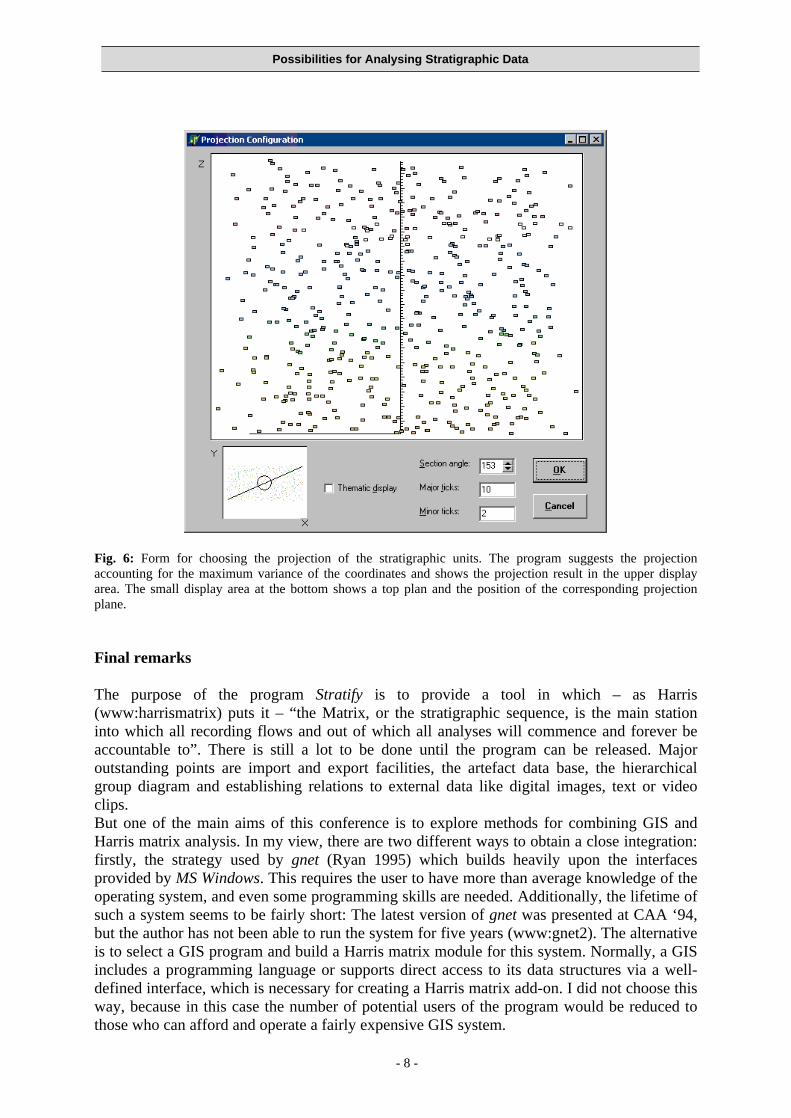
Currently I am experimenting with a layout technique which takes the spatial positions of the layers into account. The method is based on the center coordinates of the contexts, which may be calculated by a GIS and imported into the program. These context centers are projected onto a plane which corresponds to a section through the midpoint of the excavation (Fig. 6). The program suggests a section position which accounts for the maximum variance within the point coordinates (Ihm 1978, 464-465). This technique has some similarity with factor analysis and has been used previously to detect clusters. This projection reproduces the three-dimensional positions of the layers in an optimal way on a two-dimensional plane. Moreover, the user can change the angle of the section interactively, i.e. rotate the whole data set. Independent of the projection pursuit, this rotation facility may be used as an exploration tool, for example to find outliers or areas of missing data. The horizontal positions of the projected context centers determine the horizontal sequence of the corresponding Harris matrix boxes. In order to reduce white space in the diagram, strips with sparse distribution of contexts are compressed. Contrary to the straight line or polyline display used in some programs (www:gnet; www:Arched), extra space must be reserved for the vertical and horizontal connecting lines in a true Harris matrix diagram which represents a variant of orthogonal drawings as defined in graph theory (Di Battista et al. 1999, 12, 137). The picture may be stored as a bitmap file or exported in a vector format. If the Harris diagram is small or the group display is used, it is fairly easy to convert the final layout for publication on the Internet.
- 7 -
Possibilities for Analysing Stratigraphic Data
Fig. 6: Form for choosing the projection of the stratigraphic units. The program suggests the projection accounting for the maximum variance of the coordinates and shows the projection result in the upper display area. The small display area at the bottom shows a top plan and the position of the corresponding projection plane.
Final remarks
The purpose of the program Stratify is to provide a tool in which – as Harris (www:harrismatrix) puts it – “the Matrix, or the stratigraphic sequence, is the main station into which all recording flows and out of which all analyses will commence and forever be accountable to”. There is still a lot to be done until the program can be released. Major outstanding points are import and export facilities, the artefact data base, the hierarchical group diagram and establishing relations to external data like digital images, text or video clips. But one of the main aims of this conference is to explore methods for combining GIS and Harris matrix analysis. In my view, there are two different ways to obtain a close integration: firstly, the strategy used by gnet (Ryan 1995) which builds heavily upon the interfaces provided by MS Windows. This requires the user to have more than average knowledge of the operating system, and even some programming skills are needed. Additionally, the lifetime of such a system seems to be fairly short: The latest version of gnet was presented at CAA ‘94, but the author has not been able to run the system for five years (www:gnet2). The alternative is to select a GIS program and build a Harris matrix module for this system. Normally, a GIS includes a programming language or supports direct access to its data structures via a well-defined interface, which is necessary for creating a Harris matrix add-on. I did not choose this way, because in this case the number of potential users of the program would be reduced to those who can afford and operate a fairly expensive GIS system.
- 8 -
Possibilities for Analysing Stratigraphic Data
My solution is far from perfect. On the one hand, I propose the projection method which takes the context coordinates into account. On the other hand, the Harris diagram produced by my program can be imported into a GIS. Thereafter it is fairly easy to write a small program showing a map with those layers selected by the user in the matrix. But I am aware that this is not a fully integrated system: If two layers are to be merged, this has to be done twice, once within the Harris matrix program and then in the GIS system as well.
References:
Adams, M., 1992, Stratigraphy after Harris: Some Questions. In: K. Steane (ed.), Interpreting Stratigraphy: a Review of the Art. CLAU Arch. Report No. 31 (Lincoln 1993), 13-16.
Adams, M., 2000, The Optician´s Trick: an approach to recording excavation using an Iconic Formation Process Recognition System. In: S. Roskams (ed.), Interpreting Stratigraphy. Site evaluation, recording procedures and stratigraphic analysis. BAR Int. Ser. 910 (Oxford 2000), 91-101.
Ancona, M. / Gianuzzi, V. / Migliazzi, M., 1999, Computer Supported Cooperative Work in the field archaeology: the Ade system. In: Barceló, J. A. / Briz, I. / Vila, A. (eds.), New Techniques for Old Times, CAA 98. Computer Applications and Quantitative Methods in Archaeology. BAR Internat. Ser. 757 (Oxford 1999), 123-126.
Arched: www.mpi-sb.mpg.de/%7Earche/StartPage.html
Bibby, D., 1993, Building stratigraphic sequences on excavations: an example from Konstanz, Germany. In: E. Harris et al. (eds.) Practices of archaeological stratigraphy (London / San Diego 1993), 104-121.
Clark, P. R., 1993, Sites without Principles; post-excavation analysis of ‘pre-matrix’ sites. In: E. Harris et. al. (eds.) Practices of archaeological stratigraphy (London / San Diego 1993), 276-292.
Clark, P., 2000, Post-Excavation Analysis: moving from the context to the phase. In: St. Roskams (ed.), Interpreting Stratigraphy. Site evaluation, recording procedures and stratigraphic analysis. BAR Int. Ser. 910, 157-159.
Davies, B., 1992, Spot Dates as Qualitative Data? In: K. Steane (ed.), Interpreting Stratigraphy: a Review of the Art. CLAU Arch. Report No. 31 (Lincoln 1993), 30-39.
Davies, M., 1993, The application of the Harris Matrix to the recording of standing structures. In: E. Harris et. al. (eds.) Practices of archaeological stratigraphy (London / San Diego 1993), 167-180.
Di Battista, G. / Eades, P. /Tamassia, R. / Tollis, I. G., 1999, Graph Drawing. Algorithms for the Visualization of Graphs (Upper Saddle River 1999).
DIN 1463: Erstellung und Weiterentwicklung von Thesauri. Einsprachige Thesauri (Wien / Zürich 1987).
Eggert, M. K. H., 2001, Prähistorische Archäologie. Konzepte und Methoden (Stuttgart 2001).
Gerrard, R. H., 1993, Beyond crossmends: stratigraphic analysis and the content of historic artefact assemblages on urban sites. In: E. Harris et. al. (eds.) Practices of archaeological stratigraphy (London / San Diego 1993), 229-249.
gnet : www.cs.ukc.ac.uk/people/staff/nsr/arch/gnet/
gnet2: www.archaeologie-wien.at/pop45.htm
- 9 -
Possibilities for Analysing Stratigraphic Data
Ihm, P., 1978, Statistik in der Archäologie. Archaeophysica 9 (Bonn 1978).
Hammer, F., 2000a, The Structuring of Records: different systems in use from excavation through to publication. In: S. Roskams (ed.), Interpreting Stratigraphy. Site evaluation, recording procedures and stratigraphic analysis. BAR Int. Ser. 910 (Oxford 2000), 143-149.
Hammer, F., 2000b, From Field Record to Publication with a Minimum Archive Report. In: S. Roskams (ed.), Interpreting Stratigraphy. Site evaluation, recording procedures and stratigraphic analysis. BAR Int. Ser. 910 (Oxford 2000), 161-172.
Harris, E. C., 1975, The stratigraphic sequence: A question of time. World Archaeology 7 (1), 109-121.
Harris, E. C., 1977, Units of Archaeological Stratification. Norwegian Arch. Review 10 (1-2), 84-94.
Harris, E. C., 1984, The analysis of multilinear stratigraphic sequences. Scottish Arch. Review 3 (2), 127-133.
Harris, E., 1989, Principles of Archaeological Stratigraphy. 2nd ed. (London 1989).
harrismatrix: www.Harrismatrix.com/history.htm
Herzog, I. / Scollar, I., 1991, A new graph theoretic oriented program for Harris Matrix analysis. In: K. Lockyear / S. Rahtz (eds.), Computer Applications and Quantitative Methods in Archaeology 1990, BAR Internat. Ser. 565 (Oxford 1991), 53-59.
Herzog, I., 1993, Computer-aided Harris Matrix generation. In: E. Harris et. al. (eds.) Practices of archaeological stratigraphy (London / San Diego 1993), 201-217.
Herzog, I., 1995, Combining stratigraphic information and finds. In: J. Wilcock / K. Lockyear (eds.), Computer Applications and Quantitative Methods in Archaeology 1993, BAR Int. Ser. 598 (Oxford 1995), 109-114.
Jablonka, P., 2000, Computergestützte Rekonstruktion und Darstellung der Stratigraphie von Troia. Studia Troica 10, 99-122.
Lamprell, A. / Salisbury, A. / Chalmers, A. / Stoddart, S., 1996, An Integrated Information System for Archaeological Evidence. In: H. Kamermans / K. Fennema (eds.), Interfacing the Past. Computer Applications and Quantitative Methods in Archaeology CAA 95 Vol. I. Analecta Praehistorica Leidensia (Leiden 1996), 37-41.
Maggiolo-Schettini, A. / Seccacini, P. / Serratore, C. D. / Pierobon-Benoit, R. / Soricelli, G., 1995, SYSAND: a system for the archaeological excavations of Anderitum (Javols, Lozère, France). In: J. Huggett / N. Ryan (eds.), Computer Applications and Quantitative Methods in Archaeology 1994, BAR Int. Ser. 600 (Oxford 1995), 229-233.
Pearson, N. / Williams, T., 1993, Single-context planning: its role in on-site recording procedures and in post-excavation analysis at York. In: E. Harris et. al. (eds.) Practices of archaeological stratigraphy (London / San Diego 1993), 89-103.
Rauxloh, P., 2000, Stratigraphy, Residuality and a Relational Database. In: S. Roskams (ed.), Interpreting Stratigraphy. Site evaluation, recording procedures and stratigraphic analysis. BAR Int. Ser. 910 (Oxford 2000), 213-216.
Renfrew, C. / Bahn, P., 1996, Archaeology. Theories, Methods, and Practice. 2nd ed. (London 1996).
- 10 -
Possibilities for Analysing Stratigraphic Data
Roskams, S., 2001, Excavation. Cambridge Manuals in Archaeology (Cambridge 2001).
Ryan, N., 1995, The excavation archive as hyperdocument? In: J. Huggett / N. Ryan (eds.), Computer Applications and Quantitative Methods in Archaeology 1994, BAR Int. Ser. 600 (Oxford 1995), 211-220.
Spence, C., 1993, Recording the archaeology of London: the development and implementation of the DUA recording system. In: E. Harris et. al. (eds.) Practices of archaeological stratigraphy (London / San Diego 1993), 23-46.
Triggs, J. R., 1993. The seriation of multilinear stratigraphic sequences. In: E. Harris et. al. (eds.) Practices of archaeological stratigraphy (London / San Diego 1993), 250-273.
Stratigraf: www.proleg.com/products.asp
Watson, B., 2000, MAP 2 Nine Years On: a review of post-excavation procedures. In: St. Roskams (ed.), Interpreting Stratigraphy. Site evaluation, recording procedures and stratigraphic analysis. BAR Int. Ser. 910 (Oxford 2000), 151-155.
- 11 -