Embed Size (px)
DESCRIPTION
poster
Citation preview
Graphene-MnO2 nano-composite as sensor for structural health monitoring of
civil infra structures *
Abstract Materials and method
Results and discussion
Fabrication of sensors and characterization
Corrosion monitoring by embedded Sensor in concrete structures
Acknowledgement
The authors thank to ESC-0110 Project for financial support
*Corresponding author: [email protected]
Electrochemical sensors are involved in the corrosion and structural health monitoring (SHM) of
concrete structures. In this investigation, a novel attempt has been made to synthesis Graphene
modified MnO2 (GO-MnO2) nanoparticles by chemical method. Synthesized material was
characterized by following analytic techniques such as Fourier transform infrared spectroscopy (FTIR),
X-ray diffraction (XRD), Raman spectra and Scanning Electron Microscopy (SEM). The results are
clearly indicated that MnO2 nanorods are monodispersed on Graphene surface. Graphene modified
MnO2 nanocomposites sensors are fabricated and embedded in concrete structures for corrosion
monitoring of reinforced steel. The suitability of the assembled sensor was evaluated by
electrochemical tests such as potential stability, sensing ability, reversibility and impedance
spectroscopy. GO-MnO2 showed perfect stability for the exposure period upto 30 days. The sensor
was embedded in concrete and the studies are under progress.
Fig shows the XRD pattern of MnO2 and GO-MnO2 were obtained by simple
chemical method. These diffraction peaks of synthesized MnO2 and GO-MnO2
were similar to tetragonal crystal phase of MnO2 (JCPDS; 65-2821) and
moreover high intensity peaks of GO at around 2θ= 11.2 and 27,2 corresponds
to the (001) and (002).
Raman spectra of MnO2 and GO-MnO2 are shown in Figure.
From the relative intensities of the D and G band peaks at
1350 and 1590 cm− 1, it can be concluded that the size of the
sp2 domains increases during reduction of GO. Moreover, the
similar MnO2 peak at 621.41 cm− 1was observed both samples.
a)
b)
2 4 6 8 10 12 14keV
0
1
2
3
4
5
6
7
cps/eV
Mn Mn O
C
2 4 6 8 10 12 14keV
0
1
2
3
4
5
6
7
8 cps/eV
Mn Mn O
C
MnO2)
GO-MnO2)
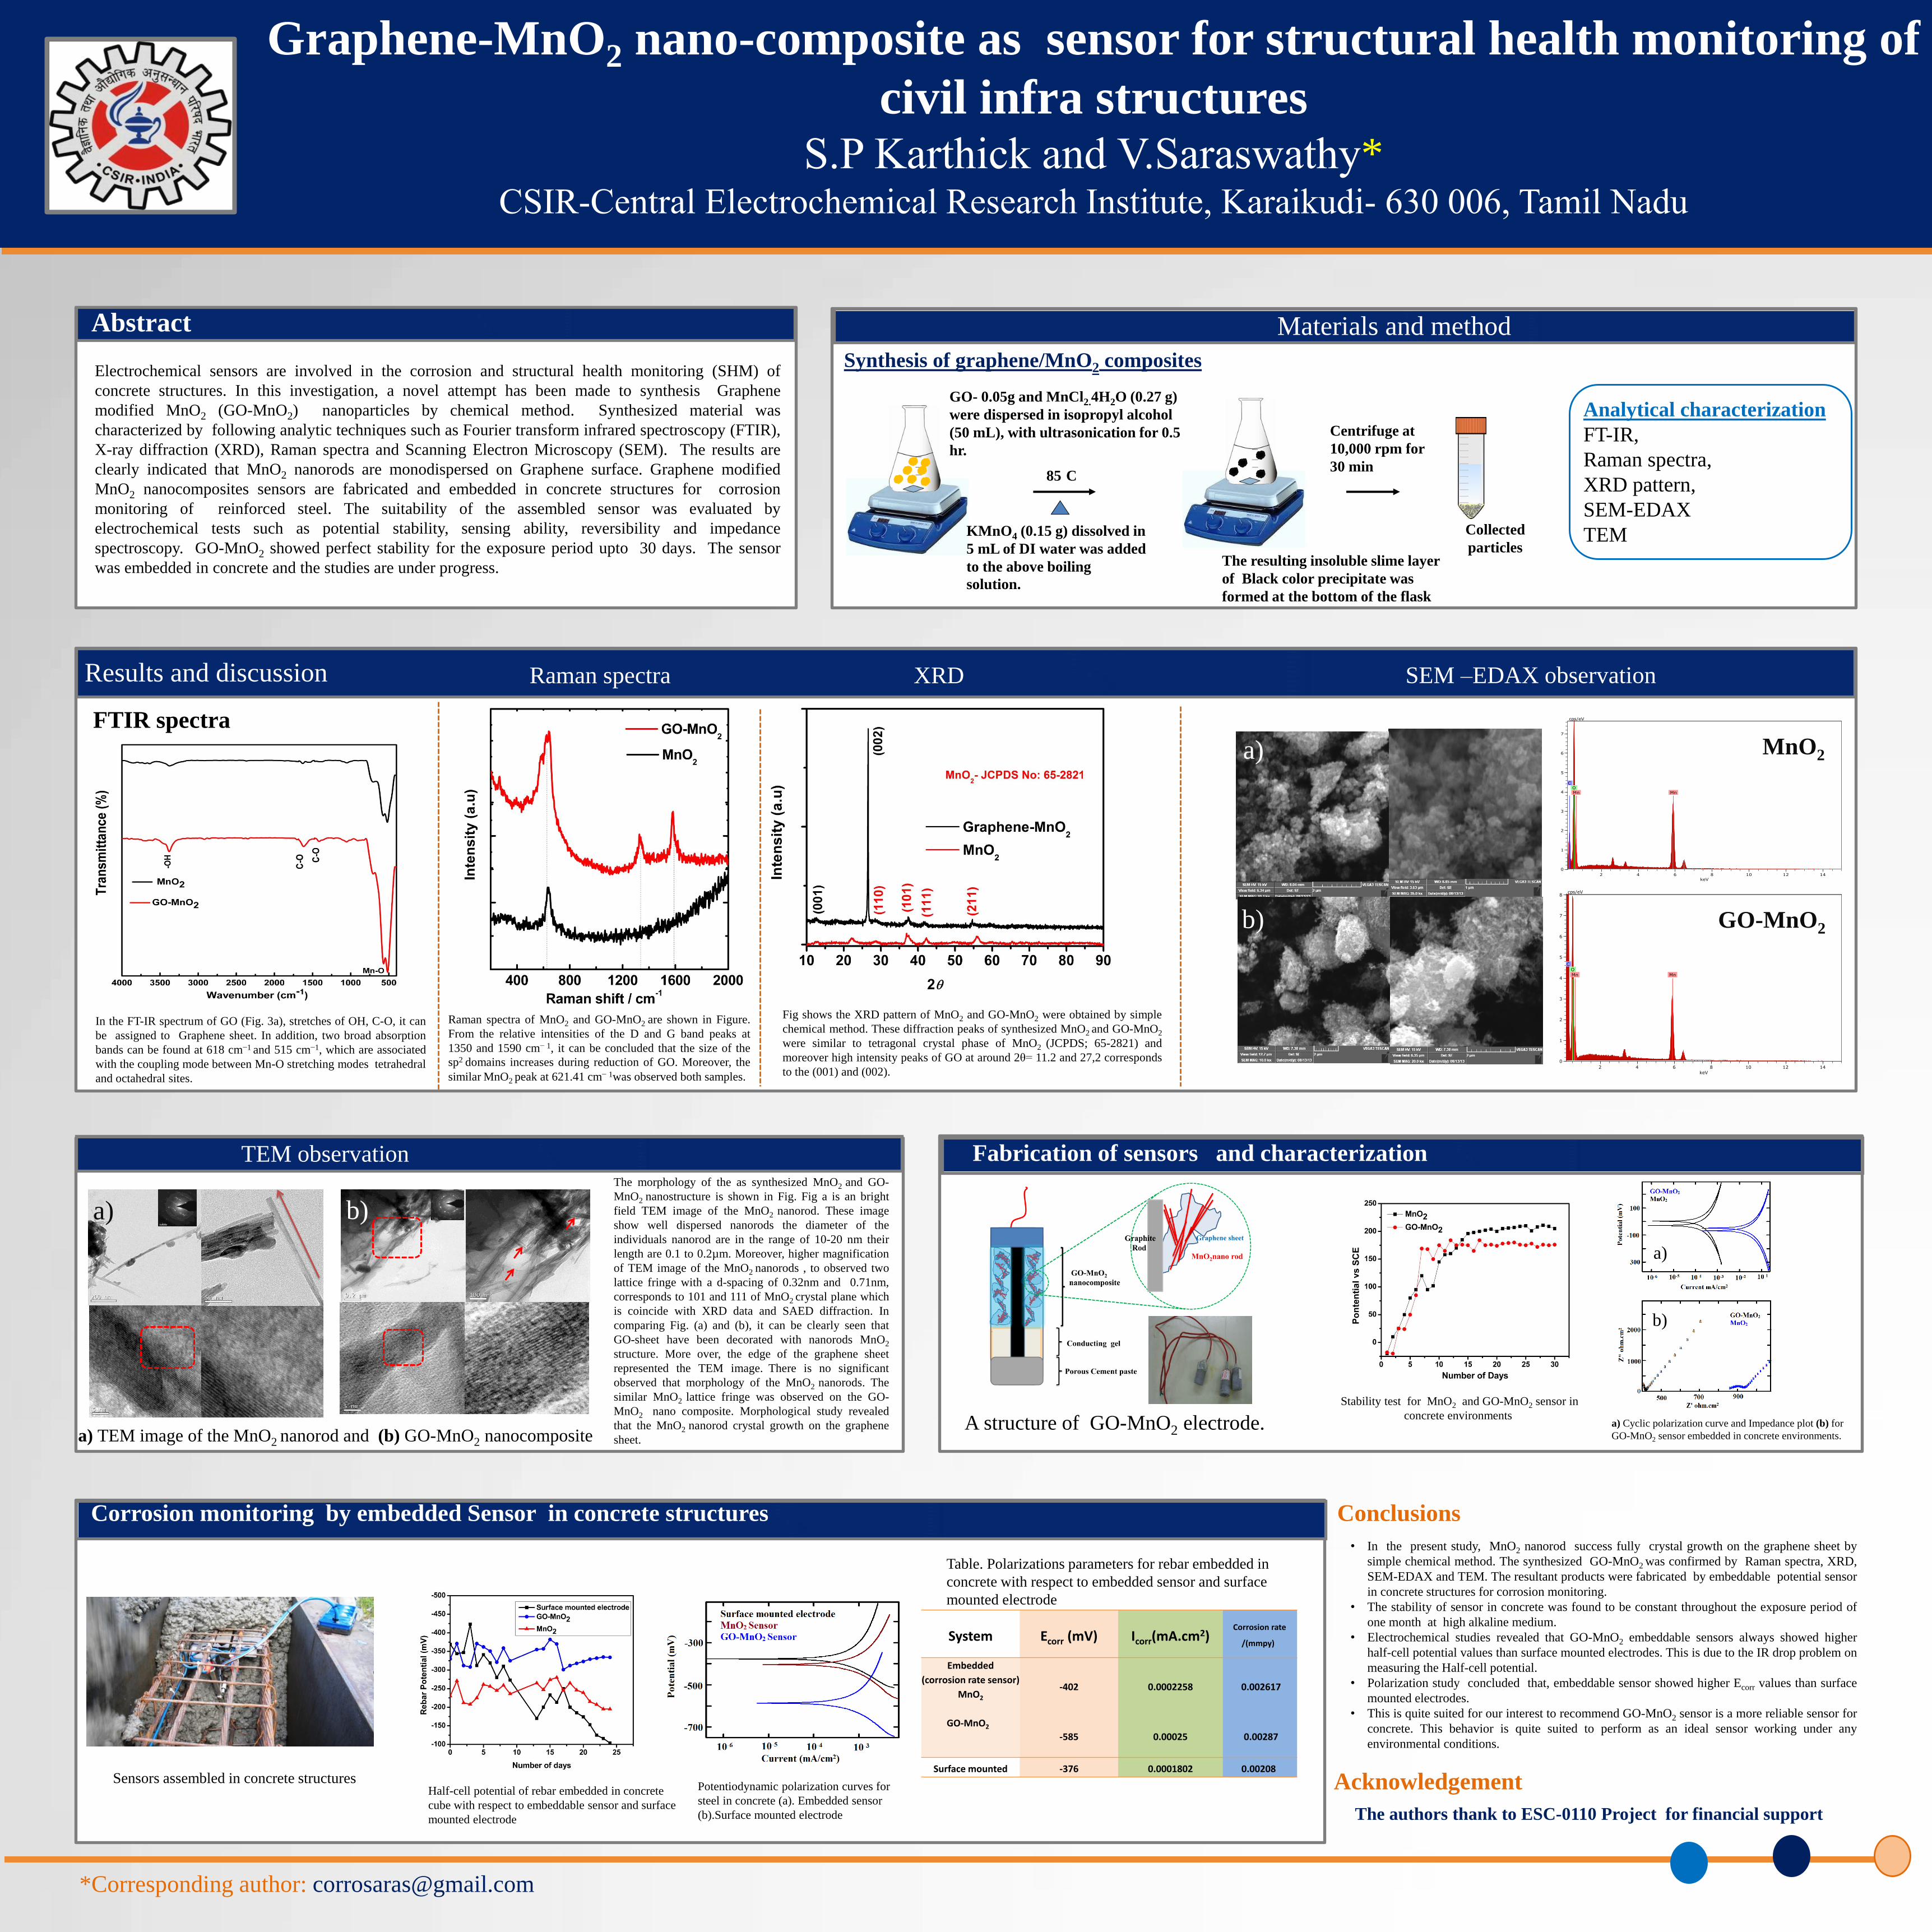
The morphology of the as synthesized MnO2 and GO-
MnO2 nanostructure is shown in Fig. Fig a is an bright
field TEM image of the MnO2 nanorod. These image
show well dispersed nanorods the diameter of the
individuals nanorod are in the range of 10-20 nm their
length are 0.1 to 0.2µm. Moreover, higher magnification
of TEM image of the MnO2 nanorods , to observed two
lattice fringe with a d-spacing of 0.32nm and 0.71nm,
corresponds to 101 and 111 of MnO2 crystal plane which
is coincide with XRD data and SAED diffraction. In
comparing Fig. (a) and (b), it can be clearly seen that
GO-sheet have been decorated with nanorods MnO2
structure. More over, the edge of the graphene sheet
represented the TEM image. There is no significant
observed that morphology of the MnO2 nanorods. The
similar MnO2 lattice fringe was observed on the GO-
MnO2 nano composite. Morphological study revealed
that the MnO2 nanorod crystal growth on the graphene
sheet. a) TEM image of the MnO2 nanorod and (b) GO-MnO2 nanocomposite
b) a)
TEM observation
FTIR spectra
Raman spectra XRD SEM –EDAX observation
A structure of GO-MnO2 electrode.
Sensors assembled in concrete structures
Analytical characterization
FT-IR,
Raman spectra,
XRD pattern,
SEM-EDAX
TEM KMnO4 (0.15 g) dissolved in
5 mL of DI water was added
to the above boiling
solution.
Synthesis of graphene/MnO2 composites
GO- 0.05g and MnCl2.4H2O (0.27 g)
were dispersed in isopropyl alcohol
(50 mL), with ultrasonication for 0.5
hr.
85
C
The resulting insoluble slime layer
of Black color precipitate was
formed at the bottom of the flask
Centrifuge at
10,000 rpm for
30 min
Collected
particles
Stability test for MnO2 and GO-MnO2 sensor in
concrete environments a) Cyclic polarization curve and Impedance plot (b) for
GO-MnO2 sensor embedded in concrete environments.
a)
b)
Half-cell potential of rebar embedded in concrete
cube with respect to embeddable sensor and surface
mounted electrode
Potentiodynamic polarization curves for
steel in concrete (a). Embedded sensor
(b).Surface mounted electrode
System Ecorr (mV) Icorr(mA.cm2) Corrosion rate
/(mmpy)
Embedded
(corrosion rate sensor)
MnO2
GO-MnO2
-402 0.0002258 0.002617
-585 0.00025 0.00287
Surface mounted -376 0.0001802 0.00208
Table. Polarizations parameters for rebar embedded in
concrete with respect to embedded sensor and surface
mounted electrode
In the FT-IR spectrum of GO (Fig. 3a), stretches of OH, C-O, it can
be assigned to Graphene sheet. In addition, two broad absorption
bands can be found at 618 cm−1 and 515 cm−1, which are associated
with the coupling mode between Mn-O stretching modes tetrahedral
and octahedral sites.
Conclusions
• In the present study, MnO2 nanorod success fully crystal growth on the graphene sheet by
simple chemical method. The synthesized GO-MnO2 was confirmed by Raman spectra, XRD,
SEM-EDAX and TEM. The resultant products were fabricated by embeddable potential sensor
in concrete structures for corrosion monitoring.
• The stability of sensor in concrete was found to be constant throughout the exposure period of
one month at high alkaline medium.
• Electrochemical studies revealed that GO-MnO2 embeddable sensors always showed higher
half-cell potential values than surface mounted electrodes. This is due to the IR drop problem on
measuring the Half-cell potential.
• Polarization study concluded that, embeddable sensor showed higher Ecorr values than surface
mounted electrodes.
• This is quite suited for our interest to recommend GO-MnO2 sensor is a more reliable sensor for
concrete. This behavior is quite suited to perform as an ideal sensor working under any
environmental conditions.