Embed Size (px)
Citation preview

ROOM DOCUMENT 14
STATISTICS DIRECTORATE
POTENTIAL OFFSHORING: EVIDENCE FROM SELECTED OECD COUNTRIES
6th OECD INTERNATIONAL TRADE STATISTICS EXPERT MEETING (ITS) &
OECD-EUROSTAT MEETING OF EXPERTS IN TRADE-IN-SERVICES STATISTICS (TIS)
Tour Europe, Salle des Nations, 12-15 September 2005
This document has been prepared by Desirée van Welsum and Xavier Reif OECD/DSTI, for information and discussion under item 17i)b Measuring offshoring
For further information, please contact: [email protected]
The Brookings Institution
Potential Offshoring: Evidence from Selected OECD Countries*
Desirée van Welsum and Xavier Reif
OECD DSTI-ICCP
July 2005
Forthcoming in Lael Brainard and Susan M. Collins (editors):
Offshoring White-Collar Work—The Issues and Implications, The Brookings Trade Forum, 2005.
* The opinions expressed and arguments employed in this paper do not necessarily reflect the official views of the Organisation or of the governments of its member countries. This paper draws on a larger body of work and a longer paper entitled “The share of employment potentially affected by offshoring – An empirical investigation” which will be published by the OECD.
2
Introduction
Rapid advances in Information and Communication Technologies (ICTs), combined with continuing efforts to liberalise international trade and investment in services, have increased the tradability of services and created new types of tradable services. This, in turn, has led to a new wave of globalisation in the services sector, with the offshoring of particular types of services activities now becoming increasingly common, as it has been for many years in manufacturing. New technological developments now allow many service activities to be carried out independently of their geographical location, and their production and delivery do no longer have to take place in the same location. As a result, many white collar jobs that were shielded from international competition now face competition from abroad.
Despite the widespread media attention given to the apparent offshoring of service sector jobs, little is known about the extent of this phenomenon, or the extent to which it is related to other economic and structural developments. This paper draws upon and extends a previous detailed analysis of occupational data for selected OECD countries that sought to determine the share of total employment that could potentially be affected by the international sourcing of IT and ICT-enabled services (van Welsum and Vickery, 2005a). Including both the low and the high skill white collar occupations potentially affected by global services sourcing, that analysis suggested that close to 20 per cent of total employment could potentially be affected by offshoring. The work also found that sectors such as business services (e.g. accounting, consulting), financial services and research and development have a relatively high share of such employment. It is important to keep in mind that “potentially affected by offshoring” refers to activities that could be coming into a country as well as those leaving a country. Incoming offshored services activities would bring about an increase in the share of employment potentially affected by offshoring, whereas services activities that leave the country would bring about a relative decline in the share.
The present paper takes this analysis one step further by examining the relationship between the share of employment potentially affected by offshoring and other economic and structural developments, using some simple descriptive regressions on a panel of OECD economies between 1996 and 2003. In particular, first estimates are provided of the statistical association between the share of employment potentially affected by service sector offshoring, trade in business services and foreign direct investment. Contrary to popular belief, the analysis in this paper does not find any systematic evidence that net outward investment or imports of business services are associated with significant declines in the share of employment potentially affected by offshoring, at least at the aggregate level. Exports of business services are found to have a positive statistical association with the share of employment potentially affected by offshoring, suggesting that increases in demand and production have also raised demand for these types of ICT-using occupations. Other key factors positively associated with the share of employment potentially affected by offshoring are found to be the comparative size of the service sector, the growing share of ICT investment in total fixed investment, and human capital.
Although there are no direct official data measuring the extent of offshoring, it is commonly believed that it has the potential to grow substantially even if it is still a relatively small phenomenon at present. This paper aims to contribute to the debate surrounding offshoring by looking in detail at some of the trade in services and employment data that may reveal further insights about its current extent, as well as by performing a simple descriptive econometric analysis of the factors statistically associated with movements in the aggregate share of employment that could potentially be affected by offshoring.
The paper is organised as follows. The next section looks at what can be learnt about offshoring on the basis of data on trade in services and occupational employment data, respectively. The subsequent section sets out the simple descriptive empirical model employed to examine what factors are associated
3
with the share of employment potentially affected by offshoring and gives some initial results. The final section offers concluding remarks.
1. The extent of potential offshoring
Offshoring includes both international outsourcing (where activities are contracted out to independent third parties abroad) and international insourcing (to foreign affiliates). The cross-border aspect is the distinguishing feature of offshoring, i.e. whether services are sourced within the domestic economy or abroad – not whether they are sourced from within the same company or from external suppliers (outsourcing). Offshoring is often confused with outsourcing, but only a part of offshoring is made up by outsourcing. Offshoring is also often interpreted as referring to the purchase of intermediate services, even though the distinction between final and intermediate services is a difficult one to make in some cases, and may not be very meaningful in the case of certain types of services.
To date there are no official data measuring the extent of offshoring so it is necessary to use indirect measures such as data on trade in services, employment data, input-output tables, and trade in intermediates. Evidence from company surveys can also be a useful complement (see for example Marin, 2004). However, while the offshoring of services activities should result in a flow of trade in services, not all trade in services is related to offshoring and it is not possible to distinguish which part of it is. Similar problems apply to the analysis of Foreign Direct Investment (FDI) as it is not possible to determine what share of FDI is directly related to offshoring. There are also no official and internationally comparable data on changes in employment resulting from the offshoring of services activities. This paper will use both trade and employment data to examine what is known about the extent of services offshoring and what can be said about its potential.
Trade data
Trade in services provides one possible proxy for measuring ICT-enabled services offshoring. As offshoring of activities takes place between residents of different countries, some of it should result in a flow of trade in services, exports from the country receiving the offshored activities and imports for the country from which the offshoring originates. OECD (2004a) and van Welsum and Vickery (2005a) examine exports of services, while Schultze (2004) and van Welsum (2004) analyse offshoring and imports of services. It is important to bear in mind though that not all trade in services is related to offshoring, and it is not possible to identify the share of trade in services that is directly related to offshoring.
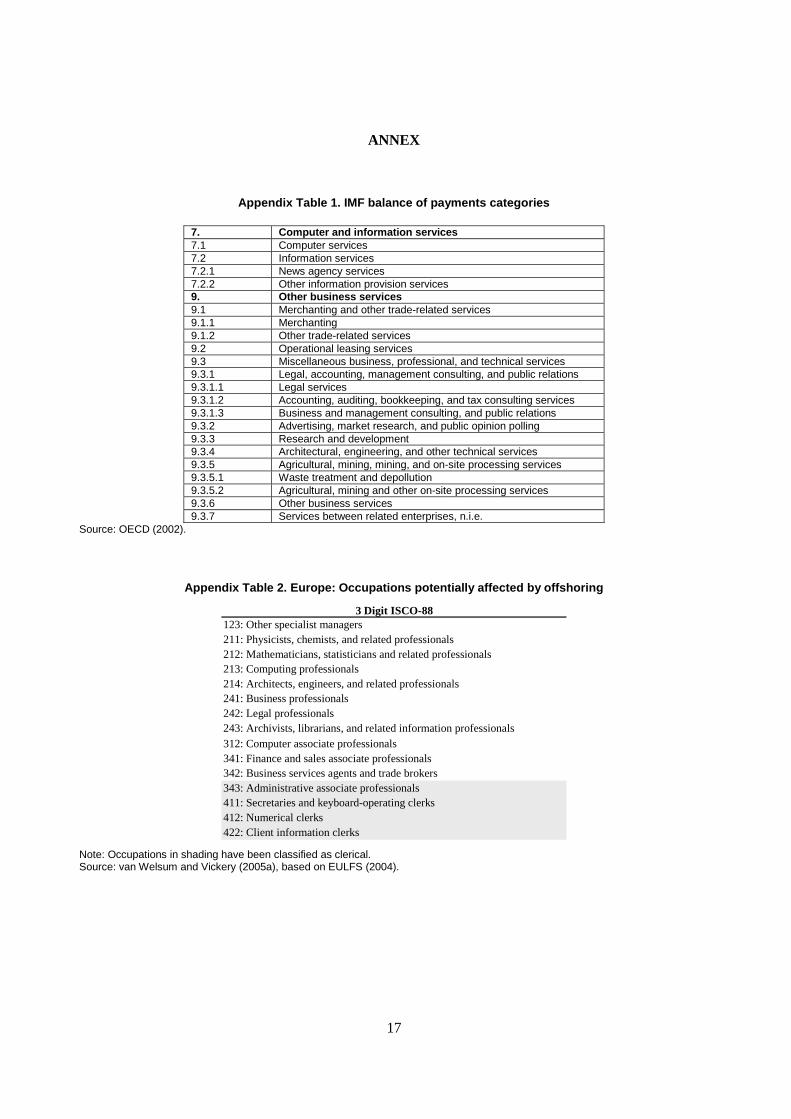
The extent of international trade in IT and ICT-enabled business process services in international statistics is approximated by summing the IMF Balance of Payments categories “computer and information services” and “other business services” (see Appendix Table 1 for details on which services are included in these categories). These data contain information on international outsourcing and international insourcing combined, but it is not possible to identify the proportion of this trade that results directly from offshoring. Data on computer and information services are not available for all countries. For some, such as India, they are included under “other business services”, along with other services.1 The “other business services” category may have variable shares of IT and ICT-enabled services in different countries. Moreover, the data are reported in current USD and will be affected by currency movements.
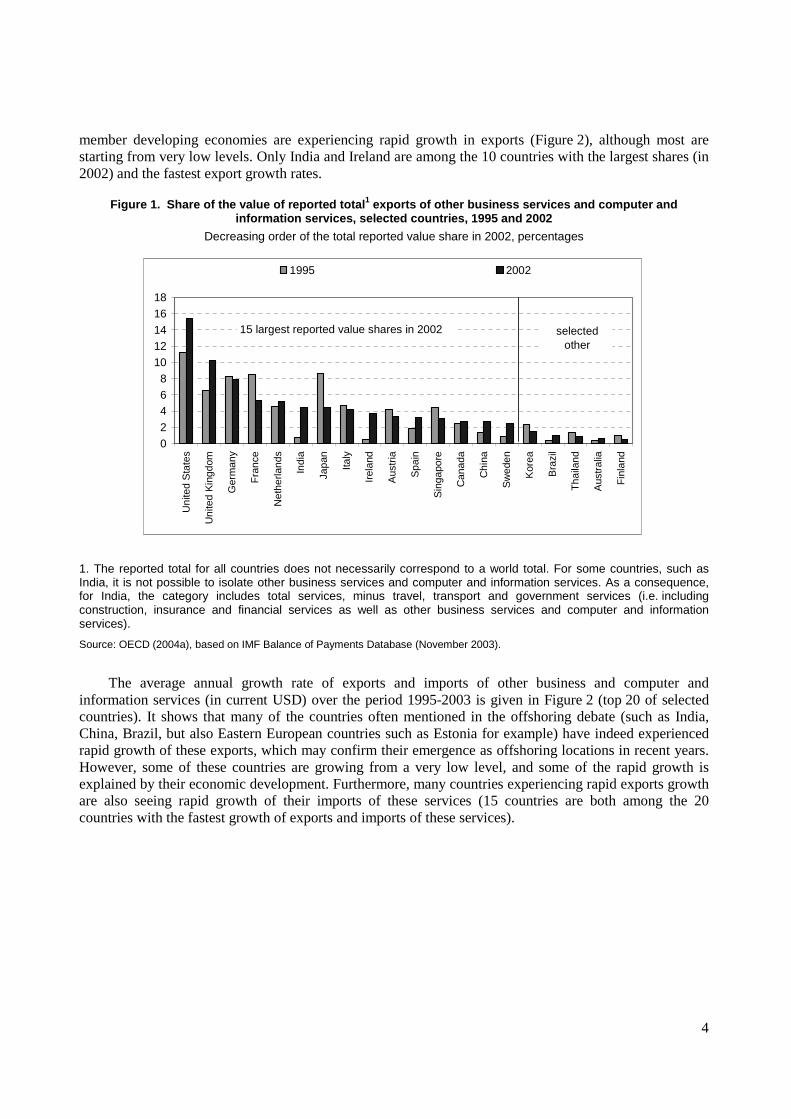
Most exports of other business services and computer and information services still originate in OECD countries although their share declined by 2.4 percentage points between 1995 and 20022 (from 79.5% of total reported value in 1995 to 77.1% in 2002).3 The 15 countries that accounted for the largest value shares in 2002, as well as some selected other economies, are shown in Figure 1. OECD countries have the top five shares of these services exports with India in sixth position. Nevertheless, some non-
4
member developing economies are experiencing rapid growth in exports (Figure 2), although most are starting from very low levels. Only India and Ireland are among the 10 countries with the largest shares (in 2002) and the fastest export growth rates.
Figure 1. Share of the value of reported total1 exports of other business services and computer and information services, selected countries, 1995 and 2002
Decreasing order of the total reported value share in 2002, percentages
0
2
46
8
10
1214
16
18
Uni
ted
Sta
tes
Uni
ted
Kin
gdom
Ger
man
y
Fra
nce
Net
herla
nds
Indi
a
Japa
n
Italy
Irel
and
Aus
tria
Spa
in
Sin
gapo
re
Can
ada
Chi
na
Sw
eden
Kor
ea
Bra
zil
Tha
iland
Aus
tral
ia
Fin
land
1995 2002
15 largest reported value shares in 2002 selected other
1. The reported total for all countries does not necessarily correspond to a world total. For some countries, such as India, it is not possible to isolate other business services and computer and information services. As a consequence, for India, the category includes total services, minus travel, transport and government services (i.e. including construction, insurance and financial services as well as other business services and computer and information services).
Source: OECD (2004a), based on IMF Balance of Payments Database (November 2003).
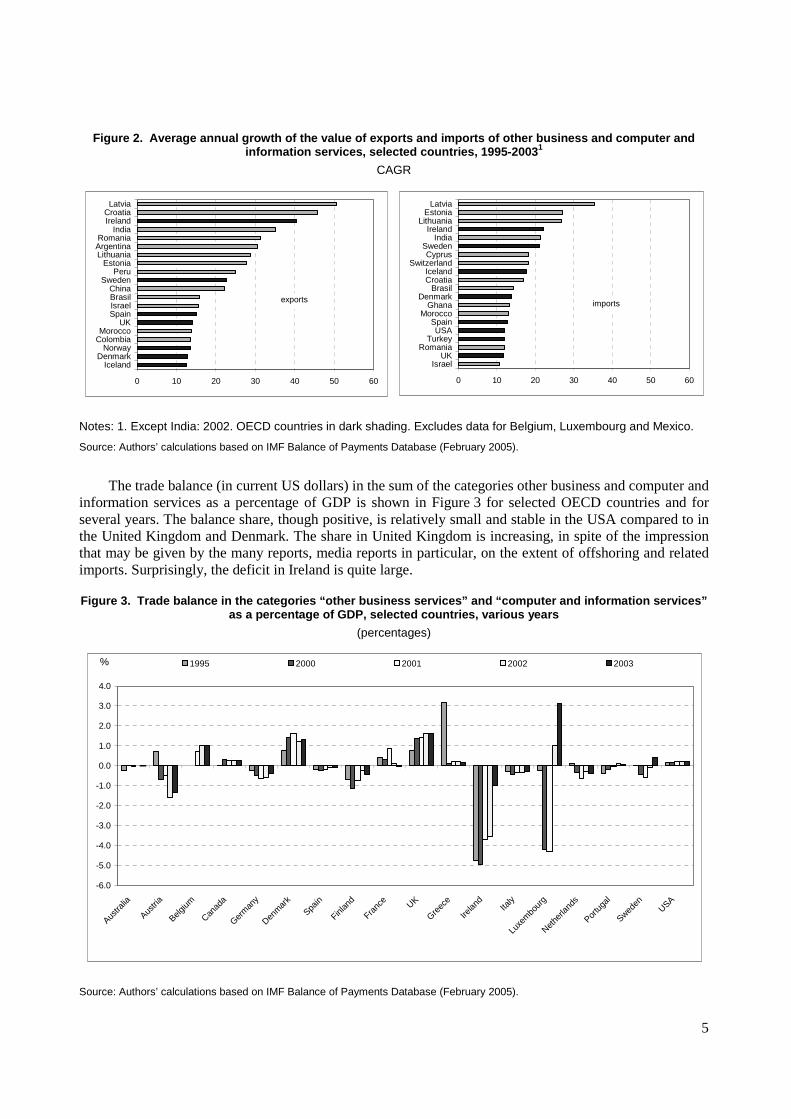
The average annual growth rate of exports and imports of other business and computer and information services (in current USD) over the period 1995-2003 is given in Figure 2 (top 20 of selected countries). It shows that many of the countries often mentioned in the offshoring debate (such as India, China, Brazil, but also Eastern European countries such as Estonia for example) have indeed experienced rapid growth of these exports, which may confirm their emergence as offshoring locations in recent years. However, some of these countries are growing from a very low level, and some of the rapid growth is explained by their economic development. Furthermore, many countries experiencing rapid exports growth are also seeing rapid growth of their imports of these services (15 countries are both among the 20 countries with the fastest growth of exports and imports of these services).
5
Figure 2. Average annual growth of the value of exports and imports of other business and computer and information services, selected countries, 1995-20031
CAGR
0 10 20 30 40 50 60
IsraelUK
RomaniaTurkey
USASpain
MoroccoGhana
DenmarkBrasil
CroatiaIceland
SwitzerlandCyprus
SwedenIndia
IrelandLithuania
EstoniaLatvia
imports
0 10 20 30 40 50 60
IcelandDenmark
NorwayColombiaMorocco
UKSpainIsraelBrasilChina
SwedenPeru
EstoniaLithuaniaArgentinaRomania
IndiaIrelandCroatia
Latvia
exports
Notes: 1. Except India: 2002. OECD countries in dark shading. Excludes data for Belgium, Luxembourg and Mexico.
Source: Authors’ calculations based on IMF Balance of Payments Database (February 2005).
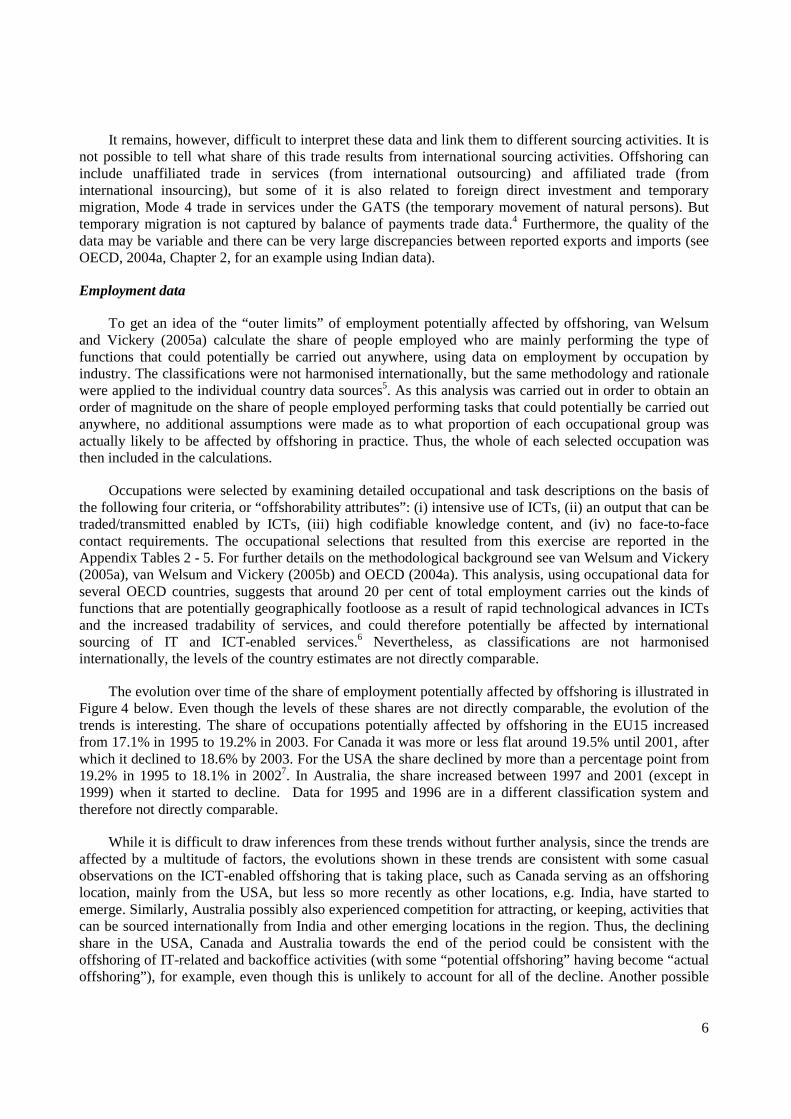
The trade balance (in current US dollars) in the sum of the categories other business and computer and information services as a percentage of GDP is shown in Figure 3 for selected OECD countries and for several years. The balance share, though positive, is relatively small and stable in the USA compared to in the United Kingdom and Denmark. The share in United Kingdom is increasing, in spite of the impression that may be given by the many reports, media reports in particular, on the extent of offshoring and related imports. Surprisingly, the deficit in Ireland is quite large.
Figure 3. Trade balance in the categories “other business services” and “computer and information services” as a percentage of GDP, selected countries, various years
(percentages)
-6.0
-5.0
-4.0
-3.0
-2.0
-1.0
0.0
1.0
2.0
3.0
4.0
Austra
lia
Austri
a
Belgium
Canad
a
Germ
any
Denm
ark
Spain
Finlan
d
Franc
eUK
Greec
e
Irelan
dIta
ly
Luxe
mbo
urg
Nethe
rland
s
Portu
gal
Sweden
USA
1995 2000 2001 2002 2003%
Source: Authors’ calculations based on IMF Balance of Payments Database (February 2005).
6
It remains, however, difficult to interpret these data and link them to different sourcing activities. It is not possible to tell what share of this trade results from international sourcing activities. Offshoring can include unaffiliated trade in services (from international outsourcing) and affiliated trade (from international insourcing), but some of it is also related to foreign direct investment and temporary migration, Mode 4 trade in services under the GATS (the temporary movement of natural persons). But temporary migration is not captured by balance of payments trade data.4 Furthermore, the quality of the data may be variable and there can be very large discrepancies between reported exports and imports (see OECD, 2004a, Chapter 2, for an example using Indian data).
Employment data
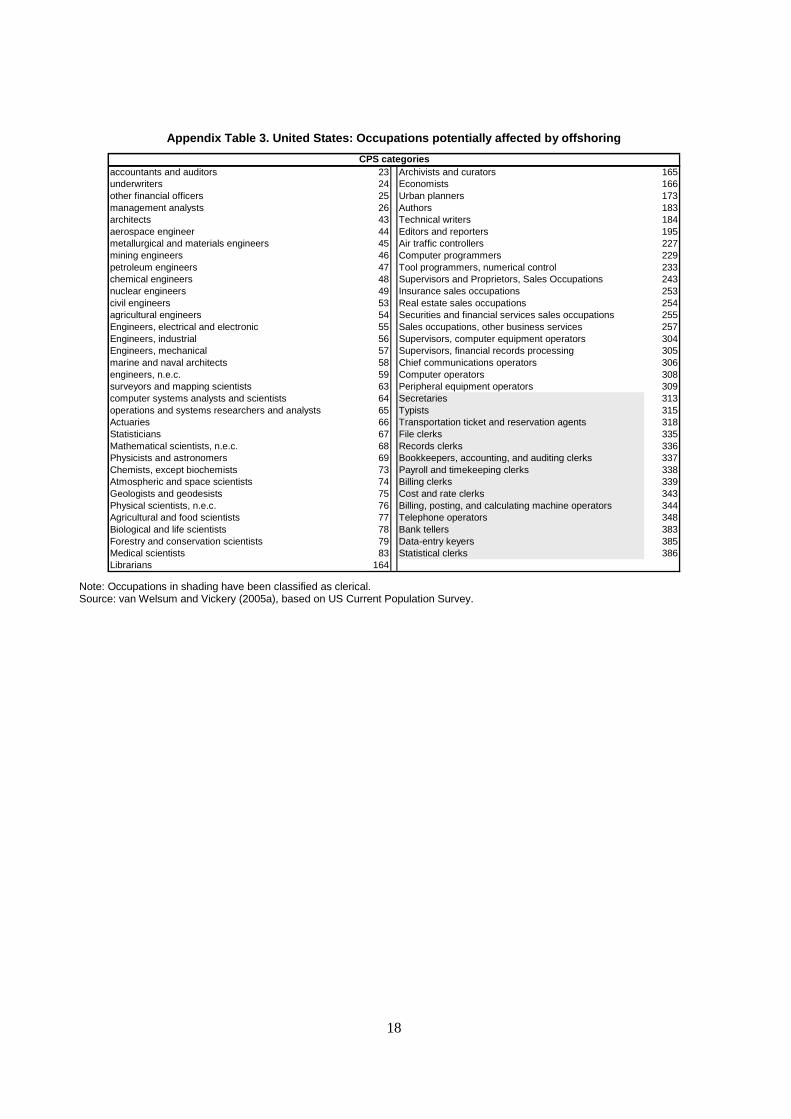
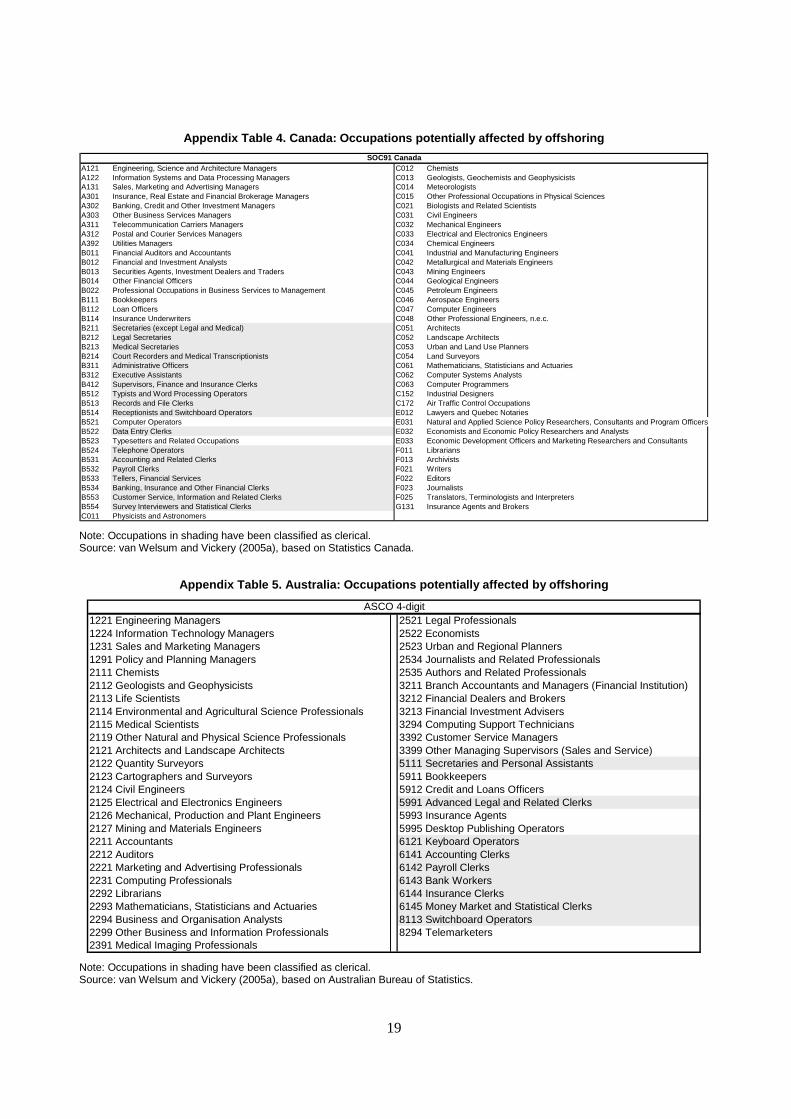
To get an idea of the “outer limits” of employment potentially affected by offshoring, van Welsum and Vickery (2005a) calculate the share of people employed who are mainly performing the type of functions that could potentially be carried out anywhere, using data on employment by occupation by industry. The classifications were not harmonised internationally, but the same methodology and rationale were applied to the individual country data sources5. As this analysis was carried out in order to obtain an order of magnitude on the share of people employed performing tasks that could potentially be carried out anywhere, no additional assumptions were made as to what proportion of each occupational group was actually likely to be affected by offshoring in practice. Thus, the whole of each selected occupation was then included in the calculations.
Occupations were selected by examining detailed occupational and task descriptions on the basis of the following four criteria, or “offshorability attributes”: (i) intensive use of ICTs, (ii) an output that can be traded/transmitted enabled by ICTs, (iii) high codifiable knowledge content, and (iv) no face-to-face contact requirements. The occupational selections that resulted from this exercise are reported in the Appendix Tables 2 - 5. For further details on the methodological background see van Welsum and Vickery (2005a), van Welsum and Vickery (2005b) and OECD (2004a). This analysis, using occupational data for several OECD countries, suggests that around 20 per cent of total employment carries out the kinds of functions that are potentially geographically footloose as a result of rapid technological advances in ICTs and the increased tradability of services, and could therefore potentially be affected by international sourcing of IT and ICT-enabled services.6 Nevertheless, as classifications are not harmonised internationally, the levels of the country estimates are not directly comparable.
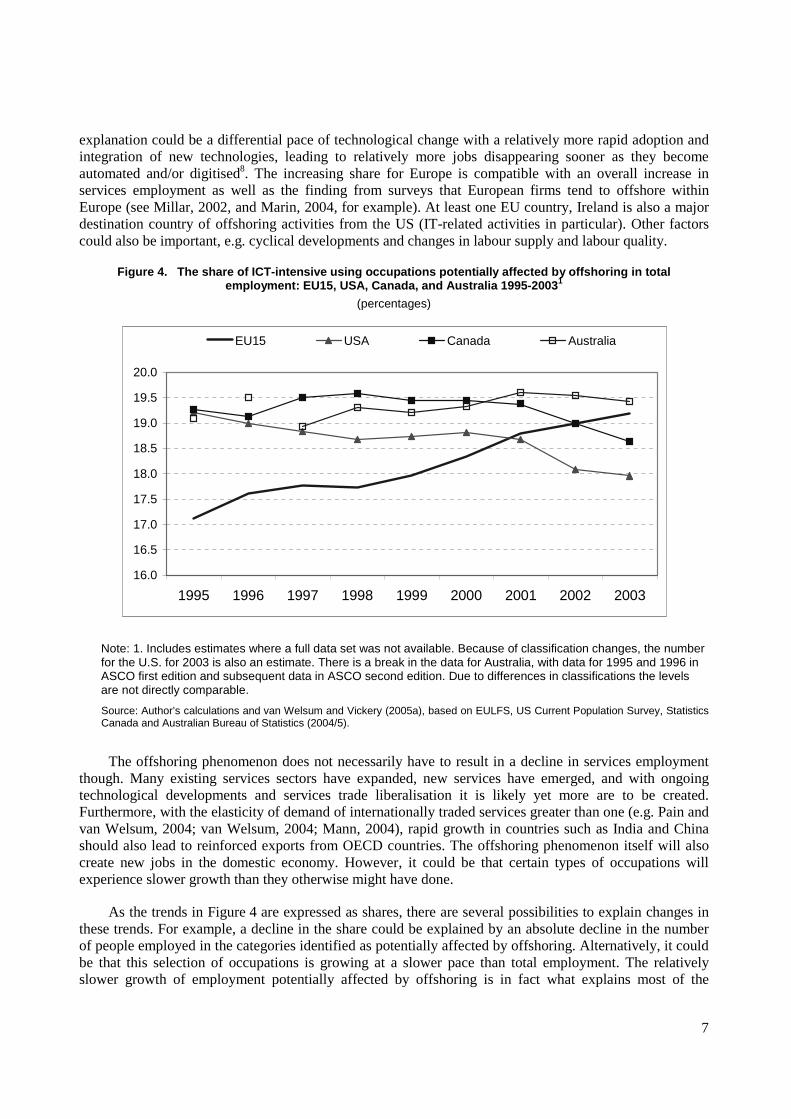
The evolution over time of the share of employment potentially affected by offshoring is illustrated in Figure 4 below. Even though the levels of these shares are not directly comparable, the evolution of the trends is interesting. The share of occupations potentially affected by offshoring in the EU15 increased from 17.1% in 1995 to 19.2% in 2003. For Canada it was more or less flat around 19.5% until 2001, after which it declined to 18.6% by 2003. For the USA the share declined by more than a percentage point from 19.2% in 1995 to 18.1% in 20027. In Australia, the share increased between 1997 and 2001 (except in 1999) when it started to decline. Data for 1995 and 1996 are in a different classification system and therefore not directly comparable.
While it is difficult to draw inferences from these trends without further analysis, since the trends are affected by a multitude of factors, the evolutions shown in these trends are consistent with some casual observations on the ICT-enabled offshoring that is taking place, such as Canada serving as an offshoring location, mainly from the USA, but less so more recently as other locations, e.g. India, have started to emerge. Similarly, Australia possibly also experienced competition for attracting, or keeping, activities that can be sourced internationally from India and other emerging locations in the region. Thus, the declining share in the USA, Canada and Australia towards the end of the period could be consistent with the offshoring of IT-related and backoffice activities (with some “potential offshoring” having become “actual offshoring”), for example, even though this is unlikely to account for all of the decline. Another possible
7
explanation could be a differential pace of technological change with a relatively more rapid adoption and integration of new technologies, leading to relatively more jobs disappearing sooner as they become automated and/or digitised8. The increasing share for Europe is compatible with an overall increase in services employment as well as the finding from surveys that European firms tend to offshore within Europe (see Millar, 2002, and Marin, 2004, for example). At least one EU country, Ireland is also a major destination country of offshoring activities from the US (IT-related activities in particular). Other factors could also be important, e.g. cyclical developments and changes in labour supply and labour quality.
Figure 4. The share of ICT-intensive using occupations potentially affected by offshoring in total employment: EU15, USA, Canada, and Australia 1995-20031
(percentages)
16.0
16.5
17.0
17.5
18.0
18.5
19.0
19.5
20.0
1995 1996 1997 1998 1999 2000 2001 2002 2003
EU15 USA Canada Australia
Note: 1. Includes estimates where a full data set was not available. Because of classification changes, the number for the U.S. for 2003 is also an estimate. There is a break in the data for Australia, with data for 1995 and 1996 in ASCO first edition and subsequent data in ASCO second edition. Due to differences in classifications the levels are not directly comparable.
Source: Author’s calculations and van Welsum and Vickery (2005a), based on EULFS, US Current Population Survey, Statistics Canada and Australian Bureau of Statistics (2004/5).
The offshoring phenomenon does not necessarily have to result in a decline in services employment though. Many existing services sectors have expanded, new services have emerged, and with ongoing technological developments and services trade liberalisation it is likely yet more are to be created. Furthermore, with the elasticity of demand of internationally traded services greater than one (e.g. Pain and van Welsum, 2004; van Welsum, 2004; Mann, 2004), rapid growth in countries such as India and China should also lead to reinforced exports from OECD countries. The offshoring phenomenon itself will also create new jobs in the domestic economy. However, it could be that certain types of occupations will experience slower growth than they otherwise might have done.
As the trends in Figure 4 are expressed as shares, there are several possibilities to explain changes in these trends. For example, a decline in the share could be explained by an absolute decline in the number of people employed in the categories identified as potentially affected by offshoring. Alternatively, it could be that this selection of occupations is growing at a slower pace than total employment. The relatively slower growth of employment potentially affected by offshoring is in fact what explains most of the
8
declines observed in the trends, except for the US where the absolute number of people employed in the categories identified as potentially affected by offshoring has declined (further details below). These observations would therefore tend to support the idea that offshoring may lead to slower growth of employment in occupations potentially affected by offshoring and not necessarily to actual declines in employment.
Underlying trends
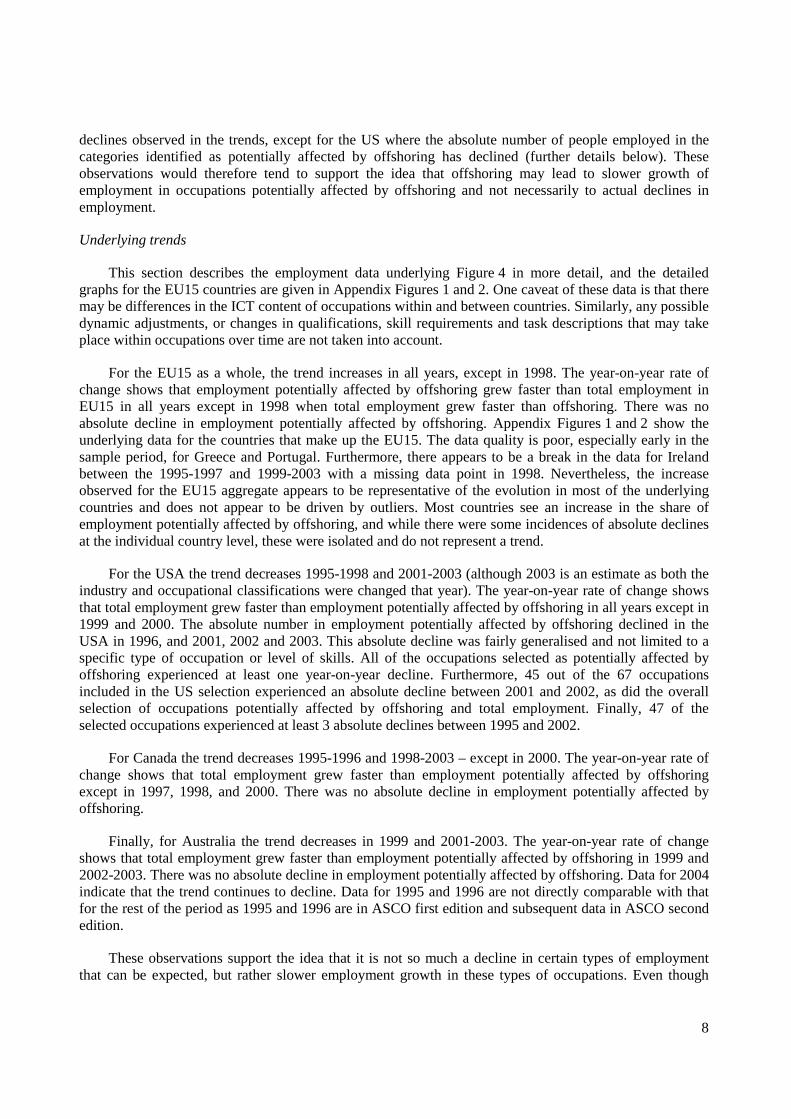
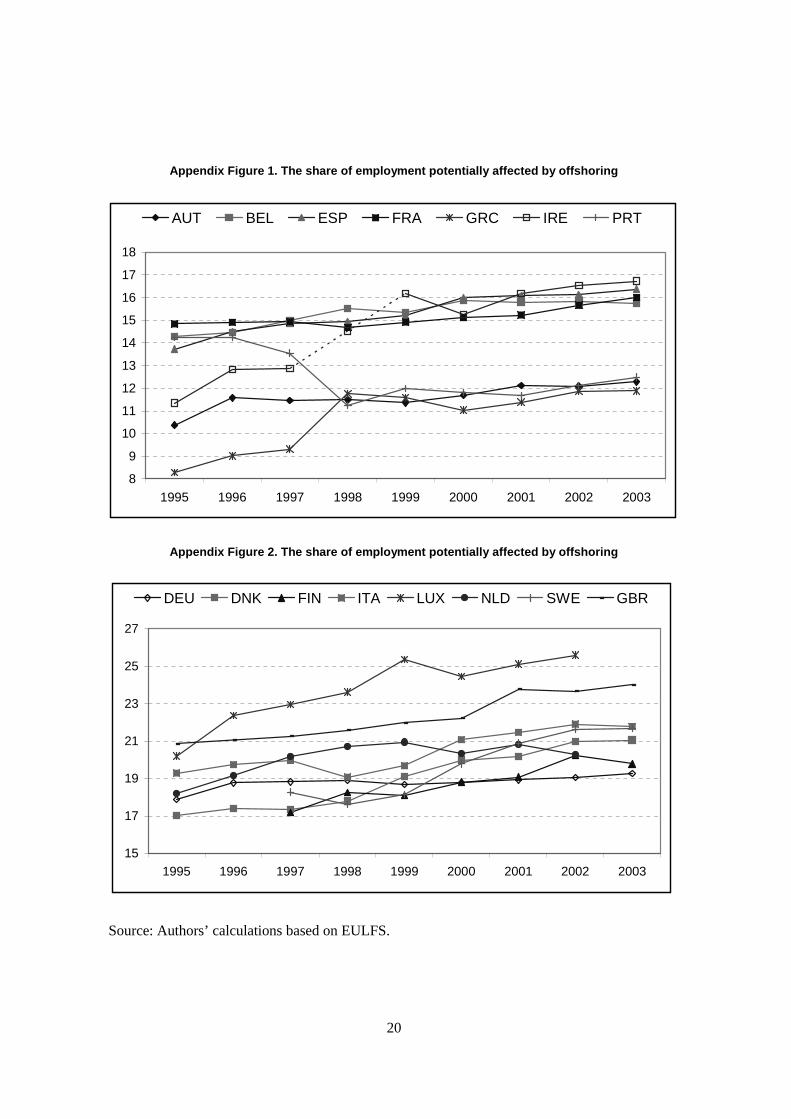
This section describes the employment data underlying Figure 4 in more detail, and the detailed graphs for the EU15 countries are given in Appendix Figures 1 and 2. One caveat of these data is that there may be differences in the ICT content of occupations within and between countries. Similarly, any possible dynamic adjustments, or changes in qualifications, skill requirements and task descriptions that may take place within occupations over time are not taken into account.
For the EU15 as a whole, the trend increases in all years, except in 1998. The year-on-year rate of change shows that employment potentially affected by offshoring grew faster than total employment in EU15 in all years except in 1998 when total employment grew faster than offshoring. There was no absolute decline in employment potentially affected by offshoring. Appendix Figures 1 and 2 show the underlying data for the countries that make up the EU15. The data quality is poor, especially early in the sample period, for Greece and Portugal. Furthermore, there appears to be a break in the data for Ireland between the 1995-1997 and 1999-2003 with a missing data point in 1998. Nevertheless, the increase observed for the EU15 aggregate appears to be representative of the evolution in most of the underlying countries and does not appear to be driven by outliers. Most countries see an increase in the share of employment potentially affected by offshoring, and while there were some incidences of absolute declines at the individual country level, these were isolated and do not represent a trend.
For the USA the trend decreases 1995-1998 and 2001-2003 (although 2003 is an estimate as both the industry and occupational classifications were changed that year). The year-on-year rate of change shows that total employment grew faster than employment potentially affected by offshoring in all years except in 1999 and 2000. The absolute number in employment potentially affected by offshoring declined in the USA in 1996, and 2001, 2002 and 2003. This absolute decline was fairly generalised and not limited to a specific type of occupation or level of skills. All of the occupations selected as potentially affected by offshoring experienced at least one year-on-year decline. Furthermore, 45 out of the 67 occupations included in the US selection experienced an absolute decline between 2001 and 2002, as did the overall selection of occupations potentially affected by offshoring and total employment. Finally, 47 of the selected occupations experienced at least 3 absolute declines between 1995 and 2002.
For Canada the trend decreases 1995-1996 and 1998-2003 – except in 2000. The year-on-year rate of change shows that total employment grew faster than employment potentially affected by offshoring except in 1997, 1998, and 2000. There was no absolute decline in employment potentially affected by offshoring.
Finally, for Australia the trend decreases in 1999 and 2001-2003. The year-on-year rate of change shows that total employment grew faster than employment potentially affected by offshoring in 1999 and 2002-2003. There was no absolute decline in employment potentially affected by offshoring. Data for 2004 indicate that the trend continues to decline. Data for 1995 and 1996 are not directly comparable with that for the rest of the period as 1995 and 1996 are in ASCO first edition and subsequent data in ASCO second edition.
These observations support the idea that it is not so much a decline in certain types of employment that can be expected, but rather slower employment growth in these types of occupations. Even though
9
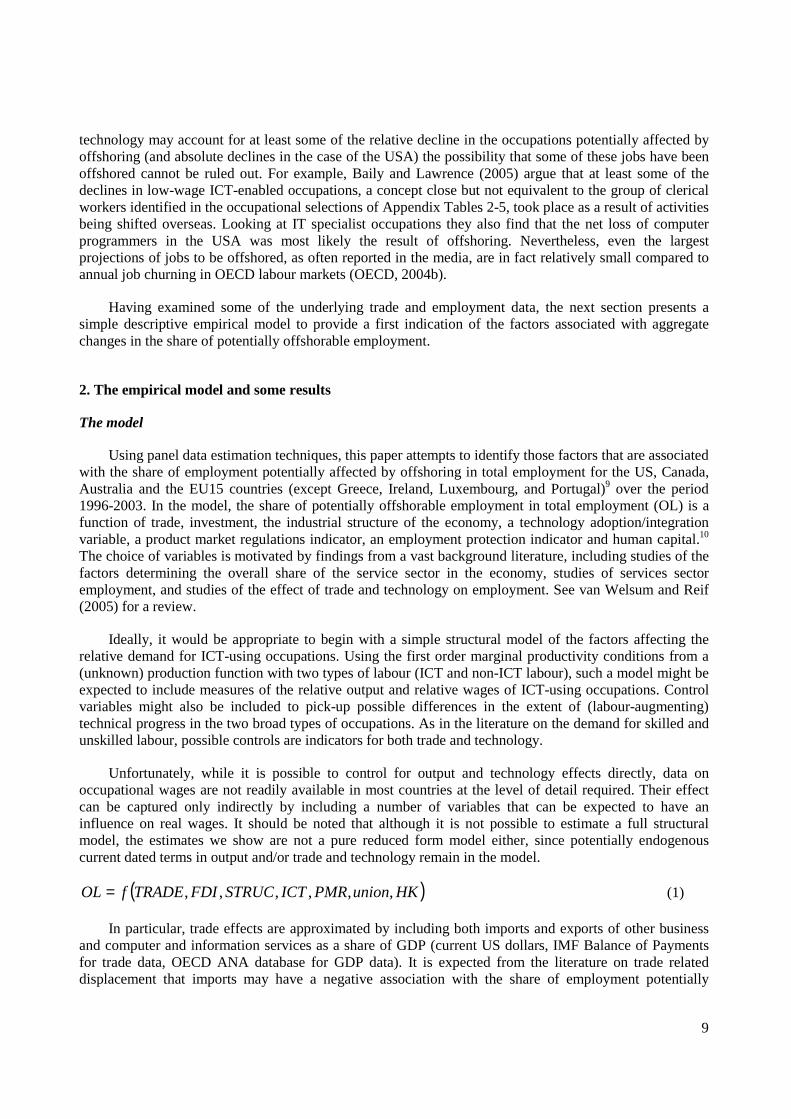
technology may account for at least some of the relative decline in the occupations potentially affected by offshoring (and absolute declines in the case of the USA) the possibility that some of these jobs have been offshored cannot be ruled out. For example, Baily and Lawrence (2005) argue that at least some of the declines in low-wage ICT-enabled occupations, a concept close but not equivalent to the group of clerical workers identified in the occupational selections of Appendix Tables 2-5, took place as a result of activities being shifted overseas. Looking at IT specialist occupations they also find that the net loss of computer programmers in the USA was most likely the result of offshoring. Nevertheless, even the largest projections of jobs to be offshored, as often reported in the media, are in fact relatively small compared to annual job churning in OECD labour markets (OECD, 2004b).
Having examined some of the underlying trade and employment data, the next section presents a simple descriptive empirical model to provide a first indication of the factors associated with aggregate changes in the share of potentially offshorable employment.
2. The empirical model and some results
The model
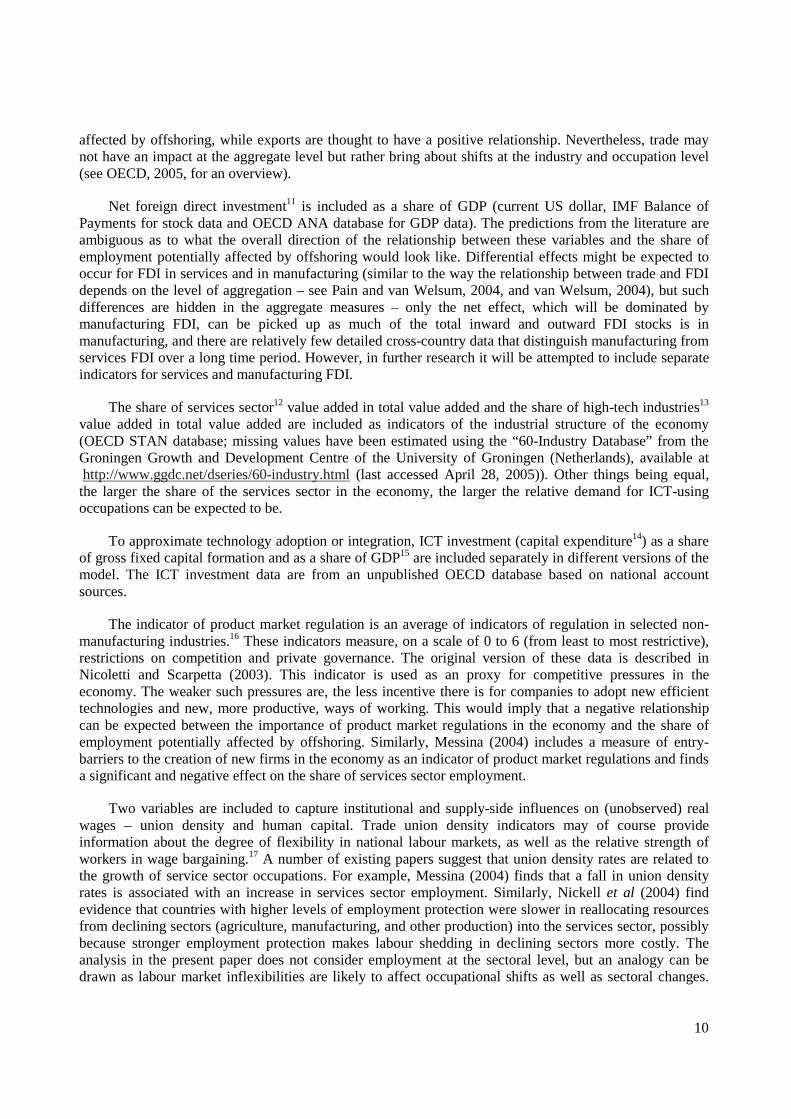
Using panel data estimation techniques, this paper attempts to identify those factors that are associated with the share of employment potentially affected by offshoring in total employment for the US, Canada, Australia and the EU15 countries (except Greece, Ireland, Luxembourg, and Portugal)9 over the period 1996-2003. In the model, the share of potentially offshorable employment in total employment (OL) is a function of trade, investment, the industrial structure of the economy, a technology adoption/integration variable, a product market regulations indicator, an employment protection indicator and human capital.10 The choice of variables is motivated by findings from a vast background literature, including studies of the factors determining the overall share of the service sector in the economy, studies of services sector employment, and studies of the effect of trade and technology on employment. See van Welsum and Reif (2005) for a review.
Ideally, it would be appropriate to begin with a simple structural model of the factors affecting the relative demand for ICT-using occupations. Using the first order marginal productivity conditions from a (unknown) production function with two types of labour (ICT and non-ICT labour), such a model might be expected to include measures of the relative output and relative wages of ICT-using occupations. Control variables might also be included to pick-up possible differences in the extent of (labour-augmenting) technical progress in the two broad types of occupations. As in the literature on the demand for skilled and unskilled labour, possible controls are indicators for both trade and technology.
Unfortunately, while it is possible to control for output and technology effects directly, data on occupational wages are not readily available in most countries at the level of detail required. Their effect can be captured only indirectly by including a number of variables that can be expected to have an influence on real wages. It should be noted that although it is not possible to estimate a full structural model, the estimates we show are not a pure reduced form model either, since potentially endogenous current dated terms in output and/or trade and technology remain in the model.
( )HKunionPMRICTSTRUCFDITRADEfOL ,,,,,,= (1)
In particular, trade effects are approximated by including both imports and exports of other business and computer and information services as a share of GDP (current US dollars, IMF Balance of Payments for trade data, OECD ANA database for GDP data). It is expected from the literature on trade related displacement that imports may have a negative association with the share of employment potentially
10
affected by offshoring, while exports are thought to have a positive relationship. Nevertheless, trade may not have an impact at the aggregate level but rather bring about shifts at the industry and occupation level (see OECD, 2005, for an overview).
Net foreign direct investment11 is included as a share of GDP (current US dollar, IMF Balance of Payments for stock data and OECD ANA database for GDP data). The predictions from the literature are ambiguous as to what the overall direction of the relationship between these variables and the share of employment potentially affected by offshoring would look like. Differential effects might be expected to occur for FDI in services and in manufacturing (similar to the way the relationship between trade and FDI depends on the level of aggregation – see Pain and van Welsum, 2004, and van Welsum, 2004), but such differences are hidden in the aggregate measures – only the net effect, which will be dominated by manufacturing FDI, can be picked up as much of the total inward and outward FDI stocks is in manufacturing, and there are relatively few detailed cross-country data that distinguish manufacturing from services FDI over a long time period. However, in further research it will be attempted to include separate indicators for services and manufacturing FDI.
The share of services sector12 value added in total value added and the share of high-tech industries13 value added in total value added are included as indicators of the industrial structure of the economy (OECD STAN database; missing values have been estimated using the “60-Industry Database” from the Groningen Growth and Development Centre of the University of Groningen (Netherlands), available at http://www.ggdc.net/dseries/60-industry.html (last accessed April 28, 2005)). Other things being equal, the larger the share of the services sector in the economy, the larger the relative demand for ICT-using occupations can be expected to be.
To approximate technology adoption or integration, ICT investment (capital expenditure14) as a share of gross fixed capital formation and as a share of GDP15 are included separately in different versions of the model. The ICT investment data are from an unpublished OECD database based on national account sources.
The indicator of product market regulation is an average of indicators of regulation in selected non-manufacturing industries.16 These indicators measure, on a scale of 0 to 6 (from least to most restrictive), restrictions on competition and private governance. The original version of these data is described in Nicoletti and Scarpetta (2003). This indicator is used as an proxy for competitive pressures in the economy. The weaker such pressures are, the less incentive there is for companies to adopt new efficient technologies and new, more productive, ways of working. This would imply that a negative relationship can be expected between the importance of product market regulations in the economy and the share of employment potentially affected by offshoring. Similarly, Messina (2004) includes a measure of entry-barriers to the creation of new firms in the economy as an indicator of product market regulations and finds a significant and negative effect on the share of services sector employment.
Two variables are included to capture institutional and supply-side influences on (unobserved) real wages – union density and human capital. Trade union density indicators may of course provide information about the degree of flexibility in national labour markets, as well as the relative strength of workers in wage bargaining.17 A number of existing papers suggest that union density rates are related to the growth of service sector occupations. For example, Messina (2004) finds that a fall in union density rates is associated with an increase in services sector employment. Similarly, Nickell et al (2004) find evidence that countries with higher levels of employment protection were slower in reallocating resources from declining sectors (agriculture, manufacturing, and other production) into the services sector, possibly because stronger employment protection makes labour shedding in declining sectors more costly. The analysis in the present paper does not consider employment at the sectoral level, but an analogy can be drawn as labour market inflexibilities are likely to affect occupational shifts as well as sectoral changes.
11
The a priori effect of this variable is ambiguous though, as it can both prevent a reallocation of resources into ICT-intensive using occupations, and hinder the speed at which existing ICT-intensive using jobs can be transferred abroad maintaining the share at a higher level than it would otherwise have been.
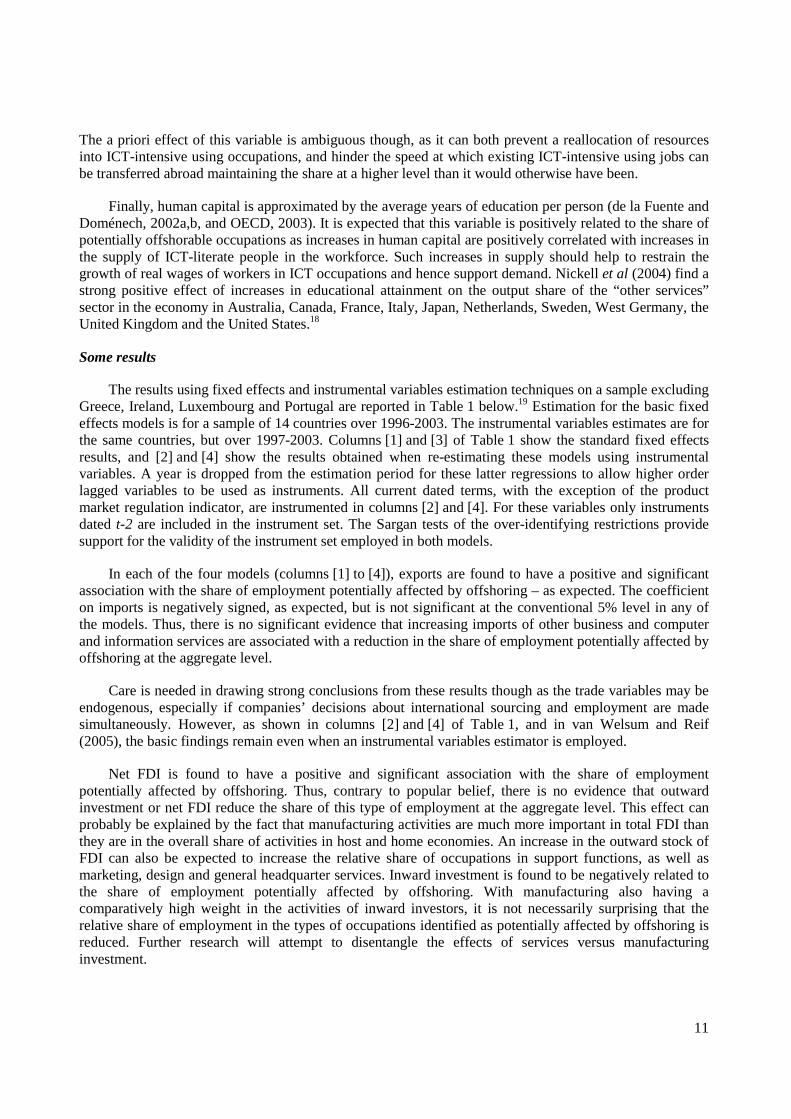
Finally, human capital is approximated by the average years of education per person (de la Fuente and Doménech, 2002a,b, and OECD, 2003). It is expected that this variable is positively related to the share of potentially offshorable occupations as increases in human capital are positively correlated with increases in the supply of ICT-literate people in the workforce. Such increases in supply should help to restrain the growth of real wages of workers in ICT occupations and hence support demand. Nickell et al (2004) find a strong positive effect of increases in educational attainment on the output share of the “other services” sector in the economy in Australia, Canada, France, Italy, Japan, Netherlands, Sweden, West Germany, the United Kingdom and the United States.18
Some results
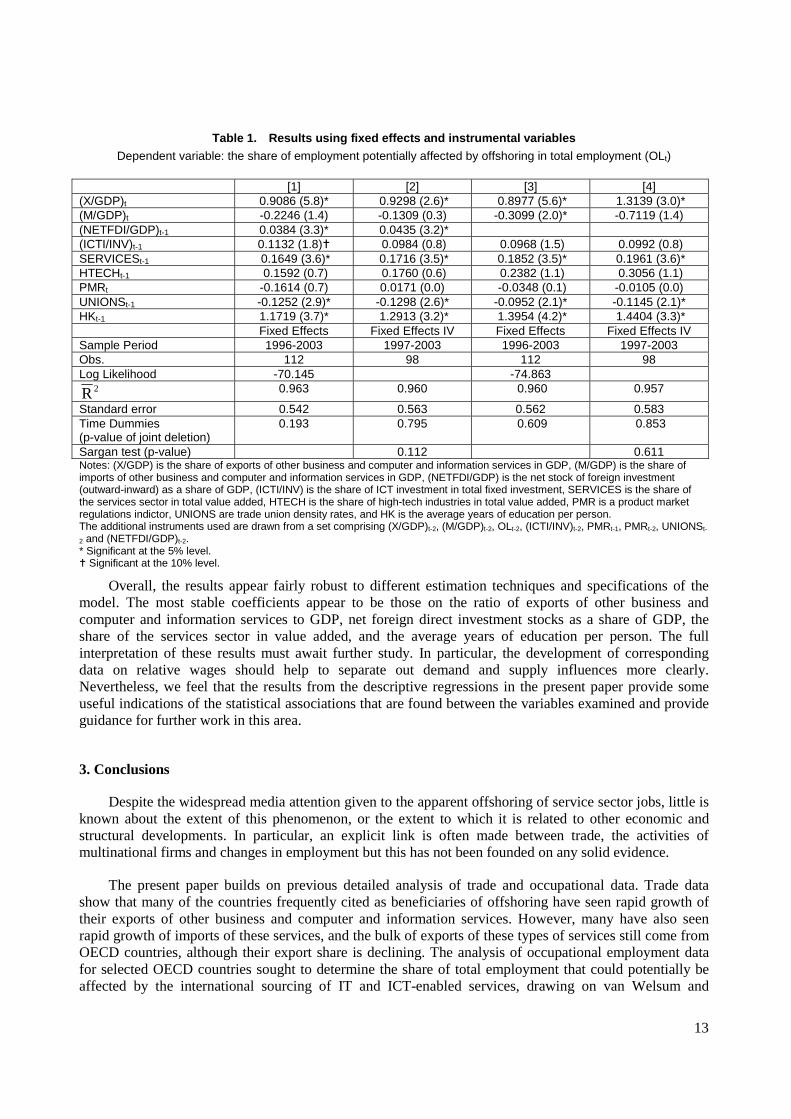
The results using fixed effects and instrumental variables estimation techniques on a sample excluding Greece, Ireland, Luxembourg and Portugal are reported in Table 1 below.19 Estimation for the basic fixed effects models is for a sample of 14 countries over 1996-2003. The instrumental variables estimates are for the same countries, but over 1997-2003. Columns [1] and [3] of Table 1 show the standard fixed effects results, and [2] and [4] show the results obtained when re-estimating these models using instrumental variables. A year is dropped from the estimation period for these latter regressions to allow higher order lagged variables to be used as instruments. All current dated terms, with the exception of the product market regulation indicator, are instrumented in columns [2] and [4]. For these variables only instruments dated t-2 are included in the instrument set. The Sargan tests of the over-identifying restrictions provide support for the validity of the instrument set employed in both models.
In each of the four models (columns [1] to [4]), exports are found to have a positive and significant association with the share of employment potentially affected by offshoring – as expected. The coefficient on imports is negatively signed, as expected, but is not significant at the conventional 5% level in any of the models. Thus, there is no significant evidence that increasing imports of other business and computer and information services are associated with a reduction in the share of employment potentially affected by offshoring at the aggregate level.
Care is needed in drawing strong conclusions from these results though as the trade variables may be endogenous, especially if companies’ decisions about international sourcing and employment are made simultaneously. However, as shown in columns [2] and [4] of Table 1, and in van Welsum and Reif (2005), the basic findings remain even when an instrumental variables estimator is employed.
Net FDI is found to have a positive and significant association with the share of employment potentially affected by offshoring. Thus, contrary to popular belief, there is no evidence that outward investment or net FDI reduce the share of this type of employment at the aggregate level. This effect can probably be explained by the fact that manufacturing activities are much more important in total FDI than they are in the overall share of activities in host and home economies. An increase in the outward stock of FDI can also be expected to increase the relative share of occupations in support functions, as well as marketing, design and general headquarter services. Inward investment is found to be negatively related to the share of employment potentially affected by offshoring. With manufacturing also having a comparatively high weight in the activities of inward investors, it is not necessarily surprising that the relative share of employment in the types of occupations identified as potentially affected by offshoring is reduced. Further research will attempt to disentangle the effects of services versus manufacturing investment.

12
There are many different factors that might be reflected in the coefficients on the FDI variables. It is also the case that FDI data can, at times, be a poor measure of the actual scale of activities that multinational companies undertake. Although this in itself is not a reason for omitting the FDI variables, it is prudent to repeat the regressions without them to ensure that their inclusion is not serving to significantly bias the coefficients on the other explanatory factors. The results, shown in columns [3] and [4] of Table 1, suggest that the net FDI variable is largely orthogonal to the remaining regressors, with the possible exception of the imports term whose coefficient becomes more negative. However it remains insignificant, at least at the 5% level.
The share of ICT investment in gross fixed capital formation is positively signed, but is not especially significant. The share of services sector value added in total value added has a significant positive association with the share of employment potentially affected by offshoring, as expected, with many services having high shares of ICT-using occupations, but there is no significant relationship with the share of high-tech industries in value added (though the coefficient is positively signed). The indicator of the importance of product market regulations in the economy is negatively signed (except in column [3]) but is not significant.
The two variables that are most likely to affect wages - union density and human capital – both have coefficients of the sign expected given the assumption that wages have a negative effect on employment. Higher levels of union density are associated with slower adjustment into the types of occupations potentially affected by offshoring, and the average years of education per person is significantly positively associated with the share of potentially offshorable employment, consistent with the observation that many such occupations are comparatively skill intensive.
13
Table 1. Results using fixed effects and instrumental variables
Dependent variable: the share of employment potentially affected by offshoring in total employment (OLt)
[1] [2] [3] [4] (X/GDP)t 0.9086 (5.8)* 0.9298 (2.6)* 0.8977 (5.6)* 1.3139 (3.0)* (M/GDP)t -0.2246 (1.4) -0.1309 (0.3) -0.3099 (2.0)* -0.7119 (1.4) (NETFDI/GDP)t-1 0.0384 (3.3)* 0.0435 (3.2)* (ICTI/INV)t-1 0.1132 (1.8) 0.0984 (0.8) 0.0968 (1.5) 0.0992 (0.8) SERVICESt-1 0.1649 (3.6)* 0.1716 (3.5)* 0.1852 (3.5)* 0.1961 (3.6)* HTECHt-1 0.1592 (0.7) 0.1760 (0.6) 0.2382 (1.1) 0.3056 (1.1) PMRt -0.1614 (0.7) 0.0171 (0.0) -0.0348 (0.1) -0.0105 (0.0) UNIONSt-1 -0.1252 (2.9)* -0.1298 (2.6)* -0.0952 (2.1)* -0.1145 (2.1)* HKt-1 1.1719 (3.7)* 1.2913 (3.2)* 1.3954 (4.2)* 1.4404 (3.3)* Fixed Effects Fixed Effects IV Fixed Effects Fixed Effects IV Sample Period 1996-2003 1997-2003 1996-2003 1997-2003 Obs. 112 98 112 98 Log Likelihood -70.145 -74.863
2R 0.963 0.960 0.960 0.957
Standard error 0.542 0.563 0.562 0.583 Time Dummies (p-value of joint deletion)
0.193 0.795 0.609 0.853
Sargan test (p-value) 0.112 0.611 Notes: (X/GDP) is the share of exports of other business and computer and information services in GDP, (M/GDP) is the share of imports of other business and computer and information services in GDP, (NETFDI/GDP) is the net stock of foreign investment (outward-inward) as a share of GDP, (ICTI/INV) is the share of ICT investment in total fixed investment, SERVICES is the share of the services sector in total value added, HTECH is the share of high-tech industries in total value added, PMR is a product market regulations indictor, UNIONS are trade union density rates, and HK is the average years of education per person. The additional instruments used are drawn from a set comprising (X/GDP)t-2, (M/GDP)t-2, OLt-2, (ICTI/INV)t-2, PMRt-1, PMRt-2, UNIONSt-
2 and (NETFDI/GDP)t-2. * Significant at the 5% level.
Significant at the 10% level.
Overall, the results appear fairly robust to different estimation techniques and specifications of the model. The most stable coefficients appear to be those on the ratio of exports of other business and computer and information services to GDP, net foreign direct investment stocks as a share of GDP, the share of the services sector in value added, and the average years of education per person. The full interpretation of these results must await further study. In particular, the development of corresponding data on relative wages should help to separate out demand and supply influences more clearly. Nevertheless, we feel that the results from the descriptive regressions in the present paper provide some useful indications of the statistical associations that are found between the variables examined and provide guidance for further work in this area.
3. Conclusions
Despite the widespread media attention given to the apparent offshoring of service sector jobs, little is known about the extent of this phenomenon, or the extent to which it is related to other economic and structural developments. In particular, an explicit link is often made between trade, the activities of multinational firms and changes in employment but this has not been founded on any solid evidence.
The present paper builds on previous detailed analysis of trade and occupational data. Trade data show that many of the countries frequently cited as beneficiaries of offshoring have seen rapid growth of their exports of other business and computer and information services. However, many have also seen rapid growth of imports of these services, and the bulk of exports of these types of services still come from OECD countries, although their export share is declining. The analysis of occupational employment data for selected OECD countries sought to determine the share of total employment that could potentially be affected by the international sourcing of IT and ICT-enabled services, drawing on van Welsum and
14
Vickery (2005a). It suggested that close to 20 per cent of total employment could potentially be affected by offshoring.
The present paper also makes an initial attempt to examine the relationship between the share of employment potentially affected by offshoring and other economic and structural developments using some simple descriptive regressions on a panel of selected OECD economies between 1996 and 2003. In particular, first estimates are provided of the statistical association between the share of potentially offshorable employment and trade in business services and international direct investment. The results indicate that exports of other business services and computer and information services are positively associated with the share of employment potentially affected by offshoring. This suggests that increases in demand and production have lead to a relative increase in the types of ICT-using occupations identified in the analysis. Furthermore, contrary to popular belief, no evidence is found of a significant negative association between imports of these services and the share of employment potentially affected by offshoring. Similarly, no evidence is found that net outward investment reduces the employment share of the ICT-intensive using occupations identified as potentially affected by offshoring. Other key factors associated with cross-country differences in the employment share are found to be the comparative size of the service sector, the growing share of ICT investment in total fixed investment, and human capital.
These results suggest that, in the OECD countries analysed, ICT-enabled services offshoring (as proxied by trade and investment) has not yet led to a relative decline in the occupational share of location independent ICT-using occupations. Overall, this implies that in the long-run the positive benefits of services offshoring outweigh the costs, even though the adjustment process may occasionally be difficult in the short run. Policy reactions to services offshoring should reflect these positive aspects. This includes the policies that contribute to the overall competitiveness of the economy and improve the macroeconomic framework, those policies that contribute to a sound investment climate, and those policies that improve the skills base and flexibility of the workforce.
It is important to take care with the interpretation of these results though as they are not drawn from the empirical testing of a formal theoretical model of the underlying structural relationships. Thus, it is not possible to separate out completely the effects from demand and supply side developments. However, the results provide guidance on the statistical associations that are found to exist between the variables included in these descriptive regressions and to this extent can be used to shape further work and analysis. This could include improvements to the underpinnings of the empirical model, such as the use of separate indicators for services and non-services FDI, and examination of whether there are differences in the factors affecting different groups of ICT-using occupations, such as clerical and non-clerical occupations. It would also be useful to develop an indicator of business adoption of ICTs to try to control for differences in “the use of ICT” or the “ICT content of occupations” across countries.
Acknowledgements
We are grateful to Nigel Pain from the OECD Economics Department and Professor Ron Smith of Birkbeck College London for their help and advice in preparing this paper. We are also grateful to our colleagues in the Directorate for Science, Technology and Industry, in particular Graham Vickery, the Directorate for Employment, Labour and Social Affairs and the Trade Directorate. Finally, our thanks go out to participants in the conferences at which earlier parts of this work have been presented, and in particular to Catherine Mann and Robert Lawrence.
15
REFERENCES
Autor, David H., Levy, Frank, and Murnane, Richard J. (2003), ‘The skills content of recent technological change: An empirical exploration’, Quarterly Journal of Economics, Vol. 118, No. 4 (November 2003), pp. 1279-1333.
Baily, Martin N., Lawrence, Robert Z. (2004), ‘What happened to the great US job machine? The role of trade and electronic offshoring.’ Brookings Papers on Economic Activity 2004 (2).
Bardhan, Ashok D., and Kroll, Cynthia. (2003), ‘The new wave of outsourcing’, University of California Berkeley, Fisher Centre for Real Estate and Urban Economics, Fisher Centre Research Report No. 1103.
de la Fuente, Angel, and Doménech, Raphael (2002a), ‘Educational attainment in the OECD, 1960-1995’, Centre for Economic Policy Research, Discussion Paper No. 3390.
de la Fuente, Angel, and Doménech, Raphael (2002b), ‘Human capital in growth regressions: How much difference does data quality make? An update and further results’, Centre for Economic Policy Research, Discussion Paper No. 3587.
Kirkegaard, Jacob Funk. (2004), ‘Outsourcing – stains on the white collar?’, Institute for International Economics, Washington, D.C.
Levy, Frank, and Murnane, Richard J. (2004), The new Division of Labor, Princeton University Press and the Russell Sage Foundation, New York.
Marin, Dalia. (2004), ‘“A nation of poets and thinkers” – Less so with Eastern enlargement? Austria and Germany’, University of Munich, Department of Economics Discussion Paper No. 2004-06, April 2004, Munich.
Mann, Catherine L. (2004), ‘The US current account, new economy services and implications for sustainability’, Review of International Economics, Vol. 12, No. 2, pp. 262-276.
Messina, Julian (2004), ‘Institutions and service employment: A panel study for OECD countries’, Paper prepared for the OECD Workshop on Services, 15-16 November 2004, forthcoming in Labour: Review of Labour Economics and Industrial Relations.
Millar, Jane, (2002), ‘Outsourcing practices in Europe’, STAR Issue Report 27, www.databank.it/star/list_issue/e.html.
Nickell, Stephen, Redding, Stephen, and Swaffield, Joanna (2004), ‘The uneven pace of deindustrialisation in the OECD’, Paper prepared for the OECD Workshop on Services, 15-16 November 2004, based on CEPR Discussion Paper No. 3068.
Nicoletti, Giuseppe, and Scarpetta, Stefano (2003), ‘Regulation, productivity and growth: OECD evidence’, Economic Policy, April 2003, pp. 9-72.

16
OECD (2002), The Manual on Statistics of International Trade in Services, joint publication of the United Nations, the International Monetary Fund, the OECD, the European Commission, the United Nations Conference on Trade and Development and the World Trade Organization. An electronic version of the manual is available free of charge at www.oecd.org/std/trade-services
OECD (2003), The Sources of Economic Growth in OECD Countries, Paris.
OECD (2004a), OECD Information Technology Outlook 2004, OECD, Paris.
OECD (2004b), OECD Economic Outlook, Vol. 2004/1, No. 75, June, OECD, Paris.
OECD (2005), OECD Employment Outlook 2005, June, OECD, Paris.
Pain, Nigel, and van Welsum, Desirée (2004), ‘International production relocation and exports of services’, OECD Economic Studies, No. 38, Vol. 2004/1.
Schultze, Charles L. (2004), ‘Offshoring, import competition and the jobless recovery’, The Brookings Institution, Policy Brief No. 136, August, 2004.
van Welsum, Desirée (2003), ‘International Trade in Services: Issues and Concepts’, Birkbeck Economics Working Paper 2003 No. 4, Birkbeck College, London.
van Welsum, Desirée (2004), ‘In search of “offshoring”: Evidence from US imports of services’, Birkbeck Economics Working Paper 2004 No. 2, Birkbeck College, London.
van Welsum, Desirée, and Reif, Xavier (2005), ‘The share of employment potentially affected by offshoring – An empirical investigation’, DSTI Information Economy Working Paper, OECD, Paris, forthcoming.
van Welsum, Desirée, and Vickery, Graham (2005a), ‘Potential offshoring of ICT-intensive using occupations’, DSTI Information Economy Working Paper, DSTI/ICCP/IE(2004)19/FINAL, OECD, Paris. http://www.oecd.org/sti/information-economy
van Welsum, Desirée, and Vickery, Graham (2005b), ‘New perspectives on ICT Skills and Employment’, DSTI Information Economy Working Paper, DSTI/ICCP/IE(2004)10/FINAL, OECD, Paris. http://www.oecd.org/sti/information-economy
17
ANNEX
Appendix Table 1. IMF balance of payments categories
7. Computer and information services 7.1 Computer services 7.2 Information services 7.2.1 News agency services 7.2.2 Other information provision services 9. Other business services 9.1 Merchanting and other trade-related services 9.1.1 Merchanting 9.1.2 Other trade-related services 9.2 Operational leasing services 9.3 Miscellaneous business, professional, and technical services 9.3.1 Legal, accounting, management consulting, and public relations 9.3.1.1 Legal services 9.3.1.2 Accounting, auditing, bookkeeping, and tax consulting services 9.3.1.3 Business and management consulting, and public relations 9.3.2 Advertising, market research, and public opinion polling 9.3.3 Research and development 9.3.4 Architectural, engineering, and other technical services 9.3.5 Agricultural, mining, mining, and on-site processing services 9.3.5.1 Waste treatment and depollution 9.3.5.2 Agricultural, mining and other on-site processing services 9.3.6 Other business services 9.3.7 Services between related enterprises, n.i.e.
Source: OECD (2002).
Appendix Table 2. Europe: Occupations potentially affected by offshoring
3 Digit ISCO-88123: Other specialist managers211: Physicists, chemists, and related professionals212: Mathematicians, statisticians and related professionals213: Computing professionals214: Architects, engineers, and related professionals241: Business professionals242: Legal professionals243: Archivists, librarians, and related information professionals312: Computer associate professionals341: Finance and sales associate professionals342: Business services agents and trade brokers343: Administrative associate professionals411: Secretaries and keyboard-operating clerks412: Numerical clerks422: Client information clerks
Note: Occupations in shading have been classified as clerical. Source: van Welsum and Vickery (2005a), based on EULFS (2004).
18
Appendix Table 3. United States: Occupations potentially affected by offshoring
accountants and auditors 23 Archivists and curators 165underwriters 24 Economists 166other financial officers 25 Urban planners 173management analysts 26 Authors 183architects 43 Technical writers 184aerospace engineer 44 Editors and reporters 195metallurgical and materials engineers 45 Air traffic controllers 227mining engineers 46 Computer programmers 229petroleum engineers 47 Tool programmers, numerical control 233chemical engineers 48 Supervisors and Proprietors, Sales Occupations 243nuclear engineers 49 Insurance sales occupations 253civil engineers 53 Real estate sales occupations 254agricultural engineers 54 Securities and financial services sales occupations 255Engineers, electrical and electronic 55 Sales occupations, other business services 257Engineers, industrial 56 Supervisors, computer equipment operators 304Engineers, mechanical 57 Supervisors, financial records processing 305marine and naval architects 58 Chief communications operators 306engineers, n.e.c. 59 Computer operators 308surveyors and mapping scientists 63 Peripheral equipment operators 309computer systems analysts and scientists 64 Secretaries 313operations and systems researchers and analysts 65 Typists 315Actuaries 66 Transportation ticket and reservation agents 318Statisticians 67 File clerks 335Mathematical scientists, n.e.c. 68 Records clerks 336Physicists and astronomers 69 Bookkeepers, accounting, and auditing clerks 337Chemists, except biochemists 73 Payroll and timekeeping clerks 338Atmospheric and space scientists 74 Billing clerks 339Geologists and geodesists 75 Cost and rate clerks 343Physical scientists, n.e.c. 76 Billing, posting, and calculating machine operators 344Agricultural and food scientists 77 Telephone operators 348Biological and life scientists 78 Bank tellers 383Forestry and conservation scientists 79 Data-entry keyers 385Medical scientists 83 Statistical clerks 386Librarians 164
CPS categories
Note: Occupations in shading have been classified as clerical. Source: van Welsum and Vickery (2005a), based on US Current Population Survey.
19
Appendix Table 4. Canada: Occupations potentially affected by offshoring
A121 Engineering, Science and Architecture Managers C012 ChemistsA122 Information Systems and Data Processing Managers C013 Geologists, Geochemists and GeophysicistsA131 Sales, Marketing and Advertising Managers C014 MeteorologistsA301 Insurance, Real Estate and Financial Brokerage Managers C015 Other Professional Occupations in Physical SciencesA302 Banking, Credit and Other Investment Managers C021 Biologists and Related ScientistsA303 Other Business Services Managers C031 Civil EngineersA311 Telecommunication Carriers Managers C032 Mechanical EngineersA312 Postal and Courier Services Managers C033 Electrical and Electronics EngineersA392 Utilities Managers C034 Chemical EngineersB011 Financial Auditors and Accountants C041 Industrial and Manufacturing EngineersB012 Financial and Investment Analysts C042 Metallurgical and Materials EngineersB013 Securities Agents, Investment Dealers and Traders C043 Mining EngineersB014 Other Financial Officers C044 Geological EngineersB022 Professional Occupations in Business Services to Management C045 Petroleum EngineersB111 Bookkeepers C046 Aerospace EngineersB112 Loan Officers C047 Computer EngineersB114 Insurance Underwriters C048 Other Professional Engineers, n.e.c.B211 Secretaries (except Legal and Medical) C051 ArchitectsB212 Legal Secretaries C052 Landscape ArchitectsB213 Medical Secretaries C053 Urban and Land Use PlannersB214 Court Recorders and Medical Transcriptionists C054 Land SurveyorsB311 Administrative Officers C061 Mathematicians, Statisticians and ActuariesB312 Executive Assistants C062 Computer Systems AnalystsB412 Supervisors, Finance and Insurance Clerks C063 Computer ProgrammersB512 Typists and Word Processing Operators C152 Industrial DesignersB513 Records and File Clerks C172 Air Traffic Control OccupationsB514 Receptionists and Switchboard Operators E012 Lawyers and Quebec NotariesB521 Computer Operators E031 Natural and Applied Science Policy Researchers, Consultants and Program OfficersB522 Data Entry Clerks E032 Economists and Economic Policy Researchers and AnalystsB523 Typesetters and Related Occupations E033 Economic Development Officers and Marketing Researchers and ConsultantsB524 Telephone Operators F011 LibrariansB531 Accounting and Related Clerks F013 ArchivistsB532 Payroll Clerks F021 WritersB533 Tellers, Financial Services F022 EditorsB534 Banking, Insurance and Other Financial Clerks F023 JournalistsB553 Customer Service, Information and Related Clerks F025 Translators, Terminologists and InterpretersB554 Survey Interviewers and Statistical Clerks G131 Insurance Agents and BrokersC011 Physicists and Astronomers
SOC91 Canada
Note: Occupations in shading have been classified as clerical. Source: van Welsum and Vickery (2005a), based on Statistics Canada.
Appendix Table 5. Australia: Occupations potentially affected by offshoring
1221 Engineering Managers 2521 Legal Professionals1224 Information Technology Managers 2522 Economists1231 Sales and Marketing Managers 2523 Urban and Regional Planners1291 Policy and Planning Managers 2534 Journalists and Related Professionals2111 Chemists 2535 Authors and Related Professionals2112 Geologists and Geophysicists 3211 Branch Accountants and Managers (Financial Institution)2113 Life Scientists 3212 Financial Dealers and Brokers2114 Environmental and Agricultural Science Professionals 3213 Financial Investment Advisers2115 Medical Scientists 3294 Computing Support Technicians2119 Other Natural and Physical Science Professionals 3392 Customer Service Managers2121 Architects and Landscape Architects 3399 Other Managing Supervisors (Sales and Service)2122 Quantity Surveyors 5111 Secretaries and Personal Assistants2123 Cartographers and Surveyors 5911 Bookkeepers2124 Civil Engineers 5912 Credit and Loans Officers2125 Electrical and Electronics Engineers 5991 Advanced Legal and Related Clerks2126 Mechanical, Production and Plant Engineers 5993 Insurance Agents2127 Mining and Materials Engineers 5995 Desktop Publishing Operators2211 Accountants 6121 Keyboard Operators2212 Auditors 6141 Accounting Clerks2221 Marketing and Advertising Professionals 6142 Payroll Clerks2231 Computing Professionals 6143 Bank Workers2292 Librarians 6144 Insurance Clerks2293 Mathematicians, Statisticians and Actuaries 6145 Money Market and Statistical Clerks2294 Business and Organisation Analysts 8113 Switchboard Operators2299 Other Business and Information Professionals 8294 Telemarketers2391 Medical Imaging Professionals
ASCO 4-digit
Note: Occupations in shading have been classified as clerical. Source: van Welsum and Vickery (2005a), based on Australian Bureau of Statistics.
20
Appendix Figure 1. The share of employment potentially affected by offshoring
8
9
10
11
12
13
14
15
16
17
18
1995 1996 1997 1998 1999 2000 2001 2002 2003
AUT BEL ESP FRA GRC IRE PRT
Appendix Figure 2. The share of employment potentially affected by offshoring
15
17
19
21
23
25
27
1995 1996 1997 1998 1999 2000 2001 2002 2003
DEU DNK FIN ITA LUX NLD SWE GBR
Source: Authors’ calculations based on EULFS.
21
NOTES
1 For India, the category “other business services” includes all services except travel, transport and
government services. However, Indian firms are now extensively exporting ICT-enabled services and business process services and the remaining services included in the category are likely to be small in comparison. Furthermore, data on overseas revenues from annual reports of top Indian export firms show patterns similar to the IMF data.
2 At the time of writing the IMF database did not include data for India in 2003 so it was not possible to update the analysis of the trade shares.
3 The share of some services exporting countries may be understated as they may not have very good data on trade in services to report to the IMF, which will bias their actual share downwards. Furthermore, other countries that export services may not be members and report to the IMF.
4 See van Welsum (2003) for a discussion. 5 The European data are Labour Force Survey data provided by Eurostat. The occupational classification
system in those data is the ISCO – International Standard Classification of Occupations, and NACE – the industrial classification system of the European Union – is used for sectoral classification. For the US, data from the Current Population Survey were used. The Current Population Survey collects information on both the industry and the occupation of the employed and unemployed. However, beginning with data from January 2003, the 1990 Census Industrial Classification System was replaced by one based on the North American Industry Classification (NAICS), and the 1990 Census Occupational Classification was replaced by one derived from the U.S. Standard Occupational Classification (SOC). Further information is available on the Web site of the U.S Bureau of Labor Statistics at: http://www.bls.gov/opub/hom/pdf/homch1.pdf (accessed November 2004): Chapter 1: Labor Force Data derived from the Current Population Survey. For Canada Labour Force Data provided by Statistics Canada were used. The occupational classification is in SOC91. For Australia data from the Labour Force Survey provided by the Australian Bureau of Statistics were used. The occupational classification is in Australian Standard Classification of Occupations (ASCO) second edition.
6 Other studies have taken a similar approach. For example, Bardhan and Kroll (2003) produced estimates of 11% of total employment in the USA in 2001 as potentially affected by offshoring, and Forrester Research, as reported by Kirkegaard (2004) up to 44% of total employment. The differences in these estimates can be explained by the selection criteria that are applied to the occupational data. Thus, Bardhan and Kroll (2003) only included occupations in which at least some offshoring was already know to have taken place yielding a more conservative estimate of the share of employment potentially affected, whereas the Forrester study used less detailed occupational categories resulting in a larger estimate of jobs potentially affected.
7 The number for 2003 (just under 18%) is an estimate as both the occupational and industrial classification systems were changed in 2003 in the U.S.
8 A parallel can be drawn here with some of the work undertaken by Autor et. al. (2003) and Levy and Murnane (2004). These authors argue that the tasks most vulnerable to being substituted by technology are those where information processing can be described in rules. If a significant part of a task can be described by rules, this increases the likelihood of the task being offshored, since the task can then be assigned to offshore producers with less risk and greater ease of supervision.
9 These countries were excluded from the sample because of a lack of data. 10 Even though GDP per capita is a variable found to be an important determinant of the share of services
sector employment (Messina, 2004) it is not used here. In a time series context it does not make sense to include the level of GDP per capital in a regression of a bounded variable. The first difference of GDP per
22
capital was found to be insignificant. This is not necessarily surprising as the countries in sample all have relatively high levels of GDP per capita, so over the sample period (1995-2003) this variable is not found to have an impact on the share of employment potentially affected by offshoring. Nevertheless, with the exception of Austria, the countries with a relatively low share of employment potentially affected by offshoring were also those with the lowest levels of GDP per capita. The role of productivity growth is also not considered here. It is sometimes argued that the decline in certain types of employment, or the lack of new jobs (the jobless recovery), is the result of important productivity increases, but Baily and Lawrence (2004) argue that this is a mistake and that while productivity may have played some role, it should not be considered a fundamental cause. Time dummies pick up common cyclical effects.
11 This is done by imposing equal and opposite signs on outward and inward FDI, a restriction accepted by the data.
12 ISIC Rev.3 categories 50-99: 50-55: Wholesale and retail trade; repairs; hotels and restaurants; 60-64: Transport, storage and communications; 65-74: Finance, insurance, real estate and business services; 75-99: Community, social and personal services.
13 ISIC Rev.3 categories: 2423: chemicals excluding pharmaceuticals; 30: office, accounting and computing machinery; 32: radio, television and communication equipment; 33: medical, precision and optical instruments; 353: aircraft and spacecraft.
14 ISIC Rev.3 categories: 30: office, accounting and computing machinery; 3130: Insulated wire and cable; 3210: Electronic valves and tubes and other electronic components; 3220: Television and radio transmitters and apparatus for line telephony and line telegraphy; 3230: Television and radio receivers, sound or video recording or reproducing apparatus, and associated goods; 3312: Instruments and appliances for measuring, checking, testing, navigating and other purposes; 3313: Industrial process control equipment; 5150: Wholesale of machinery, equipment and supplies; 6420: Telecommunications; 7123: Renting of office machinery and equipment (including computers); 72: computer and related activities.
15 Results from the regressions using ICT investment as a share of GDP are not reported here. See van Welsum and Reif (2005) for details.
16 We use a preliminary unpublished version of this product market regulation indicator. 17 The data on trade union density rates come from OECD Labour Force Statistics Indicators and OECD
2004c (Table 3.3). Factors other than union density rates, including union coverage and hiring and firing restrictions, are also important.
18 But in the sector “business services” they found a greater role for changes in relative prices. 19 Country fixed effects and year time dummies are included in all models. See van Welsum and Reif (2005)
for further results.