Embed Size (px)
Citation preview
PUBLIC & SOCIAL
REPORTPrepare by
2010
Poultry Producer Survey
Gathering Evidence for a Transitional Strategy (GETS)for HPAI H5N1 Vaccination in Vietnam
2010
Prepared by
Pavithra Ram, Le Mai Khanh, Pham Thi Hai Ninh
Public and Social Research, TNS Vietnam
194 Lac Trung, Hai Ba Trung District, Hanoi
All questions regarding this report should be sent to [email protected]
PUBLIC & SOCIAL
Poultry Producer Survey 5
TABLE OF CONTENTS
1.INTRODUCTION ................................................................................................................................... 11 1.1. BACKGROUND ............................................................................................................................ 11 1.2. OBJECTIVES ............................................................................................................................... 11 1.3. METHODS .................................................................................................................................... 12
1.3.1. Study Sites and Target Respondents ................................................................................ 12 1.3.2. Sample Sizes ..................................................................................................................... 14 1.3.3. Sampling Procedure – Cluster Sampling ........................................................................... 15
1.4. KEY INDICATORS ....................................................................................................................... 16 1.5. DATA COLLECTION .................................................................................................................... 16
1.5.1. Questionnaire Development .............................................................................................. 16 1.5.2. Recruitment of Interviewers and Supervisors .................................................................... 16 1.5.3. Training .............................................................................................................................. 17 1.5.4. Pilot .................................................................................................................................... 17
1.6. FIELDWORK PROCESS.............................................................................................................. 18 1.6.1. Authorization ...................................................................................................................... 18 1.6.2. Fieldwork Structure ............................................................................................................ 18 1.6.3. Ethical Consideration ......................................................................................................... 18
1.7. QUALITY CONTROL .................................................................................................................... 19 1.8. DATA PROCESSING AND ANALYSIS ........................................................................................ 19
2. REPORT FINDINGS ............................................................................................................................. 21 2.1. RESPONDENT PROFILE ............................................................................................................ 21 2.2. FARM PROFILE ........................................................................................................................... 22
2.2.1. Farm Management ............................................................................................................ 26 2.2.2. Farm Production ................................................................................................................ 33
2.3. PRODUCTION INPUTS .............................................................................................................. 41 2.4. PRODUCTION OUTPUTS ........................................................................................................... 44 2.5. POULTRY BUSINESS ................................................................................................................. 56 2.6. IMPORTANT POULTRY DISEASE .............................................................................................. 59 2.7. VACCINATION PROGRAM AND POULTRY HEALTH SERVICES ............................................ 62 2.8. BIO-SECURITY ............................................................................................................................ 69 2.9. REPORTING AND HANDLING SICK AND DEAD POULTRY ..................................................... 73 2.10. AVIAN INFLUENZA OUTBREAK EXPERIENCE ...................................................................... 76 2.11. ATTITUDES ................................................................................................................................ 78
2.11.1. Perceptions on HPAI ....................................................................................................... 80 2.11.2. Farmers’ Attitudes Towards the Vaccination Intervention ............................................... 84 2.11.3. Attitudes Towards the Poultry Health Care ..................................................................... 88
2.12. INFORMATION ON HPAI .......................................................................................................... 95 3. CONCLUSION .................................................................................................................................... 101
6 Poultry Producer Survey
LIST OF TABLES
Table 1: Study sites for the recruitment of participants. ....................................................................... 13
Table 2: Location break-up ................................................................................................................... 14
Table 3: No. of districts, communes and farms per commune ............................................................. 14
Table 4: Quota for sampling chicken and duck farms in each commune ............................................. 15
Table 5: Type of farm ............................................................................................................................ 22
Table 6: Percentage of each species or animals at present in poultry farms ....................................... 23
Table 7: Percentage of each species or animals at present in poultry farms(By type of farms) .......... 25
Table 8: Annual production capacity of poultry farms........................................................................... 26
Table 9: Areas to which animals have access-percentage of species that access .............................. 27
Table 10: Proportion of confinement in poultry farms ............................................................................. 27
Table 11: Proportion on how farmers manage their birds ...................................................................... 27
Table 12: Proportion on how farmers manage their meat chickens and laying chickens (By provinces) ......................................................................................................................... 29
Table 13: Proportion on how farmers manage their meat ducks and laying ducks (By provinces) ....... 30
Table 14: Proportion of kinds of rice fields which duck flocks access ( By provinces) ........................... 32
Table 15: Location of known hatchery where birds for meat production originated from (proportion of farms) (By provinces) .............................................................................................................. 37
Table 16: Location of known hatchery where birds for egg production originated from (proportion of farms) (By provinces) .............................................................................................................. 39
Table 17: Proportion of different kinds of feed the poultry is fed with ..................................................... 41
Table 18: Source of feed for each avian species in percentage ............................................................ 42
Table 19: The number of people living on the farm ................................................................................ 44
Table 20: The way brokers/traders/buyers determine the weight of the birds for purchase among farms (By type of farm) ..................................................................................................................... 50
Table 21: Proportion on income coming from poultry farming of each type of farm ............................... 56
Table 22: Three most important constraints to poultry business ............................................................ 58
Table 23: Proportion of farmers who aware of poultry diseases (By type of farm) ................................ 59
Table 24: Perception of the seriousness/importance of poultry diseases to their farms (proportion of farmers) (By type of farm) ....................................................................................................... 61
Table 25: Proportion of farmers who applied vaccination program for each poultry disease (By type of farm) ........................................................................................................................................ 63
Table 26: Age (in weeks) of giving the first and repeat doses of vaccine .............................................. 64
Table 27: Primary source of vaccine for each disease ........................................................................... 65
Table 28: Farms’ poultry health services suppliers (proportion of farmers) (By type of farm) ................ 66
Table 29: Frequency of health service providers’ providing poultry services for the farm ..................... 67
Table 30: Trustworthiness of Health Services Suppliers (proportion of farmers who consider the suppliers to be most trustworthy) (By type of farm) ................................................................ 68
Table 31: Important factors for good poultry health (proportion of farmers) ........................................... 69
Table 32: Frequency of brushing (proportion of farmers) ....................................................................... 70
Poultry Producer Survey 7
Table 33: Frequency of washing (proportion of farmers) ....................................................................... 70
Table 34: Frequency of disinfecting (proportion of farmers) ................................................................... 71
Table 35: Poultry disposal methods off the farm (proportion of farms) .................................................. 74
Table 36: Proportion of farmers responded the number of AI outbreak happened in their commune ... 77
Table 37: Proportion of farmers’ reporting treatment seeking when they are sick after handling sick or dead poultry (By type of farm) ................................................................................................ 93
8 Poultry Producer Survey
LIST OF FIGURES
Figure 1: Objectives ............................................................................................................................... 12 Figure 2: Survey locations ..................................................................................................................... 13 Figure 3: Research methodology ........................................................................................................... 15 Figure 4: Research Process .................................................................................................................. 20 Figure 5: Gender .................................................................................................................................... 21 Figure 6: Proportion of type of farms included in the ............................................................................. 23 Figure 7: Percentage of each species or animals at present in poultry farms (By provinces)............... 24 Figure 8: Farm management- proportion of birds by different types of management system- Chicken
Farms ...................................................................................................................................... 28 Figure 9: Percentage of farms grazing ducks on the rice fields (By provinces) .................................... 31 Figure 10: Percentage of farms grazing ducks on the rice fields (By income coming from poultry
farming) ................................................................................................................................... 32 Figure 11: Proportion of kinds of rice fields which duck flocks access (By income coming from poultry
farming) ................................................................................................................................... 33 Figure 12: The proportion of poultry farms raising chickens and ducks for meat and egg production .... 34 Figure 13: Proportion of farms having birds originated from eggs laid and hatched on the farm or on
another farm ........................................................................................................................... 35 Figure 14: Proportion of farms purchase their day-old birds from a hatchery or from a dealer/contract
supplier ................................................................................................................................... 35 Figure 15: Proportion of farms purchase their older birds from a dealer or from another farmers .......... 36 Figure 16: Origin of birds for meat production (proportion of farms) (By provinces) ............................... 36 Figure 17: Meat chicken and meat duck consumption (proportion of farms) (By provinces) .................. 37 Figure 18: Origin of birds for egg production (proportion of farms) (By provinces) ................................. 38 Figure 19: Chicken and duck egg destination .......................................................................................... 39 Figure 20: Destination of birds at the end of the production cycle (By provinces) .................................. 40 Figure 21: Proportion of vehicle ownership delivering feed to the poultry farm by provinces ................. 42 Figure 22: Proportion of vehicle ownership delivering feed to the poultry farm by types of farms .......... 43 Figure 23: Proportion of farmers whose family living on the poultry farm (By provinces) ...................... 44 Figure 24: Proportion on the ownership of vehicles used to collect birds or eggs from the farm (By
provinces) ............................................................................................................................... 45 Figure 25: Proportion of vehicle ownership of vehicles used to collect birds or eggs from the farm meat
and egg production ................................................................................................................. 45 Figure 26: Proportion of poultry farms in which vehicles used to deliver production visited other farms
where birds are raised ............................................................................................................ 46 Figure 27: Proportion of poultry farms in which vehicles used to deliver production visited other farms
where birds are raised ............................................................................................................ 47 Figure 28: Number of different brokers/trader/buyers each poultry farmer deals with (By provinces) .... 48 Figure 29: Number of different brokers/trader/buyers each poultry farmer deals with (Type of farm) .... 48 Figure 30: Proportion of the farm where the broker/trader/collector/buyer entering the poultry housing
area when selecting birds (By provinces) ............................................................................... 49 Figure 31: The way brokers/traders/buyers determine the weight of the birds for purchase among the
chicken farms .......................................................................................................................... 51
Poultry Producer Survey 9
Figure 32: The way brokers/traders/buyers determine the weight of the birds for purchase among the chicken farms .......................................................................................................................... 52
Figure 33: Proportion on the ways brokers/traders/buyers determine the weight of the birds for purchase (By income coming from poultry farm) .................................................................... 53
Figure 34: Proportion of farmers reporting bio-security practices of Broker/trader/collector/buyer when he enters duck farms .............................................................................................................. 54
Figure 35: Proportion on income coming from poultry farming among the chicken farms ..................... 57 Figure 36: Proportion of farmers who aware of poultry diseases ........................................................... 60 Figure 37: Perception of the seriousness/importance of poultry diseases to their farms (proportion of
farmers)................................................................................................................................... 61 Figure 38: Proportion of farmers who applied vaccination program for each poultry disease (By
provinces) ............................................................................................................................... 63 Figure 39: Vaccine Administration Route for each type of disease ......................................................... 65 Figure 40: Farms’ poultry health services suppliers (proportion of farmers) ........................................... 66 Figure 41: Trustworthiness of Health Services Suppliers (proportion of farmers who consider the
suppliers to be trustworthy)..................................................................................................... 67 Figure 42: Percentage of farms having disinfectant footbaths at the entrance to the poultry housing
area ......................................................................................................................................... 71 Figure 43: Percentage of farms having disinfectant footbaths at the entrance to the poultry housing
area (By income coming from the poultry farming) ................................................................ 72 Figure 44: Proportion of poultry disposal methods on the farm ............................................................... 73 Figure 45: Reporting of bird losses (Proportion of farms) (By type of farm) ............................................ 74 Figure 46: Proportion of farmers who report whether sick birds/birds that cannot be sold are returned to
farm (By type of farm) ............................................................................................................. 75 Figure 47: Proportion of farmers who reported that AI outbreak happened in their commune ............... 76 Figure 48: Proportion of farmers who have experiences with AI in their own flock ................................. 77 Figure 49: Perceptions about HPAI- Risk perception .............................................................................. 80 Figure 50: Perceptions about HPAI-Status of HPAI ................................................................................ 81 Figure 51: Perceptions about HPAI-Poultry Helath ................................................................................ 82 Figure 52: Perceptions about HPAI-Poultry vulnerability ......................................................................... 82 Figure 53: Perceptions about HPAI-Poultry Productivity ......................................................................... 83 Figure 54: Percentage of farmers using the present HPAI vaccination program provided by the AHW in
chicken and duck farms .......................................................................................................... 85 Figure 55: Percentage of farmers using the present HPAI vaccination program provided by the AHW
(By type of farm) ..................................................................................................................... 85 Figure 56: Reasons for using the present HPAI vaccination program provided by the AHW (proportion
of farmers) .............................................................................................................................. 86 Figure 57: Reasons for not using the present HPAI vaccination program provided by the AHW
(proportion of farmers) ............................................................................................................ 86 Figure 58: Proportion of farmers who know that there were changes in HPAI vaccination program of
their farms ............................................................................................................................... 87 Figure 59: Awareness of the type of change in HPAI vaccination program of poultry farms (proportion of
farmers)................................................................................................................................... 87 Figure 60: Proportion of farmers who agree/completely agree that they have received many trainings on
HPAI since 2004 ..................................................................................................................... 88 Figure 61: Proportion of farmers who agree/completely agree that their poultry has been vaccinated
more often since 2004 ............................................................................................................ 89
10 Poultry Producer Survey
Figure 62: Proportion of farmers who agree/completely agree that they keep their poultry under confinement more since 2004 ................................................................................................ 90
Figure 63: Proportion of farmers who agree/completely agree that they clean the poultry area more since 2004 .............................................................................................................................. 90
Figure 64: Proportion of farmers who agree/completely agree that they prevent direct handling of poultry more since 2004 ......................................................................................................... 91
Figure 65: Proportion of farmers who agree/completely agree that they wash hands with soap more since 2004 .............................................................................................................................. 92
Figure 66: Proportion of farmers’ reporting treatment seeking whe n they are sick after handling sick or dead poultry (By provinces) .................................................................................................... 92
Figure 67: Proportion of farmers who agree/completely agree that they adhere to bio-security more after 2004 ................................................................................................................................ 93
Figure 68: Proportion of farmers who agree/completely agree that they report sick and dead poultry more after 2004 ...................................................................................................................... 94
Figure 69: Proportion of farmers exposed to different types of public information on HPAI.................... 95 Figure 70: Different sources of the HPAI information in Five GETs Provinces (proportion of farmers) .. 96 Figure 71: Proportion on sources of the HPAI information ...................................................................... 97 Figure 72: Proportion on accessible sources of HPAI information .......................................................... 97 Figure 73: Proportion of farmers who reported the need for more information on HPAI ......................... 98 Figure 74: Further information required (proportion of farmers) .............................................................. 99
Poultry Producer Survey 11
1.INTRODUCTION
1.1. BACKGROUND
Since the winter of the year 2003 – 2004, outbreaks of the Highly Pathogenic Avian Influenza (HPAI) have been reported in several South-East Asian countries. In which, Vietnam was among the worst affected countries by the Avian Influenza outbreak. While Vietnam has been practicing the vaccination of poultry twice a year (October and April) since the autumn of 2005 to control the HPAI H5N1 epidemic with some considerable empirical evidence of success, it has been recognized that this control strategy is not sustainable over the whole country as mass vaccination has large impacts on finances as well as human resources. Therefore, alternative control strategies need to be devised as Vietnam moves from initial emergency measures to a period of consolidation and ultimately on to the stated aim of control/eradication beyond 2010.
Gathering Evidence for a Transitional Strategy (GETS) implemented by the Food and Agriculture Organization of the United Nations (FAO) with financial assistance from USAID is to provide field data by testing a number of alternative strategies including differing vaccination strategies and the complimentary strategy of improved surveillance.
1.2. OBJECTIVES
The purpose of the GETS project is to assist the Government of Vietnam in transitioning from the current national, mass vaccination of poultry to more cost-effective and targeted measures for sustained control of HPAI.
The GETS strategy includes
Trial of alternative vaccination strategies in both high and low risk pilot provinces; Manage risk with a package of ancillary disease control measures; and Gather comprehensive field data using a multidisciplinary approach. GETS looks at alternative vaccination strategies in both high and low risk provinces for HPAI
H5N1 (High risk are Nam Dinh, Ninh Binh, Soc Trang and Hau Giang provinces; low risk is Quang Binh province). The GETS project is trialing a number of alternative targeted vaccination strategies in five high
and low risk provinces (Nam Dinh, Ninh Binh, Quang Binh, Soc Trang, Hau Giang) for Highly Pathogenic Avian Influenza (HPAI) H5N1. It uses a multidisciplinary approach to gather data consisting of a vaccine strategic intervention that incorporates public awareness, training and surveillance field activities, a cost effectiveness component, a sociological behavioral component and a policy analysis component.
To complement these vaccination intervention studies, a number of components are being carried out of which a Sociological Behavior is to
1. Understand the reaction and possible acceptance of a change in vaccine strategy, 2. Understand how farmers use and integrate vaccination into their farming strategy and how this can change as well as the implication of it, 3. Monitor farmers’ perception and behavior change. This survey therefore is a part of Sociological Behavior component sharing the same stated objectives.
12 Poultry Producer Survey
In this context TNS, a leader in Public and Social research – both in Vietnam and on a global level – we would like to present our understanding of objectives, and propose a methodology, implementation and project team for the poultry industry survey.
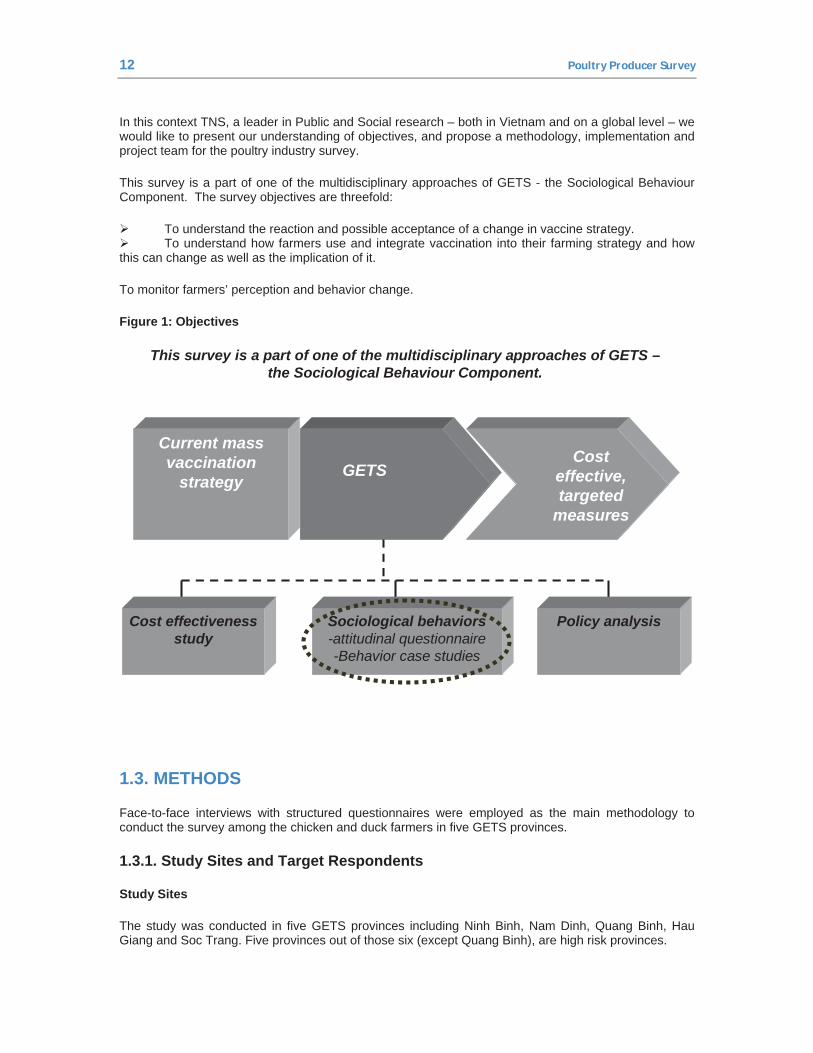
This survey is a part of one of the multidisciplinary approaches of GETS - the Sociological Behaviour Component. The survey objectives are threefold:
To understand the reaction and possible acceptance of a change in vaccine strategy. To understand how farmers use and integrate vaccination into their farming strategy and how
this can change as well as the implication of it.
To monitor farmers’ perception and behavior change.
Figure 1: Objectives
Current mass vaccination
strategyGETS
Cost effective, targeted
measures
Cost effectiveness study
Sociological behaviors-attitudinal questionnaire-Behavior case studies
Policy analysis
This survey is a part of one of the multidisciplinary approaches of GETS –the Sociological Behaviour Component.
1.3. METHODS
Face-to-face interviews with structured questionnaires were employed as the main methodology to conduct the survey among the chicken and duck farmers in five GETS provinces.
1.3.1. Study Sites and Target Respondents
Study Sites
The study was conducted in five GETS provinces including Ninh Binh, Nam Dinh, Quang Binh, Hau Giang and Soc Trang. Five provinces out of those six (except Quang Binh), are high risk provinces.
Poultry Producer Survey 13
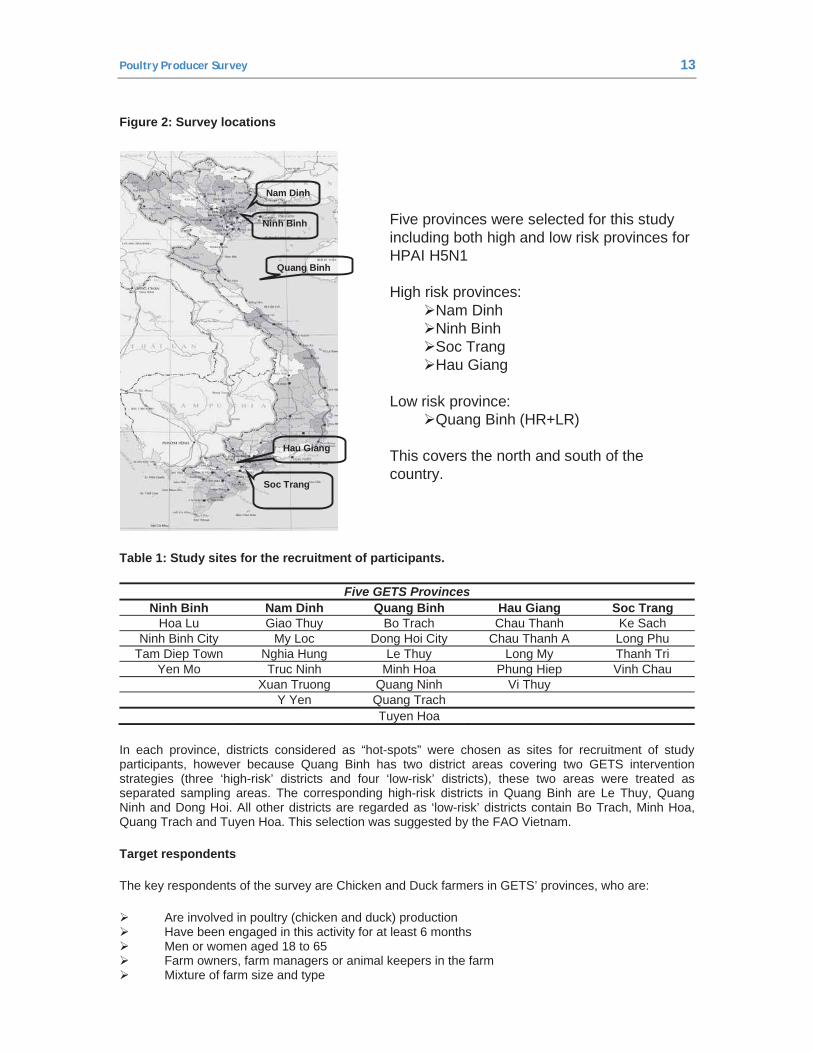
Figure 2: Survey locations
Nam Dinh
Ninh Binh
Quang Binh
Hau Giang
Soc Trang
Five provinces were selected for this study including both high and low risk provinces for HPAI H5N1
High risk provinces:Nam DinhNinh BinhSoc Trang Hau Giang
Low risk province:Quang Binh (HR+LR)
This covers the north and south of the country.
Table 1: Study sites for the recruitment of participants.
Five GETS Provinces Ninh Binh Nam Dinh Quang Binh Hau Giang Soc Trang
Hoa Lu Giao Thuy Bo Trach Chau Thanh Ke Sach Ninh Binh City My Loc Dong Hoi City Chau Thanh A Long Phu
Tam Diep Town Nghia Hung Le Thuy Long My Thanh Tri Yen Mo Truc Ninh Minh Hoa Phung Hiep Vinh Chau
Xuan Truong Quang Ninh Vi Thuy Y Yen Quang Trach Tuyen Hoa
In each province, districts considered as “hot-spots” were chosen as sites for recruitment of study participants, however because Quang Binh has two district areas covering two GETS intervention strategies (three ‘high-risk’ districts and four ‘low-risk’ districts), these two areas were treated as separated sampling areas. The corresponding high-risk districts in Quang Binh are Le Thuy, Quang Ninh and Dong Hoi. All other districts are regarded as ‘low-risk’ districts contain Bo Trach, Minh Hoa, Quang Trach and Tuyen Hoa. This selection was suggested by the FAO Vietnam.
Target respondents
The key respondents of the survey are Chicken and Duck farmers in GETS’ provinces, who are:
Are involved in poultry (chicken and duck) production Have been engaged in this activity for at least 6 months Men or women aged 18 to 65 Farm owners, farm managers or animal keepers in the farm Mixture of farm size and type
14 Poultry Producer Survey
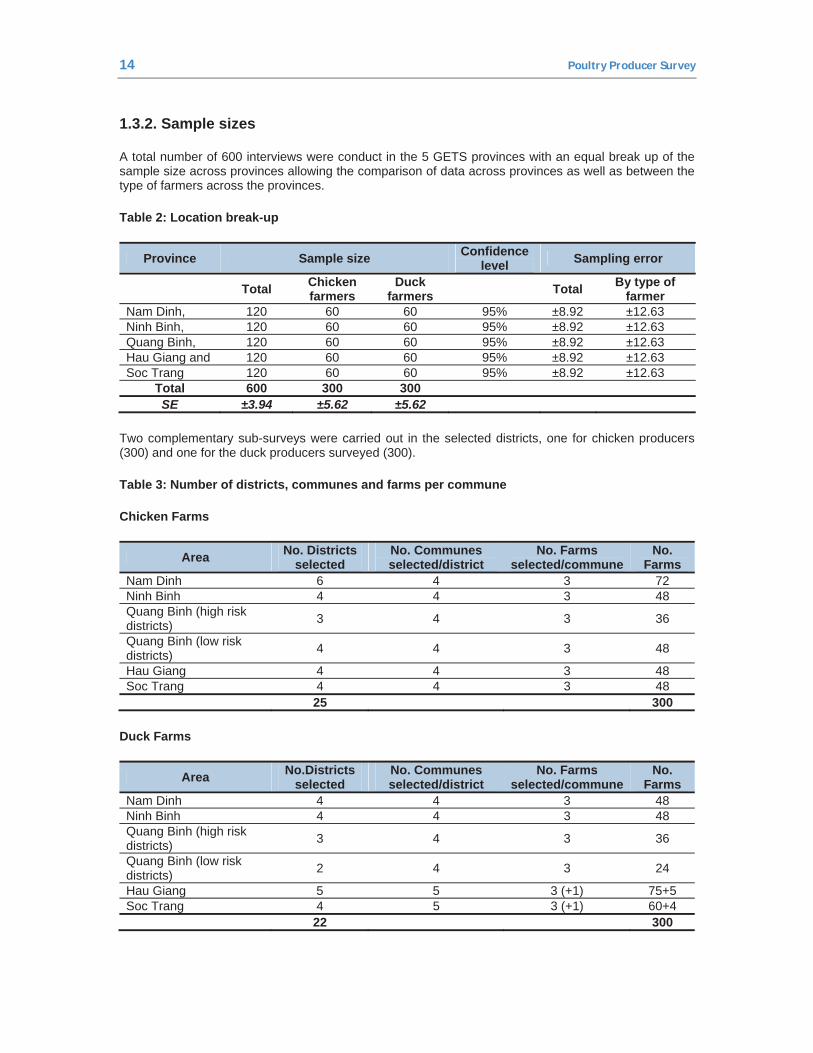
1.3.2. Sample sizes
A total number of 600 interviews were conduct in the 5 GETS provinces with an equal break up of the sample size across provinces allowing the comparison of data across provinces as well as between the type of farmers across the provinces.
Table 2: Location break-up
Province Sample size Confidence level Sampling error
Total Chicken farmers
Duck farmers Total By type of
farmer Nam Dinh, 120 60 60 95% ±8.92 ±12.63 Ninh Binh, 120 60 60 95% ±8.92 ±12.63 Quang Binh, 120 60 60 95% ±8.92 ±12.63 Hau Giang and 120 60 60 95% ±8.92 ±12.63 Soc Trang 120 60 60 95% ±8.92 ±12.63
Total 600 300 300 SE ±3.94 ±5.62 ±5.62
Two complementary sub-surveys were carried out in the selected districts, one for chicken producers (300) and one for the duck producers surveyed (300).
Table 3: Number of districts, communes and farms per commune
Chicken Farms
Area No. Districts selected
No. Communes selected/district
No. Farms selected/commune
No. Farms
Nam Dinh 6 4 3 72 Ninh Binh 4 4 3 48 Quang Binh (high risk districts) 3 4 3 36
Quang Binh (low risk districts) 4 4 3 48
Hau Giang 4 4 3 48 Soc Trang 4 4 3 48
25 300
Duck Farms
Area No.Districts selected
No. Communes selected/district
No. Farms selected/commune
No. Farms
Nam Dinh 4 4 3 48 Ninh Binh 4 4 3 48 Quang Binh (high risk districts) 3 4 3 36
Quang Binh (low risk districts) 2 4 3 24
Hau Giang 5 5 3 (+1) 75+5 Soc Trang 4 5 3 (+1) 60+4
22 300
Poultry Producer Survey 15
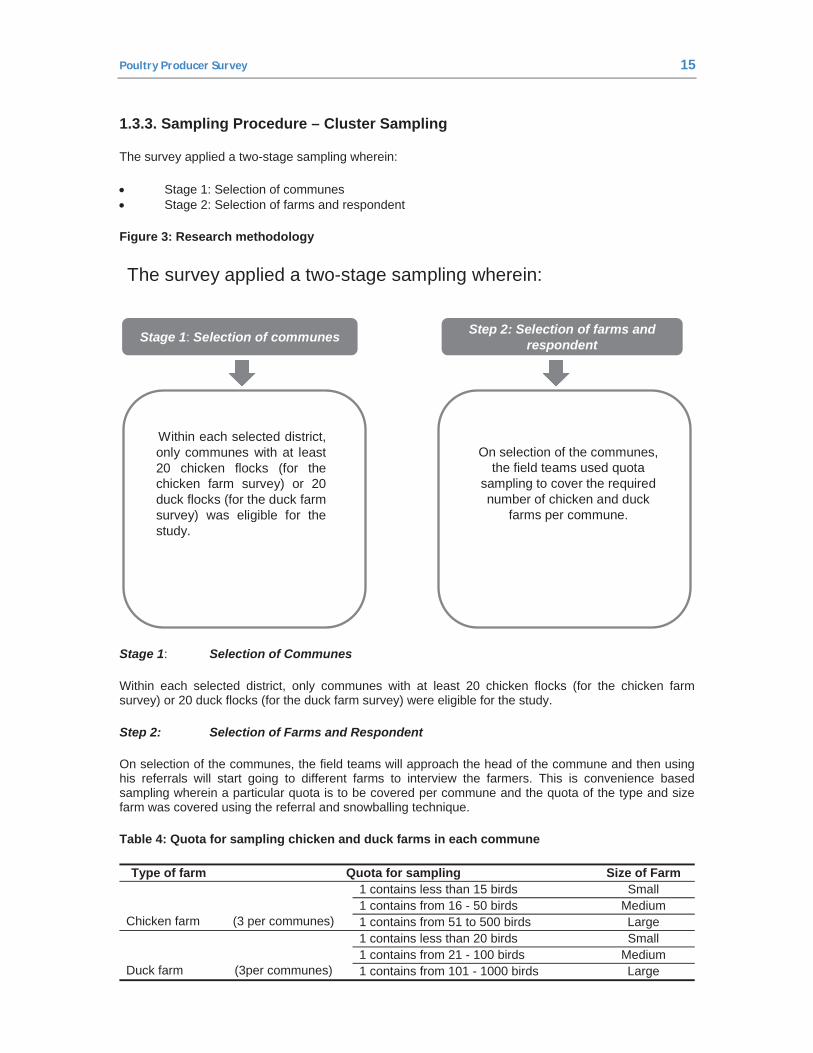
1.3.3. Sampling Procedure – Cluster Sampling
The survey applied a two-stage sampling wherein:
Stage 1: Selection of communes Stage 2: Selection of farms and respondent
Figure 3: Research methodology
The survey applied a two-stage sampling wherein:
4
Within each selected district, only communes with at least 20 chicken flocks (for the chicken farm survey) or 20 duck flocks (for the duck farm survey) was eligible for the study.
On selection of the communes, the field teams used quota
sampling to cover the required number of chicken and duck
farms per commune.
Step 2: Selection of farms and respondentStage 1: Selection of communes
Stage 1: Selection of Communes
Within each selected district, only communes with at least 20 chicken flocks (for the chicken farm survey) or 20 duck flocks (for the duck farm survey) were eligible for the study.
Step 2: Selection of Farms and Respondent
On selection of the communes, the field teams will approach the head of the commune and then using his referrals will start going to different farms to interview the farmers. This is convenience based sampling wherein a particular quota is to be covered per commune and the quota of the type and size farm was covered using the referral and snowballing technique.
Table 4: Quota for sampling chicken and duck farms in each commune
Type of farm Quota for sampling Size of Farm
Chicken farm
(3 per communes)
1 contains less than 15 birds Small 1 contains from 16 - 50 birds Medium 1 contains from 51 to 500 birds Large
Duck farm
(3per communes)
1 contains less than 20 birds Small 1 contains from 21 - 100 birds Medium 1 contains from 101 - 1000 birds Large
16 Poultry Producer Survey
If a particular commune does not contain a farm of any of the strata, the missing farm will be sampled from that commune in the district with the next sequential commune code.
Farms that have both ducks and chickens (mixed farms) were defined by the species of which they have a larger number of birds and cannot be included in both surveys.
1.4. KEY INDICATORS
Characteristics of the poultry farm Grazing duck management Annual production capacity of the poultry farm Farm management Origins and type of birds Egg Production Product Inputs Production Outputs Business Constraints Important Poultry Diseases Vaccination Program Poultry health services Labor capacity Avian Influenza Outbreak Experience Attitudes towards the Vaccination Intervention
1.5. DATA COLLECTION
1.5.1. Questionnaire Development
FAO provided the research instruments for the quantitative phase which will be further modified and improved by TNS. Questionnaires were drafted covering all of the basic indicators described. The questionnaire was at first translated into Vietnamese and then back-translated into English to assure that the translations are accurate. All measures were adopted to prevent data loss in the process of questionnaire translations.
The research instruments were pre-tested through the pilot interviews which took placed in three communes randomly selected in Ninh Binh and Hau Giang.
Adjustments and revisions were made to the structure, language use and wording. All the learning’s were documented and shared with the client and final versions of the questionnaires were prepared with the mutual agreement from FAO.
These were about 45 pages and took approximately an hour to administer. Every questionnaire included a unique identification number (ID).
1.5.2. Recruitment of Interviewers and Supervisors
The selection of interviewers was done from the pool of talented resources who have been working with TNS for a long period of time.
TNS conducted the fieldwork in adherence to our quality of standards. We mobilized several fieldwork teams of interviewers. Each team of interviewers was led by a senior field supervisor and traveled to the sampled province and remained there until field work completion.
Poultry Producer Survey 17
Furthermore, no matter how experienced the interviewers are, the training courses were provided before field implementation. They must be exposed to a rigorous training exercise.
1.5.3. Training
Once the research tools and the sampling of the sites are finalized, the next step is to prepare the field interviewers for conducting the study. Keeping with the nature of the data collection methods (including selection of the respondents and method of interviewing them) it is extremely important to subject the field teams to a very rigorous training exercise.
The trainings covered several topics including interviewing skills, introduction questionnaires, experience and guidance in reaching target respondents and were conducted in a participatory manner. In addition to familiarity and practice in filling out the survey forms, interviewers and supervisors were trained in different sampling techniques like snowballing and quota sampling. They were also given adequate practice in coding the questionnaires. All the trainees had opportunities for role-playing and for discussion with researchers and FAO staff from on-going intervention programs.
There were two training sessions in this survey. The first training session took place before the pilot exercise. After the pilot study, the questionnaire needed to be fine-tuned once more where necessary. Another training session took place before the main field work with the finalized questionnaire which incorporated changes from the pilot study. Training will include the following:
Introduction to FAO Sensitization with regard to AI (especially if there has been a recent outbreak) Questionnaire briefing Mock calls and role play (to practice introducing self, study objectives and seeking consent) Dry-run-interviewers practicing to fill out the questionnaire in pairs with the observation of supervisors.
1.5.4. Pilot
A pilot exercise was conducted in ten randomly sampled chicken and duck farms in Ninh Binh and Hau Giang in 9th July, 2010 before the fieldwork. These sites were not repeated in the main sample.
The main outcomes of the pilot exercise (that comprised of 10 interviews) were:
- The questionnaires were pre-tested to gauge the following issues in the local languages:
Flow of the questions Ease in administering the questionnaire Ease in understanding of the questions by the respondents Appropriateness of questions Comprehensiveness in terms of information coverage Skipping, additional instructions etc for field interviewers Identifying specific training requirements for field interviewers
- Helped detect and solve logistics issues that may arise during the actual fieldwork. - Helped liaise with local authorities - Helped the team members and supervisors understand their roles in the survey team.
Based on the pilot, further training needs were identified and included in the training session before the main survey.
18 Poultry Producer Survey
1.6. FIELDWORK PROCESS 1.6.1. Authorization
Before the teams went to the field, letters identifying the Survey as part of the GETS project were issued by the National Veterinary Health Department of Vietnam and FAO Vietnam. The field teams also contacted local authorities such as the Provincial and district level authorities to seek permission to conduct the study.
1.6.2. Fieldwork Structure
Each team was led by a supervisor who ensured that the completed surveys were checked for logic, incentives given, recruitment of eligible respondents etc. The field supervisor reported to the Field Manager who would directly communicate to the Research team on updates, issues etc.
1.6.3. Ethical Consideration
During fieldwork, it was ensured that ethics of research were adhered to. Ethical considerations are very important in research studies that require the participation of human participants. To this end, TNS followed all regulations or guidelines governing research ethics:
One of the most critical ethical guideline is the respect for persons participating in the survey. Respect for persons recognizes the capacity and rights of all individuals to make their own choices and decisions. It refers to the respect of the autonomy and self-determination of all human beings; acknowledging their dignity and freedom. The basic Principals governing the ethical conduct of research are informed consent. It was ensured that voluntary informed consent was obtained from the respondents. Informed consent would be obtained from the respondent if he/she:
- Has received the necessary information and has adequately understood this information: It is essential that the information provided is understood by the potential participant and empowers that person to make a voluntary decision about whether or not to participate in the study. To this end, the interviewers explained the scope and purpose of the study; - Has the capacity to consent; - Has arrived at a decision without having been subjected to coercion, undue influence or inducement, or intimidation; and - Has comprehended the risks and benefits involved if any in participating.
Essential Elements of Informed Consent
In order to ensure that a research participant receives the necessary information to make an informed decision, the participant was provided with:
- Description of the research and participant’s participation - Explanation of confidentiality - Whom to contact about the research and participants’ rights - Explanation that participation is voluntary
Description of the Research
The purpose or objectives of the research were presented, explaining what new information the study is seeking to obtain. The anticipated duration and the expected participant responsibilities of the study were clearly stated and agreed upon by participants.
Confidentiality
Confidentiality of the information was also ensured and conveyed to the respondent’s Special attention to confidentiality is important when public knowledge of participation is potentially damaging.
Poultry Producer Survey 19
Compensation to the Respondent
Clear information was provided about any compensation that may be available to the participant if a problem arises during the study.
Voluntary Participation
In the informed consent form, it was stated that participation is voluntary. It was stated that participants are free to withdraw or refuse to participate in the survey. It was clearly communicated that desire to withdraw from the study or refusal to participate would not result in any penalties or loss of benefits to which the participant is otherwise entitled.
Privacy during the Interview
To ensure comfort of the respondents as well as to reduce bias, the interviews were conducted without disturbance from their family and peers.
The Process of Obtaining Informed Consent
The process of obtaining informed consent was an interactive communication process between the researcher and the participant that started before the research was initiated and continued throughout the study.
Initial 5 minutes of the conversation was focused on convincing the respondents on the nature of the study and developed comfort levels by clarifying the issues the respondents might have with the nature of the data requirement.
Once the respondent gave verbal consent to the interview, the interviewer signed his/ her name indicating the verbal informed consent has been given.
1.7. QUALITY CONTROL
Each interviewer was required to mark down all contacts made on a contact sheet and trace his/her route on a map. Thus, when the quality control team checked the interviews, they could find the respondents and verify and validate the quality of the interview.
Each questionnaire was checked for logic and completion. In addition, each interviewer was observed at least once during the fieldwork period. Accompanying each team was a part-time quality controller, whose task was to carry out at least 20% physical back-check of all interviews, which is the benchmark in the industry. Generally, the Quality Control team re-asked some of the key questions to validate interview acceptance.
TNS Vietnam is the only Research Company in Vietnam to have been awarded QCSI accreditation, independently audited by Ernst & Young Australia, and granted in 1999. The system is audited annually before certification is extended. This means that our fieldwork team follows very rigid and structured steps to assure that all fieldwork meets or exceeds ESOMAR standards.
1.8. DATA PROCESSING AND ANALYSIS
Coding and Data Entry
Once quality controlled questionnaires were received from the Field Department, a full-time coder coded and entered the data.
20 Poultry Producer Survey
Data Checks
Coding and data punching are also quality controlled. At a minimum, 10% of the coded questionnaires per coder per day were back-checked by the team supervisor
Data Analysis
TNS mainly uses Surveycraft and SPSS (Statistical Package for Social Sciences) for data processing. TNS validated 100 % of questionnaires using range checks and logical checks written into the data entry specifications.
All data was analyzed in accordance with the tabulation plan finalized in consultation with the client.
For the study, coding of the open-ended questions was done by the interviewers during the data collection exercise under the supervision of the team leaders. All data were coded, punched, cleaned and validated before being subjected to analysis.
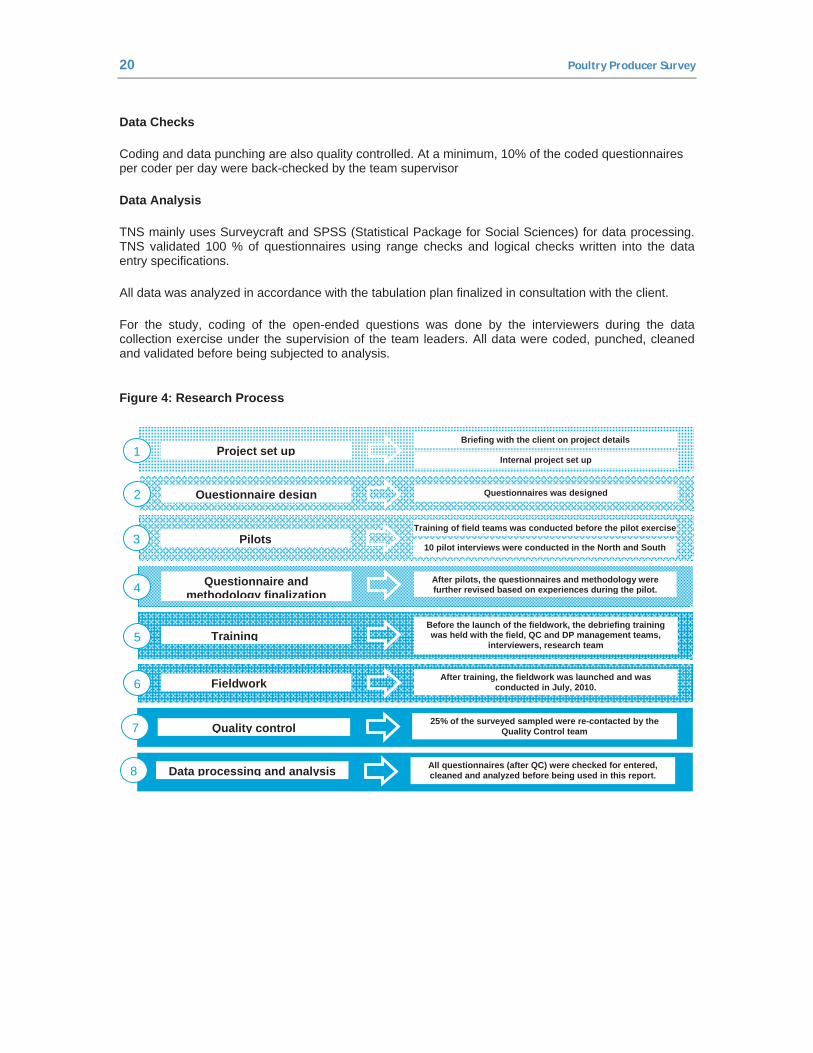
Figure 4: Research Process
Questionnaire design Questionnaires was designed 2
Questionnaire and methodology finalization
After pilots, the questionnaires and methodology were further revised based on experiences during the pilot.4
All questionnaires (after QC) were checked for entered, cleaned and analyzed before being used in this report. Data processing and analysis 8
Training Before the launch of the fieldwork, the debriefing training was held with the field, QC and DP management teams,
interviewers, research team 5
Project set up Briefing with the client on project details
1 Internal project set up
Pilots Training of field teams was conducted before the pilot exercise
3 10 pilot interviews were conducted in the North and South
25% of the surveyed sampled were re-contacted by the Quality Control team Quality control 7
Fieldwork After training, the fieldwork was launched and was conducted in July, 2010. 6
Poultry Producer Survey 21
2. REPORT FINDINGS
2.1. RESPONDENT PROFILE
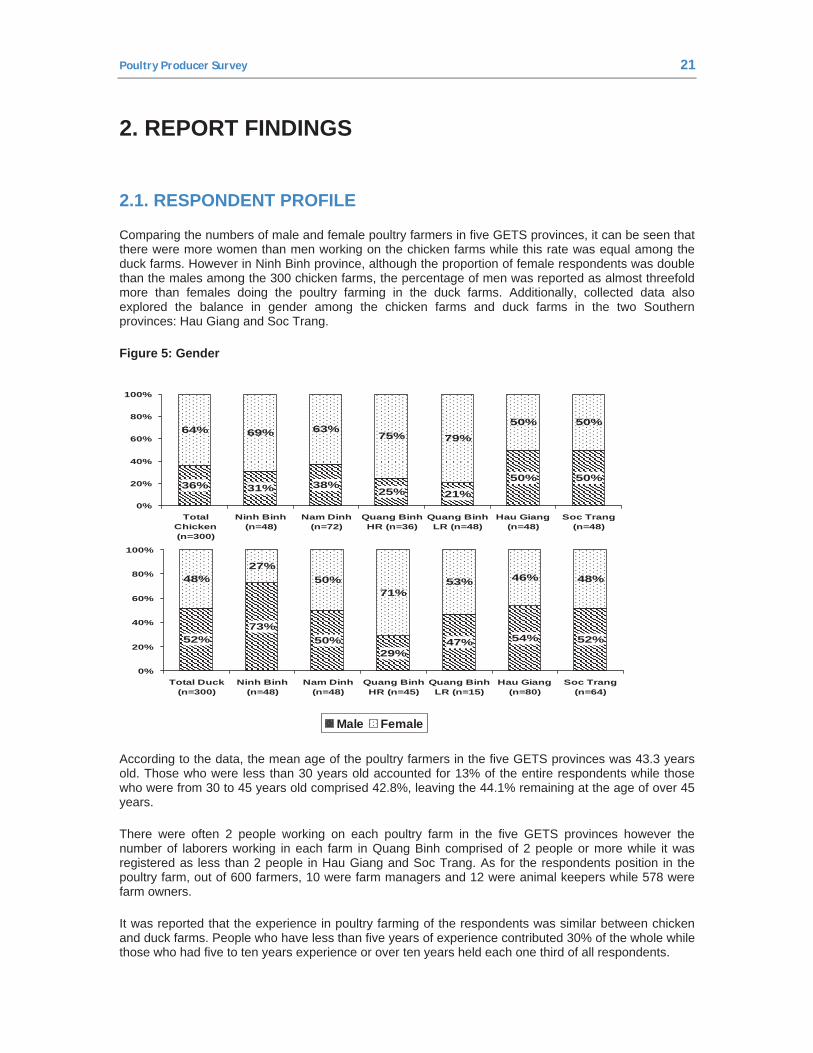
Comparing the numbers of male and female poultry farmers in five GETS provinces, it can be seen that there were more women than men working on the chicken farms while this rate was equal among the duck farms. However in Ninh Binh province, although the proportion of female respondents was double than the males among the 300 chicken farms, the percentage of men was reported as almost threefold more than females doing the poultry farming in the duck farms. Additionally, collected data also explored the balance in gender among the chicken farms and duck farms in the two Southern provinces: Hau Giang and Soc Trang.
Figure 5: Gender
36% 31% 38%25% 21%
50% 50%
64% 69% 63%75% 79%
50% 50%
0%
20%
40%
60%
80%
100%
TotalChicken(n=300)
Ninh Binh(n=48)
Nam Dinh(n=72)
Quang BinhHR (n=36)
Quang BinhLR (n=48)
Hau Giang(n=48)
Soc Trang(n=48)
52%73%
50%29%
47% 54% 52%
48%27%
50%71%
53% 46% 48%
0%
20%
40%
60%
80%
100%
Total Duck(n=300)
Ninh Binh(n=48)
Nam Dinh(n=48)
Quang BinhHR (n=45)
Quang BinhLR (n=15)
Hau Giang(n=80)
Soc Trang(n=64)
Male Female
According to the data, the mean age of the poultry farmers in the five GETS provinces was 43.3 years old. Those who were less than 30 years old accounted for 13% of the entire respondents while those who were from 30 to 45 years old comprised 42.8%, leaving the 44.1% remaining at the age of over 45 years.
There were often 2 people working on each poultry farm in the five GETS provinces however the number of laborers working in each farm in Quang Binh comprised of 2 people or more while it was registered as less than 2 people in Hau Giang and Soc Trang. As for the respondents position in the poultry farm, out of 600 farmers, 10 were farm managers and 12 were animal keepers while 578 were farm owners.
It was reported that the experience in poultry farming of the respondents was similar between chicken and duck farms. People who have less than five years of experience contributed 30% of the whole while those who had five to ten years experience or over ten years held each one third of all respondents.
22 Poultry Producer Survey
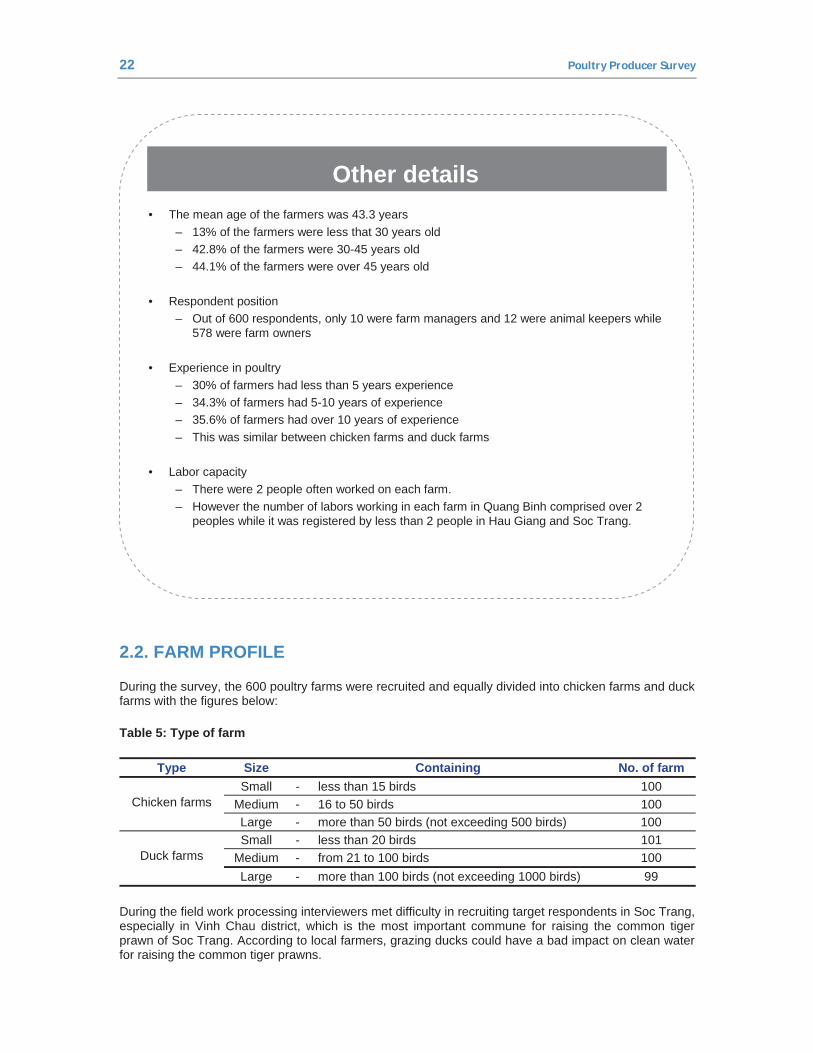
Other details • The mean age of the farmers was 43.3 years
– 13% of the farmers were less that 30 years old– 42.8% of the farmers were 30-45 years old– 44.1% of the farmers were over 45 years old
• Respondent position– Out of 600 respondents, only 10 were farm managers and 12 were animal keepers while
578 were farm owners
• Experience in poultry – 30% of farmers had less than 5 years experience – 34.3% of farmers had 5-10 years of experience– 35.6% of farmers had over 10 years of experience– This was similar between chicken farms and duck farms
• Labor capacity– There were 2 people often worked on each farm. – However the number of labors working in each farm in Quang Binh comprised over 2
peoples while it was registered by less than 2 people in Hau Giang and Soc Trang.
2.2. FARM PROFILE
During the survey, the 600 poultry farms were recruited and equally divided into chicken farms and duck farms with the figures below:
Table 5: Type of farm
Type Size Containing No. of farm
Chicken farms Small - less than 15 birds 100
Medium - 16 to 50 birds 100 Large - more than 50 birds (not exceeding 500 birds) 100
Duck farms
Small - less than 20 birds 101 Medium - from 21 to 100 birds 100 Large - more than 100 birds (not exceeding 1000 birds) 99
During the field work processing interviewers met difficulty in recruiting target respondents in Soc Trang, especially in Vinh Chau district, which is the most important commune for raising the common tiger prawn of Soc Trang. According to local farmers, grazing ducks could have a bad impact on clean water for raising the common tiger prawns.
Poultry Producer Survey 23
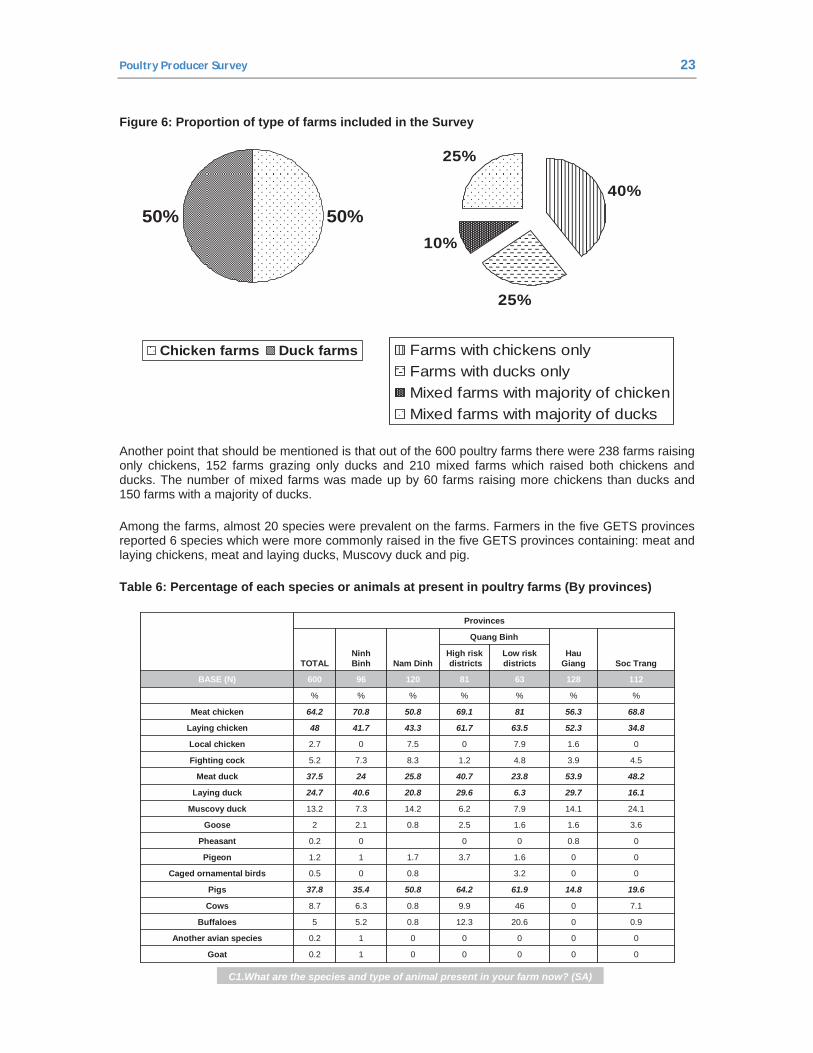
Figure 6: Proportion of type of farms included in the Survey
50%50%
Chicken farms Duck farms
40%
25%
10%
25%
Farms with chickens onlyFarms with ducks onlyMixed farms with majority of chickenMixed farms with majority of ducks
Another point that should be mentioned is that out of the 600 poultry farms there were 238 farms raising only chickens, 152 farms grazing only ducks and 210 mixed farms which raised both chickens and ducks. The number of mixed farms was made up by 60 farms raising more chickens than ducks and 150 farms with a majority of ducks.
Among the farms, almost 20 species were prevalent on the farms. Farmers in the five GETS provinces reported 6 species which were more commonly raised in the five GETS provinces containing: meat and laying chickens, meat and laying ducks, Muscovy duck and pig.
Table 6: Percentage of each species or animals at present in poultry farms (By provinces)
21C1.What are the species and type of animal present in your farm now? (SA)
0000010.2Goat
0000010.2Another avian species
0.9020.612.30.85.25Buffaloes
7.10469.90.86.38.7Cows
19.614.861.964.250.835.437.8Pigs
003.20.800.5Caged ornamental birds
001.63.71.711.2Pigeon
00.80000.2Pheasant
3.61.61.62.50.82.12Goose
24.114.17.96.214.27.313.2Muscovy duck
16.129.76.329.620.840.624.7Laying duck
48.253.923.840.725.82437.5Meat duck
4.53.94.81.28.37.35.2Fighting cock
01.67.907.502.7Local chicken
34.852.363.561.743.341.748Laying chicken
68.856.38169.150.870.864.2Meat chicken
%%%%%%%
112128638112096600BASE (N)
Low risk districts
High riskdistricts Soc Trang
HauGiang
Quang Binh
Nam DinhNinhBinhTOTAL
Provinces
24 Poultry Producer Survey
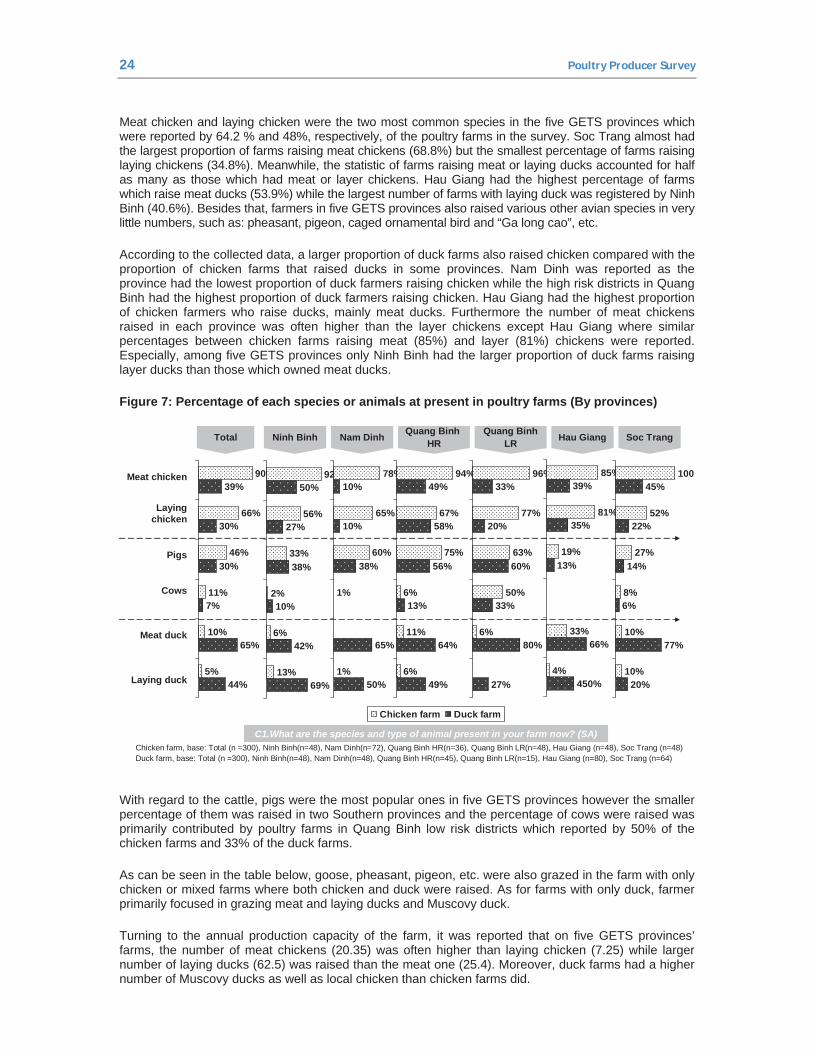
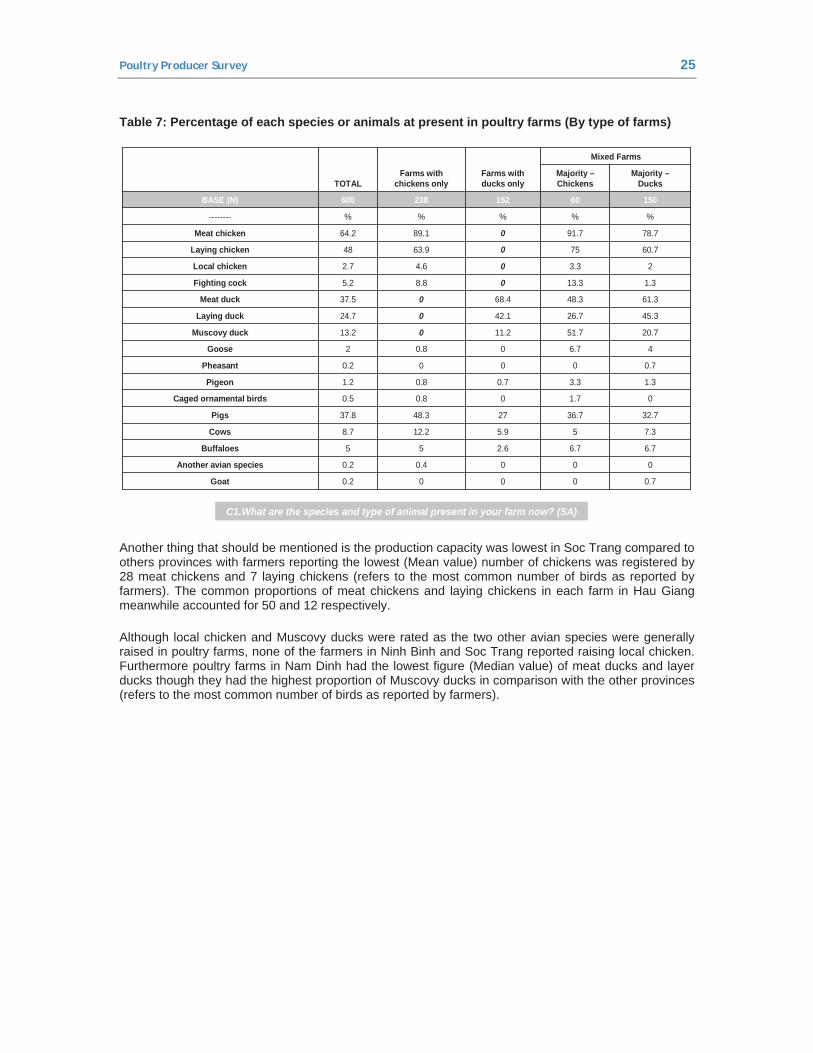
Meat chicken and laying chicken were the two most common species in the five GETS provinces which were reported by 64.2 % and 48%, respectively, of the poultry farms in the survey. Soc Trang almost had the largest proportion of farms raising meat chickens (68.8%) but the smallest percentage of farms raising laying chickens (34.8%). Meanwhile, the statistic of farms raising meat or laying ducks accounted for half as many as those which had meat or layer chickens. Hau Giang had the highest percentage of farms which raise meat ducks (53.9%) while the largest number of farms with laying duck was registered by Ninh Binh (40.6%). Besides that, farmers in five GETS provinces also raised various other avian species in very little numbers, such as: pheasant, pigeon, caged ornamental bird and “Ga long cao”, etc.
According to the collected data, a larger proportion of duck farms also raised chicken compared with the proportion of chicken farms that raised ducks in some provinces. Nam Dinh was reported as the province had the lowest proportion of duck farmers raising chicken while the high risk districts in Quang Binh had the highest proportion of duck farmers raising chicken. Hau Giang had the highest proportion of chicken farmers who raise ducks, mainly meat ducks. Furthermore the number of meat chickens raised in each province was often higher than the layer chickens except Hau Giang where similar percentages between chicken farms raising meat (85%) and layer (81%) chickens were reported. Especially, among five GETS provinces only Ninh Binh had the larger proportion of duck farms raising layer ducks than those which owned meat ducks.
Figure 7: Percentage of each species or animals at present in poultry farms (By provinces)
•Chicken farm, base: Total (n =300), Ninh Binh(n=48), Nam Dinh(n=72), Quang Binh HR(n=36), Quang Binh LR(n=48), Hau Giang (n=48), Soc Trang (n=48) •Duck farm, base: Total (n =300), Ninh Binh(n=48), Nam Dinh(n=48), Quang Binh HR(n=45), Quang Binh LR(n=15), Hau Giang (n=80), Soc Trang (n=64)
Ninh Binh Quang BinhHR Hau Giang
Chicken farm Duck farm
Total Nam Dinh Quang BinhLR Soc Trang
Laying duck
Meat duck
Cows
Pigs
Laying chicken
Meat chicken
5%
10%
11%
46%
66%
90%
44%
65%
7%
30%
30%
39%
13%
6%
2%
33%
56%
92%
69%
42%
10%
38%
27%
50%
1%
1%
60%
65%
78%
50%
65%
38%
10%
10%
6%
11%
6%
75%
67%
94%
49%
64%
13%
56%
58%
49%
6%
50%
63%
77%
96%
27%
80%
33%
60%
20%
33%
4%
33%
19%
81%
85%
450%
66%
13%
35%
39%
10%
10%
8%
27%
52%
100
20%
77%
6%
14%
22%
45%
C1.What are the species and type of animal present in your farm now? (SA)
With regard to the cattle, pigs were the most popular ones in five GETS provinces however the smaller percentage of them was raised in two Southern provinces and the percentage of cows were raised was primarily contributed by poultry farms in Quang Binh low risk districts which reported by 50% of the chicken farms and 33% of the duck farms.
As can be seen in the table below, goose, pheasant, pigeon, etc. were also grazed in the farm with only chicken or mixed farms where both chicken and duck were raised. As for farms with only duck, farmer primarily focused in grazing meat and laying ducks and Muscovy duck.
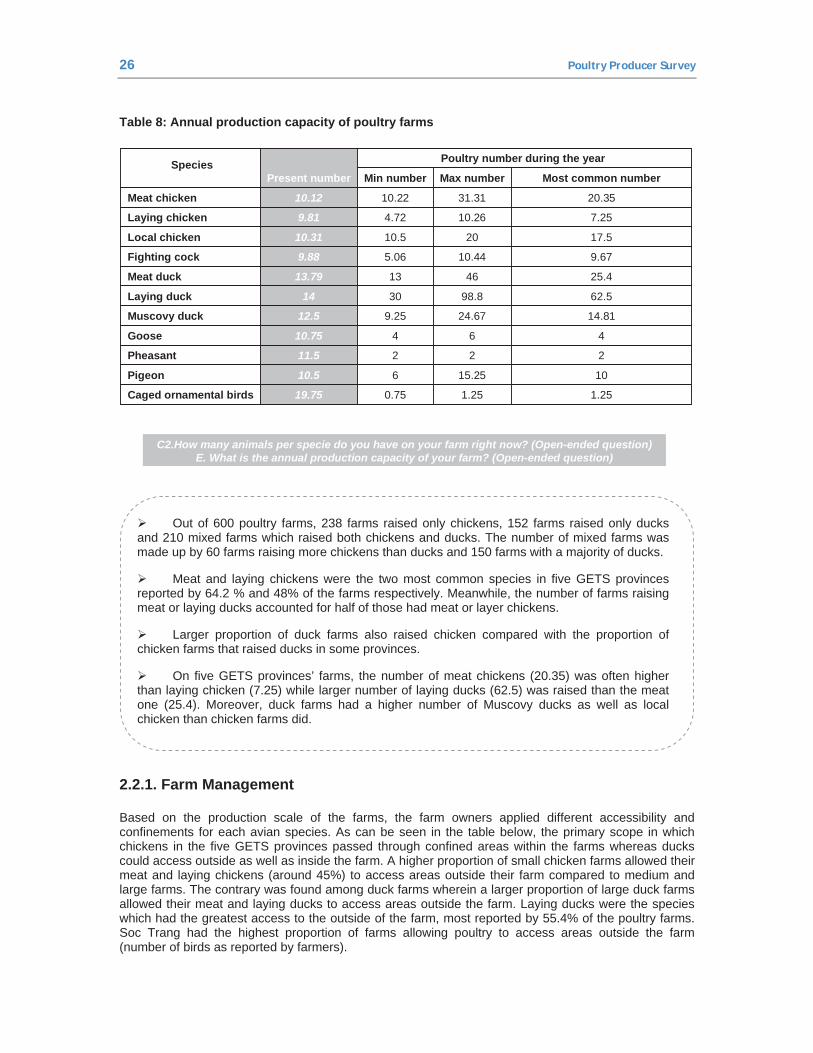
Turning to the annual production capacity of the farm, it was reported that on five GETS provinces’ farms, the number of meat chickens (20.35) was often higher than laying chicken (7.25) while larger number of laying ducks (62.5) was raised than the meat one (25.4). Moreover, duck farms had a higher number of Muscovy ducks as well as local chicken than chicken farms did.
Poultry Producer Survey 25
Table 7: Percentage of each species or animals at present in poultry farms (By type of farms)
0.70000.2Goat
0000.40.2Another avian species
6.76.72.655Buffaloes
7.355.912.28.7Cows
32.736.72748.337.8Pigs
01.700.80.5Caged ornamental birds
1.33.30.70.81.2Pigeon
0.70000.2Pheasant
46.700.82Goose
20.751.711.2013.2Muscovy duck
45.326.742.1024.7Laying duck
61.348.368.4037.5Meat duck
1.313.308.85.2Fighting cock
23.304.62.7Local chicken
60.775063.948Laying chicken
78.791.7089.164.2Meat chicken
%%%%%--------
15060152238600BASE (N)
Majority –Ducks
Majority –Chickens
Mixed Farms
Farms with ducks only
Farms with chickens onlyTOTAL
C1.What are the species and type of animal present in your farm now? (SA)
Another thing that should be mentioned is the production capacity was lowest in Soc Trang compared to others provinces with farmers reporting the lowest (Mean value) number of chickens was registered by 28 meat chickens and 7 laying chickens (refers to the most common number of birds as reported by farmers). The common proportions of meat chickens and laying chickens in each farm in Hau Giang meanwhile accounted for 50 and 12 respectively.
Although local chicken and Muscovy ducks were rated as the two other avian species were generally raised in poultry farms, none of the farmers in Ninh Binh and Soc Trang reported raising local chicken. Furthermore poultry farms in Nam Dinh had the lowest figure (Median value) of meat ducks and layer ducks though they had the highest proportion of Muscovy ducks in comparison with the other provinces (refers to the most common number of birds as reported by farmers).
26 Poultry Producer Survey
Table 8: Annual production capacity of poultry farms
1.251.250.7519.75Caged ornamental birds
1015.25610.5Pigeon
22211.5Pheasant
46410.75Goose
14.8124.679.2512.5Muscovy duck
62.598.83014Laying duck
25.4461313.79Meat duck
9.6710.445.069.88Fighting cock
17.52010.510.31Local chicken
7.2510.264.729.81Laying chicken
20.3531.3110.2210.12Meat chicken
Most common numberMax numberMin number
Poultry number during the year
Present numberSpecies
C2.How many animals per specie do you have on your farm right now? (Open-ended question)E. What is the annual production capacity of your farm? (Open-ended question)
Out of 600 poultry farms, 238 farms raised only chickens, 152 farms raised only ducks and 210 mixed farms which raised both chickens and ducks. The number of mixed farms was made up by 60 farms raising more chickens than ducks and 150 farms with a majority of ducks.
Meat and laying chickens were the two most common species in five GETS provinces reported by 64.2 % and 48% of the farms respectively. Meanwhile, the number of farms raising meat or laying ducks accounted for half of those had meat or layer chickens.
Larger proportion of duck farms also raised chicken compared with the proportion of chicken farms that raised ducks in some provinces.
On five GETS provinces’ farms, the number of meat chickens (20.35) was often higher than laying chicken (7.25) while larger number of laying ducks (62.5) was raised than the meat one (25.4). Moreover, duck farms had a higher number of Muscovy ducks as well as local chicken than chicken farms did.
2.2.1. Farm Management
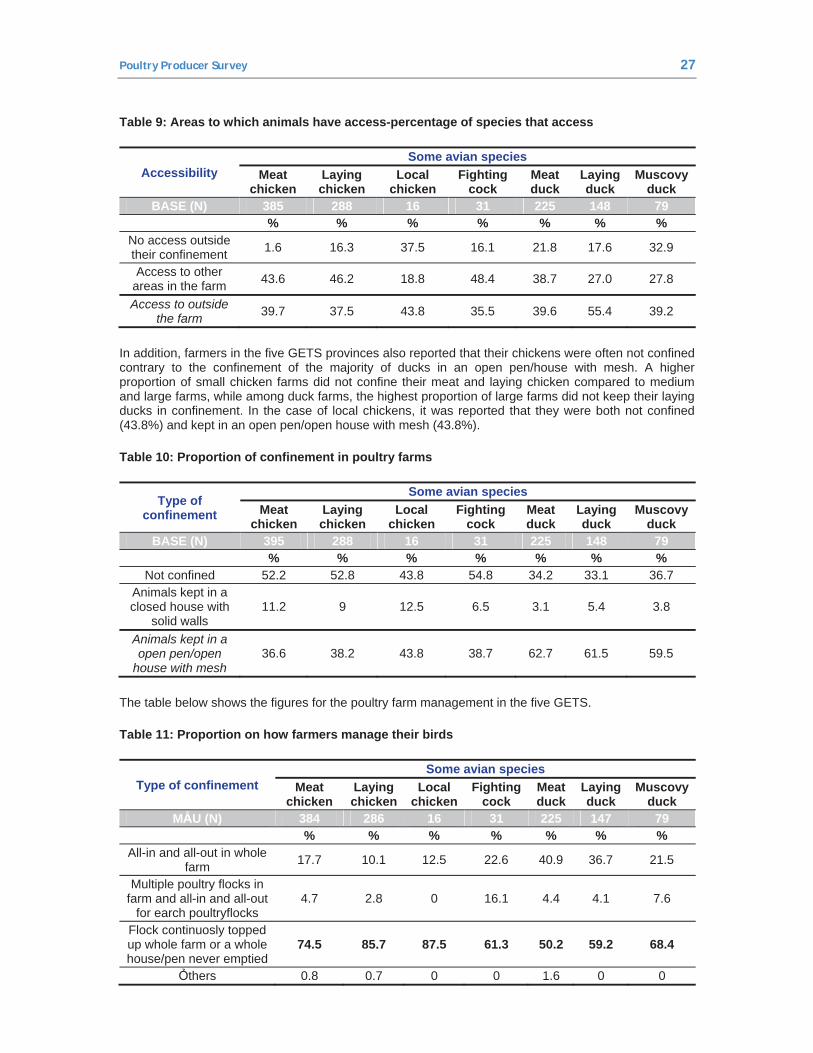
Based on the production scale of the farms, the farm owners applied different accessibility and confinements for each avian species. As can be seen in the table below, the primary scope in which chickens in the five GETS provinces passed through confined areas within the farms whereas ducks could access outside as well as inside the farm. A higher proportion of small chicken farms allowed their meat and laying chickens (around 45%) to access areas outside their farm compared to medium and large farms. The contrary was found among duck farms wherein a larger proportion of large duck farms allowed their meat and laying ducks to access areas outside the farm. Laying ducks were the species which had the greatest access to the outside of the farm, most reported by 55.4% of the poultry farms. Soc Trang had the highest proportion of farms allowing poultry to access areas outside the farm (number of birds as reported by farmers).
Poultry Producer Survey 27
Table 9: Areas to which animals have access-percentage of species that access
Accessibility Some avian species
Meat chicken
Laying chicken
Local chicken
Fighting cock
Meat duck
Laying duck
Muscovy duck
BASE (N) 385 288 16 31 225 148 79 % % % % % % %
No access outside their confinement 1.6 16.3 37.5 16.1 21.8 17.6 32.9
Access to other areas in the farm 43.6 46.2 18.8 48.4 38.7 27.0 27.8
Access to outside the farm 39.7 37.5 43.8 35.5 39.6 55.4 39.2
In addition, farmers in the five GETS provinces also reported that their chickens were often not confined contrary to the confinement of the majority of ducks in an open pen/house with mesh. A higher proportion of small chicken farms did not confine their meat and laying chicken compared to medium and large farms, while among duck farms, the highest proportion of large farms did not keep their laying ducks in confinement. In the case of local chickens, it was reported that they were both not confined (43.8%) and kept in an open pen/open house with mesh (43.8%).
Table 10: Proportion of confinement in poultry farms
Type of confinement
Some avian species Meat
chicken Laying chicken
Local chicken
Fighting cock
Meat duck
Laying duck
Muscovy duck
BASE (N) 395 288 16 31 225 148 79 % % % % % % %
Not confined 52.2 52.8 43.8 54.8 34.2 33.1 36.7 Animals kept in a closed house with
solid walls 11.2 9 12.5 6.5 3.1 5.4 3.8
Animals kept in a open pen/open
house with mesh 36.6 38.2 43.8 38.7 62.7 61.5 59.5
The table below shows the figures for the poultry farm management in the five GETS.
Table 11: Proportion on how farmers manage their birds
Type of confinement Some avian species
Meat chicken
Laying chicken
Local chicken
Fighting cock
Meat duck
Laying duck
Muscovy duck
M U (N) 384 286 16 31 225 147 79 % % % % % % %
All-in and all-out in whole farm 17.7 10.1 12.5 22.6 40.9 36.7 21.5
Multiple poultry flocks in farm and all-in and all-out
for earch poultryflocks 4.7 2.8 0 16.1 4.4 4.1 7.6
Flock continuosly topped up whole farm or a whole house/pen never emptied
74.5 85.7 87.5 61.3 50.2 59.2 68.4
thers 0.8 0.7 0 0 1.6 0 0
28 Poultry Producer Survey
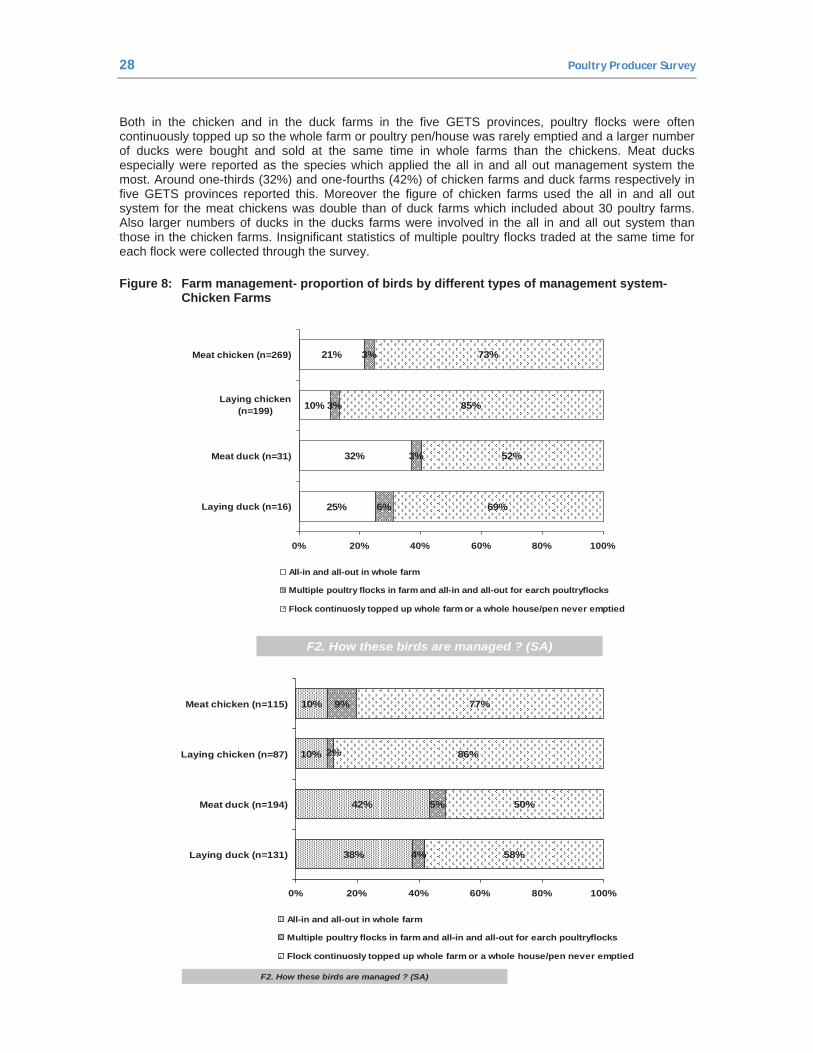
Both in the chicken and in the duck farms in the five GETS provinces, poultry flocks were often continuously topped up so the whole farm or poultry pen/house was rarely emptied and a larger number of ducks were bought and sold at the same time in whole farms than the chickens. Meat ducks especially were reported as the species which applied the all in and all out management system the most. Around one-thirds (32%) and one-fourths (42%) of chicken farms and duck farms respectively in five GETS provinces reported this. Moreover the figure of chicken farms used the all in and all out system for the meat chickens was double than of duck farms which included about 30 poultry farms. Also larger numbers of ducks in the ducks farms were involved in the all in and all out system than those in the chicken farms. Insignificant statistics of multiple poultry flocks traded at the same time for each flock were collected through the survey.
Figure 8: Farm management- proportion of birds by different types of management system- Chicken Farms
21%
10%
32%
25%
3%
3%
3%
6%
73%
85%
52%
69%
0% 20% 40% 60% 80% 100%
Meat chicken (n=269)
Laying chicken(n=199)
Meat duck (n=31)
Laying duck (n=16)
All-in and all-out in whole farm
Multiple poultry flocks in farm and all-in and all-out for earch poultryflocks
Flock continuosly topped up whole farm or a whole house/pen never emptied
F2. How these birds are managed ? (SA)
10%
10%
42%
38%
9%
5%
4%
77%
86%
50%
58%
2%
0% 20% 40% 60% 80% 100%
Meat chicken (n=115)
Laying chicken (n=87)
Meat duck (n=194)
Laying duck (n=131)
All-in and all-out in whole farm
Multiple poultry flocks in farm and all-in and all-out for earch poultryflocks
Flock continuosly topped up whole farm or a whole house/pen never emptied
F2. How these birds are managed ? (SA)
Poultry Producer Survey 29
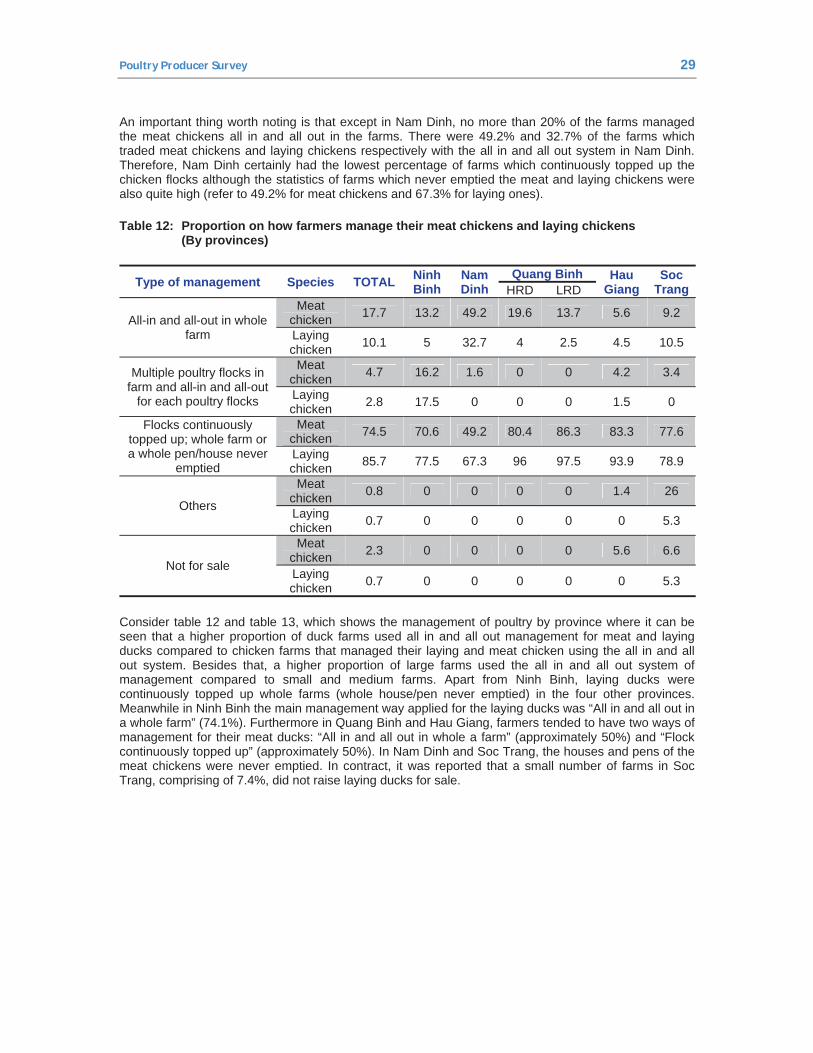
An important thing worth noting is that except in Nam Dinh, no more than 20% of the farms managed the meat chickens all in and all out in the farms. There were 49.2% and 32.7% of the farms which traded meat chickens and laying chickens respectively with the all in and all out system in Nam Dinh. Therefore, Nam Dinh certainly had the lowest percentage of farms which continuously topped up the chicken flocks although the statistics of farms which never emptied the meat and laying chickens were also quite high (refer to 49.2% for meat chickens and 67.3% for laying ones).
Table 12: Proportion on how farmers manage their meat chickens and laying chickens (By provinces)
Type of management Species TOTAL Ninh Binh
Nam Dinh
Quang Binh Hau Giang
Soc TrangHRD LRD
All-in and all-out in whole farm
Meat chicken 17.7 13.2 49.2 19.6 13.7 5.6 9.2
Laying chicken 10.1 5 32.7 4 2.5 4.5 10.5
Multiple poultry flocks in farm and all-in and all-out
for each poultry flocks
Meat chicken 4.7 16.2 1.6 0 0 4.2 3.4
Laying chicken 2.8 17.5 0 0 0 1.5 0
Flocks continuously topped up; whole farm or a whole pen/house never
emptied
Meat chicken 74.5 70.6 49.2 80.4 86.3 83.3 77.6
Laying chicken 85.7 77.5 67.3 96 97.5 93.9 78.9
Others
Meat chicken 0.8 0 0 0 0 1.4 26
Laying chicken 0.7 0 0 0 0 0 5.3
Not for sale
Meat chicken 2.3 0 0 0 0 5.6 6.6
Laying chicken 0.7 0 0 0 0 0 5.3
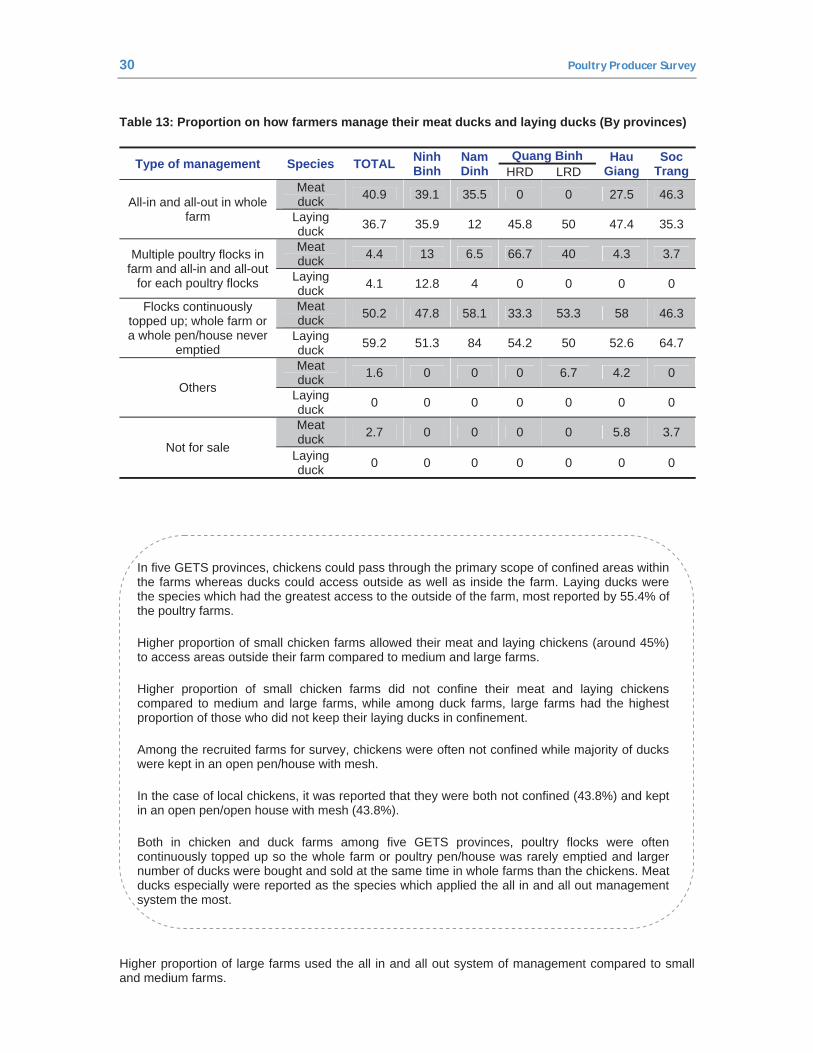
Consider table 12 and table 13, which shows the management of poultry by province where it can be seen that a higher proportion of duck farms used all in and all out management for meat and laying ducks compared to chicken farms that managed their laying and meat chicken using the all in and all out system. Besides that, a higher proportion of large farms used the all in and all out system of management compared to small and medium farms. Apart from Ninh Binh, laying ducks were continuously topped up whole farms (whole house/pen never emptied) in the four other provinces. Meanwhile in Ninh Binh the main management way applied for the laying ducks was “All in and all out in a whole farm” (74.1%). Furthermore in Quang Binh and Hau Giang, farmers tended to have two ways of management for their meat ducks: “All in and all out in whole a farm” (approximately 50%) and “Flock continuously topped up” (approximately 50%). In Nam Dinh and Soc Trang, the houses and pens of the meat chickens were never emptied. In contract, it was reported that a small number of farms in Soc Trang, comprising of 7.4%, did not raise laying ducks for sale.
30 Poultry Producer Survey
Table 13: Proportion on how farmers manage their meat ducks and laying ducks (By provinces)
Type of management Species TOTAL Ninh Binh
Nam Dinh
Quang Binh Hau Giang
Soc TrangHRD LRD
All-in and all-out in whole farm
Meat duck 40.9 39.1 35.5 0 0 27.5 46.3
Laying duck 36.7 35.9 12 45.8 50 47.4 35.3
Multiple poultry flocks in farm and all-in and all-out
for each poultry flocks
Meat duck 4.4 13 6.5 66.7 40 4.3 3.7
Laying duck 4.1 12.8 4 0 0 0 0
Flocks continuously topped up; whole farm or a whole pen/house never
emptied
Meat duck 50.2 47.8 58.1 33.3 53.3 58 46.3
Laying duck 59.2 51.3 84 54.2 50 52.6 64.7
Others
Meat duck 1.6 0 0 0 6.7 4.2 0
Laying duck 0 0 0 0 0 0 0
Not for sale
Meat duck 2.7 0 0 0 0 5.8 3.7
Laying duck 0 0 0 0 0 0 0
In five GETS provinces, chickens could pass through the primary scope of confined areas within the farms whereas ducks could access outside as well as inside the farm. Laying ducks were the species which had the greatest access to the outside of the farm, most reported by 55.4% of the poultry farms.
Higher proportion of small chicken farms allowed their meat and laying chickens (around 45%) to access areas outside their farm compared to medium and large farms.
Higher proportion of small chicken farms did not confine their meat and laying chickens compared to medium and large farms, while among duck farms, large farms had the highest proportion of those who did not keep their laying ducks in confinement.
Among the recruited farms for survey, chickens were often not confined while majority of ducks were kept in an open pen/house with mesh.
In the case of local chickens, it was reported that they were both not confined (43.8%) and kept in an open pen/open house with mesh (43.8%).
Both in chicken and duck farms among five GETS provinces, poultry flocks were often continuously topped up so the whole farm or poultry pen/house was rarely emptied and larger number of ducks were bought and sold at the same time in whole farms than the chickens. Meat ducks especially were reported as the species which applied the all in and all out management system the most.
Higher proportion of large farms used the all in and all out system of management compared to small and medium farms.
Poultry Producer Survey 31
Grazing Duck Management
Figure 9: Percentage of farms grazing ducks on the rice fields (By provinces)
D1a. Do you feed your ducks on rice fields at least once in a year? (SA)
56%65%
54%67%
87%
53%42%
0%
20%
40%
60%
80%
100%
Total Duck(n=300)
Ninh Binh(n=48)
Nam Dinh(n=48)
Quang BinhHR (n=45)
Quang BinhLR (n=15)
Hau Giang(n=80)
Soc Trang(n=64)
Yes
180116.6761.2586.6737.559.2987.65
No. of days in the year ducks were fed on the rice fields
(Median)
Low risk districts
High risk districts
Soc Trang
HauGiang
Quang Binh
Nam Dinh
NinhBinhTOTAL
PROVINCES
D1b. How many days in the year are ducks fed on rice fields? (Open- ended question)
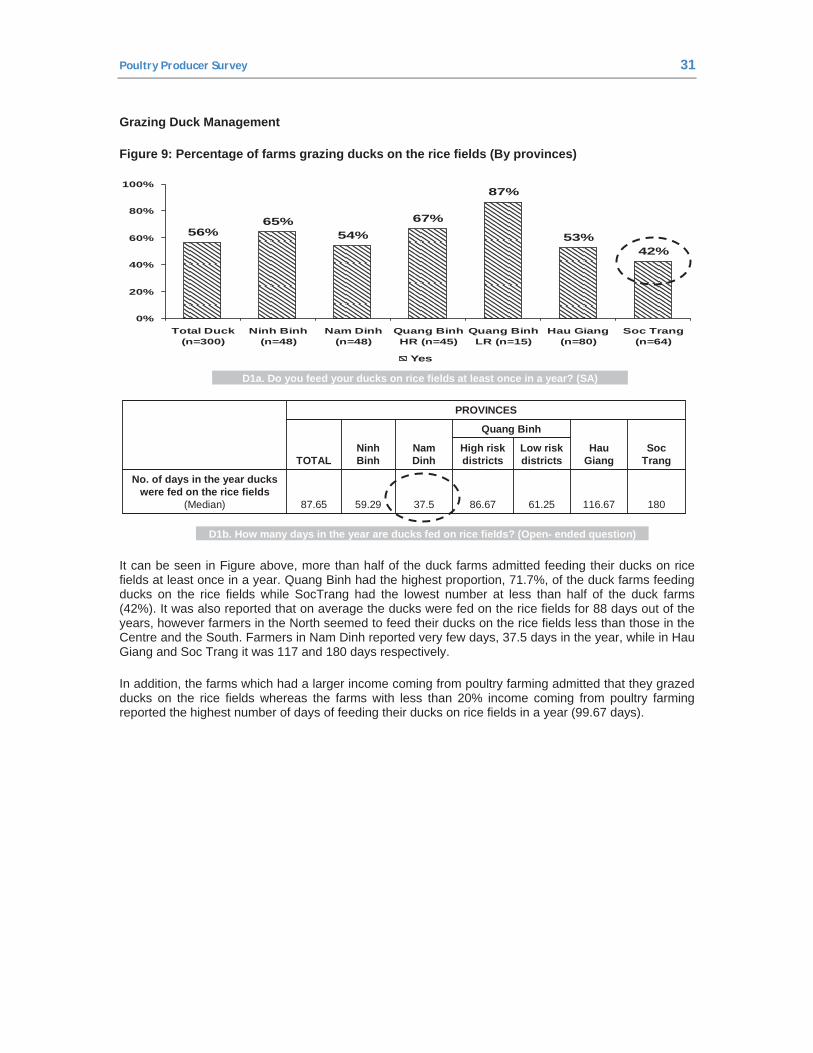
It can be seen in Figure above, more than half of the duck farms admitted feeding their ducks on rice fields at least once in a year. Quang Binh had the highest proportion, 71.7%, of the duck farms feeding ducks on the rice fields while SocTrang had the lowest number at less than half of the duck farms (42%). It was also reported that on average the ducks were fed on the rice fields for 88 days out of the years, however farmers in the North seemed to feed their ducks on the rice fields less than those in the Centre and the South. Farmers in Nam Dinh reported very few days, 37.5 days in the year, while in Hau Giang and Soc Trang it was 117 and 180 days respectively.
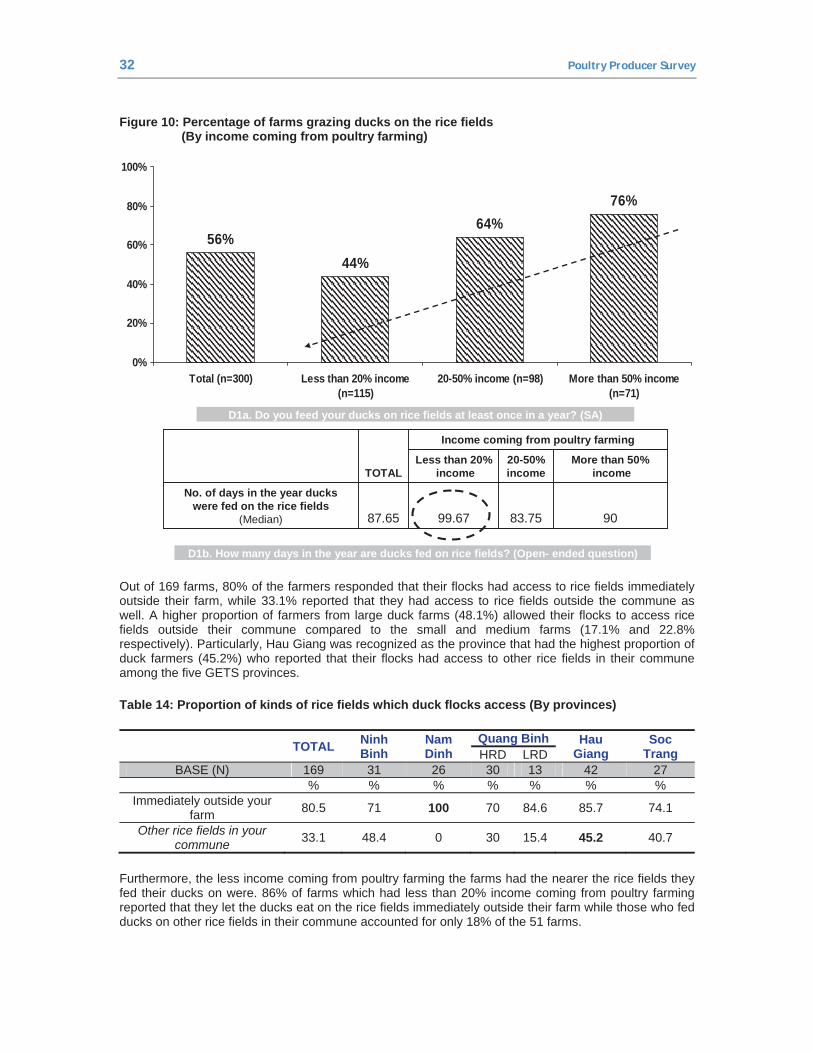
In addition, the farms which had a larger income coming from poultry farming admitted that they grazed ducks on the rice fields whereas the farms with less than 20% income coming from poultry farming reported the highest number of days of feeding their ducks on rice fields in a year (99.67 days).
32 Poultry Producer Survey
Figure 10: Percentage of farms grazing ducks on the rice fields (By income coming from poultry farming)
37
56%44%
64%76%
0%
20%
40%
60%
80%
100%
Total (n=300) Less than 20% income(n=115)
20-50% income (n=98) More than 50% income(n=71)
D1a. Do you feed your ducks on rice fields at least once in a year? (SA)
9083.7599.6787.65
No. of days in the year ducks were fed on the rice fields
(Median)
More than 50%income
20-50% income
Less than 20%income
Income coming from poultry farming
TOTAL
D1b. How many days in the year are ducks fed on rice fields? (Open- ended question)
Out of 169 farms, 80% of the farmers responded that their flocks had access to rice fields immediately outside their farm, while 33.1% reported that they had access to rice fields outside the commune as well. A higher proportion of farmers from large duck farms (48.1%) allowed their flocks to access rice fields outside their commune compared to the small and medium farms (17.1% and 22.8% respectively). Particularly, Hau Giang was recognized as the province that had the highest proportion of duck farmers (45.2%) who reported that their flocks had access to other rice fields in their commune among the five GETS provinces.
Table 14: Proportion of kinds of rice fields which duck flocks access (By provinces)
TOTAL Ninh Binh
Nam Dinh
Quang Binh Hau Giang
Soc Trang HRD LRD
BASE (N) 169 31 26 30 13 42 27 % % % % % % %
Immediately outside your farm 80.5 71 100 70 84.6 85.7 74.1
Other rice fields in your commune 33.1 48.4 0 30 15.4 45.2 40.7
Furthermore, the less income coming from poultry farming the farms had the nearer the rice fields they fed their ducks on were. 86% of farms which had less than 20% income coming from poultry farming reported that they let the ducks eat on the rice fields immediately outside their farm while those who fed ducks on other rice fields in their commune accounted for only 18% of the 51 farms.
Poultry Producer Survey 33
Figure 11: Proportion of kinds of rice fields which duck flocks access (By income coming from poultry farming)
•Base: Total (n=169), Less than 20%(n=51), 20-50% (n=63), More than 50% (n=54)
Less than 20%Income
20-50%income
More than 50%incomeTotal
Other rice fields in your commune
Immediately outside your farm
18%
86%
37%
81%
33%
81% 74%
44%
D2. Which rice field does your duck flock access? (MA)
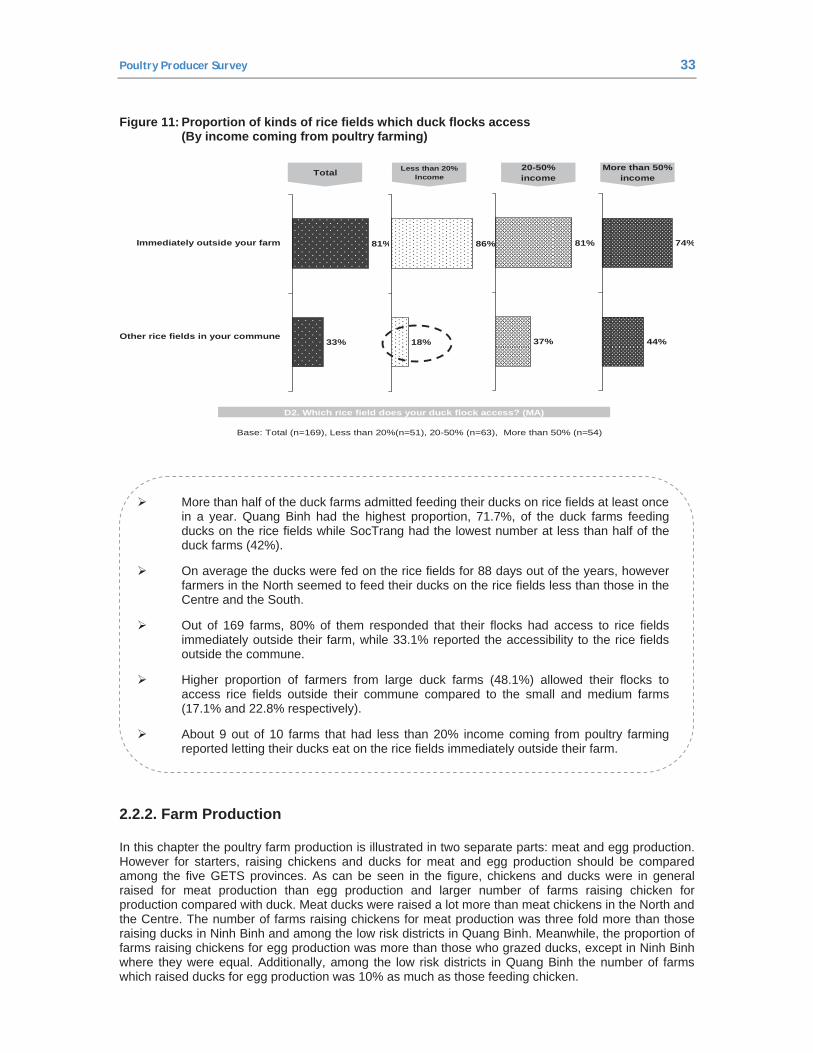
More than half of the duck farms admitted feeding their ducks on rice fields at least once in a year. Quang Binh had the highest proportion, 71.7%, of the duck farms feeding ducks on the rice fields while SocTrang had the lowest number at less than half of the duck farms (42%).
On average the ducks were fed on the rice fields for 88 days out of the years, however farmers in the North seemed to feed their ducks on the rice fields less than those in the Centre and the South.
Out of 169 farms, 80% of them responded that their flocks had access to rice fields immediately outside their farm, while 33.1% reported the accessibility to the rice fields outside the commune.
Higher proportion of farmers from large duck farms (48.1%) allowed their flocks to access rice fields outside their commune compared to the small and medium farms (17.1% and 22.8% respectively).
About 9 out of 10 farms that had less than 20% income coming from poultry farming reported letting their ducks eat on the rice fields immediately outside their farm.
2.2.2. Farm Production
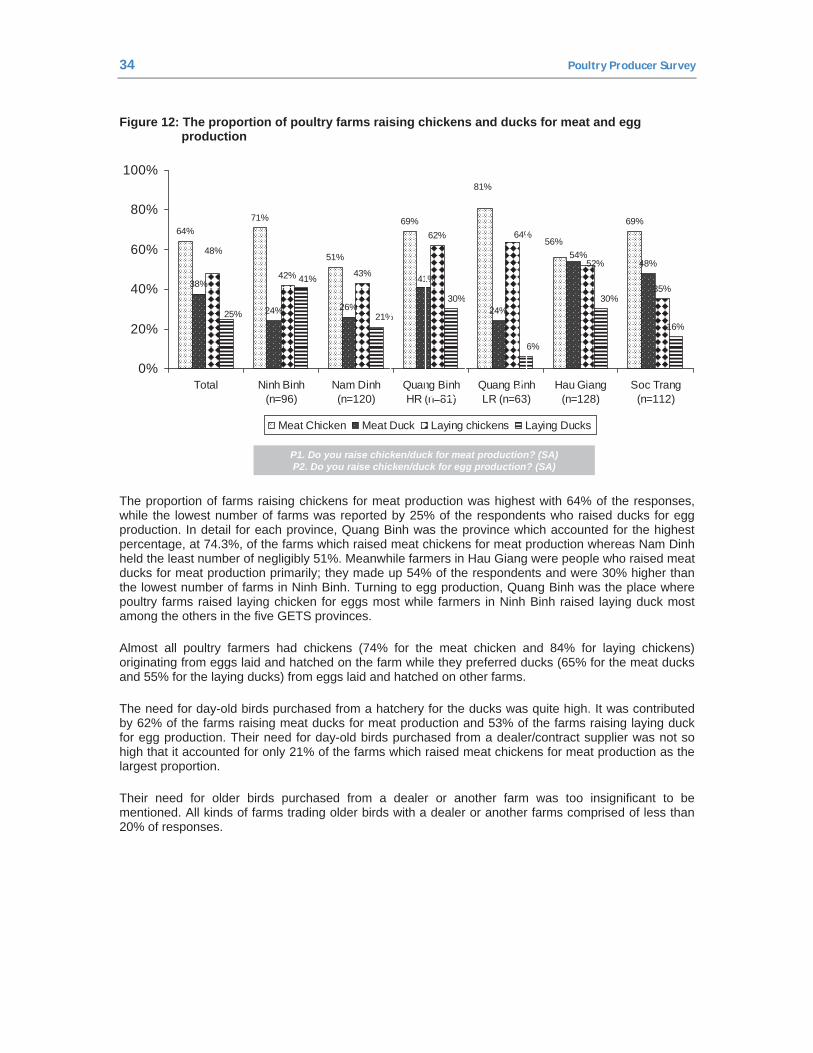
In this chapter the poultry farm production is illustrated in two separate parts: meat and egg production. However for starters, raising chickens and ducks for meat and egg production should be compared among the five GETS provinces. As can be seen in the figure, chickens and ducks were in general raised for meat production than egg production and larger number of farms raising chicken for production compared with duck. Meat ducks were raised a lot more than meat chickens in the North and the Centre. The number of farms raising chickens for meat production was three fold more than those raising ducks in Ninh Binh and among the low risk districts in Quang Binh. Meanwhile, the proportion of farms raising chickens for egg production was more than those who grazed ducks, except in Ninh Binh where they were equal. Additionally, among the low risk districts in Quang Binh the number of farms which raised ducks for egg production was 10% as much as those feeding chicken.
34 Poultry Producer Survey
Figure 12: The proportion of poultry farms raising chickens and ducks for meat and egg production
64%71%
51%
69% 69%
38%
24% 26% 24%
48%42% 43%
62%
35%
16%
56%
81%
41%
54%52%
64%
48%
30%
6%
30%
21%
41%
25%
0%
20%
40%
60%
80%
100%
Total Ninh Binh(n=96)
Nam Dinh(n=120)
Quang BinhHR (n=81)
Quang BinhLR (n=63)
Hau Giang(n=128)
Soc Trang(n=112)
Meat Chicken Meat Duck Laying chickens Laying Ducks
P1. Do you raise chicken/duck for meat production? (SA)P2. Do you raise chicken/duck for egg production? (SA)
The proportion of farms raising chickens for meat production was highest with 64% of the responses, while the lowest number of farms was reported by 25% of the respondents who raised ducks for egg production. In detail for each province, Quang Binh was the province which accounted for the highest percentage, at 74.3%, of the farms which raised meat chickens for meat production whereas Nam Dinh held the least number of negligibly 51%. Meanwhile farmers in Hau Giang were people who raised meat ducks for meat production primarily; they made up 54% of the respondents and were 30% higher than the lowest number of farms in Ninh Binh. Turning to egg production, Quang Binh was the place where poultry farms raised laying chicken for eggs most while farmers in Ninh Binh raised laying duck most among the others in the five GETS provinces.
Almost all poultry farmers had chickens (74% for the meat chicken and 84% for laying chickens) originating from eggs laid and hatched on the farm while they preferred ducks (65% for the meat ducks and 55% for the laying ducks) from eggs laid and hatched on other farms.
The need for day-old birds purchased from a hatchery for the ducks was quite high. It was contributed by 62% of the farms raising meat ducks for meat production and 53% of the farms raising laying duck for egg production. Their need for day-old birds purchased from a dealer/contract supplier was not so high that it accounted for only 21% of the farms which raised meat chickens for meat production as the largest proportion.
Their need for older birds purchased from a dealer or another farm was too insignificant to be mentioned. All kinds of farms trading older birds with a dealer or another farms comprised of less than 20% of responses.
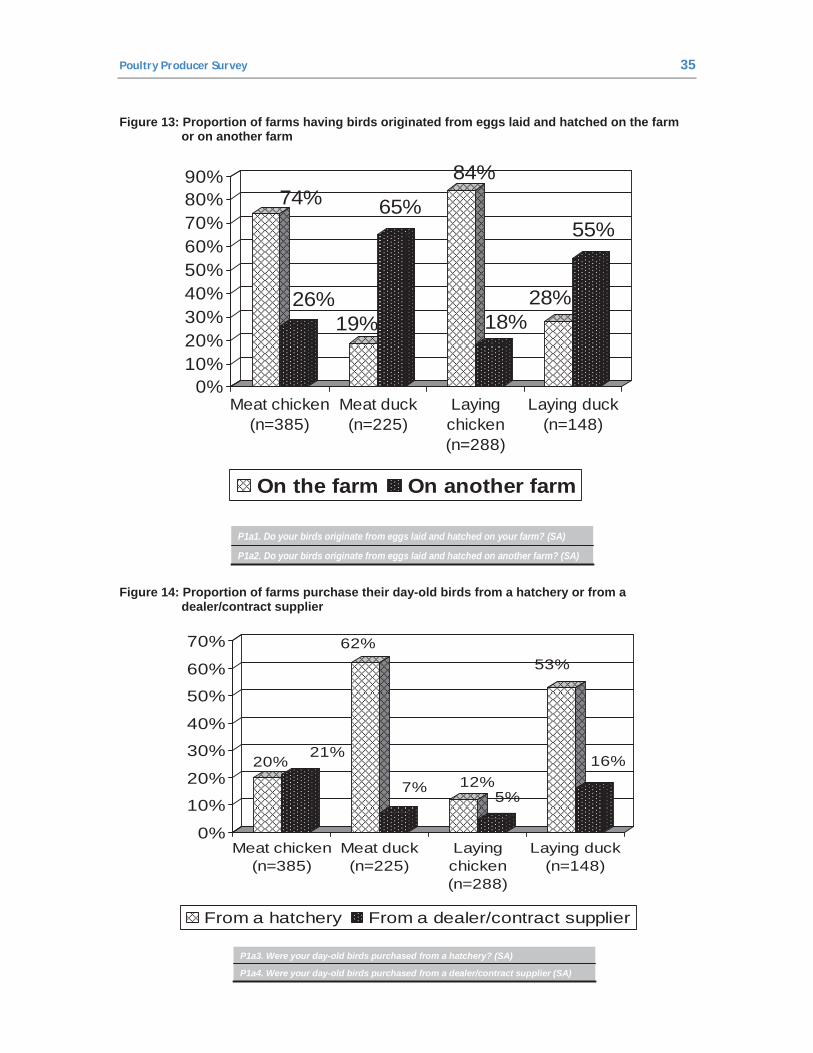
Poultry Producer Survey 35
Figure 13: Proportion of farms having birds originated from eggs laid and hatched on the farm or on another farm
74%
26%19%
65%
84%
18%28%
55%
0%10%20%30%40%50%60%70%80%90%
Meat chicken(n=385)
Meat duck(n=225)
Layingchicken(n=288)
Laying duck(n=148)
On the farm On another farm
P1a2. Do your birds originate from eggs laid and hatched on another farm? (SA)
P1a1. Do your birds originate from eggs laid and hatched on your farm? (SA)
Figure 14: Proportion of farms purchase their day-old birds from a hatchery or from a dealer/contract supplier
20%21%
62%
7% 12%5%
53%
16%
0%
10%
20%
30%
40%
50%
60%
70%
Meat chicken(n=385)
Meat duck(n=225)
Layingchicken(n=288)
Laying duck(n=148)
From a hatchery From a dealer/contract supplier
P1a4. Were your day-old birds purchased from a dealer/contract supplier (SA)
P1a3. Were your day-old birds purchased from a hatchery? (SA)
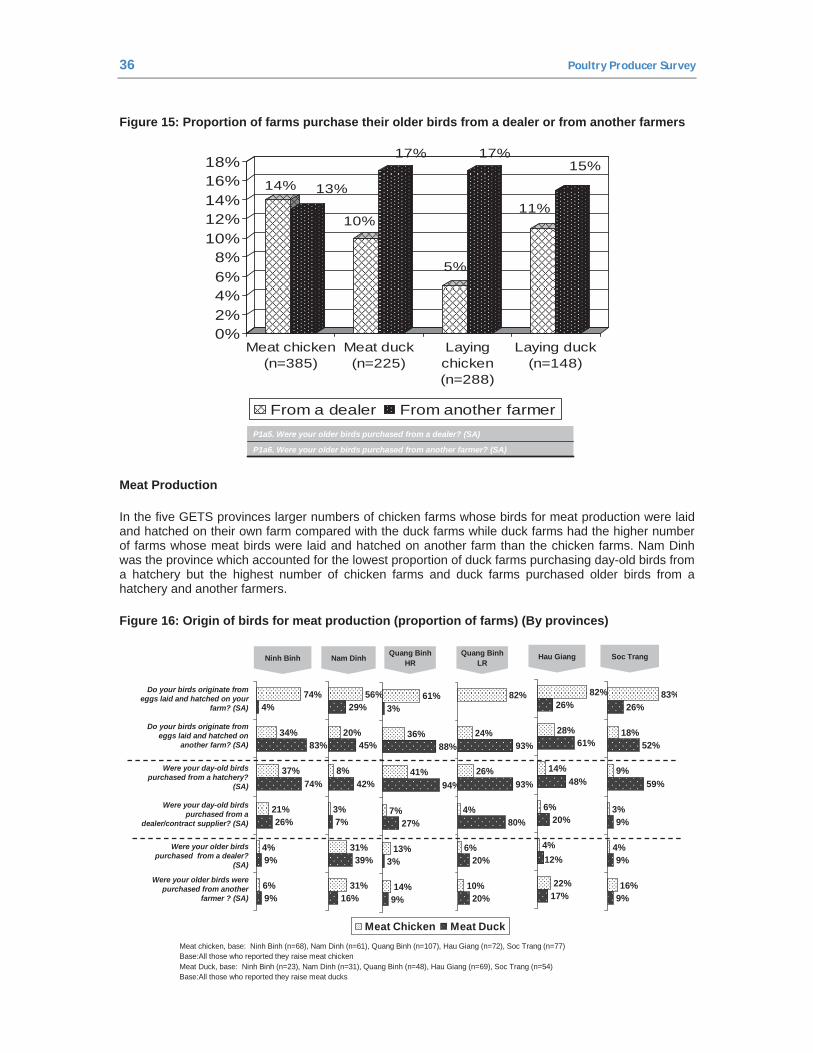
36 Poultry Producer Survey
Figure 15: Proportion of farms purchase their older birds from a dealer or from another farmers
14% 13%
10%
17%
5%
17%
11%
15%
0%2%4%6%8%
10%12%14%16%18%
Meat chicken(n=385)
Meat duck(n=225)
Layingchicken(n=288)
Laying duck(n=148)
From a dealer From another farmer
P1a6. Were your older birds purchased from another farmer? (SA)
P1a5. Were your older birds purchased from a dealer? (SA)
Meat Production
In the five GETS provinces larger numbers of chicken farms whose birds for meat production were laid and hatched on their own farm compared with the duck farms while duck farms had the higher number of farms whose meat birds were laid and hatched on another farm than the chicken farms. Nam Dinh was the province which accounted for the lowest proportion of duck farms purchasing day-old birds from a hatchery but the highest number of chicken farms and duck farms purchased older birds from a hatchery and another farmers.
Figure 16: Origin of birds for meat production (proportion of farms) (By provinces)
Nam Dinh Quang BinhHR
Hau Giang Soc Trang
6%
4%
21%
37%
34%
74%
9%
9%
26%
74%
83%
4%
Ninh Binh
•Meat chicken, base: Ninh Binh (n=68), Nam Dinh (n=61), Quang Binh (n=107), Hau Giang (n=72), Soc Trang (n=77) •Base:All those who reported they raise meat chicken •Meat Duck, base: Ninh Binh (n=23), Nam Dinh (n=31), Quang Binh (n=48), Hau Giang (n=69), Soc Trang (n=54)•Base:All those who reported they raise meat ducks
31%
31%
3%
8%
20%
56%
16%
39%
7%
42%
45%
29%
14%
13%
7%
41%
36%
61%
9%
3%
27%
94%
88%
3%
22%
4%
6%
14%
28%
82%
17%
12%
20%
48%
61%
26%
16%
4%
3%
9%
18%
83%
9%
9%
9%
59%
52%
26%
Quang BinhLR
Do your birds originate from eggs laid and hatched on your
farm? (SA)
Do your birds originate from eggs laid and hatched on
another farm? (SA)
Were your day-old birds purchased from a hatchery?
(SA)
Were your day-old birds purchased from a
dealer/contract supplier? (SA)
Were your older birds purchased from a dealer?
(SA)
Were your older birds were purchased from another
farmer ? (SA)10%
6%
4%
26%
24%
82%
20%
20%
80%
93%
93%
Meat Chicken Meat Duck
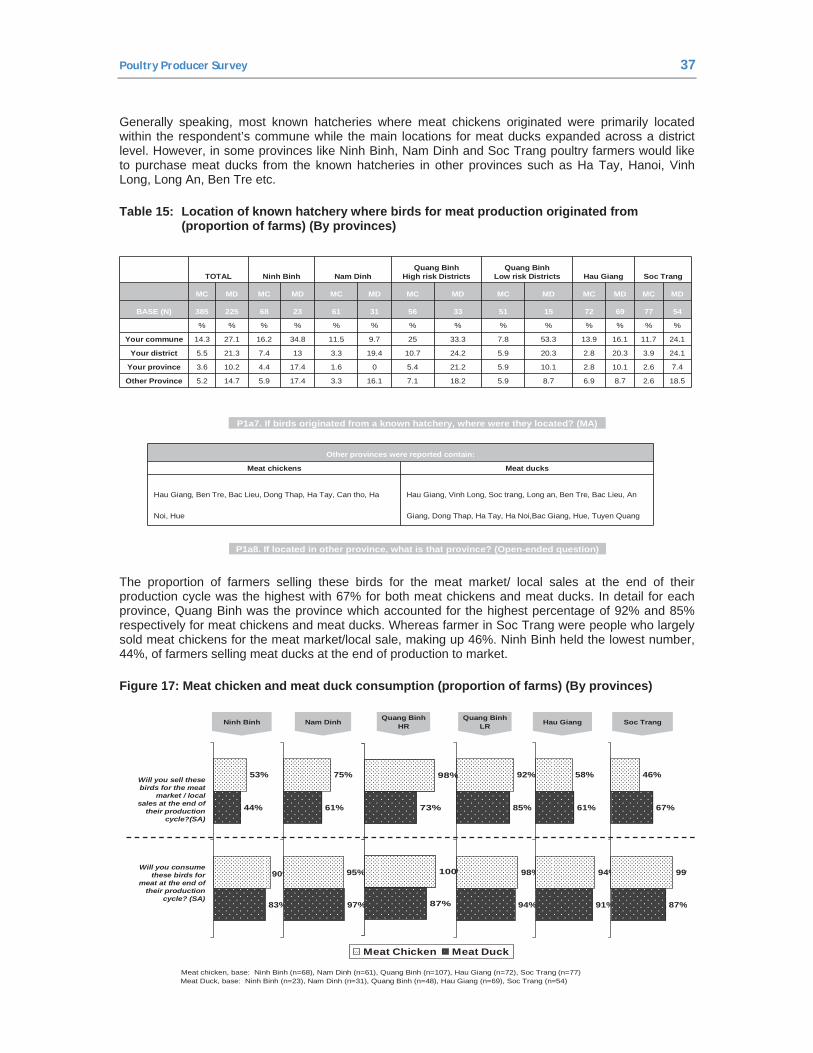
Poultry Producer Survey 37
Generally speaking, most known hatcheries where meat chickens originated were primarily located within the respondent’s commune while the main locations for meat ducks expanded across a district level. However, in some provinces like Ninh Binh, Nam Dinh and Soc Trang poultry farmers would like to purchase meat ducks from the known hatcheries in other provinces such as Ha Tay, Hanoi, Vinh Long, Long An, Ben Tre etc.
Table 15: Location of known hatchery where birds for meat production originated from (proportion of farms) (By provinces)
TOTAL Ninh Binh Nam DinhQuang Binh
High risk DistrictsQuang Binh
Low risk Districts Hau Giang Soc Trang
MC MD MC MD MC MD MC MD MC MD MC MD MC MD
BASE (N) 385 225 68 23 61 31 56 33 51 15 72 69 77 54
% % % % % % % % % % % % % %
Your commune 14.3 27.1 16.2 34.8 11.5 9.7 25 33.3 7.8 53.3 13.9 16.1 11.7 24.1
Your district 5.5 21.3 7.4 13 3.3 19.4 10.7 24.2 5.9 20.3 2.8 20.3 3.9 24.1
Your province 3.6 10.2 4.4 17.4 1.6 0 5.4 21.2 5.9 10.1 2.8 10.1 2.6 7.4
Other Province 5.2 14.7 5.9 17.4 3.3 16.1 7.1 18.2 5.9 8.7 6.9 8.7 2.6 18.5
Other provinces were reported contain:
Meat chickens Meat ducks
Hau Giang, Ben Tre, Bac Lieu, Dong Thap, Ha Tay, Can tho, Ha
Noi, Hue
Hau Giang, Vinh Long, Soc trang, Long an, Ben Tre, Bac Lieu, An
Giang, Dong Thap, Ha Tay, Ha Noi,Bac Giang, Hue, Tuyen Quang
P1a7. If birds originated from a known hatchery, where were they located? (MA)
P1a8. If located in other province, what is that province? (Open-ended question)
The proportion of farmers selling these birds for the meat market/ local sales at the end of their production cycle was the highest with 67% for both meat chickens and meat ducks. In detail for each province, Quang Binh was the province which accounted for the highest percentage of 92% and 85% respectively for meat chickens and meat ducks. Whereas farmer in Soc Trang were people who largely sold meat chickens for the meat market/local sale, making up 46%. Ninh Binh held the lowest number, 44%, of farmers selling meat ducks at the end of production to market.
Figure 17: Meat chicken and meat duck consumption (proportion of farms) (By provinces)
90%
53%
83%
44%
95%
75%
97%
61%
98%
92%
94%
85%
94%
58%
91%
61%
99%
46%
87%
67%
Nam Dinh Quang BinhLR Hau Giang Soc TrangNinh Binh
•Meat chicken, base: Ninh Binh (n=68), Nam Dinh (n=61), Quang Binh (n=107), Hau Giang (n=72), Soc Trang (n=77) Meat Duck, base: Ninh Binh (n=23), Nam Dinh (n=31), Quang Binh (n=48), Hau Giang (n=69), Soc Trang (n=54)
Will you sell these birds for the meat
market / local sales at the end of
their production cycle?(SA)
Will you consume these birds for
meat at the end of their production
cycle? (SA)
Quang BinhHR
100%
98%
87%
73%
Meat Chicken Meat Duck
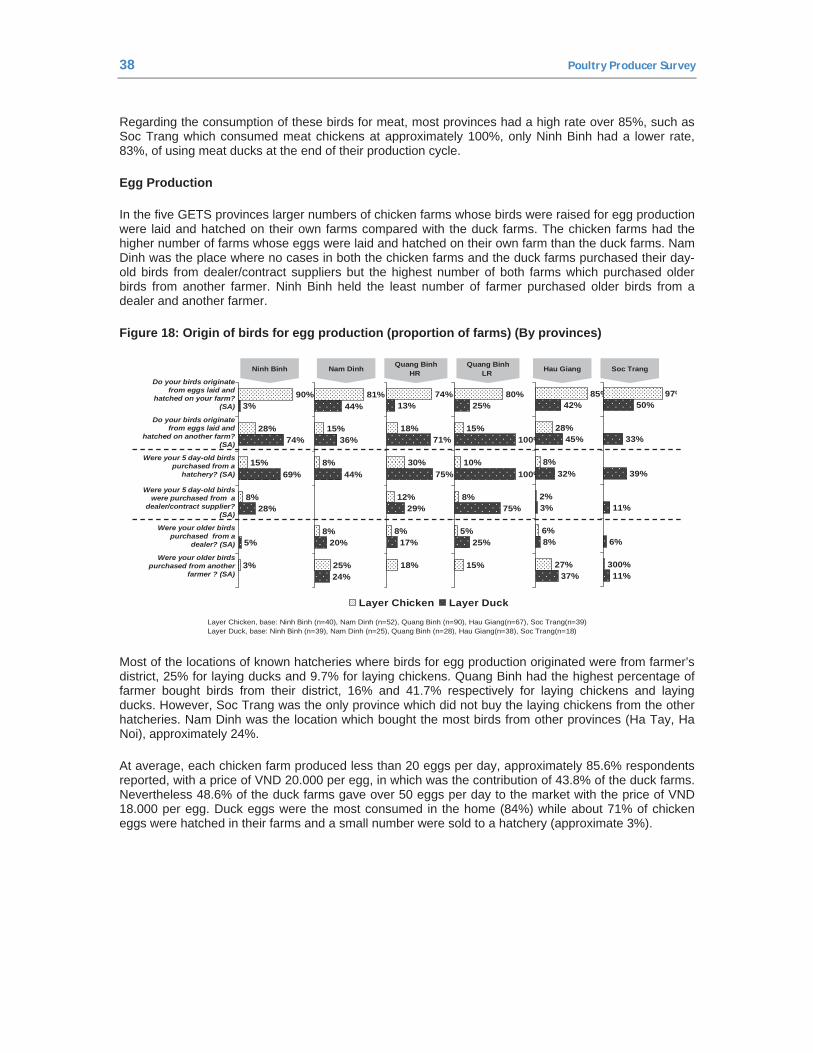
38 Poultry Producer Survey
Regarding the consumption of these birds for meat, most provinces had a high rate over 85%, such as Soc Trang which consumed meat chickens at approximately 100%, only Ninh Binh had a lower rate, 83%, of using meat ducks at the end of their production cycle.
Egg Production
In the five GETS provinces larger numbers of chicken farms whose birds were raised for egg production were laid and hatched on their own farms compared with the duck farms. The chicken farms had the higher number of farms whose eggs were laid and hatched on their own farm than the duck farms. Nam Dinh was the place where no cases in both the chicken farms and the duck farms purchased their day-old birds from dealer/contract suppliers but the highest number of both farms which purchased older birds from another farmer. Ninh Binh held the least number of farmer purchased older birds from a dealer and another farmer.
Figure 18: Origin of birds for egg production (proportion of farms) (By provinces)
•Layer Chicken, base: Ninh Binh (n=40), Nam Dinh (n=52), Quang Binh (n=90), Hau Giang(n=67), Soc Trang(n=39) •Layer Duck, base: Ninh Binh (n=39), Nam Dinh (n=25), Quang Binh (n=28), Hau Giang(n=38), Soc Trang(n=18)
Ninh Binh Quang BinhHR Hau GiangNam Dinh Soc Trang
Do your birds originate from eggs laid and
hatched on your farm? (SA)
Do your birds originate from eggs laid and
hatched on another farm? (SA)
Were your 5 day-old birds purchased from a
hatchery? (SA)
Were your 5 day-old birds were purchased from a
dealer/contract supplier? (SA)
Were your older birds purchased from a
dealer? (SA)
Were your older birds purchased from another
farmer ? (SA)
Quang BinhLR
3%
8%
15%
28%
90%
5%
28%
69%
74%
3%
25%
8%
8%
15%
81%
24%
20%
44%
36%
44%
18%
8%
12%
30%
18%
74%
17%
29%
75%
71%
13%
15%
5%
8%
10%
15%
80%
25%
75%
100%
100%
25%
27%
6%
2%
8%
28%
85%
37%
8%
3%
32%
45%
42%
300%
97%
11%
6%
11%
39%
33%
50%
Layer Chicken Layer Duck
Most of the locations of known hatcheries where birds for egg production originated were from farmer’s district, 25% for laying ducks and 9.7% for laying chickens. Quang Binh had the highest percentage of farmer bought birds from their district, 16% and 41.7% respectively for laying chickens and laying ducks. However, Soc Trang was the only province which did not buy the laying chickens from the other hatcheries. Nam Dinh was the location which bought the most birds from other provinces (Ha Tay, Ha Noi), approximately 24%.
At average, each chicken farm produced less than 20 eggs per day, approximately 85.6% respondents reported, with a price of VND 20.000 per egg, in which was the contribution of 43.8% of the duck farms. Nevertheless 48.6% of the duck farms gave over 50 eggs per day to the market with the price of VND 18.000 per egg. Duck eggs were the most consumed in the home (84%) while about 71% of chicken eggs were hatched in their farms and a small number were sold to a hatchery (approximate 3%).
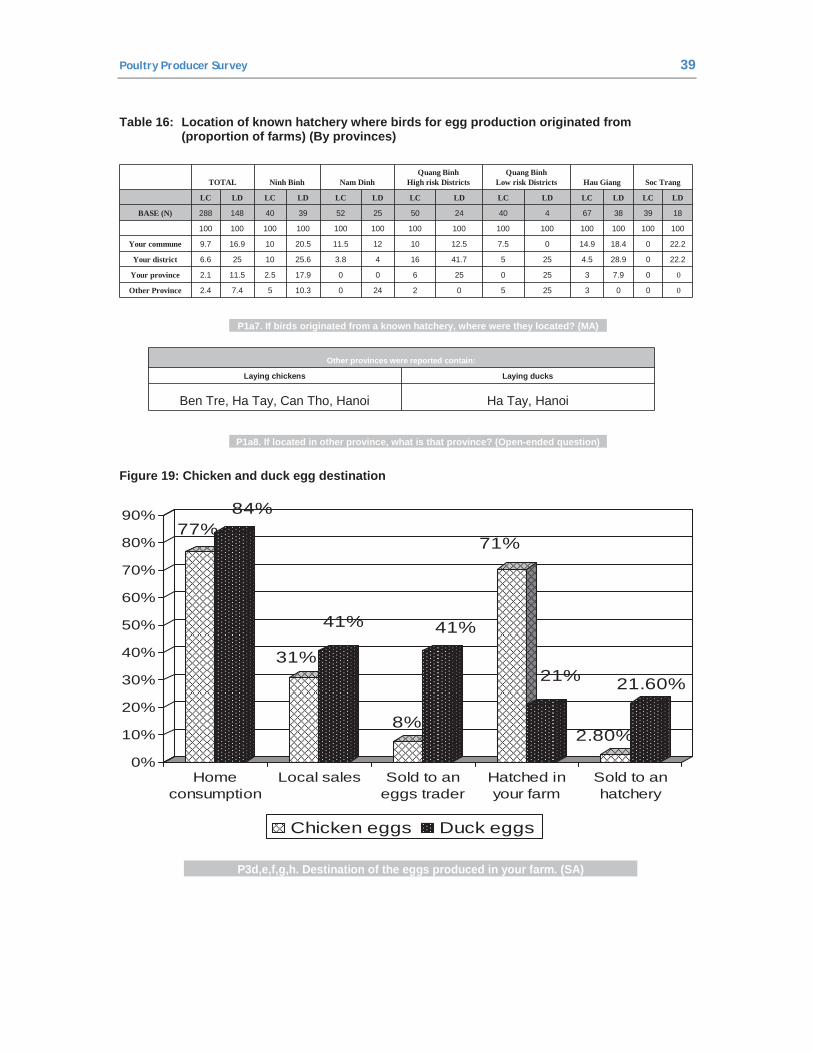
Poultry Producer Survey 39
Table 16: Location of known hatchery where birds for egg production originated from (proportion of farms) (By provinces)
Other provinces were reported contain:
Laying chickens Laying ducks
Ben Tre, Ha Tay, Can Tho, Hanoi Ha Tay, Hanoi
P1a7. If birds originated from a known hatchery, where were they located? (MA)
P1a8. If located in other province, what is that province? (Open-ended question)
TOTAL Ninh Binh Nam DinhQuang Binh
High risk DistrictsQuang Binh
Low risk Districts Hau Giang Soc Trang
LC LD LC LD LC LD LC LD LC LD LC LD LC LD
BASE (N) 288 148 40 39 52 25 50 24 40 4 67 38 39 18
100 100 100 100 100 100 100 100 100 100 100 100 100 100
Your commune 9.7 16.9 10 20.5 11.5 12 10 12.5 7.5 0 14.9 18.4 0 22.2
Your district 6.6 25 10 25.6 3.8 4 16 41.7 5 25 4.5 28.9 0 22.2
Your province 2.1 11.5 2.5 17.9 0 0 6 25 0 25 3 7.9 0 0
Other Province 2.4 7.4 5 10.3 0 24 2 0 5 25 3 0 0 0
Figure 19: Chicken and duck egg destination
77%84%
31%
41%
8%
41%
71%
21%
2.80%
21.60%
0%
10%
20%
30%
40%
50%
60%
70%
80%
90%
Homeconsumption
Local sales Sold to aneggs trader
Hatched inyour farm
Sold to anhatchery
Chicken eggs Duck eggs
P3d,e,f,g,h. Destination of the eggs produced in your farm. (SA)
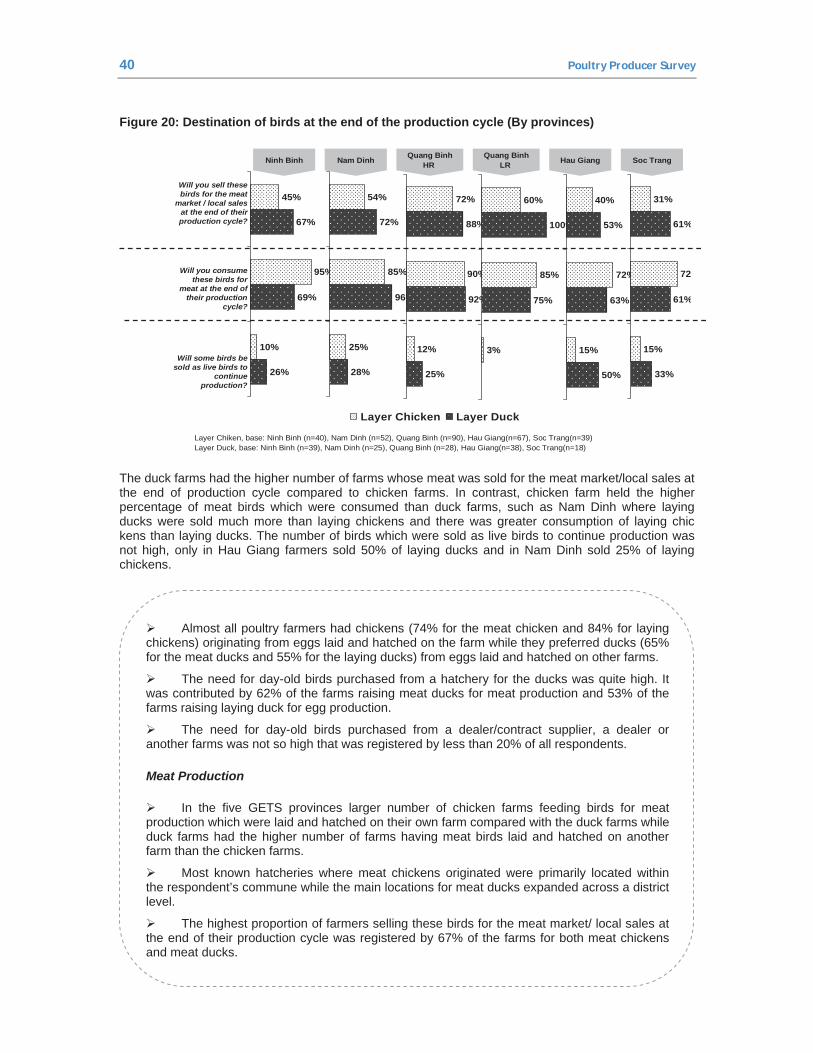
40 Poultry Producer Survey
Figure 20: Destination of birds at the end of the production cycle (By provinces)
•Layer Chiken, base: Ninh Binh (n=40), Nam Dinh (n=52), Quang Binh (n=90), Hau Giang(n=67), Soc Trang(n=39) •Layer Duck, base: Ninh Binh (n=39), Nam Dinh (n=25), Quang Binh (n=28), Hau Giang(n=38), Soc Trang(n=18)
Ninh Binh Quang BinhHR Hau GiangNam Dinh Soc Trang
Will you sell these birds for the meat
market / local sales at the end of their production cycle?
Will you consume these birds for
meat at the end of their production
cycle?
Will some birds be sold as live birds to
continue production?
Quang BinhLR
10%
95%
45%
26%
69%
67%
25%
85%
54%
28%
96%
72%
12%
90%
72%
25%
92%
88%
3%
85%
60%
75%
100%
15%
72%
40%
50%
63%
53%
15%
72
31%
33%
61%
61%
Layer Chicken Layer Duck
The duck farms had the higher number of farms whose meat was sold for the meat market/local sales at the end of production cycle compared to chicken farms. In contrast, chicken farm held the higher percentage of meat birds which were consumed than duck farms, such as Nam Dinh where laying ducks were sold much more than laying chickens and there was greater consumption of laying chic kens than laying ducks. The number of birds which were sold as live birds to continue production was not high, only in Hau Giang farmers sold 50% of laying ducks and in Nam Dinh sold 25% of laying chickens.
Almost all poultry farmers had chickens (74% for the meat chicken and 84% for laying chickens) originating from eggs laid and hatched on the farm while they preferred ducks (65% for the meat ducks and 55% for the laying ducks) from eggs laid and hatched on other farms.
The need for day-old birds purchased from a hatchery for the ducks was quite high. It was contributed by 62% of the farms raising meat ducks for meat production and 53% of the farms raising laying duck for egg production.
The need for day-old birds purchased from a dealer/contract supplier, a dealer or another farms was not so high that was registered by less than 20% of all respondents.
Meat Production
In the five GETS provinces larger number of chicken farms feeding birds for meat production which were laid and hatched on their own farm compared with the duck farms while duck farms had the higher number of farms having meat birds laid and hatched on another farm than the chicken farms.
Most known hatcheries where meat chickens originated were primarily located within the respondent’s commune while the main locations for meat ducks expanded across a district level.
The highest proportion of farmers selling these birds for the meat market/ local sales at the end of their production cycle was registered by 67% of the farms for both meat chickens and meat ducks.
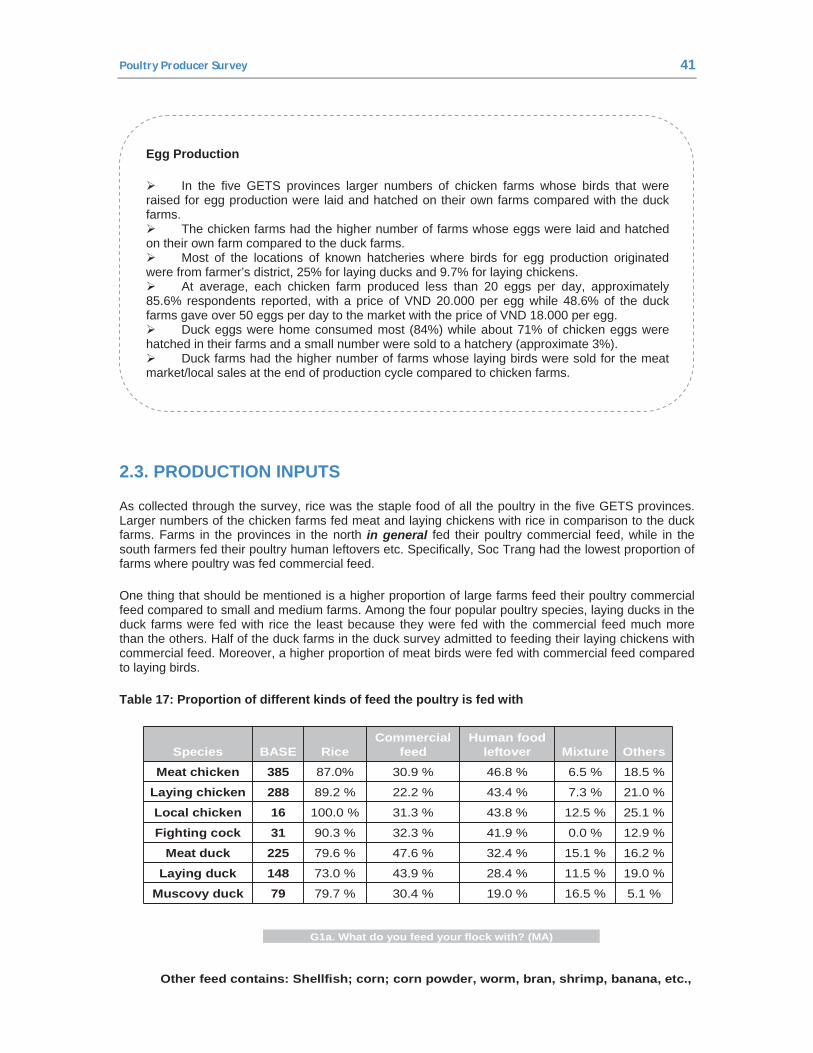
Poultry Producer Survey 41
Egg Production
In the five GETS provinces larger numbers of chicken farms whose birds that were raised for egg production were laid and hatched on their own farms compared with the duck farms.
The chicken farms had the higher number of farms whose eggs were laid and hatched on their own farm compared to the duck farms.
Most of the locations of known hatcheries where birds for egg production originated were from farmer’s district, 25% for laying ducks and 9.7% for laying chickens.
At average, each chicken farm produced less than 20 eggs per day, approximately 85.6% respondents reported, with a price of VND 20.000 per egg while 48.6% of the duck farms gave over 50 eggs per day to the market with the price of VND 18.000 per egg.
Duck eggs were home consumed most (84%) while about 71% of chicken eggs were hatched in their farms and a small number were sold to a hatchery (approximate 3%).
Duck farms had the higher number of farms whose laying birds were sold for the meat market/local sales at the end of production cycle compared to chicken farms.
2.3. PRODUCTION INPUTS
As collected through the survey, rice was the staple food of all the poultry in the five GETS provinces. Larger numbers of the chicken farms fed meat and laying chickens with rice in comparison to the duck farms. Farms in the provinces in the north in general fed their poultry commercial feed, while in the south farmers fed their poultry human leftovers etc. Specifically, Soc Trang had the lowest proportion of farms where poultry was fed commercial feed.
One thing that should be mentioned is a higher proportion of large farms feed their poultry commercial feed compared to small and medium farms. Among the four popular poultry species, laying ducks in the duck farms were fed with rice the least because they were fed with the commercial feed much more than the others. Half of the duck farms in the duck survey admitted to feeding their laying chickens with commercial feed. Moreover, a higher proportion of meat birds were fed with commercial feed compared to laying birds.
Table 17: Proportion of different kinds of feed the poultry is fed with
Species BASE RiceCommercial
feedHuman food
leftover Mixture OthersMeat chicken 385 87.0% 30.9 % 46.8 % 6.5 % 18.5 %
Laying chicken 288 89.2 % 22.2 % 43.4 % 7.3 % 21.0 %
Local chicken 16 100.0 % 31.3 % 43.8 % 12.5 % 25.1 %
Fighting cock 31 90.3 % 32.3 % 41.9 % 0.0 % 12.9 %
Meat duck 225 79.6 % 47.6 % 32.4 % 15.1 % 16.2 %
Laying duck 148 73.0 % 43.9 % 28.4 % 11.5 % 19.0 %
Muscovy duck 79 79.7 % 30.4 % 19.0 % 16.5 % 5.1 %
G1a. What do you feed your flock with? (MA)
Other feed contains: Shellfish; corn; corn powder, worm, bran, shrimp, banana, etc.,
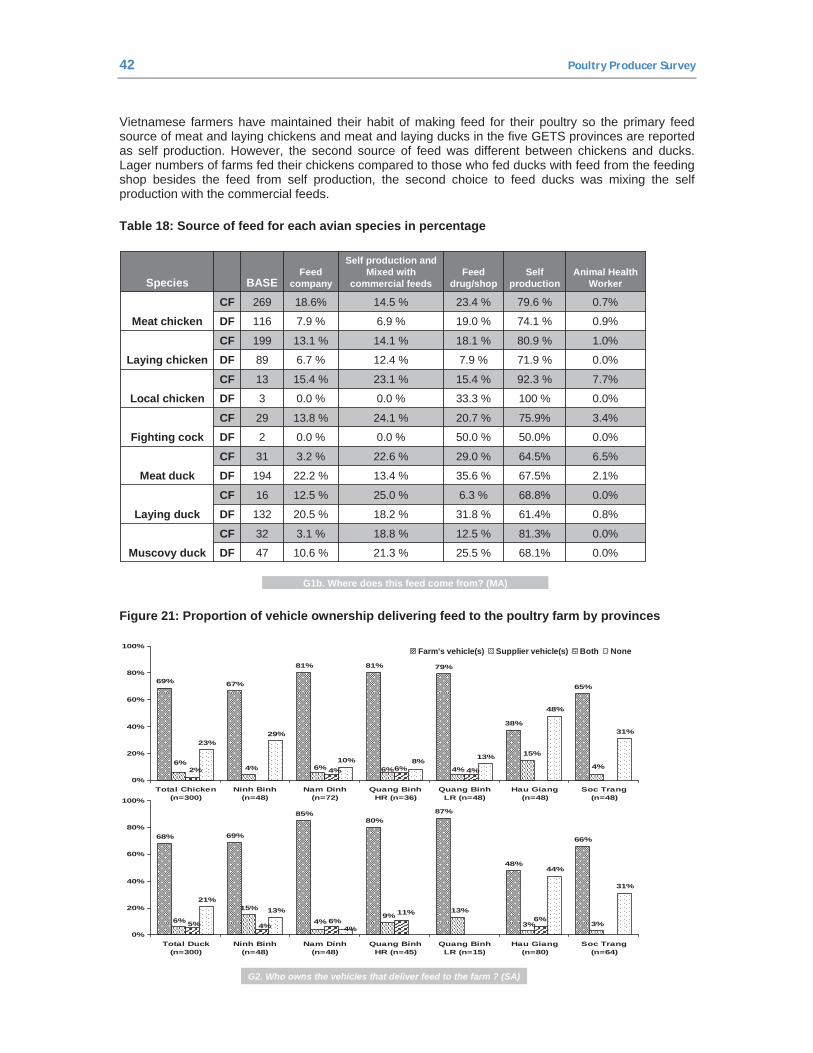
42 Poultry Producer Survey
Vietnamese farmers have maintained their habit of making feed for their poultry so the primary feed source of meat and laying chickens and meat and laying ducks in the five GETS provinces are reported as self production. However, the second source of feed was different between chickens and ducks. Lager numbers of farms fed their chickens compared to those who fed ducks with feed from the feeding shop besides the feed from self production, the second choice to feed ducks was mixing the self production with the commercial feeds.
Table 18: Source of feed for each avian species in percentage
0.0%68.1%25.5 %21.3 %10.6 %47DF0.0%81.3%12.5 %18.8 %3.1 %32CF
Muscovy duck
0.8%61.4%31.8 %18.2 %20.5 %132DF0.0%68.8%6.3 %25.0 %12.5 %16CF
Laying duck
2.1%67.5%35.6 %13.4 %22.2 %194DF6.5%64.5%29.0 %22.6 %3.2 %31CF
Meat duck
0.0%50.0%50.0 %0.0 %0.0 %2DF3.4%75.9%20.7 %24.1 %13.8 %29CF
Fighting cock
0.0%100 %33.3 %0.0 %0.0 %3DF7.7%92.3 %15.4 %23.1 %15.4 %13CF
Local chicken
0.0%71.9 %7.9 %12.4 %6.7 %89DF1.0%80.9 %18.1 %14.1 %13.1 %199CF
Laying chicken
0.9%74.1 %19.0 %6.9 %7.9 %116DF0.7%79.6 %23.4 %14.5 %18.6%269CF
Meat chicken
Animal Health Worker
Self production
Feed drug/shop
Self production and Mixed with
commercial feedsFeed
companyBASESpecies
G1b. Where does this feed come from? (MA)
Figure 21: Proportion of vehicle ownership delivering feed to the poultry farm by provinces
69% 67%
81% 81% 79%
38%
65%
23%29%
10% 13%
48%
31%
15%
4%4%6%6%4%6%
4%6%4%2%8%
0%
20%
40%
60%
80%
100%
Total Chicken(n=300)
Ninh Binh(n=48)
Nam Dinh(n=72)
Quang BinhHR (n=36)
Quang BinhLR (n=48)
Hau Giang(n=48)
Soc Trang(n=48)
68% 69%
85%80%
87%
48%
66%
15%9%
3%
21%13%
44%
31%
13%
3%4%6% 6%
11%6%
4%5% 4%
0%
20%
40%
60%
80%
100%
Total Duck(n=300)
Ninh Binh(n=48)
Nam Dinh(n=48)
Quang BinhHR (n=45)
Quang BinhLR (n=15)
Hau Giang(n=80)
Soc Trang(n=64)
Farm's vehicle(s) Supplier vehicle(s) Both None
G2. Who owns the vehicles that deliver feed to the farm ? (SA)
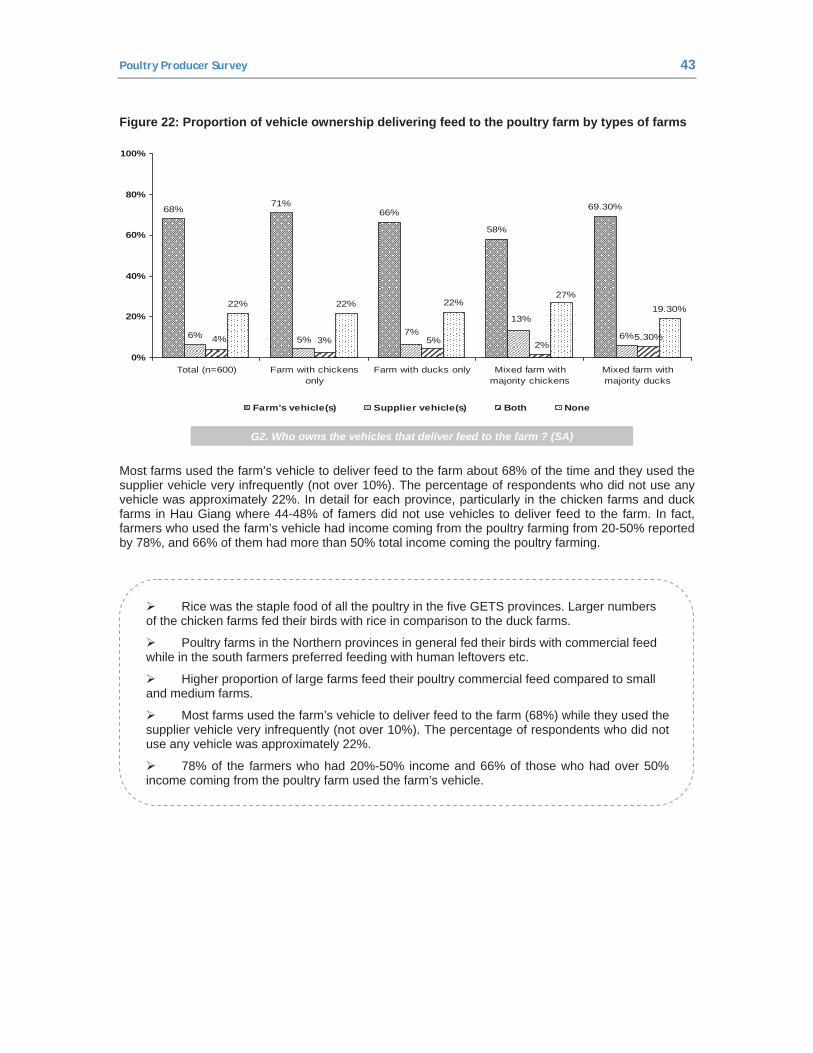
Poultry Producer Survey 43
Figure 22: Proportion of vehicle ownership delivering feed to the poultry farm by types of farms
68%71%
66%
58%
69.30%
6% 6%5.30%
22% 22% 22%19.30%
13%
5%7%
2%5%3%4%
27%
0%
20%
40%
60%
80%
100%
Total (n=600) Farm with chickensonly
Farm with ducks only Mixed farm withmajority chickens
Mixed farm withmajority ducks
Farm's vehicle(s) Supplier vehicle(s) Both None
G2. Who owns the vehicles that deliver feed to the farm ? (SA)
Most farms used the farm’s vehicle to deliver feed to the farm about 68% of the time and they used the supplier vehicle very infrequently (not over 10%). The percentage of respondents who did not use any vehicle was approximately 22%. In detail for each province, particularly in the chicken farms and duck farms in Hau Giang where 44-48% of famers did not use vehicles to deliver feed to the farm. In fact, farmers who used the farm’s vehicle had income coming from the poultry farming from 20-50% reported by 78%, and 66% of them had more than 50% total income coming the poultry farming.
Rice was the staple food of all the poultry in the five GETS provinces. Larger numbers of the chicken farms fed their birds with rice in comparison to the duck farms.
Poultry farms in the Northern provinces in general fed their birds with commercial feed while in the south farmers preferred feeding with human leftovers etc.
Higher proportion of large farms feed their poultry commercial feed compared to small and medium farms.
Most farms used the farm’s vehicle to deliver feed to the farm (68%) while they used the supplier vehicle very infrequently (not over 10%). The percentage of respondents who did not use any vehicle was approximately 22%.
78% of the farmers who had 20%-50% income and 66% of those who had over 50% income coming from the poultry farm used the farm’s vehicle.
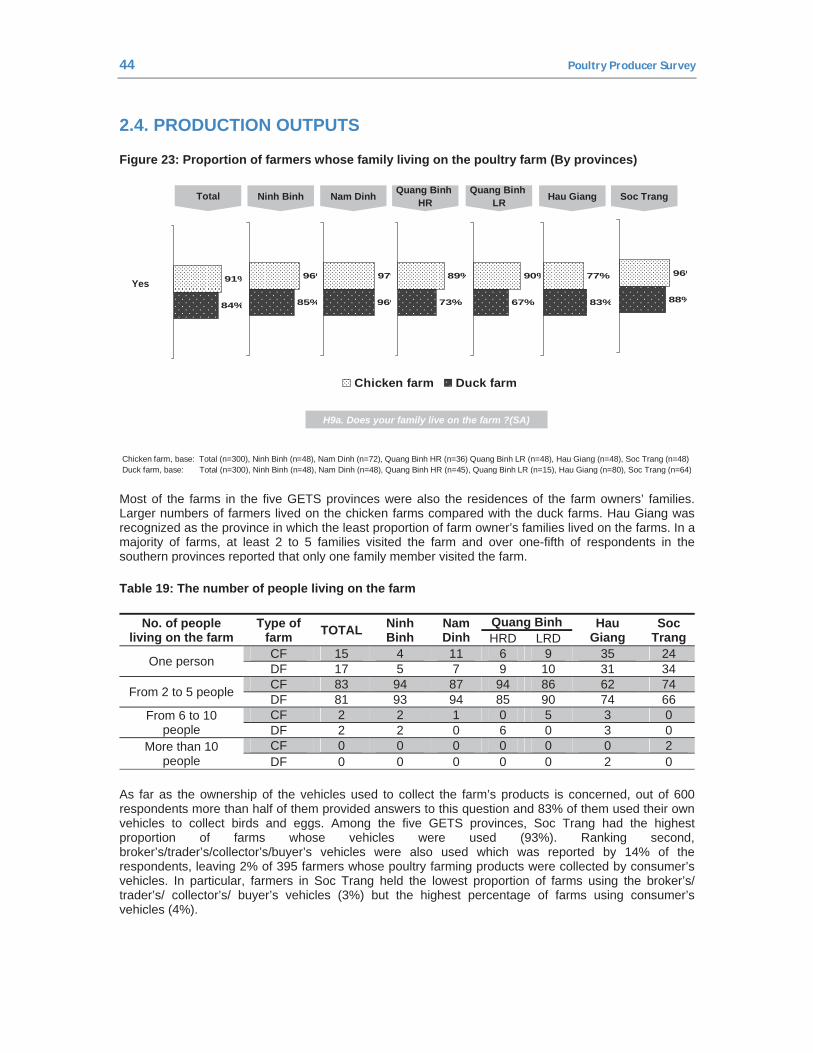
44 Poultry Producer Survey
2.4. PRODUCTION OUTPUTS
Figure 23: Proportion of farmers whose family living on the poultry farm (By provinces)
89%
73%
91%
84%
Yes
•Chicken farm, base: Total (n=300), Ninh Binh (n=48), Nam Dinh (n=72), Quang Binh HR (n=36) Quang Binh LR (n=48), Hau Giang (n=48), Soc Trang (n=48) •Duck farm, base: Total (n=300), Ninh Binh (n=48), Nam Dinh (n=48), Quang Binh HR (n=45), Quang Binh LR (n=15), Hau Giang (n=80), Soc Trang (n=64)
Ninh Binh Nam Dinh Quang BinhHR
Quang BinhLRTotal Soc TrangHau Giang
96%
85%
97%
96%
90%
67%
77%
83%
96%
88%
Chicken farm Duck farm
H9a. Does your family live on the farm ?(SA)
Most of the farms in the five GETS provinces were also the residences of the farm owners’ families. Larger numbers of farmers lived on the chicken farms compared with the duck farms. Hau Giang was recognized as the province in which the least proportion of farm owner’s families lived on the farms. In a majority of farms, at least 2 to 5 families visited the farm and over one-fifth of respondents in the southern provinces reported that only one family member visited the farm.
Table 19: The number of people living on the farm
No. of people living on the farm
Type of farm TOTAL Ninh
Binh Nam Dinh
Quang Binh Hau Giang
Soc Trang HRD LRD
One person CF 15 4 11 6 9 35 24 DF 17 5 7 9 10 31 34
From 2 to 5 people CF 83 94 87 94 86 62 74 DF 81 93 94 85 90 74 66
From 6 to 10 people
CF 2 2 1 0 5 3 0 DF 2 2 0 6 0 3 0
More than 10 people
CF 0 0 0 0 0 0 2 DF 0 0 0 0 0 2 0
As far as the ownership of the vehicles used to collect the farm’s products is concerned, out of 600 respondents more than half of them provided answers to this question and 83% of them used their own vehicles to collect birds and eggs. Among the five GETS provinces, Soc Trang had the highest proportion of farms whose vehicles were used (93%). Ranking second, broker’s/trader’s/collector’s/buyer’s vehicles were also used which was reported by 14% of the respondents, leaving 2% of 395 farmers whose poultry farming products were collected by consumer’s vehicles. In particular, farmers in Soc Trang held the lowest proportion of farms using the broker’s/ trader’s/ collector’s/ buyer’s vehicles (3%) but the highest percentage of farms using consumer’s vehicles (4%).
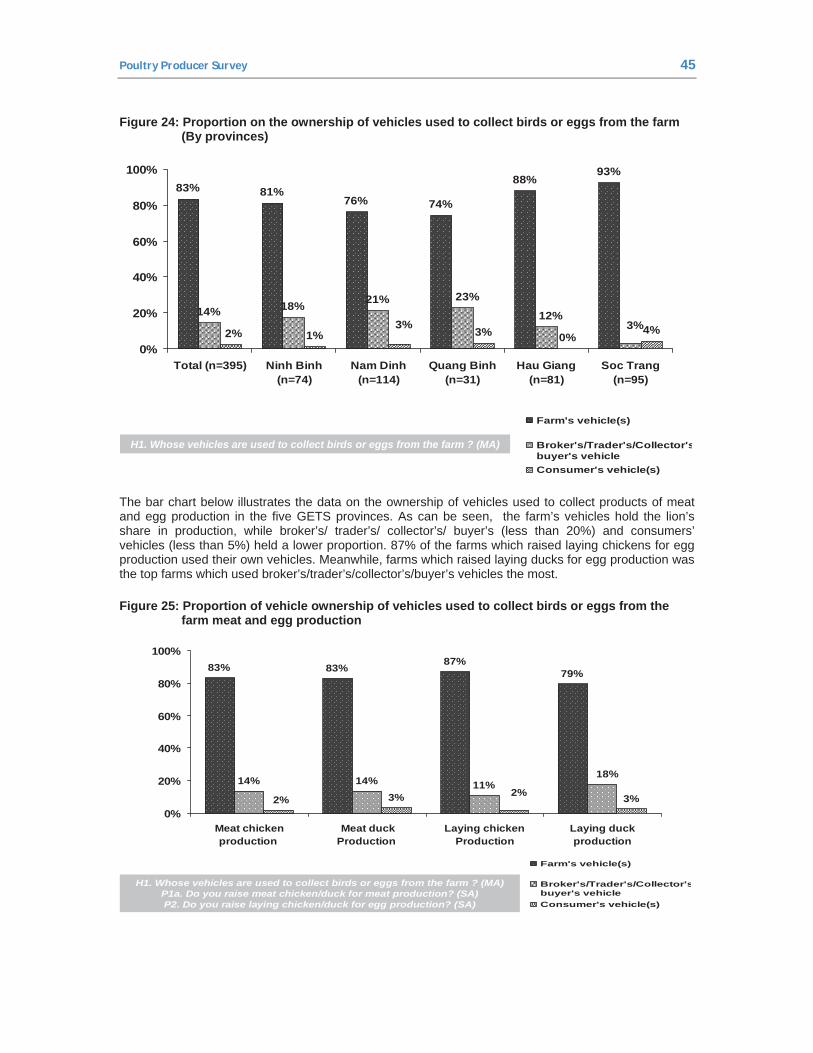
Poultry Producer Survey 45
Figure 24: Proportion on the ownership of vehicles used to collect birds or eggs from the farm (By provinces)
83% 81%76% 74%
88%93%
14% 18% 21%
1% 3% 0% 4%3%12%
23%
2%3%
0%
20%
40%
60%
80%
100%
Total (n=395) Ninh Binh(n=74)
Nam Dinh(n=114)
Quang Binh(n=31)
Hau Giang(n=81)
Soc Trang(n=95)
Farm's vehicle(s)
Broker's/Trader's/Collector'sbuyer's vehicleConsumer's vehicle(s)
H1. Whose vehicles are used to collect birds or eggs from the farm ? (MA)
The bar chart below illustrates the data on the ownership of vehicles used to collect products of meat and egg production in the five GETS provinces. As can be seen, the farm’s vehicles hold the lion’s share in production, while broker’s/ trader’s/ collector’s/ buyer’s (less than 20%) and consumers’ vehicles (less than 5%) held a lower proportion. 87% of the farms which raised laying chickens for egg production used their own vehicles. Meanwhile, farms which raised laying ducks for egg production was the top farms which used broker’s/trader’s/collector’s/buyer’s vehicles the most.
Figure 25: Proportion of vehicle ownership of vehicles used to collect birds or eggs from the farm meat and egg production
83% 83% 87%79%
14% 14% 11%3% 3%
18%
2%2%
0%
20%
40%
60%
80%
100%
Meat chickenproduction
Meat duckProduction
Laying chickenProduction
Laying duckproduction
Farm's vehicle(s)
Broker's/Trader's/Collector'sbuyer's vehicleConsumer's vehicle(s)
H1. Whose vehicles are used to collect birds or eggs from the farm ? (MA) P1a. Do you raise meat chicken/duck for meat production? (SA)P2. Do you raise laying chicken/duck for egg production? (SA)
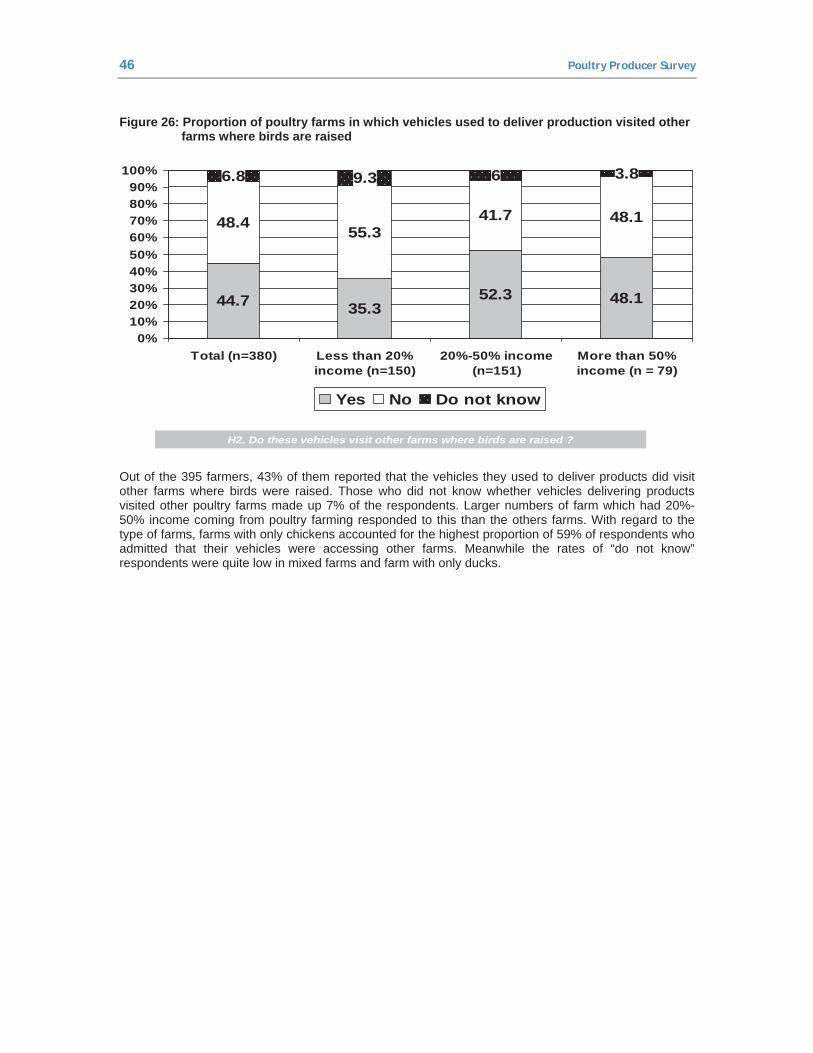
46 Poultry Producer Survey
Figure 26: Proportion of poultry farms in which vehicles used to deliver production visited other farms where birds are raised
6
44.7 35.352.3 48.1
48.4 55.341.7 48.1
6.8 9.3 6 3.8
0%10%20%30%40%50%60%70%80%90%
100%
Total (n=380) Less than 20%income (n=150)
20%-50% income(n=151)
More than 50%income (n = 79)
Yes No Do not know
H2. Do these vehicles visit other farms where birds are raised ?
Out of the 395 farmers, 43% of them reported that the vehicles they used to deliver products did visit other farms where birds were raised. Those who did not know whether vehicles delivering products visited other poultry farms made up 7% of the respondents. Larger numbers of farm which had 20%-50% income coming from poultry farming responded to this than the others farms. With regard to the type of farms, farms with only chickens accounted for the highest proportion of 59% of respondents who admitted that their vehicles were accessing other farms. Meanwhile the rates of “do not know” respondents were quite low in mixed farms and farm with only ducks.
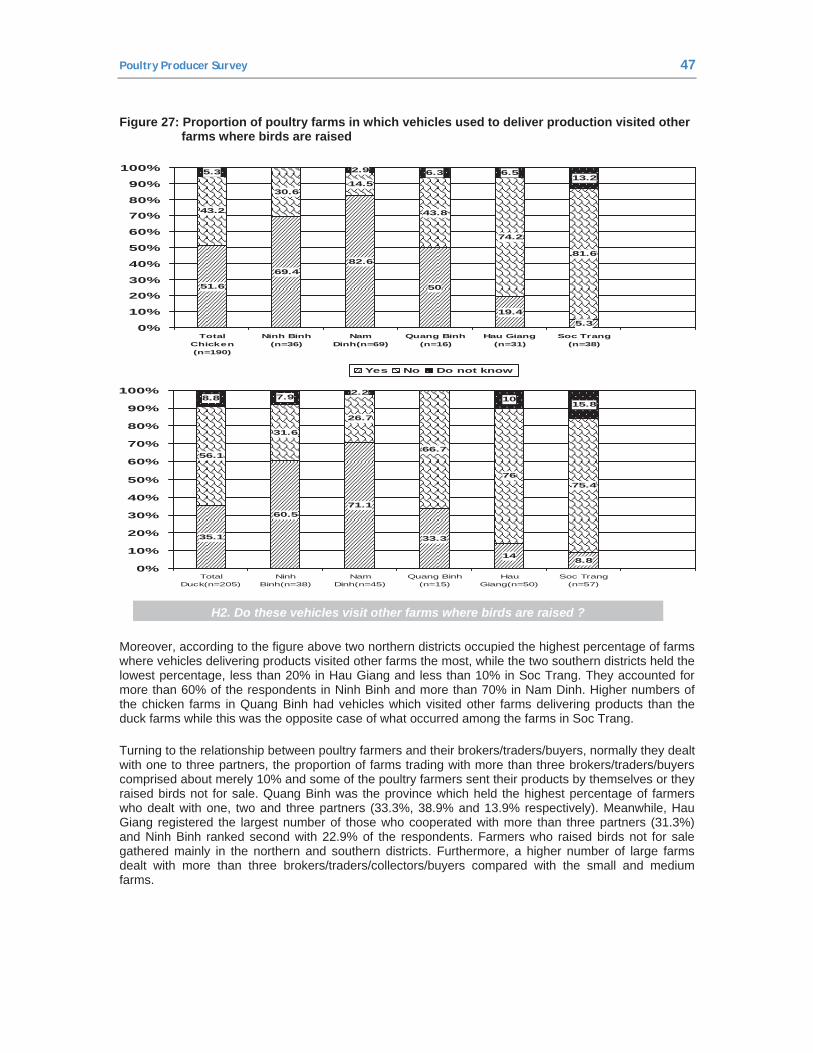
Poultry Producer Survey 47
Figure 27: Proportion of poultry farms in which vehicles used to deliver production visited other farms where birds are raised
H2. Do these vehicles visit other farms where birds are raised ?
51.6
69.482.6
50
19.45.3
43.2
30.614.5
43.8
74.2
81.6
5.3 2.9 6.3 6.513.2
0%
10%
20%
30%
40%
50%
60%
70%
80%
90%
100%
TotalChicken(n=190)
Ninh Binh(n=36)
NamDinh(n=69)
Quang Binh(n=16)
Hau Giang(n=31)
Soc Trang(n=38)
Yes No Do not know
35.1
60.571.1
33.3
14 8.8
56.1
31.6
66.7
7675.4
8.8 7.9 2.210
15.8
26.7
0%
10%
20%
30%
40%
50%
60%
70%
80%
90%
100%
TotalDuck(n=205)
NinhBinh(n=38)
NamDinh(n=45)
Quang Binh(n=15)
HauGiang(n=50)
Soc Trang(n=57)
Moreover, according to the figure above two northern districts occupied the highest percentage of farms where vehicles delivering products visited other farms the most, while the two southern districts held the lowest percentage, less than 20% in Hau Giang and less than 10% in Soc Trang. They accounted for more than 60% of the respondents in Ninh Binh and more than 70% in Nam Dinh. Higher numbers of the chicken farms in Quang Binh had vehicles which visited other farms delivering products than the duck farms while this was the opposite case of what occurred among the farms in Soc Trang.
Turning to the relationship between poultry farmers and their brokers/traders/buyers, normally they dealt with one to three partners, the proportion of farms trading with more than three brokers/traders/buyers comprised about merely 10% and some of the poultry farmers sent their products by themselves or they raised birds not for sale. Quang Binh was the province which held the highest percentage of farmers who dealt with one, two and three partners (33.3%, 38.9% and 13.9% respectively). Meanwhile, Hau Giang registered the largest number of those who cooperated with more than three partners (31.3%) and Ninh Binh ranked second with 22.9% of the respondents. Farmers who raised birds not for sale gathered mainly in the northern and southern districts. Furthermore, a higher number of large farms dealt with more than three brokers/traders/collectors/buyers compared with the small and medium farms.
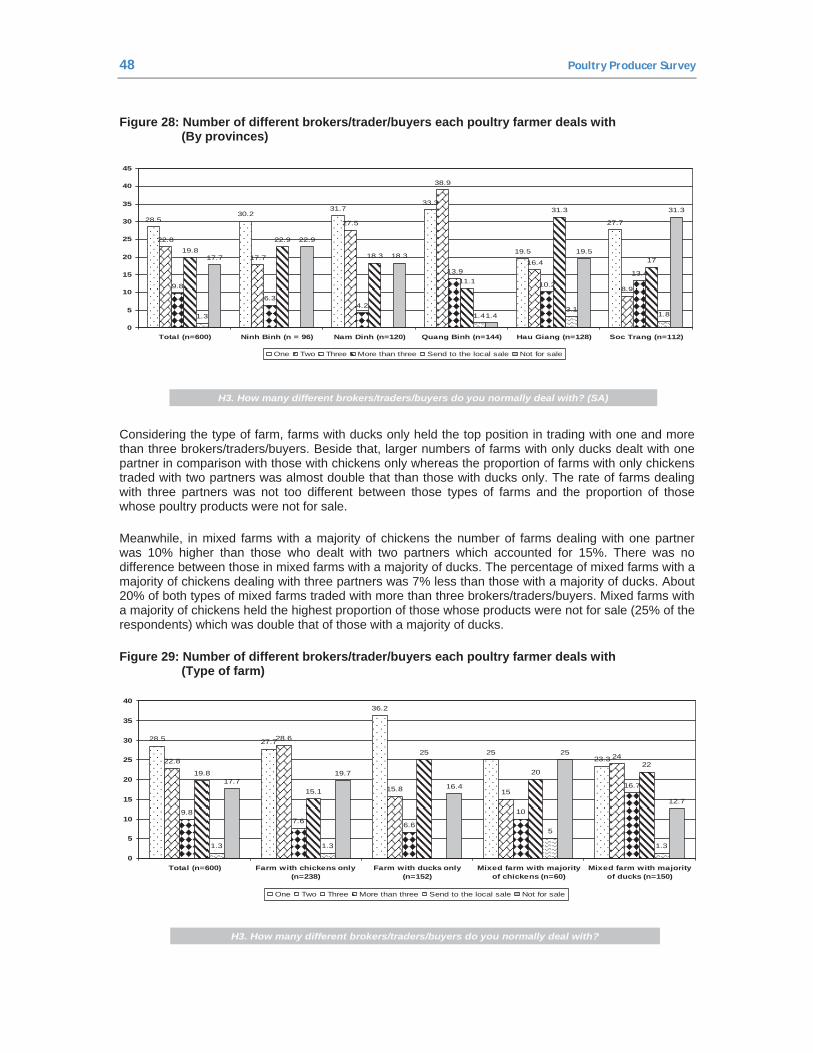
48 Poultry Producer Survey
Figure 28: Number of different brokers/trader/buyers each poultry farmer deals with (By provinces)
H3. How many different brokers/traders/buyers do you normally deal with? (SA)
28.530.2
31.733.3
19.5
27.7
22.8
17.7
27.5
38.9
16.4
8.99.8
6.34.2
13.9
10.2
13.4
19.822.9
18.3
11.1
31.3
17
1.3 1.43.1
1.8
17.7
22.9
18.3
1.4
19.5
31.3
0
5
10
15
20
25
30
35
40
45
Total (n=600) Ninh Binh (n = 96) Nam Dinh (n=120) Quang Binh (n=144) Hau Giang (n=128) Soc Trang (n=112)
One Two Three More than three Send to the local sale Not for sale
Considering the type of farm, farms with ducks only held the top position in trading with one and more than three brokers/traders/buyers. Beside that, larger numbers of farms with only ducks dealt with one partner in comparison with those with chickens only whereas the proportion of farms with only chickens traded with two partners was almost double that than those with ducks only. The rate of farms dealing with three partners was not too different between those types of farms and the proportion of those whose poultry products were not for sale.
Meanwhile, in mixed farms with a majority of chickens the number of farms dealing with one partner was 10% higher than those who dealt with two partners which accounted for 15%. There was no difference between those in mixed farms with a majority of ducks. The percentage of mixed farms with a majority of chickens dealing with three partners was 7% less than those with a majority of ducks. About 20% of both types of mixed farms traded with more than three brokers/traders/buyers. Mixed farms with a majority of chickens held the highest proportion of those whose products were not for sale (25% of the respondents) which was double that of those with a majority of ducks.
Figure 29: Number of different brokers/trader/buyers each poultry farmer deals with (Type of farm)
H3. How many different brokers/traders/buyers do you normally deal with?
28.5 27.7
36.2
2523.322.8
28.6
15.8 15
24
9.87.6 6.6
10
16.7
19.8
15.1
25
2022
1.3 1.3
5
1.3
17.719.7
16.4
25
12.7
0
5
10
15
20
25
30
35
40
Total (n=600) Farm with chickens only(n=238)
Farm with ducks only(n=152)
Mixed farm with majorityof chickens (n=60)
Mixed farm with majorityof ducks (n=150)
One Two Three More than three Send to the local sale Not for sale
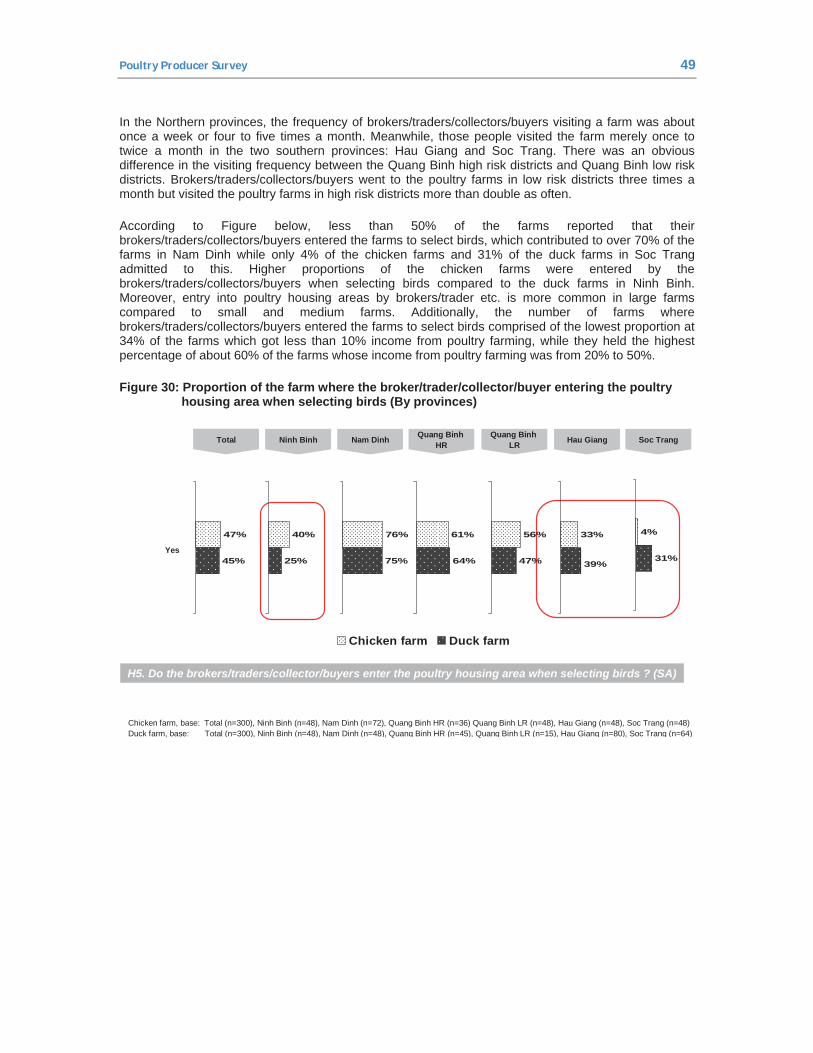
Poultry Producer Survey 49
In the Northern provinces, the frequency of brokers/traders/collectors/buyers visiting a farm was about once a week or four to five times a month. Meanwhile, those people visited the farm merely once to twice a month in the two southern provinces: Hau Giang and Soc Trang. There was an obvious difference in the visiting frequency between the Quang Binh high risk districts and Quang Binh low risk districts. Brokers/traders/collectors/buyers went to the poultry farms in low risk districts three times a month but visited the poultry farms in high risk districts more than double as often.
According to Figure below, less than 50% of the farms reported that their brokers/traders/collectors/buyers entered the farms to select birds, which contributed to over 70% of the farms in Nam Dinh while only 4% of the chicken farms and 31% of the duck farms in Soc Trang admitted to this. Higher proportions of the chicken farms were entered by the brokers/traders/collectors/buyers when selecting birds compared to the duck farms in Ninh Binh. Moreover, entry into poultry housing areas by brokers/trader etc. is more common in large farms compared to small and medium farms. Additionally, the number of farms where brokers/traders/collectors/buyers entered the farms to select birds comprised of the lowest proportion at 34% of the farms which got less than 10% income from poultry farming, while they held the highest percentage of about 60% of the farms whose income from poultry farming was from 20% to 50%.
Figure 30: Proportion of the farm where the broker/trader/collector/buyer entering the poultry housing area when selecting birds (By provinces)
Yes
•Chicken farm, base: Total (n=300), Ninh Binh (n=48), Nam Dinh (n=72), Quang Binh HR (n=36) Quang Binh LR (n=48), Hau Giang (n=48), Soc Trang (n=48) •Duck farm, base: Total (n=300), Ninh Binh (n=48), Nam Dinh (n=48), Quang Binh HR (n=45), Quang Binh LR (n=15), Hau Giang (n=80), Soc Trang (n=64)
Ninh Binh Nam Dinh Quang BinhHR
Quang BinhLRTotal Soc TrangHau Giang
61%
64%
47%
45%
40%
25%
76%
75%
56%
47%
33%
39%
4%
31%
Chicken farm Duck farm
H5. Do the brokers/traders/collector/buyers enter the poultry housing area when selecting birds ? (SA)
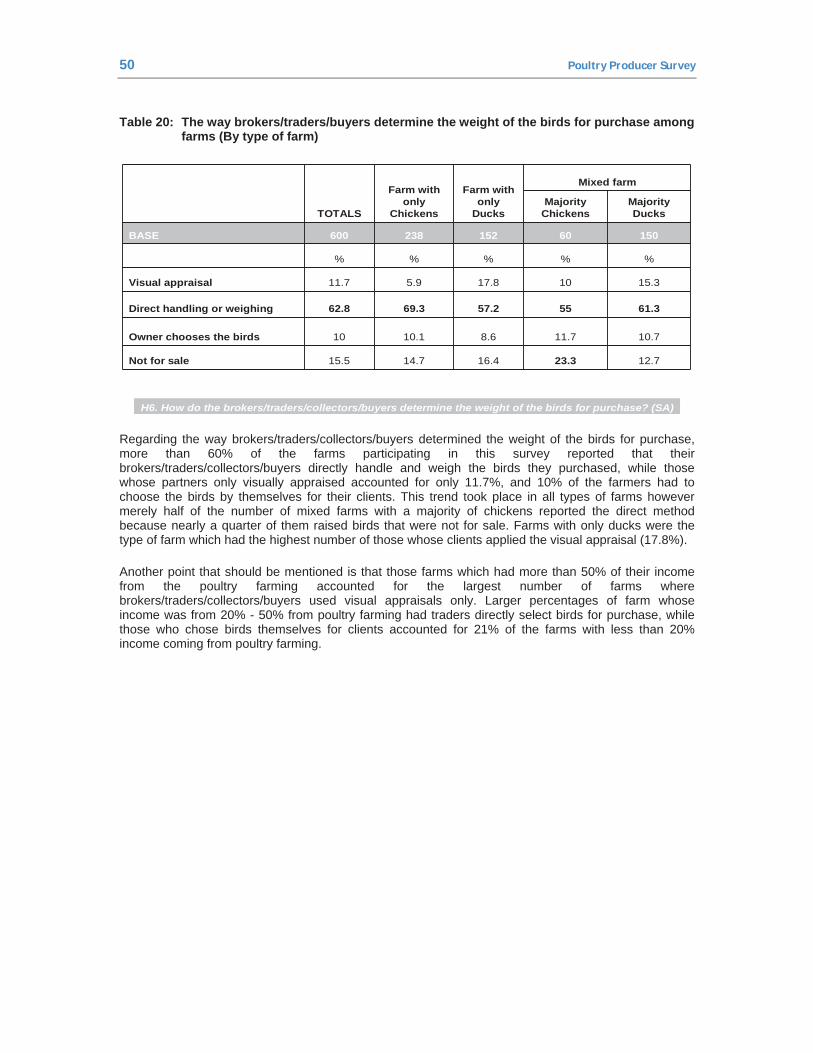
50 Poultry Producer Survey
Table 20: The way brokers/traders/buyers determine the weight of the birds for purchase among farms (By type of farm)
TOTALS
Farm with only
Chickens
Farm with only
Ducks
Mixed farm
Majority Chickens
Majority Ducks
BASE 600 238 152 60 150
% % % % %
Visual appraisal 11.7 5.9 17.8 10 15.3
Direct handling or weighing 62.8 69.3 57.2 55 61.3
Owner chooses the birds 10 10.1 8.6 11.7 10.7
Not for sale 15.5 14.7 16.4 23.3 12.7
H6. How do the brokers/traders/collectors/buyers determine the weight of the birds for purchase? (SA)
Regarding the way brokers/traders/collectors/buyers determined the weight of the birds for purchase, more than 60% of the farms participating in this survey reported that their brokers/traders/collectors/buyers directly handle and weigh the birds they purchased, while those whose partners only visually appraised accounted for only 11.7%, and 10% of the farmers had to choose the birds by themselves for their clients. This trend took place in all types of farms however merely half of the number of mixed farms with a majority of chickens reported the direct method because nearly a quarter of them raised birds that were not for sale. Farms with only ducks were the type of farm which had the highest number of those whose clients applied the visual appraisal (17.8%).
Another point that should be mentioned is that those farms which had more than 50% of their income from the poultry farming accounted for the largest number of farms where brokers/traders/collectors/buyers used visual appraisals only. Larger percentages of farm whose income was from 20% - 50% from poultry farming had traders directly select birds for purchase, while those who chose birds themselves for clients accounted for 21% of the farms with less than 20% income coming from poultry farming.
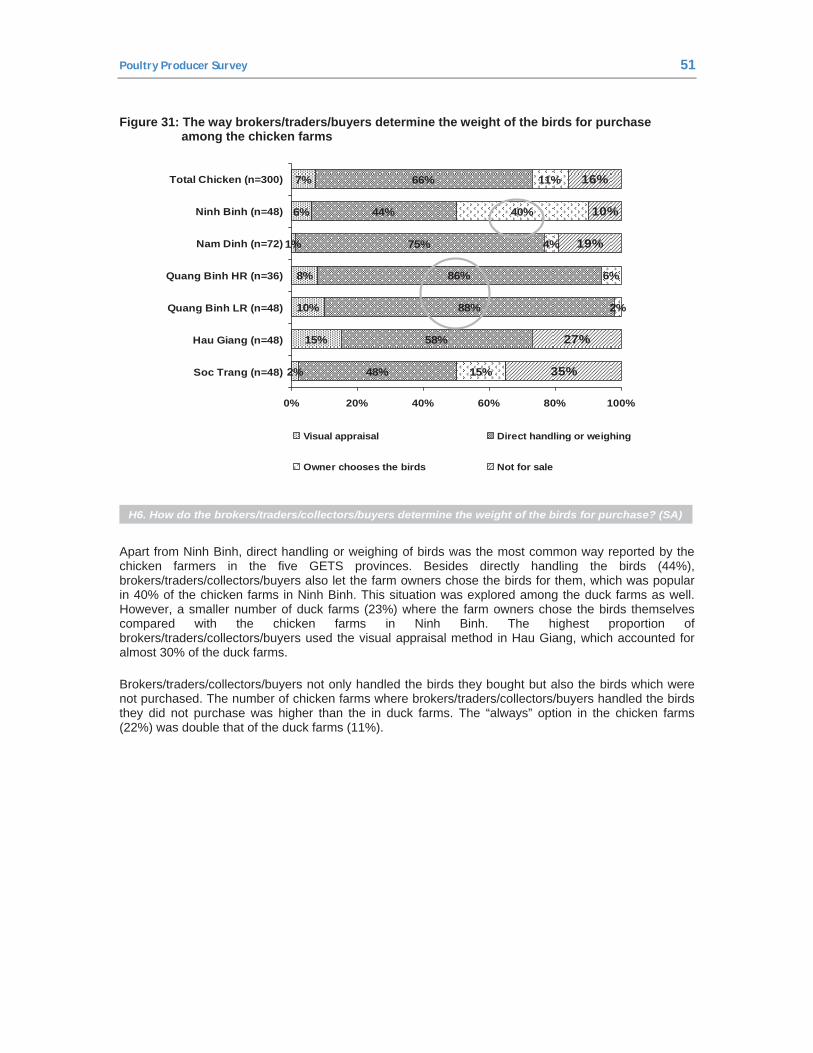
Poultry Producer Survey 51
Figure 31: The way brokers/traders/buyers determine the weight of the birds for purchase among the chicken farms
7%
6%
1%
8%
10%
15%
2%
66%
44%
75%
86%
88%
58%
48%
11%
40%
4%
6%
2%
15%
16%
10%
19%
27%
35%
0% 20% 40% 60% 80% 100%
Total Chicken (n=300)
Ninh Binh (n=48)
Nam Dinh (n=72)
Quang Binh HR (n=36)
Quang Binh LR (n=48)
Hau Giang (n=48)
Soc Trang (n=48)
Visual appraisal Direct handling or weighing
Owner chooses the birds Not for sale
H6. How do the brokers/traders/collectors/buyers determine the weight of the birds for purchase? (SA)
Apart from Ninh Binh, direct handling or weighing of birds was the most common way reported by the chicken farmers in the five GETS provinces. Besides directly handling the birds (44%), brokers/traders/collectors/buyers also let the farm owners chose the birds for them, which was popular in 40% of the chicken farms in Ninh Binh. This situation was explored among the duck farms as well. However, a smaller number of duck farms (23%) where the farm owners chose the birds themselves compared with the chicken farms in Ninh Binh. The highest proportion of brokers/traders/collectors/buyers used the visual appraisal method in Hau Giang, which accounted for almost 30% of the duck farms.
Brokers/traders/collectors/buyers not only handled the birds they bought but also the birds which were not purchased. The number of chicken farms where brokers/traders/collectors/buyers handled the birds they did not purchase was higher than the in duck farms. The “always” option in the chicken farms (22%) was double that of the duck farms (11%).
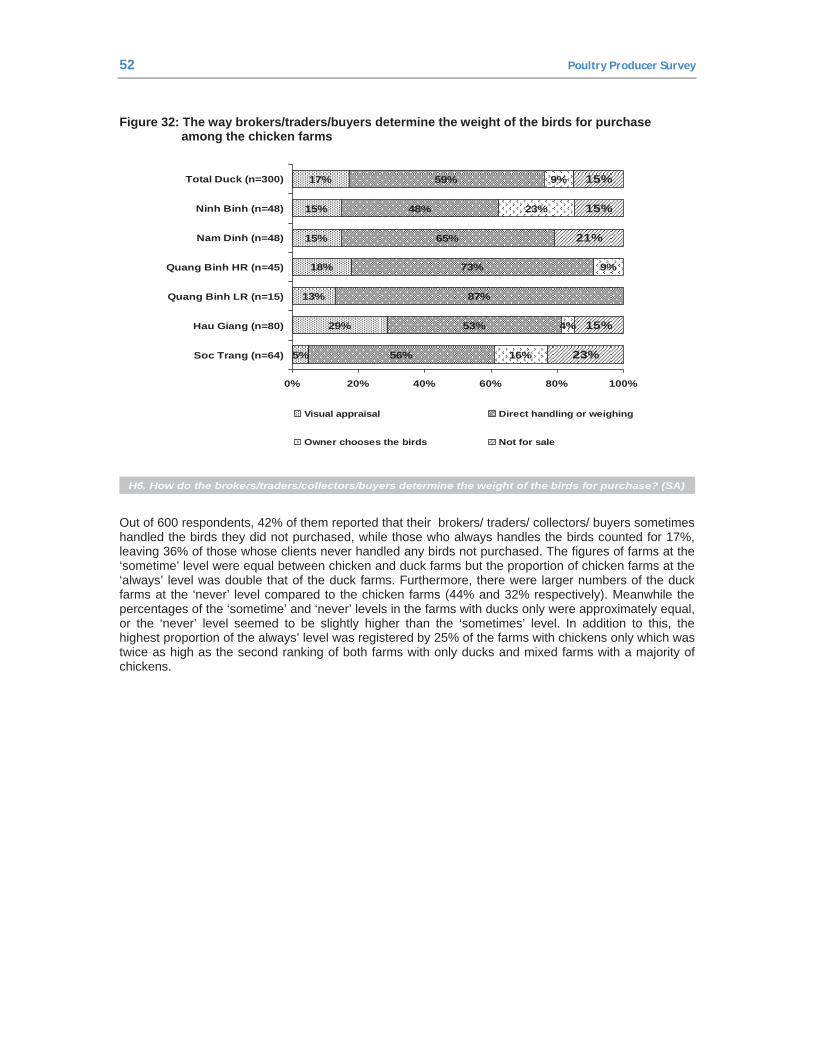
52 Poultry Producer Survey
Figure 32: The way brokers/traders/buyers determine the weight of the birds for purchase among the chicken farms
17%
15%
15%
18%
13%
29%
5%
59%
48%
65%
73%
87%
53%
56%
9%
23%
9%
4%
16%
15%
15%
21%
15%
23%
0% 20% 40% 60% 80% 100%
Total Duck (n=300)
Ninh Binh (n=48)
Nam Dinh (n=48)
Quang Binh HR (n=45)
Quang Binh LR (n=15)
Hau Giang (n=80)
Soc Trang (n=64)
Visual appraisal Direct handling or weighing
Owner chooses the birds Not for sale
H6. How do the brokers/traders/collectors/buyers determine the weight of the birds for purchase? (SA)
Out of 600 respondents, 42% of them reported that their brokers/ traders/ collectors/ buyers sometimes handled the birds they did not purchased, while those who always handles the birds counted for 17%, leaving 36% of those whose clients never handled any birds not purchased. The figures of farms at the ‘sometime’ level were equal between chicken and duck farms but the proportion of chicken farms at the ‘always’ level was double that of the duck farms. Furthermore, there were larger numbers of the duck farms at the ‘never’ level compared to the chicken farms (44% and 32% respectively). Meanwhile the percentages of the ‘sometime’ and ‘never’ levels in the farms with ducks only were approximately equal, or the ‘never’ level seemed to be slightly higher than the ‘sometimes’ level. In addition to this, the highest proportion of the always’ level was registered by 25% of the farms with chickens only which was twice as high as the second ranking of both farms with only ducks and mixed farms with a majority of chickens.
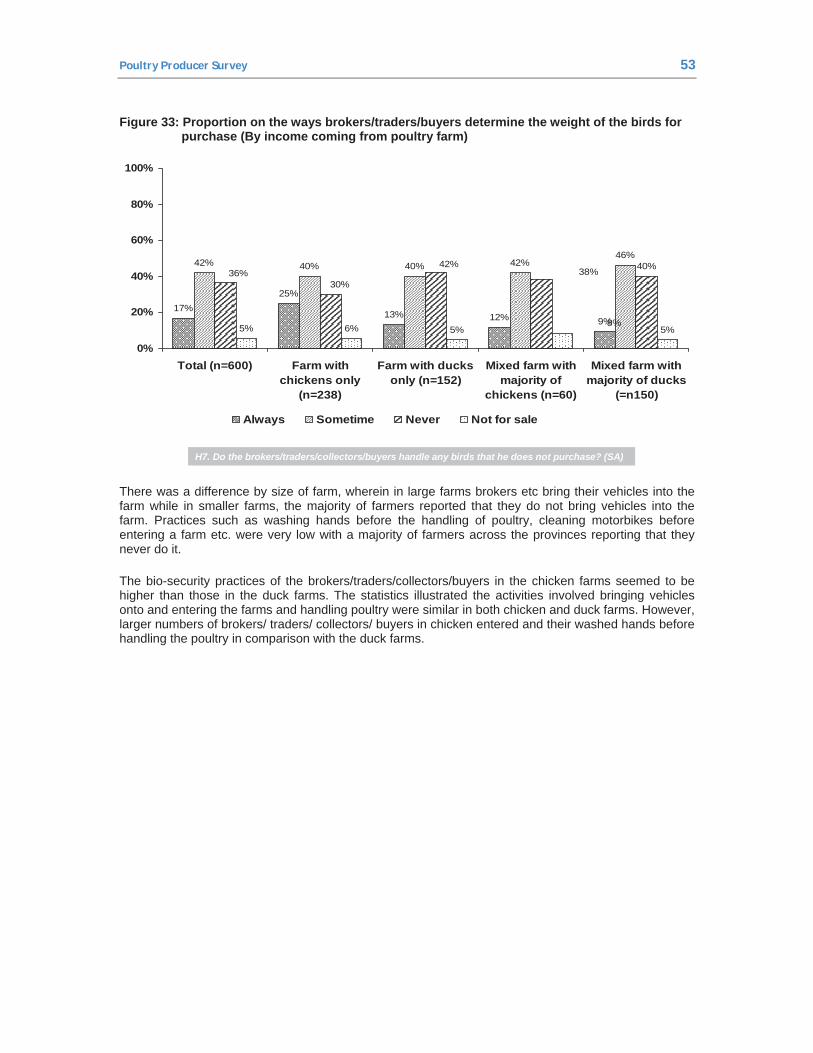
Poultry Producer Survey 53
Figure 33: Proportion on the ways brokers/traders/buyers determine the weight of the birds for purchase (By income coming from poultry farm)
17%25%
13% 12% 9%
42% 40% 40% 42%46%
40%
5% 6% 5% 5%
38%42%
30%36%
8%
0%
20%
40%
60%
80%
100%
Total (n=600) Farm withchickens only
(n=238)
Farm with ducksonly (n=152)
Mixed farm withmajority of
chickens (n=60)
Mixed farm withmajority of ducks
(=n150)
Always Sometime Never Not for sale
H7. Do the brokers/traders/collectors/buyers handle any birds that he does not purchase? (SA)
There was a difference by size of farm, wherein in large farms brokers etc bring their vehicles into the farm while in smaller farms, the majority of farmers reported that they do not bring vehicles into the farm. Practices such as washing hands before the handling of poultry, cleaning motorbikes before entering a farm etc. were very low with a majority of farmers across the provinces reporting that they never do it.
The bio-security practices of the brokers/traders/collectors/buyers in the chicken farms seemed to be higher than those in the duck farms. The statistics illustrated the activities involved bringing vehicles onto and entering the farms and handling poultry were similar in both chicken and duck farms. However, larger numbers of brokers/ traders/ collectors/ buyers in chicken entered and their washed hands before handling the poultry in comparison with the duck farms.
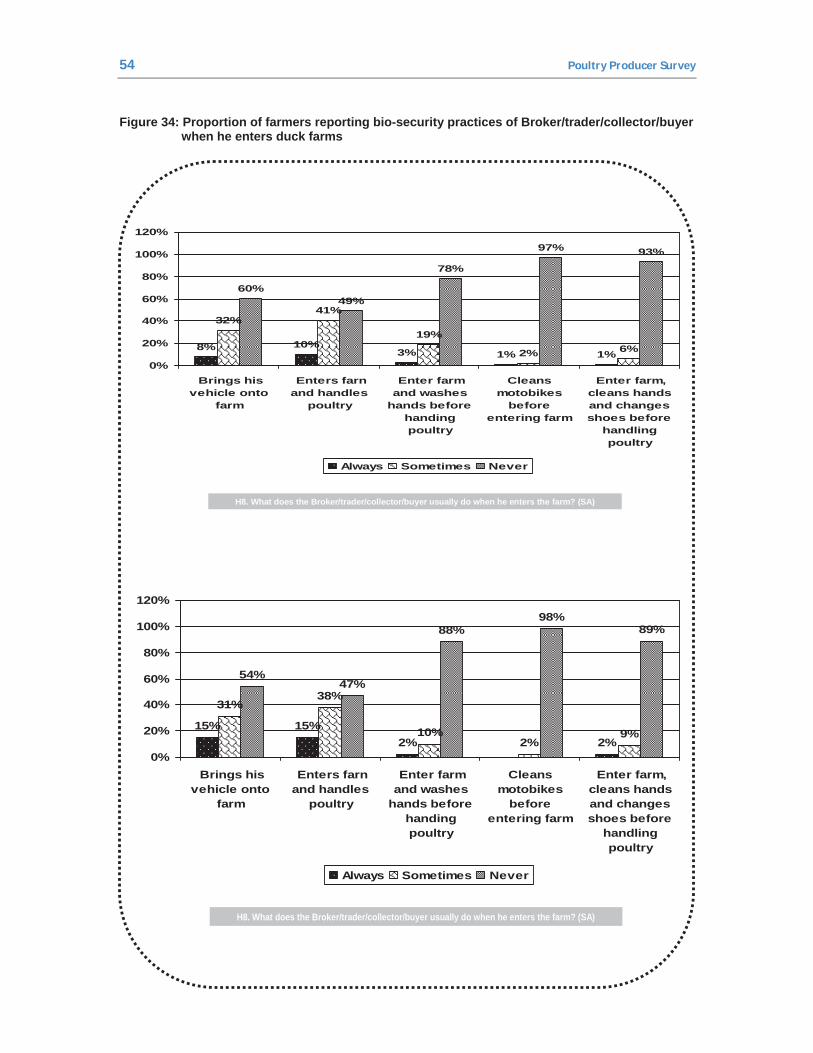
54 Poultry Producer Survey
Figure 34: Proportion of farmers reporting bio-security practices of Broker/trader/collector/buyer when he enters duck farms
8% 10%3% 1% 1%
32%41%
19%
2% 6%
60%49%
78%
97% 93%
0%
20%
40%
60%
80%
100%
120%
Brings hisvehicle onto
farm
Enters farnand handles
poultry
Enter farmand washes
hands beforehandingpoultry
Cleansmotobikes
beforeentering farm
Enter farm,cleans handsand changesshoes before
handlingpoultry
Always Sometimes Never
H8. What does the Broker/trader/collector/buyer usually do when he enters the farm? (SA)
15% 15%2% 2%
31%38%
10%2%
9%
54%47%
88%98%
89%
0%
20%
40%
60%
80%
100%
120%
Brings hisvehicle onto
farm
Enters farnand handles
poultry
Enter farmand washes
hands beforehandingpoultry
Cleansmotobikes
beforeentering farm
Enter farm,cleans handsand changesshoes before
handlingpoultry
Always Sometimes Never
H8. What does the Broker/trader/collector/buyer usually do when he enters the farm? (SA)
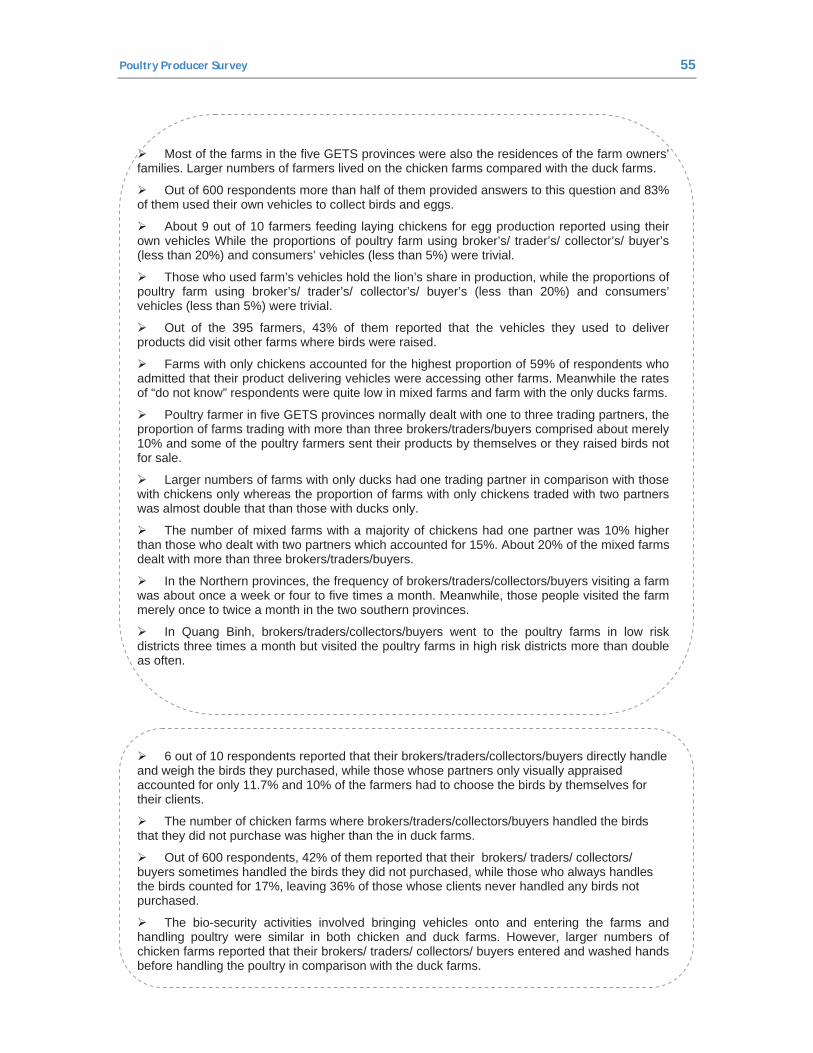
Poultry Producer Survey 55
Most of the farms in the five GETS provinces were also the residences of the farm owners’ families. Larger numbers of farmers lived on the chicken farms compared with the duck farms.
Out of 600 respondents more than half of them provided answers to this question and 83% of them used their own vehicles to collect birds and eggs.
About 9 out of 10 farmers feeding laying chickens for egg production reported using their own vehicles While the proportions of poultry farm using broker’s/ trader’s/ collector’s/ buyer’s (less than 20%) and consumers’ vehicles (less than 5%) were trivial.
Those who used farm’s vehicles hold the lion’s share in production, while the proportions of poultry farm using broker’s/ trader’s/ collector’s/ buyer’s (less than 20%) and consumers’ vehicles (less than 5%) were trivial.
Out of the 395 farmers, 43% of them reported that the vehicles they used to deliver products did visit other farms where birds were raised.
Farms with only chickens accounted for the highest proportion of 59% of respondents who admitted that their product delivering vehicles were accessing other farms. Meanwhile the rates of “do not know” respondents were quite low in mixed farms and farm with the only ducks farms.
Poultry farmer in five GETS provinces normally dealt with one to three trading partners, the proportion of farms trading with more than three brokers/traders/buyers comprised about merely 10% and some of the poultry farmers sent their products by themselves or they raised birds not for sale.
Larger numbers of farms with only ducks had one trading partner in comparison with those with chickens only whereas the proportion of farms with only chickens traded with two partners was almost double that than those with ducks only.
The number of mixed farms with a majority of chickens had one partner was 10% higher than those who dealt with two partners which accounted for 15%. About 20% of the mixed farms dealt with more than three brokers/traders/buyers.
In the Northern provinces, the frequency of brokers/traders/collectors/buyers visiting a farm was about once a week or four to five times a month. Meanwhile, those people visited the farm merely once to twice a month in the two southern provinces.
In Quang Binh, brokers/traders/collectors/buyers went to the poultry farms in low risk districts three times a month but visited the poultry farms in high risk districts more than double as often.
6 out of 10 respondents reported that their brokers/traders/collectors/buyers directly handle and weigh the birds they purchased, while those whose partners only visually appraised accounted for only 11.7% and 10% of the farmers had to choose the birds by themselves for their clients.
The number of chicken farms where brokers/traders/collectors/buyers handled the birds that they did not purchase was higher than the in duck farms.
Out of 600 respondents, 42% of them reported that their brokers/ traders/ collectors/ buyers sometimes handled the birds they did not purchased, while those who always handles the birds counted for 17%, leaving 36% of those whose clients never handled any birds not purchased.
The bio-security activities involved bringing vehicles onto and entering the farms and handling poultry were similar in both chicken and duck farms. However, larger numbers of chicken farms reported that their brokers/ traders/ collectors/ buyers entered and washed hands before handling the poultry in comparison with the duck farms.
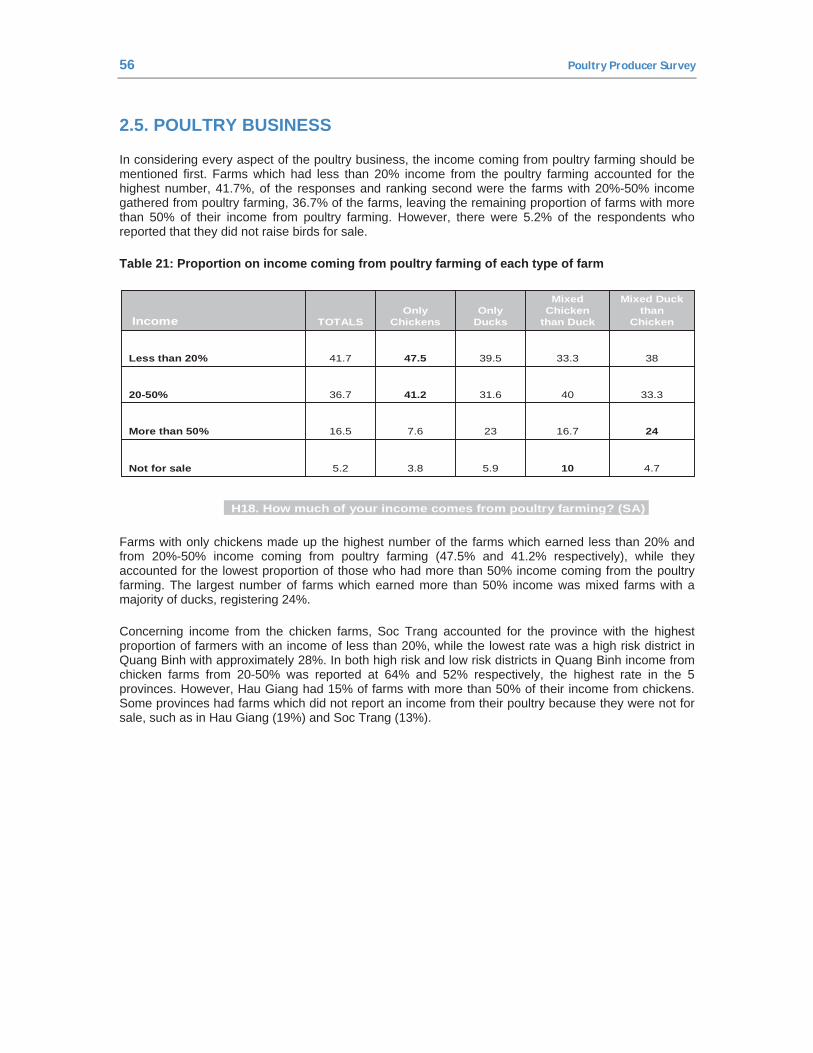
56 Poultry Producer Survey
2.5. POULTRY BUSINESS
In considering every aspect of the poultry business, the income coming from poultry farming should be mentioned first. Farms which had less than 20% income from the poultry farming accounted for the highest number, 41.7%, of the responses and ranking second were the farms with 20%-50% income gathered from poultry farming, 36.7% of the farms, leaving the remaining proportion of farms with more than 50% of their income from poultry farming. However, there were 5.2% of the respondents who reported that they did not raise birds for sale.
Table 21: Proportion on income coming from poultry farming of each type of farm
H18. How much of your income comes from poultry farming? (SA)
4.7105.93.85.2Not for sale
2416.7237.616.5More than 50%
33.34031.641.236.720-50%
3833.339.547.541.7Less than 20%
Mixed Duck than
Chicken
Mixed Chicken
than DuckOnly
DucksOnly
ChickensTOTALSIncome
Farms with only chickens made up the highest number of the farms which earned less than 20% and from 20%-50% income coming from poultry farming (47.5% and 41.2% respectively), while they accounted for the lowest proportion of those who had more than 50% income coming from the poultry farming. The largest number of farms which earned more than 50% income was mixed farms with a majority of ducks, registering 24%.
Concerning income from the chicken farms, Soc Trang accounted for the province with the highest proportion of farmers with an income of less than 20%, while the lowest rate was a high risk district in Quang Binh with approximately 28%. In both high risk and low risk districts in Quang Binh income from chicken farms from 20-50% was reported at 64% and 52% respectively, the highest rate in the 5 provinces. However, Hau Giang had 15% of farms with more than 50% of their income from chickens. Some provinces had farms which did not report an income from their poultry because they were not for sale, such as in Hau Giang (19%) and Soc Trang (13%).
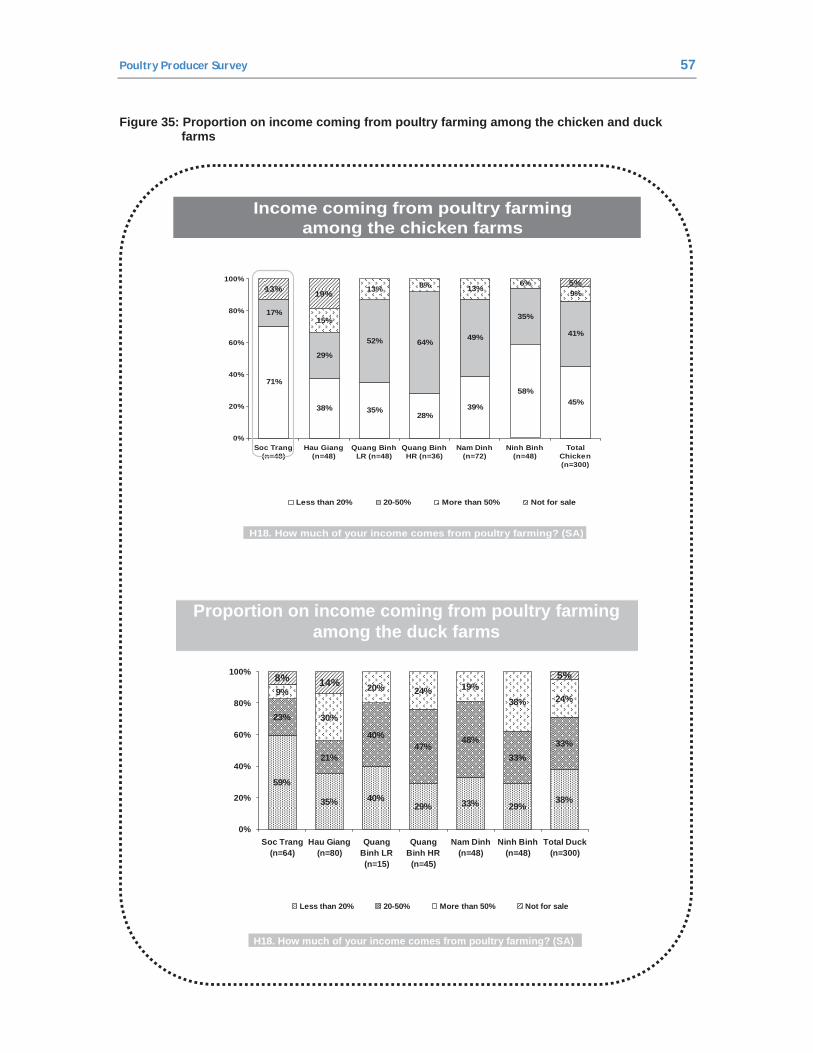
Poultry Producer Survey 57
Figure 35: Proportion on income coming from poultry farming among the chicken and duck farms
Income coming from poultry farming among the chicken farms
H18. How much of your income comes from poultry farming? (SA)
45%58%
39%28%
35%38%
71%
41%
35%
49%64%52%
29%
17%
9%6%
13%8%13%
15%
5%19%13%
0%
20%
40%
60%
80%
100%
TotalChicken(n=300)
Ninh Binh(n=48)
Nam Dinh(n=72)
Quang BinhHR (n=36)
Quang BinhLR (n=48)
Hau Giang(n=48)
Soc Trang(n=48)
Less than 20% 20-50% More than 50% Not for sale
38%29%33%29%
40%35%
59%
33%33%
48%47%
40%
21%
23%
24%38%19%24%20%
30%
9%
5%14%8%
0%
20%
40%
60%
80%
100%
Total Duck(n=300)
Ninh Binh(n=48)
Nam Dinh(n=48)
QuangBinh HR
(n=45)
QuangBinh LR(n=15)
Hau Giang(n=80)
Soc Trang(n=64)
Less than 20% 20-50% More than 50% Not for sale
H18. How much of your income comes from poultry farming? (SA)
Proportion on income coming from poultry farming among the duck farms
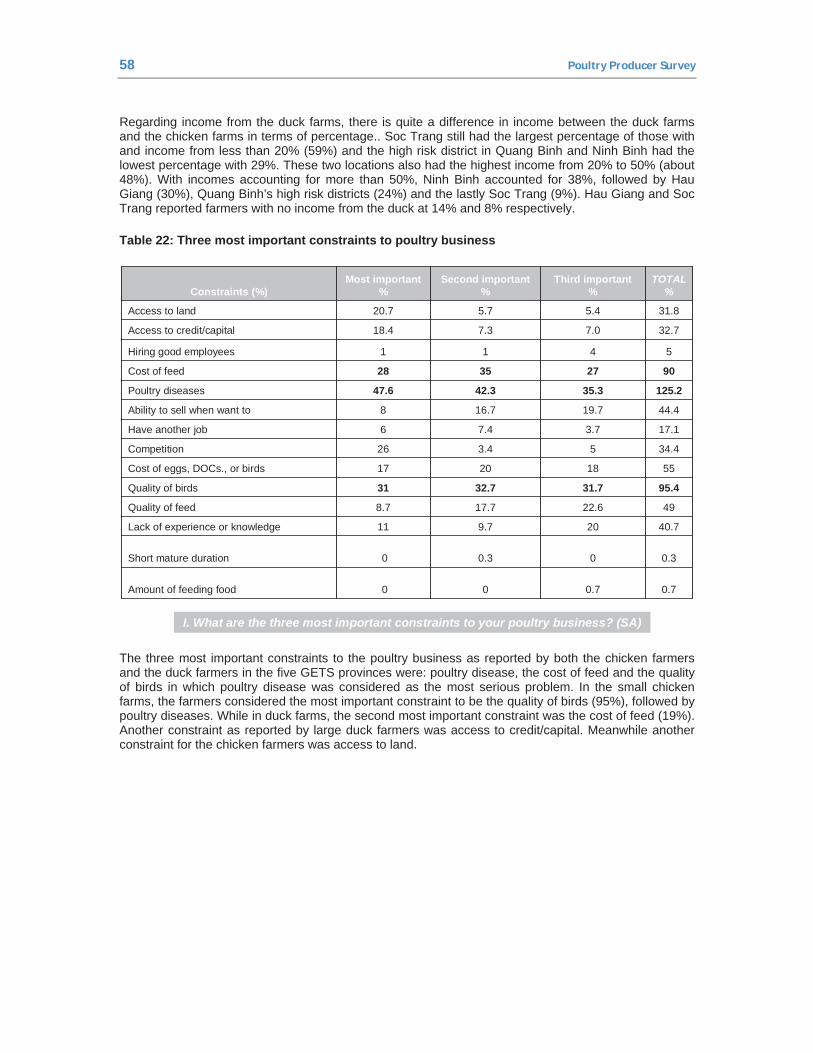
58 Poultry Producer Survey
Regarding income from the duck farms, there is quite a difference in income between the duck farms and the chicken farms in terms of percentage.. Soc Trang still had the largest percentage of those with and income from less than 20% (59%) and the high risk district in Quang Binh and Ninh Binh had the lowest percentage with 29%. These two locations also had the highest income from 20% to 50% (about 48%). With incomes accounting for more than 50%, Ninh Binh accounted for 38%, followed by Hau Giang (30%), Quang Binh’s high risk districts (24%) and the lastly Soc Trang (9%). Hau Giang and Soc Trang reported farmers with no income from the duck at 14% and 8% respectively.
Table 22: Three most important constraints to poultry business
0.7
0
20
22.6
31.7
18
5
3.7
19.7
35.3
27
4
7.0
5.4
Third important%
0.700Amount of feeding food
0.30.30Short mature duration
40.79.711Lack of experience or knowledge
4917.78.7Quality of feed
95.432.731Quality of birds
552017Cost of eggs, DOCs., or birds
34.43.426Competition
17.17.46Have another job
44.416.78Ability to sell when want to
125.242.347.6Poultry diseases
903528Cost of feed
511Hiring good employees
32.77.318.4Access to credit/capital
31.85.720.7Access to land
TOTAL%
Second important%
Most important%Constraints (%)
I. What are the three most important constraints to your poultry business? (SA)
The three most important constraints to the poultry business as reported by both the chicken farmers and the duck farmers in the five GETS provinces were: poultry disease, the cost of feed and the quality of birds in which poultry disease was considered as the most serious problem. In the small chicken farms, the farmers considered the most important constraint to be the quality of birds (95%), followed by poultry diseases. While in duck farms, the second most important constraint was the cost of feed (19%). Another constraint as reported by large duck farmers was access to credit/capital. Meanwhile another constraint for the chicken farmers was access to land.
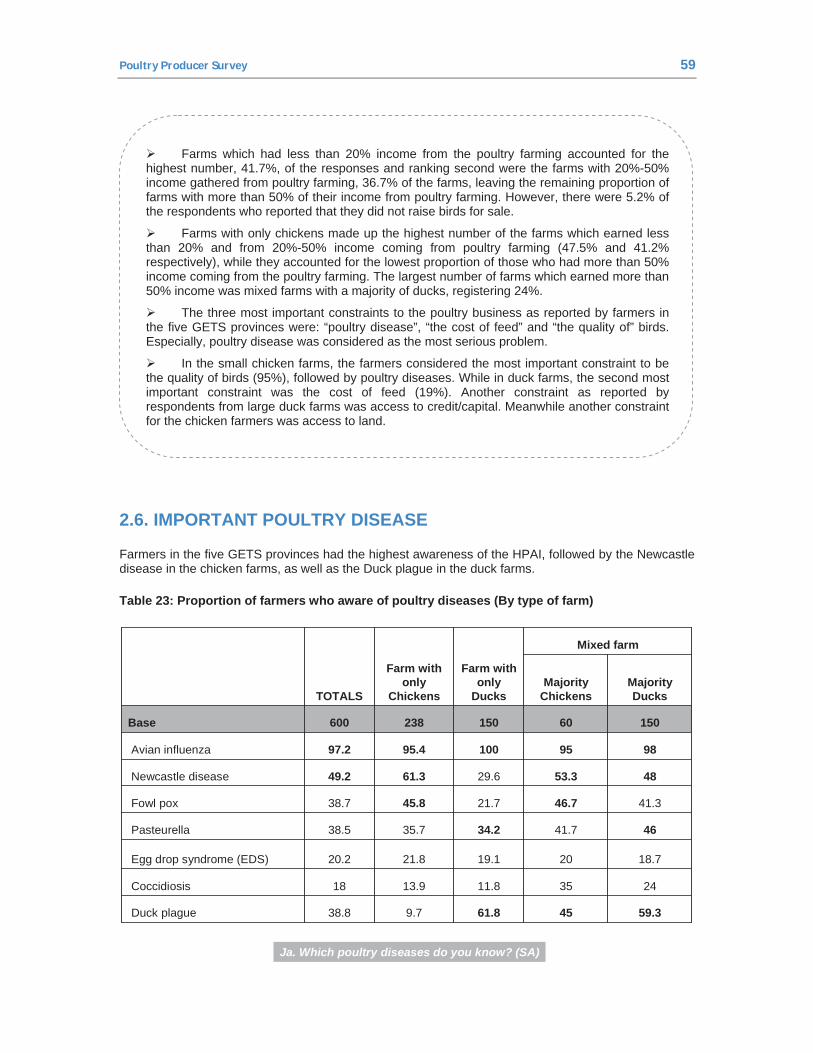
Poultry Producer Survey 59
Farms which had less than 20% income from the poultry farming accounted for the highest number, 41.7%, of the responses and ranking second were the farms with 20%-50% income gathered from poultry farming, 36.7% of the farms, leaving the remaining proportion of farms with more than 50% of their income from poultry farming. However, there were 5.2% of the respondents who reported that they did not raise birds for sale.
Farms with only chickens made up the highest number of the farms which earned less than 20% and from 20%-50% income coming from poultry farming (47.5% and 41.2% respectively), while they accounted for the lowest proportion of those who had more than 50% income coming from the poultry farming. The largest number of farms which earned more than 50% income was mixed farms with a majority of ducks, registering 24%.
The three most important constraints to the poultry business as reported by farmers in the five GETS provinces were: “poultry disease”, “the cost of feed” and “the quality of” birds. Especially, poultry disease was considered as the most serious problem.
In the small chicken farms, the farmers considered the most important constraint to be the quality of birds (95%), followed by poultry diseases. While in duck farms, the second most important constraint was the cost of feed (19%). Another constraint as reported by respondents from large duck farms was access to credit/capital. Meanwhile another constraint for the chicken farmers was access to land.
2.6. IMPORTANT POULTRY DISEASE
Farmers in the five GETS provinces had the highest awareness of the HPAI, followed by the Newcastle disease in the chicken farms, as well as the Duck plague in the duck farms.
Table 23: Proportion of farmers who aware of poultry diseases (By type of farm)
Majority Ducks
Majority Chickens
15060150238600Base
59.34561.89.738.8Duck plague
243511.813.918Coccidiosis
18.72019.121.820.2Egg drop syndrome (EDS)
4641.734.235.738.5Pasteurella
41.346.721.745.838.7Fowl pox
4853.329.661.349.2Newcastle disease
989510095.497.2Avian influenza
Mixed farm
Farm with only
Ducks
Farm with only
ChickensTOTALS
Ja. Which poultry diseases do you know? (SA)
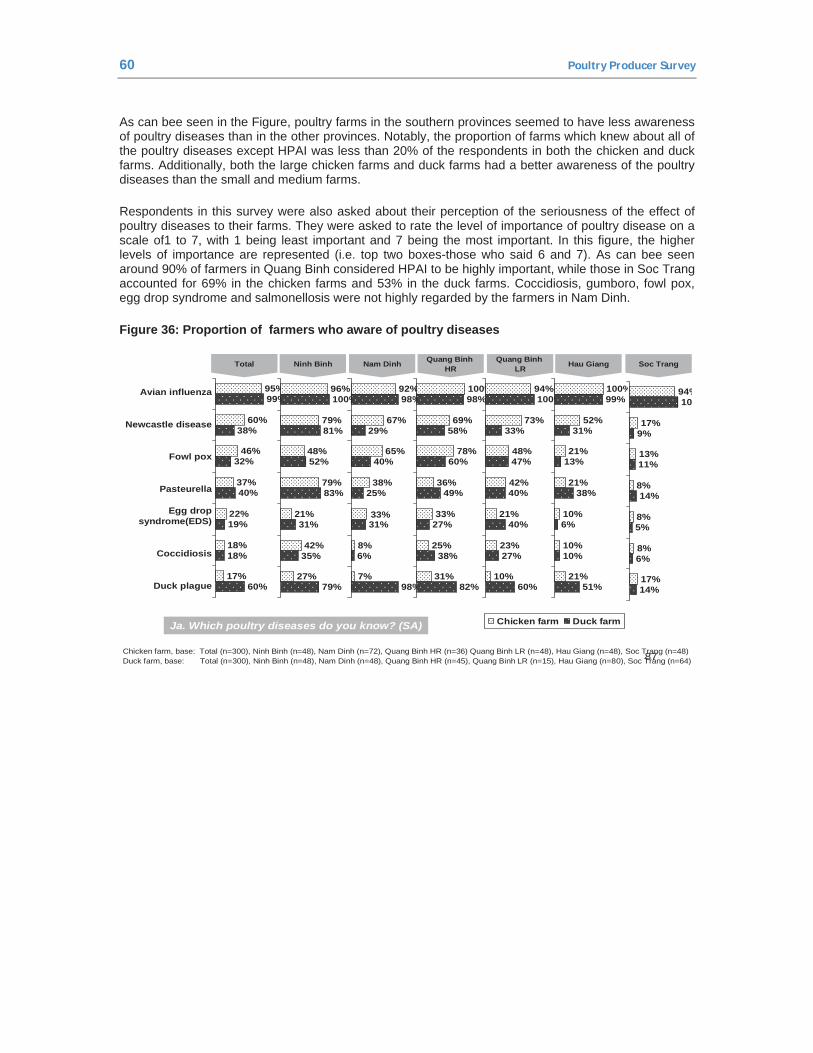
60 Poultry Producer Survey
As can bee seen in the Figure, poultry farms in the southern provinces seemed to have less awareness of poultry diseases than in the other provinces. Notably, the proportion of farms which knew about all of the poultry diseases except HPAI was less than 20% of the respondents in both the chicken and duck farms. Additionally, both the large chicken farms and duck farms had a better awareness of the poultry diseases than the small and medium farms.
Respondents in this survey were also asked about their perception of the seriousness of the effect of poultry diseases to their farms. They were asked to rate the level of importance of poultry disease on a scale of1 to 7, with 1 being least important and 7 being the most important. In this figure, the higher levels of importance are represented (i.e. top two boxes-those who said 6 and 7). As can bee seen around 90% of farmers in Quang Binh considered HPAI to be highly important, while those in Soc Trang accounted for 69% in the chicken farms and 53% in the duck farms. Coccidiosis, gumboro, fowl pox, egg drop syndrome and salmonellosis were not highly regarded by the farmers in Nam Dinh.
Figure 36: Proportion of farmers who aware of poultry diseases
87•Chicken farm, base: Total (n=300), Ninh Binh (n=48), Nam Dinh (n=72), Quang Binh HR (n=36) Quang Binh LR (n=48), Hau Giang (n=48), Soc Trang (n=48) •Duck farm, base: Total (n=300), Ninh Binh (n=48), Nam Dinh (n=48), Quang Binh HR (n=45), Quang Binh LR (n=15), Hau Giang (n=80), Soc Trang (n=64)
Duck plague
Coccidiosis
Egg drop syndrome(EDS)
Pasteurella
Fowl pox
Newcastle disease
Avian influenza
Ninh Binh Nam Dinh Quang BinhHR
Quang BinhLRTotal Soc TrangHau Giang
Chicken farm Duck farm
17%
18%
22%
37%
46%
60%
95%
60%
18%
19%
40%
32%
38%
99%
27%
42%
21%
79%
48%
79%
96%
79%
35%
31%
83%
52%
81%
100%
7%
8%
33%
38%
65%
67%
92%
98%
6%
31%
25%
40%
29%
98%
31%
25%
33%
36%
78%
69%
100%
82%
38%
27%
49%
60%
58%
98%
10%
23%
21%
42%
48%
73%
94%
60%
27%
40%
40%
47%
33%
100%
21%
10%
10%
21%
21%
52%
100%
51%
10%
6%
38%
13%
31%
99%94%
17%
8%
8%
8%
13%
17%
100
14%
6%
5%
14%
11%
9%
Ja. Which poultry diseases do you know? (SA)
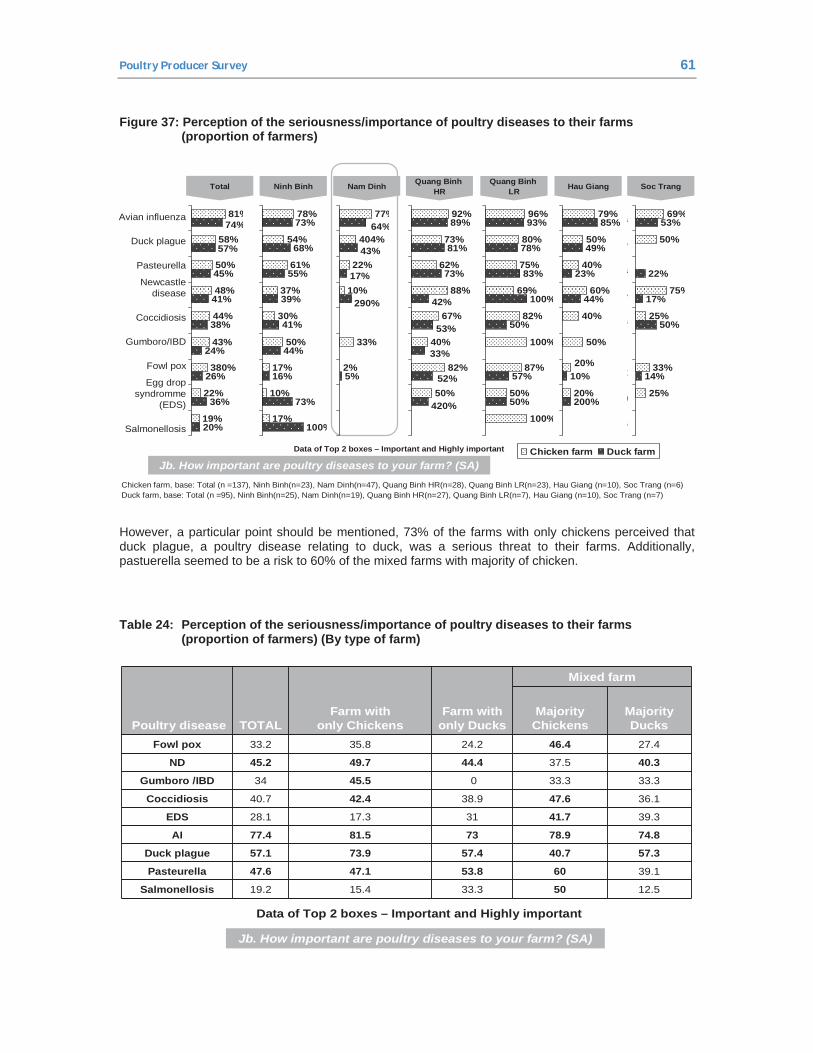
Poultry Producer Survey 61
Figure 37: Perception of the seriousness/importance of poultry diseases to their farms (proportion of farmers)
Chicken farm, base: Total (n =137), Ninh Binh(n=23), Nam Dinh(n=47), Quang Binh HR(n=28), Quang Binh LR(n=23), Hau Giang (n=10), Soc Trang (n=6) Duck farm, base: Total (n =95), Ninh Binh(n=25), Nam Dinh(n=19), Quang Binh HR(n=27), Quang Binh LR(n=7), Hau Giang (n=10), Soc Trang (n=7)
Avian influenza
Duck plague
Pasteurella
Newcastle disease
Coccidiosis
Gumboro/IBD
Fowl pox
Egg drop syndromme
(EDS)
Salmonellosis
Ninh Binh Nam Dinh Quang BinhHR
Quang BinhLRTotal Soc TrangHau Giang
19%
22%
380%
43%
44%
48%
50%
58%
81%
20%
36%
26%
24%
38%
41%
45%
57%
74%
17%
10%
17%
50%
30%
37%
61%
54%
78%
100%
73%
16%
44%
41%
39%
55%
68%
73%
2%
33%
10%
22%
404%
77%
5%
290%
17%
43%
64%
50%
82%
40%
67%
88%
62%
73%
92%
420%
52%
33%
53%
42%
73%
81%
89%
100%
50%
87%
100%
82%
69%
75%
80%
96%
50%
57%
50%
100%
83%
78%
93%
20%
20%
50%
40%
60%
40%
50%
79%
200%
10%
44%
23%
49%
85%
25%
33%
25%
75%
50%
69%
14%
50%
17%
22%
53%a
e
a
e
s
x
)
s
Chicken farm Duck farmJb. How important are poultry diseases to your farm? (SA)
Data of Top 2 boxes – Important and Highly important
However, a particular point should be mentioned, 73% of the farms with only chickens perceived that duck plague, a poultry disease relating to duck, was a serious threat to their farms. Additionally, pastuerella seemed to be a risk to 60% of the mixed farms with majority of chicken.
Table 24: Perception of the seriousness/importance of poultry diseases to their farms (proportion of farmers) (By type of farm)
Jb. How important are poultry diseases to your farm? (SA)
Poultry disease TOTALFarm with
only ChickensFarm with
only Ducks
Mixed farm
Majority Chickens
Majority Ducks
Fowl pox 33.2 35.8 24.2 46.4 27.4
ND 45.2 49.7 44.4 37.5 40.3
Gumboro /IBD 34 45.5 0 33.3 33.3
Coccidiosis 40.7 42.4 38.9 47.6 36.1
EDS 28.1 17.3 31 41.7 39.3
AI 77.4 81.5 73 78.9 74.8
Duck plague 57.1 73.9 57.4 40.7 57.3
Pasteurella 47.6 47.1 53.8 60 39.1
Salmonellosis 19.2 15.4 33.3 50 12.5
Data of Top 2 boxes – Important and Highly important
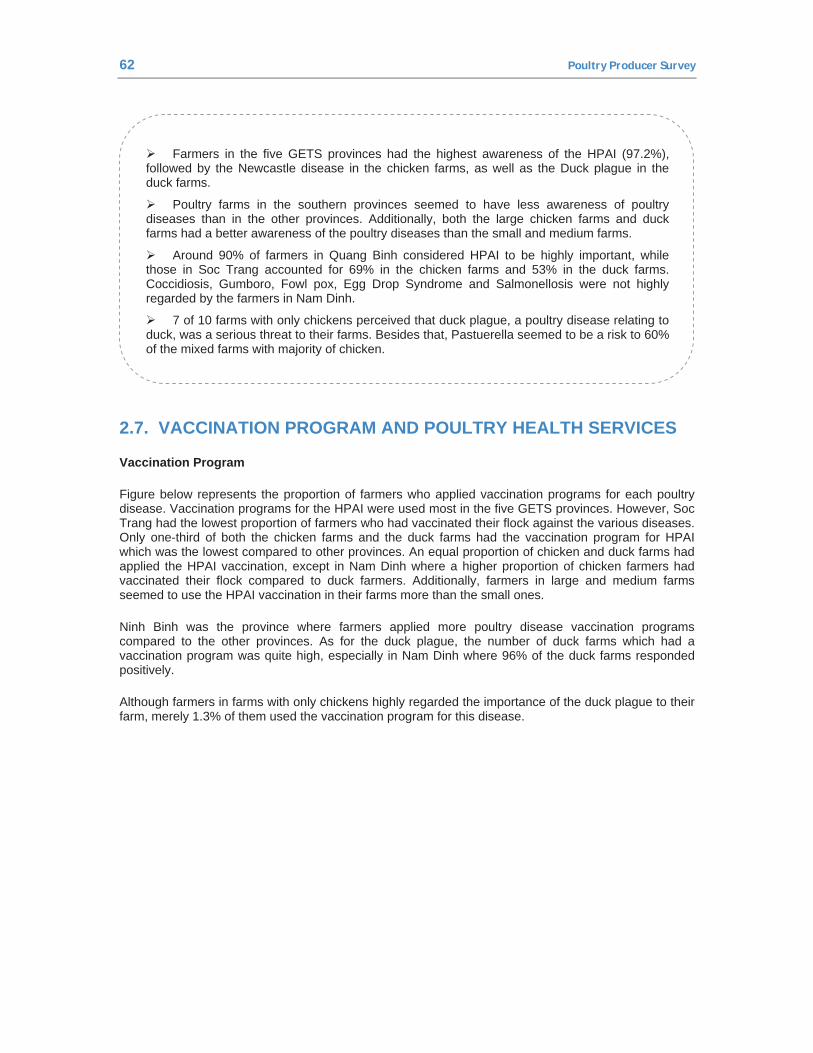
62 Poultry Producer Survey
Farmers in the five GETS provinces had the highest awareness of the HPAI (97.2%), followed by the Newcastle disease in the chicken farms, as well as the Duck plague in the duck farms.
Poultry farms in the southern provinces seemed to have less awareness of poultry diseases than in the other provinces. Additionally, both the large chicken farms and duck farms had a better awareness of the poultry diseases than the small and medium farms.
Around 90% of farmers in Quang Binh considered HPAI to be highly important, while those in Soc Trang accounted for 69% in the chicken farms and 53% in the duck farms. Coccidiosis, Gumboro, Fowl pox, Egg Drop Syndrome and Salmonellosis were not highly regarded by the farmers in Nam Dinh.
7 of 10 farms with only chickens perceived that duck plague, a poultry disease relating to duck, was a serious threat to their farms. Besides that, Pastuerella seemed to be a risk to 60% of the mixed farms with majority of chicken.
2.7. VACCINATION PROGRAM AND POULTRY HEALTH SERVICES
Vaccination Program
Figure below represents the proportion of farmers who applied vaccination programs for each poultry disease. Vaccination programs for the HPAI were used most in the five GETS provinces. However, Soc Trang had the lowest proportion of farmers who had vaccinated their flock against the various diseases. Only one-third of both the chicken farms and the duck farms had the vaccination program for HPAI which was the lowest compared to other provinces. An equal proportion of chicken and duck farms had applied the HPAI vaccination, except in Nam Dinh where a higher proportion of chicken farmers had vaccinated their flock compared to duck farmers. Additionally, farmers in large and medium farms seemed to use the HPAI vaccination in their farms more than the small ones.
Ninh Binh was the province where farmers applied more poultry disease vaccination programs compared to the other provinces. As for the duck plague, the number of duck farms which had a vaccination program was quite high, especially in Nam Dinh where 96% of the duck farms responded positively.
Although farmers in farms with only chickens highly regarded the importance of the duck plague to their farm, merely 1.3% of them used the vaccination program for this disease.
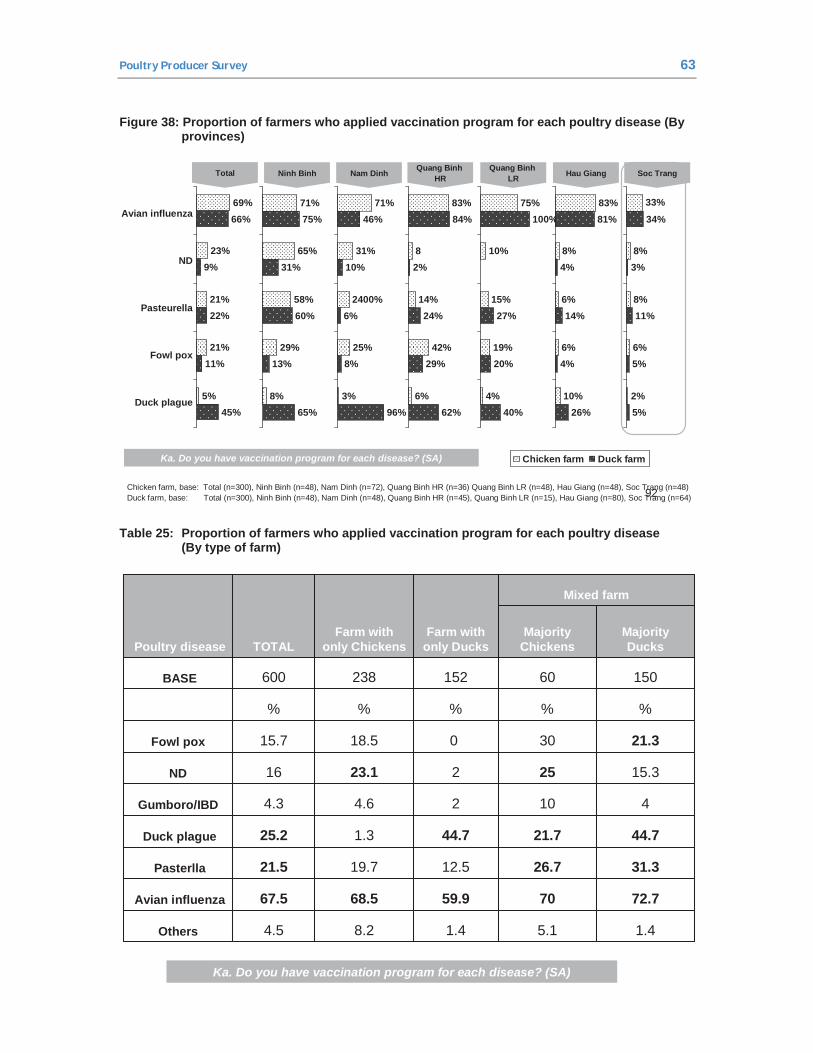
Poultry Producer Survey 63
Figure 38: Proportion of farmers who applied vaccination program for each poultry disease (By provinces)
92•Chicken farm, base: Total (n=300), Ninh Binh (n=48), Nam Dinh (n=72), Quang Binh HR (n=36) Quang Binh LR (n=48), Hau Giang (n=48), Soc Trang (n=48) •Duck farm, base: Total (n=300), Ninh Binh (n=48), Nam Dinh (n=48), Quang Binh HR (n=45), Quang Binh LR (n=15), Hau Giang (n=80), Soc Trang (n=64)
Duck plague
Fowl pox
Pasteurella
ND
Avian influenza
Ninh Binh Nam Dinh Quang BinhHR
Quang BinhLRTotal Soc TrangHau Giang
5%
21%
21%
23%
69%
45%
11%
22%
9%
66%
8%
29%
58%
65%
71%
65%
13%
60%
31%
75%
3%
25%
2400%
31%
71%
96%
8%
6%
10%
46%
6%
42%
14%
8
83%
62%
29%
24%
2%
84%
4%
19%
15%
10%
75%
40%
20%
27%
100%
10%
6%
6%
8%
83%
26%
4%
14%
4%
81%
2%
6%
8%
8%
33%
5%
5%
11%
3%
34%
Chicken farm Duck farmKa. Do you have vaccination program for each disease? (SA)
Table 25: Proportion of farmers who applied vaccination program for each poultry disease (By type of farm)
Mixed farm
1.45.11.48.24.5Others
72.77059.968.567.5Avian influenza
31.326.712.519.721.5Pasterlla
44.721.744.71.325.2Duck plague
41024.64.3Gumboro/IBD
15.325223.116ND
21.330018.515.7Fowl pox
%%%%%
15060152238600BASE
Majority Ducks
Majority Chickens
Farm with only Ducks
Farm with only ChickensTOTALPoultry disease
Ka. Do you have vaccination program for each disease? (SA)
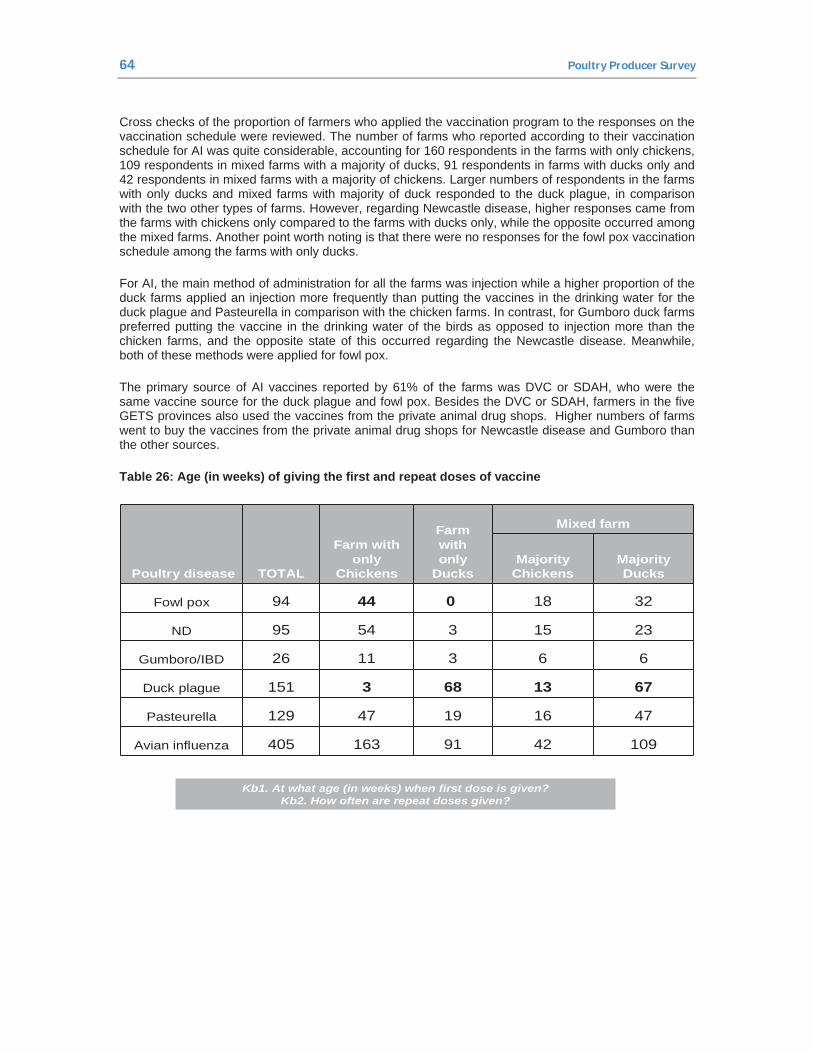
64 Poultry Producer Survey
Cross checks of the proportion of farmers who applied the vaccination program to the responses on the vaccination schedule were reviewed. The number of farms who reported according to their vaccination schedule for AI was quite considerable, accounting for 160 respondents in the farms with only chickens, 109 respondents in mixed farms with a majority of ducks, 91 respondents in farms with ducks only and 42 respondents in mixed farms with a majority of chickens. Larger numbers of respondents in the farms with only ducks and mixed farms with majority of duck responded to the duck plague, in comparison with the two other types of farms. However, regarding Newcastle disease, higher responses came from the farms with chickens only compared to the farms with ducks only, while the opposite occurred among the mixed farms. Another point worth noting is that there were no responses for the fowl pox vaccination schedule among the farms with only ducks.
For AI, the main method of administration for all the farms was injection while a higher proportion of the duck farms applied an injection more frequently than putting the vaccines in the drinking water for the duck plague and Pasteurella in comparison with the chicken farms. In contrast, for Gumboro duck farms preferred putting the vaccine in the drinking water of the birds as opposed to injection more than the chicken farms, and the opposite state of this occurred regarding the Newcastle disease. Meanwhile, both of these methods were applied for fowl pox.
The primary source of AI vaccines reported by 61% of the farms was DVC or SDAH, who were the same vaccine source for the duck plague and fowl pox. Besides the DVC or SDAH, farmers in the five GETS provinces also used the vaccines from the private animal drug shops. Higher numbers of farms went to buy the vaccines from the private animal drug shops for Newcastle disease and Gumboro than the other sources.
Table 26: Age (in weeks) of giving the first and repeat doses of vaccine
Poultry disease TOTAL
Farm with only
Chickens
Farm with only
Ducks
Mixed farm
Majority Chickens
Majority Ducks
Fowl pox 94 44 0 18 32
ND 95 54 3 15 23
Gumboro/IBD 26 11 3 6 6
Duck plague 151 3 68 13 67
Pasteurella 129 47 19 16 47
Avian influenza 405 163 91 42 109
Kb1. At what age (in weeks) when first dose is given?Kb2. How often are repeat doses given?
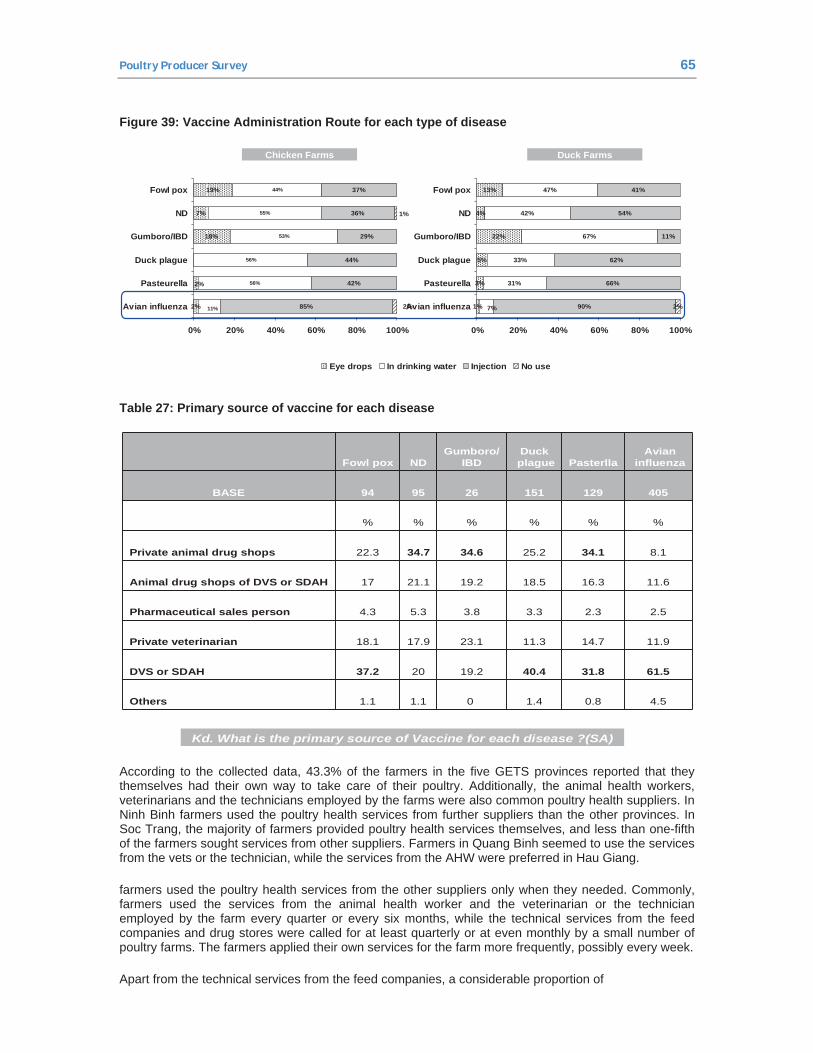
Poultry Producer Survey 65
Figure 39: Vaccine Administration Route for each type of disease
Duck FarmsChicken Farms
19%
7%
18%
2%
44%
55%
53%
56%
56%
37%
36%
29%
44%
42%
85%
2%
11%
1%
2%
0% 20% 40% 60% 80% 100%
Fowl pox
ND
Gumboro/IBD
Duck plague
Pasteurella
Avian influenza
13%
4%
22%
5%
3%
1%
47%
42%
67%
33%
31%
41%
54%
11%
62%
66%
90% 2%7%
0% 20% 40% 60% 80% 100%
Fowl pox
ND
Gumboro/IBD
Duck plague
Pasteurella
Avian influenza
Eye drops In drinking water Injection No use
Table 27: Primary source of vaccine for each disease
Fowl pox NDGumboro/
IBDDuckplague Pasterlla
Avianinfluenza
BASE 94 95 26 151 129 405
% % % % % %
Private animal drug shops 22.3 34.7 34.6 25.2 34.1 8.1
Animal drug shops of DVS or SDAH 17 21.1 19.2 18.5 16.3 11.6
Pharmaceutical sales person 4.3 5.3 3.8 3.3 2.3 2.5
Private veterinarian 18.1 17.9 23.1 11.3 14.7 11.9
DVS or SDAH 37.2 20 19.2 40.4 31.8 61.5
Others 1.1 1.1 0 1.4 0.8 4.5
Kd. What is the primary source of Vaccine for each disease ?(SA)
According to the collected data, 43.3% of the farmers in the five GETS provinces reported that they themselves had their own way to take care of their poultry. Additionally, the animal health workers, veterinarians and the technicians employed by the farms were also common poultry health suppliers. In Ninh Binh farmers used the poultry health services from further suppliers than the other provinces. In Soc Trang, the majority of farmers provided poultry health services themselves, and less than one-fifth of the farmers sought services from other suppliers. Farmers in Quang Binh seemed to use the services from the vets or the technician, while the services from the AHW were preferred in Hau Giang.
farmers used the poultry health services from the other suppliers only when they needed. Commonly, farmers used the services from the animal health worker and the veterinarian or the technician employed by the farm every quarter or every six months, while the technical services from the feed companies and drug stores were called for at least quarterly or at even monthly by a small number of poultry farms. The farmers applied their own services for the farm more frequently, possibly every week.
Apart from the technical services from the feed companies, a considerable proportion of
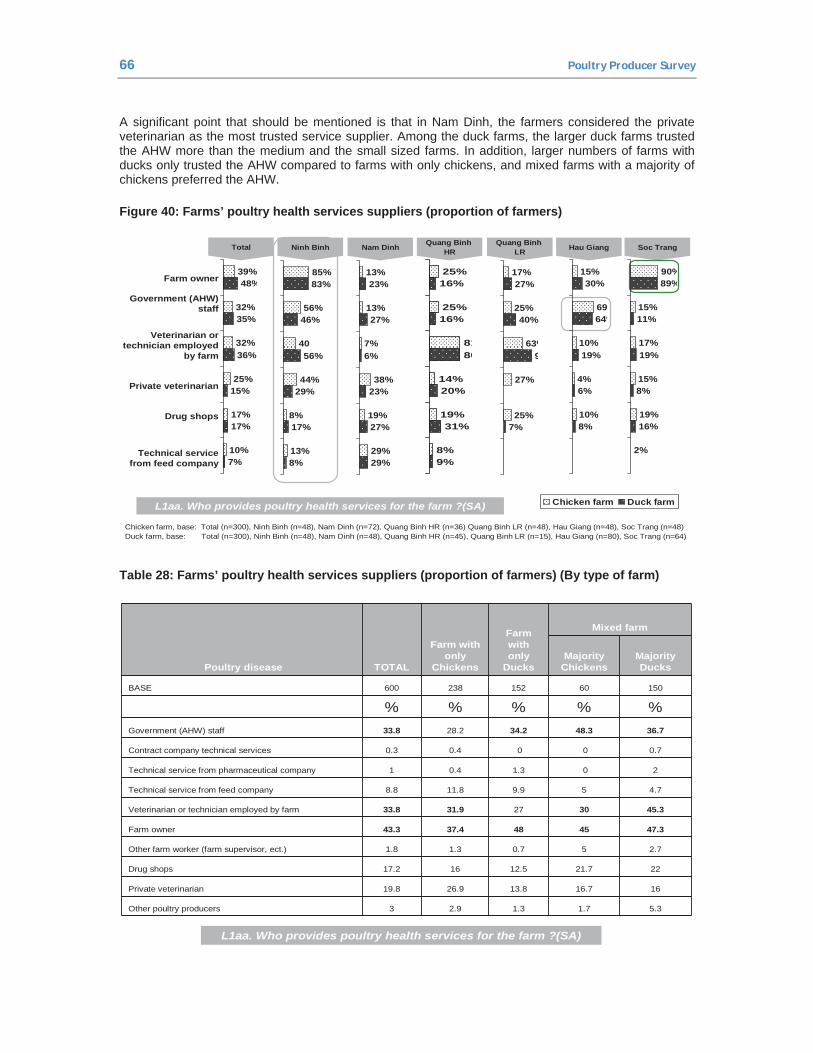
66 Poultry Producer Survey
A significant point that should be mentioned is that in Nam Dinh, the farmers considered the private veterinarian as the most trusted service supplier. Among the duck farms, the larger duck farms trusted the AHW more than the medium and the small sized farms. In addition, larger numbers of farms with ducks only trusted the AHW compared to farms with only chickens, and mixed farms with a majority of chickens preferred the AHW.
Figure 40: Farms’ poultry health services suppliers (proportion of farmers)
Chicken farm, base: Total (n=300), Ninh Binh (n=48), Nam Dinh (n=72), Quang Binh HR (n=36) Quang Binh LR (n=48), Hau Giang (n=48), Soc Trang (n=48) Duck farm, base: Total (n=300), Ninh Binh (n=48), Nam Dinh (n=48), Quang Binh HR (n=45), Quang Binh LR (n=15), Hau Giang (n=80), Soc Trang (n=64)
Farm owner
Government (AHW) staff
Veterinarian or technician employed
by farm
Private veterinarian
Drug shops
Technical service from feed company
Ninh Binh Nam Dinh Quang BinhHR
Quang BinhLRTotal Soc TrangHau Giang
10%
17%
25%
32%
32%
39%
7%
17%
15%
36%
35%
48%
Chicken farm Duck farm
13%
8%
44%
40
56%
85%
8%
17%
29%
56%
46%
83%
29%
19%
38%
7%
13%
13%
29%
27%
23%
6%
27%
23%
25%
27%
63%
25%
17%
7%
9
40%
27%
8%
19%
14%
81
25%
25%
9%
31%
20%
80
16%
16%
10%
4%
10%
69
15%
8%
6%
19%
64%
30%
2%
19%
15%
17%
15%
90%
16%
8%
19%
11%
89%
L1aa. Who provides poultry health services for the farm ?(SA)
Table 28: Farms’ poultry health services suppliers (proportion of farmers) (By type of farm)
Poultry disease TOTAL
Farm with only
Chickens
Farm with only
Ducks
Mixed farm
Majority Chickens
Majority Ducks
BASE 600 238 152 60 150
% % % % %Government (AHW) staff 33.8 28.2 34.2 48.3 36.7
Contract company technical services 0.3 0.4 0 0 0.7
Technical service from pharmaceutical company 1 0.4 1.3 0 2
Technical service from feed company 8.8 11.8 9.9 5 4.7
Veterinarian or technician employed by farm 33.8 31.9 27 30 45.3
Farm owner 43.3 37.4 48 45 47.3
Other farm worker (farm supervisor, ect.) 1.8 1.3 0.7 5 2.7
Drug shops 17.2 16 12.5 21.7 22
Private veterinarian 19.8 26.9 13.8 16.7 16
Other poultry producers 3 2.9 1.3 1.7 5.3
L1aa. Who provides poultry health services for the farm ?(SA)
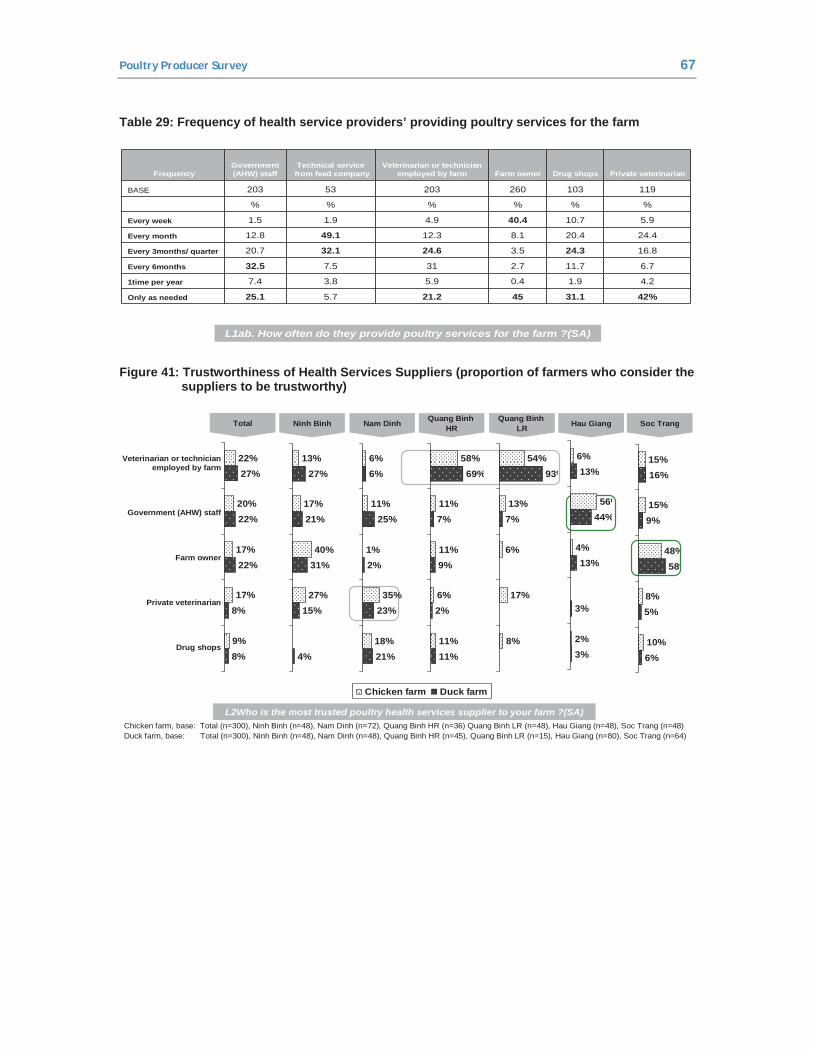
Poultry Producer Survey 67
Table 29: Frequency of health service providers’ providing poultry services for the farm
FrequencyGovernment (AHW) staff
Technical servicefrom feed company
Veterinarian or technician employed by farm Farm owner Drug shops Private veterinarian
BASE 203 53 203 260 103 119
% % % % % %
Every week 1.5 1.9 4.9 40.4 10.7 5.9
Every month 12.8 49.1 12.3 8.1 20.4 24.4
Every 3months/ quarter 20.7 32.1 24.6 3.5 24.3 16.8
Every 6months 32.5 7.5 31 2.7 11.7 6.7
1time per year 7.4 3.8 5.9 0.4 1.9 4.2
Only as needed 25.1 5.7 21.2 45 31.1 42%
L1ab. How often do they provide poultry services for the farm ?(SA)
Figure 41: Trustworthiness of Health Services Suppliers (proportion of farmers who consider the suppliers to be trustworthy)
Chicken farm, base: Total (n=300), Ninh Binh (n=48), Nam Dinh (n=72), Quang Binh HR (n=36) Quang Binh LR (n=48), Hau Giang (n=48), Soc Trang (n=48) Duck farm, base: Total (n=300), Ninh Binh (n=48), Nam Dinh (n=48), Quang Binh HR (n=45), Quang Binh LR (n=15), Hau Giang (n=80), Soc Trang (n=64)
Veterinarian or technician employed by farm
Government (AHW) staff
Farm owner
Private veterinarian
Drug shops
Ninh Binh Nam Dinh Quang BinhHR
Quang BinhLRTotal Soc TrangHau Giang
9%
17%
17%
20%
22%
8%
8%
22%
22%
27%
Chicken farm Duck farm
27%
40%
17%
13%
4%
15%
31%
21%
27%
18%
35%
1%
11%
6%
21%
23%
2%
25%
6%
11%
6%
11%
11%
58%
11%
2%
9%
7%
69%
8%
17%
6%
13%
54%
7%
93%
2%
4%
56%
6%
3%
3%
13%
44%
13%
10%
8%
48%
15%
15%
6%
5%
58%
9%
16%
L2Who is the most trusted poultry health services supplier to your farm ?(SA)
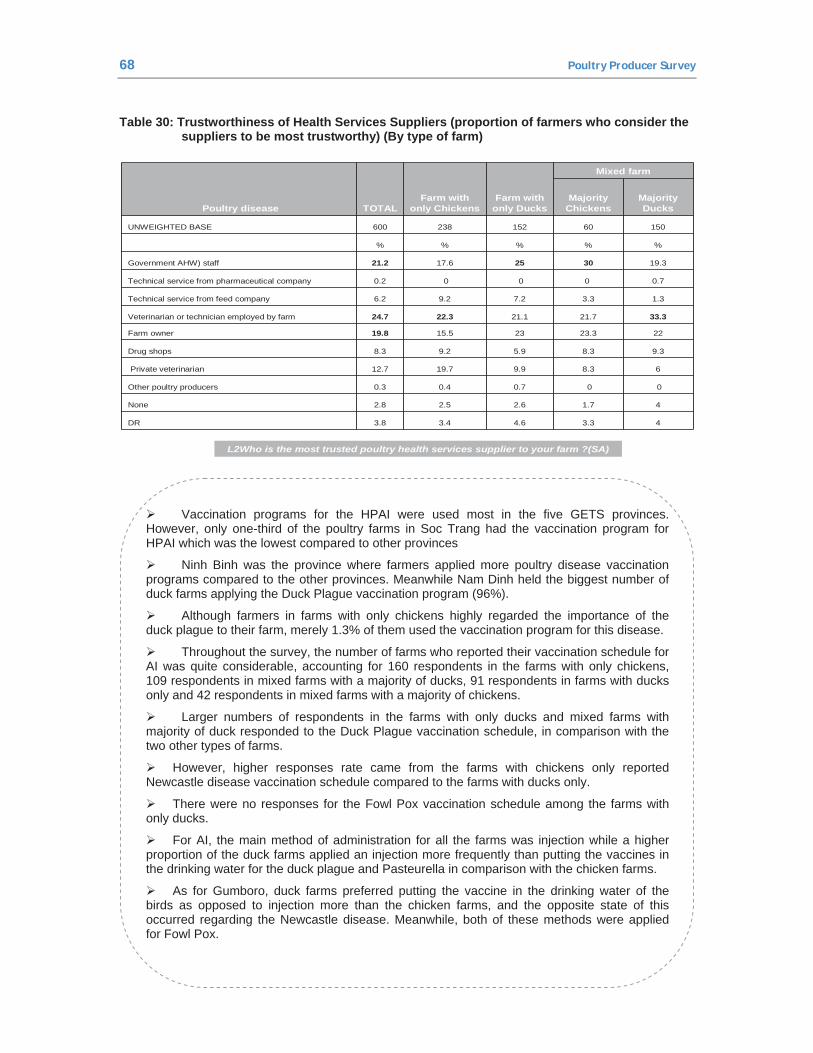
68 Poultry Producer Survey
Table 30: Trustworthiness of Health Services Suppliers (proportion of farmers who consider the suppliers to be most trustworthy) (By type of farm)
Poultry disease TOTALFarm with
only ChickensFarm with
only Ducks
Mixed farm
Majority Chickens
Majority Ducks
UNWEIGHTED BASE 600 238 152 60 150
% % % % %
Government AHW) staff 21.2 17.6 25 30 19.3
Technical service from pharmaceutical company 0.2 0 0 0 0.7
Technical service from feed company 6.2 9.2 7.2 3.3 1.3
Veterinarian or technician employed by farm 24.7 22.3 21.1 21.7 33.3
Farm owner 19.8 15.5 23 23.3 22
Drug shops 8.3 9.2 5.9 8.3 9.3
Private veterinarian 12.7 19.7 9.9 8.3 6
Other poultry producers 0.3 0.4 0.7 0 0
None 2.8 2.5 2.6 1.7 4
DR 3.8 3.4 4.6 3.3 4
L2Who is the most trusted poultry health services supplier to your farm ?(SA)
Vaccination programs for the HPAI were used most in the five GETS provinces. However, only one-third of the poultry farms in Soc Trang had the vaccination program for HPAI which was the lowest compared to other provinces
Ninh Binh was the province where farmers applied more poultry disease vaccination programs compared to the other provinces. Meanwhile Nam Dinh held the biggest number of duck farms applying the Duck Plague vaccination program (96%).
Although farmers in farms with only chickens highly regarded the importance of the duck plague to their farm, merely 1.3% of them used the vaccination program for this disease.
Throughout the survey, the number of farms who reported their vaccination schedule for AI was quite considerable, accounting for 160 respondents in the farms with only chickens, 109 respondents in mixed farms with a majority of ducks, 91 respondents in farms with ducks only and 42 respondents in mixed farms with a majority of chickens.
Larger numbers of respondents in the farms with only ducks and mixed farms with majority of duck responded to the Duck Plague vaccination schedule, in comparison with the two other types of farms.
However, higher responses rate came from the farms with chickens only reported Newcastle disease vaccination schedule compared to the farms with ducks only.
There were no responses for the Fowl Pox vaccination schedule among the farms with only ducks.
For AI, the main method of administration for all the farms was injection while a higher proportion of the duck farms applied an injection more frequently than putting the vaccines in the drinking water for the duck plague and Pasteurella in comparison with the chicken farms.
As for Gumboro, duck farms preferred putting the vaccine in the drinking water of the birds as opposed to injection more than the chicken farms, and the opposite state of this occurred regarding the Newcastle disease. Meanwhile, both of these methods were applied for Fowl Pox.
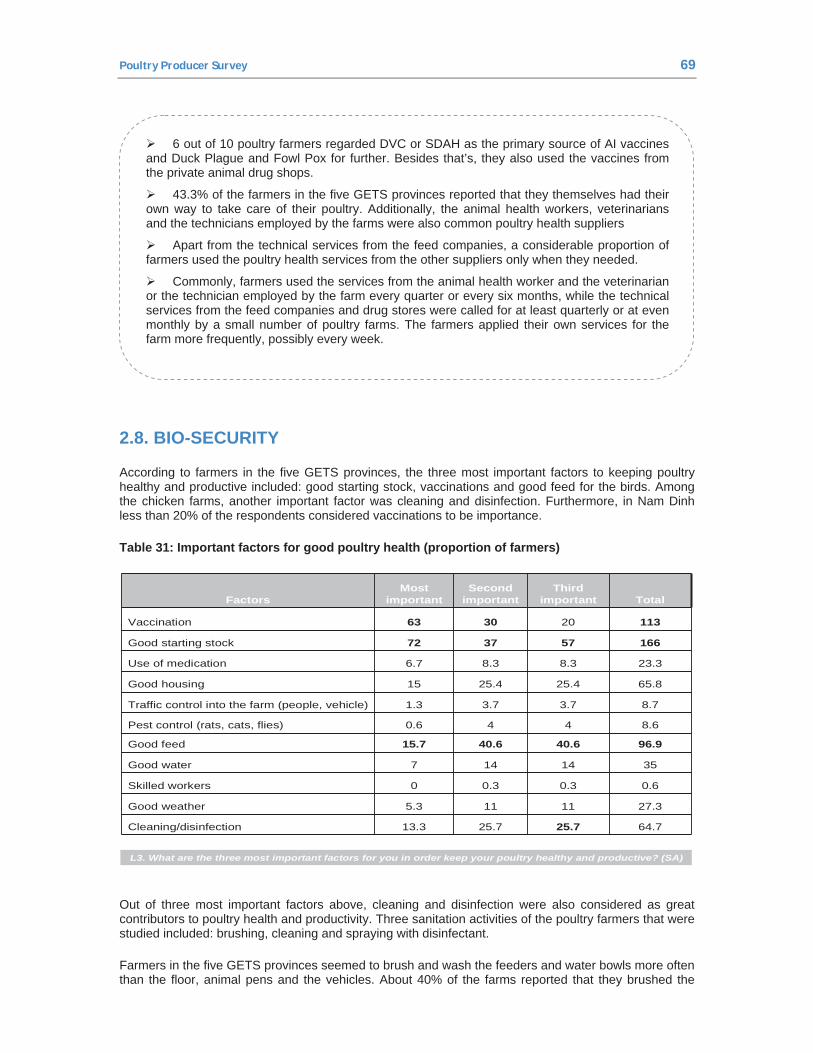
Poultry Producer Survey 69
6 out of 10 poultry farmers regarded DVC or SDAH as the primary source of AI vaccines and Duck Plague and Fowl Pox for further. Besides that’s, they also used the vaccines from the private animal drug shops.
43.3% of the farmers in the five GETS provinces reported that they themselves had their own way to take care of their poultry. Additionally, the animal health workers, veterinarians and the technicians employed by the farms were also common poultry health suppliers
Apart from the technical services from the feed companies, a considerable proportion of farmers used the poultry health services from the other suppliers only when they needed.
Commonly, farmers used the services from the animal health worker and the veterinarian or the technician employed by the farm every quarter or every six months, while the technical services from the feed companies and drug stores were called for at least quarterly or at even monthly by a small number of poultry farms. The farmers applied their own services for the farm more frequently, possibly every week.
2.8. BIO-SECURITY
According to farmers in the five GETS provinces, the three most important factors to keeping poultry healthy and productive included: good starting stock, vaccinations and good feed for the birds. Among the chicken farms, another important factor was cleaning and disinfection. Furthermore, in Nam Dinh less than 20% of the respondents considered vaccinations to be importance.
Table 31: Important factors for good poultry health (proportion of farmers)
104
FactorsMost
importantSecond
importantThird
important Total
Vaccination 63 30 20 113
Good starting stock 72 37 57 166
Use of medication 6.7 8.3 8.3 23.3
Good housing 15 25.4 25.4 65.8
Traffic control into the farm (people, vehicle) 1.3 3.7 3.7 8.7
Pest control (rats, cats, flies) 0.6 4 4 8.6
Good feed 15.7 40.6 40.6 96.9
Good water 7 14 14 35
Skilled workers 0 0.3 0.3 0.6
Good weather 5.3 11 11 27.3
Cleaning/disinfection 13.3 25.7 25.7 64.7
L3. What are the three most important factors for you in order keep your poultry healthy and productive? (SA)
Out of three most important factors above, cleaning and disinfection were also considered as great contributors to poultry health and productivity. Three sanitation activities of the poultry farmers that were studied included: brushing, cleaning and spraying with disinfectant.
Farmers in the five GETS provinces seemed to brush and wash the feeders and water bowls more often than the floor, animal pens and the vehicles. About 40% of the farms reported that they brushed the
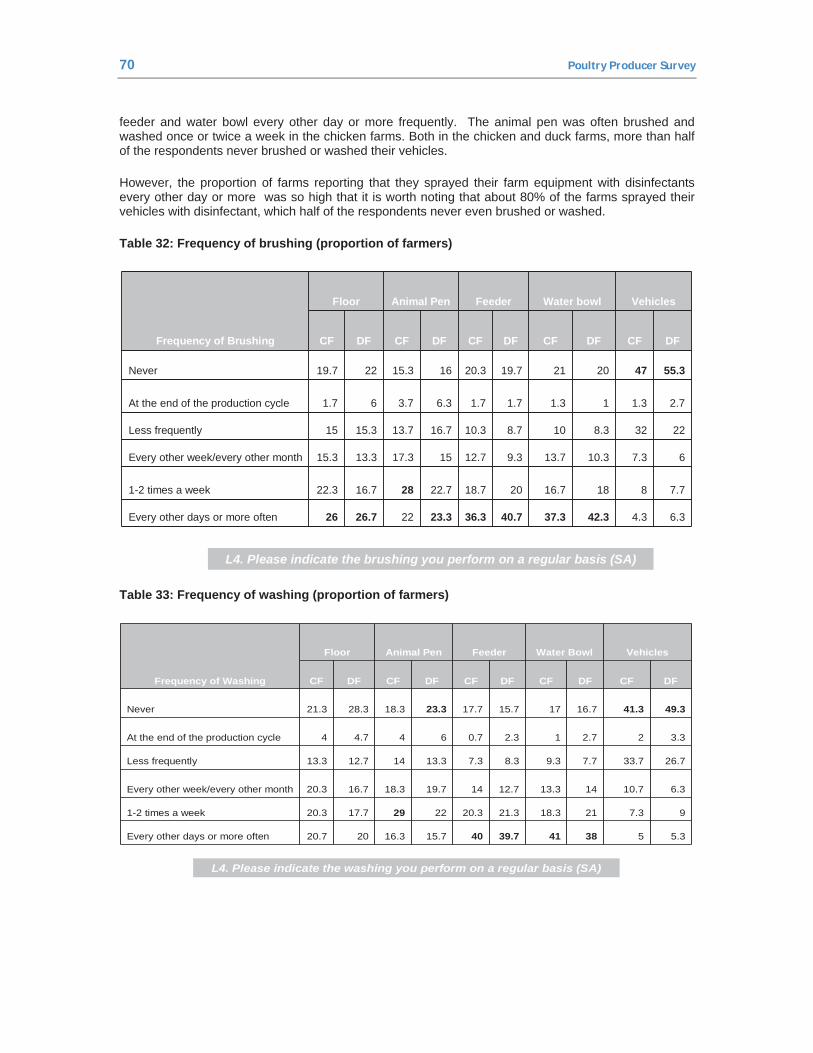
70 Poultry Producer Survey
feeder and water bowl every other day or more frequently. The animal pen was often brushed and washed once or twice a week in the chicken farms. Both in the chicken and duck farms, more than half of the respondents never brushed or washed their vehicles.
However, the proportion of farms reporting that they sprayed their farm equipment with disinfectants every other day or more was so high that it is worth noting that about 80% of the farms sprayed their vehicles with disinfectant, which half of the respondents never even brushed or washed.
Table 32: Frequency of brushing (proportion of farmers)
Frequency of Brushing
Floor Animal Pen Feeder Water bowl Vehicles
CF DF CF DF CF DF CF DF CF DF
Never 19.7 22 15.3 16 20.3 19.7 21 20 47 55.3
At the end of the production cycle 1.7 6 3.7 6.3 1.7 1.7 1.3 1 1.3 2.7
Less frequently 15 15.3 13.7 16.7 10.3 8.7 10 8.3 32 22
Every other week/every other month 15.3 13.3 17.3 15 12.7 9.3 13.7 10.3 7.3 6
1-2 times a week 22.3 16.7 28 22.7 18.7 20 16.7 18 8 7.7
Every other days or more often 26 26.7 22 23.3 36.3 40.7 37.3 42.3 4.3 6.3
L4. Please indicate the brushing you perform on a regular basis (SA)
Table 33: Frequency of washing (proportion of farmers)
Frequency of Washing
Floor Animal Pen Feeder Water Bowl Vehicles
CF DF CF DF CF DF CF DF CF DF
Never 21.3 28.3 18.3 23.3 17.7 15.7 17 16.7 41.3 49.3
At the end of the production cycle 4 4.7 4 6 0.7 2.3 1 2.7 2 3.3
Less frequently 13.3 12.7 14 13.3 7.3 8.3 9.3 7.7 33.7 26.7
Every other week/every other month 20.3 16.7 18.3 19.7 14 12.7 13.3 14 10.7 6.3
1-2 times a week 20.3 17.7 29 22 20.3 21.3 18.3 21 7.3 9
Every other days or more often 20.7 20 16.3 15.7 40 39.7 41 38 5 5.3
L4. Please indicate the washing you perform on a regular basis (SA)
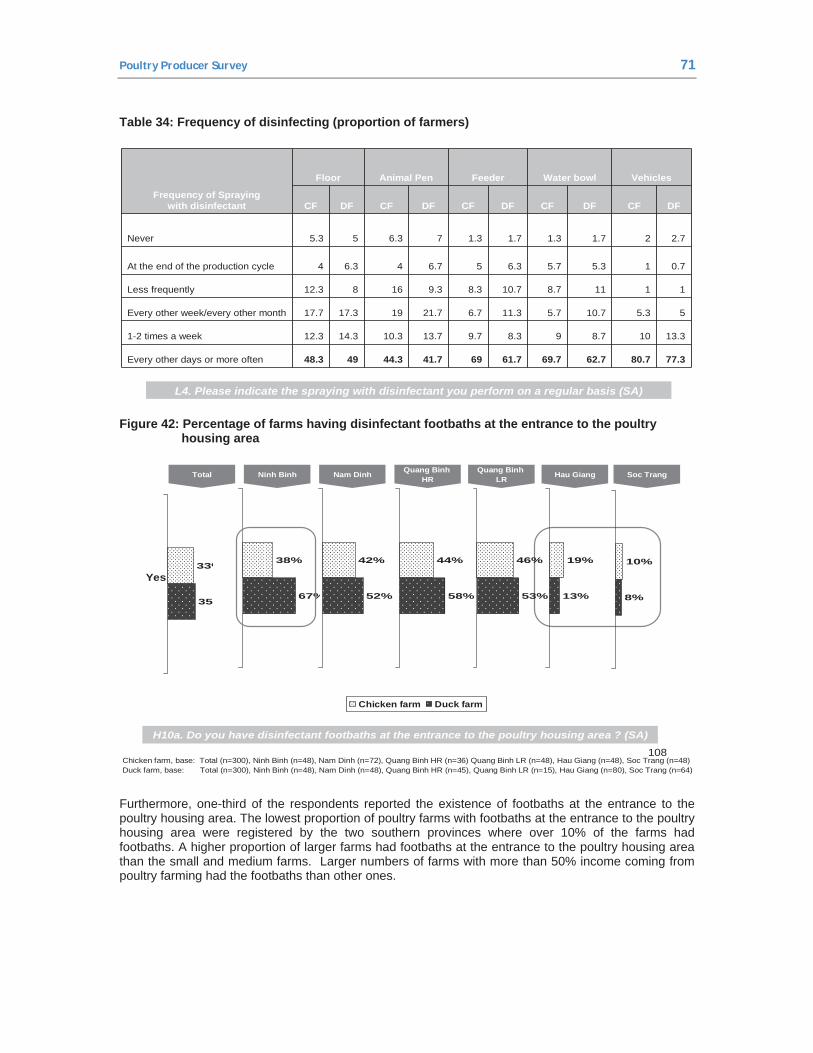
Poultry Producer Survey 71
Table 34: Frequency of disinfecting (proportion of farmers)
Frequency of Spraying with disinfectant
Floor Animal Pen Feeder Water bowl Vehicles
CF DF CF DF CF DF CF DF CF DF
Never 5.3 5 6.3 7 1.3 1.7 1.3 1.7 2 2.7
At the end of the production cycle 4 6.3 4 6.7 5 6.3 5.7 5.3 1 0.7
Less frequently 12.3 8 16 9.3 8.3 10.7 8.7 11 1 1
Every other week/every other month 17.7 17.3 19 21.7 6.7 11.3 5.7 10.7 5.3 5
1-2 times a week 12.3 14.3 10.3 13.7 9.7 8.3 9 8.7 10 13.3
Every other days or more often 48.3 49 44.3 41.7 69 61.7 69.7 62.7 80.7 77.3
L4. Please indicate the spraying with disinfectant you perform on a regular basis (SA)
Figure 42: Percentage of farms having disinfectant footbaths at the entrance to the poultry housing area
108
38%
67%
Yes
•Chicken farm, base: Total (n=300), Ninh Binh (n=48), Nam Dinh (n=72), Quang Binh HR (n=36) Quang Binh LR (n=48), Hau Giang (n=48), Soc Trang (n=48) •Duck farm, base: Total (n=300), Ninh Binh (n=48), Nam Dinh (n=48), Quang Binh HR (n=45), Quang Binh LR (n=15), Hau Giang (n=80), Soc Trang (n=64)
Ninh Binh Nam Dinh Quang BinhHR
Quang BinhLRTotal Soc TrangHau Giang
Chicken farm Duck farm
33%
35%
42%
52%
44%
58%
46%
53%
19%
13%
10%
8%
H10a. Do you have disinfectant footbaths at the entrance to the poultry housing area ? (SA)
Furthermore, one-third of the respondents reported the existence of footbaths at the entrance to the poultry housing area. The lowest proportion of poultry farms with footbaths at the entrance to the poultry housing area were registered by the two southern provinces where over 10% of the farms had footbaths. A higher proportion of larger farms had footbaths at the entrance to the poultry housing area than the small and medium farms. Larger numbers of farms with more than 50% income coming from poultry farming had the footbaths than other ones.
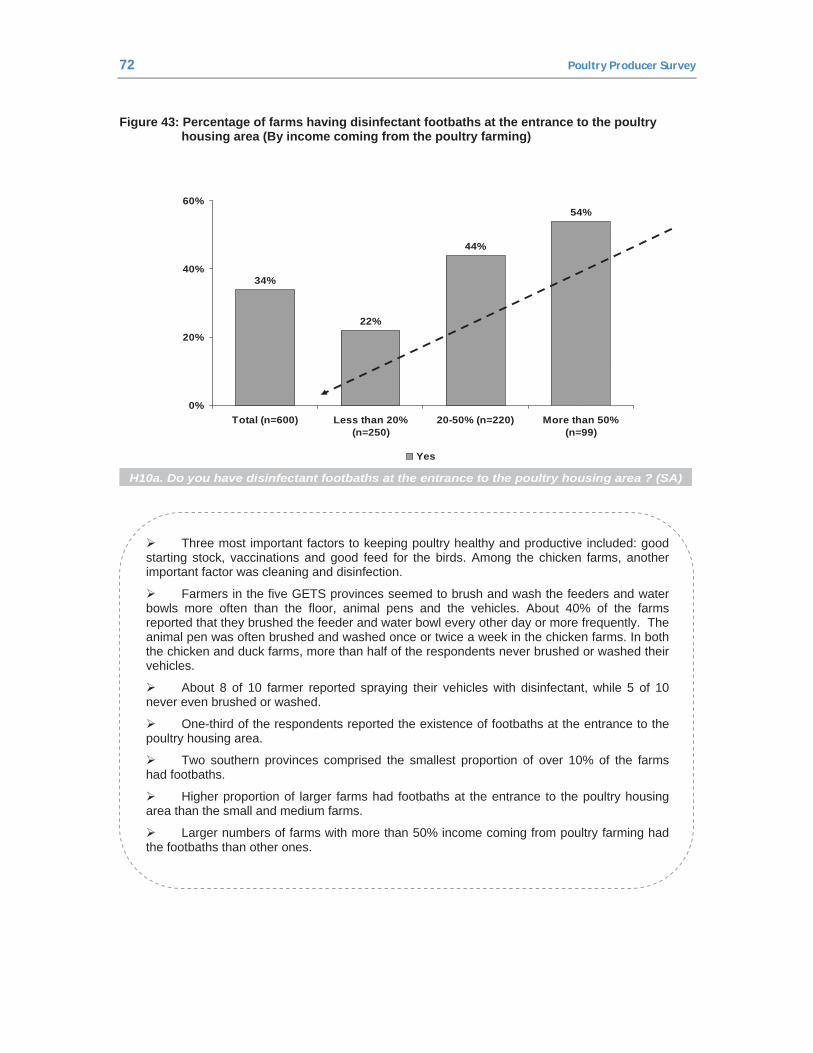
72 Poultry Producer Survey
Figure 43: Percentage of farms having disinfectant footbaths at the entrance to the poultry housing area (By income coming from the poultry farming)
34%
22%
44%
54%
0%
20%
40%
60%
Total (n=600) Less than 20%(n=250)
20-50% (n=220) More than 50%(n=99)
Yes
H10a. Do you have disinfectant footbaths at the entrance to the poultry housing area ? (SA)
Three most important factors to keeping poultry healthy and productive included: good starting stock, vaccinations and good feed for the birds. Among the chicken farms, another important factor was cleaning and disinfection.
Farmers in the five GETS provinces seemed to brush and wash the feeders and water bowls more often than the floor, animal pens and the vehicles. About 40% of the farms reported that they brushed the feeder and water bowl every other day or more frequently. The animal pen was often brushed and washed once or twice a week in the chicken farms. In both the chicken and duck farms, more than half of the respondents never brushed or washed their vehicles.
About 8 of 10 farmer reported spraying their vehicles with disinfectant, while 5 of 10 never even brushed or washed.
One-third of the respondents reported the existence of footbaths at the entrance to the poultry housing area.
Two southern provinces comprised the smallest proportion of over 10% of the farms had footbaths.
Higher proportion of larger farms had footbaths at the entrance to the poultry housing area than the small and medium farms.
Larger numbers of farms with more than 50% income coming from poultry farming had the footbaths than other ones.
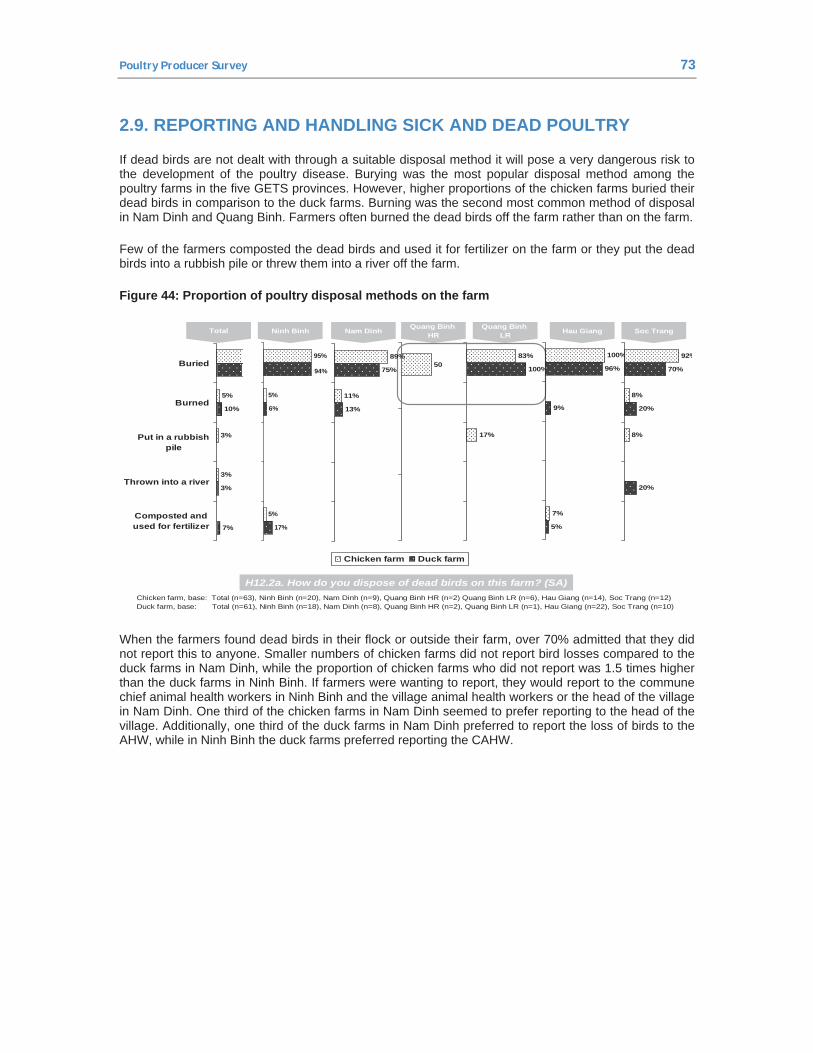
Poultry Producer Survey 73
2.9. REPORTING AND HANDLING SICK AND DEAD POULTRY
If dead birds are not dealt with through a suitable disposal method it will pose a very dangerous risk to the development of the poultry disease. Burying was the most popular disposal method among the poultry farms in the five GETS provinces. However, higher proportions of the chicken farms buried their dead birds in comparison to the duck farms. Burning was the second most common method of disposal in Nam Dinh and Quang Binh. Farmers often burned the dead birds off the farm rather than on the farm.
Few of the farmers composted the dead birds and used it for fertilizer on the farm or they put the dead birds into a rubbish pile or threw them into a river off the farm.
Figure 44: Proportion of poultry disposal methods on the farm
50
17%
83%
100%
Chicken farm, base: Total (n=63), Ninh Binh (n=20), Nam Dinh (n=9), Quang Binh HR (n=2) Quang Binh LR (n=6), Hau Giang (n=14), Soc Trang (n=12) Duck farm, base: Total (n=61), Ninh Binh (n=18), Nam Dinh (n=8), Quang Binh HR (n=2), Quang Binh LR (n=1), Hau Giang (n=22), Soc Trang (n=10)
Ninh Binh Nam Dinh Quang BinhHR
Quang BinhLRTotal Soc TrangHau Giang
Chicken farm Duck farm
3%
3%
5%
7%
3%
10%
Buried
Burned
Put in a rubbishpile
Thrown into a river
Composted andused for fertilizer
5%
5%
95%
17%
6%
94%
11%
89%
13%
75%
7%
100%
5%
9%
96%
8%
8%
92%
20%
20%
70%
H12.2a. How do you dispose of dead birds on this farm? (SA)
When the farmers found dead birds in their flock or outside their farm, over 70% admitted that they did not report this to anyone. Smaller numbers of chicken farms did not report bird losses compared to the duck farms in Nam Dinh, while the proportion of chicken farms who did not report was 1.5 times higher than the duck farms in Ninh Binh. If farmers were wanting to report, they would report to the commune chief animal health workers in Ninh Binh and the village animal health workers or the head of the village in Nam Dinh. One third of the chicken farms in Nam Dinh seemed to prefer reporting to the head of the village. Additionally, one third of the duck farms in Nam Dinh preferred to report the loss of birds to the AHW, while in Ninh Binh the duck farms preferred reporting the CAHW.
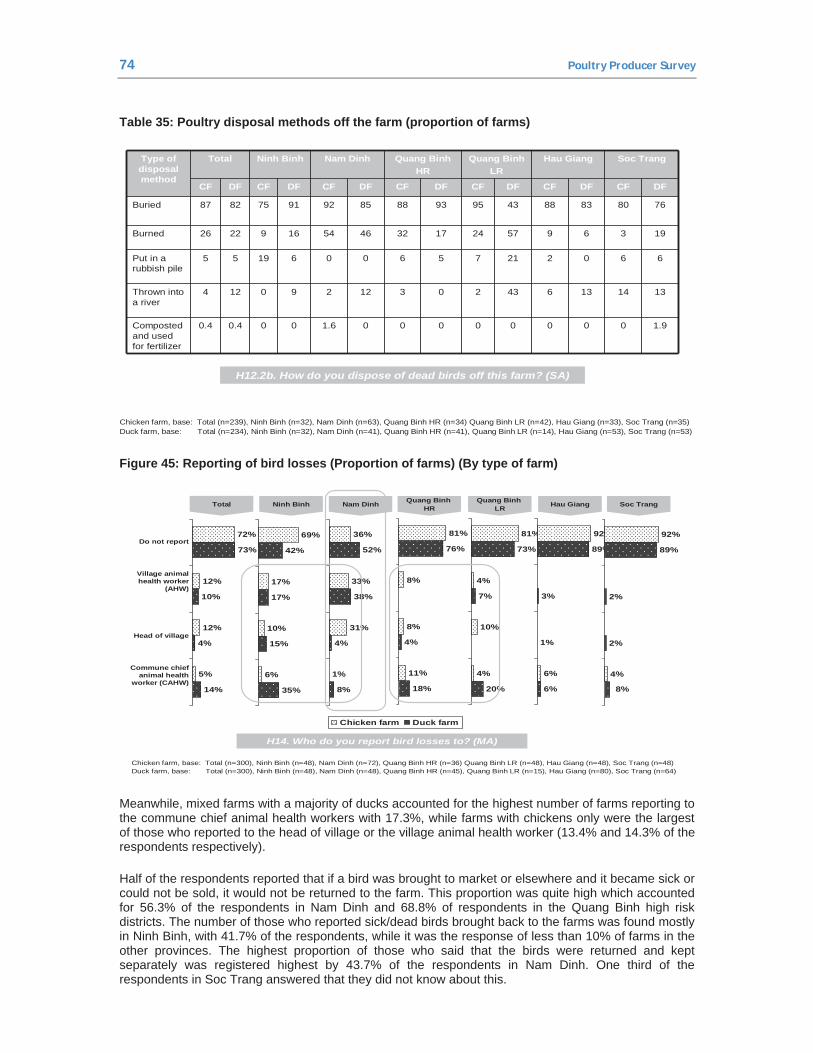
74 Poultry Producer Survey
Table 35: Poultry disposal methods off the farm (proportion of farms)
Chicken farm, base: Total (n=239), Ninh Binh (n=32), Nam Dinh (n=63), Quang Binh HR (n=34) Quang Binh LR (n=42), Hau Giang (n=33), Soc Trang (n=35) Duck farm, base: Total (n=234), Ninh Binh (n=32), Nam Dinh (n=41), Quang Binh HR (n=41), Quang Binh LR (n=14), Hau Giang (n=53), Soc Trang (n=53)
H12.2b. How do you dispose of dead birds off this farm? (SA)
Type of disposal method
Total Ninh Binh Nam Dinh Quang BinhHR
Quang BinhLR
Hau Giang Soc Trang
CF DF CF DF CF DF CF DF CF DF CF DF CF DF
Buried 87 82 75 91 92 85 88 93 95 43 88 83 80 76
Burned 26 22 9 16 54 46 32 17 24 57 9 6 3 19
Put in a rubbish pile
5 5 19 6 0 0 6 5 7 21 2 0 6 6
Thrown into a river
4 12 0 9 2 12 3 0 2 43 6 13 14 13
Composted and used for fertilizer
0.4 0.4 0 0 1.6 0 0 0 0 0 0 0 0 1.9
Figure 45: Reporting of bird losses (Proportion of farms) (By type of farm)
4%
10%
4%
81%
20%
7%
73%
5%
12%
12%
72%
14%
4%
10%
73%
6%
10%
17%
69%
35%
15%
17%
42%
1%
31%
33%
36%
8%
4%
38%
52%
6%
92%
6%
1%
3%
89%
4%
92%
8%
2%
2%
89%
11%
8%
8%
81%
18%
4%
76%
•Chicken farm, base: Total (n=300), Ninh Binh (n=48), Nam Dinh (n=72), Quang Binh HR (n=36) Quang Binh LR (n=48), Hau Giang (n=48), Soc Trang (n=48) •Duck farm, base: Total (n=300), Ninh Binh (n=48), Nam Dinh (n=48), Quang Binh HR (n=45), Quang Binh LR (n=15), Hau Giang (n=80), Soc Trang (n=64)
Do not report
Village animal health worker
(AHW)
Head of village
Commune chief animal health
worker (CAHW)
Ninh Binh Nam Dinh Quang BinhHR
Quang BinhLRTotal Soc TrangHau Giang
Chicken farm Duck farm
H14. Who do you report bird losses to? (MA)
Meanwhile, mixed farms with a majority of ducks accounted for the highest number of farms reporting to the commune chief animal health workers with 17.3%, while farms with chickens only were the largest of those who reported to the head of village or the village animal health worker (13.4% and 14.3% of the respondents respectively).
Half of the respondents reported that if a bird was brought to market or elsewhere and it became sick or could not be sold, it would not be returned to the farm. This proportion was quite high which accounted for 56.3% of the respondents in Nam Dinh and 68.8% of respondents in the Quang Binh high risk districts. The number of those who reported sick/dead birds brought back to the farms was found mostly in Ninh Binh, with 41.7% of the respondents, while it was the response of less than 10% of farms in the other provinces. The highest proportion of those who said that the birds were returned and kept separately was registered highest by 43.7% of the respondents in Nam Dinh. One third of the respondents in Soc Trang answered that they did not know about this.
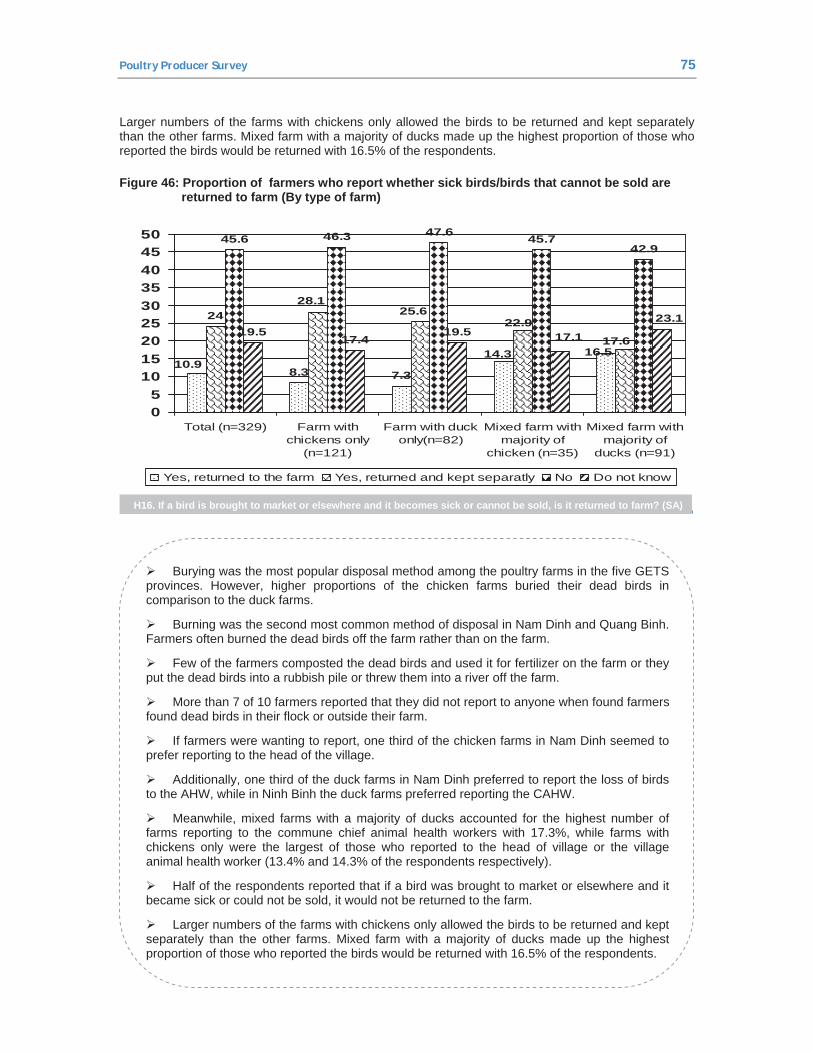
Poultry Producer Survey 75
Larger numbers of the farms with chickens only allowed the birds to be returned and kept separately than the other farms. Mixed farm with a majority of ducks made up the highest proportion of those who reported the birds would be returned with 16.5% of the respondents.
Figure 46: Proportion of farmers who report whether sick birds/birds that cannot be sold are returned to farm (By type of farm)
8.3 7.3
24
45.6 46.3 47.6 45.742.9
19.517.4
19.5
10.914.3 16.5
28.125.6
22.917.617.1
23.1
05
101520253035404550
Total (n=329) Farm withchickens only
(n=121)
Farm with duckonly(n=82)
Mixed farm withmajority of
chicken (n=35)
Mixed farm withmajority of
ducks (n=91)
Yes, returned to the farm Yes, returned and kept separatly No Do not know
H16. If a bird is brought to market or elsewhere and it becomes sick or cannot be sold, is it returned to farm? (SA)
Burying was the most popular disposal method among the poultry farms in the five GETS provinces. However, higher proportions of the chicken farms buried their dead birds in comparison to the duck farms.
Burning was the second most common method of disposal in Nam Dinh and Quang Binh. Farmers often burned the dead birds off the farm rather than on the farm.
Few of the farmers composted the dead birds and used it for fertilizer on the farm or they put the dead birds into a rubbish pile or threw them into a river off the farm.
More than 7 of 10 farmers reported that they did not report to anyone when found farmers found dead birds in their flock or outside their farm.
If farmers were wanting to report, one third of the chicken farms in Nam Dinh seemed to prefer reporting to the head of the village.
Additionally, one third of the duck farms in Nam Dinh preferred to report the loss of birds to the AHW, while in Ninh Binh the duck farms preferred reporting the CAHW.
Meanwhile, mixed farms with a majority of ducks accounted for the highest number of farms reporting to the commune chief animal health workers with 17.3%, while farms with chickens only were the largest of those who reported to the head of village or the village animal health worker (13.4% and 14.3% of the respondents respectively).
Half of the respondents reported that if a bird was brought to market or elsewhere and it became sick or could not be sold, it would not be returned to the farm.
Larger numbers of the farms with chickens only allowed the birds to be returned and kept separately than the other farms. Mixed farm with a majority of ducks made up the highest proportion of those who reported the birds would be returned with 16.5% of the respondents.

76 Poultry Producer Survey
2.10. AVIAN INFLUENZA OUTBREAK EXPERIENCE
Larger numbers of the farms in the two Northern provinces reported that AI outbreaks happened in their commune than in the other provinces. It accounted for 82% of the chicken farms and 58% of the duck farms in Nam Dinh, and 44% of the chicken farms and 71% of duck farms in Ninh Binh.
The number of farms which had AI outbreaks within the commune had decreased since October 2009. The data of farmers who reported the outbreaks before October 2009 was approximately three times higher than after October 2009, which accounted for 67 people. The highest number reported was registered by farmers in Nam Dinh, with 92 people reported the outbreaks before October 2009 and 41 reported outbreaks after October 2009. Half of the responses were contributed by the two Northern provinces.
As for the experience with AI in their own flocks, larger numbers of chicken farms (32%) responded than the ducks farms (21%). In Quang Binh and Soc Trang, the AI outbreak occurred only in the chicken farms while in Hau Giang it took place among the duck farms.
Figure 47: Proportion of farmers who reported that AI outbreak happened in their commune
Chicken farm, base: Total (n=300), Ninh Binh (n=48), Nam Dinh (n=72), Quang Binh HR (n=36) Quang Binh LR (n=48), Hau Giang (n=48), Soc Trang (n=48) Duck farm, base: Total (n=300), Ninh Binh (n=48), Nam Dinh (n=48), Quang Binh HR (n=45), Quang Binh LR (n=15), Hau Giang (n=80), Soc Trang (n=64)
42%
82%
31%25% 21%
29%
44%
13%16%13%
71%
58%
30%
0%
20%
40%
60%
80%
100%
Total Ninh Binh Nam Dinh QuangBinh HR
QuangBinh LR
Hau Giang Soc Trang
Chicken Duck
N1.Did AI outbreak ever happen in your commune? (SA)
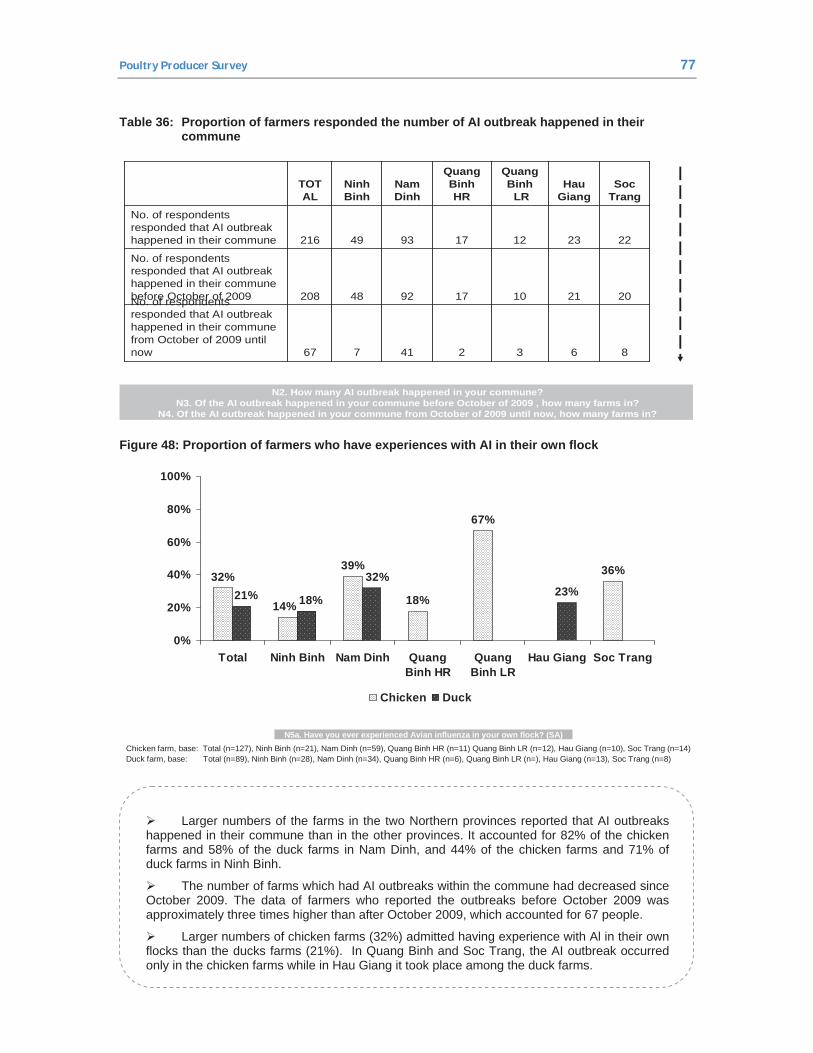
Poultry Producer Survey 77
Table 36: Proportion of farmers responded the number of AI outbreak happened in their commune
863241767
No. of respondentsresponded that AI outbreakhappened in their communefrom October of 2009 untilnow
202110179248208
No. of respondentsresponded that AI outbreakhappened in their communebefore October of 2009
222312179349216
No. of respondentsresponded that AI outbreakhappened in their commune
S ocTrang
HauG iang
QuangB inh
L R
QuangB inhHR
NamDinh
NinhB inh
TOTAL
N2. How many AI outbreak happened in your commune?N3. Of the AI outbreak happened in your commune before October of 2009 , how many farms in?
N4. Of the AI outbreak happened in your commune from October of 2009 until now, how many farms in?
Figure 48: Proportion of farmers who have experiences with AI in their own flock
N5a. Have you ever experienced Avian influenza in your own flock? (SA)
32%39%
18%
67%
36%
23%14%
32%
18%21%
0%
20%
40%
60%
80%
100%
Total Ninh Binh Nam Dinh QuangBinh HR
QuangBinh LR
Hau Giang Soc Trang
Chicken Duck
•Chicken farm, base: Total (n=127), Ninh Binh (n=21), Nam Dinh (n=59), Quang Binh HR (n=11) Quang Binh LR (n=12), Hau Giang (n=10), Soc Trang (n=14) •Duck farm, base: Total (n=89), Ninh Binh (n=28), Nam Dinh (n=34), Quang Binh HR (n=6), Quang Binh LR (n=), Hau Giang (n=13), Soc Trang (n=8)
Larger numbers of the farms in the two Northern provinces reported that AI outbreaks happened in their commune than in the other provinces. It accounted for 82% of the chicken farms and 58% of the duck farms in Nam Dinh, and 44% of the chicken farms and 71% of duck farms in Ninh Binh.
The number of farms which had AI outbreaks within the commune had decreased since October 2009. The data of farmers who reported the outbreaks before October 2009 was approximately three times higher than after October 2009, which accounted for 67 people.
Larger numbers of chicken farms (32%) admitted having experience with Al in their own flocks than the ducks farms (21%). In Quang Binh and Soc Trang, the AI outbreak occurred only in the chicken farms while in Hau Giang it took place among the duck farms.
78 Poultry Producer Survey
2.11. ATTITUDES
This part clarifies the findings with regard to the poultry farmers’ perceptions and attitudes towards poultry health, risk perception and HPAI before the outbreak of HPAI, after the outbreak in 2006 and since October of 2009.
To determine the perception of the farmers on HPAI, six hundred chicken and duck farmers in the five GETS provinces in Vietnam: Nam Dinh and Ninh Binh (north); Quang Binh (central) and Hau Giang and Soc Tang (south) were administered a list of statements. These statements were read out to the farmers who then had to rate on a five point Likert scale the extent to which they agreed with each statement:
1) Completely disagree 2) Disagree3) Neither agree nor disagree 4) Agree 5) Completely agree
Poultry Producer Survey 79
The farmer could either disagree (completely disagree or disagree) or agree (completely agree or agree) with the statement or maintain a neutral stance (Neither agree nor disagree).
To understand how the farmers perceived HPAI as a threat to poultry and to what extent the farmers considered HPAI to be serious, they were administered the following statements to which they had to mark their response on an agreement scale:
- HPAI is as serious as other poultry diseases. - HPAI is avoidable. - HPAI affects poultry health. - HPAI affects human health.
In order to compare the status of HPAI before and after October 2009, the farmers were administered the following statements which they had to rate on the agreement scale:
- HPAI status was very serious between 2004 and October 2009 in your province. - HPAI status has been very serious since October 2009 till now. - Poultry in your commune were very healthy before 2004. - Poultry in your commune were very healthy between 2004 and October 2009. - Poultry in your commune have been very healthy since October 2009 till now. - Poultry in your commune were vulnerable to HPAI between 2004 and October 2009. - Poultry in your commune has been more vulnerable to HPAI since October 2009. - Poultry productivity in your commune decreased between 2004 and October 2009. - Poultry productivity in your commune has been further decreased since October 2009.
Face to face interviews were conducted among six hundreds poultry farmers from three hundred chicken farms and three hundred duck farms and the information collected shows that most farmers have a good perception of the HPAI because of their higher than 80% agreement with the given statements. 87.3% of respondents highly agreed that HPAI was as serious as other poultry diseases and about 86% of those thought that HPAI could be avoided. However, as it can be seen in Table 1 the percentage of people from the south who found it possible to avoid HPAI was much lower than those in the north and the central. They accounted for only 72.9% in Hau Giang and 75% in Soc Trang of the chicken farms and 71.9 % from the duck farms of Soc Trang. Particularly, we must be concerned by the minimal proportion of 70.3% of the duck farmers in Soc Trang who believed that HPAI was as serious as other poultry diseases.
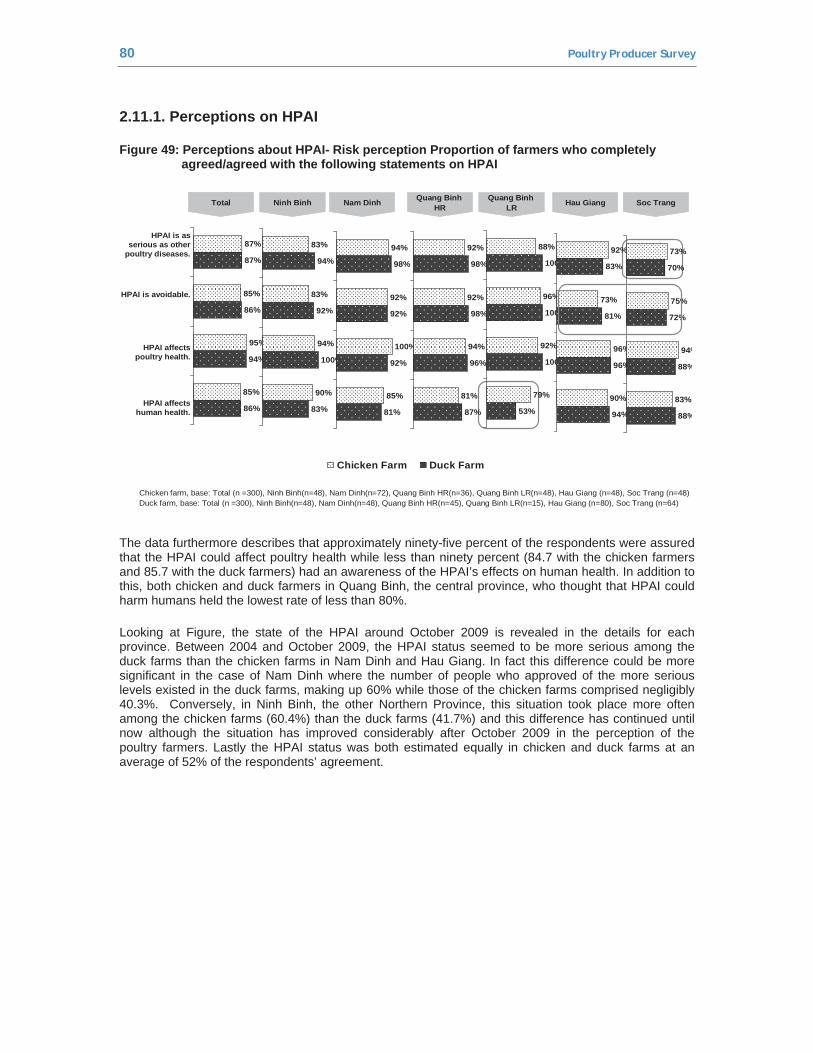
80 Poultry Producer Survey
2.11.1. Perceptions on HPAI
Figure 49: Perceptions about HPAI- Risk perception Proportion of farmers who completely agreed/agreed with the following statements on HPAI
Chicken farm, base: Total (n =300), Ninh Binh(n=48), Nam Dinh(n=72), Quang Binh HR(n=36), Quang Binh LR(n=48), Hau Giang (n=48), Soc Trang (n=48) Duck farm, base: Total (n =300), Ninh Binh(n=48), Nam Dinh(n=48), Quang Binh HR(n=45), Quang Binh LR(n=15), Hau Giang (n=80), Soc Trang (n=64)
Ninh Binh Nam Dinh Quang BinhHR
Quang BinhLRTotal Soc TrangHau Giang
85%
95%
85%
87%
86%
94%
86%
87%
90%
94%
83%
83%
83%
100%
92%
94%
85%
100%
92%
94%
81%
92%
92%
98%
81%
94%
92%
92%
87%
96%
98%
98%
79%
92%
96%
88%
53%
100%
100%
100%
90%
96%
73%
92%
94%
96%
81%
83%
83%
94%
75%
73%
88%
88%
72%
70%
HPAI affects human health.
HPAI affects poultry health.
HPAI is avoidable.
HPAI is as serious as other
poultry diseases.
Chicken Farm Duck Farm
The data furthermore describes that approximately ninety-five percent of the respondents were assured that the HPAI could affect poultry health while less than ninety percent (84.7 with the chicken farmers and 85.7 with the duck farmers) had an awareness of the HPAI’s effects on human health. In addition to this, both chicken and duck farmers in Quang Binh, the central province, who thought that HPAI could harm humans held the lowest rate of less than 80%.
Looking at Figure, the state of the HPAI around October 2009 is revealed in the details for each province. Between 2004 and October 2009, the HPAI status seemed to be more serious among the duck farms than the chicken farms in Nam Dinh and Hau Giang. In fact this difference could be more significant in the case of Nam Dinh where the number of people who approved of the more serious levels existed in the duck farms, making up 60% while those of the chicken farms comprised negligibly 40.3%. Conversely, in Ninh Binh, the other Northern Province, this situation took place more often among the chicken farms (60.4%) than the duck farms (41.7%) and this difference has continued until now although the situation has improved considerably after October 2009 in the perception of the poultry farmers. Lastly the HPAI status was both estimated equally in chicken and duck farms at an average of 52% of the respondents’ agreement.
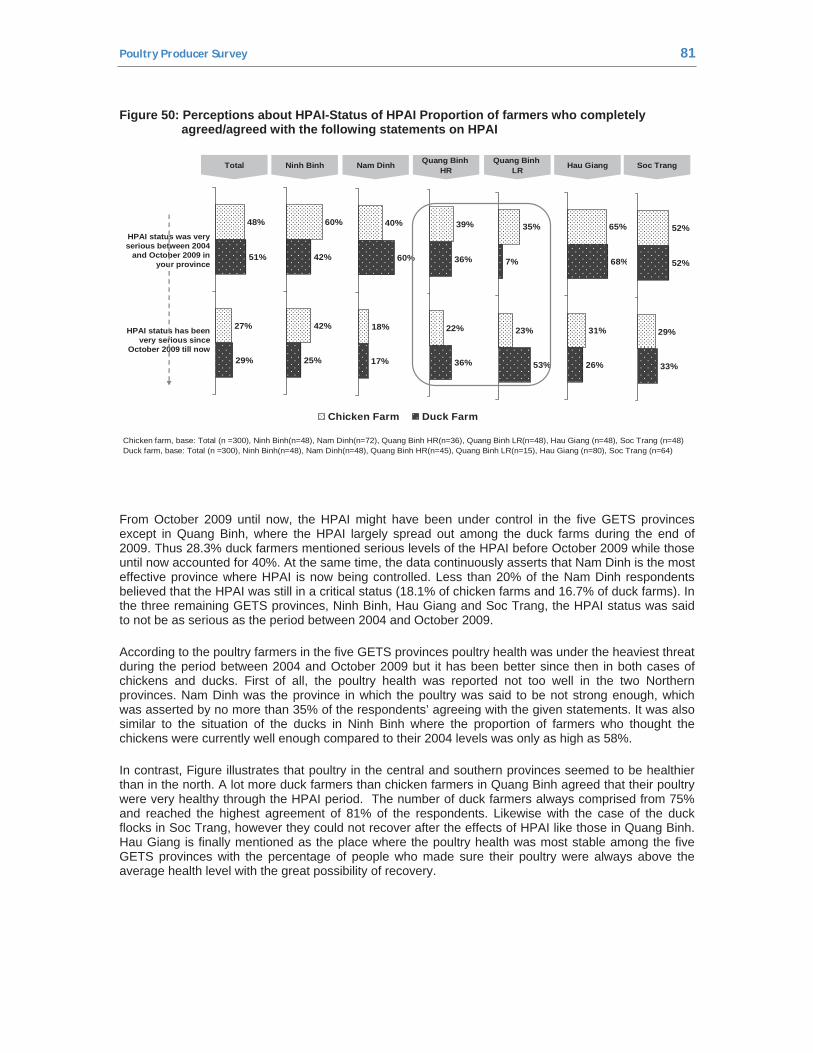
Poultry Producer Survey 81
Figure 50: Perceptions about HPAI-Status of HPAI Proportion of farmers who completely agreed/agreed with the following statements on HPAI
Chicken farm, base: Total (n =300), Ninh Binh(n=48), Nam Dinh(n=72), Quang Binh HR(n=36), Quang Binh LR(n=48), Hau Giang (n=48), Soc Trang (n=48) Duck farm, base: Total (n =300), Ninh Binh(n=48), Nam Dinh(n=48), Quang Binh HR(n=45), Quang Binh LR(n=15), Hau Giang (n=80), Soc Trang (n=64)
HPAI status has been very serious since
October 2009 till now
HPAI status was very serious between 2004
and October 2009 in your province
Ninh Binh Nam Dinh Quang BinhHR
Quang BinhLRTotal Soc TrangHau Giang
27%
48%
29%
51%
42%
60%
25%
42%
18%
40%
17%
60%
22%
39%
36%
36%
23%
35%
53%
7%
31%
65%
26%
68%
29%
52%
33%
52%
Chicken Farm Duck Farm
From October 2009 until now, the HPAI might have been under control in the five GETS provinces except in Quang Binh, where the HPAI largely spread out among the duck farms during the end of 2009. Thus 28.3% duck farmers mentioned serious levels of the HPAI before October 2009 while those until now accounted for 40%. At the same time, the data continuously asserts that Nam Dinh is the most effective province where HPAI is now being controlled. Less than 20% of the Nam Dinh respondents believed that the HPAI was still in a critical status (18.1% of chicken farms and 16.7% of duck farms). In the three remaining GETS provinces, Ninh Binh, Hau Giang and Soc Trang, the HPAI status was said to not be as serious as the period between 2004 and October 2009.
According to the poultry farmers in the five GETS provinces poultry health was under the heaviest threat during the period between 2004 and October 2009 but it has been better since then in both cases of chickens and ducks. First of all, the poultry health was reported not too well in the two Northern provinces. Nam Dinh was the province in which the poultry was said to be not strong enough, which was asserted by no more than 35% of the respondents’ agreeing with the given statements. It was also similar to the situation of the ducks in Ninh Binh where the proportion of farmers who thought the chickens were currently well enough compared to their 2004 levels was only as high as 58%.
In contrast, Figure illustrates that poultry in the central and southern provinces seemed to be healthier than in the north. A lot more duck farmers than chicken farmers in Quang Binh agreed that their poultry were very healthy through the HPAI period. The number of duck farmers always comprised from 75% and reached the highest agreement of 81% of the respondents. Likewise with the case of the duck flocks in Soc Trang, however they could not recover after the effects of HPAI like those in Quang Binh. Hau Giang is finally mentioned as the place where the poultry health was most stable among the five GETS provinces with the percentage of people who made sure their poultry were always above the average health level with the great possibility of recovery.
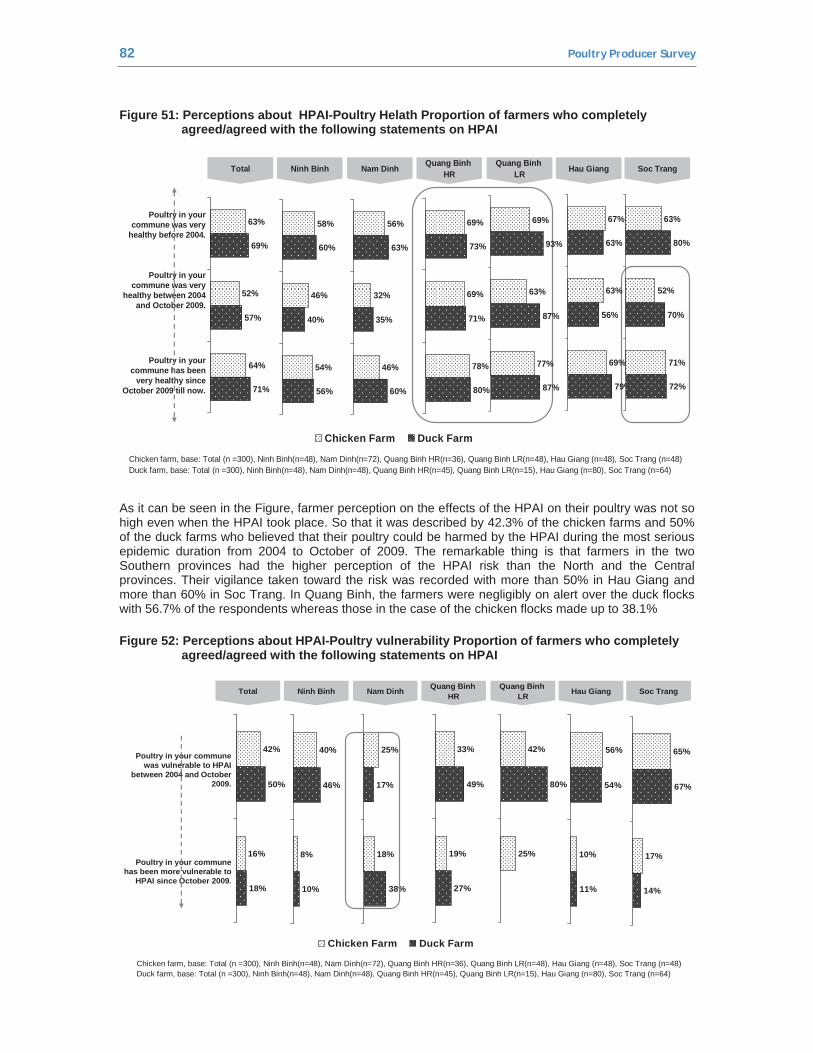
82 Poultry Producer Survey
Figure 51: Perceptions about HPAI-Poultry Helath Proportion of farmers who completely agreed/agreed with the following statements on HPAI
Chicken farm, base: Total (n =300), Ninh Binh(n=48), Nam Dinh(n=72), Quang Binh HR(n=36), Quang Binh LR(n=48), Hau Giang (n=48), Soc Trang (n=48) Duck farm, base: Total (n =300), Ninh Binh(n=48), Nam Dinh(n=48), Quang Binh HR(n=45), Quang Binh LR(n=15), Hau Giang (n=80), Soc Trang (n=64)
Poultry in your commune has been
very healthy since October 2009 till now.
Poultry in your commune was very
healthy between 2004 and October 2009.
Poultry in your commune was very
healthy before 2004.
Ninh Binh Nam Dinh Quang BinhHR
Quang BinhLRTotal Soc TrangHau Giang
64%
52%
63%
71%
57%
69%
54%
46%
58%
56%
40%
60%
46%
32%
56%
60%
35%
63%
78%
69%
69%
80%
71%
73%
77%
63%
69%
87%
87%
93%
69%
63%
67%
79%
56%
63%
71%
52%
63%
72%
70%
80%
Chicken Farm Duck Farm
As it can be seen in the Figure, farmer perception on the effects of the HPAI on their poultry was not so high even when the HPAI took place. So that it was described by 42.3% of the chicken farms and 50% of the duck farms who believed that their poultry could be harmed by the HPAI during the most serious epidemic duration from 2004 to October of 2009. The remarkable thing is that farmers in the two Southern provinces had the higher perception of the HPAI risk than the North and the Central provinces. Their vigilance taken toward the risk was recorded with more than 50% in Hau Giang and more than 60% in Soc Trang. In Quang Binh, the farmers were negligibly on alert over the duck flocks with 56.7% of the respondents whereas those in the case of the chicken flocks made up to 38.1%
Figure 52: Perceptions about HPAI-Poultry vulnerability Proportion of farmers who completely agreed/agreed with the following statements on HPAI
Chicken farm, base: Total (n =300), Ninh Binh(n=48), Nam Dinh(n=72), Quang Binh HR(n=36), Quang Binh LR(n=48), Hau Giang (n=48), Soc Trang (n=48) Duck farm, base: Total (n =300), Ninh Binh(n=48), Nam Dinh(n=48), Quang Binh HR(n=45), Quang Binh LR(n=15), Hau Giang (n=80), Soc Trang (n=64)
Poultry in your commune has been more vulnerable to
HPAI since October 2009.
Poultry in your commune was vulnerable to HPAI
between 2004 and October 2009.
Ninh Binh Nam Dinh Quang BinhHR
Quang BinhLRTotal Soc TrangHau Giang
16%
42%
18%
50%
8%
40%
10%
46%
18%
25%
38%
17%
19%
33%
27%
49%
25%
42%
80%
10%
56%
11%
54%
17%
65%
14%
67%
Chicken Farm Duck Farm
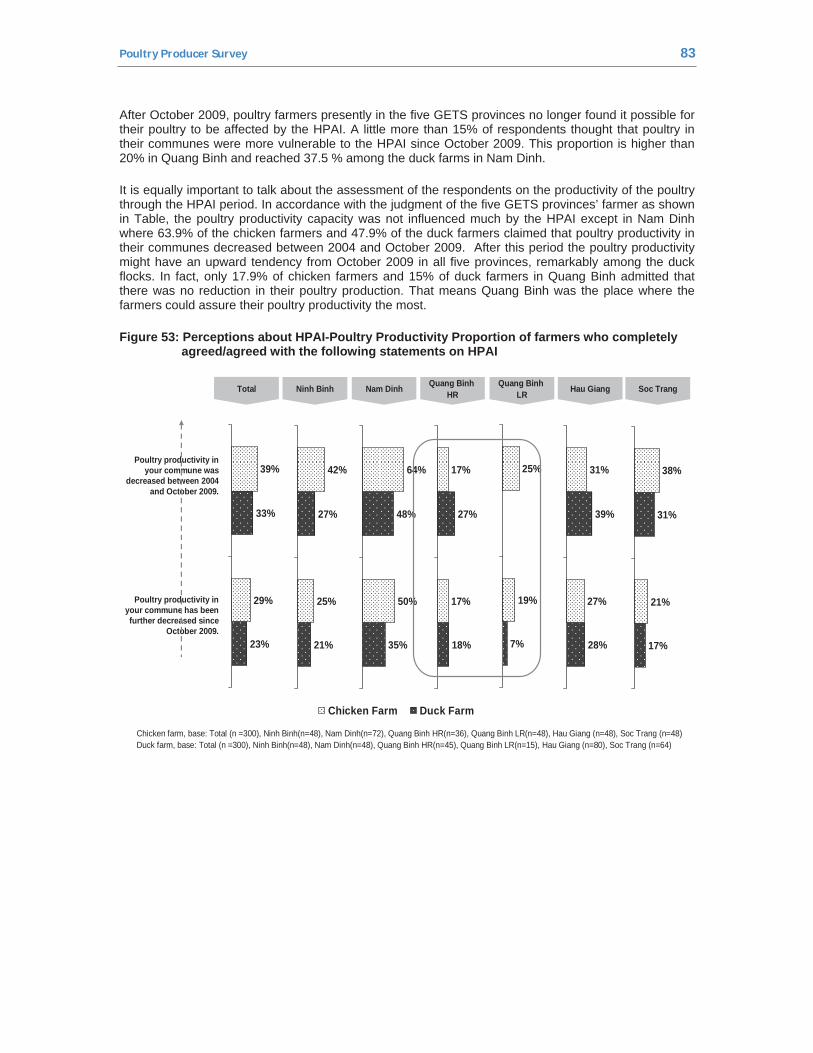
Poultry Producer Survey 83
After October 2009, poultry farmers presently in the five GETS provinces no longer found it possible for their poultry to be affected by the HPAI. A little more than 15% of respondents thought that poultry in their communes were more vulnerable to the HPAI since October 2009. This proportion is higher than 20% in Quang Binh and reached 37.5 % among the duck farms in Nam Dinh.
It is equally important to talk about the assessment of the respondents on the productivity of the poultry through the HPAI period. In accordance with the judgment of the five GETS provinces’ farmer as shown in Table, the poultry productivity capacity was not influenced much by the HPAI except in Nam Dinh where 63.9% of the chicken farmers and 47.9% of the duck farmers claimed that poultry productivity in their communes decreased between 2004 and October 2009. After this period the poultry productivity might have an upward tendency from October 2009 in all five provinces, remarkably among the duck flocks. In fact, only 17.9% of chicken farmers and 15% of duck farmers in Quang Binh admitted that there was no reduction in their poultry production. That means Quang Binh was the place where the farmers could assure their poultry productivity the most.
Figure 53: Perceptions about HPAI-Poultry Productivity Proportion of farmers who completely agreed/agreed with the following statements on HPAI
•Chicken farm, base: Total (n =300), Ninh Binh(n=48), Nam Dinh(n=72), Quang Binh HR(n=36), Quang Binh LR(n=48), Hau Giang (n=48), Soc Trang (n=48) •Duck farm, base: Total (n =300), Ninh Binh(n=48), Nam Dinh(n=48), Quang Binh HR(n=45), Quang Binh LR(n=15), Hau Giang (n=80), Soc Trang (n=64)
Poultry productivity in your commune was
decreased between 2004 and October 2009.
Poultry productivity in your commune has been further decreased since
October 2009.
Ninh Binh Nam Dinh Quang BinhHR
Quang BinhLRTotal Soc TrangHau Giang
29%
39%
23%
33%
25%
42%
21%
27%
50%
64%
35%
48%
17%
17%
18%
27%
19%
25%
7%
27%
31%
28%
39%
21%
38%
17%
31%
Chicken Farm Duck Farm
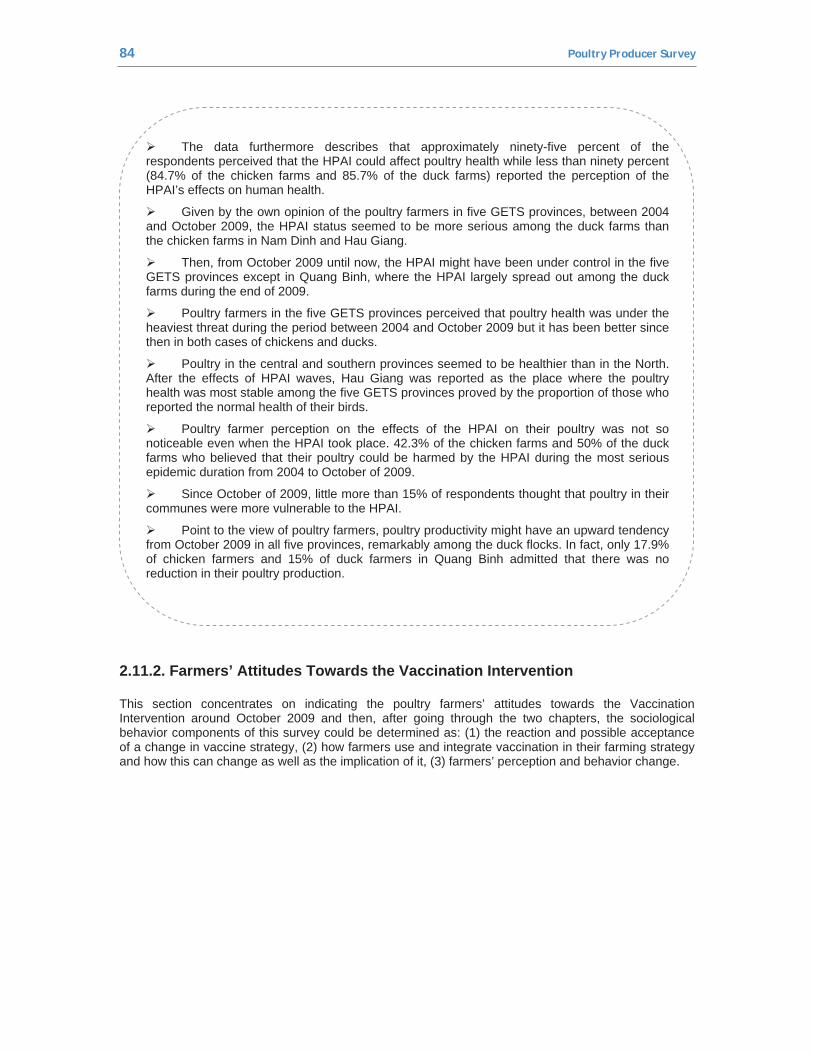
84 Poultry Producer Survey
The data furthermore describes that approximately ninety-five percent of the respondents perceived that the HPAI could affect poultry health while less than ninety percent (84.7% of the chicken farms and 85.7% of the duck farms) reported the perception of the HPAI’s effects on human health.
Given by the own opinion of the poultry farmers in five GETS provinces, between 2004 and October 2009, the HPAI status seemed to be more serious among the duck farms than the chicken farms in Nam Dinh and Hau Giang.
Then, from October 2009 until now, the HPAI might have been under control in the five GETS provinces except in Quang Binh, where the HPAI largely spread out among the duck farms during the end of 2009.
Poultry farmers in the five GETS provinces perceived that poultry health was under the heaviest threat during the period between 2004 and October 2009 but it has been better since then in both cases of chickens and ducks.
Poultry in the central and southern provinces seemed to be healthier than in the North. After the effects of HPAI waves, Hau Giang was reported as the place where the poultry health was most stable among the five GETS provinces proved by the proportion of those who reported the normal health of their birds.
Poultry farmer perception on the effects of the HPAI on their poultry was not so noticeable even when the HPAI took place. 42.3% of the chicken farms and 50% of the duck farms who believed that their poultry could be harmed by the HPAI during the most serious epidemic duration from 2004 to October of 2009.
Since October of 2009, little more than 15% of respondents thought that poultry in their communes were more vulnerable to the HPAI.
Point to the view of poultry farmers, poultry productivity might have an upward tendency from October 2009 in all five provinces, remarkably among the duck flocks. In fact, only 17.9% of chicken farmers and 15% of duck farmers in Quang Binh admitted that there was no reduction in their poultry production.
2.11.2. Farmers’ Attitudes Towards the Vaccination Intervention
This section concentrates on indicating the poultry farmers’ attitudes towards the Vaccination Intervention around October 2009 and then, after going through the two chapters, the sociological behavior components of this survey could be determined as: (1) the reaction and possible acceptance of a change in vaccine strategy, (2) how farmers use and integrate vaccination in their farming strategy and how this can change as well as the implication of it, (3) farmers’ perception and behavior change.
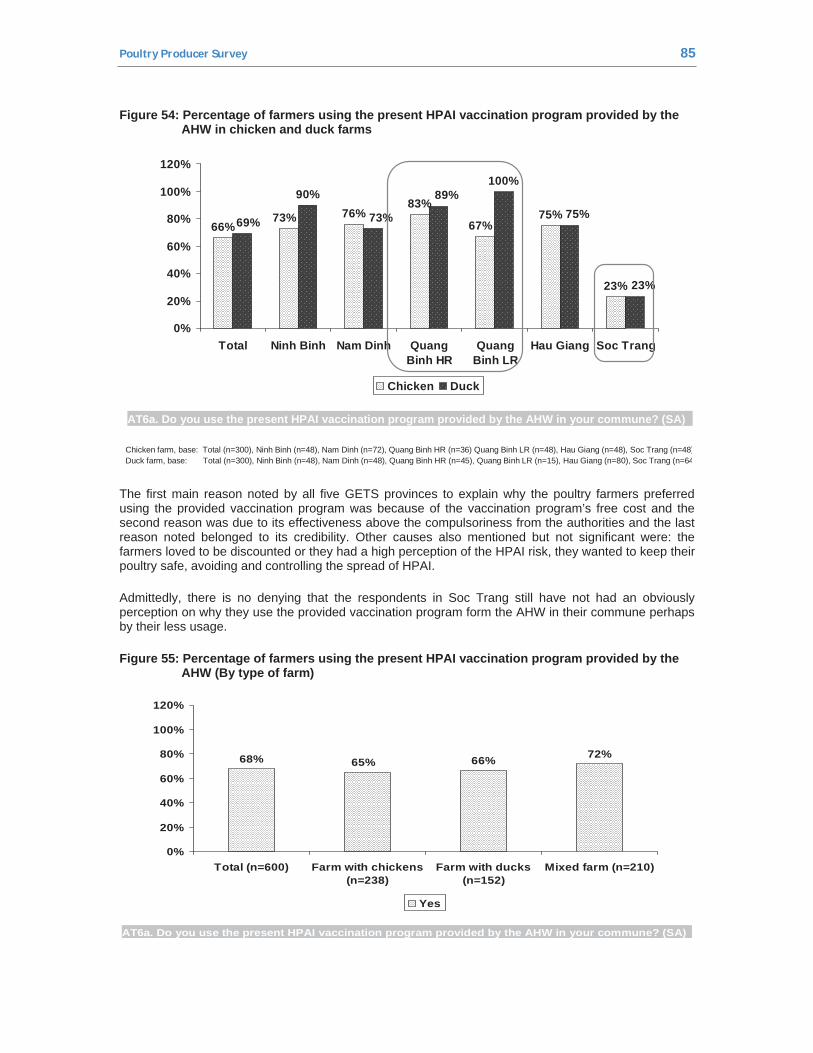
Poultry Producer Survey 85
Figure 54: Percentage of farmers using the present HPAI vaccination program provided by the AHW in chicken and duck farms
Chicken farm, base: Total (n=300), Ninh Binh (n=48), Nam Dinh (n=72), Quang Binh HR (n=36) Quang Binh LR (n=48), Hau Giang (n=48), Soc Trang (n=48)Duck farm, base: Total (n=300), Ninh Binh (n=48), Nam Dinh (n=48), Quang Binh HR (n=45), Quang Binh LR (n=15), Hau Giang (n=80), Soc Trang (n=64
66%76%
83%75%
23%
90%100%
73% 67%69%
89%
73%
23%
75%
0%
20%
40%
60%
80%
100%
120%
Total Ninh Binh Nam Dinh QuangBinh HR
QuangBinh LR
Hau Giang Soc Trang
Chicken Duck
AT6a. Do you use the present HPAI vaccination program provided by the AHW in your commune? (SA)
The first main reason noted by all five GETS provinces to explain why the poultry farmers preferred using the provided vaccination program was because of the vaccination program’s free cost and the second reason was due to its effectiveness above the compulsoriness from the authorities and the last reason noted belonged to its credibility. Other causes also mentioned but not significant were: the farmers loved to be discounted or they had a high perception of the HPAI risk, they wanted to keep their poultry safe, avoiding and controlling the spread of HPAI.
Admittedly, there is no denying that the respondents in Soc Trang still have not had an obviously perception on why they use the provided vaccination program form the AHW in their commune perhaps by their less usage.
Figure 55: Percentage of farmers using the present HPAI vaccination program provided by the AHW (By type of farm)
68% 66% 72%65%
0%
20%
40%
60%
80%
100%
120%
Total (n=600) Farm with chickens(n=238)
Farm with ducks(n=152)
Mixed farm (n=210)
Yes
AT6a. Do you use the present HPAI vaccination program provided by the AHW in your commune? (SA)
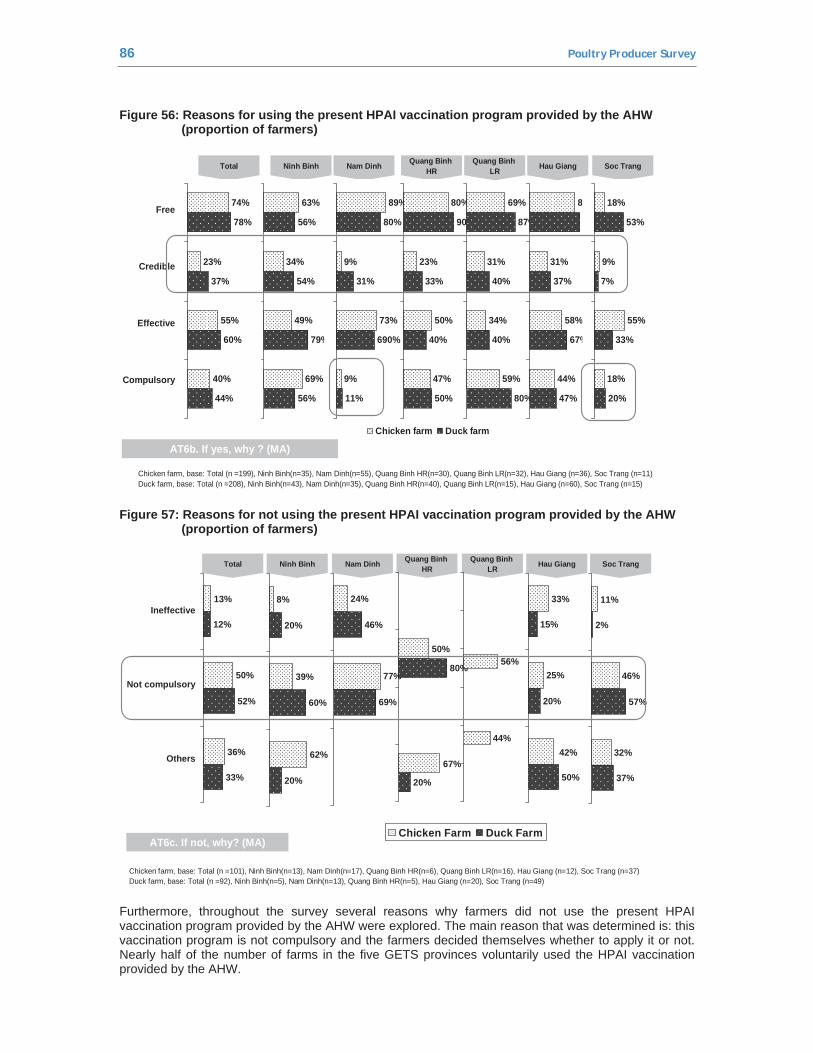
86 Poultry Producer Survey
Figure 56: Reasons for using the present HPAI vaccination program provided by the AHW (proportion of farmers)
Free
Credible
Effective
Compulsory
•Chicken farm, base: Total (n =199), Ninh Binh(n=35), Nam Dinh(n=55), Quang Binh HR(n=30), Quang Binh LR(n=32), Hau Giang (n=36), Soc Trang (n=11) •Duck farm, base: Total (n =208), Ninh Binh(n=43), Nam Dinh(n=35), Quang Binh HR(n=40), Quang Binh LR(n=15), Hau Giang (n=60), Soc Trang (n=15)
Ninh Binh Nam Dinh Quang BinhHR
Quang BinhLRTotal Soc TrangHau Giang
40%
55%
23%
74%
44%
60%
37%
78%
69%
49%
34%
63%
56%
79%
54%
56%
9%
73%
9%
89%
11%
690%
31%
80%
47%
50%
23%
80%
50%
40%
33%
90%
59%
34%
31%
69%
80%
40%
40%
87%
44%
58%
31%
81%
47%
67%
37%
90%
18%
55%
9%
18%
20%
33%
7%
53%
Chicken farm Duck farm
AT6b. If yes, why ? (MA)
Figure 57: Reasons for not using the present HPAI vaccination program provided by the AHW (proportion of farmers)
•Chicken farm, base: Total (n =101), Ninh Binh(n=13), Nam Dinh(n=17), Quang Binh HR(n=6), Quang Binh LR(n=16), Hau Giang (n=12), Soc Trang (n=37) •Duck farm, base: Total (n =92), Ninh Binh(n=5), Nam Dinh(n=13), Quang Binh HR(n=5), Hau Giang (n=20), Soc Trang (n=49)
Ninh Binh Nam Dinh Quang BinhHR
Quang BinhLRTotal Soc TrangHau Giang
36%
50%
13%
33%
52%
12%Ineffective
Not compulsory
Others 62%
39%
8%
20%
60%
20%
77%
24%
69%
46%
50%
67%
80%
20%
44%
56%
42%
25%
33%
50%
20%
15%
32%
46%
11%
37%
57%
2%
Chicken Farm Duck FarmAT6c. If not, why? (MA)
Furthermore, throughout the survey several reasons why farmers did not use the present HPAI vaccination program provided by the AHW were explored. The main reason that was determined is: this vaccination program is not compulsory and the farmers decided themselves whether to apply it or not. Nearly half of the number of farms in the five GETS provinces voluntarily used the HPAI vaccination provided by the AHW.
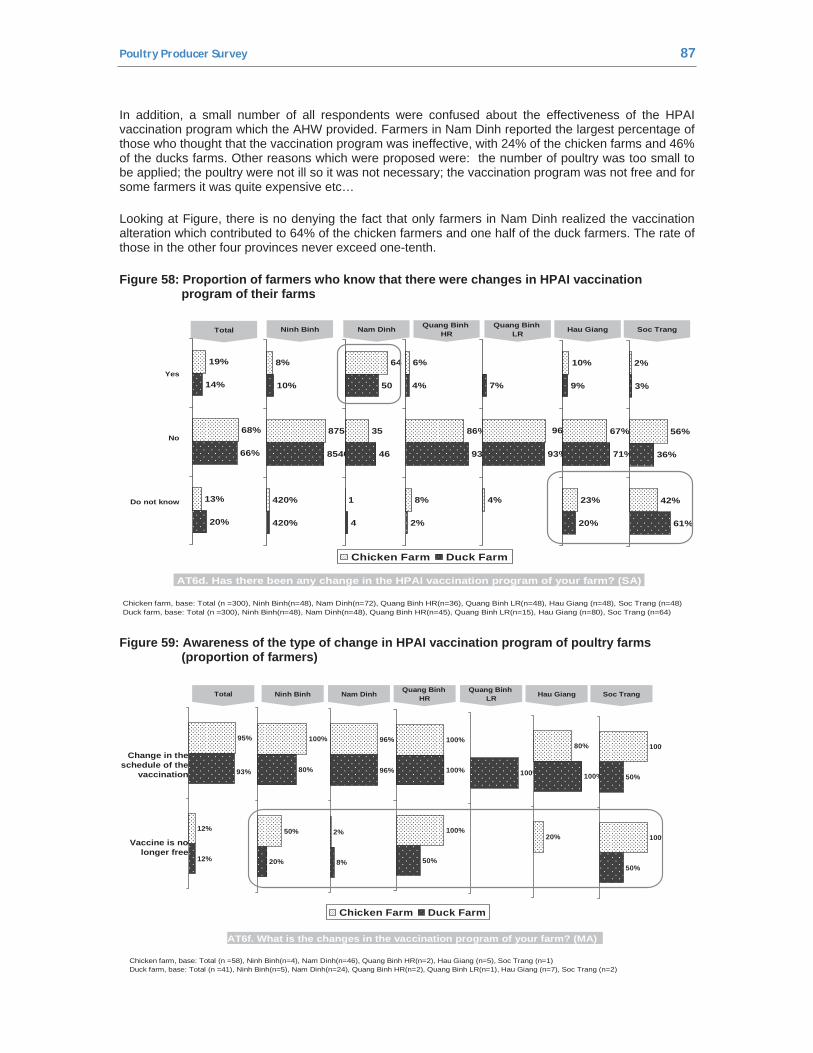
Poultry Producer Survey 87
In addition, a small number of all respondents were confused about the effectiveness of the HPAI vaccination program which the AHW provided. Farmers in Nam Dinh reported the largest percentage of those who thought that the vaccination program was ineffective, with 24% of the chicken farms and 46% of the ducks farms. Other reasons which were proposed were: the number of poultry was too small to be applied; the poultry were not ill so it was not necessary; the vaccination program was not free and for some farmers it was quite expensive etc…
Looking at Figure, there is no denying the fact that only farmers in Nam Dinh realized the vaccination alteration which contributed to 64% of the chicken farmers and one half of the duck farmers. The rate of those in the other four provinces never exceed one-tenth.
Figure 58: Proportion of farmers who know that there were changes in HPAI vaccination program of their farms
AT6d. Has there been any change in the HPAI vaccination program of your farm? (SA)
Yes
No
Do not know
•Chicken farm, base: Total (n =300), Ninh Binh(n=48), Nam Dinh(n=72), Quang Binh HR(n=36), Quang Binh LR(n=48), Hau Giang (n=48), Soc Trang (n=48) •Duck farm, base: Total (n =300), Ninh Binh(n=48), Nam Dinh(n=48), Quang Binh HR(n=45), Quang Binh LR(n=15), Hau Giang (n=80), Soc Trang (n=64)
Ninh Binh Nam Dinh Quang BinhHR
Quang BinhLRTotal Soc TrangHau Giang
13%
68%
19%
20%
66%
14%
420%
8540%
420%
8750%
8%
10%
64
35
1
50
46
4
8%
86%
6%
2%
93%
4%
4%
96%
93%
7%
23%
67%
10%
20%
71%
9%
42%
56%
2%
61%
36%
3%
Chicken Farm Duck Farm
Figure 59: Awareness of the type of change in HPAI vaccination program of poultry farms (proportion of farmers)
AT6f. What is the changes in the vaccination program of your farm? (MA)
•Chicken farm, base: Total (n =58), Ninh Binh(n=4), Nam Dinh(n=46), Quang Binh HR(n=2), Hau Giang (n=5), Soc Trang (n=1) •Duck farm, base: Total (n =41), Ninh Binh(n=5), Nam Dinh(n=24), Quang Binh HR(n=2), Quang Binh LR(n=1), Hau Giang (n=7), Soc Trang (n=2)
Change in the schedule of the
vaccination
Vaccine is no longer free
Ninh Binh Nam Dinh Quang BinhHR
Quang BinhLRTotal Soc TrangHau Giang
Chicken Farm Duck Farm
12%
95%
12%
93%
50%
100%
20%
80%
100%
100%
50%
100%
2%
96%
8%
96% 100%
20%
80%
100%
100%
100%
50%
50%
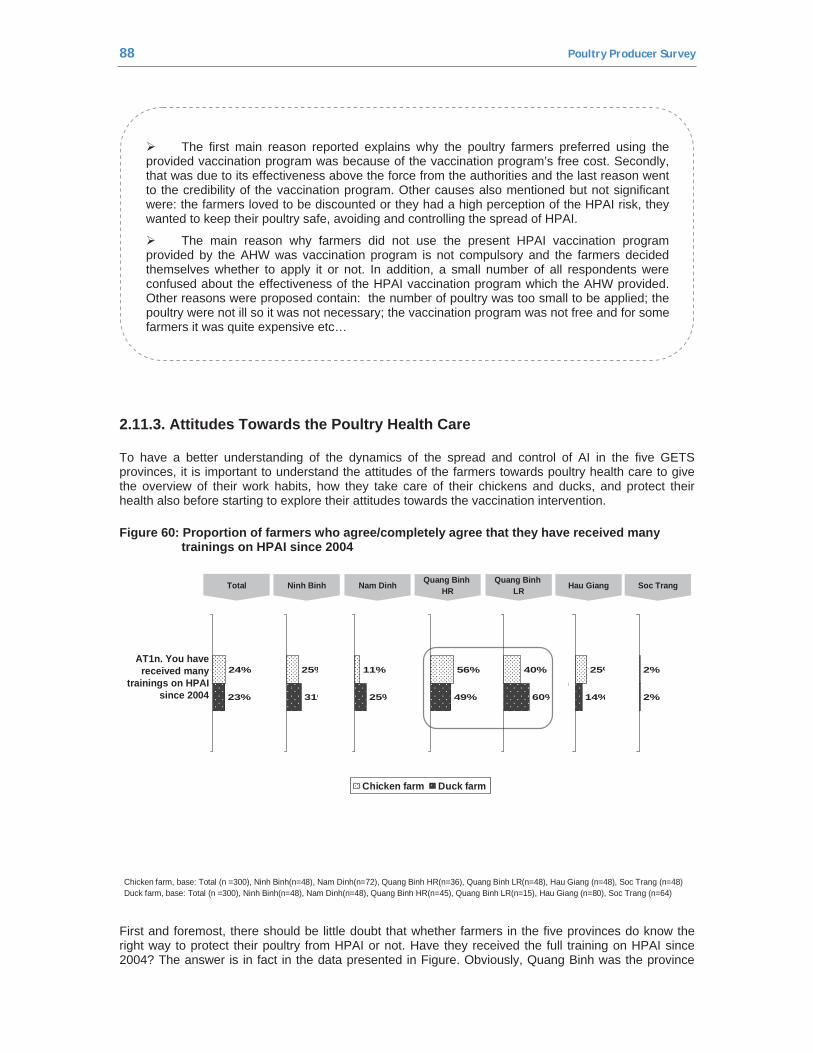
88 Poultry Producer Survey
The first main reason reported explains why the poultry farmers preferred using the provided vaccination program was because of the vaccination program’s free cost. Secondly, that was due to its effectiveness above the force from the authorities and the last reason went to the credibility of the vaccination program. Other causes also mentioned but not significant were: the farmers loved to be discounted or they had a high perception of the HPAI risk, they wanted to keep their poultry safe, avoiding and controlling the spread of HPAI.
The main reason why farmers did not use the present HPAI vaccination program provided by the AHW was vaccination program is not compulsory and the farmers decided themselves whether to apply it or not. In addition, a small number of all respondents were confused about the effectiveness of the HPAI vaccination program which the AHW provided. Other reasons were proposed contain: the number of poultry was too small to be applied; the poultry were not ill so it was not necessary; the vaccination program was not free and for some farmers it was quite expensive etc…
2.11.3. Attitudes Towards the Poultry Health Care
To have a better understanding of the dynamics of the spread and control of AI in the five GETS provinces, it is important to understand the attitudes of the farmers towards poultry health care to give the overview of their work habits, how they take care of their chickens and ducks, and protect their health also before starting to explore their attitudes towards the vaccination intervention.
Figure 60: Proportion of farmers who agree/completely agree that they have received many trainings on HPAI since 2004
•Chicken farm, base: Total (n =300), Ninh Binh(n=48), Nam Dinh(n=72), Quang Binh HR(n=36), Quang Binh LR(n=48), Hau Giang (n=48), Soc Trang (n=48) •Duck farm, base: Total (n =300), Ninh Binh(n=48), Nam Dinh(n=48), Quang Binh HR(n=45), Quang Binh LR(n=15), Hau Giang (n=80), Soc Trang (n=64)
AT1n. You have received many
trainings on HPAI since 2004
Ninh Binh Nam Dinh Quang BinhHR
Quang BinhLRTotal Soc TrangHau Giang
24%
23%
25%
31%
11%
25%
56%
49%
40%
60%
2%
2%
25%
14%g
Chicken farm Duck farm
First and foremost, there should be little doubt that whether farmers in the five provinces do know the right way to protect their poultry from HPAI or not. Have they received the full training on HPAI since 2004? The answer is in fact in the data presented in Figure. Obviously, Quang Binh was the province
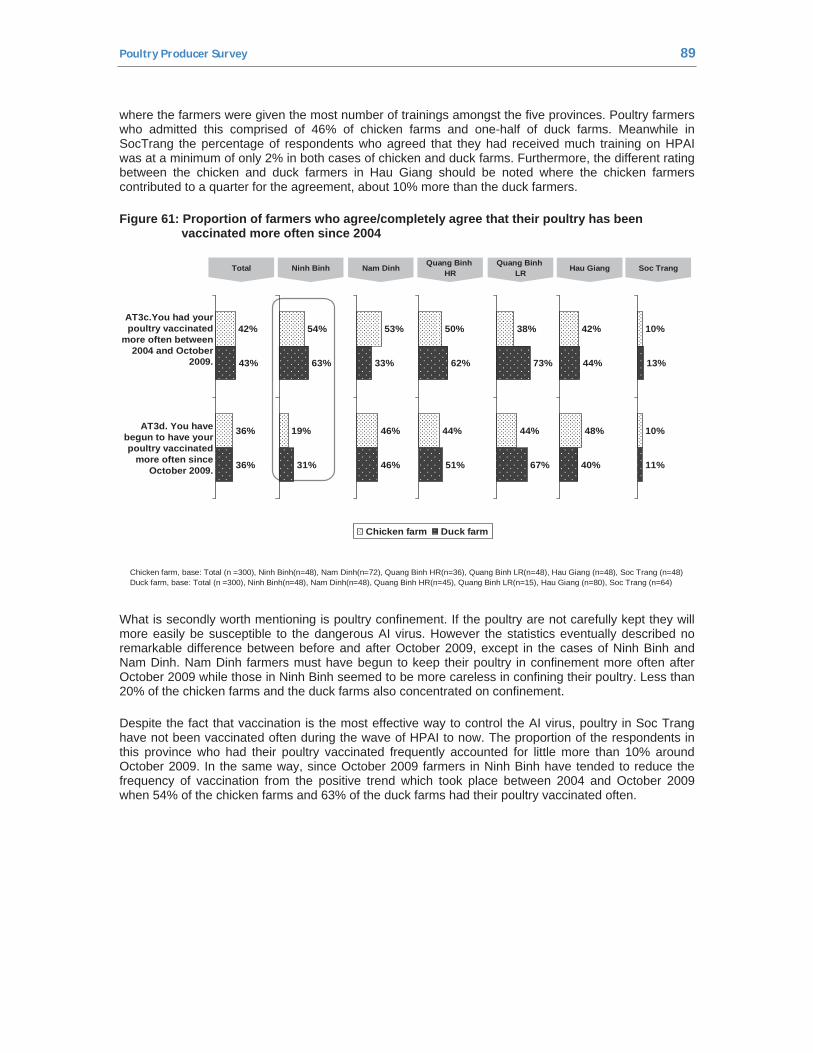
Poultry Producer Survey 89
where the farmers were given the most number of trainings amongst the five provinces. Poultry farmers who admitted this comprised of 46% of chicken farms and one-half of duck farms. Meanwhile in SocTrang the percentage of respondents who agreed that they had received much training on HPAI was at a minimum of only 2% in both cases of chicken and duck farms. Furthermore, the different rating between the chicken and duck farmers in Hau Giang should be noted where the chicken farmers contributed to a quarter for the agreement, about 10% more than the duck farmers.
Figure 61: Proportion of farmers who agree/completely agree that their poultry has been vaccinated more often since 2004
Chicken farm, base: Total (n =300), Ninh Binh(n=48), Nam Dinh(n=72), Quang Binh HR(n=36), Quang Binh LR(n=48), Hau Giang (n=48), Soc Trang (n=48) Duck farm, base: Total (n =300), Ninh Binh(n=48), Nam Dinh(n=48), Quang Binh HR(n=45), Quang Binh LR(n=15), Hau Giang (n=80), Soc Trang (n=64)
AT3c.You had your poultry vaccinated
more often between 2004 and October
2009.
AT3d. You have begun to have your poultry vaccinated
more often since October 2009.
Ninh Binh Nam Dinh Quang BinhHR
Quang BinhLRTotal Soc TrangHau Giang
Chicken farm Duck farm
36%
42%
36%
43%
19%
54%
31%
63%
46%
53%
46%
33%
44%
50%
51%
62%
44%
38%
67%
73%
10%
10%
11%
13%
48%
42%
40%
44%
What is secondly worth mentioning is poultry confinement. If the poultry are not carefully kept they will more easily be susceptible to the dangerous AI virus. However the statistics eventually described no remarkable difference between before and after October 2009, except in the cases of Ninh Binh and Nam Dinh. Nam Dinh farmers must have begun to keep their poultry in confinement more often after October 2009 while those in Ninh Binh seemed to be more careless in confining their poultry. Less than 20% of the chicken farms and the duck farms also concentrated on confinement.
Despite the fact that vaccination is the most effective way to control the AI virus, poultry in Soc Trang have not been vaccinated often during the wave of HPAI to now. The proportion of the respondents in this province who had their poultry vaccinated frequently accounted for little more than 10% around October 2009. In the same way, since October 2009 farmers in Ninh Binh have tended to reduce the frequency of vaccination from the positive trend which took place between 2004 and October 2009 when 54% of the chicken farms and 63% of the duck farms had their poultry vaccinated often.
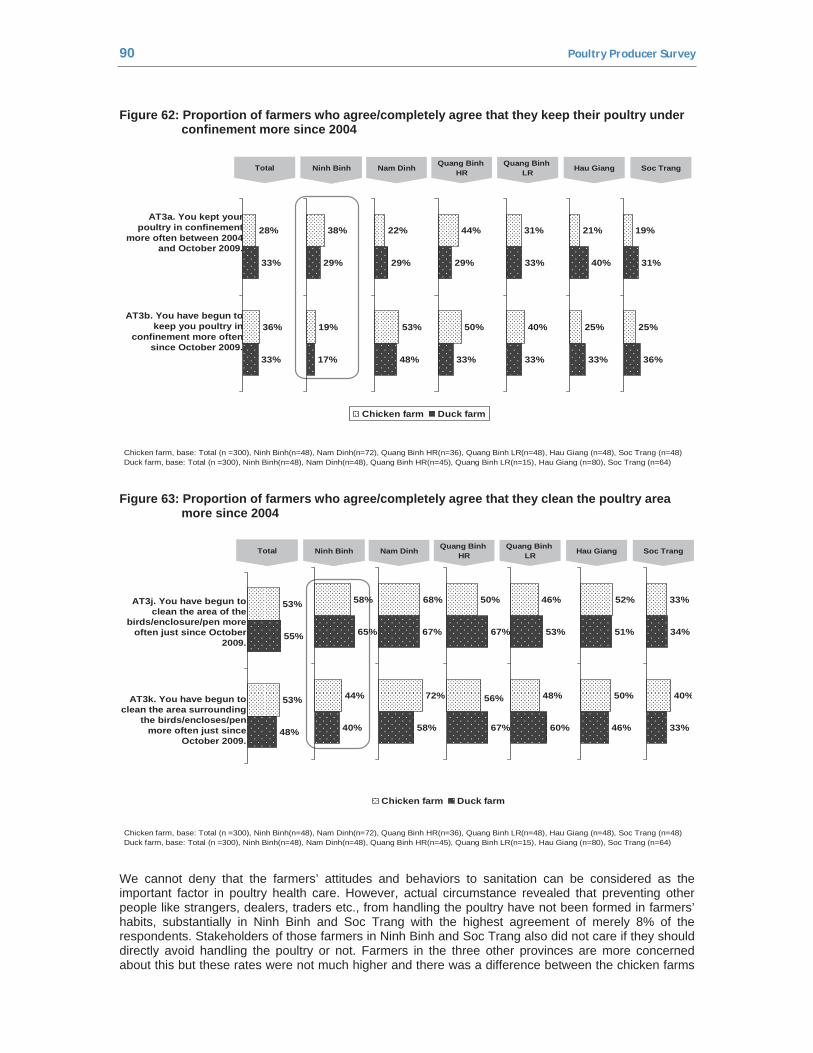
90 Poultry Producer Survey
Figure 62: Proportion of farmers who agree/completely agree that they keep their poultry under confinement more since 2004
Chicken farm, base: Total (n =300), Ninh Binh(n=48), Nam Dinh(n=72), Quang Binh HR(n=36), Quang Binh LR(n=48), Hau Giang (n=48), Soc Trang (n=48) Duck farm, base: Total (n =300), Ninh Binh(n=48), Nam Dinh(n=48), Quang Binh HR(n=45), Quang Binh LR(n=15), Hau Giang (n=80), Soc Trang (n=64)
AT3a. You kept your poultry in confinement
more often between 2004 and October 2009.
AT3b. You have begun to keep you poultry in
confinement more often since October 2009.
Ninh Binh Nam Dinh Quang BinhHR
Quang BinhLRTotal Soc TrangHau Giang
36%
28%
33%
33%
19%
38%
17%
29%
53%
22%
48%
29%
50%
44%
33%
29%
40%
31%
33%
33%
25%
21%
33%
40%
25%
19%
36%
31%
Chicken farm Duck farm
Figure 63: Proportion of farmers who agree/completely agree that they clean the poultry area more since 2004
Chicken farm, base: Total (n =300), Ninh Binh(n=48), Nam Dinh(n=72), Quang Binh HR(n=36), Quang Binh LR(n=48), Hau Giang (n=48), Soc Trang (n=48) Duck farm, base: Total (n =300), Ninh Binh(n=48), Nam Dinh(n=48), Quang Binh HR(n=45), Quang Binh LR(n=15), Hau Giang (n=80), Soc Trang (n=64)
AT3j. You have begun to clean the area of the
birds/enclosure/pen more often just since October
2009.
AT3k. You have begun to clean the area surrounding
the birds/encloses/pen more often just since
October 2009.
Ninh Binh Nam Dinh Quang BinhHR
Quang BinhLRTotal Soc TrangHau Giang
53%
53%
48%
55%
44%
58%
40%
65%
72%
68%
58%
67%
56%
50%
67%
67%
48%
46%
60%
53%
50%
52%
46%
51%
40%
33%
33%
34%
Chicken farm Duck farm
We cannot deny that the farmers’ attitudes and behaviors to sanitation can be considered as the important factor in poultry health care. However, actual circumstance revealed that preventing other people like strangers, dealers, traders etc., from handling the poultry have not been formed in farmers’ habits, substantially in Ninh Binh and Soc Trang with the highest agreement of merely 8% of the respondents. Stakeholders of those farmers in Ninh Binh and Soc Trang also did not care if they should directly avoid handling the poultry or not. Farmers in the three other provinces are more concerned about this but these rates were not much higher and there was a difference between the chicken farms
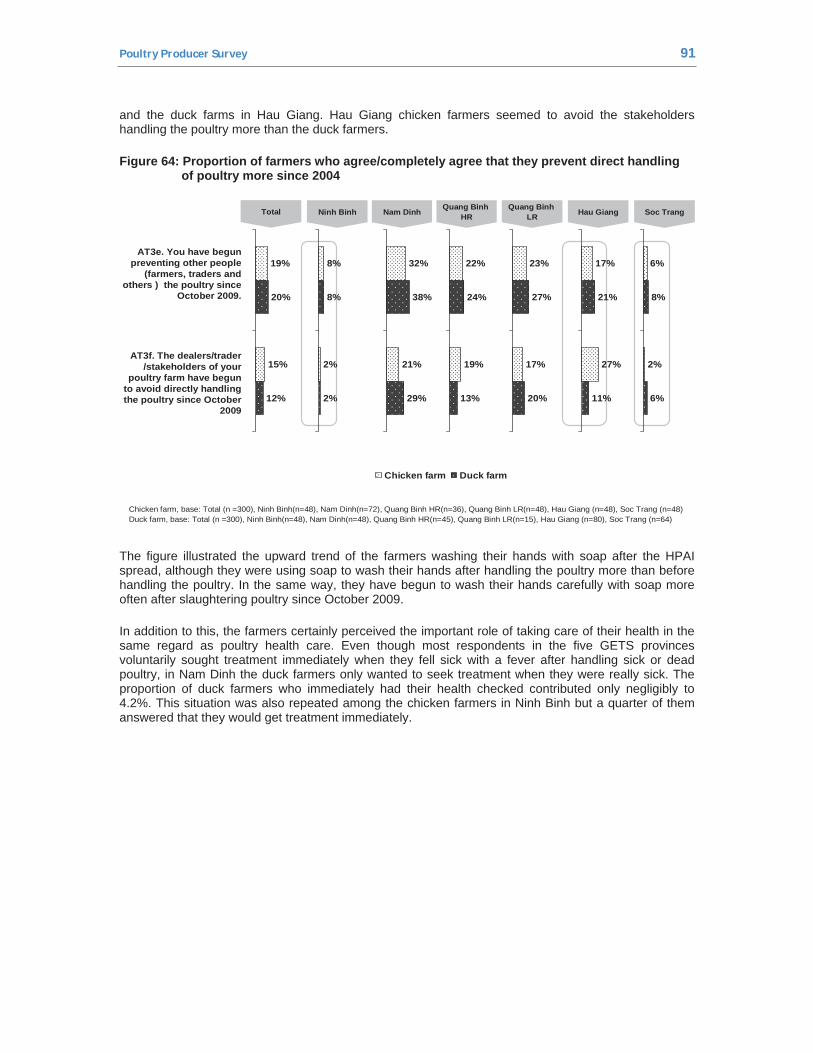
Poultry Producer Survey 91
and the duck farms in Hau Giang. Hau Giang chicken farmers seemed to avoid the stakeholders handling the poultry more than the duck farmers.
Figure 64: Proportion of farmers who agree/completely agree that they prevent direct handling of poultry more since 2004
Chicken farm, base: Total (n =300), Ninh Binh(n=48), Nam Dinh(n=72), Quang Binh HR(n=36), Quang Binh LR(n=48), Hau Giang (n=48), Soc Trang (n=48) Duck farm, base: Total (n =300), Ninh Binh(n=48), Nam Dinh(n=48), Quang Binh HR(n=45), Quang Binh LR(n=15), Hau Giang (n=80), Soc Trang (n=64)
AT3e. You have begun preventing other people
(farmers, traders and others ) the poultry since
October 2009.
AT3f. The dealers/trader /stakeholders of your
poultry farm have begun to avoid directly handling the poultry since October
2009
Ninh Binh Nam Dinh Quang BinhHR
Quang BinhLRTotal Soc TrangHau Giang
15%
19%
12%
20%
2%
8%
2%
8%
21%
32%
29%
38%
19%
22%
13%
24%
17%
23%
20%
27%
27%
17%
11%
21%
2%
6%
6%
8%
Chicken farm Duck farm
The figure illustrated the upward trend of the farmers washing their hands with soap after the HPAI spread, although they were using soap to wash their hands after handling the poultry more than before handling the poultry. In the same way, they have begun to wash their hands carefully with soap more often after slaughtering poultry since October 2009.
In addition to this, the farmers certainly perceived the important role of taking care of their health in the same regard as poultry health care. Even though most respondents in the five GETS provinces voluntarily sought treatment immediately when they fell sick with a fever after handling sick or dead poultry, in Nam Dinh the duck farmers only wanted to seek treatment when they were really sick. The proportion of duck farmers who immediately had their health checked contributed only negligibly to 4.2%. This situation was also repeated among the chicken farmers in Ninh Binh but a quarter of them answered that they would get treatment immediately.
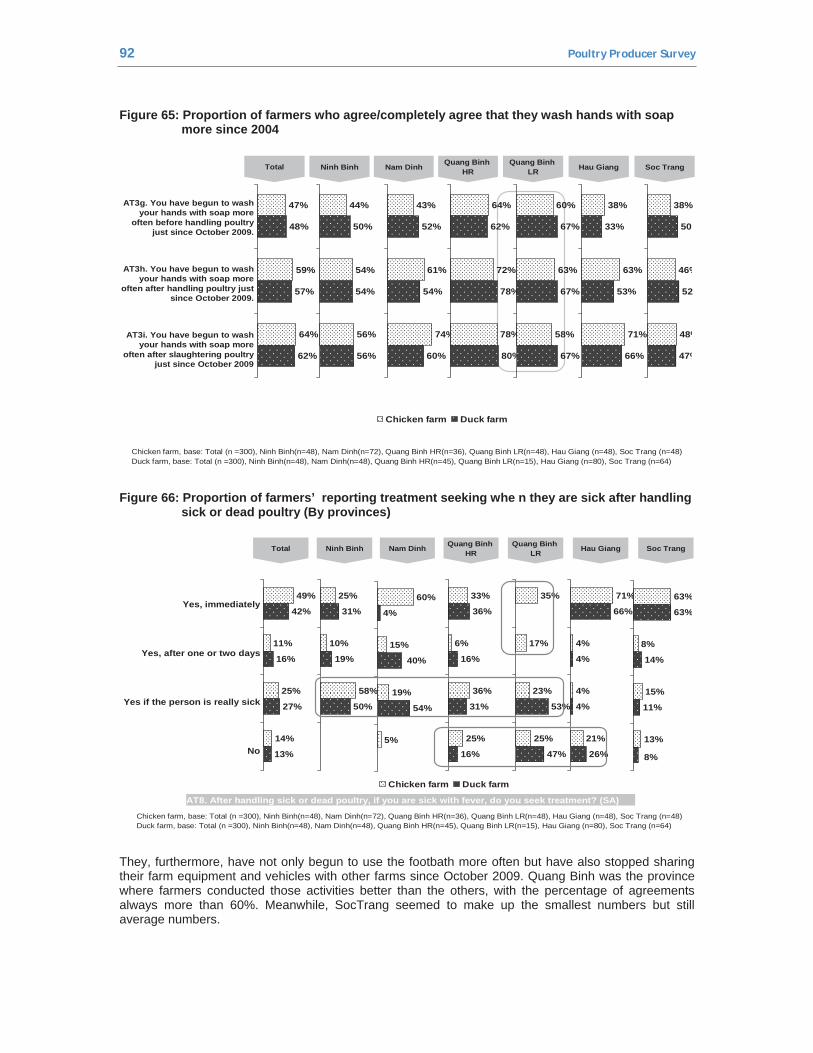
92 Poultry Producer Survey
Figure 65: Proportion of farmers who agree/completely agree that they wash hands with soap more since 2004
Chicken farm, base: Total (n =300), Ninh Binh(n=48), Nam Dinh(n=72), Quang Binh HR(n=36), Quang Binh LR(n=48), Hau Giang (n=48), Soc Trang (n=48) Duck farm, base: Total (n =300), Ninh Binh(n=48), Nam Dinh(n=48), Quang Binh HR(n=45), Quang Binh LR(n=15), Hau Giang (n=80), Soc Trang (n=64)
AT3g. You have begun to wash your hands with soap more
often before handling poultry just since October 2009.
AT3h. You have begun to wash your hands with soap more
often after handling poultry just since October 2009.
AT3i. You have begun to wash your hands with soap more
often after slaughtering poultry just since October 2009
Ninh Binh Nam Dinh Quang BinhHR
Quang BinhLRTotal Soc TrangHau Giang
64%
59%
47%
62%
57%
48%
Chicken farm Duck farm
56%
54%
44%
56%
54%
50%
74%
61%
43%
60%
54%
52%
78%
72%
64%
80%
78%
62%
58%
63%
60%
67%
67%
67%
71%
63%
38%
66%
53%
33%
48%
46%
38%
47%
52
50%
Figure 66: Proportion of farmers’ reporting treatment seeking whe n they are sick after handling sick or dead poultry (By provinces)
25%
36%
6%
33%
16%
31%
16%
36%
25%
23%
17%
35%
47%
53%
AT8. After handling sick or dead poultry, if you are sick with fever, do you seek treatment? (SA)Chicken farm, base: Total (n =300), Ninh Binh(n=48), Nam Dinh(n=72), Quang Binh HR(n=36), Quang Binh LR(n=48), Hau Giang (n=48), Soc Trang (n=48) Duck farm, base: Total (n =300), Ninh Binh(n=48), Nam Dinh(n=48), Quang Binh HR(n=45), Quang Binh LR(n=15), Hau Giang (n=80), Soc Trang (n=64)
Yes, immediately
Yes, after one or two days
Yes if the person is really sick
No
Ninh Binh Nam Dinh Quang BinhHR
Quang BinhLRTotal Soc TrangHau Giang
14%
25%
11%
49%
13%
27%
16%
42%
58%
10%
25%
50%
19%
31%
5%
19%
15%
60%
54%
40%
4%
21%
4%
4%
71%
26%
4%
4%
66%
13%
15%
8%
63%
8%
11%
14%
63%
Chicken farm Duck farm
They, furthermore, have not only begun to use the footbath more often but have also stopped sharing their farm equipment and vehicles with other farms since October 2009. Quang Binh was the province where farmers conducted those activities better than the others, with the percentage of agreements always more than 60%. Meanwhile, SocTrang seemed to make up the smallest numbers but still average numbers.
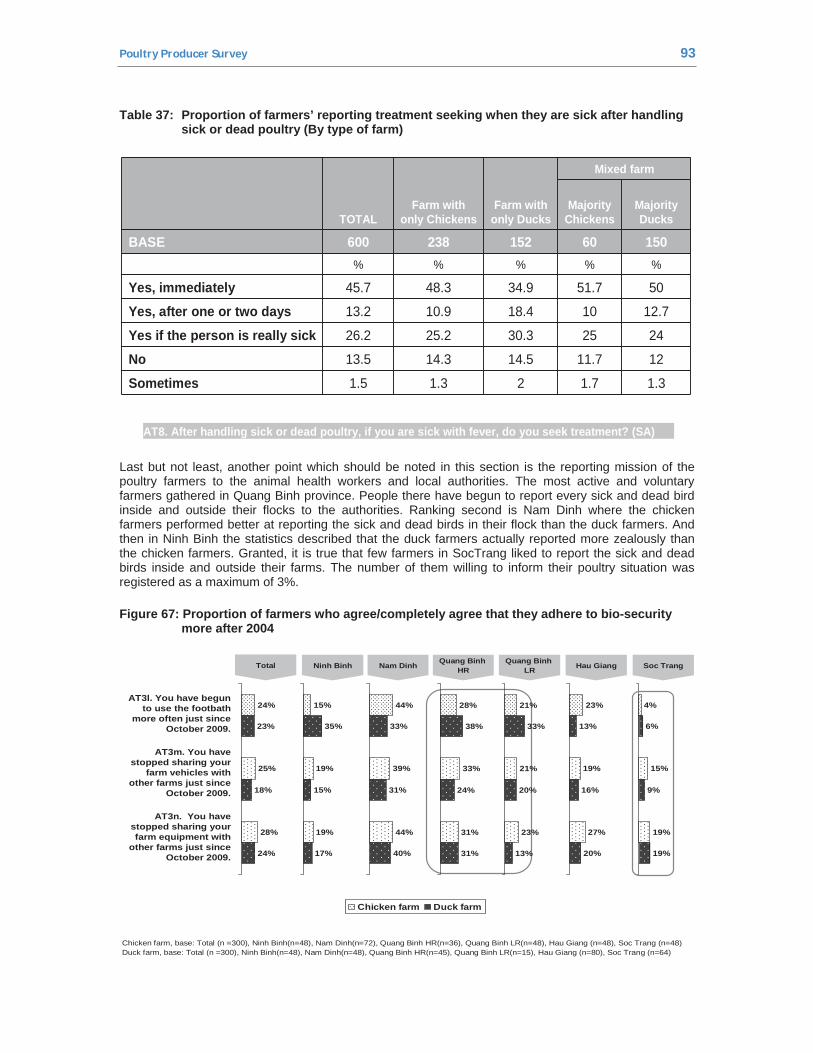
Poultry Producer Survey 93
Table 37: Proportion of farmers’ reporting treatment seeking when they are sick after handling sick or dead poultry (By type of farm)
AT8. After handling sick or dead poultry, if you are sick with fever, do you seek treatment? (SA)
TOTALFarm with
only ChickensFarm with
only Ducks
Mixed farm
Majority Chickens
Majority Ducks
BASE 600 238 152 60 150% % % % %
Yes, immediately 45.7 48.3 34.9 51.7 50
Yes, after one or two days 13.2 10.9 18.4 10 12.7
Yes if the person is really sick 26.2 25.2 30.3 25 24
No 13.5 14.3 14.5 11.7 12
Sometimes 1.5 1.3 2 1.7 1.3
Last but not least, another point which should be noted in this section is the reporting mission of the poultry farmers to the animal health workers and local authorities. The most active and voluntary farmers gathered in Quang Binh province. People there have begun to report every sick and dead bird inside and outside their flocks to the authorities. Ranking second is Nam Dinh where the chicken farmers performed better at reporting the sick and dead birds in their flock than the duck farmers. And then in Ninh Binh the statistics described that the duck farmers actually reported more zealously than the chicken farmers. Granted, it is true that few farmers in SocTrang liked to report the sick and dead birds inside and outside their farms. The number of them willing to inform their poultry situation was registered as a maximum of 3%.
Figure 67: Proportion of farmers who agree/completely agree that they adhere to bio-security more after 2004
4%
6%
15%
9%
19%
19%
24%
23%
25%
18%
28%
24%
Chicken farm, base: Total (n =300), Ninh Binh(n=48), Nam Dinh(n=72), Quang Binh HR(n=36), Quang Binh LR(n=48), Hau Giang (n=48), Soc Trang (n=48) Duck farm, base: Total (n =300), Ninh Binh(n=48), Nam Dinh(n=48), Quang Binh HR(n=45), Quang Binh LR(n=15), Hau Giang (n=80), Soc Trang (n=64)
AT3l. You have begun to use the footbath
more often just since October 2009.
AT3m. You have stopped sharing your
farm vehicles with other farms just since
October 2009.
AT3n. You have stopped sharing your farm equipment with
other farms just since October 2009.
Ninh Binh Nam Dinh Quang BinhHR
Quang BinhLRTotal Soc TrangHau Giang
Chicken farm Duck farm
15%
35%
19%
15%
19%
17%
44%
33%
39%
31%
44%
40%
23%
13%
19%
16%
27%
20%
28%
38%
33%
24%
31%
31%
21%
33%
21%
20%
23%
13%
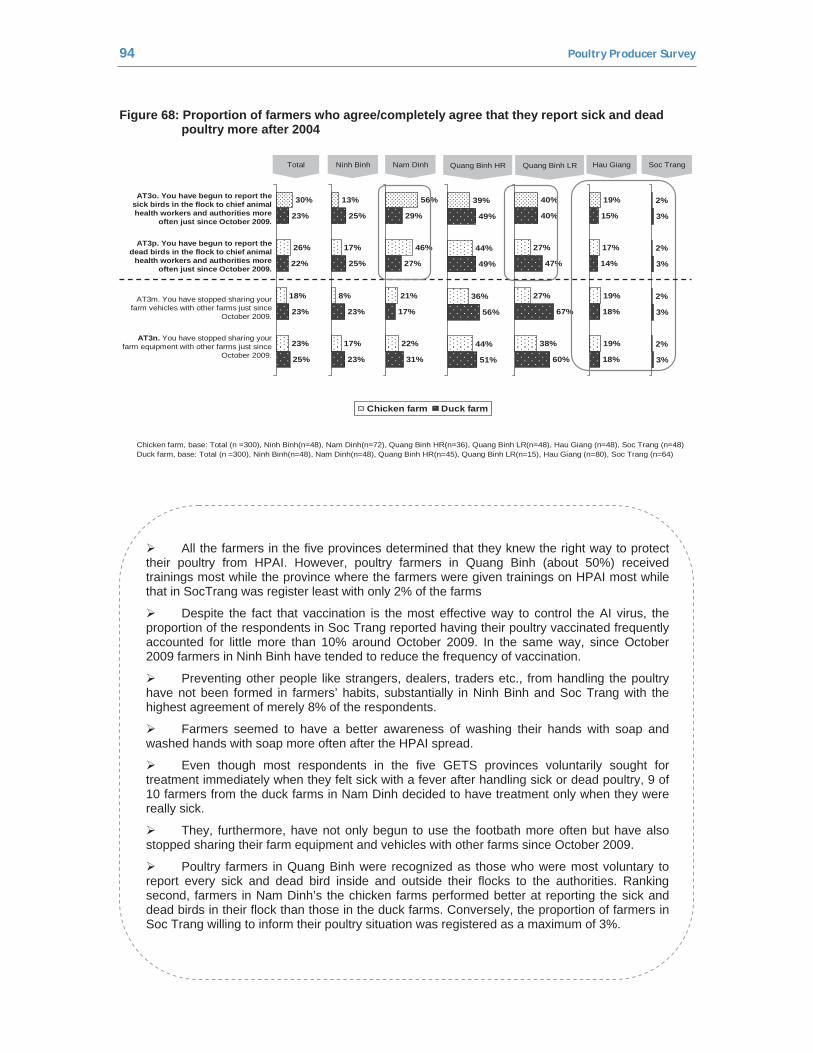
94 Poultry Producer Survey
Figure 68: Proportion of farmers who agree/completely agree that they report sick and dead poultry more after 2004
30%
23%
26%
22%
18%
23%
23%
25%
13%
25%
17%
25%
8%
23%
17%
23%
56%
29%
46%
27%
21%
17%
22%
31%
40%
40%
27%
47%
27%
67%
38%
60%
19%
15%
17%
14%
19%
18%
19%
18%
Chicken farm, base: Total (n =300), Ninh Binh(n=48), Nam Dinh(n=72), Quang Binh HR(n=36), Quang Binh LR(n=48), Hau Giang (n=48), Soc Trang (n=48) Duck farm, base: Total (n =300), Ninh Binh(n=48), Nam Dinh(n=48), Quang Binh HR(n=45), Quang Binh LR(n=15), Hau Giang (n=80), Soc Trang (n=64)
Ninh Binh Quang Binh HR Hau GiangTotal Nam Dinh Quang Binh LR Soc Trang
AT3o. You have begun to report the sick birds in the flock to chief animal health workers and authorities more
often just since October 2009.
AT3p. You have begun to report the dead birds in the flock to chief animal
health workers and authorities more often just since October 2009.
AT3m. You have stopped sharing your farm vehicles with other farms just since
October 2009.
AT3n. You have stopped sharing your farm equipment with other farms just since
October 2009.
Chicken farm Duck farm
39%
49%
44%
49%
36%
56%
44%
51%
2%
3%
2%
3%
2%
3%
2%
3%
All the farmers in the five provinces determined that they knew the right way to protect their poultry from HPAI. However, poultry farmers in Quang Binh (about 50%) received trainings most while the province where the farmers were given trainings on HPAI most while that in SocTrang was register least with only 2% of the farms
Despite the fact that vaccination is the most effective way to control the AI virus, the proportion of the respondents in Soc Trang reported having their poultry vaccinated frequently accounted for little more than 10% around October 2009. In the same way, since October 2009 farmers in Ninh Binh have tended to reduce the frequency of vaccination.
Preventing other people like strangers, dealers, traders etc., from handling the poultry have not been formed in farmers’ habits, substantially in Ninh Binh and Soc Trang with the highest agreement of merely 8% of the respondents.
Farmers seemed to have a better awareness of washing their hands with soap and washed hands with soap more often after the HPAI spread.
Even though most respondents in the five GETS provinces voluntarily sought for treatment immediately when they felt sick with a fever after handling sick or dead poultry, 9 of 10 farmers from the duck farms in Nam Dinh decided to have treatment only when they were really sick.
They, furthermore, have not only begun to use the footbath more often but have also stopped sharing their farm equipment and vehicles with other farms since October 2009.
Poultry farmers in Quang Binh were recognized as those who were most voluntary to report every sick and dead bird inside and outside their flocks to the authorities. Ranking second, farmers in Nam Dinh’s the chicken farms performed better at reporting the sick and dead birds in their flock than those in the duck farms. Conversely, the proportion of farmers in Soc Trang willing to inform their poultry situation was registered as a maximum of 3%.
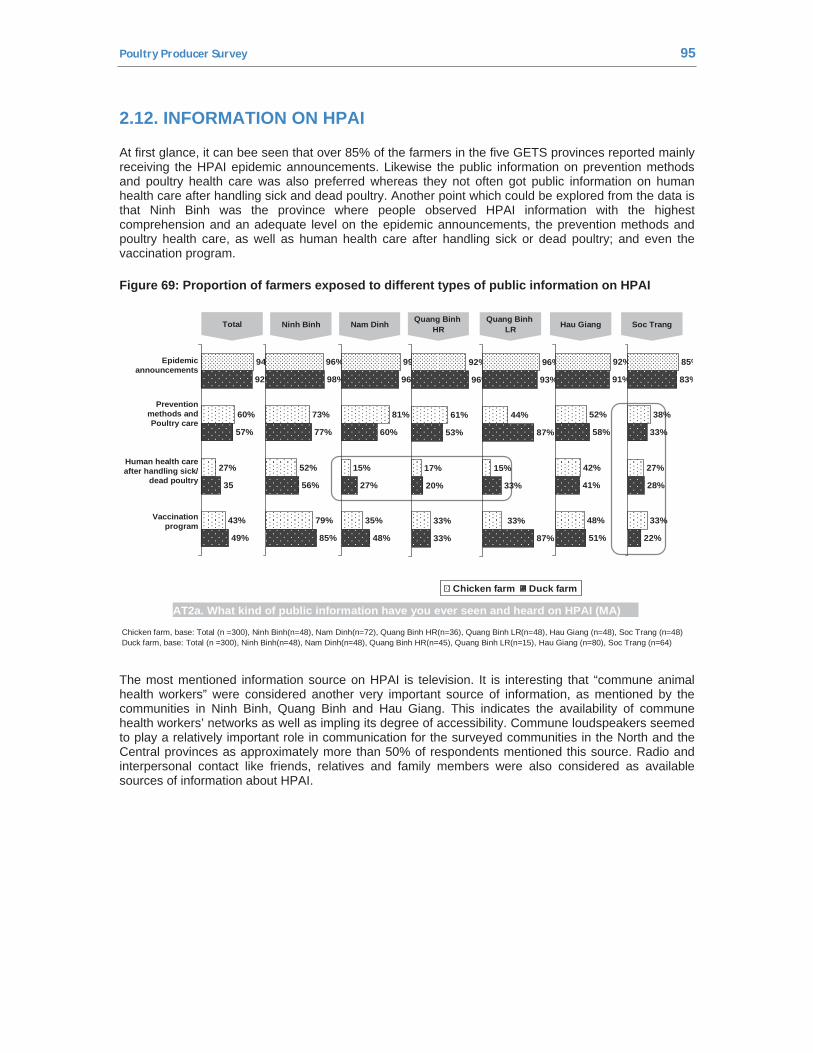
Poultry Producer Survey 95
2.12. INFORMATION ON HPAI
At first glance, it can bee seen that over 85% of the farmers in the five GETS provinces reported mainly receiving the HPAI epidemic announcements. Likewise the public information on prevention methods and poultry health care was also preferred whereas they not often got public information on human health care after handling sick and dead poultry. Another point which could be explored from the data is that Ninh Binh was the province where people observed HPAI information with the highest comprehension and an adequate level on the epidemic announcements, the prevention methods and poultry health care, as well as human health care after handling sick or dead poultry; and even the vaccination program.
Figure 69: Proportion of farmers exposed to different types of public information on HPAI
AT2a. What kind of public information have you ever seen and heard on HPAI (MA)
Chicken farm, base: Total (n =300), Ninh Binh(n=48), Nam Dinh(n=72), Quang Binh HR(n=36), Quang Binh LR(n=48), Hau Giang (n=48), Soc Trang (n=48) Duck farm, base: Total (n =300), Ninh Binh(n=48), Nam Dinh(n=48), Quang Binh HR(n=45), Quang Binh LR(n=15), Hau Giang (n=80), Soc Trang (n=64)
Epidemic announcements
Prevention methods and Poultry care
Human health care after handling sick/
dead poultry
Vaccination program
Ninh Binh Nam Dinh Quang BinhHR
Quang BinhLRTotal Soc TrangHau Giang
94%
92%
60%
57%
27%
35
43%
49%
Chicken farm Duck farm
96%
98%
73%
77%
52%
56%
79%
85%
99%
96%
81%
60%
15%
27%
35%
48%
92%
96%
61%
53%
17%
20%
33%
33%
96%
93%
44%
87%
15%
33%
33%
87%
92%
91%
52%
58%
42%
41%
48%
51%
85%
83%
38%
33%
27%
28%
33%
22%
The most mentioned information source on HPAI is television. It is interesting that “commune animal health workers” were considered another very important source of information, as mentioned by the communities in Ninh Binh, Quang Binh and Hau Giang. This indicates the availability of commune health workers’ networks as well as impling its degree of accessibility. Commune loudspeakers seemed to play a relatively important role in communication for the surveyed communities in the North and the Central provinces as approximately more than 50% of respondents mentioned this source. Radio and interpersonal contact like friends, relatives and family members were also considered as available sources of information about HPAI.
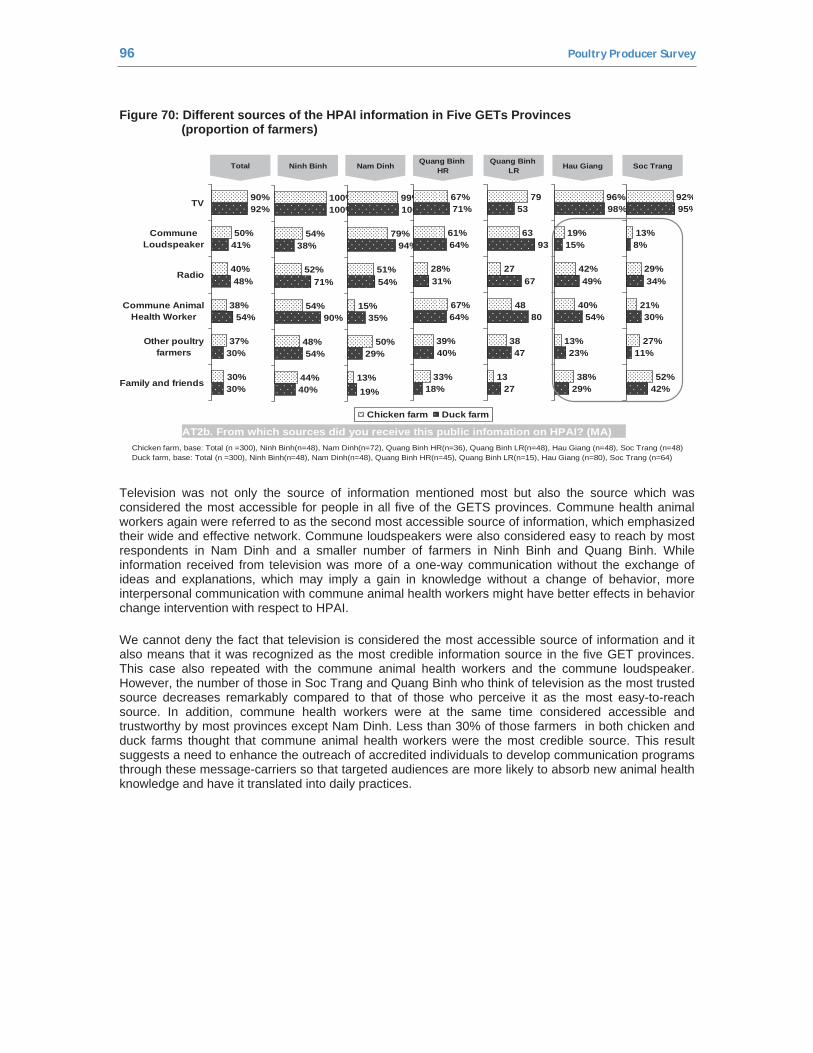
96 Poultry Producer Survey
Figure 70: Different sources of the HPAI information in Five GETs Provinces (proportion of farmers)
38%
13%
40%
42%
19%
96%
29%
23%
54%
49%
15%
98%
52%
27%
21%
29%
13%
92%
42%
11%
30%
34%
8%
95%
AT2b. From which sources did you receive this public infomation on HPAI? (MA)Chicken farm, base: Total (n =300), Ninh Binh(n=48), Nam Dinh(n=72), Quang Binh HR(n=36), Quang Binh LR(n=48), Hau Giang (n=48), Soc Trang (n=48) Duck farm, base: Total (n =300), Ninh Binh(n=48), Nam Dinh(n=48), Quang Binh HR(n=45), Quang Binh LR(n=15), Hau Giang (n=80), Soc Trang (n=64)
Ninh Binh Nam Dinh Quang BinhHR
Quang BinhLRTotal Soc TrangHau Giang
30%
37%
38%
40%
50%
90%
30%
30%
54%
48%
41%
92%TV
CommuneLoudspeaker
Radio
Commune AnimalHealth Worker
Other poultryfarmers
Family and friends
Chicken farm Duck farm
44%
48%
54%
52%
54%
100%
40%
54%
90%
71%
38%
100%
13%
50%
15%
51%
79%
99%
19%
29%
35%
54%
94%
100%
33%
39%
67%
28%
61%
67%
18%
40%
64%
31%
64%
71%79
63
27
48
38
13
53
93
67
80
47
27
Television was not only the source of information mentioned most but also the source which was considered the most accessible for people in all five of the GETS provinces. Commune health animal workers again were referred to as the second most accessible source of information, which emphasized their wide and effective network. Commune loudspeakers were also considered easy to reach by most respondents in Nam Dinh and a smaller number of farmers in Ninh Binh and Quang Binh. While information received from television was more of a one-way communication without the exchange of ideas and explanations, which may imply a gain in knowledge without a change of behavior, more interpersonal communication with commune animal health workers might have better effects in behavior change intervention with respect to HPAI.
We cannot deny the fact that television is considered the most accessible source of information and it also means that it was recognized as the most credible information source in the five GET provinces. This case also repeated with the commune animal health workers and the commune loudspeaker. However, the number of those in Soc Trang and Quang Binh who think of television as the most trusted source decreases remarkably compared to that of those who perceive it as the most easy-to-reach source. In addition, commune health workers were at the same time considered accessible and trustworthy by most provinces except Nam Dinh. Less than 30% of those farmers in both chicken and duck farms thought that commune animal health workers were the most credible source. This result suggests a need to enhance the outreach of accredited individuals to develop communication programs through these message-carriers so that targeted audiences are more likely to absorb new animal health knowledge and have it translated into daily practices.
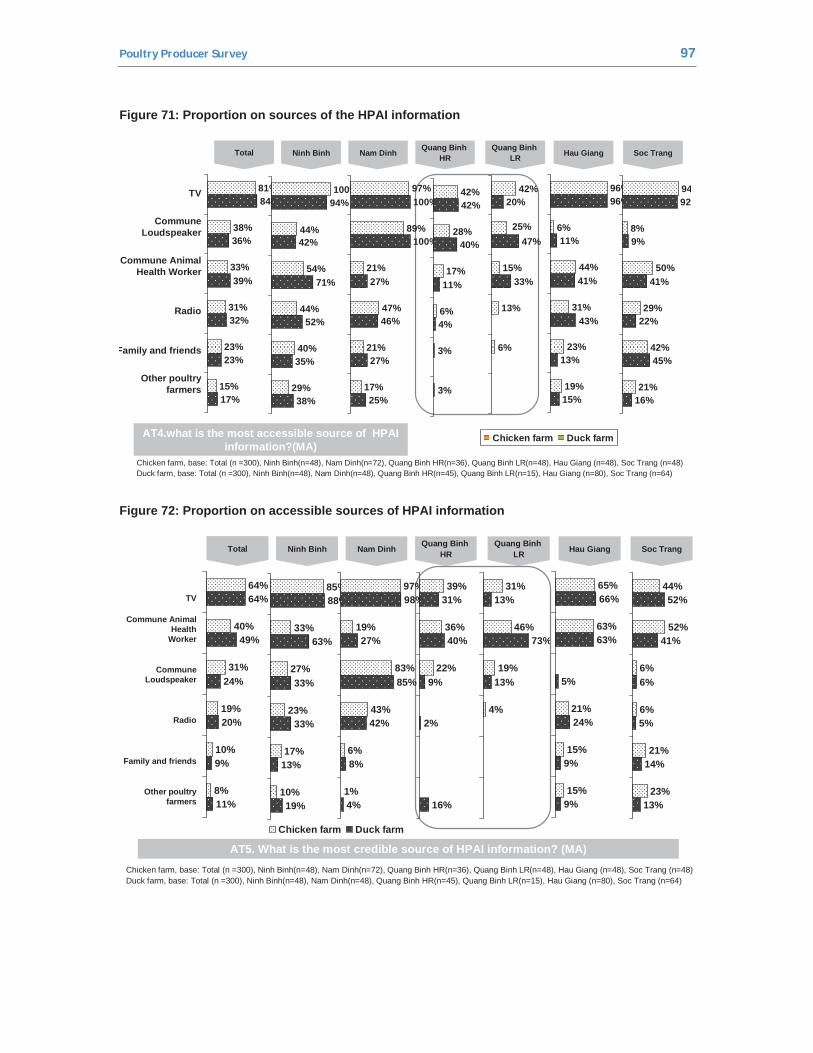
Poultry Producer Survey 97
Figure 71: Proportion on sources of the HPAI information
Chicken farm Duck farm
Chicken farm, base: Total (n =300), Ninh Binh(n=48), Nam Dinh(n=72), Quang Binh HR(n=36), Quang Binh LR(n=48), Hau Giang (n=48), Soc Trang (n=48) Duck farm, base: Total (n =300), Ninh Binh(n=48), Nam Dinh(n=48), Quang Binh HR(n=45), Quang Binh LR(n=15), Hau Giang (n=80), Soc Trang (n=64)
Other poultry farmers
Family and friends
Radio
Commune Animal Health Worker
Commune Loudspeaker
TV
Ninh Binh Nam Dinh Quang BinhHR
Quang BinhLRTotal Soc TrangHau Giang
15%
23%
31%
33%
38%
81%
17%
23%
32%
39%
36%
84%
29%
40%
44%
54%
44%
100%
38%
35%
52%
71%
42%
94%
17%
21%
47%
21%
89%
97%
25%
27%
46%
27%
100%
100%
3%
3%
6%
17%
28%
42%
4%
11%
40%
42%
6%
13%
15%
25%
42%
33%
47%
20%
19%
23%
31%
44%
6%
96%
15%
13%
43%
41%
11%
96%
21%
42%
29%
50%
8%
94
16%
45%
22%
41%
9%
92
AT4.what is the most accessible source of HPAI information?(MA)
Figure 72: Proportion on accessible sources of HPAI information
Chicken farm, base: Total (n =300), Ninh Binh(n=48), Nam Dinh(n=72), Quang Binh HR(n=36), Quang Binh LR(n=48), Hau Giang (n=48), Soc Trang (n=48) Duck farm, base: Total (n =300), Ninh Binh(n=48), Nam Dinh(n=48), Quang Binh HR(n=45), Quang Binh LR(n=15), Hau Giang (n=80), Soc Trang (n=64)
Other poultry farmers
Family and friends
Radio
Commune Loudspeaker
Commune Animal Health
Worker
TV
Ninh Binh Nam Dinh Quang BinhHR
Quang BinhLRTotal Soc TrangHau Giang
8%
10%
19%
31%
40%
64%
11%
9%
20%
24%
49%
64%
10%
17%
23%
27%
33%
85%
19%
13%
33%
33%
63%
88%
1%
6%
43%
83%
19%
97%
4%
8%
42%
85%
27%
98%
22%
36%
39%
16%
2%
9%
40%
31%
4%
19%
46%
31%
13%
73%
13%
15%
15%
21%
63%
65%
9%
9%
24%
5%
63%
66%
23%
21%
6%
6%
52%
44%
13%
14%
5%
6%
41%
52%
Chicken farm Duck farm
AT5. What is the most credible source of HPAI information? (MA)
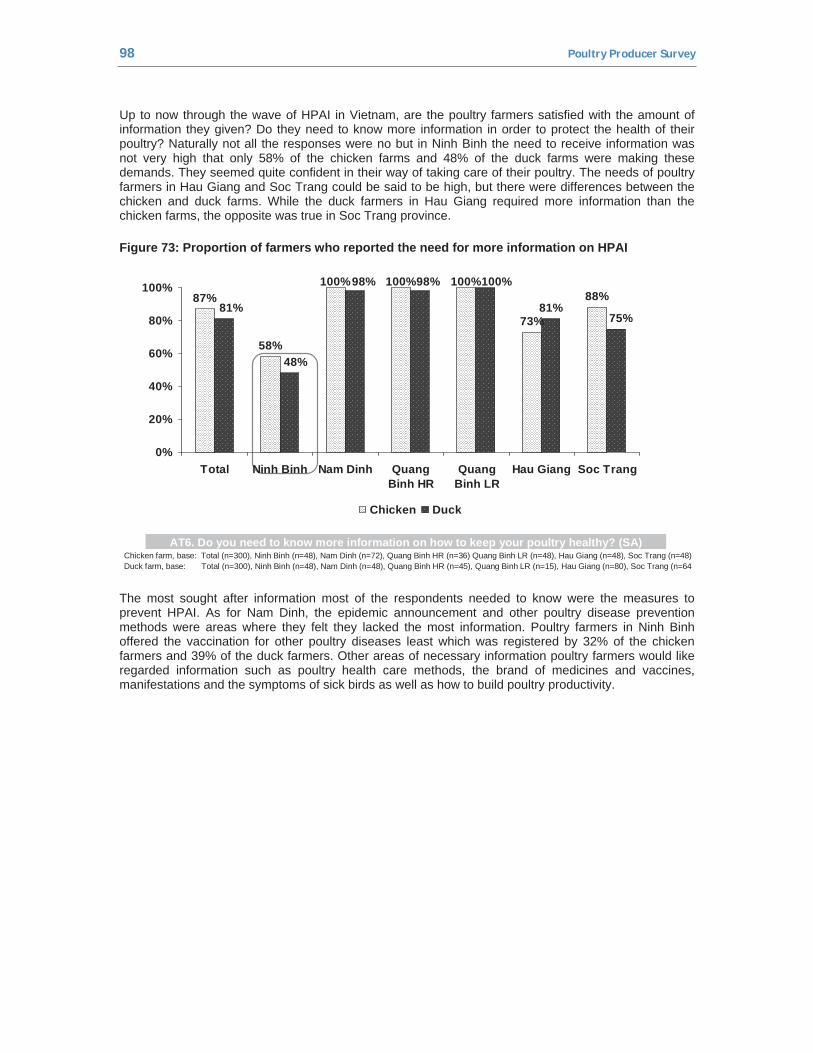
98 Poultry Producer Survey
Up to now through the wave of HPAI in Vietnam, are the poultry farmers satisfied with the amount of information they given? Do they need to know more information in order to protect the health of their poultry? Naturally not all the responses were no but in Ninh Binh the need to receive information was not very high that only 58% of the chicken farms and 48% of the duck farms were making these demands. They seemed quite confident in their way of taking care of their poultry. The needs of poultry farmers in Hau Giang and Soc Trang could be said to be high, but there were differences between the chicken and duck farms. While the duck farmers in Hau Giang required more information than the chicken farms, the opposite was true in Soc Trang province.
Figure 73: Proportion of farmers who reported the need for more information on HPAI
AT6. Do you need to know more information on how to keep your poultry healthy? (SA)Chicken farm, base: Total (n=300), Ninh Binh (n=48), Nam Dinh (n=72), Quang Binh HR (n=36) Quang Binh LR (n=48), Hau Giang (n=48), Soc Trang (n=48) Duck farm, base: Total (n=300), Ninh Binh (n=48), Nam Dinh (n=48), Quang Binh HR (n=45), Quang Binh LR (n=15), Hau Giang (n=80), Soc Trang (n=64
87%
58%
100% 100% 100%
73%
88%81%
75%
100%98%98%
48%
81%
0%
20%
40%
60%
80%
100%
Total Ninh Binh Nam Dinh QuangBinh HR
QuangBinh LR
Hau Giang Soc Trang
Chicken Duck
The most sought after information most of the respondents needed to know were the measures to prevent HPAI. As for Nam Dinh, the epidemic announcement and other poultry disease prevention methods were areas where they felt they lacked the most information. Poultry farmers in Ninh Binh offered the vaccination for other poultry diseases least which was registered by 32% of the chicken farmers and 39% of the duck farmers. Other areas of necessary information poultry farmers would like regarded information such as poultry health care methods, the brand of medicines and vaccines, manifestations and the symptoms of sick birds as well as how to build poultry productivity.
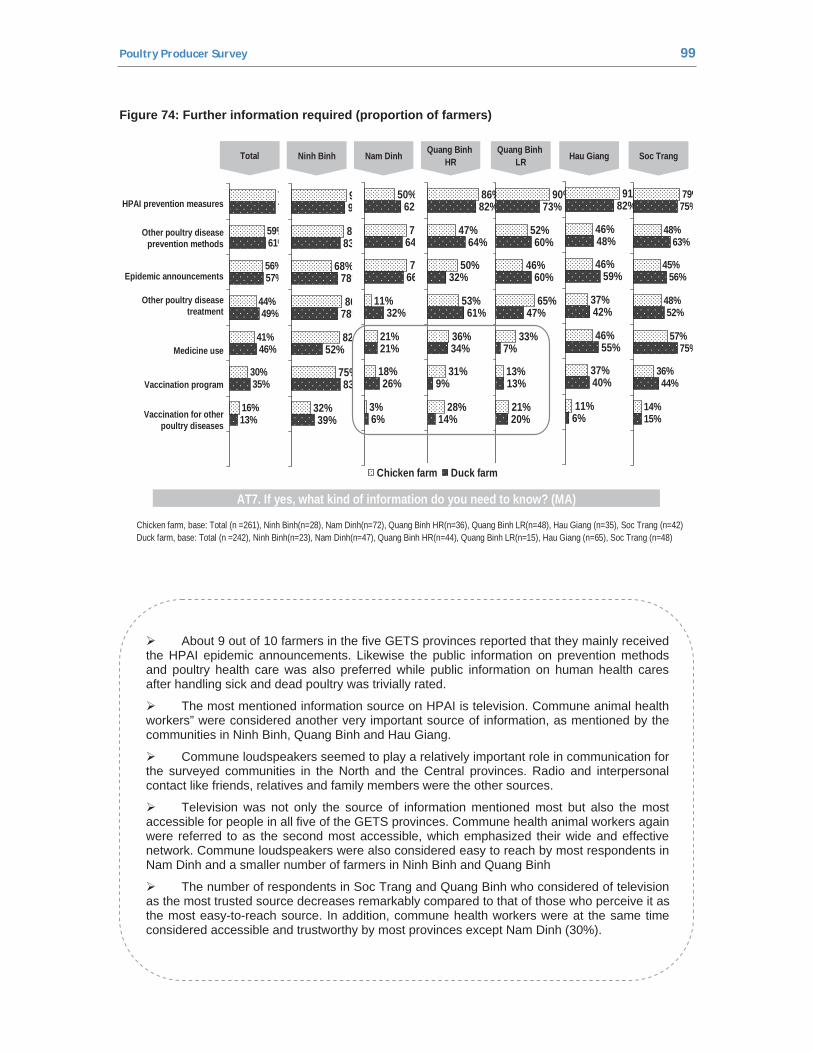
Poultry Producer Survey 99
Figure 74: Further information required (proportion of farmers)
Chicken farm, base: Total (n =261), Ninh Binh(n=28), Nam Dinh(n=72), Quang Binh HR(n=36), Quang Binh LR(n=48), Hau Giang (n=35), Soc Trang (n=42) Duck farm, base: Total (n =242), Ninh Binh(n=23), Nam Dinh(n=47), Quang Binh HR(n=44), Quang Binh LR(n=15), Hau Giang (n=65), Soc Trang (n=48)
HPAI prevention measures
Other poultry disease prevention methods
Epidemic announcements
Other poultry disease treatment
Medicine use
Vaccination program
Vaccination for other poultry diseases
Ninh Binh Nam Dinh Quang BinhHR
Quang BinhLRTotal Soc TrangHau Giang
16%
30%
41%
44%
56%
59%
77%
13%
35%
46%
49%
57%
61%
77%
32%
75%
82%
86%
68%
89%
93%
39%
83%
52%
78%
78%
83%
91%
3%
18%
21%
11%
72%
7%
50%
26%
21%
32%
66%
64%
62%
6%28%
31%
36%
53%
50%
47%
86%
14%
9%
34%
61%
32%
64%
82%
21%
13%
33%
65%
46%
52%
90%
20%
13%
7%
47%
60%
60%
73%
11%
37%
46%
37%
46%
46%
91%
6%
40%
55%
42%
59%
48%
82%
14%
36%
57%
48%
45%
48%
79%
15%
44%
75%
52%
56%
63%
75%
Chicken farm Duck farm
AT7. If yes, what kind of information do you need to know? (MA)
About 9 out of 10 farmers in the five GETS provinces reported that they mainly received the HPAI epidemic announcements. Likewise the public information on prevention methods and poultry health care was also preferred while public information on human health cares after handling sick and dead poultry was trivially rated.
The most mentioned information source on HPAI is television. Commune animal health workers” were considered another very important source of information, as mentioned by the communities in Ninh Binh, Quang Binh and Hau Giang.
Commune loudspeakers seemed to play a relatively important role in communication for the surveyed communities in the North and the Central provinces. Radio and interpersonal contact like friends, relatives and family members were the other sources.
Television was not only the source of information mentioned most but also the most accessible for people in all five of the GETS provinces. Commune health animal workers again were referred to as the second most accessible, which emphasized their wide and effective network. Commune loudspeakers were also considered easy to reach by most respondents in Nam Dinh and a smaller number of farmers in Ninh Binh and Quang Binh
The number of respondents in Soc Trang and Quang Binh who considered of television as the most trusted source decreases remarkably compared to that of those who perceive it as the most easy-to-reach source. In addition, commune health workers were at the same time considered accessible and trustworthy by most provinces except Nam Dinh (30%).
100 Poultry Producer Survey
Poultry farmers seemed to be quite confident in their way of taking care of their poultry due to the fact that their need to receive information was not very high. In Ninh Binh, only 58% of the chicken farms and 48% of the duck farms had information requirement.
Most of the respondents needed to know were the measures to prevent HPAI. As for Nam Dinh, the epidemic announcement and other poultry disease prevention methods were areas where they felt they lacked the most information.
Other areas of necessary information poultry farmers would like regarded information such as poultry health care methods, the brand of medicines and vaccines, manifestations and the symptoms of sick birds as well as how to build poultry productivity.
Poultry Producer Survey 101
3. CONCLUSION
Out of 600 poultry farms, 238 farms raised only chickens, 152 farms raised only ducks and 210 mixed farms which raised both chickens and ducks. The number of mixed farms was made up by 60 farms raising more chickens than ducks and 150 farms with a majority of ducks. Meat and laying chickens were the two most common species in five GETS provinces reported by 64.2 % and 48% of the farms respectively. Meanwhile, the number of farms raising meat or laying ducks accounted for half of those had meat or layer chickens. Farms which had less than 20% income from the poultry farming accounted for the highest number( 41.7%) followed by farms who got 20%-50% income gathered from poultry farming( 36.7% of the farms).
The three most important constraints to the poultry business as reported by farmers in the five GETS provinces were: “poultry disease”, “the cost of feed” and “the quality of” birds. Especially, poultry disease was considered as the most serious problem. In the small chicken farms, the farmers considered the most important constraint to be the quality of birds (95%), followed by poultry diseases. While in duck farms, the second most important constraint was the cost of feed (19%). Another constraint as reported by respondents from large duck farms was access to credit/capital. Meanwhile another constraint for the chicken farmers was access to land.
Farmers in the five GETS provinces had the highest awareness of the HPAI (97.2%), followed by the Newcastle disease in the chicken farms, as well as the Duck plague in the duck farms. Poultry farms in the southern provinces seemed to have less awareness of poultry diseases than in the other provinces. Additionally, both the large chicken farms and duck farms had a better awareness of the poultry diseases than the small and medium farms.
Vaccination programs for the HPAI were used most in the five GETS provinces. However, only one-third of the poultry farms in Soc Trang had the vaccination program for HPAI which was the lowest compared to other provinces Ninh Binh was the province where farmers applied more poultry disease vaccination programs compared to the other provinces. Meanwhile Nam Dinh held the biggest number of duck farms applying the Duck Plague vaccination program (96%).
Six out of 10 poultry farmers regarded DVC or SDAH as the primary source of AI vaccines and Duck Plague and Fowl Pox for further. Besides that’s, they also used the vaccines from the private animal drug shops.43.3% of the farmers in the five GETS provinces reported that they themselves had their own way to take care of their poultry. Additionally, the animal health workers, veterinarians and the technicians employed by the farms were also common poultry health suppliers Apart from the technical services from the feed companies, a considerable proportion of farmers used the poultry health services from the other suppliers only when they needed.
Farmers also reported that they used the services from the animal health worker and the veterinarian or the technician employed by the farm every quarter or every six months, while the technical services from the feed companies and drug stores were called for at least quarterly or at even monthly by a small number of poultry farms. The farmers applied their own services for the farm more frequently, possibly every week.
Three most important factors to keeping poultry healthy and productive included: good starting stock, vaccinations and good feed for the birds. Among the chicken farms, another important factor was cleaning and disinfection.
Farmers in the five GETS provinces seemed to brush and wash the feeders and water bowls more often than the floor, animal pens and the vehicles. About 40% of the farms reported that they brushed the feeder and water bowl every other day or more frequently. The animal pen was often brushed and washed once or twice a week in the chicken farms. In both the chicken and duck farms, more than half of the respondents never brushed or washed their vehicles. About 8 of 10 farmer reported spraying their vehicles with disinfectant, while 5 of 10 never even brushed or washed. One-third of the respondents
102 Poultry Producer Survey
reported the existence of footbaths at the entrance to the poultry housing area. Two southern provinces comprised the smallest proportion of over 10% of the farms had footbaths. Higher proportion of larger farms had footbaths at the entrance to the poultry housing area than the small and medium farms. Larger numbers of farms with more than 50% income coming from poultry farming had the footbaths than other ones.
Burying was the most popular disposal method among the poultry farms in the five GETS provinces. However, higher proportions of the chicken farms buried their dead birds in comparison to the duck farms. Burning was the second most common method of disposal in Nam Dinh and Quang Binh. Farmers often burned the dead birds off the farm rather than on the farm.Few of the farmers composted the dead birds and used it for fertilizer on the farm or they put the dead birds into a rubbish pile or threw them into a river off the farm.
More than 7 of 10 farmers reported that they did not report to anyone when found farmers found dead birds in their flock or outside their farm. If farmers were wanting to report, one third of the chicken farms in Nam Dinh seemed to prefer reporting to the head of the village. Additionally, one third of the duck farms in Nam Dinh preferred to report the loss of birds to the AHW, while in Ninh Binh the duck farms preferred reporting the CAHW. Meanwhile, mixed farms with a majority of ducks accounted for the highest number of farms reporting to the commune chief animal health workers with 17.3%, while farms with chickens only were the largest of those who reported to the head of village or the village animal health worker (13.4% and 14.3% of the respondents respectively).
Half of the respondents reported that if a bird was brought to market or elsewhere and it became sick or could not be sold, it would not be returned to the farm. Larger numbers of the farms with chickens only allowed the birds to be returned and kept separately than the other farms. Mixed farm with a majority of ducks made up the highest proportion of those who reported the birds would be returned with 16.5% of the respondents. Larger numbers of the farms in the two Northern provinces reported that AI outbreaks happened in their commune than in the other provinces. It accounted for 82% of the chicken farms and 58% of the duck farms in Nam Dinh, and 44% of the chicken farms and 71% of duck farms in Ninh Binh.
The number of farms which had AI outbreaks within the commune had decreased since October 2009. The data of farmers who reported the outbreaks before October 2009 was approximately three times higher than after October 2009, which accounted for 67 people. Larger numbers of chicken farms (32%) admitted having experience with Al in their own flocks than the ducks farms (21%). In Quang Binh and Soc Trang, the AI outbreak occurred only in the chicken farms while in Hau Giang it took place among the duck farms.
The first main reason reported explains why the poultry farmers preferred using the provided vaccination program was because of the vaccination program’s free cost. Secondly, that was due to its effectiveness above the force from the authorities and the last reason went to the credibility of the vaccination program. Other causes also mentioned but not significant were: the farmers loved to be discounted or they had a high perception of the HPAI risk, they wanted to keep their poultry safe, avoiding and controlling the spread of HPAI.
The main reason why farmers did not use the present HPAI vaccination program provided by the AHW was vaccination program is not compulsory and the farmers decided themselves whether to apply it or not. In addition, a small number of all respondents were confused about the effectiveness of the HPAI vaccination program which the AHW provided. Other reasons were proposed contain: the number of poultry was too small to be applied; the poultry were not ill so it was not necessary; the vaccination program was not free and for some farmers it was quite expensive etc…
All the farmers in the five provinces determined that they knew the right way to protect their poultry from HPAI. However, poultry farmers in Quang Binh (about 50%) received trainings most while the province where the farmers were given trainings on HPAI most while that in SocTrang was register least with only 2% of the farms Despite the fact that vaccination is the most effective way to control the AI virus, the proportion of the respondents in Soc Trang reported having their poultry vaccinated frequently accounted for little more than 10% around October 2009. In the same way, since October 2009 farmers in Ninh Binh have tended to reduce the frequency of vaccination.
Poultry Producer Survey 103
Preventing other people like strangers, dealers, traders etc., from handling the poultry have not been formed in farmers’ habits, substantially in Ninh Binh and Soc Trang with the highest agreement of merely 8% of the respondents. Farmers seemed to have a better awareness of washing their hands with soap and washed hands with soap more often after the HPAI spread. Even though most respondents in the five GETS provinces voluntarily sought for treatment immediately when they felt sick with a fever after handling sick or dead poultry, 9 of 10 farmers from the duck farms in Nam Dinh decided to have treatment only when they were really sick.
The most mentioned information source on HPAI is television. Commune animal health workers” were considered another very important source of information, as mentioned by the communities in Ninh Binh, Quang Binh and Hau Giang. Commune loudspeakers seemed to play a relatively important role in communication for the surveyed communities in the North and the Central provinces. Radio and interpersonal contact like friends, relatives and family members were the other sources.


![In the United States, the proportion ofhntmmttn.vn/Upload/File/NMP 13PM/[LS3.60] Eng.pdf · Selection criteria-Patients with clinical symptoms and ABI ≤0,9 agree to participate](https://img.pdfslide.net/doc/110x75/5fd12b52f60e881c5769d2cd/in-the-united-states-the-proportion-13pmls360-engpdf-selection-criteria-patients.jpg)