Embed Size (px)
Citation preview
Private Bag 0024, Gaborone.Tel: 3671300 Fax: 3952201 Toll Free: 0800 600 200 E-mail: [email protected]: http://www.statsbots.org.bw
BOTSWANA MULTI-TOPIC HOUSEHOLD SURVEY
POVERTY STATS BRIEF
2 Botswana Multi-Topic Household Survey 2015/16-JAN 2018 STATISTICS BOTSWANAPOVERTY STATS BRIEF
Preface This Stats brief presents preliminary poverty results from the 2015/16 Botswana Multi Topic Household Survey. The survey had a total of sixteen modules covering a range of topics including labour and poverty. Due to the extensive data that was collected and the need for detailed analysis, Statistics Botswana adopted a modular approach for the release of the survey results.
This brief presents Poverty indicators. The final product will be a comprehensive survey report.
The survey shows that poverty levels over the past five years (2009/10 to 2015/16) have declined. The proportion of people living below the poverty datum line has dropped by three percentage points from 19.3 to 16.3 percent during the period. The proportion of those living in extreme poverty (below $1.90 a Day) has also reduced from 6.4 to 5.8 percent.
At district/sub-district level, Ngamiland West had the highest poverty incidence in 2009/10 while Kweneng West was the most affected in 2015/16.
The Gini Coefficient has increased from 0.495 to 0.522, at national level. At stratum level, the rural areas and urban areas recorded increases from 0.438 to 0.474, and 0.510 to 0.518, respectively.
The data show that more female headed households (55%) are affected by poverty compared to those headed by males, at 45 percent.
The largest share of consumption expenditure was allocated to transport (23.9%), followed by housing costs (17.8%) and then food (12.8%).
We hope the stakeholders find these results useful in informing policy formulation, review, monitoring and evaluation, planning and decision making.
I wish to thank the World Bank for providing technical support during the different phases of the survey, respondents who provided this invaluable information for the survey, survey personnel, partners and stakeholders who contributed to the success of the survey.
___________________Anna N. MajelantleStatistician GeneralJanuary 2018

Botswana Multi-Topic Household Survey 2015/16-JAN 2018 STATISTICS BOTSWANAPOVERTY STATS BRIEF
3
1.0 INTRODUCTION In 2015/16 Statistics Botswana (SB) conducted the Botswana Multi Topic Household Survey (BMTHS), which combined labour and poverty modules. The BMTHS was preceded by the 2009/10 Botswana Core Welfare Indicators Survey (BCWIS) which was commonly known as the Poverty Survey, and the 2002/03 Household Income and Expenditure Survey (HIES).
The multi-modular/multi-topic surveys in their nature are designed to produce multidimensional welfare indicators at household level; which allows for enriched analysis and in-depth profiling of the households through the different modules administered on the same households.
The purpose of the 2015/16 BMTHS was to provide a comprehensive set of household level indicators for poverty and the labour market such as the Poverty incidence, employment and unemployment levels.
Information on the characteristics of the unemployed and poor would facilitate targeting of programmes, policy formulation, programming for National Development Plans and National Vision 2036. The survey results will further provide baseline indicators for the Sustainable Development Goals (SDGs) and Africa 2063 Agenda.
The survey was also designed to determine household consumption and expenditure patterns in order to revise the weights and basket for the Consumer Price Index (CPI). The survey will provide the basis for subsequent Continuous Multi-Topic Household Surveys (CMTHS) which will avail more frequent Labour and Poverty indicators and address emerging needs of stakeholders.
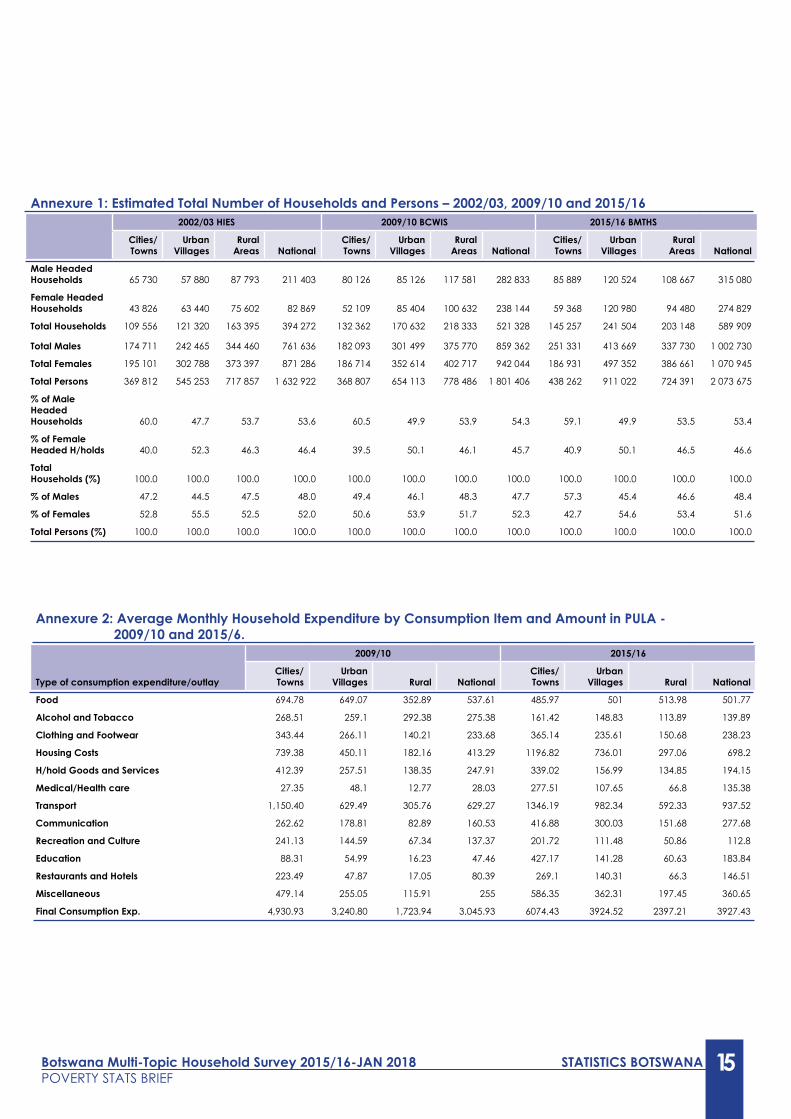
The survey only targeted households in all districts and sub-districts. It did not cover institutions such as Prisons, Army Barracks, Hospitals and other institutions because the survey was meant to investigate poverty and employment levels at households and individual level . From the sampled households, the estimated population was 2, 073, 675, from an estimated total of 589, 909 households, of which 53.4 percent were male headed and 46.6 percent female headed (Annexure 1).
4 Botswana Multi-Topic Household Survey 2015/16-JAN 2018 STATISTICS BOTSWANAPOVERTY STATS BRIEF
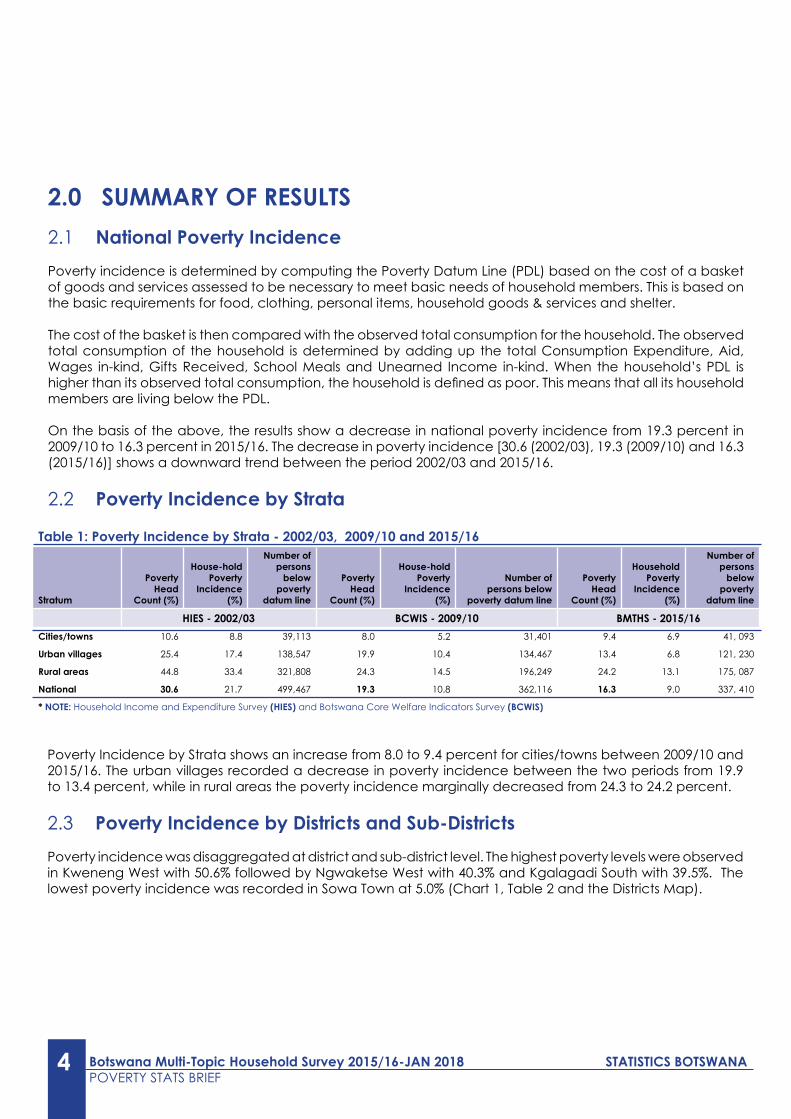
2.0 SUMMARY OF RESULTS2.1 National Poverty IncidencePoverty incidence is determined by computing the Poverty Datum Line (PDL) based on the cost of a basket of goods and services assessed to be necessary to meet basic needs of household members. This is based on the basic requirements for food, clothing, personal items, household goods & services and shelter.
The cost of the basket is then compared with the observed total consumption for the household. The observed total consumption of the household is determined by adding up the total Consumption Expenditure, Aid, Wages in-kind, Gifts Received, School Meals and Unearned Income in-kind. When the household’s PDL is higher than its observed total consumption, the household is defined as poor. This means that all its household members are living below the PDL.
On the basis of the above, the results show a decrease in national poverty incidence from 19.3 percent in 2009/10 to 16.3 percent in 2015/16. The decrease in poverty incidence [30.6 (2002/03), 19.3 (2009/10) and 16.3 (2015/16)] shows a downward trend between the period 2002/03 and 2015/16.
2.2 Poverty Incidence by Strata
Table 1: Poverty Incidence by Strata - 2002/03, 2009/10 and 2015/16
Stratum
Poverty Head
Count (%)
House-hold Poverty
Incidence (%)
Number of persons
below poverty
datum line
Poverty Head
Count (%)
House-hold Poverty
Incidence (%)
Number of persons below
poverty datum line
Poverty Head
Count (%)
Household Poverty
Incidence (%)
Number of persons
below poverty
datum line
HIES - 2002/03 BCWIS - 2009/10 BMTHS - 2015/16Cities/towns 10.6 8.8 39,113 8.0 5.2 31,401 9.4 6.9 41, 093
Urban villages 25.4 17.4 138,547 19.9 10.4 134,467 13.4 6.8 121, 230
Rural areas 44.8 33.4 321,808 24.3 14.5 196,249 24.2 13.1 175, 087
National 30.6 21.7 499,467 19.3 10.8 362,116 16.3 9.0 337, 410
* NOTE: Household Income and Expenditure Survey (HIES) and Botswana Core Welfare Indicators Survey (BCWIS)
Poverty Incidence by Strata shows an increase from 8.0 to 9.4 percent for cities/towns between 2009/10 and 2015/16. The urban villages recorded a decrease in poverty incidence between the two periods from 19.9 to 13.4 percent, while in rural areas the poverty incidence marginally decreased from 24.3 to 24.2 percent.
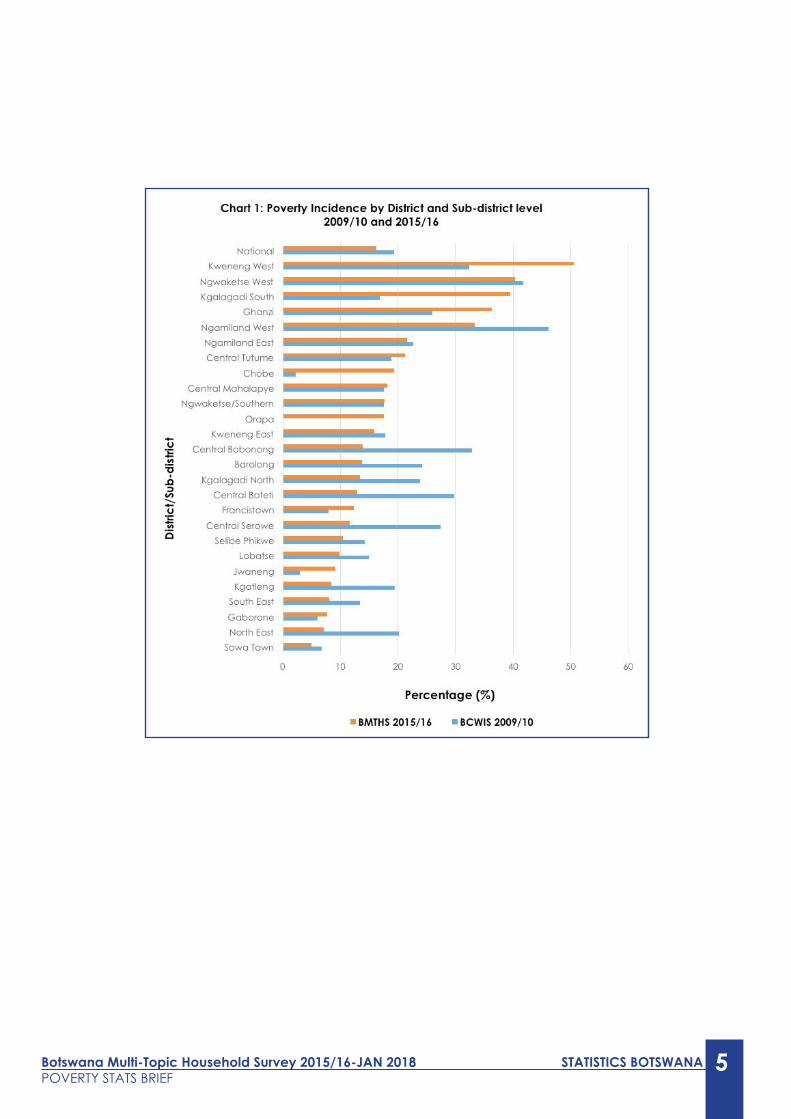
2.3 Poverty Incidence by Districts and Sub-Districts Poverty incidence was disaggregated at district and sub-district level. The highest poverty levels were observed in Kweneng West with 50.6% followed by Ngwaketse West with 40.3% and Kgalagadi South with 39.5%. The lowest poverty incidence was recorded in Sowa Town at 5.0% (Chart 1, Table 2 and the Districts Map).
Botswana Multi-Topic Household Survey 2015/16-JAN 2018 STATISTICS BOTSWANAPOVERTY STATS BRIEF
5
6 Botswana Multi-Topic Household Survey 2015/16-JAN 2018 STATISTICS BOTSWANAPOVERTY STATS BRIEF
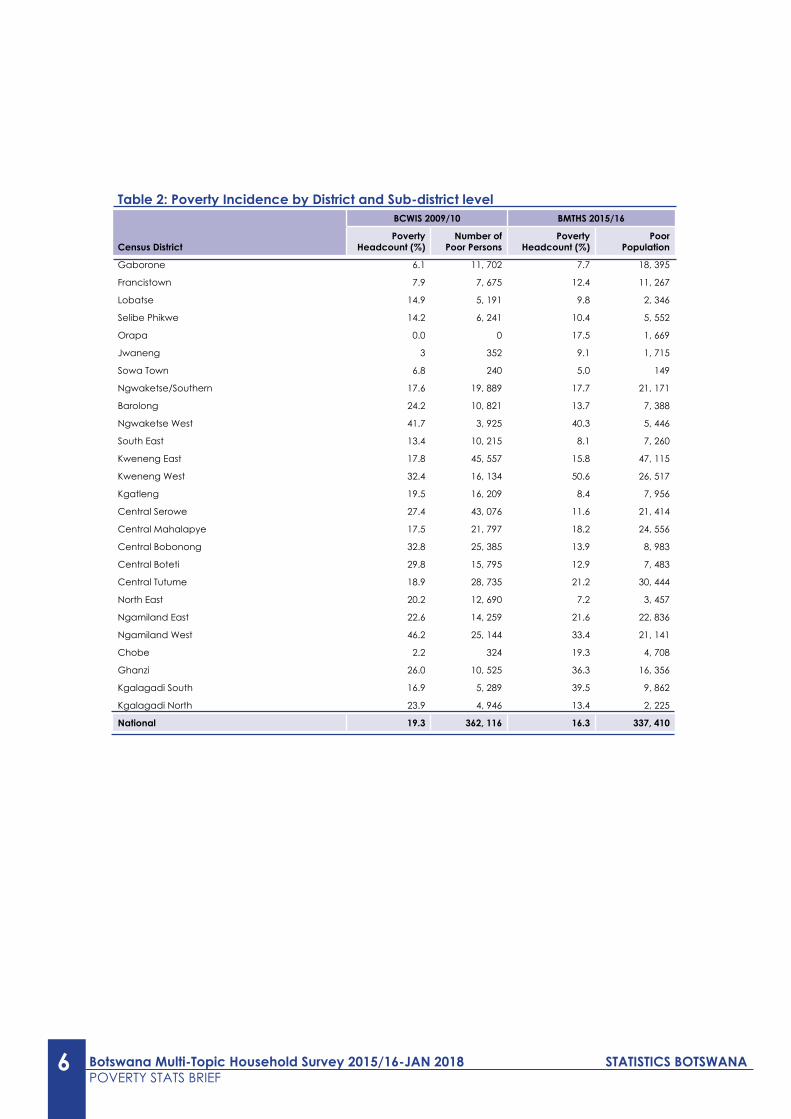
Table 2: Poverty Incidence by District and Sub-district level
Census District
BCWIS 2009/10 BMTHS 2015/16
Poverty Headcount (%)
Number of Poor Persons
Poverty Headcount (%)
Poor Population
Gaborone 6.1 11, 702 7.7 18, 395
Francistown 7.9 7, 675 12.4 11, 267
Lobatse 14.9 5, 191 9.8 2, 346
Selibe Phikwe 14.2 6, 241 10.4 5, 552
Orapa 0.0 0 17.5 1, 669
Jwaneng 3 352 9.1 1, 715
Sowa Town 6.8 240 5.0 149
Ngwaketse/Southern 17.6 19, 889 17.7 21, 171
Barolong 24.2 10, 821 13.7 7, 388
Ngwaketse West 41.7 3, 925 40.3 5, 446
South East 13.4 10, 215 8.1 7, 260
Kweneng East 17.8 45, 557 15.8 47, 115
Kweneng West 32.4 16, 134 50.6 26, 517
Kgatleng 19.5 16, 209 8.4 7, 956
Central Serowe 27.4 43, 076 11.6 21, 414
Central Mahalapye 17.5 21, 797 18.2 24, 556
Central Bobonong 32.8 25, 385 13.9 8, 983
Central Boteti 29.8 15, 795 12.9 7, 483
Central Tutume 18.9 28, 735 21.2 30, 444
North East 20.2 12, 690 7.2 3, 457
Ngamiland East 22.6 14, 259 21.6 22, 836
Ngamiland West 46.2 25, 144 33.4 21, 141
Chobe 2.2 324 19.3 4, 708
Ghanzi 26.0 10, 525 36.3 16, 356
Kgalagadi South 16.9 5, 289 39.5 9, 862
Kgalagadi North 23.9 4, 946 13.4 2, 225
National 19.3 362, 116 16.3 337, 410

Botswana Multi-Topic Household Survey 2015/16-JAN 2018 STATISTICS BOTSWANAPOVERTY STATS BRIEF
7
Table 2: Poverty Incidence by District and Sub-district level
Census District
BCWIS 2009/10 BMTHS 2015/16
Poverty Headcount (%)
Number of Poor Persons
Poverty Headcount (%)
Poor Population
Gaborone 6.1 11, 702 7.7 18, 395
Francistown 7.9 7, 675 12.4 11, 267
Lobatse 14.9 5, 191 9.8 2, 346
Selibe Phikwe 14.2 6, 241 10.4 5, 552
Orapa 0.0 0 17.5 1, 669
Jwaneng 3 352 9.1 1, 715
Sowa Town 6.8 240 5.0 149
Ngwaketse/Southern 17.6 19, 889 17.7 21, 171
Barolong 24.2 10, 821 13.7 7, 388
Ngwaketse West 41.7 3, 925 40.3 5, 446
South East 13.4 10, 215 8.1 7, 260
Kweneng East 17.8 45, 557 15.8 47, 115
Kweneng West 32.4 16, 134 50.6 26, 517
Kgatleng 19.5 16, 209 8.4 7, 956
Central Serowe 27.4 43, 076 11.6 21, 414
Central Mahalapye 17.5 21, 797 18.2 24, 556
Central Bobonong 32.8 25, 385 13.9 8, 983
Central Boteti 29.8 15, 795 12.9 7, 483
Central Tutume 18.9 28, 735 21.2 30, 444
North East 20.2 12, 690 7.2 3, 457
Ngamiland East 22.6 14, 259 21.6 22, 836
Ngamiland West 46.2 25, 144 33.4 21, 141
Chobe 2.2 324 19.3 4, 708
Ghanzi 26.0 10, 525 36.3 16, 356
Kgalagadi South 16.9 5, 289 39.5 9, 862
Kgalagadi North 23.9 4, 946 13.4 2, 225
National 19.3 362, 116 16.3 337, 410
8 Botswana Multi-Topic Household Survey 2015/16-JAN 2018 STATISTICS BOTSWANAPOVERTY STATS BRIEF
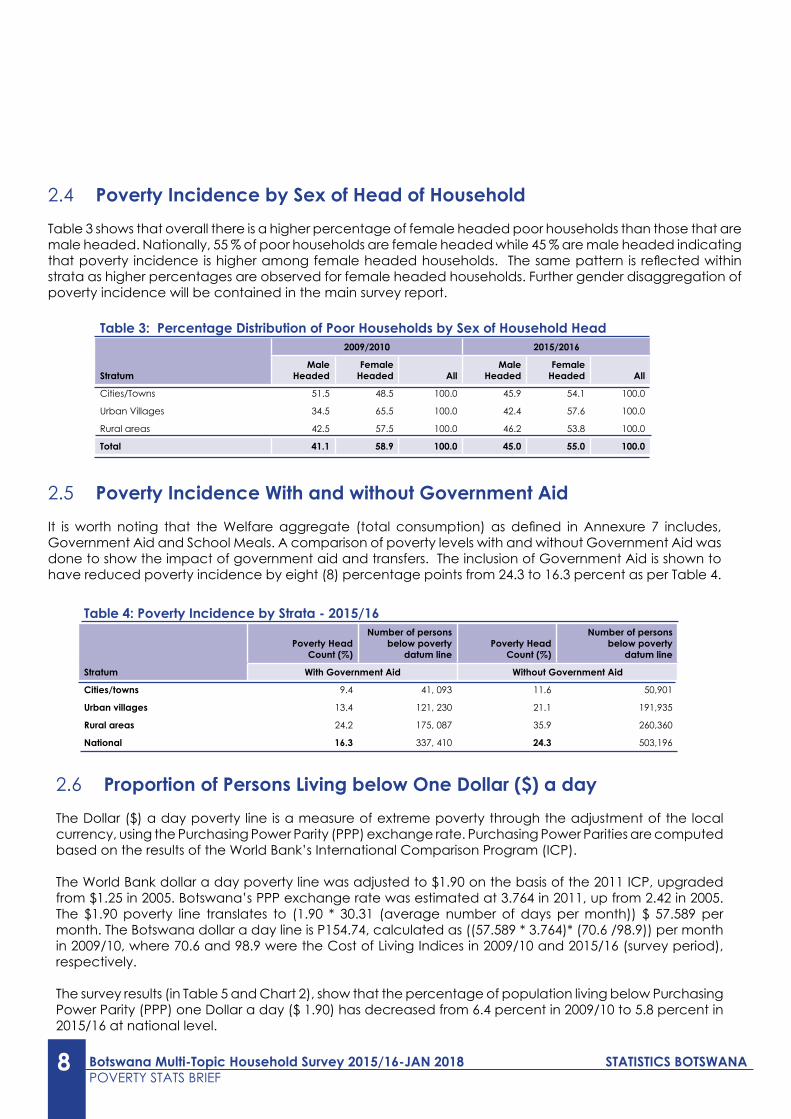
2.4 Poverty Incidence by Sex of Head of HouseholdTable 3 shows that overall there is a higher percentage of female headed poor households than those that are male headed. Nationally, 55 % of poor households are female headed while 45 % are male headed indicating that poverty incidence is higher among female headed households. The same pattern is reflected within strata as higher percentages are observed for female headed households. Further gender disaggregation of poverty incidence will be contained in the main survey report.
Table 3: Percentage Distribution of Poor Households by Sex of Household Head
Stratum
2009/2010 2015/2016
Male Headed
Female Headed All
Male Headed
Female Headed All
Cities/Towns 51.5 48.5 100.0 45.9 54.1 100.0
Urban Villages 34.5 65.5 100.0 42.4 57.6 100.0
Rural areas 42.5 57.5 100.0 46.2 53.8 100.0
Total 41.1 58.9 100.0 45.0 55.0 100.0
2.5 Poverty Incidence With and without Government AidIt is worth noting that the Welfare aggregate (total consumption) as defined in Annexure 7 includes, Government Aid and School Meals. A comparison of poverty levels with and without Government Aid was done to show the impact of government aid and transfers. The inclusion of Government Aid is shown to have reduced poverty incidence by eight (8) percentage points from 24.3 to 16.3 percent as per Table 4.
Table 4: Poverty Incidence by Strata - 2015/16
Stratum
Poverty Head Count (%)
Number of persons below poverty
datum linePoverty Head
Count (%)
Number of persons below poverty
datum line
With Government Aid Without Government Aid
Cities/towns 9.4 41, 093 11.6 50,901
Urban villages 13.4 121, 230 21.1 191,935
Rural areas 24.2 175, 087 35.9 260,360
National 16.3 337, 410 24.3 503,196
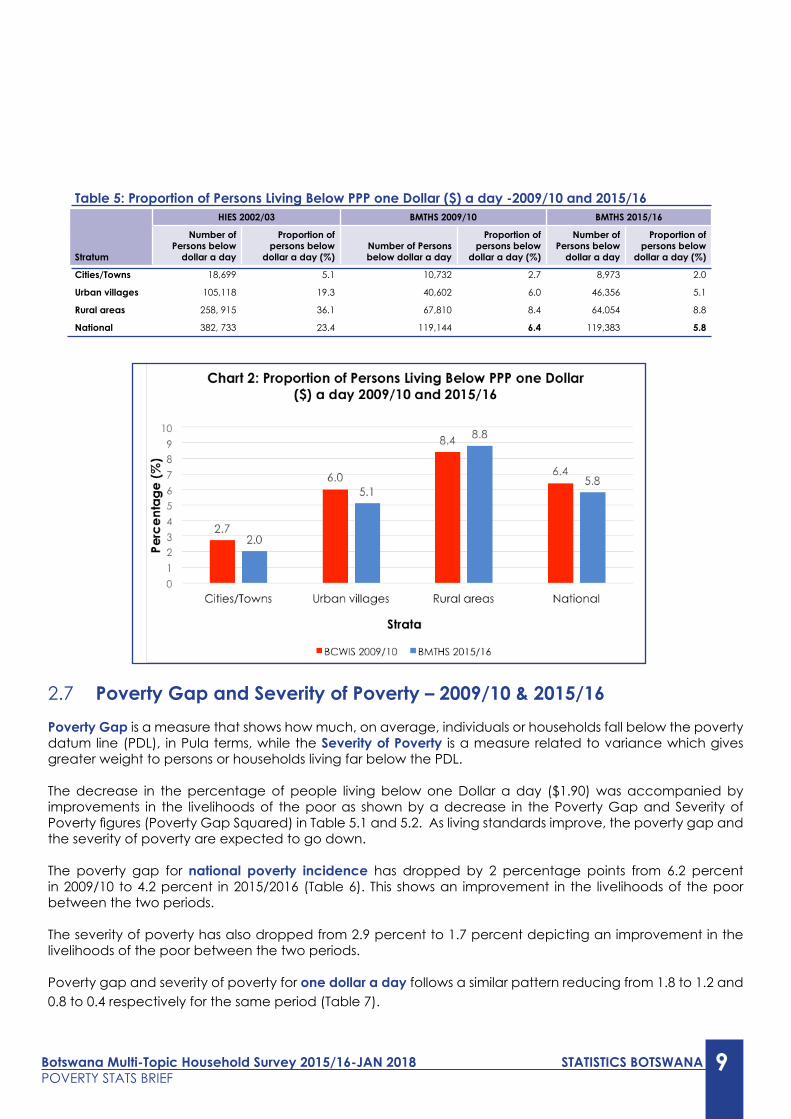
2.6 Proportion of Persons Living below One Dollar ($) a dayThe Dollar ($) a day poverty line is a measure of extreme poverty through the adjustment of the local currency, using the Purchasing Power Parity (PPP) exchange rate. Purchasing Power Parities are computed based on the results of the World Bank’s International Comparison Program (ICP).
The World Bank dollar a day poverty line was adjusted to $1.90 on the basis of the 2011 ICP, upgraded from $1.25 in 2005. Botswana’s PPP exchange rate was estimated at 3.764 in 2011, up from 2.42 in 2005. The $1.90 poverty line translates to (1.90 * 30.31 (average number of days per month)) $ 57.589 per month. The Botswana dollar a day line is P154.74, calculated as ((57.589 * 3.764)* (70.6 /98.9)) per month in 2009/10, where 70.6 and 98.9 were the Cost of Living Indices in 2009/10 and 2015/16 (survey period), respectively.
The survey results (in Table 5 and Chart 2), show that the percentage of population living below Purchasing Power Parity (PPP) one Dollar a day ($ 1.90) has decreased from 6.4 percent in 2009/10 to 5.8 percent in 2015/16 at national level.
Botswana Multi-Topic Household Survey 2015/16-JAN 2018 STATISTICS BOTSWANAPOVERTY STATS BRIEF
9
Table 5: Proportion of Persons Living Below PPP one Dollar ($) a day -2009/10 and 2015/16
Stratum
HIES 2002/03 BMTHS 2009/10 BMTHS 2015/16
Number of Persons below
dollar a day
Proportion of persons below
dollar a day (%)Number of Persons below dollar a day
Proportion of persons below
dollar a day (%)
Number of Persons below
dollar a day
Proportion of persons below
dollar a day (%)
Cities/Towns 18,699 5.1 10,732 2.7 8,973 2.0
Urban villages 105,118 19.3 40,602 6.0 46,356 5.1
Rural areas 258, 915 36.1 67,810 8.4 64,054 8.8
National 382, 733 23.4 119,144 6.4 119,383 5.8
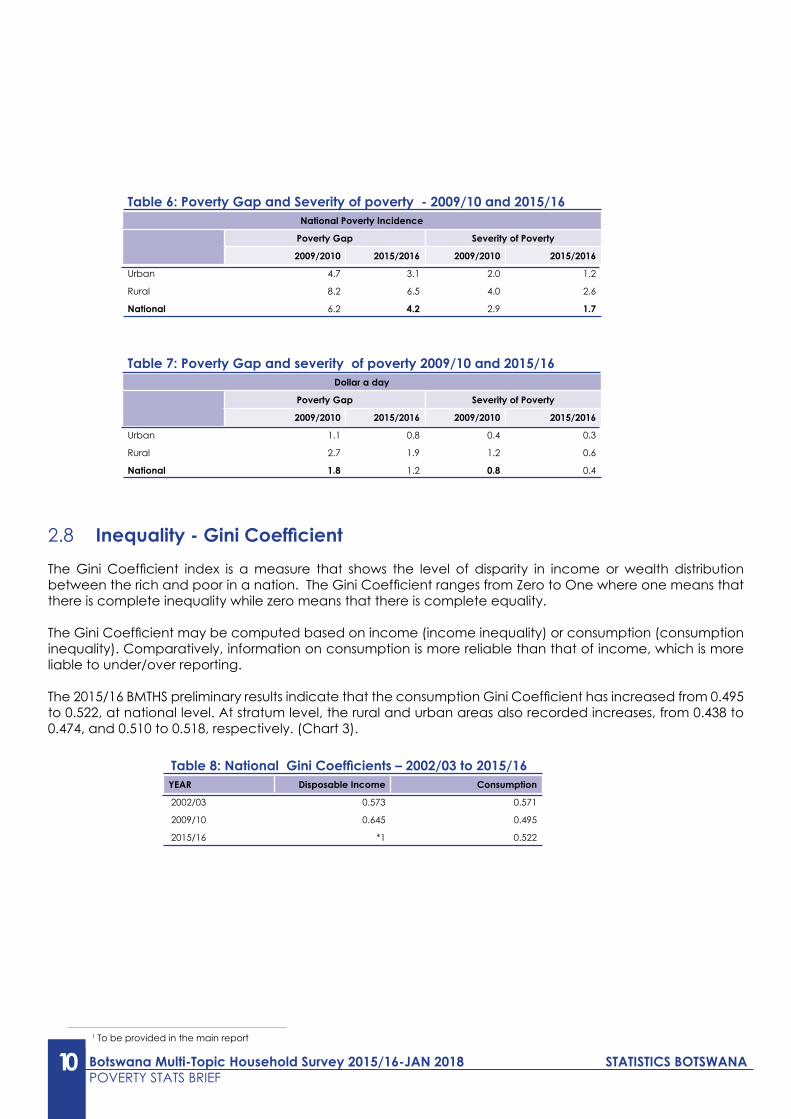
2.7 Poverty Gap and Severity of Poverty – 2009/10 & 2015/16 Poverty Gap is a measure that shows how much, on average, individuals or households fall below the poverty datum line (PDL), in Pula terms, while the Severity of Poverty is a measure related to variance which gives greater weight to persons or households living far below the PDL.
The decrease in the percentage of people living below one Dollar a day ($1.90) was accompanied by improvements in the livelihoods of the poor as shown by a decrease in the Poverty Gap and Severity of Poverty figures (Poverty Gap Squared) in Table 5.1 and 5.2. As living standards improve, the poverty gap and the severity of poverty are expected to go down.
The poverty gap for national poverty incidence has dropped by 2 percentage points from 6.2 percent in 2009/10 to 4.2 percent in 2015/2016 (Table 6). This shows an improvement in the livelihoods of the poor between the two periods.
The severity of poverty has also dropped from 2.9 percent to 1.7 percent depicting an improvement in the livelihoods of the poor between the two periods.
Poverty gap and severity of poverty for one dollar a day follows a similar pattern reducing from 1.8 to 1.2 and 0.8 to 0.4 respectively for the same period (Table 7).
10 Botswana Multi-Topic Household Survey 2015/16-JAN 2018 STATISTICS BOTSWANAPOVERTY STATS BRIEF
Table 6: Poverty Gap and Severity of poverty - 2009/10 and 2015/16National Poverty Incidence
Poverty Gap Severity of Poverty
2009/2010 2015/2016 2009/2010 2015/2016
Urban 4.7 3.1 2.0 1.2
Rural 8.2 6.5 4.0 2.6
National 6.2 4.2 2.9 1.7
Table 7: Poverty Gap and severity of poverty 2009/10 and 2015/16Dollar a day
Poverty Gap Severity of Poverty
2009/2010 2015/2016 2009/2010 2015/2016
Urban 1.1 0.8 0.4 0.3
Rural 2.7 1.9 1.2 0.6
National 1.8 1.2 0.8 0.4
2.8 Inequality-GiniCoefficientThe Gini Coefficient index is a measure that shows the level of disparity in income or wealth distribution between the rich and poor in a nation. The Gini Coefficient ranges from Zero to One where one means that there is complete inequality while zero means that there is complete equality.
The Gini Coefficient may be computed based on income (income inequality) or consumption (consumption inequality). Comparatively, information on consumption is more reliable than that of income, which is more liable to under/over reporting.
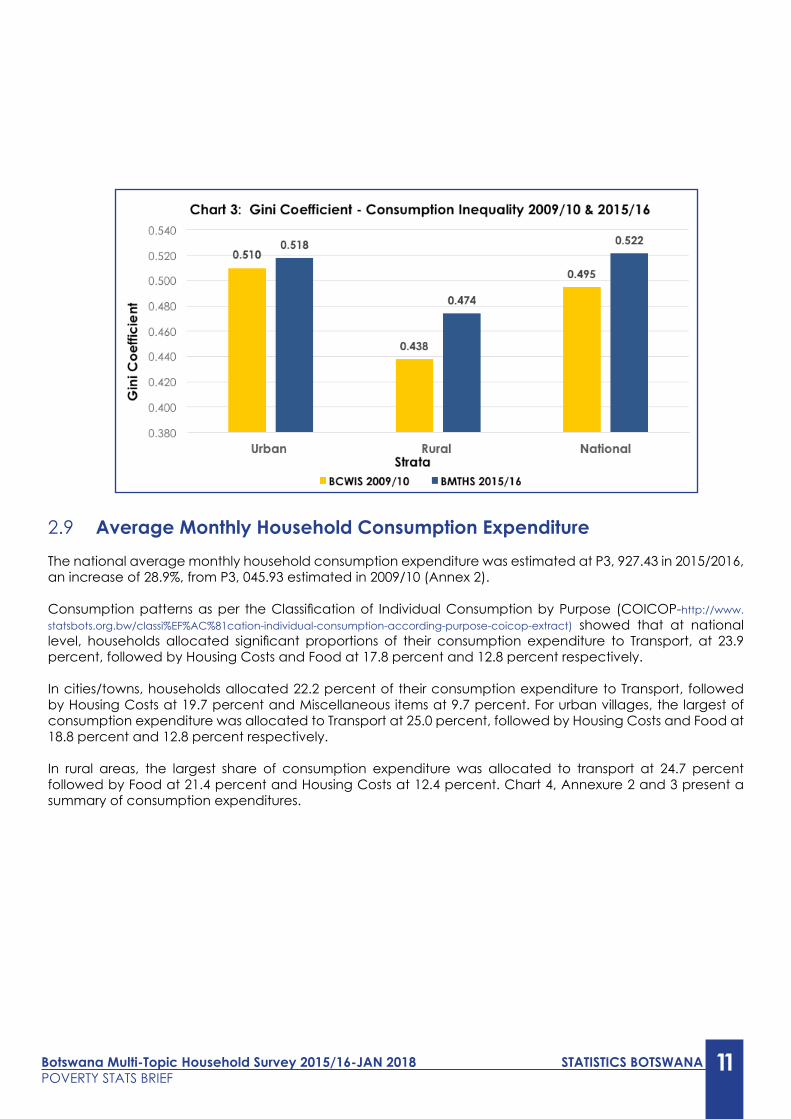
The 2015/16 BMTHS preliminary results indicate that the consumption Gini Coefficient has increased from 0.495 to 0.522, at national level. At stratum level, the rural and urban areas also recorded increases, from 0.438 to 0.474, and 0.510 to 0.518, respectively. (Chart 3).
Table8:NationalGiniCoefficients–2002/03to2015/16YEAR Disposable Income Consumption
2002/03 0.573 0.571
2009/10 0.645 0.495
2015/16 *1 0.522
1 To be provided in the main report
Botswana Multi-Topic Household Survey 2015/16-JAN 2018 STATISTICS BOTSWANAPOVERTY STATS BRIEF
11
2.9 Average Monthly Household Consumption Expenditure The national average monthly household consumption expenditure was estimated at P3, 927.43 in 2015/2016, an increase of 28.9%, from P3, 045.93 estimated in 2009/10 (Annex 2).
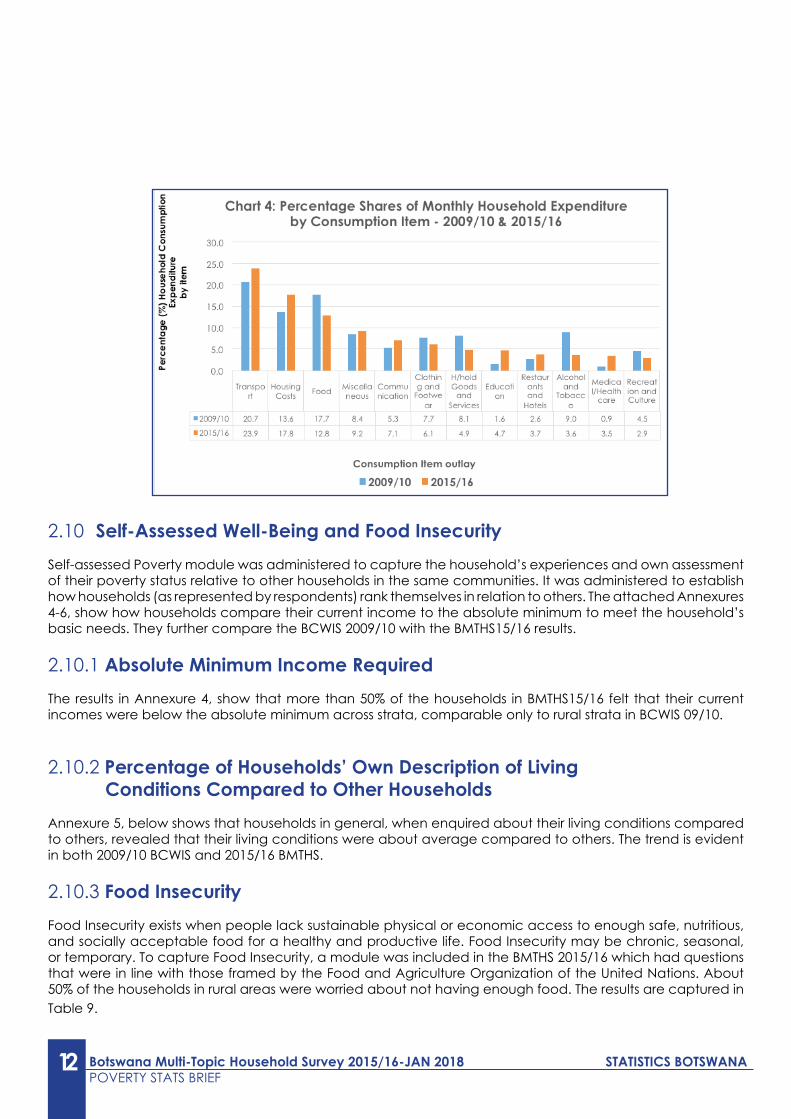
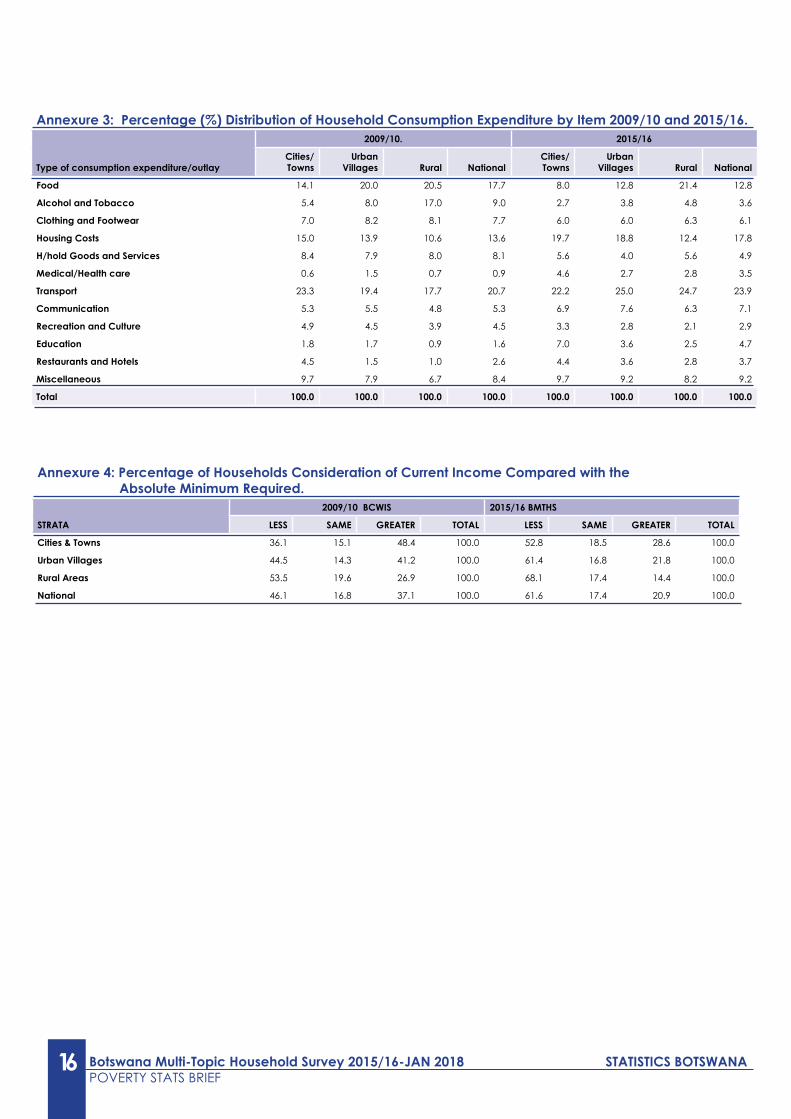
Consumption patterns as per the Classification of Individual Consumption by Purpose (COICOP-http://www.statsbots.org.bw/classi%EF%AC%81cation-individual-consumption-according-purpose-coicop-extract) showed that at national level, households allocated significant proportions of their consumption expenditure to Transport, at 23.9 percent, followed by Housing Costs and Food at 17.8 percent and 12.8 percent respectively.
In cities/towns, households allocated 22.2 percent of their consumption expenditure to Transport, followed by Housing Costs at 19.7 percent and Miscellaneous items at 9.7 percent. For urban villages, the largest of consumption expenditure was allocated to Transport at 25.0 percent, followed by Housing Costs and Food at 18.8 percent and 12.8 percent respectively.
In rural areas, the largest share of consumption expenditure was allocated to transport at 24.7 percent followed by Food at 21.4 percent and Housing Costs at 12.4 percent. Chart 4, Annexure 2 and 3 present a summary of consumption expenditures.
12 Botswana Multi-Topic Household Survey 2015/16-JAN 2018 STATISTICS BOTSWANAPOVERTY STATS BRIEF
2.10 Self-Assessed Well-Being and Food InsecuritySelf-assessed Poverty module was administered to capture the household’s experiences and own assessment of their poverty status relative to other households in the same communities. It was administered to establish how households (as represented by respondents) rank themselves in relation to others. The attached Annexures 4-6, show how households compare their current income to the absolute minimum to meet the household’s basic needs. They further compare the BCWIS 2009/10 with the BMTHS15/16 results.
2.10.1 Absolute Minimum Income Required The results in Annexure 4, show that more than 50% of the households in BMTHS15/16 felt that their current incomes were below the absolute minimum across strata, comparable only to rural strata in BCWIS 09/10.
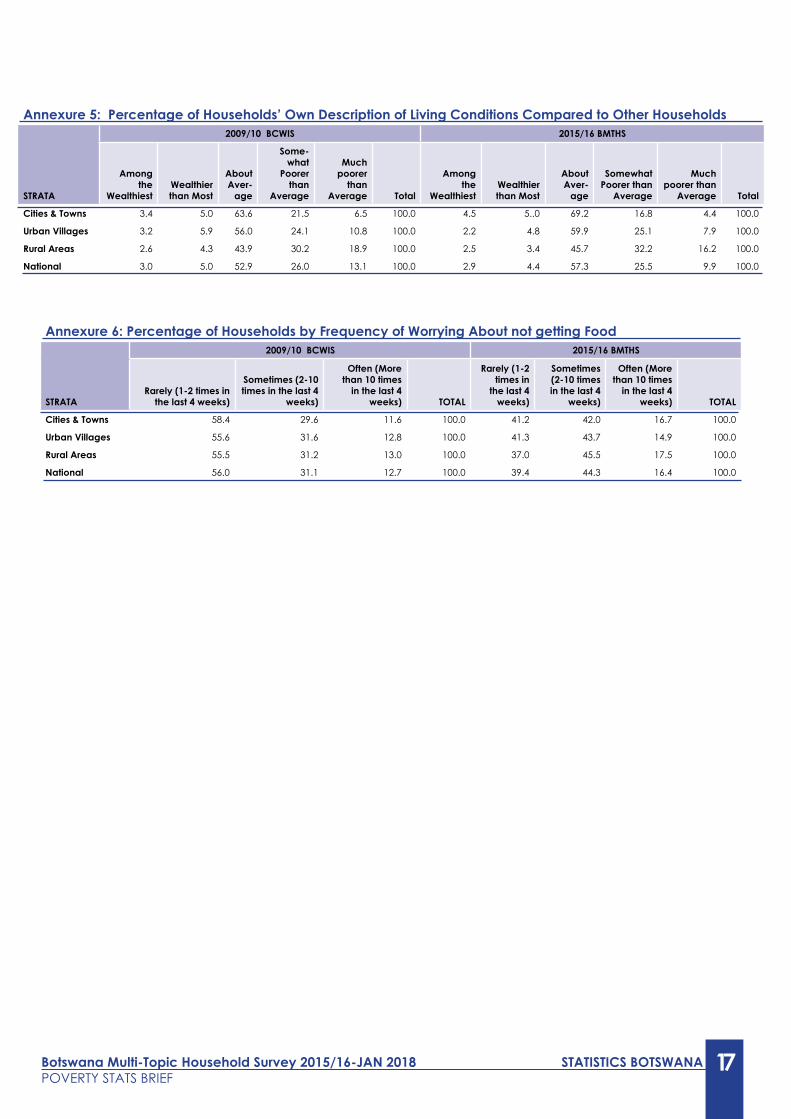
2.10.2 Percentage of Households’ Own Description of Living Conditions Compared to Other HouseholdsAnnexure 5, below shows that households in general, when enquired about their living conditions compared to others, revealed that their living conditions were about average compared to others. The trend is evident in both 2009/10 BCWIS and 2015/16 BMTHS. 2.10.3 Food InsecurityFood Insecurity exists when people lack sustainable physical or economic access to enough safe, nutritious, and socially acceptable food for a healthy and productive life. Food Insecurity may be chronic, seasonal, or temporary. To capture Food Insecurity, a module was included in the BMTHS 2015/16 which had questions that were in line with those framed by the Food and Agriculture Organization of the United Nations. About 50% of the households in rural areas were worried about not having enough food. The results are captured in Table 9.

Botswana Multi-Topic Household Survey 2015/16-JAN 2018 STATISTICS BOTSWANAPOVERTY STATS BRIEF
13
Table 9: Percentage of Households Who Worry About not Having Enough Food
STRATA
2009/10 BCWIS 2015/16 BMTHS
YES YES
Cities /Towns 28.8 25.5
Urban Villages 42.8 37.5
Rural Areas 50.6 50.2
National 42.5 38.9
2.10.4 Proportion that worry about not having food. The proportion of households that worried about not having enough food, that is, more than 10 times in the past four weeks, have shown an increase between 2009/10 and 2015/16, from 12.7 to 16.4 percent at national level. The increases were observed in all strata (Annexure 6).
3.0 TECHNICAL INFORMATION
3.1 SURVEY METHODOLOGY
3.1.1 Survey SamplingThe Botswana Multi-Topic Household Survey like most national surveys, employed a two stage stratified sampling design. The procedure was made plausible by the existing stratification of twenty-seven (27) Census Districts which are heterogeneous in nature and are aligned to administrative districts. In this structure, the Census Districts were further grouped into three (3) domains, being; cities/ towns, urban villages and rural areas.
The survey only targeted households in all districts and sub-districts. It did not cover institutions such as Prisons, Army Barracks, Hospitals and other institutions because the survey was meant to investigate poverty and employment levels at households and individual level.
In light of the above, the first stage was the selection of Enumeration Areas (EAs) as Primary Sampling Units (PSUs) with Probability Proportional to Size (PPS) where measure of size is the number of households in an EA as defined in the 2011 Population & Housing Census. This yielded 599 Enumeration Areas.
In the second stage, households were the Secondary Sampling Units (SSUs) and were systematically selected from the listed households in the selected EA’s (PSUs). This yielded 7,188 households. Based on the estimated number of households, 25,130 persons were expected to participate in the 2015/16 BMTHS survey. Table 10 summarises response rates for the survey.
14 Botswana Multi-Topic Household Survey 2015/16-JAN 2018 STATISTICS BOTSWANAPOVERTY STATS BRIEF
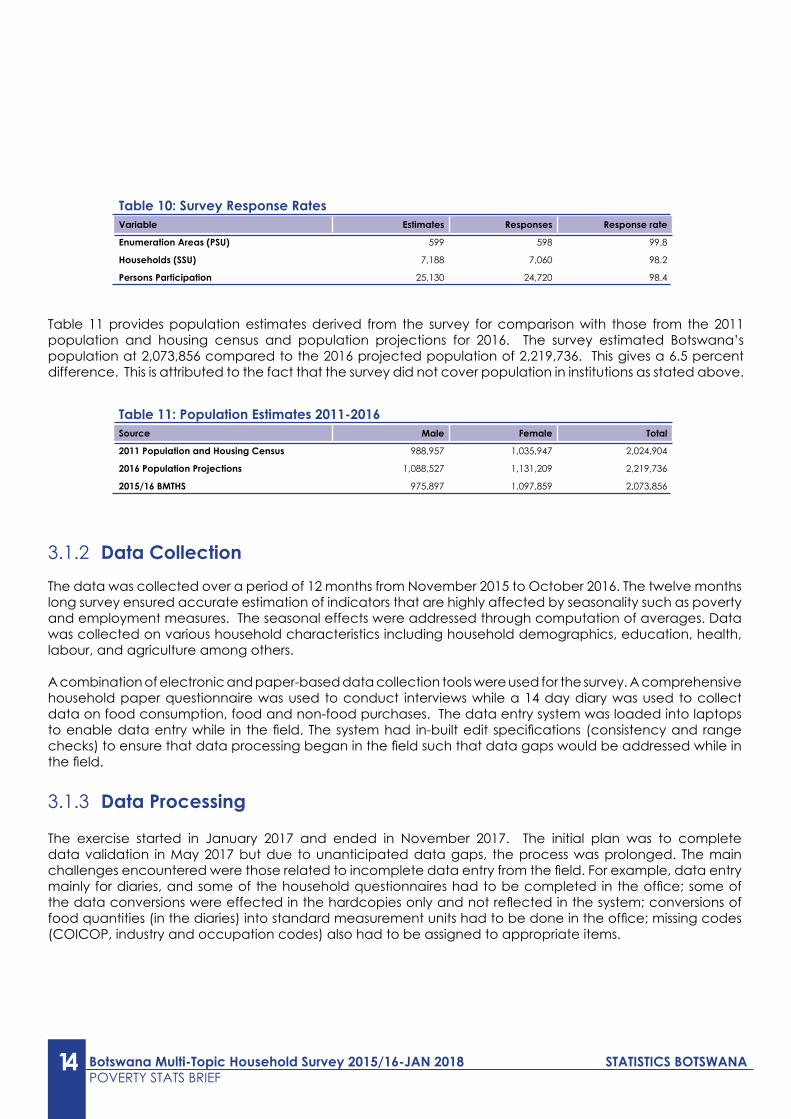
Table 10: Survey Response RatesVariable Estimates Responses Response rate
Enumeration Areas (PSU) 599 598 99.8
Households (SSU) 7,188 7,060 98.2
Persons Participation 25,130 24,720 98.4
Table 11 provides population estimates derived from the survey for comparison with those from the 2011 population and housing census and population projections for 2016. The survey estimated Botswana’s population at 2,073,856 compared to the 2016 projected population of 2,219,736. This gives a 6.5 percent difference. This is attributed to the fact that the survey did not cover population in institutions as stated above.
Table 11: Population Estimates 2011-2016Source Male Female Total
2011 Population and Housing Census 988,957 1,035,947 2,024,904
2016 Population Projections 1,088,527 1,131,209 2,219,736
2015/16 BMTHS 975,897 1,097,859 2,073,856
3.1.2 Data Collection The data was collected over a period of 12 months from November 2015 to October 2016. The twelve months long survey ensured accurate estimation of indicators that are highly affected by seasonality such as poverty and employment measures. The seasonal effects were addressed through computation of averages. Data was collected on various household characteristics including household demographics, education, health, labour, and agriculture among others.
A combination of electronic and paper-based data collection tools were used for the survey. A comprehensive household paper questionnaire was used to conduct interviews while a 14 day diary was used to collect data on food consumption, food and non-food purchases. The data entry system was loaded into laptops to enable data entry while in the field. The system had in-built edit specifications (consistency and range checks) to ensure that data processing began in the field such that data gaps would be addressed while in the field.
3.1.3 Data Processing
The exercise started in January 2017 and ended in November 2017. The initial plan was to complete data validation in May 2017 but due to unanticipated data gaps, the process was prolonged. The main challenges encountered were those related to incomplete data entry from the field. For example, data entry mainly for diaries, and some of the household questionnaires had to be completed in the office; some of the data conversions were effected in the hardcopies only and not reflected in the system; conversions of food quantities (in the diaries) into standard measurement units had to be done in the office; missing codes (COICOP, industry and occupation codes) also had to be assigned to appropriate items.
Botswana Multi-Topic Household Survey 2015/16-JAN 2018 STATISTICS BOTSWANAPOVERTY STATS BRIEF
15
Annexure 1: Estimated Total Number of Households and Persons – 2002/03, 2009/10 and 2015/16 2002/03 HIES 2009/10 BCWIS 2015/16 BMTHS
Cities/Towns
UrbanVillages
RuralAreas National
Cities/Towns
UrbanVillages
RuralAreas National
Cities/Towns
UrbanVillages
RuralAreas National
Male Headed Households 65 730 57 880 87 793 211 403 80 126 85 126 117 581 282 833 85 889 120 524 108 667 315 080
Female Headed Households 43 826 63 440 75 602 82 869 52 109 85 404 100 632 238 144 59 368 120 980 94 480 274 829
Total Households 109 556 121 320 163 395 394 272 132 362 170 632 218 333 521 328 145 257 241 504 203 148 589 909
Total Males 174 711 242 465 344 460 761 636 182 093 301 499 375 770 859 362 251 331 413 669 337 730 1 002 730
Total Females 195 101 302 788 373 397 871 286 186 714 352 614 402 717 942 044 186 931 497 352 386 661 1 070 945
Total Persons 369 812 545 253 717 857 1 632 922 368 807 654 113 778 486 1 801 406 438 262 911 022 724 391 2 073 675
% of Male Headed Households 60.0 47.7 53.7 53.6 60.5 49.9 53.9 54.3 59.1 49.9 53.5 53.4
% of Female Headed H/holds 40.0 52.3 46.3 46.4 39.5 50.1 46.1 45.7 40.9 50.1 46.5 46.6
Total Households (%) 100.0 100.0 100.0 100.0 100.0 100.0 100.0 100.0 100.0 100.0 100.0 100.0
% of Males 47.2 44.5 47.5 48.0 49.4 46.1 48.3 47.7 57.3 45.4 46.6 48.4
% of Females 52.8 55.5 52.5 52.0 50.6 53.9 51.7 52.3 42.7 54.6 53.4 51.6
Total Persons (%) 100.0 100.0 100.0 100.0 100.0 100.0 100.0 100.0 100.0 100.0 100.0 100.0
Annexure 2: Average Monthly Household Expenditure by Consumption Item and Amount in PULA - 2009/10 and 2015/6.
Type of consumption expenditure/outlay
2009/10 2015/16
Cities/Towns
Urban Villages Rural National
Cities/ Towns
Urban Villages Rural National
Food 694.78 649.07 352.89 537.61 485.97 501 513.98 501.77
Alcohol and Tobacco 268.51 259.1 292.38 275.38 161.42 148.83 113.89 139.89
Clothing and Footwear 343.44 266.11 140.21 233.68 365.14 235.61 150.68 238.23
Housing Costs 739.38 450.11 182.16 413.29 1196.82 736.01 297.06 698.2
H/hold Goods and Services 412.39 257.51 138.35 247.91 339.02 156.99 134.85 194.15
Medical/Health care 27.35 48.1 12.77 28.03 277.51 107.65 66.8 135.38
Transport 1,150.40 629.49 305.76 629.27 1346.19 982.34 592.33 937.52
Communication 262.62 178.81 82.89 160.53 416.88 300.03 151.68 277.68
Recreation and Culture 241.13 144.59 67.34 137.37 201.72 111.48 50.86 112.8
Education 88.31 54.99 16.23 47.46 427.17 141.28 60.63 183.84
Restaurants and Hotels 223.49 47.87 17.05 80.39 269.1 140.31 66.3 146.51
Miscellaneous 479.14 255.05 115.91 255 586.35 362.31 197.45 360.65
Final Consumption Exp. 4,930.93 3,240.80 1,723.94 3,045.93 6074.43 3924.52 2397.21 3927.43
16 Botswana Multi-Topic Household Survey 2015/16-JAN 2018 STATISTICS BOTSWANAPOVERTY STATS BRIEF
Annexure 3: Percentage (%) Distribution of Household Consumption Expenditure by Item 2009/10 and 2015/16.
Type of consumption expenditure/outlay
2009/10. 2015/16
Cities/Towns
Urban Villages Rural National
Cities/ Towns
Urban Villages Rural National
Food 14.1 20.0 20.5 17.7 8.0 12.8 21.4 12.8
Alcohol and Tobacco 5.4 8.0 17.0 9.0 2.7 3.8 4.8 3.6
Clothing and Footwear 7.0 8.2 8.1 7.7 6.0 6.0 6.3 6.1
Housing Costs 15.0 13.9 10.6 13.6 19.7 18.8 12.4 17.8
H/hold Goods and Services 8.4 7.9 8.0 8.1 5.6 4.0 5.6 4.9
Medical/Health care 0.6 1.5 0.7 0.9 4.6 2.7 2.8 3.5
Transport 23.3 19.4 17.7 20.7 22.2 25.0 24.7 23.9
Communication 5.3 5.5 4.8 5.3 6.9 7.6 6.3 7.1
Recreation and Culture 4.9 4.5 3.9 4.5 3.3 2.8 2.1 2.9
Education 1.8 1.7 0.9 1.6 7.0 3.6 2.5 4.7
Restaurants and Hotels 4.5 1.5 1.0 2.6 4.4 3.6 2.8 3.7
Miscellaneous 9.7 7.9 6.7 8.4 9.7 9.2 8.2 9.2
Total 100.0 100.0 100.0 100.0 100.0 100.0 100.0 100.0
Annexure 4: Percentage of Households Consideration of Current Income Compared with the Absolute Minimum Required.
STRATA
2009/10 BCWIS 2015/16 BMTHS
LESS SAME GREATER TOTAL LESS SAME GREATER TOTAL
Cities & Towns 36.1 15.1 48.4 100.0 52.8 18.5 28.6 100.0
Urban Villages 44.5 14.3 41.2 100.0 61.4 16.8 21.8 100.0
Rural Areas 53.5 19.6 26.9 100.0 68.1 17.4 14.4 100.0
National 46.1 16.8 37.1 100.0 61.6 17.4 20.9 100.0
Botswana Multi-Topic Household Survey 2015/16-JAN 2018 STATISTICS BOTSWANAPOVERTY STATS BRIEF
17
Annexure 5: Percentage of Households’ Own Description of Living Conditions Compared to Other Households
STRATA
2009/10 BCWIS 2015/16 BMTHS
Among the
Wealthiest Wealthier than Most
About Aver-
age
Some-what
Poorer than
Average
Much poorer
than Average Total
Among the
Wealthiest Wealthier than Most
About Aver-
age
Somewhat Poorer than
Average
Much poorer than
Average Total
Cities & Towns 3.4 5.0 63.6 21.5 6.5 100.0 4.5 5..0 69.2 16.8 4.4 100.0
Urban Villages 3.2 5.9 56.0 24.1 10.8 100.0 2.2 4.8 59.9 25.1 7.9 100.0
Rural Areas 2.6 4.3 43.9 30.2 18.9 100.0 2.5 3.4 45.7 32.2 16.2 100.0
National 3.0 5.0 52.9 26.0 13.1 100.0 2.9 4.4 57.3 25.5 9.9 100.0
Annexure 6: Percentage of Households by Frequency of Worrying About not getting Food
STRATA
2009/10 BCWIS 2015/16 BMTHS
Rarely (1-2 times in the last 4 weeks)
Sometimes (2-10 times in the last 4
weeks)
Often (More than 10 times
in the last 4 weeks) TOTAL
Rarely (1-2 times in
the last 4 weeks)
Sometimes (2-10 times in the last 4
weeks)
Often (More than 10 times
in the last 4 weeks) TOTAL
Cities & Towns 58.4 29.6 11.6 100.0 41.2 42.0 16.7 100.0
Urban Villages 55.6 31.6 12.8 100.0 41.3 43.7 14.9 100.0
Rural Areas 55.5 31.2 13.0 100.0 37.0 45.5 17.5 100.0
National 56.0 31.1 12.7 100.0 39.4 44.3 16.4 100.0
18 Botswana Multi-Topic Household Survey 2015/16-JAN 2018 STATISTICS BOTSWANAPOVERTY STATS BRIEF
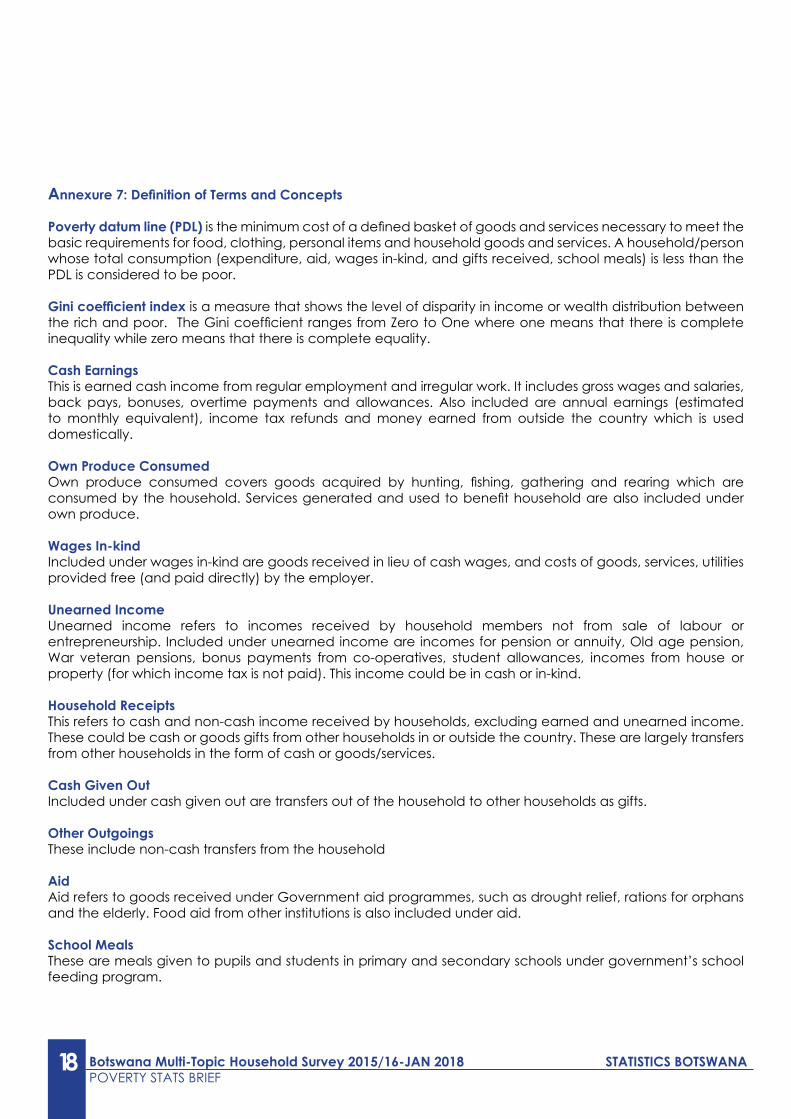
Annexure7:DefinitionofTermsandConcepts
Poverty datum line (PDL) is the minimum cost of a defined basket of goods and services necessary to meet the basic requirements for food, clothing, personal items and household goods and services. A household/person whose total consumption (expenditure, aid, wages in-kind, and gifts received, school meals) is less than the PDL is considered to be poor.
Ginicoefficientindex is a measure that shows the level of disparity in income or wealth distribution between the rich and poor. The Gini coefficient ranges from Zero to One where one means that there is complete inequality while zero means that there is complete equality.
Cash EarningsThis is earned cash income from regular employment and irregular work. It includes gross wages and salaries, back pays, bonuses, overtime payments and allowances. Also included are annual earnings (estimated to monthly equivalent), income tax refunds and money earned from outside the country which is used domestically.
Own Produce ConsumedOwn produce consumed covers goods acquired by hunting, fishing, gathering and rearing which are consumed by the household. Services generated and used to benefit household are also included under own produce.
Wages In-kindIncluded under wages in-kind are goods received in lieu of cash wages, and costs of goods, services, utilities provided free (and paid directly) by the employer.
Unearned IncomeUnearned income refers to incomes received by household members not from sale of labour or entrepreneurship. Included under unearned income are incomes for pension or annuity, Old age pension, War veteran pensions, bonus payments from co-operatives, student allowances, incomes from house or property (for which income tax is not paid). This income could be in cash or in-kind.
Household ReceiptsThis refers to cash and non-cash income received by households, excluding earned and unearned income. These could be cash or goods gifts from other households in or outside the country. These are largely transfers from other households in the form of cash or goods/services.
Cash Given OutIncluded under cash given out are transfers out of the household to other households as gifts.
Other OutgoingsThese include non-cash transfers from the household
AidAid refers to goods received under Government aid programmes, such as drought relief, rations for orphans and the elderly. Food aid from other institutions is also included under aid.
School MealsThese are meals given to pupils and students in primary and secondary schools under government’s school feeding program.
Botswana Multi-Topic Household Survey 2015/16-JAN 2018 STATISTICS BOTSWANAPOVERTY STATS BRIEF
19
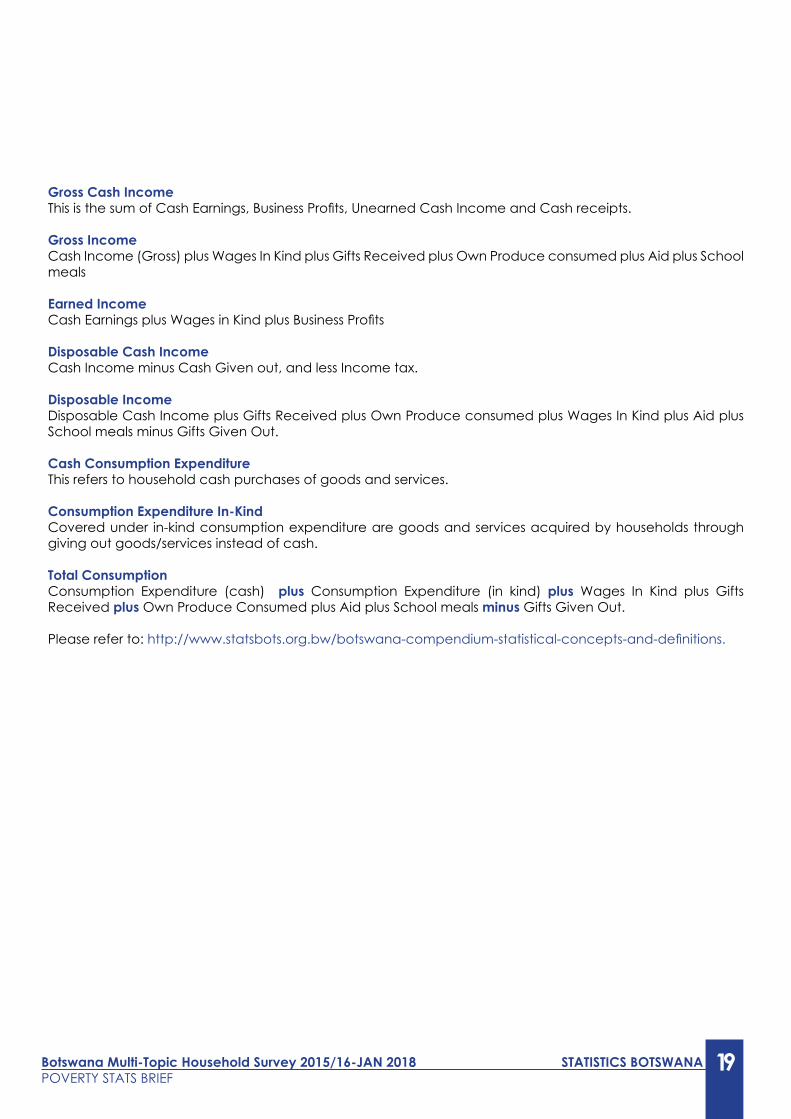
Gross Cash IncomeThis is the sum of Cash Earnings, Business Profits, Unearned Cash Income and Cash receipts.
Gross IncomeCash Income (Gross) plus Wages In Kind plus Gifts Received plus Own Produce consumed plus Aid plus School meals
Earned IncomeCash Earnings plus Wages in Kind plus Business Profits
Disposable Cash IncomeCash Income minus Cash Given out, and less Income tax.
Disposable IncomeDisposable Cash Income plus Gifts Received plus Own Produce consumed plus Wages In Kind plus Aid plus School meals minus Gifts Given Out.
Cash Consumption ExpenditureThis refers to household cash purchases of goods and services.
Consumption Expenditure In-KindCovered under in-kind consumption expenditure are goods and services acquired by households through giving out goods/services instead of cash.
Total ConsumptionConsumption Expenditure (cash) plus Consumption Expenditure (in kind) plus Wages In Kind plus Gifts Received plus Own Produce Consumed plus Aid plus School meals minus Gifts Given Out.
Please refer to: http://www.statsbots.org.bw/botswana-compendium-statistical-concepts-and-definitions.
20 Botswana Multi-Topic Household Survey 2015/16-JAN 2018 STATISTICS BOTSWANAPOVERTY STATS BRIEF
Private Bag 0024, Gaborone.Tel: 3671300 Fax: 3952201 Toll Free: 0800 600 200 E-mail: [email protected]: http://www.statsbots.org.bw