Embed Size (px)
Citation preview
Poverty Reduction Through Financial Inclusion
National Team for Acceleration of Poverty Reduction (TNP2K)Office of Vice President, Republik Indonesia
MARCH 2016
Elan SatriawanHead of Policy Working Group
2|
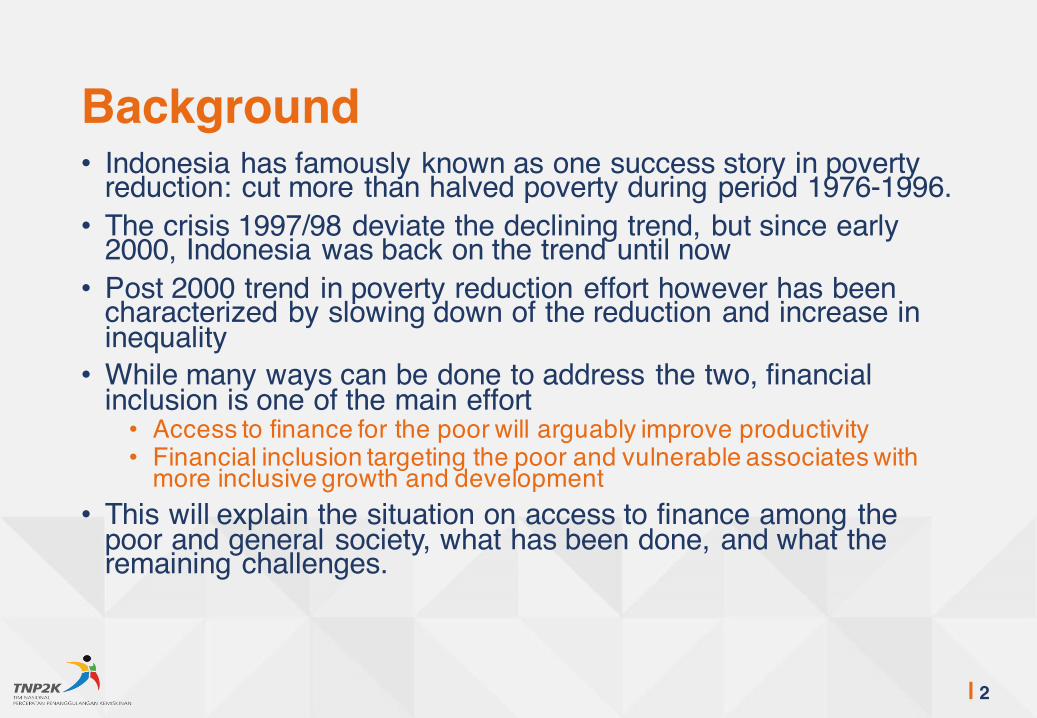
• Indonesia has famously known as one success story in poverty reduction: cut more than halved poverty during period 1976-1996.
• The crisis 1997/98 deviate the declining trend, but since early 2000, Indonesia was back on the trend until now
• Post 2000 trend in poverty reduction effort however has been characterized by slowing down of the reduction and increase in inequality
• While many ways can be done to address the two, financial inclusion is one of the main effort• Access to finance for the poor will arguably improve productivity• Financial inclusion targeting the poor and vulnerable associates with
more inclusive growth and development• This will explain the situation on access to finance among the
poor and general society, what has been done, and what the remaining challenges.
Background
3|
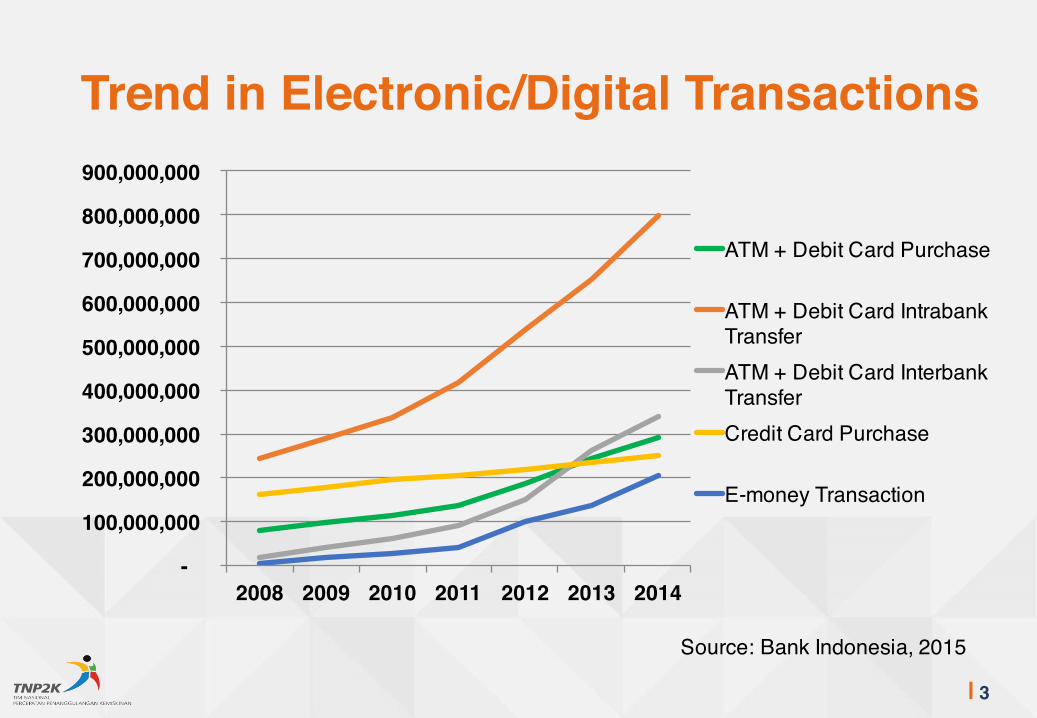
Trend in Electronic/Digital Transactions
-
100,000,000
200,000,000
300,000,000
400,000,000
500,000,000
600,000,000
700,000,000
800,000,000
900,000,000
2008 2009 2010 2011 2012 2013 2014
ATM + Debit Card Purchase
ATM + Debit Card Intrabank TransferATM + Debit Card Interbank TransferCredit Card Purchase
E-money Transaction
Source: Bank Indonesia, 2015
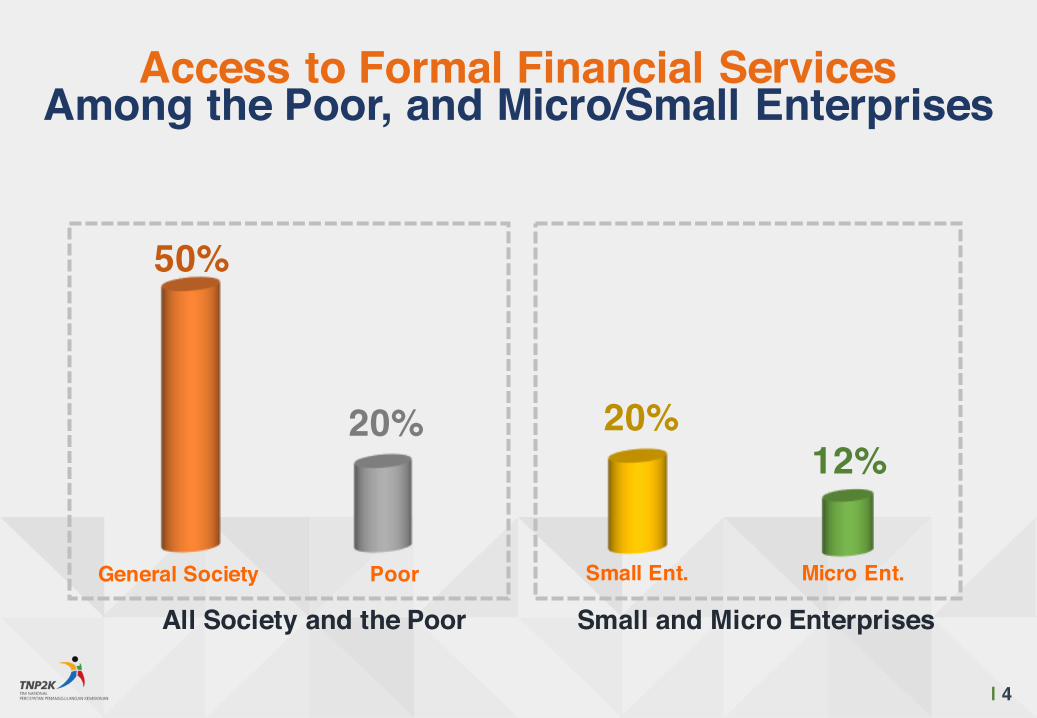
All Society and the Poor Small and Micro Enterprises
| 4
General Society
20%
50%
Poor Small Ent.
12%20%
Micro Ent.
Access to Formal Financial ServicesAmong the Poor, and Micro/Small Enterprises
5|
Using Cashless Services for Distribution of Social Assistance Benefits.
6|
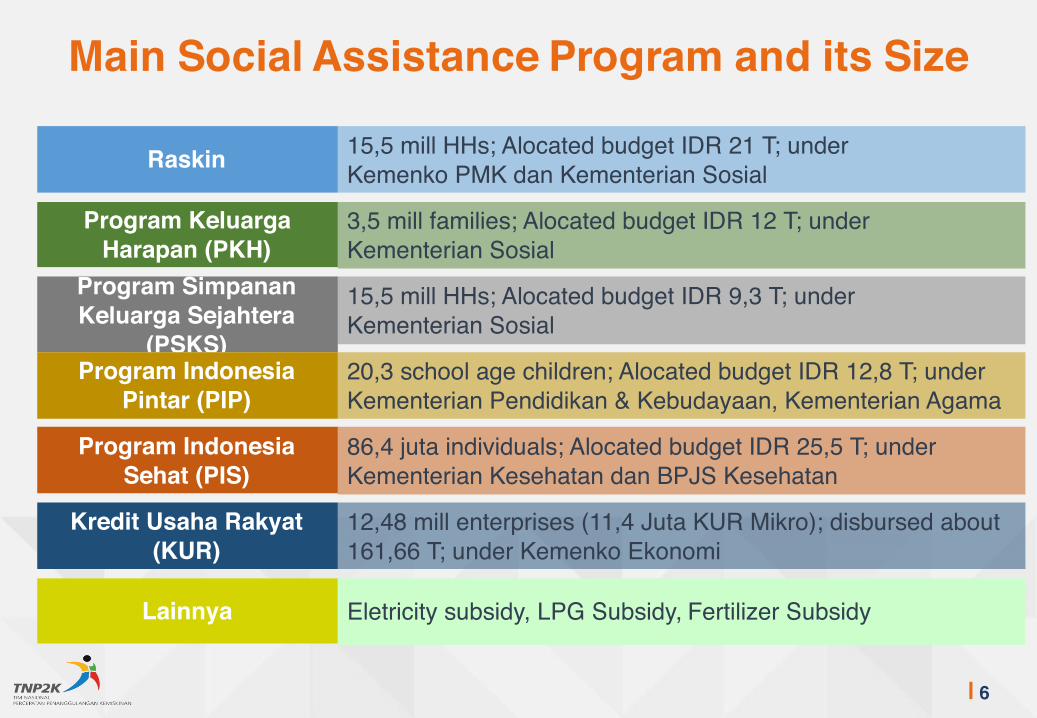
Raskin
Program KeluargaHarapan (PKH)
Program SimpananKeluarga Sejahtera
(PSKS)Program Indonesia
Pintar (PIP)
Program Indonesia Sehat (PIS)
Kredit Usaha Rakyat (KUR)
15,5 mill HHs; Alocated budget IDR 21 T; underKemenko PMK dan Kementerian Sosial
3,5 mill families; Alocated budget IDR 12 T; underKementerian Sosial
15,5 mill HHs; Alocated budget IDR 9,3 T; underKementerian Sosial
20,3 school age children; Alocated budget IDR 12,8 T; underKementerian Pendidikan & Kebudayaan, Kementerian Agama
86,4 juta individuals; Alocated budget IDR 25,5 T; underKementerian Kesehatan dan BPJS Kesehatan
12,48 mill enterprises (11,4 Juta KUR Mikro); disbursed about 161,66 T; under Kemenko Ekonomi
Lainnya Eletricity subsidy, LPG Subsidy, Fertilizer Subsidy
Main Social Assistance Program and its Size
7|
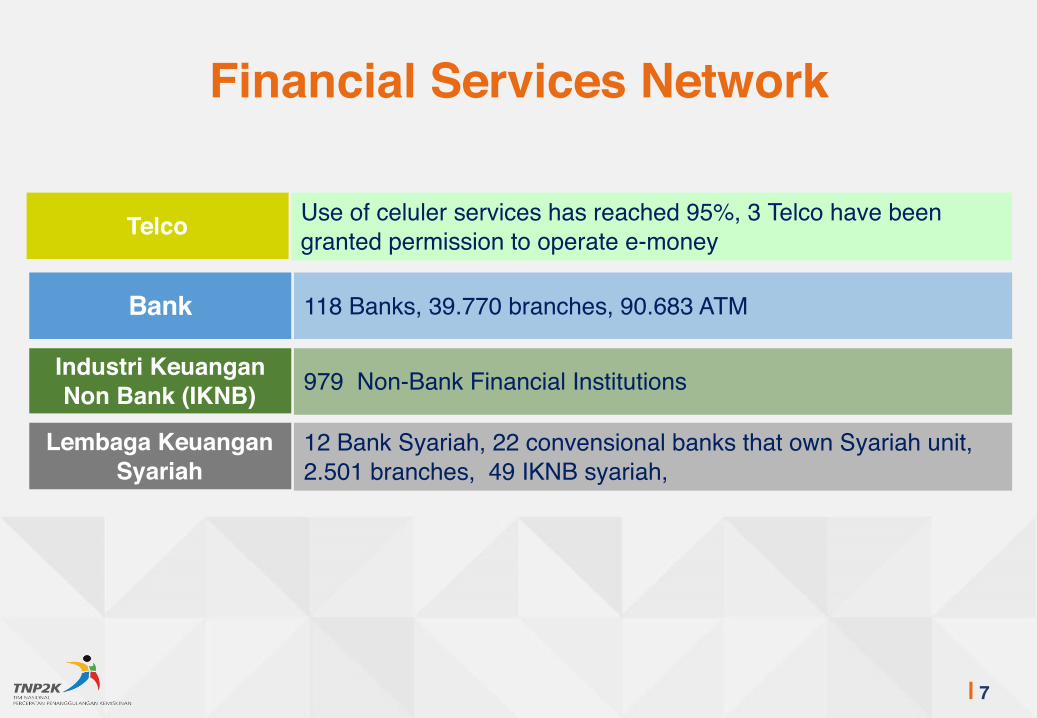
Bank
Industri KeuanganNon Bank (IKNB)
Lembaga KeuanganSyariah
118 Banks, 39.770 branches, 90.683 ATM
979 Non-Bank Financial Institutions
12 Bank Syariah, 22 convensional banks that own Syariah unit, 2.501 branches, 49 IKNB syariah,
Telco Use of celuler services has reached 95%, 3 Telco have been granted permission to operate e-money
Financial Services Network
8|
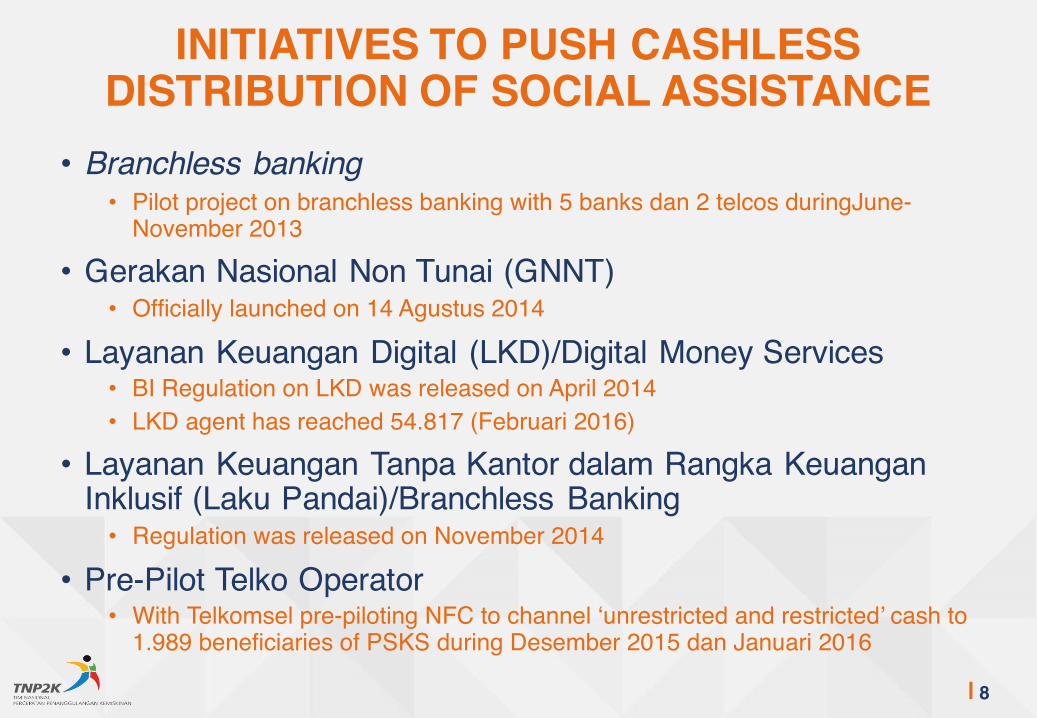
• Branchless banking• Pilot project on branchless banking with 5 banks dan 2 telcos duringJune-
November 2013
• Gerakan Nasional Non Tunai (GNNT)• Officially launched on 14 Agustus 2014
• Layanan Keuangan Digital (LKD)/Digital Money Services• BI Regulation on LKD was released on April 2014• LKD agent has reached 54.817 (Februari 2016)
• Layanan Keuangan Tanpa Kantor dalam Rangka Keuangan Inklusif (Laku Pandai)/Branchless Banking• Regulation was released on November 2014
• Pre-Pilot Telko Operator• With Telkomsel pre-piloting NFC to channel ‘unrestricted and restricted’ cash to
1.989 beneficiaries of PSKS during Desember 2015 dan Januari 2016
INITIATIVES TO PUSH CASHLESS DISTRIBUTION OF SOCIAL ASSISTANCE
9|
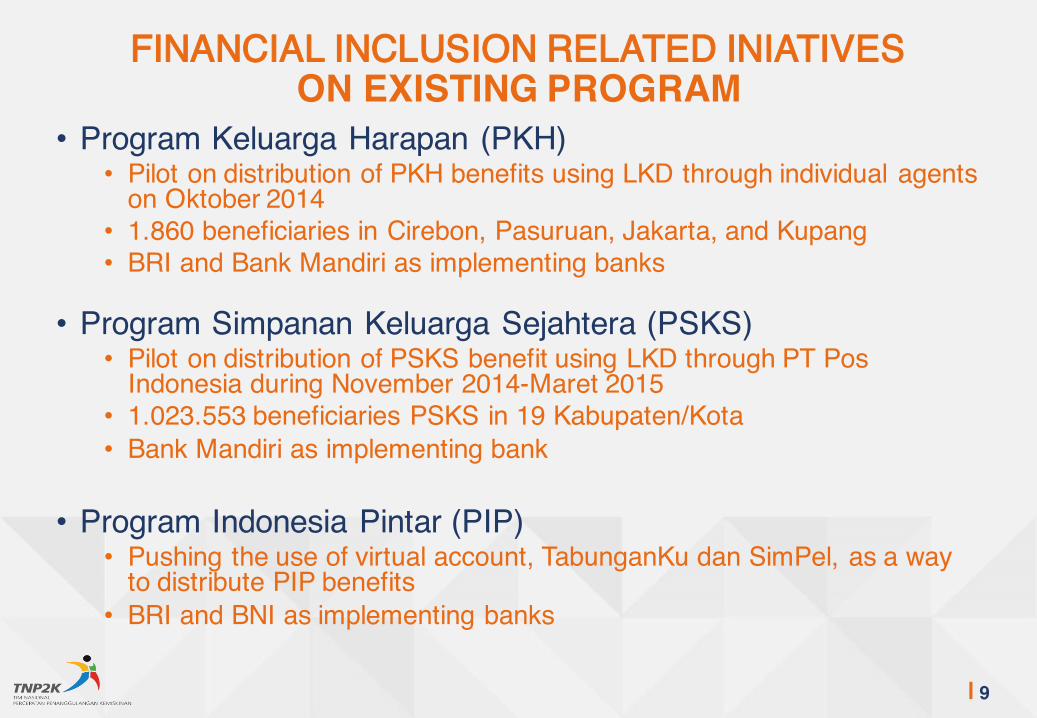
• Program Keluarga Harapan (PKH)• Pilot on distribution of PKH benefits using LKD through individual agents
on Oktober 2014• 1.860 beneficiaries in Cirebon, Pasuruan, Jakarta, and Kupang• BRI and Bank Mandiri as implementing banks
• Program Simpanan Keluarga Sejahtera (PSKS)• Pilot on distribution of PSKS benefit using LKD through PT Pos
Indonesia during November 2014-Maret 2015• 1.023.553 beneficiaries PSKS in 19 Kabupaten/Kota• Bank Mandiri as implementing bank
• Program Indonesia Pintar (PIP)• Pushing the use of virtual account, TabunganKu dan SimPel, as a way
to distribute PIP benefits• BRI and BNI as implementing banks
FINANCIAL INCLUSION RELATED INIATIVES ON EXISTING PROGRAM
10|
Improving Access to Credit for Micro and Small Enterprises
11|
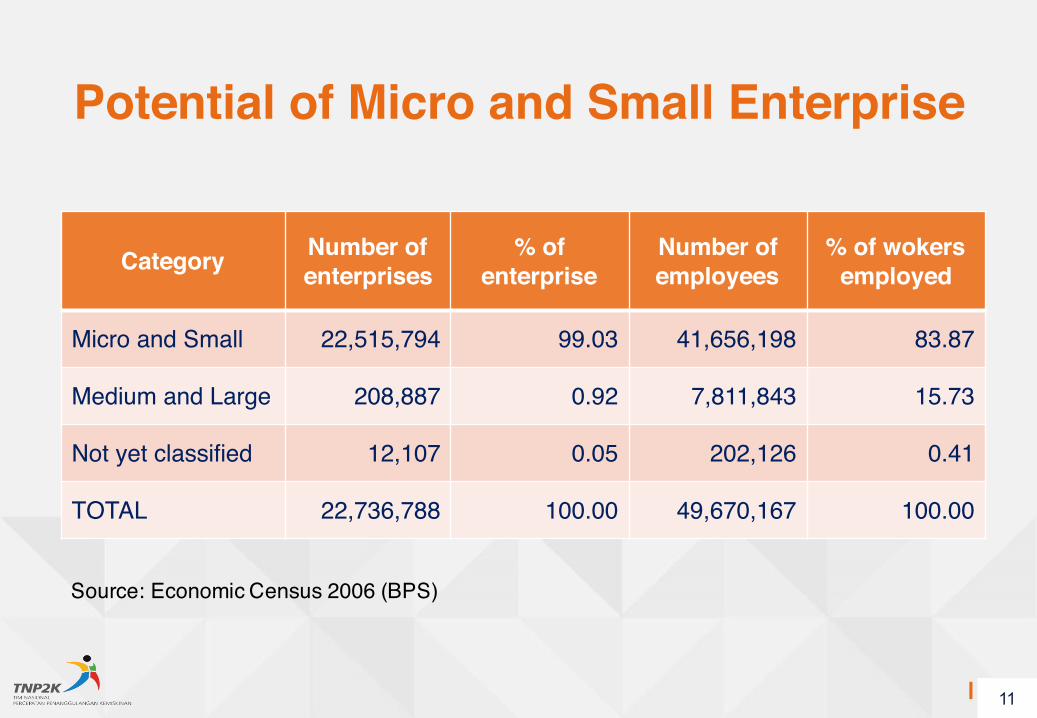
Category Number of enterprises
% of enterprise
Number of employees
% of wokersemployed
Micro and Small 22,515,794 99.03 41,656,198 83.87
Medium and Large 208,887 0.92 7,811,843 15.73
Not yet classified 12,107 0.05 202,126 0.41
TOTAL 22,736,788 100.00 49,670,167 100.00
Source: Economic Census 2006 (BPS)
11
Potential of Micro and Small Enterprise
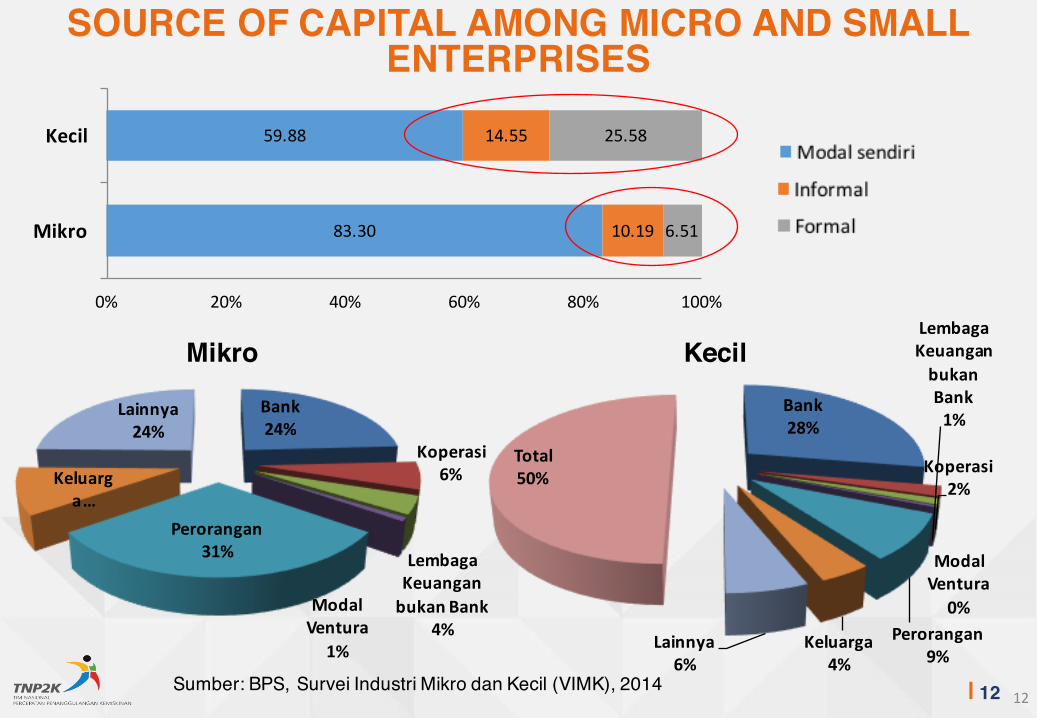
12|Sumber: BPS, Survei Industri Mikro dan Kecil (VIMK), 201412
83.30
59.88
10.19
14.55
6.51
25.58
0% 20% 40% 60% 80% 100%
Mikro
Kecil
Bank24%
Koperasi6%
Lembaga Keuangan bukan Bank
4%Modal Ventura
1%
Perorangan31%
Keluarga…
Lainnya24%
Mikro
Bank28%
Koperasi2%
Lembaga Keuangan bukan Bank1%
Modal Ventura
0%Perorangan
9%Keluarga
4%Lainnya
6%
Total50%
Kecil
SOURCE OF CAPITAL AMONG MICRO AND SMALL ENTERPRISES
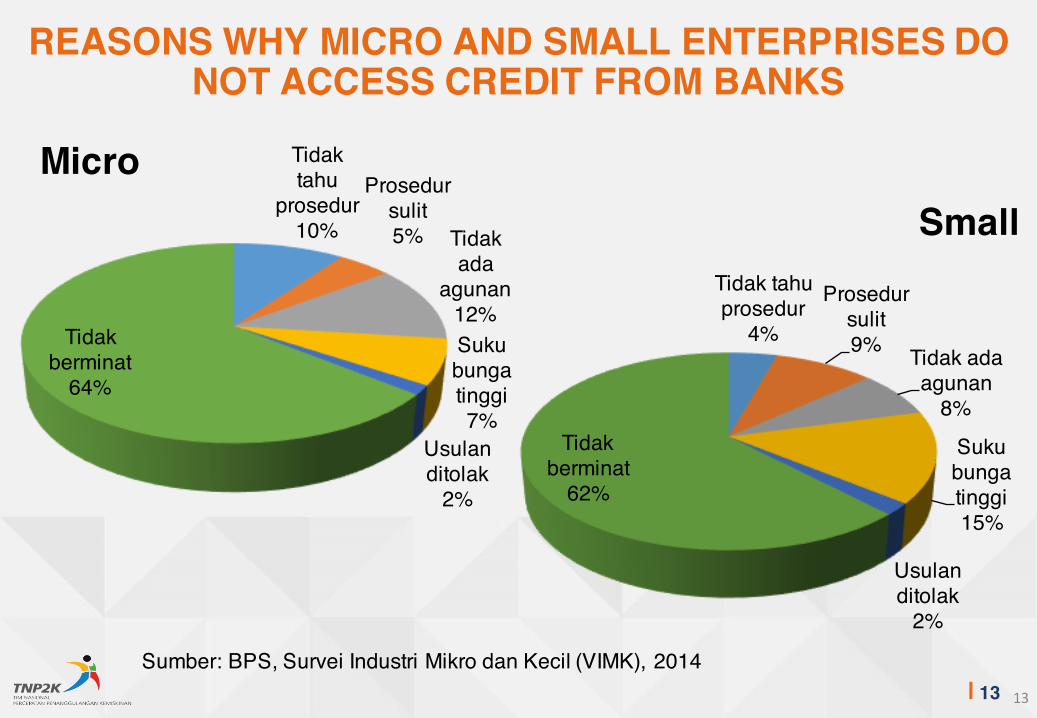
13|Sumber: BPS, Survei Industri Mikro dan Kecil (VIMK), 2014
13
Tidak tahu
prosedur10%
Prosedur sulit5% Tidak
ada agunan
12%Suku bunga tinggi7%
Usulan ditolak
2%
Tidak berminat
64%
Micro
Tidak tahu prosedur
4%
Prosedur sulit9% Tidak ada
agunan8%
Suku bunga tinggi15%
Usulan ditolak
2%
Tidak berminat
62%
Small
REASONS WHY MICRO AND SMALL ENTERPRISES DO NOT ACCESS CREDIT FROM BANKS
14|
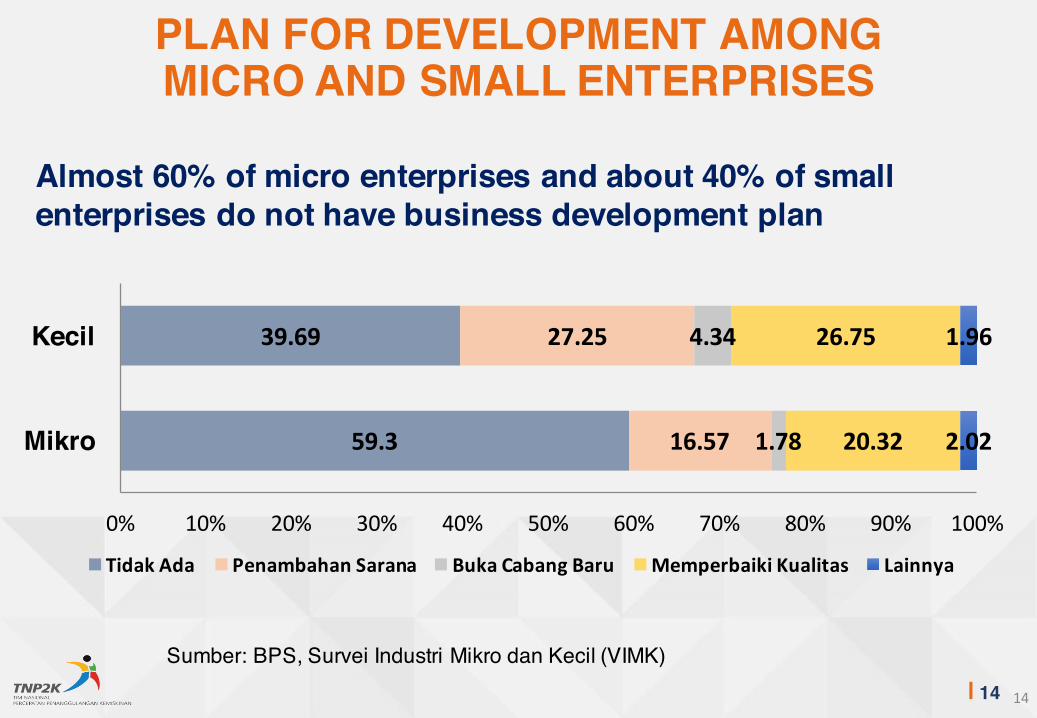
Almost 60% of micro enterprises and about 40% of small enterprises do not have business development plan
59.3
39.69
16.57
27.25
1.78
4.34
20.32
26.75
2.02
1.96
0% 10% 20% 30% 40% 50% 60% 70% 80% 90% 100%
Mikro
Kecil
Tidak Ada Penambahan Sarana Buka Cabang Baru Memperbaiki Kualitas Lainnya
Sumber: BPS, Survei Industri Mikro dan Kecil (VIMK)
14
PLAN FOR DEVELOPMENT AMONG MICRO AND SMALL ENTERPRISES
15|
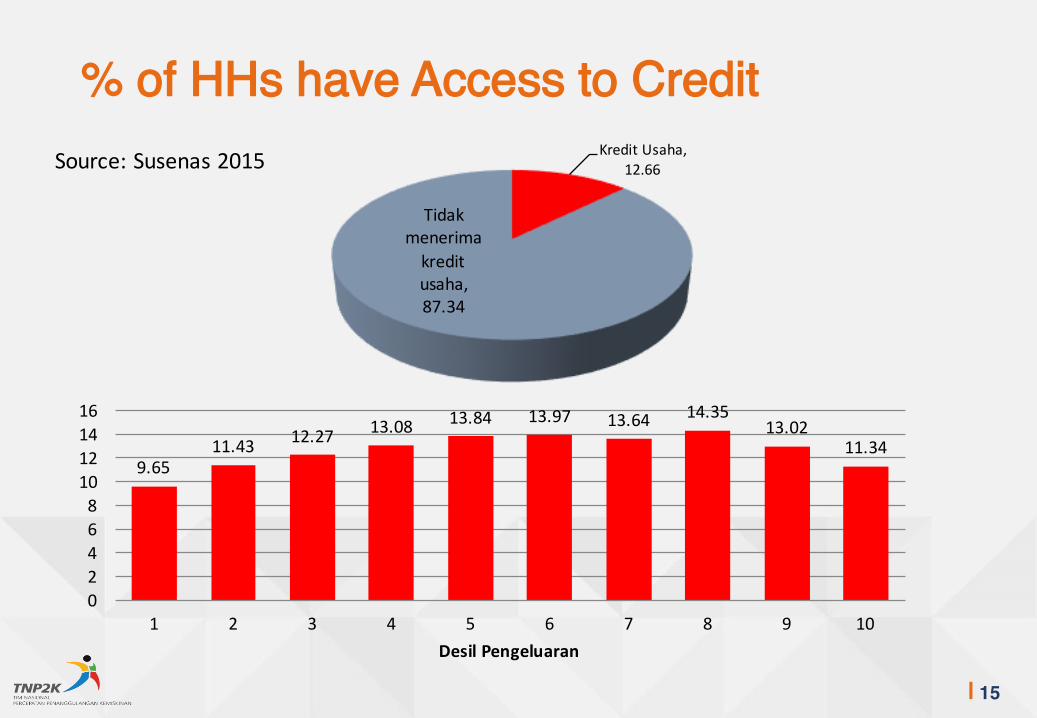
% of HHs have Access to Credit
9.6511.43 12.27 13.08 13.84 13.97 13.64 14.35
13.0211.34
0246810121416
1 2 3 4 5 6 7 8 9 10Desil Pengeluaran
Kredit Usaha, 12.66
Tidak menerima kredit usaha, 87.34
Source: Susenas 2015
16|
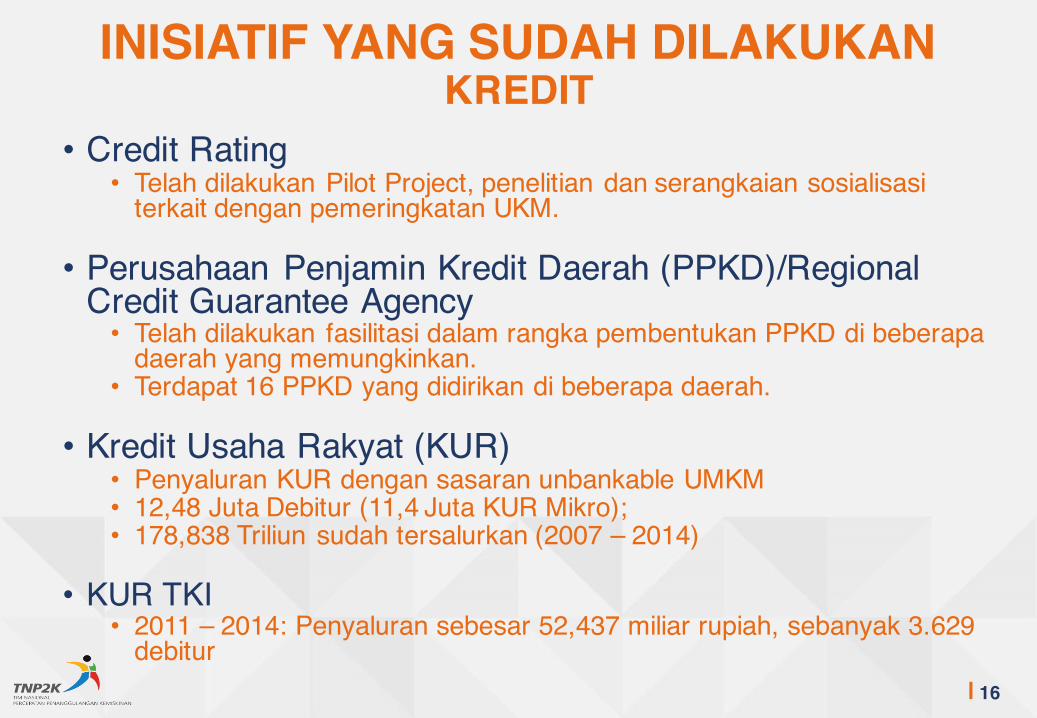
INISIATIF YANG SUDAH DILAKUKANKREDIT
• Credit Rating• Telah dilakukan Pilot Project, penelitian dan serangkaian sosialisasi
terkait dengan pemeringkatan UKM.
• Perusahaan Penjamin Kredit Daerah (PPKD)/Regional Credit Guarantee Agency• Telah dilakukan fasilitasi dalam rangka pembentukan PPKD di beberapa
daerah yang memungkinkan.• Terdapat 16 PPKD yang didirikan di beberapa daerah.
• Kredit Usaha Rakyat (KUR)• Penyaluran KUR dengan sasaran unbankable UMKM • 12,48 Juta Debitur (11,4 Juta KUR Mikro); • 178,838 Triliun sudah tersalurkan (2007 – 2014)
• KUR TKI• 2011 – 2014: Penyaluran sebesar 52,437 miliar rupiah, sebanyak 3.629
debitur
17|
PROGRAM KREDIT USAHA RAKYAT (KUR)
18
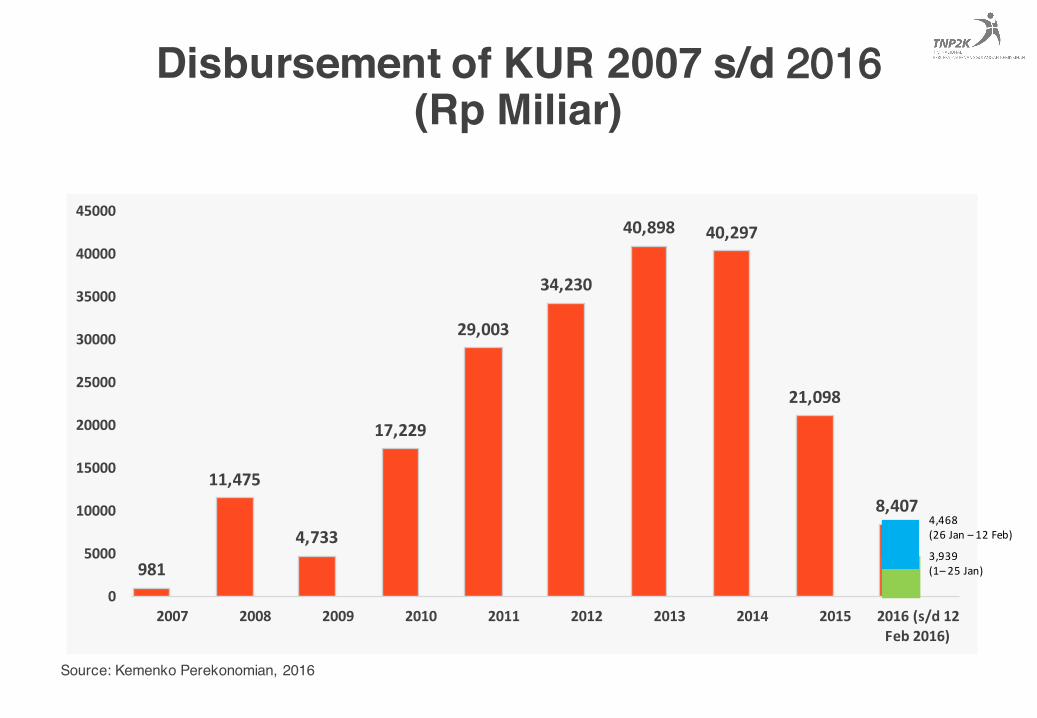
Disbursement of KUR 2007 s/d 2016 (Rp Miliar)
981
11,475
4,733
17,229
29,003
34,230
40,898 40,297
21,098
8,407
0
5000
10000
15000
20000
25000
30000
35000
40000
45000
2007 2008 2009 2010 2011 2012 2013 2014 2015 2016 (s/d 12 Feb 2016)
Source: Kemenko Perekonomian, 2016
4,468 (26 Jan – 12 Feb)
3,939(1– 25 Jan)
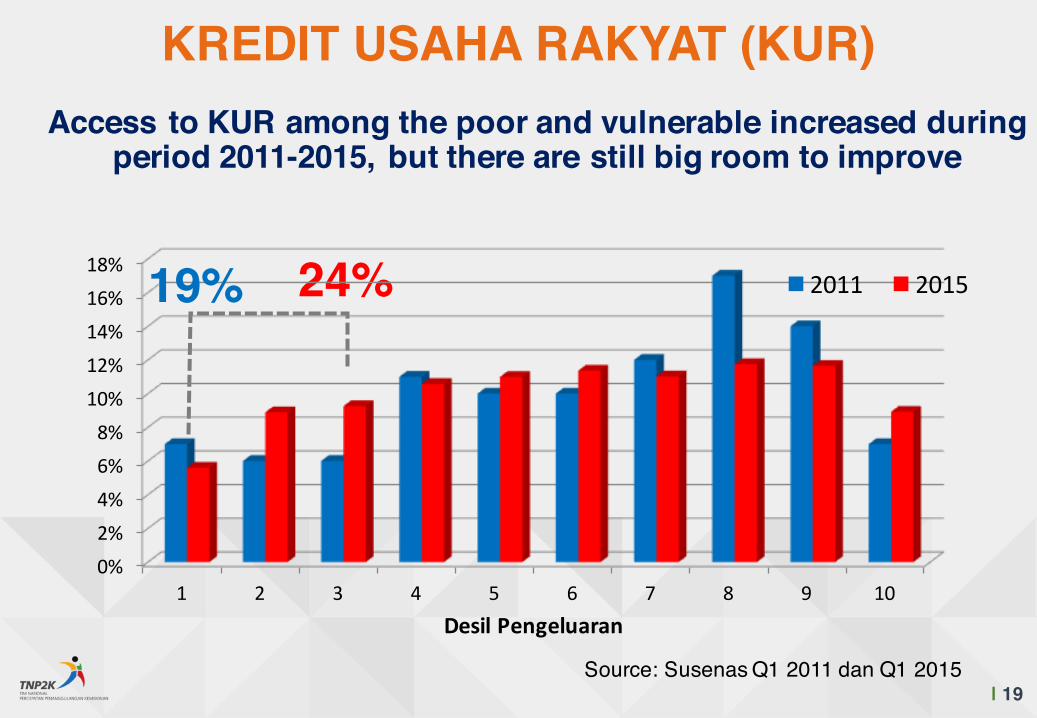
19| | 19Source: Susenas Q1 2011 dan Q1 2015
24%
Access to KUR among the poor and vulnerable increased during period 2011-2015, but there are still big room to improve
0%2%4%6%8%10%12%14%16%18%
1 2 3 4 5 6 7 8 9 10Desil Pengeluaran
2011 2015
KREDIT USAHA RAKYAT (KUR)
19%
20
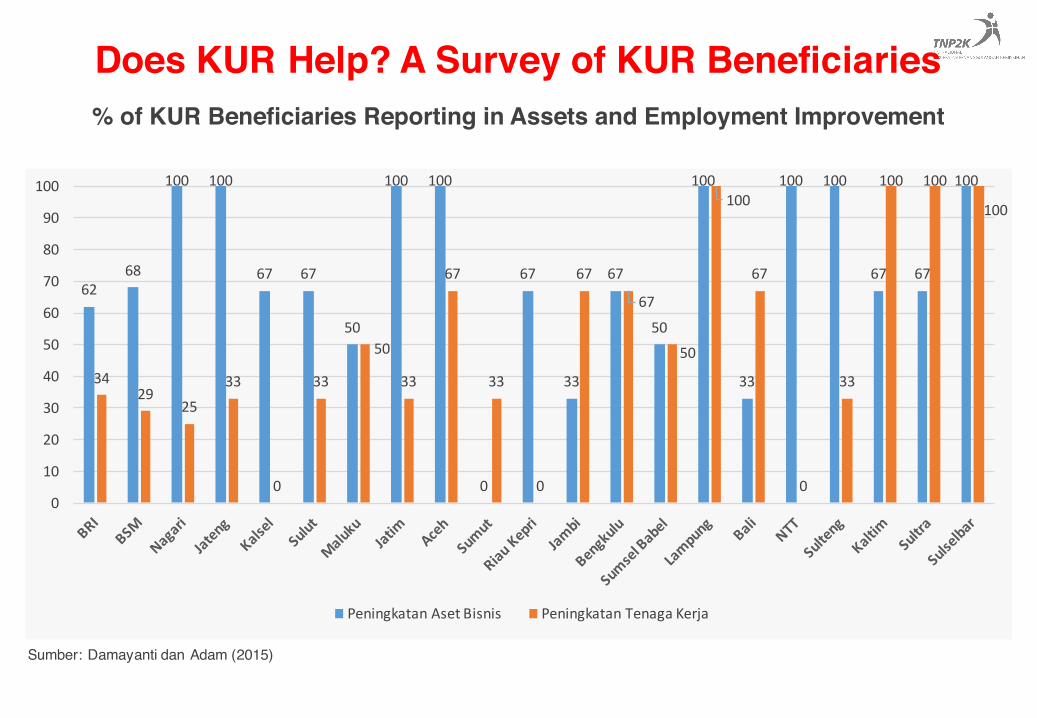
Does KUR Help? A Survey of KUR Beneficiaries
Sumber: Damayanti dan Adam (2015)
% of KUR Beneficiaries Reporting in Assets and Employment Improvement
6268
100 100
67 67
50
100 100
0
67
33
67
50
100
33
100 100
67 67
100
3429
2533
0
33
50
33
67
33
0
67
67
50
100
67
0
33
100 100
100
0
10
20
30
40
50
60
70
80
90
100
Peningkatan Aset Bisnis Peningkatan Tenaga Kerja
21
% of KUR Beneficiaries Reporting Additional Benefits of KUR
43
5450 50 50
43
80
66
25
38
75
60
33
67
29
50
75
33
50 50
75
22 24
50 50
33
43
2017
0
38
25
40
22
0
43
17
25
17
50
25 25
131111
40 0 0 0 0
17
0
13
0 0
22
0
14
0 0
17
0 0 00
10
20
30
40
50
60
70
80
Percaya Diri Dalam Berusaha Jaringan Bisnis Lebih Luas Membantu Pemasaran Pengetahuan Pembukuan
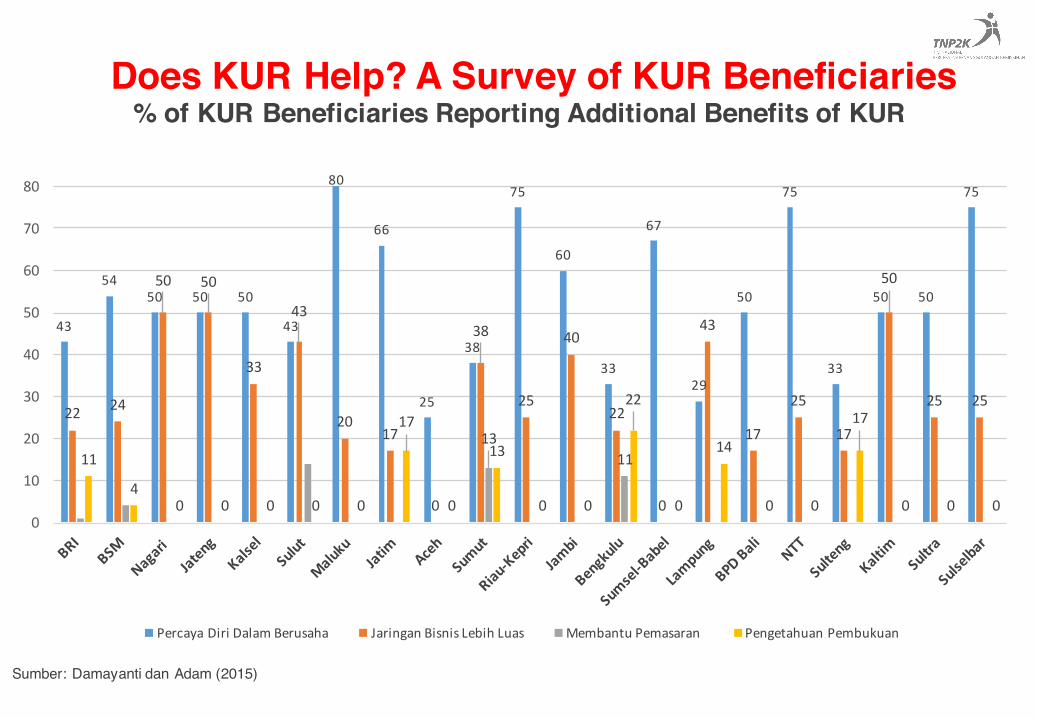
Sumber: Damayanti dan Adam (2015)
Does KUR Help? A Survey of KUR Beneficiaries
22
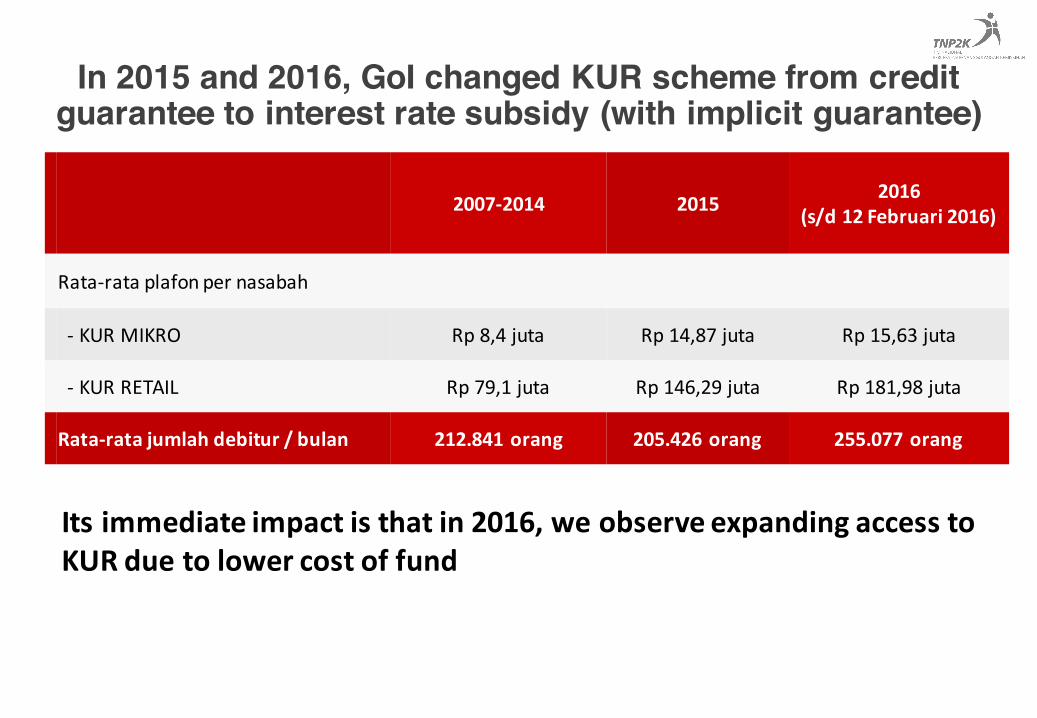
In 2015 and 2016, GoI changed KUR scheme from credit guarantee to interest rate subsidy (with implicit guarantee)
2007-‐2014 2015 2016 (s/d 12 Februari 2016)
Rata-‐rata plafon per nasabah
-‐ KUR MIKRO Rp 8,4 juta Rp 14,87 juta Rp 15,63 juta
-‐ KUR RETAIL Rp 79,1 juta Rp 146,29 juta Rp 181,98 juta
Rata-‐rata jumlah debitur / bulan 212.841 orang 205.426 orang 255.077 orang
Its immediate impact is that in 2016, we observe expanding access to KUR due to lower cost of fund
23|
ACEH
SUMATERA UTARA
SUMATERA BARAT
RIAU
JAMBISUMATERA SELATAN
BENGKULU
LAMPUNG
KEPULAUAN BANGKA BELITUNG
KEPULAUAN RIAU
DKI JAKARTA
JAWA BARAT
JAWA TENGAHD I YOGYAKARTA
JAWA TIMUR
BANTEN
BALI
NUSA TENGGARA BARAT
NUSA TENGGARA TIMUR
KALIMANTAN BARAT
KALIMANTAN TENGAH
KALIMANTAN SELATAN
KALIMANTAN TIMUR
KALIMANTAN UTARA SULAWESI UTARASULAWESI TENGAH
SULAWESI SELATAN
SULAWESI TENGGARA
GORONTALOSULAWESI BARAT
MALUKU
MALUKU UTARAPAPUA BARAT
0
20
40
60
80
100
0 10 20 30 40 50 60 70 80 90 100
12
3 4
% Villages with enterprise receiving KUR in a Province
% S
ubdi
stric
tsw
ith p
rese
nce
of B
anks
in a
pr
ovin
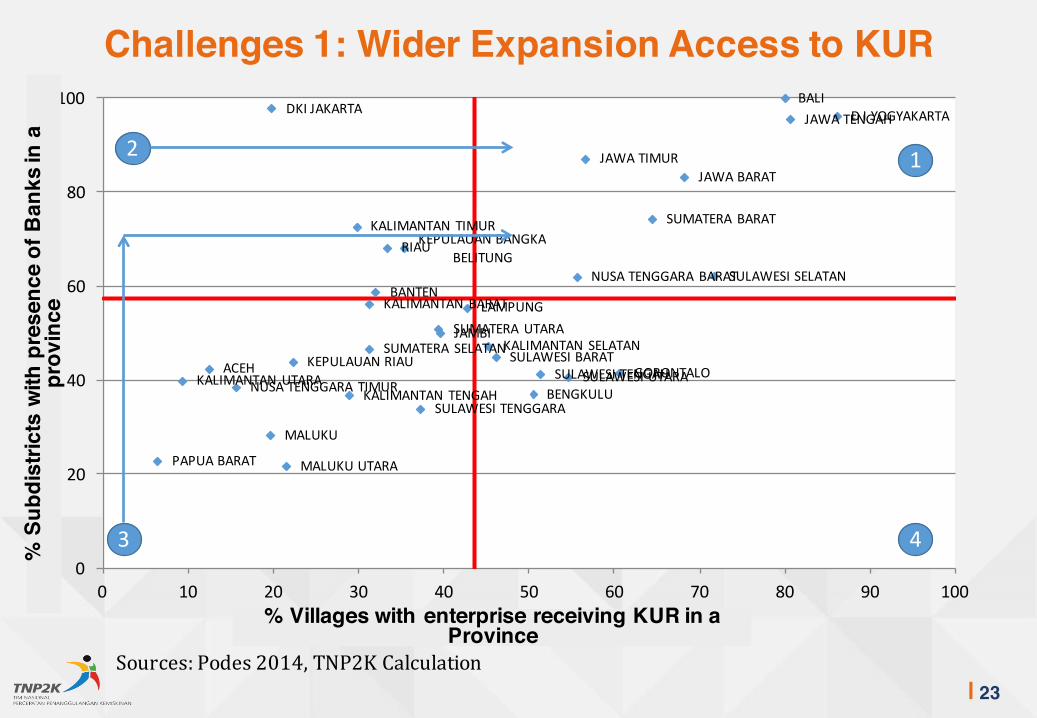
ceChallenges 1: Wider Expansion Access to KUR
Sources: Podes 2014, TNP2K Calculation
24|
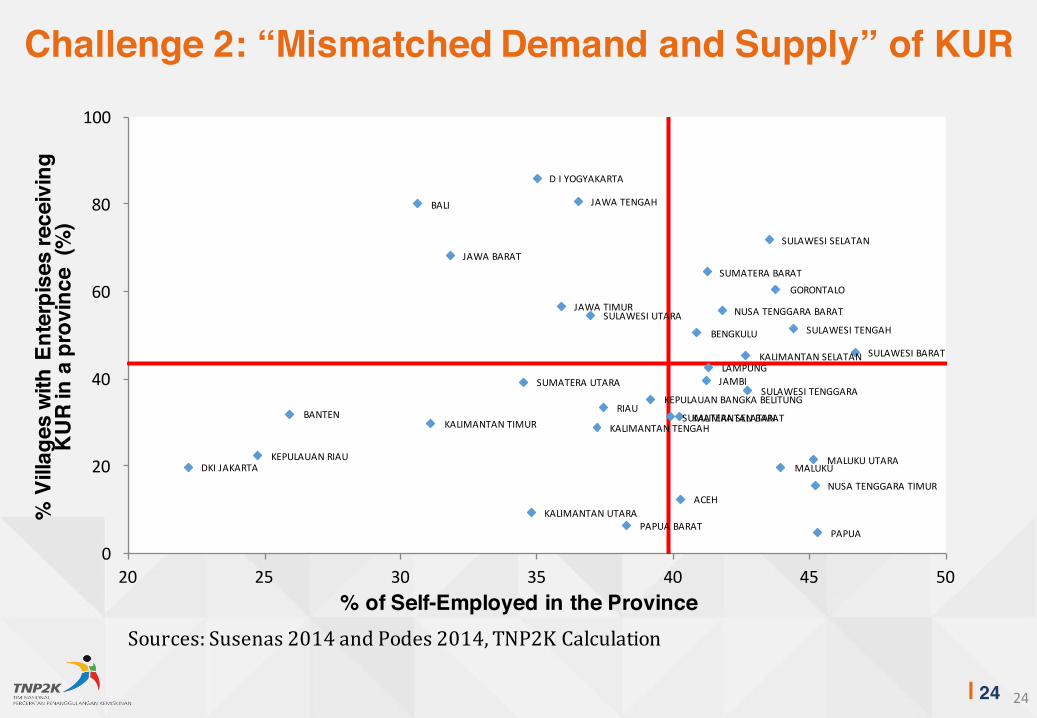
ACEH
SUMATERA UTARA
SUMATERA BARAT
RIAU
JAMBI
SUMATERA SELATAN
BENGKULU
LAMPUNG
KEPULAUAN BANGKA BELITUNG
KEPULAUAN RIAUDKI JAKARTA
JAWA BARAT
JAWA TENGAH
D I YOGYAKARTA
JAWA TIMUR
BANTEN
BALI
NUSA TENGGARA BARAT
NUSA TENGGARA TIMUR
KALIMANTAN BARATKALIMANTAN TENGAH
KALIMANTAN SELATAN
KALIMANTAN TIMUR
KALIMANTAN UTARA
SULAWESI UTARASULAWESI TENGAH
SULAWESI SELATAN
SULAWESI TENGGARA
GORONTALO
SULAWESI BARAT
MALUKUMALUKU UTARA
PAPUA BARATPAPUA
0
20
40
60
80
100
20 25 30 35 40 45 50% of Self-Employed in the Province
% V
illag
es w
ith E
nter
pise
sre
ceiv
ing
KU
R in
a p
rovi
nce
(%)
24
Challenge 2: “Mismatched Demand and Supply” of KUR
Sources: Susenas 2014 and Podes 2014, TNP2K Calculation
25|
• Does new KUR policy help to wider access –toward outer islands and non-existing beneficiaries?• Does involve non-bank as KUR participating
agencies help to reach the poor and vulnerable?• Does current policy lead to crowding out of non-
KUR credits –both within the same implementing bank or inter-credit agencies?
Some Remaining Questions to Explore

Terima Kasih