Embed Size (px)
DESCRIPTION
A guide book for electrical power supply
Citation preview
02
Power balance and choice of power
supply solutions
PowEr guidE 2009 / BOOk 02

INTRO
On every site, whether it is new or being renovated, a logical, interactive and systemic conceptual process must be carried out in order to make crucial technical choices: structure and sizing of the installation, connection to the network, choice of supplies, organisation of the protective devices, control and monitoring systems, safety and replacement sources, and numerous other characteristics that will all have a significant influence on the final result, on which the quality of the site will be judged.
And expectations are ever higher: quality of service, quality of execution, price-quality ratio and also increasingly the expected quality of operation which is fundamental to performance, reliability and economy of use. Energy has become a precious, costly commodity. Energy efficiency is now a duty.
Savings can be made while maintaining or even improving the level of service. But this challenge involves, amongst other things, an imperative two-fold conceptual approach: power analysis and selection of sources.
Book 2 of the Legrand Power Guide provides guidance on this approach, by describing the essential aspects of an initial analysis, whether this is based on a project (new) or a diagnosis (existing), detailing the difficult methods for calculating power and its distribution, and the requirements for their provision so that the most suitable source can be selected.
In accordance with its policy of continuous improvement, the Company reserves the right to change specifications and designs without notice. All illustrations, descriptions, dimensions and weights in this catalogue are for guidance and cannot be held binding on the Company.
The increasing complexity of electrical installations, a corollary of the diversity of sectors and their specific requirements, means that there is no one model. Residential, commercial, public services, structures, agriculture, IT, communications, industry, health, transport, etc. are all sectors with different needs but very similar final expectations.
01
Power analysis 02New installations � � � � � � � � � � � � � � � � � � � � � � � � � � � � � � � � � � � � � � � � � 03Existing installations � � � � � � � � � � � � � � � � � � � � � � � � � � � � � � � � � � � � � � � 05Analysis of the loads, calculation of the currents, power of the source � � � � � � � � � � � � � � � � � � � � � � � � � � � � � � � � � � � � � � � � 14Analysis of the loads � � � � � � � � � � � � � � � � � � � � � � � � � � � � � � � � � � � � � � � � 16Calculation of the currents � � � � � � � � � � � � � � � � � � � � � � � � � � � � � � � � � � 26Calculation of the power according to the types of load� � � � � � � � � � � � 29
Selection of sources 44Power supplies � � � � � � � � � � � � � � � � � � � � � � � � � � � � � � � � � � � � � � � � � � � � 44HV/lV transformers � � � � � � � � � � � � � � � � � � � � � � � � � � � � � � � � � � � � � � � � 46Generator sets � � � � � � � � � � � � � � � � � � � � � � � � � � � � � � � � � � � � � � � � � � � � 53UPS � � � � � � � � � � � � � � � � � � � � � � � � � � � � � � � � � � � � � � � � � � � � � � � � � � � � � � 56Batteries � � � � � � � � � � � � � � � � � � � � � � � � � � � � � � � � � � � � � � � � � � � � � � � � � � 57
Choice of transformers 58Advantages of cast resin transformers � � � � � � � � � � � � � � � � � � � � � � � � 59Energy saving transformers with reduced losses� � � � � � � � � � � � � � � � � 62Environmental and climatic features and fire resistance � � � � � � � � � � 64low electromagnetic emission � � � � � � � � � � � � � � � � � � � � � � � � � � � � � � � � 65Protection against temperature rise � � � � � � � � � � � � � � � � � � � � � � � � � � � 66Ventilation of the transformers � � � � � � � � � � � � � � � � � � � � � � � � � � � � � � � 68Protection against overloads � � � � � � � � � � � � � � � � � � � � � � � � � � � � � � � � � 70Protection against short-circuits � � � � � � � � � � � � � � � � � � � � � � � � � � � � � � 73Protection against overvoltages � � � � � � � � � � � � � � � � � � � � � � � � � � � � � � � 75
Zucchini transformers 76Range � � � � � � � � � � � � � � � � � � � � � � � � � � � � � � � � � � � � � � � � � � � � � � � � � � � 76Constructional characteristics � � � � � � � � � � � � � � � � � � � � � � � � � � � � � � � � 77High-voltage winding � � � � � � � � � � � � � � � � � � � � � � � � � � � � � � � � � � � � � � � 78low-voltage winding � � � � � � � � � � � � � � � � � � � � � � � � � � � � � � � � � � � � � � � � 79
Choice of products 80
02
P o w e r b a l a n c e a n d c h o i c e o f P o w e r s u P P ly s o l u t i o n s
Power analysis
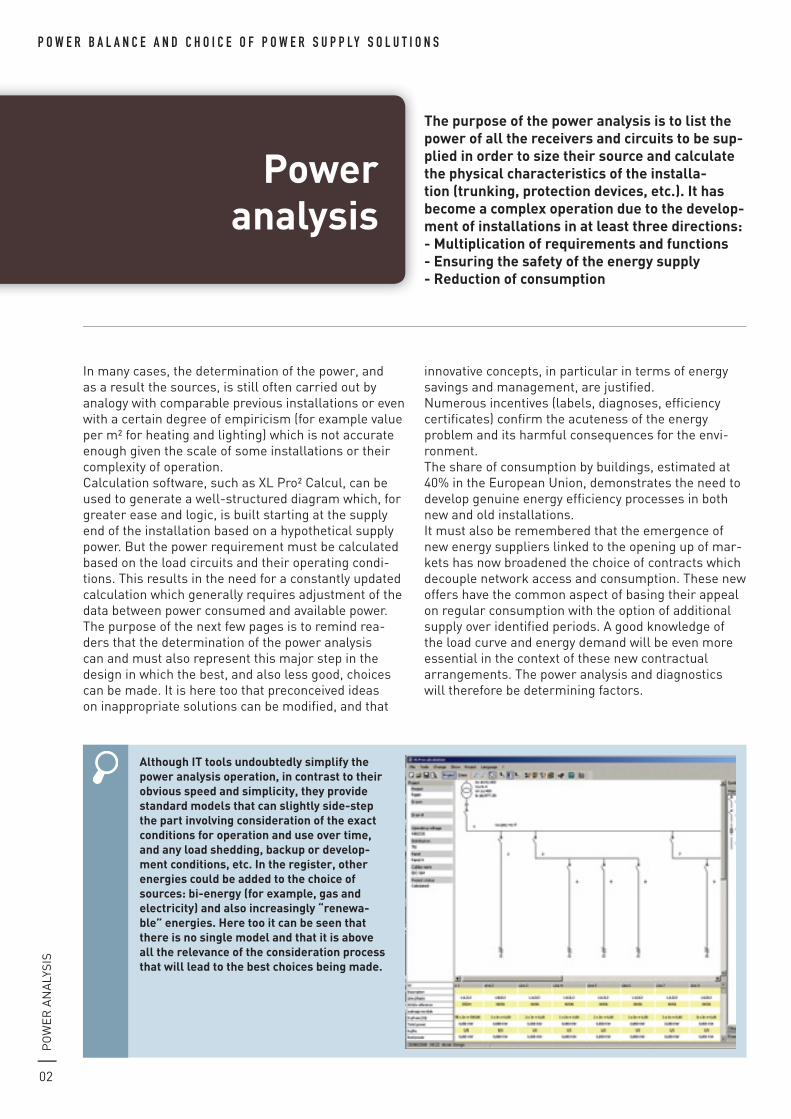
the purpose of the power analysis is to list the power of all the receivers and circuits to be sup-plied in order to size their source and calculate the physical characteristics of the installa-tion (trunking, protection devices, etc.). it has become a complex operation due to the develop-ment of installations in at least three directions:- Multiplication of requirements and functions - ensuring the safety of the energy supply- reduction of consumption
in many cases, the determination of the power, and as a result the sources, is still often carried out by analogy with comparable previous installations or even with a certain degree of empiricism (for example value per m² for heating and lighting) which is not accurate enough given the scale of some installations or their complexity of operation�Calculation software, such as xl Pro² Calcul, can be used to generate a well-structured diagram which, for greater ease and logic, is built starting at the supply end of the installation based on a hypothetical supply power� But the power requirement must be calculated based on the load circuits and their operating condi-tions� this results in the need for a constantly updated calculation which generally requires adjustment of the data between power consumed and available power�the purpose of the next few pages is to remind rea-ders that the determination of the power analysis can and must also represent this major step in the design in which the best, and also less good, choices can be made� it is here too that preconceived ideas on inappropriate solutions can be modified, and that
innovative concepts, in particular in terms of energy savings and management, are justified�Numerous incentives (labels, diagnoses, efficiency certificates) confirm the acuteness of the energy problem and its harmful consequences for the envi-ronment�the share of consumption by buildings, estimated at 40% in the European Union, demonstrates the need to develop genuine energy efficiency processes in both new and old installations�it must also be remembered that the emergence of new energy suppliers linked to the opening up of mar-kets has now broadened the choice of contracts which decouple network access and consumption� these new offers have the common aspect of basing their appeal on regular consumption with the option of additional supply over identified periods� A good knowledge of the load curve and energy demand will be even more essential in the context of these new contractual arrangements� the power analysis and diagnostics will therefore be determining factors�
although it tools undoubtedly simplify the power analysis operation, in contrast to their obvious speed and simplicity, they provide standard models that can slightly side-step the part involving consideration of the exact conditions for operation and use over time, and any load shedding, backup or develop-ment conditions, etc. in the register, other energies could be added to the choice of sources: bi-energy (for example, gas and electricity) and also increasingly “renewa-ble” energies. here too it can be seen that there is no single model and that it is above all the relevance of the consideration process that will lead to the best choices being made.
Po
wE
R A
NA
lYSi
S
NE
w iN
StA
llAt
ioN
S
03
new inStallationS
Main distribution
Secondary distribution
Terminal distribution
Terminal circuits
Terminal circuits
Proximity cabinet
* common name for panels
Terminal circuits
Direct application(s)
Direct application(s)
Main connection and distribution panel (Main LV distribution board)*
Distribution panel
Terminal panel(Modular consumer unit)*
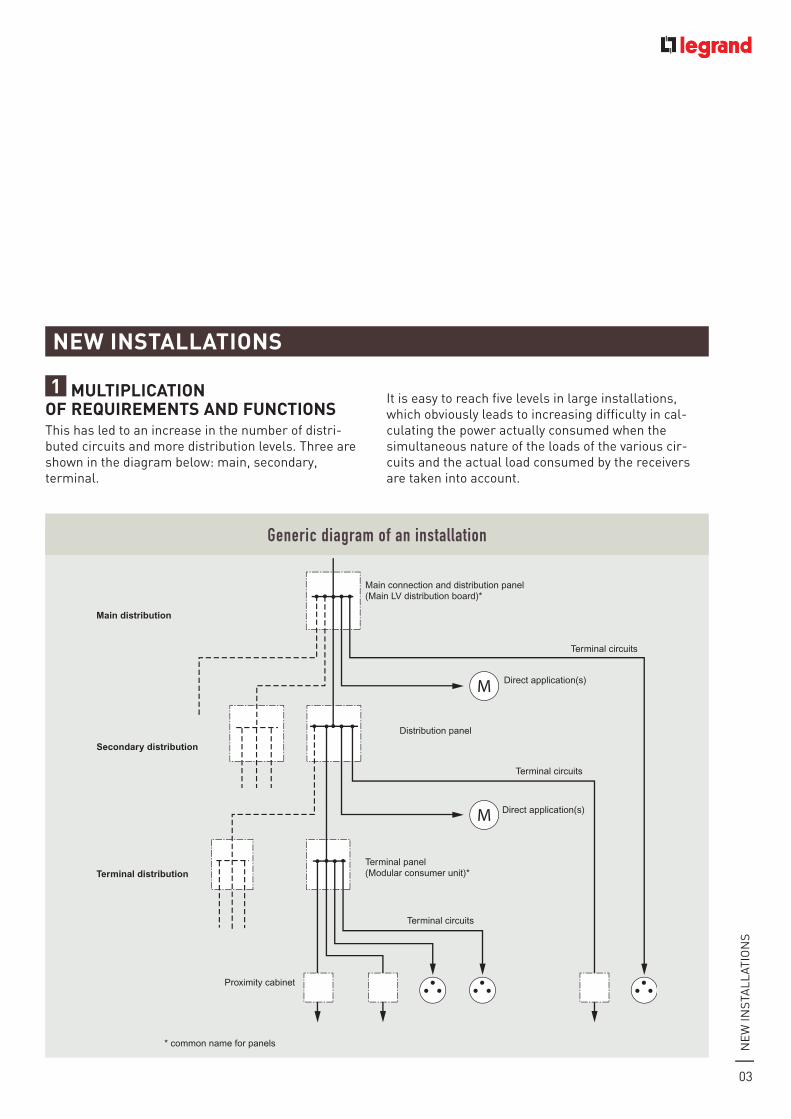
Generic diagram of an installation
1 MultiPliCation of requireMentS and funCtionS this has led to an increase in the number of distri-buted circuits and more distribution levels� three are shown in the diagram below: main, secondary, terminal�
it is easy to reach five levels in large installations, which obviously leads to increasing difficulty in cal-culating the power actually consumed when the simultaneous nature of the loads of the various cir-cuits and the actual load consumed by the receivers are taken into account�

04
P o w e r b a l a n c e a n d c h o i c e o f P o w e r s u P P ly s o l u t i o n sN
Ew
iNSt
All
Atio
NS
Power analysis (continued)
the french regulations on the thermal characteristics of buildings implementing article r111-20 of the Building Code became compulsory for new buildings and new parts of buildings, under the order of 29 november 2000, with the designation rt 2000. these regulations anticipated european directive 2002/91/eC published in January 2003, which is referred to as the “energy performance of buildings” directive.these purpose of these initial regulations was to limit energy consumption with reference to predetermined values with which the project manager should provide proof of compliance.this was calculated according to the conventional cli-matic data, adding together the amounts of energy consumed by the heating, air conditioning, hot water production and lighting. Solar gain and ventilation rates were also taken into consideration.rt 2005 has been in force since 1st September 2006. following on directly from rt 2000, it goes further
in terms of objectives (15%) for reduction of energy consumption. Bioclimatic design (direction buildings face), solar gain and protection are all assessed within this same energy reduction approach.the consumption of cooling systems must also be incor-porated, but as a counterpart, the regulations encourage the use of materials whose inertia favours comfortable temperatures in the summer.it also retains the principle of compensation between items to meet an overall objective. the use of renewable energies is promoted in the reference systems. they will doubtless be promoted even more in the next rt regula-tions due in 2010…
thermal regulations rt 2000 and rt 2005
Currents and active, reactive and apparent power must be calculated differently depending on whether motive power, heating or lighting is involved� Especially noti-ceable in industry, motors and inductive loads will in particular require consideration of the proportion of reactive power consumption in order to calculate the required compensation�in commercial installations, the extensive use of it (electronic power supplies) and “low consumption” lamps will require special calculation methods to take account of the additional power (known as distorting power) connected with the harmonics specific to this type of load� Compensation for these when they are in the majority may even require chokes in view of their overall capacitive characteristic�
2 enSuring Safety of SuPPlythis may be required gradually to keep the safety ser-vices for people in operation (alarms, lighting, etc�), and also those for the safety of property (fire extin-guishing systems, monitoring, critical processes), or even to ensure that the activity is kept fully or partially
in operation� in some sensitive installations (for example, data centres) it may be necessary go as far as completely duplicating the sources and power distribution circuits� if one of the circuits fails, the circuit that is still in service is then able to supply the two initial circuits� this is commonly referred to as “2+1”� A power analysis enabling the appropriate source to be chosen must be carried out for each ope-rating configuration: normal, backup, replacement�
3 SearCh for MiniMuM ConSuMPtion this must accompany every step in the definition, in particular when choosing the receivers and tech-nologies used� Not withstanding this “little by little” approach, the equation of the overall power to be pro-vided in relation to the possible energy sources will arise� How many will there be? How should they be distributed, switched, shed? Another analysis, that of the sources, must therefore be carried out�

05
Exi
StiN
G iN
StA
llAt
ioN
S
Although it is generally acknowledged that substantial energy savings are possible in most existing installa-tions, the process of achieving these savings is more complex than it may seem� Suggesting and implementing alternative lower consumption solutions (motors, high-efficiency transformers, energy compensation, low consump-tion lighting, etc�) and also installing regulation and automation systems (electrical control units, PlCs, intelligent management, etc�) are investments that have to be validated and justified by diagnostics based on relevant sets of readings requiring the necessary measuring apparatus (metering, instrumentation, recording of consumptions and events, etc�)� the “energy efficiency project” methodology must leave nothing to chance�
1 funCtion and requireMent: the diagnoStiC PhaSethe initial process consists of attempting to unders-tand how the electricity is consumed, irrespective of whether or not this is the only source of energy�what are the largest functions? How is the electricity used? if it is known exactly what the energy is used for, it may be possible to act at the source by making changes to the function itself�As a general rule, the preparatory phase of the project is based on work that is divided into two parts which are complementary but may sometimes be contradic-tory: a concrete, physical descriptive summary (the installation, the areas, the sources, the buildings, etc�) and a functional summary, which is often complex, as it is connected with human behaviour� its description must be intelligent, balanced and always prudent� we all forget to turn off a light sometimes� So while some types of behaviour may seem surprising, it is the cause we must investigate and not the consequence that must be pointed out�
1.1. descriptive summary the descriptive summary must first and foremost delineate and identify the main areas made up by the principal buildings (workshops, warehouses, store-rooms, etc�) or main sectors of the entity in question which are intended on the whole for a main function: manufacturing, offices, warehouses, etc�ideally sources which give rise to energy metering should be superimposed over these areas, with for example a source item or better still a consumption history� Failing this, appropriate measuring apparatus must be available at least during the diagnostic phase�the surface areas, number of floors, number of people present, and possibly other details such as the year of construction, and any element relating to the energy aspect (glazed areas, doors, structural components, etc�) must be specified in the descriptive summary�
eXiSting inStallationS
although it is right that heating and air conditioning account for a very large part of the energy consump-tion of buildings, in particular residential buildings (approximately 40% in europe), other energy-con-suming processes in the industrial field and also the commercial field may also be improved: motors, furnaces, electrolysis systems, and also lighting, it, refrigeration (in shops and warehouses), hot water production, etc. Some diagnostic studies have shown that energy consumption is hardly reduced at all during periods when premises are not occupied, even for long periods (sic). and generally this is not due to non public spirited behaviour, but quite simply systems that were not designed from the outset to incorporate energy optimi-sation aspects.
energy efficiency

06
P o w e r b a l a n c e a n d c h o i c e o f P o w e r s u P P ly s o l u t i o n s
All the activities in each area must be assessed in terms of electrical consumption� the main activity and secondary activities must be distinguished� the secon-dary activities may often be less secondary than they seem: for example a cafeteria that consumes more energy than the kitchens�the analysis of the energy company's bills will give an overview of the energy consumption (active and reactive) and the share of the fixed items (standing
charge and costs)� in some cases, the customer also has access to a consumption history and can therefore ascertain the power consumption profile according to the time (measured in 10 min intervals) or even the season� these two pieces of information will give an initial indication which will of course be general, but will already enable correlation with the operation of some high consumption items�
Exi
StiN
G iN
StA
llAt
ioN
S
Power analysis (continued)
distribution of the billed amount and consumption of the various buildings*
active energy
reactive energy
Miscellaneous costs
Standing charge
76.4 %
1.6 % 675 MWh15%
900 MWh20%
1125 MWh25%
1800 MWh40%
0.5 %
21.5 %
distribution of the billed amount distribution per building
76.4 %
1.6 % 675 MWh15%
900 MWh20%
1125 MWh25%
1800 MWh40%
0.5 %
21.5 %
total amount: 149,013 euros inc. tax
Building a
Building B
Building C
Building d
5 000
4 500
4 000
3 500
3 000
2 500
2 000
MW
h
1 2 3 4 5 6 7 8 9 10 111213 141516 17 180
Quantification of the changes in consumption at the site being examined*
years
over the years
1 2 3 4 5 6 7 8 9 10 11 12
7 000
6 000
5 000
4 000
3 000
2 000
1 000
0
off-peak times high-load times Peak times
Month
cons
umpti
on (k
wh/d
ay)
over one year
* imaginary values used for example purposes
07
Exi
StiN
G iN
StA
llAt
ioN
S
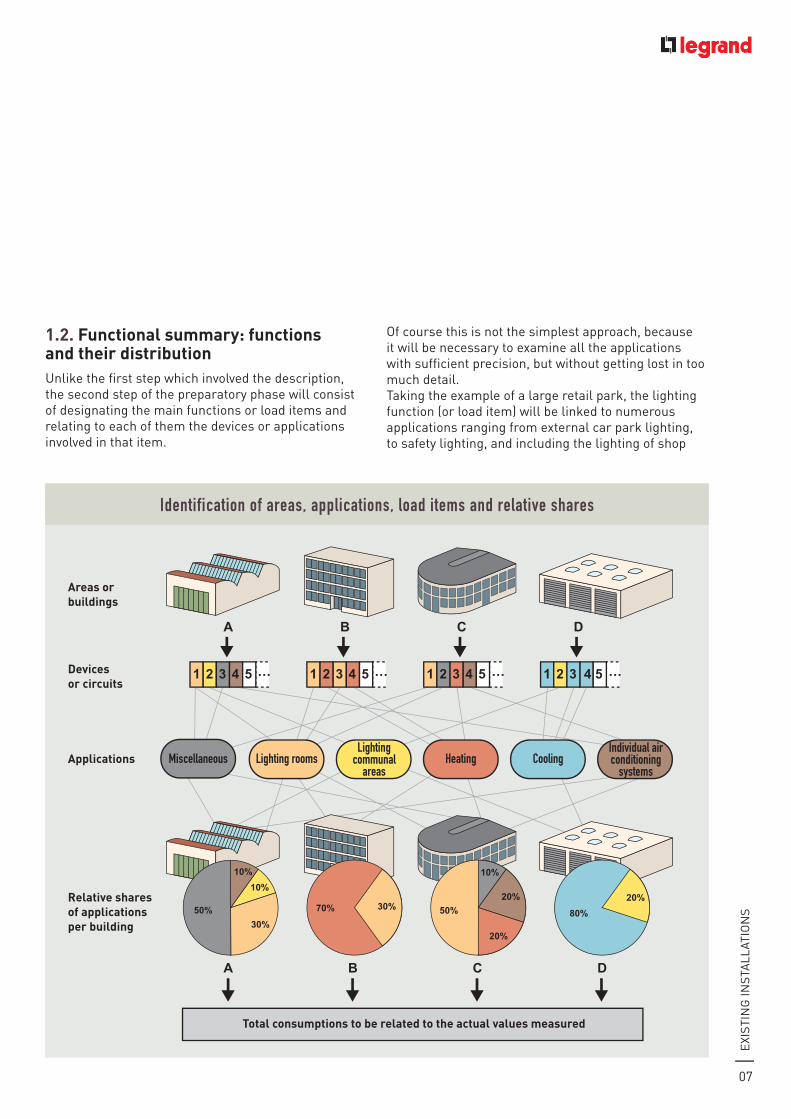
1.2. functional summary: functions and their distributionUnlike the first step which involved the description, the second step of the preparatory phase will consist of designating the main functions or load items and relating to each of them the devices or applications involved in that item�
of course this is not the simplest approach, because it will be necessary to examine all the applications with sufficient precision, but without getting lost in too much detail�taking the example of a large retail park, the lighting function (or load item) will be linked to numerous applications ranging from external car park lighting, to safety lighting, and including the lighting of shop
identification of areas, applications, load items and relative shares
A
30%
10%
50%
10%
30%70%
10%
20%
20%
50%20%
80%
1 2 3 4 5 … … … …1 2 3 4 5 1 2 3 4 5 1 2 3 4 5
B C D
A B C D
areas or buildings
devices or circuits
applications lighting roomslighting
communal areas
heating coolingindividual air conditioning
systems
total consumptions to be related to the actual values measured
relative shares of applications per building
Miscellaneous
08
P o w e r b a l a n c e a n d c h o i c e o f P o w e r s u P P ly s o l u t i o n sE
xiSt
iNG
iNSt
All
Atio
NS
Power analysis (continued)
windows, offices, corridors, shelves, storerooms, cloakrooms, etc� it can be seen immediately that the measurement of all the consumptions by all the appli-cations will reveal the challenge� Choices, sometimes arbitrary, must be made to select only high consump-tion applications or those which would a priori be wasteful�A few preliminary measurements could be necessary at this stage in order to decide on the advantage of carrying out a more in-depth diagnosis of a particular function�the relative share of each of these load items must then be allocated to each of the previously defined main areas� Some load items may match one area fairly exactly, while for others the area identified may have numerous functions whose relative share must assessed� this is usually the role of the power ana-lysis prior to a project, but in the case of an existing installation, it is the measurement that will provide information on this exact share�
the process shown in the example in the block dia-gram on the previous page can be used to determine the relative shares of each of the functions by area or by building� these shares must be related to the actual measured consumptions (see page 7)� it is thus possi-ble to establish relationships between the applications and the main consumptions� in the example described, it is for example important to understand why building B has a relative heating consumption share of 70% whereas building C, with an identical surface area, only has a 20% relative share� of course, numerous other questions must also be asked: - Comparison of the actual energy consumptions in kwh� - Understanding of why individual air conditioning units are installed in this building� is the solar gain perhaps much higher in building C? this could explain the lower heating demand but, as a counterpart, the cooling requirement� At this stage in the considerations, consultation of the consumptions according to the times of year could be revealing�
- Should better use be made of the solar gain, which is useful in winter but inconvenient in summer? individual air conditioning units are certainly not the right answer� Deflectors, awnings, a centralised air conditioning system or even changes to the hours during which the premises are occupied are all hypo-theses that should be explored�- the assumption that a large part of the heat is generated by the lighting (50% of the consumption of building C) must be precisely quantified� if all these questions do not provide satisfactory answers, it may be necessary to look for them in the characteristics of the buildings� is the insulation of building B adequate? Numerous causes can be investigated: aren't there abnormally high losses in the actual functioning of building B? the doors opening onto the loading bays are often open� it could be possible to consider asking users to close them, but if this has to be said ten times a day, the effectiveness of the measure is likely to be uncertain� other solutions such as air curtains or automatic closing systems should therefore be considered�the targeted identification of functions can be seen on this simple example, and their relative share in relation to the overall environment of the installation enables numerous questions to be asked, using a few figures (consumptions, monitoring, distribution, etc�)� Some often have logical answers: building D consumes 80% of the cooling� it is a cold store and fur-thermore its specific consumption is limited (relative share 15%)� it is accepted that it will not be subject to measurements in this initial diagnosis operation�Although evidence may appear on simple reading of the available consumption figures, it must be remembered that many points will only appear when additional information is collected: operating cycles, human occupation, local climatology, characteristics of the buildings, etc� which must be cross-referenced with the measurements taken on-site�the exact relative share of the functions/applications described in this diagram cannot generally be comple-ted until after measurements have been taken�
09
Exi
StiN
G iN
StA
llAt
ioN
S
2 ColleCtion of inforMation and taking MeaSureMentS
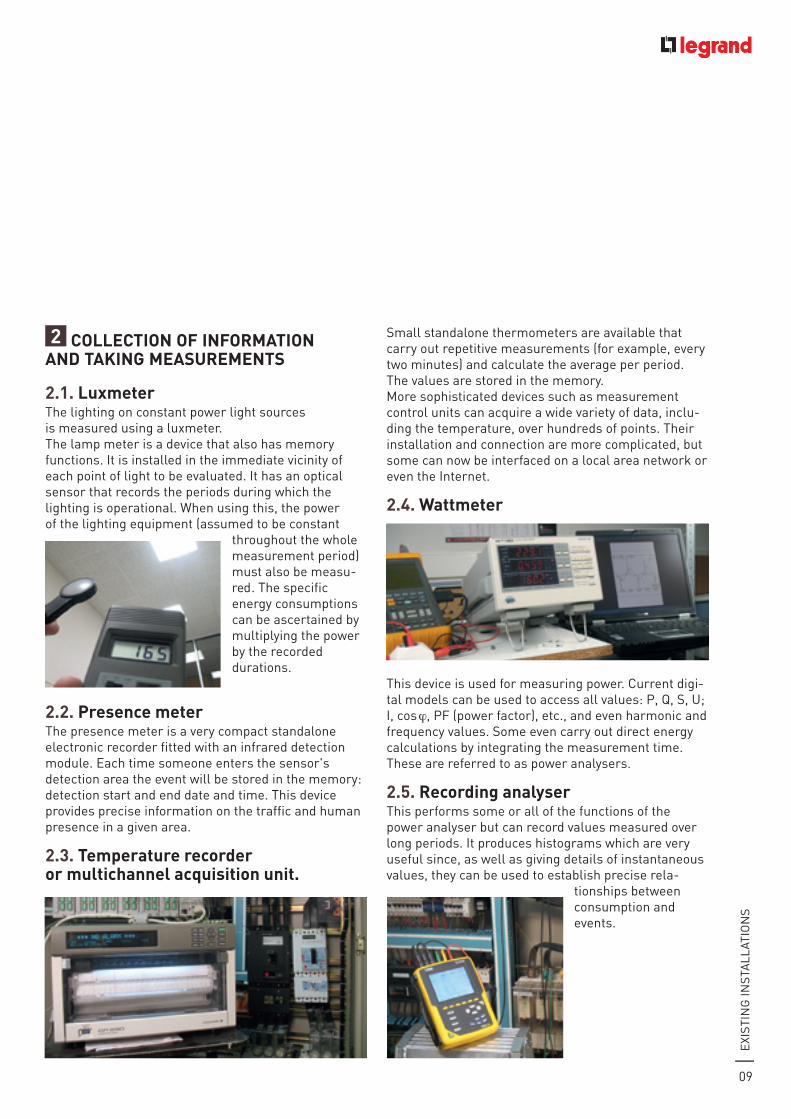
2.1. luxmeterthe lighting on constant power light sources is measured using a luxmeter�the lamp meter is a device that also has memory functions� it is installed in the immediate vicinity of each point of light to be evaluated� it has an optical sensor that records the periods during which the lighting is operational� when using this, the power of the lighting equipment (assumed to be constant
throughout the whole measurement period) must also be measu-red� the specific energy consumptions can be ascertained by multiplying the power by the recorded durations�
2.2. Presence meter the presence meter is a very compact standalone electronic recorder fitted with an infrared detection module� Each time someone enters the sensor's detection area the event will be stored in the memory: detection start and end date and time� this device provides precise information on the traffic and human presence in a given area�
2.3. temperature recorder or multichannel acquisition unit.
Small standalone thermometers are available that carry out repetitive measurements (for example, every two minutes) and calculate the average per period� the values are stored in the memory�More sophisticated devices such as measurement control units can acquire a wide variety of data, inclu-ding the temperature, over hundreds of points� their installation and connection are more complicated, but some can now be interfaced on a local area network or even the internet�
2.4. wattmeter
this device is used for measuring power� Current digi-tal models can be used to access all values: P, Q, S, U; i, cos ϕ, PF (power factor), etc�, and even harmonic and frequency values� Some even carry out direct energy calculations by integrating the measurement time�these are referred to as power analysers�
2.5. recording analyser this performs some or all of the functions of the power analyser but can record values measured over long periods� it produces histograms which are very useful since, as well as giving details of instantaneous values, they can be used to establish precise rela-
tionships between consumption and events�
10
P o w e r b a l a n c e a n d c h o i c e o f P o w e r s u P P ly s o l u t i o n sE
xiSt
iNG
iNSt
All
Atio
NS
Power analysis (continued)
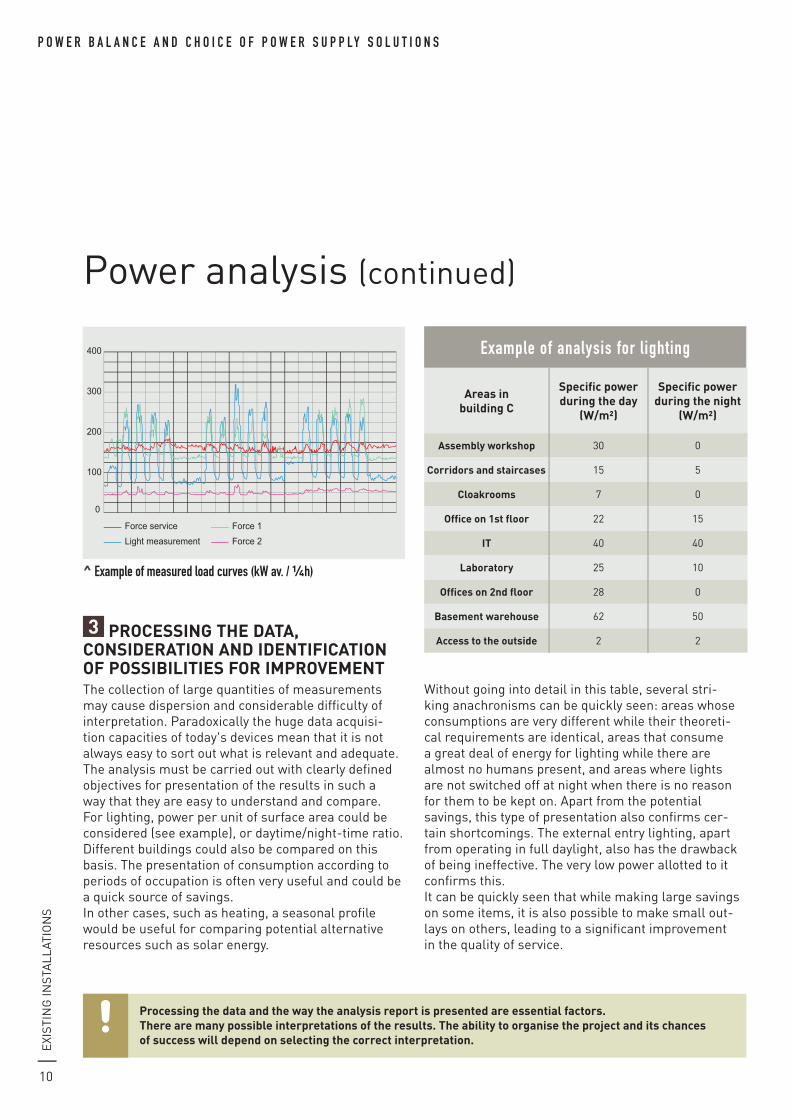
400
300
200
100
0
Force serviceLight measurement
Force 1Force 2
^ example of measured load curves (kw av. / 4h)
3 ProCeSSing the data, ConSideration and identifiCation of PoSSiBilitieS for iMProveMentthe collection of large quantities of measurements may cause dispersion and considerable difficulty of interpretation� Paradoxically the huge data acquisi-tion capacities of today's devices mean that it is not always easy to sort out what is relevant and adequate� the analysis must be carried out with clearly defined objectives for presentation of the results in such a way that they are easy to understand and compare� For lighting, power per unit of surface area could be considered (see example), or daytime/night-time ratio� Different buildings could also be compared on this basis� the presentation of consumption according to periods of occupation is often very useful and could be a quick source of savings�in other cases, such as heating, a seasonal profile would be useful for comparing potential alternative resources such as solar energy�
without going into detail in this table, several stri-king anachronisms can be quickly seen: areas whose consumptions are very different while their theoreti-cal requirements are identical, areas that consume a great deal of energy for lighting while there are almost no humans present, and areas where lights are not switched off at night when there is no reason for them to be kept on� Apart from the potential savings, this type of presentation also confirms cer-tain shortcomings� the external entry lighting, apart from operating in full daylight, also has the drawback of being ineffective� the very low power allotted to it confirms this�it can be quickly seen that while making large savings on some items, it is also possible to make small out-lays on others, leading to a significant improvement in the quality of service�
example of analysis for lighting
areas in building C
Specific power during the day
(w/m²)
Specific power during the night
(w/m²)
assembly workshop 30 0
Corridors and staircases 15 5
Cloakrooms 7 0
office on 1st floor 22 15
it 40 40
laboratory 25 10
offices on 2nd floor 28 0
Basement warehouse 62 50
access to the outside 2 2
Processing the data and the way the analysis report is presented are essential factors. there are many possible interpretations of the results. the ability to organise the project and its chances of success will depend on selecting the correct interpretation.

11
Exi
StiN
G iN
StA
llAt
ioN
S
4 iMPleMenting the iMProveMent ProJeCtFollowing on logically from the diagnostic phase, the implementation phase will be based on the analysis report whose relevance and readability will have a significant influence on the decisions that are taken on actions� the report must contain, in addition to a simplified description and block diagram of the ins-tallations, an outline of the energy analysis resulting from the measurements taken and the analysis of the consumption, and the identification of possible sources of savings�
4.1. Possible actionsAt this stage, the decision can be taken to either do nothing or to undertake improvement work� there are often as many possibilities for improvement as there is information collected, to such a point that there is a real risk of trying undertake too many things at once, just as there is a risk of confusion over the expected effectiveness of an action� it is therefore advisable to give an overall picture of the achievable improvement by subject and the associated cost involved�
example of presentation
Possible actions Saving(1) Cost(2)
raising staff awareness 1 to 3% low 1000€
Changes to opening times 2 to 6% low 1500€
optimisation of operating modes 5% Negligible
improvement of regulation 5 to 12% Average 15000€
high efficiency receivers and applications (motors, furnaces, etc.)
15 to 20% High 40000€
Changing heating boilers 8 to 15% High 180000€
drawing up a lighting plan 10 to 20%
Not costed (totally
separate project)
energy management (measurement, management, forecasting, purchase, etc.)
10 to 15% Average 10000€
improvement of electrical quality (power factor, harmonics)
2% Average 8000€
(1) in comparison with a reference consumption which is to be specified (for example, average over the last 3 years)(2) low, medium or high, or if possible a more precise value
- is it justified for it to operate in this time slot? - is there an alternative solution that uses less energy? - is it absolutely essential? - is it possible to change the opening times?one may imagine that it would therefore be possible to fulfil the same requirements with much less energy, and with a lower power demand. this very innovative approach has already been successfully applied to other types of buildings.the consideration and questioning phase, which must lead to the examination of existing information, is essen-tial. there are numerous problem-solving methods that could be of use here: “selecting, researching (brainstor-
ming), classifying (compatibility table)”, five ws and h, cause and effect diagram, Pareto principle, etc.understanding consumption, but not overlooking interference.this analytical work must also enable the quality of the current circulating in the building to be studied. Current functions often have a significant impact on the shape and quality of the current, on which they have an adverse effect, in particular with the presence of a great deal of harmonics. this can disturb the operation of certain functions, or lead to the over-sizing of some equipment. it is therefore important to understand this too, in order to act in an appropriate way.
Questioning phase
P o w e r b a l a n c e a n d c h o i c e o f P o w e r s u P P ly s o l u t i o n s
12
Decisions can then be taken on various actions� they must be connected with a reference subject� Plainly, low cost operations should be undertaken quickly, even if the resulting savings are small�
Exi
StiN
G iN
StA
llAt
ioN
S
Power analysis (continued)
4.2. recommendation and presentation of actionsthe recommended actions should be presented with a precise description of the application in question and the reference subject as just mentioned, supporting an energy cost justification based on the measurement phase, and proposing a replacement or improvement solution� the investment cost, and if required the maintenance cost, together with the resulting potential energy savings and cost savings must be presented in the form of a financial analysis with a cost-benefit calculation� if the benefits and savings are identified, specific conditions for success may be specified� these may be for example the agreement of the staff (provide the appropriate information), informing custo-mers (opening times), equipment requirements (direct high voltage power supply for very large motors, etc�), re-sizing of the networks (change of energy, etc�), etc�information on advantages in terms of efficiency, emission of greenhouse gases, and actual cost accor-ding to life cycle, will lead to a better understanding of the challenges of the envisaged action�the recommended actions can be presented together with the diagnostic report, but as a general rule it will be preferable to keep the two phases (diagnostic and improvement project) separate, as they will require different skills� Although external consultants or an inspection body can be used for the former, the latter will only be successful in the long term if the human and financial commitment is actually made by those in the company�one solution would be to draw up “project sheets” together, which would have the advantage of defi-ning an action and establishing it in terms of costed objectives� it is better to establish a few well-targeted actions that are well-executed through to their conclu-sion than huge numbers of recommendations most of which will come to nothing� Although its effectiveness is limited in energy terms, a key action that should in practice be included in all projects is the setting up of a permanent system
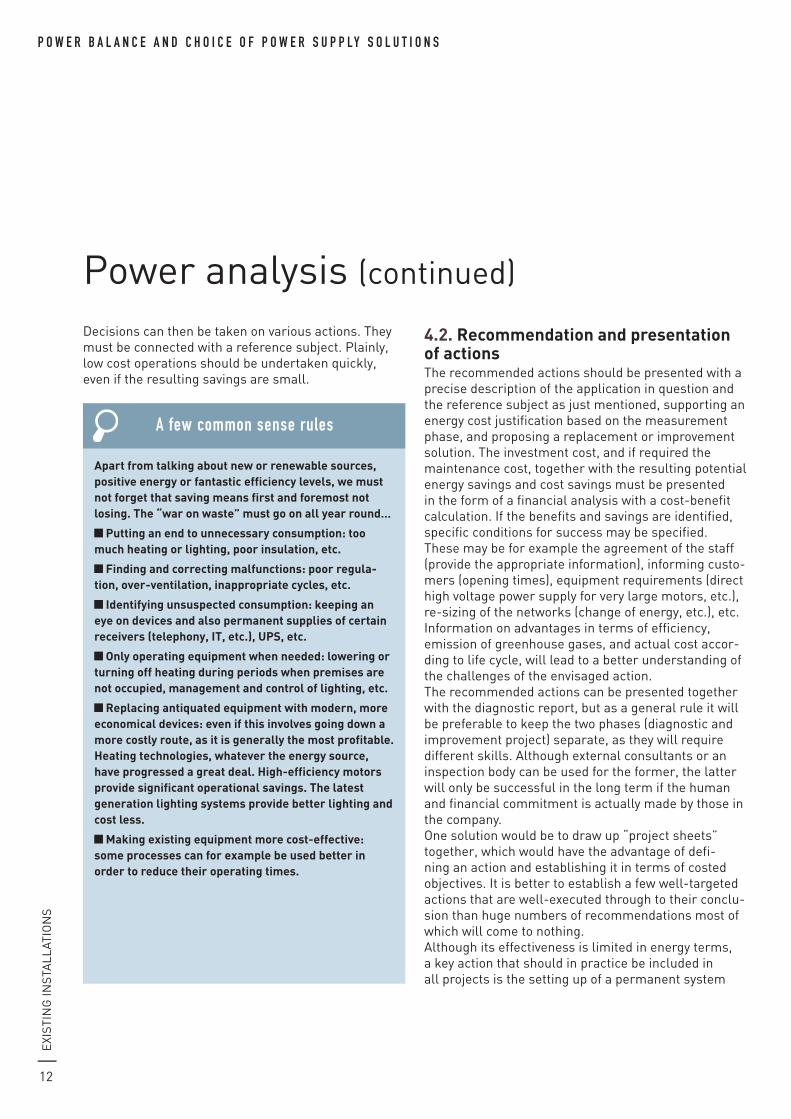
apart from talking about new or renewable sources, positive energy or fantastic efficiency levels, we must not forget that saving means first and foremost not losing. the “war on waste” must go on all year round…
Putting an end to unnecessary consumption: too much heating or lighting, poor insulation, etc.
finding and correcting malfunctions: poor regula-tion, over-ventilation, inappropriate cycles, etc.
identifying unsuspected consumption: keeping an eye on devices and also permanent supplies of certain receivers (telephony, it, etc.), uPS, etc.
only operating equipment when needed: lowering or turning off heating during periods when premises are not occupied, management and control of lighting, etc.
replacing antiquated equipment with modern, more economical devices: even if this involves going down a more costly route, as it is generally the most profitable. heating technologies, whatever the energy source, have progressed a great deal. high-efficiency motors provide significant operational savings. the latest generation lighting systems provide better lighting and cost less.
Making existing equipment more cost-effective: some processes can for example be used better in order to reduce their operating times.
a few common sense rules
13
Exi
StiN
G iN
StA
llAt
ioN
S
of measurement to establish indisputable reference values in terms of auditing, monitoring and impro-vement� Any deviations from the actions undertaken can then be corrected� the measurements will also provide a documented source of information that is relevant and customised, making it easier for all those concerned to accept the process�
5 CheCking and MonitoringHaving implemented the recommended actions, the effectiveness of the result can only be guaranteed if it is measured and checked� this is a prerequisite for contractual obligations� on small installations, measurement devices can be simple (index meters) and readings can be taken manually, but as soon as the size or number of consumption points increase, full energy management systems combining measure-ment and management are more suitable� these use appropriate computer software which makes it pos-sible to directly establish load profiles, consumption curves and carry out any required processing�An equipment step, which also makes it possible to move from measurement to energy management and to consider qualification actions such as “Energy Efficiency Certificates” (CEE in France) or “Energy Performance Contracts” in the context of Public Private Partnership Contracts (PPP) applicable for example to housing stock�
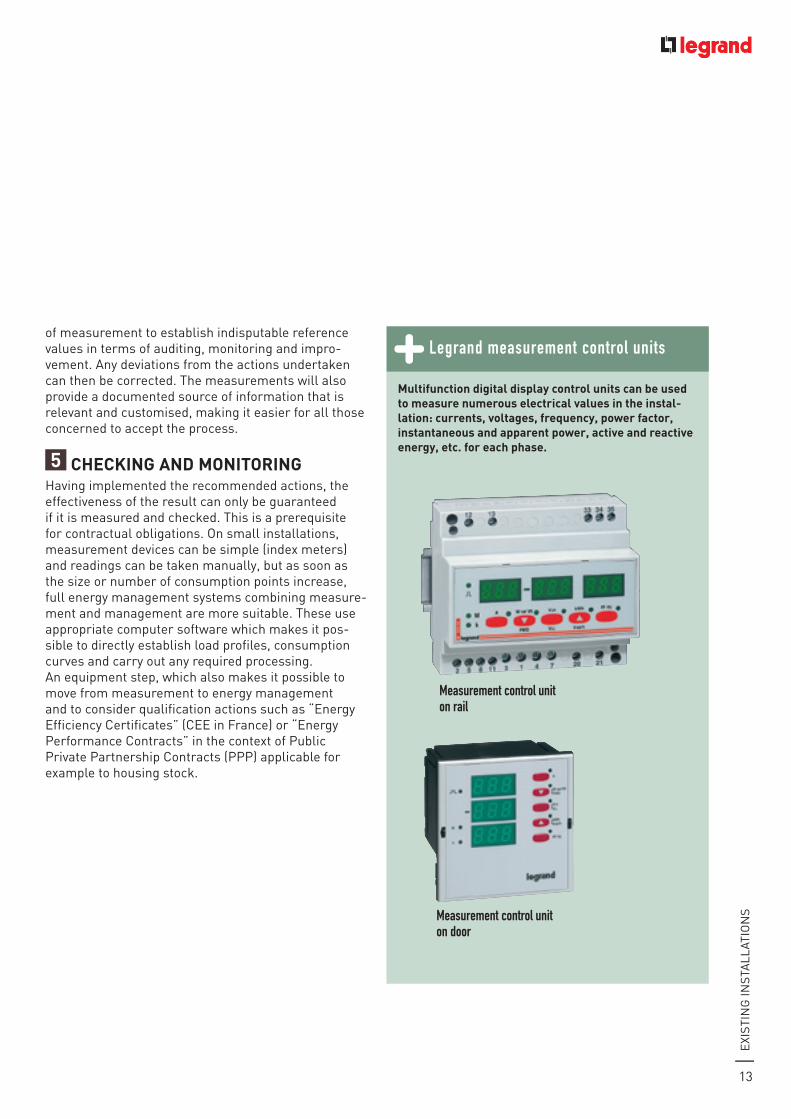
Multifunction digital display control units can be used to measure numerous electrical values in the instal-lation: currents, voltages, frequency, power factor, instantaneous and apparent power, active and reactive energy, etc. for each phase.
legrand measurement control units
Measurement control unit on rail
Measurement control unit on door
AN
AlY
SiS
oF
tHE
lo
AD
S, C
AlC
UlA
tio
N o
F tH
E C
UR
RE
NtS
, Po
wE
R o
F tH
E S
oU
RC
E
14
P o w e r b a l a n c e a n d c h o i c e o f P o w e r s u P P ly s o l u t i o n s
Power analysis (continued)
analySiS of the loadS, CalCulation of the CurrentS, Power of the SourCe
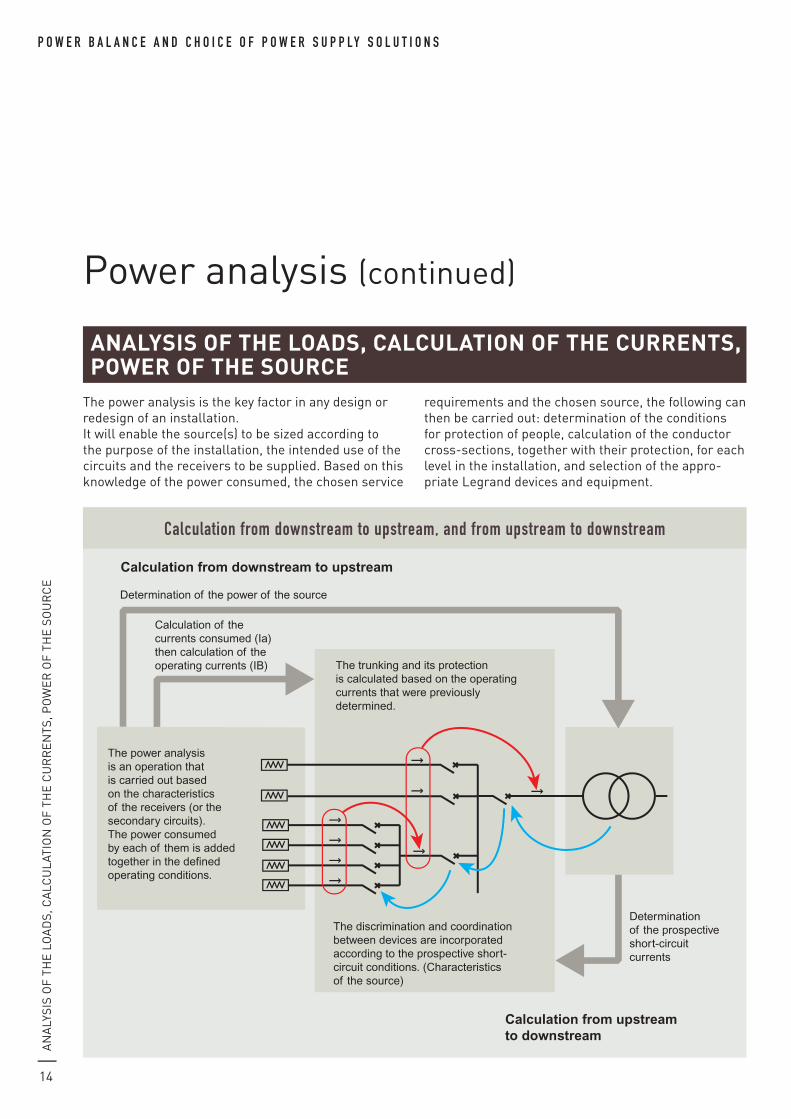
Calculation from downstream to upstream
Calculation from upstream to downstream
The power analysis is an operation that is carried out based on the characteristics of the receivers (or the secondary circuits). The power consumed by each of them is added together in the defined operating conditions.
Calculation of the currents consumed (Ia) then calculation of the operating currents (IB)
Determination of the prospective short-circuit currents
Determination of the power of the source
The trunking and its protection is calculated based on the operating currents that were previously determined.
The discrimination and coordination between devices are incorporated according to the prospective short-circuit conditions. (Characteristics of the source)
calculation from downstream to upstream, and from upstream to downstream
the power analysis is the key factor in any design or redesign of an installation� it will enable the source(s) to be sized according to the purpose of the installation, the intended use of the circuits and the receivers to be supplied� Based on this knowledge of the power consumed, the chosen service
requirements and the chosen source, the following can then be carried out: determination of the conditions for protection of people, calculation of the conductor cross-sections, together with their protection, for each level in the installation, and selection of the appro-priate legrand devices and equipment�

AN
AlY
SiS
oF
tHE
lo
AD
S, C
AlC
UlA
tio
N o
F tH
E C
UR
RE
NtS
, Po
wE
R o
F tH
E S
oU
RC
E
15
1 analySiS of the loadS the loads supplied by the electrical installation can be of various types depending on the business: motive power, variable control units, lighting, it, heating, etc� Depending on the individual case, the electrical operating parameters (phase shift, efficiency, inrush transients, harmonics, etc�) will be different� the power to be considered is not limited to the simple reading of a value in watts� Reactive power (inductive loads) and also distorting power (loads consuming a non-sinusoidal current) must be included and may have a significant adverse effect on the energy effi-ciency of the receivers in question� An observation that will lead to “compensating” for these unnecessary and non-recoverable losses, which are also costly, using compensation measures such as capacitors or filters� this is covered in greater detail on pages 16 to 25�
2 CalCulation of the CurrentSthis is the operation that associates the analysis of the loads with the determination of the power of the source� the calculation of the currents is also essen-tial for determining the conductors and protection devices (see book 4 “Sizing conductors and selec-ting protection devices”)� in the context of the power analysis, this calculation takes account of the whole installation and its operating conditions (load factor, simultaneous operation of the various circuits) while incorporating the characteristics of each receiver (efficiency, cos ϕ)� this is covered in greater detail on pages 26 to 28�
3 CalCulation of the Power aCCording to the tyPeS of load it is not possible to calculate all power in the same way, as they are of differing types (resistive, inductive, distorting)� Practical examples are given on pages 29 to 43�
4 Power of the SourCe the power of the source can generally be sized at a much lower value than the sum of the power of all the receivers� this is the main objective of the power analysis� the determination of the optimum and adequate power of the source or sources is an operation that can have considerable consequences in terms of relia-bility and operating cost�it generally involves an HV/lV transformer for which it must be remembered that undersizing may result in virtually continuous operation at full load or even overload, which can cause premature ageing of the insulation as well as the risk of tripping and more or less lengthy stoppage� on the other hand, oversizing involves excessive expenditure and unnecessary no-load losses� However, on-load losses my be significantly reduced if the continuous load is high� See “Selection of sour-ces” page 44�
historically, energy compensation applied to producing reactive power compensation by capacitor banks. the ever-increasing presence of harmonics in installations now requires the installation of more or less sophisticated filters (legrand solutions).here too, however, an installation that has been carefully designed, choosing high quality equipment and receivers, will significantly limit these phenomena that are costly in terms of both energy (billing of non active power) and sizing (higher ratings and larger cross-sections), as well harming reliability (premature ageing) and being polluting for all users of the electricity supply.
An
Aly
sis
of
the
lo
Ad
s
16
P o w e r b a l a n c e a n d c h o i c e o f P o w e r s u P P ly s o l u t i o n s
Power analysis (continued)
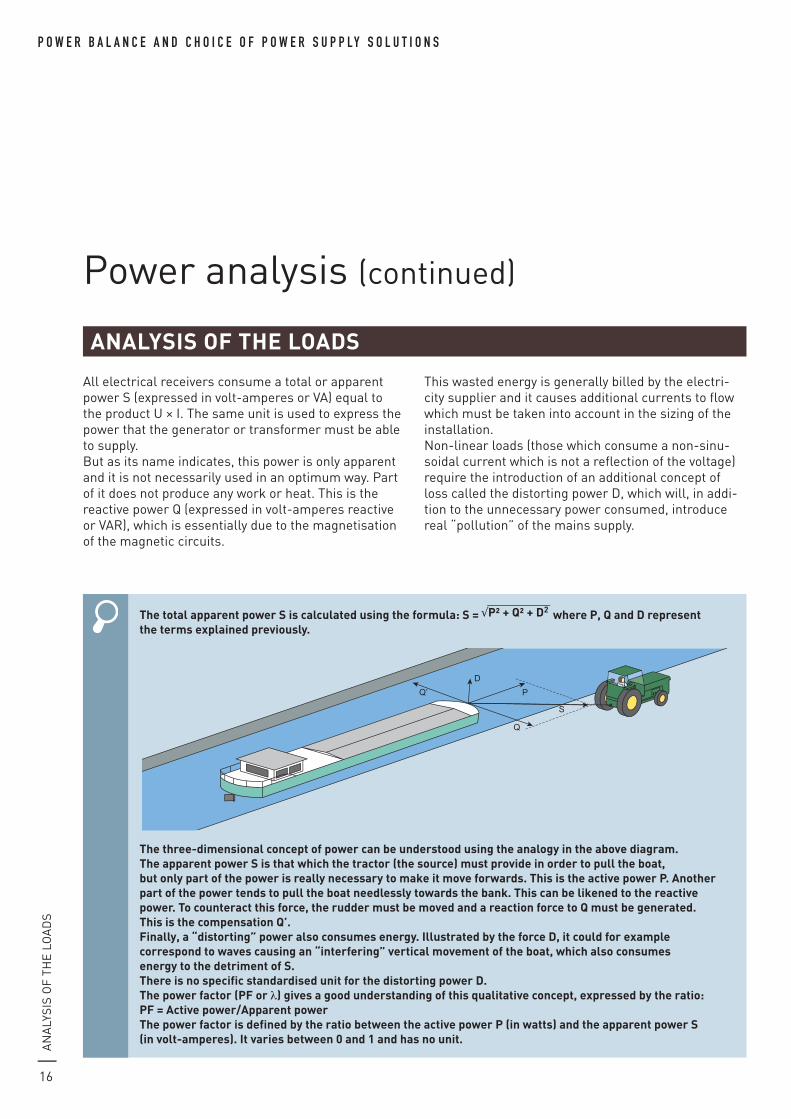
All electrical receivers consume a total or apparent power s (expressed in volt-amperes or VA) equal to the product U x i. the same unit is used to express the power that the generator or transformer must be able to supply.But as its name indicates, this power is only apparent and it is not necessarily used in an optimum way. Part of it does not produce any work or heat. this is the reactive power Q (expressed in volt-amperes reactive or VAR), which is essentially due to the magnetisation of the magnetic circuits.
this wasted energy is generally billed by the electri-city supplier and it causes additional currents to flow which must be taken into account in the sizing of the installation. non-linear loads (those which consume a non-sinu-soidal current which is not a reflection of the voltage) require the introduction of an additional concept of loss called the distorting power d, which will, in addi-tion to the unnecessary power consumed, introduce real “pollution” of the mains supply.
AnAlysis of the loAds
the total apparent power s is calculated using the formula: s = √P² + Q² + d2 where P, Q and d represent
the terms explained previously.
the three-dimensional concept of power can be understood using the analogy in the above diagram. the apparent power s is that which the tractor (the source) must provide in order to pull the boat, but only part of the power is really necessary to make it move forwards. this is the active power P. Another part of the power tends to pull the boat needlessly towards the bank. this can be likened to the reactive power. to counteract this force, the rudder must be moved and a reaction force to Q must be generated. this is the compensation Q’.finally, a “distorting” power also consumes energy. illustrated by the force d, it could for example correspond to waves causing an “interfering” vertical movement of the boat, which also consumes energy to the detriment of s.there is no specific standardised unit for the distorting power d.the power factor (Pf or λ) gives a good understanding of this qualitative concept, expressed by the ratio:Pf = Active power/Apparent powerthe power factor is defined by the ratio between the active power P (in watts) and the apparent power s (in volt-amperes). it varies between 0 and 1 and has no unit.
Q
Q’
S
P
D
An
Aly
sis
of
the
lo
Ad
s
17
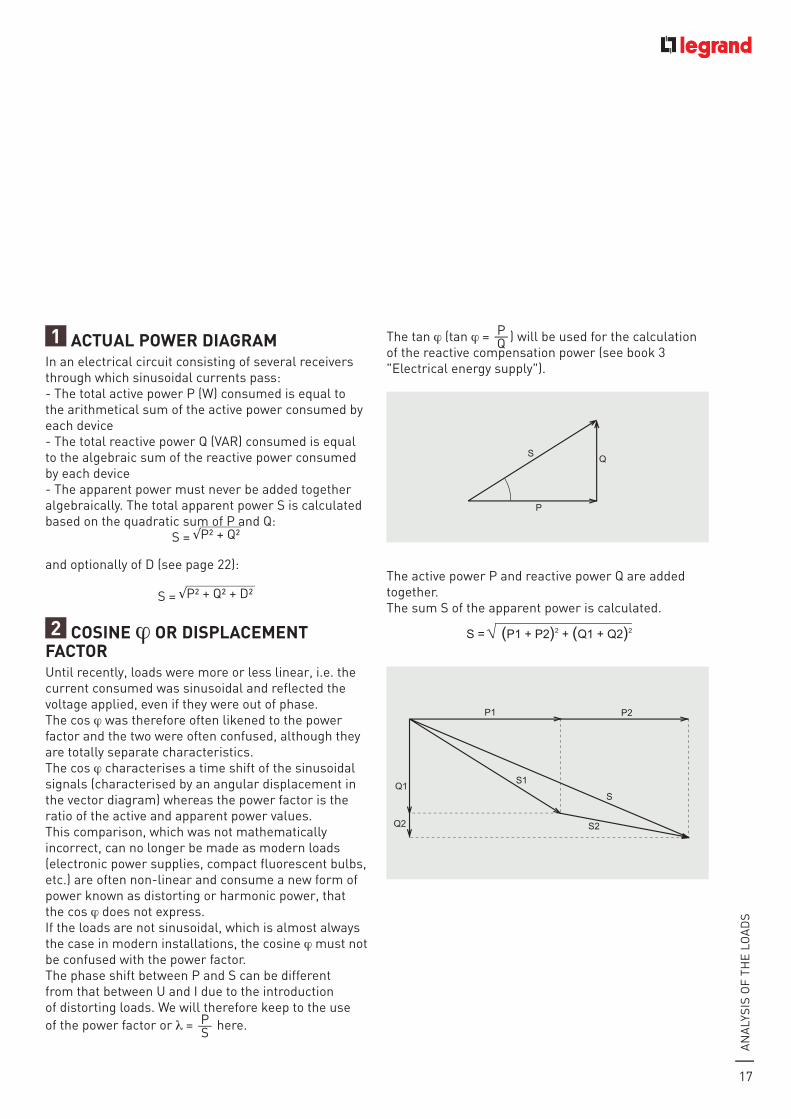
1 ActuAl Power diAgrAmin an electrical circuit consisting of several receivers through which sinusoidal currents pass:- the total active power P (W) consumed is equal to the arithmetical sum of the active power consumed by each device- the total reactive power Q (VAR) consumed is equal to the algebraic sum of the reactive power consumed by each device- the apparent power must never be added together algebraically. the total apparent power s is calculated based on the quadratic sum of P and Q:
s = √P² + Q²
and optionally of d (see page 22):
s = √P² + Q² + d²
2 cosine ϕ or disPlAcement fActor Until recently, loads were more or less linear, i.e. the current consumed was sinusoidal and reflected the voltage applied, even if they were out of phase.the cos ϕ was therefore often likened to the power factor and the two were often confused, although they are totally separate characteristics. the cos ϕ characterises a time shift of the sinusoidal signals (characterised by an angular displacement in the vector diagram) whereas the power factor is the ratio of the active and apparent power values.this comparison, which was not mathematically incorrect, can no longer be made as modern loads (electronic power supplies, compact fluorescent bulbs, etc.) are often non-linear and consume a new form of power known as distorting or harmonic power, that the cos ϕ does not express.if the loads are not sinusoidal, which is almost always the case in modern installations, the cosine ϕ must not be confused with the power factor. the phase shift between P and s can be different from that between U and i due to the introduction of distorting loads. We will therefore keep to the use of the power factor or λ = P
s here.
the tan ϕ (tan ϕ = PQ ) will be used for the calculation
of the reactive compensation power (see book 3"electrical energy supply").
the active power P and reactive power Q are added together. the sum s of the apparent power is calculated.
S = (P1 + P2)2 + (Q1 + Q2)2
SQ
P
SQ
Q'
P
'
P1
S2
S1Q1
Q2
S
P2
SQ
P
SQ
Q'
P
'
P1
S2
S1Q1
Q2
S
P2
An
Aly
sis
of
the
lo
Ad
s
18
P o w e r b a l a n c e a n d c h o i c e o f P o w e r s u P P ly s o l u t i o n s
Power analysis (continued)
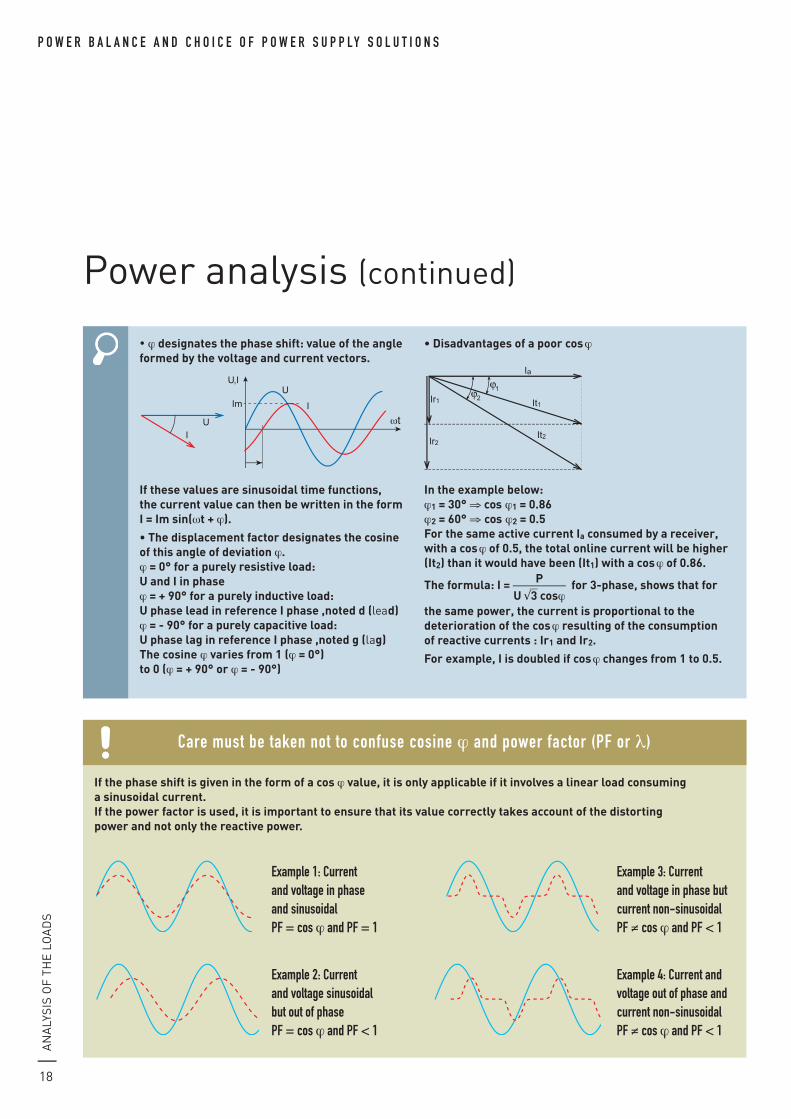
if the phase shift is given in the form of a cos ϕ value, it is only applicable if it involves a linear load consuming a sinusoidal current.if the power factor is used, it is important to ensure that its value correctly takes account of the distorting power and not only the reactive power.
care must be taken not to confuse cosine ϕ and power factor (Pf or λ)
example 1: current and voltage in phase and sinusoidal Pf = cos ϕ and Pf = 1
example 2: current and voltage sinusoidal but out of phase Pf = cos ϕ and Pf < 1
example 3: current and voltage in phase but current non-sinusoidal Pf = cos ϕ and Pf < 1
example 4: current and voltage out of phase and current non-sinusoidal Pf = cos ϕ and Pf < 1
• ϕ designates the phase shift: value of the angle formed by the voltage and current vectors.
if these values are sinusoidal time functions, the current value can then be written in the form i = im sin(ωt + ϕ).
• The displacement factor designates the cosine of this angle of deviation ϕ.ϕ = 0° for a purely resistive load: u and i in phaseϕ = + 90° for a purely inductive load: u phase lead in reference i phase ,noted d (lead)ϕ = - 90° for a purely capacitive load: u phase lag in reference i phase ,noted g (lag)the cosine ϕ varies from 1 (ϕ = 0°) to 0 (ϕ = + 90° or ϕ = - 90°)
• Disadvantages of a poor cos ϕ
in the example below: ϕ1 = 30° ⇒ cos ϕ1 = 0.86 ϕ2 = 60° ⇒ cos ϕ2 = 0.5for the same active current ia consumed by a receiver, with a cos ϕ of 0.5, the total online current will be higher (it2) than it would have been (it1) with a cos ϕ of 0.86.
the formula: i = Pu √3 cosϕ
for 3-phase, shows that for
the same power, the current is proportional to the deterioration of the cos ϕ resulting of the consumption of reactive currents : ir1 and ir2.
for example, i is doubled if cos ϕ changes from 1 to 0.5.
U
I
It1Ir1
Ia
It2Ir2
2
1U,I
U
IIm
ωtUI

An
Aly
sis
of
the
lo
Ad
s
19
3 the origin And nAture of hArmonicsin electrical networks, the voltage and current wave-forms are not purely sinusoidal. this distortion is due to the presence of loads with non-linear characteris-tics. these loads consume non-sinusoidal currents thus causing a distortion of the current wave. the greater the number of non-linear receivers, the higher the distorted currents and the more visible the effect on the voltage wave, thus causing deterioration in the quality of the energy distributed (see book 3 "electrical energy supply")
3.1. current harmonics and voltage harmonics there are two types of harmonic wave: the current wave and the voltage wave. At the origin, devices with non-linear circuits distort the fundamental current
in order to quantify and represent these phenomena, a mathematical calculation called “fourier analysis” is used. this enables any periodic signal to be represented in the form of the sum of a fundamental wave and additio-nal waves, the harmonics, whose frequency is a multiple of the fundamental.there are even-order and odd-order harmo-nics. odd-order harmonics are frequently found in electrical networks. even-order harmonics cancel each other out due to the symmetry of the signal.
100
80
50 100 150 200 250 300 350
60
40
20
0
Module (%)
Frequency(Hz)
spectral decomposition of a signal into frequencies
and generate harmonic currents.these currents, circulating in the installation, cross impedances and cause harmonic voltages. it is the total harmonic distortion of the voltage wave that will be used to define the degree of pollution of the instal-lation. on the other hand, it is the measurement of the total harmonic distortion of the current wave that is used to detect the sources that are at the origin of this pollution.
the distorted wave is represented mathematically by the “fundamental” wave at a frequency of 50 hz, on which a certain number of sinusoidal waves are superimposed, each with a frequency that is a multi-ple of that of the fundamental wave. these waves are called harmonic waves. they are identified by their order (integer) which is the ratio between their frequency and the fundamental frequency:they are defined by their amplitude in relation to the fundamental wave.
order = ƒharmonicƒfundamental
several measurements are used to characterise the distortion of the signal. the harmonics can be expressed order by order, for voltage or current, as a percentage of the fundamental frequency value or as a real value. the most commonly used value is the total harmonic distortion (thd), which is calculated based on the sum of all the orders. this single figure, giving the measurement of the thermal effect of all the harmonics, is used for making comparisons or to assess the direct impact on receivers.
Rang =ƒharmonique
ƒfondamentale
THD = A22 + A3
2 + ...+ Ai2 + ...+ An
2
A1
′ Q = P(tanϕ − 0,4)
tan ϕ = WpVAr Q
tan ϕ = QP
P = Wpt
P = U I 3cos ϕ
tan ϕ = 1cos ϕ −1
I = P3 cosU ϕ
IB = Q x 1000 x K3U
A1 being the rms value of the fundamental and Ai the rms value of the ith order harmonic.the root mean square (rms) or quadratic mean is the expression of the square root of the mean of the squares of a quantity of values gived by a continously varying function, eg. sinusoïd.
characterisation of the distortion
An
Aly
sis
of
the
lo
Ad
s
20
P o w e r b a l a n c e a n d c h o i c e o f P o w e r s u P P ly s o l u t i o n s
Most loads connected to the network are symmetrical (the current half-waves are equal and opposite). the total even-order harmonic distortion is generally zero.three-phase, balanced, symmetrical, non-linear loads, with no connection to the neutral do not gene-rate any 3rd order harmonics, or any harmonic orders that are multiples of 3. these cancel each other out in the triangular load circuit.
three-phase, balanced, symmetrical, non-linear loads, with connection to the neutral generate 3rd order harmonic currents and harmonic currents in the neutral conductor in orders that are multiples of 3, which are added together arithmetically. the rms value of the neutral current can therefore be greater than that of the phase current and can theoretically reach √3
− times the value of the current in one phase.
to remedy the overload of the neutral conductor, the simplest solution is to increase the cross-section of this conductor (doubling it) from a certain level of harmonic distortion. (see page 31) other solutions would be to use zigzag connection reactors or harmonic filters tuned to the third order harmonic.
3.2. elements that generate harmonicshistorically, harmonics (3rd order and its multiples) were mainly due to saturation of the magnetic circuits and were very limited.the advent of single-phase diode rectifiers with capacitor filters had significantly increased the level of 3rd order harmonics, which can reach 80% of the fundamental.numerous modern devices generate harmonics of many different orders. these include the following (non-exhaustive list):- All devices with a single-phase rectified supply followed by switching (3rd, 5th and 7th orders): tVs, computers, faxes, lamps with electronic ballast, etc.- single-phase AC power controllers using variation of the phase angle (3rd, 5th and 7th orders): variable control units, controllers, starters, etc.- equipment using arcs (3rd and 5th orders): furnaces, welding, etc.- thyristor power rectifiers (5th and 7th orders): power supplies for variable speed motors, furnaces, UPs, etc.- Machines with magnetic circuits, if the circuit is saturated (3rd order): transformers, motors. etc.- Controlled arc lighting devices (3rd order): lamps with electromagnetic ballast, high pressure vapour lamps, fluorescent tubes, etc.
Power analysis (continued)
Model 7100 350.0 V
Three Phase Delta 250.0 A
-350.0 V 0 sec
-250.0 A20.00 ms
0.0 A 0.0 V
Snapshot Waveform
1000.00 us / div
2
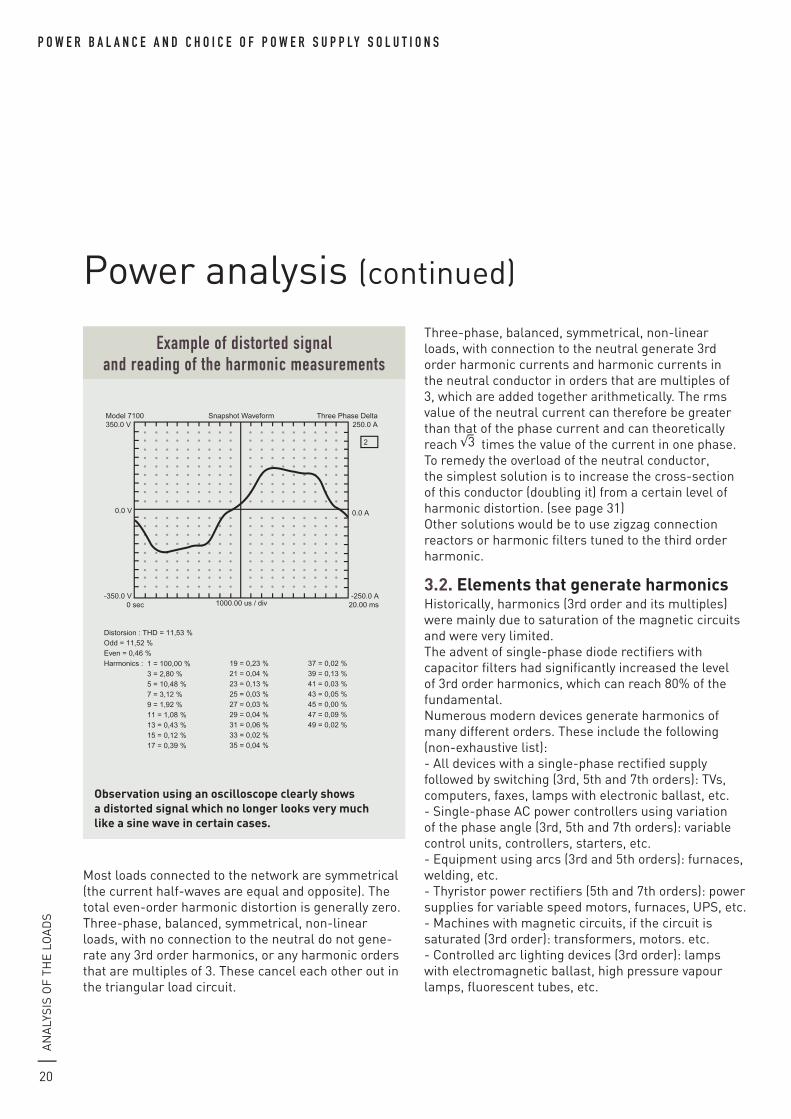
Distorsion : THD = 11,53 % Odd = 11,52 % Even = 0,46 % Harmonics : 1 = 100,00 %
3 = 2,80 % 5 = 10,48 % 7 = 3,12 % 9 = 1,92 % 11 = 1,08 % 13 = 0,43 % 15 = 0,12 % 17 = 0,39 %
19 = 0,23 % 21 = 0,04 % 23 = 0,13 % 25 = 0,03 % 27 = 0,03 % 29 = 0,04 % 31 = 0,06 % 33 = 0,02 % 35 = 0,04 %
37 = 0,02 % 39 = 0,13 % 41 = 0,03 % 43 = 0,05 % 45 = 0,00 % 47 = 0,09 % 49 = 0,02 %
example of distorted signal and reading of the harmonic measurements
observation using an oscilloscope clearly shows a distorted signal which no longer looks very much like a sine wave in certain cases.
An
Aly
sis
of
the
lo
Ad
s
21
U
0t
Fundamental sine wave
3rd order harmonic sine wave
Distorted actual wave = fundamental wave + 3rd order harmonic
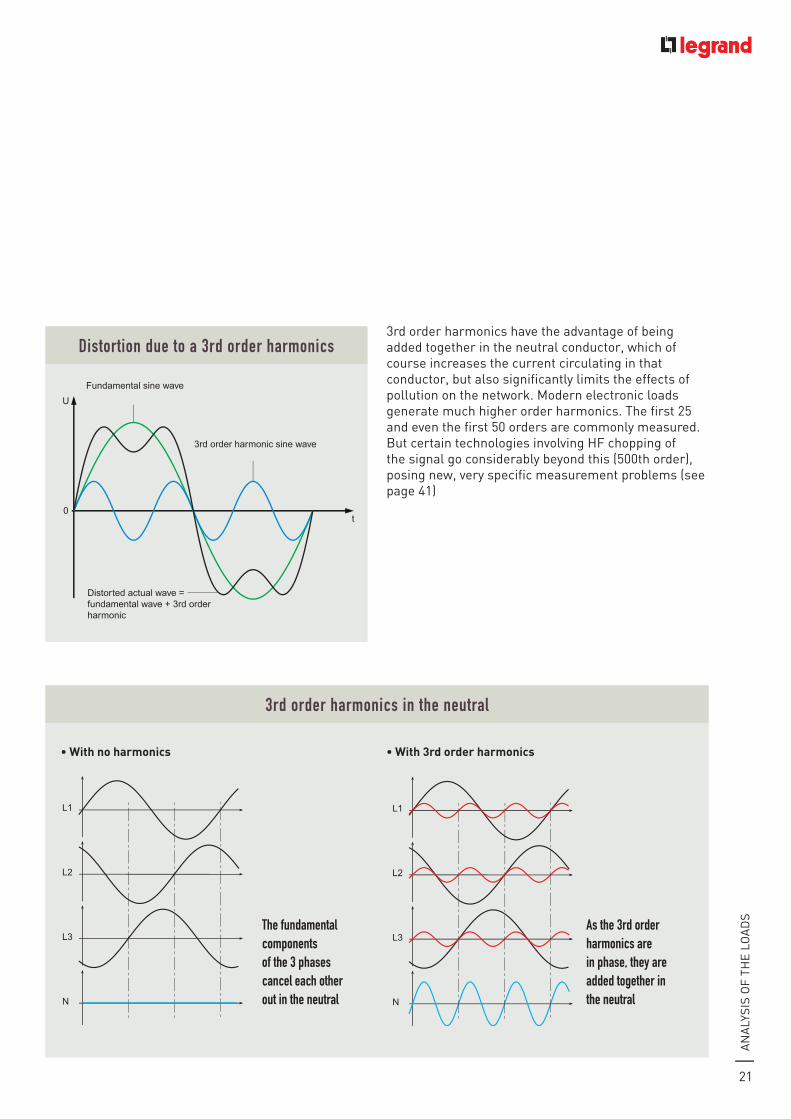
distortion due to a 3rd order harmonics3rd order harmonics have the advantage of being added together in the neutral conductor, which of course increases the current circulating in that conductor, but also significantly limits the effects of pollution on the network. Modern electronic loads generate much higher order harmonics. the first 25 and even the first 50 orders are commonly measured. But certain technologies involving hf chopping of the signal go considerably beyond this (500th order), posing new, very specific measurement problems (see page 41)
3rd order harmonics in the neutral
as the 3rd order harmonics are in phase, they are added together in the neutral
the fundamental components of the 3 phases cancel each other out in the neutral
• With no harmonics • With 3rd order harmonics
L1
L2
L3
N
L1
L2
L3
N
L1
L2
L3
N
L1
L2
L3
N
An
Aly
sis
of
the
lo
Ad
s
22
P o w e r b a l a n c e a n d c h o i c e o f P o w e r s u P P ly s o l u t i o n s
Power analysis (continued)
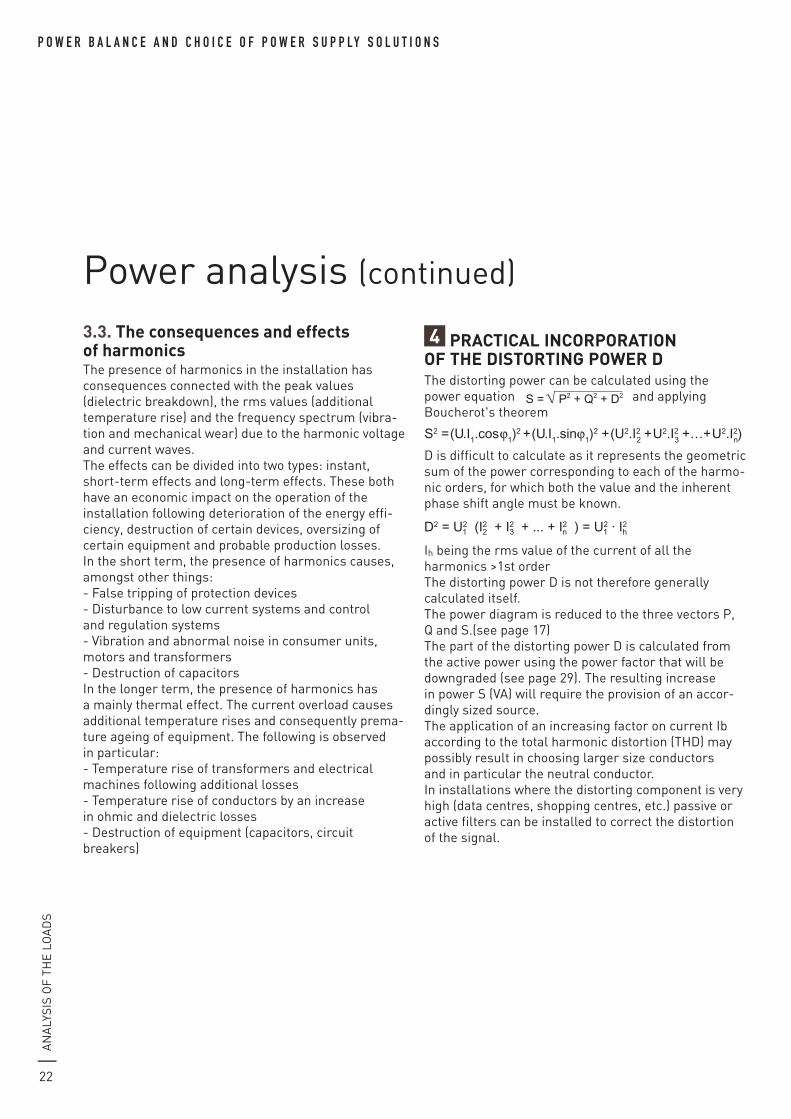
4 PrActicAl incorPorAtion of the distorting Power dthe distorting power can be calculated using the power equation S = P2 + Q2 + D2 and applying Boucherot's theorem
D2 = U2 (I2 + I2 + ... + I2 ) = U2 · I2 1 2 3 n 1 h
S2 =(U.I1.cosϕ
1)2 +(U.I
1.sinϕ
1)2 +(U2.I2 +U2.I2 +…+U2.I2)2 3 n
d is difficult to calculate as it represents the geometric sum of the power corresponding to each of the harmo-nic orders, for which both the value and the inherent phase shift angle must be known.
D2 = U2 (I2 + I2 + ... + I2 ) = U2 · I2 1 2 3 n 1 h
S2 =(U.I1.cosϕ
1)2 +(U.I
1.sinϕ
1)2 +(U2.I2 +U2.I2 +…+U2.I2)2 3 n
ih being the rms value of the current of all the harmonics >1st order the distorting power d is not therefore generally calculated itself. the power diagram is reduced to the three vectors P, Q and s.(see page 17)the part of the distorting power d is calculated from the active power using the power factor that will be downgraded (see page 29). the resulting increase in power s (VA) will require the provision of an accor-dingly sized source.the application of an increasing factor on current ib according to the total harmonic distortion (thd) may possibly result in choosing larger size conductors and in particular the neutral conductor.in installations where the distorting component is very high (data centres, shopping centres, etc.) passive or active filters can be installed to correct the distortion of the signal.
3.3. the consequences and effects of harmonicsthe presence of harmonics in the installation has consequences connected with the peak values (dielectric breakdown), the rms values (additional temperature rise) and the frequency spectrum (vibra-tion and mechanical wear) due to the harmonic voltage and current waves.the effects can be divided into two types: instant, short-term effects and long-term effects. these both have an economic impact on the operation of the installation following deterioration of the energy effi-ciency, destruction of certain devices, oversizing of certain equipment and probable production losses.in the short term, the presence of harmonics causes, amongst other things:- false tripping of protection devices- disturbance to low current systems and control and regulation systems- Vibration and abnormal noise in consumer units, motors and transformers- destruction of capacitorsin the longer term, the presence of harmonics has a mainly thermal effect. the current overload causes additional temperature rises and consequently prema-ture ageing of equipment. the following is observed in particular:- temperature rise of transformers and electrical machines following additional losses- temperature rise of conductors by an increase in ohmic and dielectric losses- destruction of equipment (capacitors, circuit breakers)
An
Aly
sis
of
the
lo
Ad
s
23
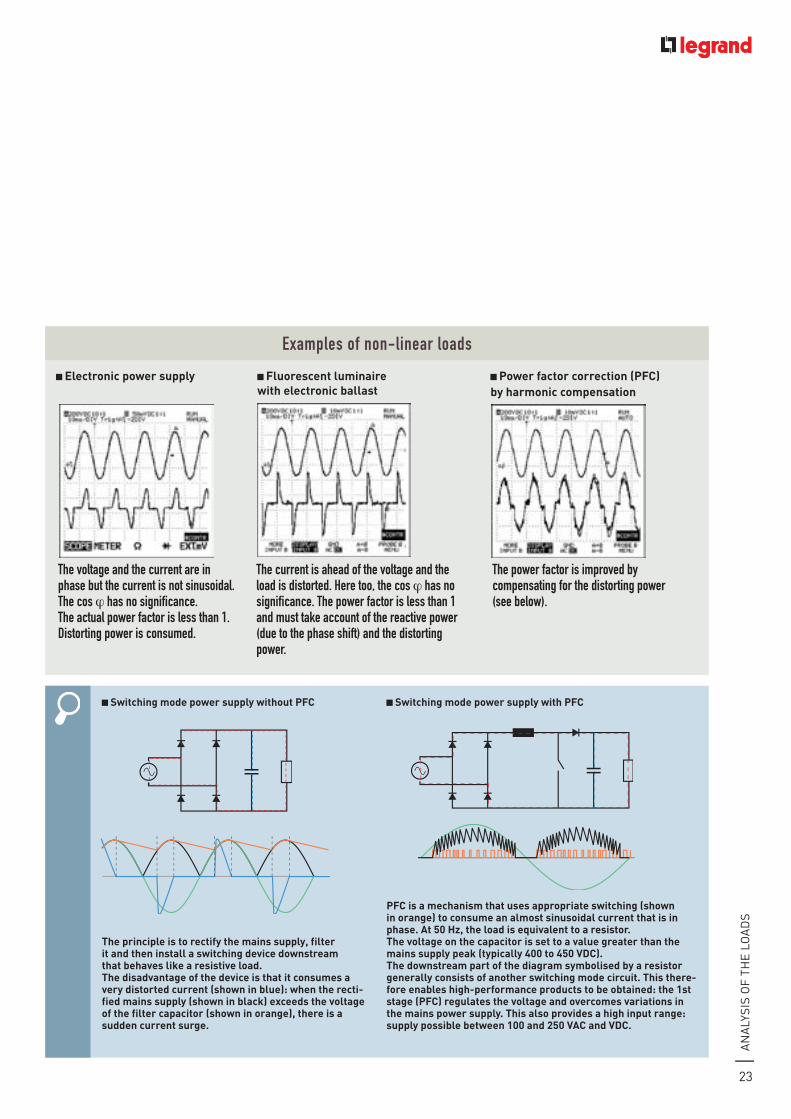
switching mode power supply without Pfc
the principle is to rectify the mains supply, filter it and then install a switching device downstream that behaves like a resistive load. the disadvantage of the device is that it consumes a very distorted current (shown in blue): when the recti-fied mains supply (shown in black) exceeds the voltage of the filter capacitor (shown in orange), there is a sudden current surge.
switching mode power supply with Pfc
Pfc is a mechanism that uses appropriate switching (shown in orange) to consume an almost sinusoidal current that is in phase. At 50 hz, the load is equivalent to a resistor. the voltage on the capacitor is set to a value greater than the mains supply peak (typically 400 to 450 Vdc). the downstream part of the diagram symbolised by a resistor generally consists of another switching mode circuit. this there-fore enables high-performance products to be obtained: the 1st stage (Pfc) regulates the voltage and overcomes variations in the mains power supply. this also provides a high input range: supply possible between 100 and 250 VAc and Vdc.
examples of non-linear loads
the voltage and the current are in phase but the current is not sinusoidal. the cos ϕ has no significance. the actual power factor is less than 1. distorting power is consumed.
electronic power supply
the current is ahead of the voltage and the load is distorted. here too, the cos ϕ has no significance. the power factor is less than 1 and must take account of the reactive power (due to the phase shift) and the distorting power.
fluorescent luminaire with electronic ballast
the power factor is improved by compensating for the distorting power (see below).
Power factor correction (Pfc) by harmonic compensation
An
Aly
sis
of
the
lo
Ad
s
24
P o w e r b a l a n c e a n d c h o i c e o f P o w e r s u P P ly s o l u t i o n s
Power analysis (continued)
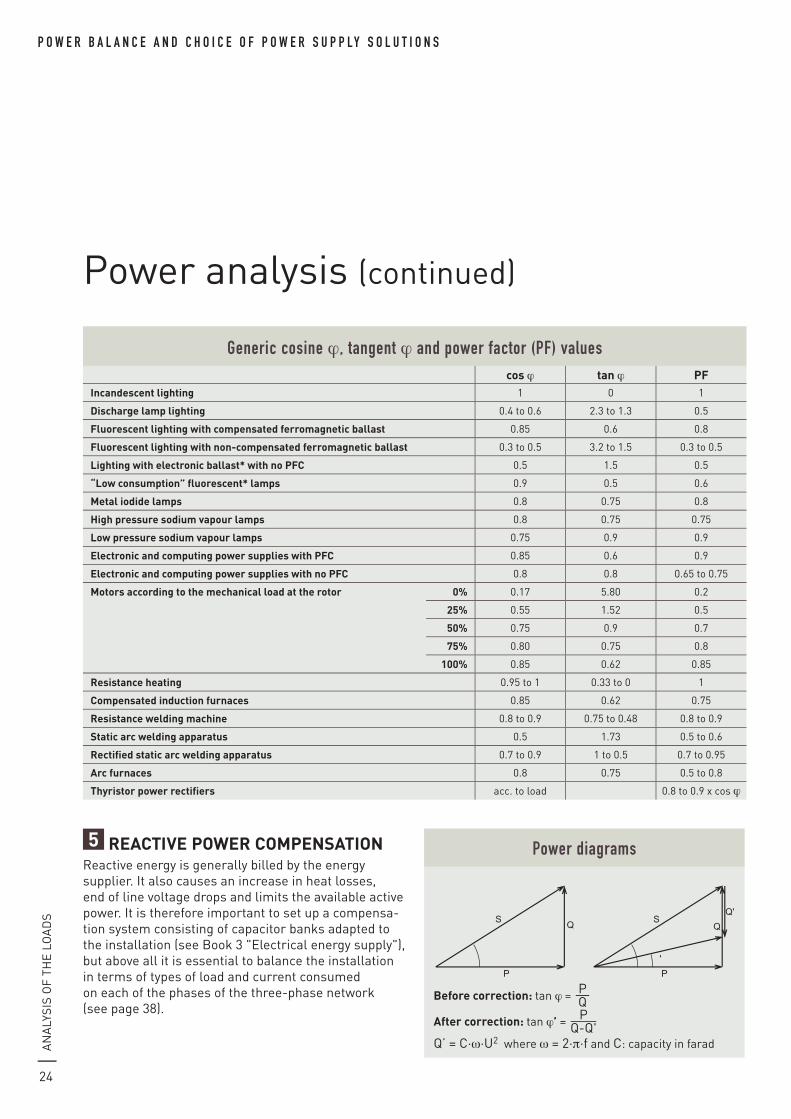
Generic cosine ϕ, tangent ϕ and power factor (Pf) valuescos ϕ tan ϕ Pf
incandescent lighting 1 0 1
discharge lamp lighting 0.4 to 0.6 2.3 to 1.3 0.5
fluorescent lighting with compensated ferromagnetic ballast 0.85 0.6 0.8
fluorescent lighting with non-compensated ferromagnetic ballast 0.3 to 0.5 3.2 to 1.5 0.3 to 0.5
lighting with electronic ballast* with no Pfc 0.5 1.5 0.5
“low consumption” fluorescent* lamps 0.9 0.5 0.6
metal iodide lamps 0.8 0.75 0.8
high pressure sodium vapour lamps 0.8 0.75 0.75
low pressure sodium vapour lamps 0.75 0.9 0.9
electronic and computing power supplies with Pfc 0.85 0.6 0.9
electronic and computing power supplies with no Pfc 0.8 0.8 0.65 to 0.75
motors according to the mechanical load at the rotor 0% 0.17 5.80 0.2
25% 0.55 1.52 0.5
50% 0.75 0.9 0.7
75% 0.80 0.75 0.8
100% 0.85 0.62 0.85
resistance heating 0.95 to 1 0.33 to 0 1
compensated induction furnaces 0.85 0.62 0.75
resistance welding machine 0.8 to 0.9 0.75 to 0.48 0.8 to 0.9
static arc welding apparatus 0.5 1.73 0.5 to 0.6
rectified static arc welding apparatus 0.7 to 0.9 1 to 0.5 0.7 to 0.95
Arc furnaces 0.8 0.75 0.5 to 0.8
thyristor power rectifiers acc. to load 0.8 to 0.9 x cos ϕ
5 reActiVe Power comPensAtion Reactive energy is generally billed by the energy supplier. it also causes an increase in heat losses, end of line voltage drops and limits the available active power. it is therefore important to set up a compensa-tion system consisting of capacitor banks adapted to the installation (see Book 3 "electrical energy supply"), but above all it is essential to balance the installation in terms of types of load and current consumed on each of the phases of the three-phase network (see page 38).
SQ
P
SQ
Q'
P
'
Power diagrams
Before correction: tan ϕ = PQ
After correction: tan ϕ’ = PQ-Q'
Q’ = C·ω·U2 where ω = 2·π·f and C: capacity in farad
An
Aly
sis
of
the
lo
Ad
s
25
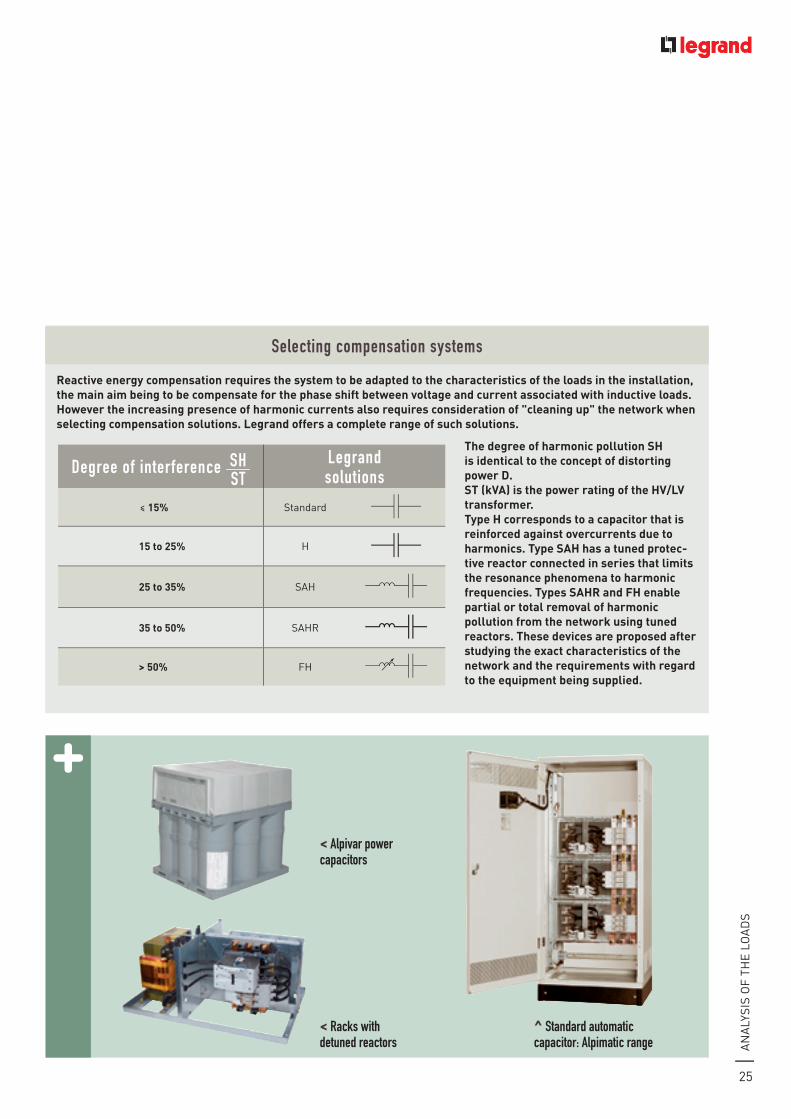
reactive energy compensation requires the system to be adapted to the characteristics of the loads in the installation, the main aim being to be compensate for the phase shift between voltage and current associated with inductive loads. however the increasing presence of harmonic currents also requires consideration of "cleaning up" the network when selecting compensation solutions. legrand offers a complete range of such solutions.
the degree of harmonic pollution sh is identical to the concept of distorting power d.st (kVA) is the power rating of the hV/lV transformer.type h corresponds to a capacitor that is reinforced against overcurrents due to harmonics. type sAh has a tuned protec-tive reactor connected in series that limits the resonance phenomena to harmonic frequencies. types sAhr and fh enable partial or total removal of harmonic pollution from the network using tuned reactors. these devices are proposed after studying the exact characteristics of the network and the requirements with regard to the equipment being supplied.
selecting compensation systems
degree of interference shst
legrand solutions
< 15% standard
15 to 25% h
25 to 35% sAh
35 to 50% sAhR
> 50% fh
< alpivar power capacitors
< racks with detuned reactors
^ standard automatic capacitor: alpimatic range
CA
lCU
lAti
on
of
the
CU
RR
en
ts
26
P o w e r b a l a n c e a n d c h o i c e o f P o w e r s u P P ly s o l u t i o n s
Power analysis (continued)
cAlculAtion of the currents
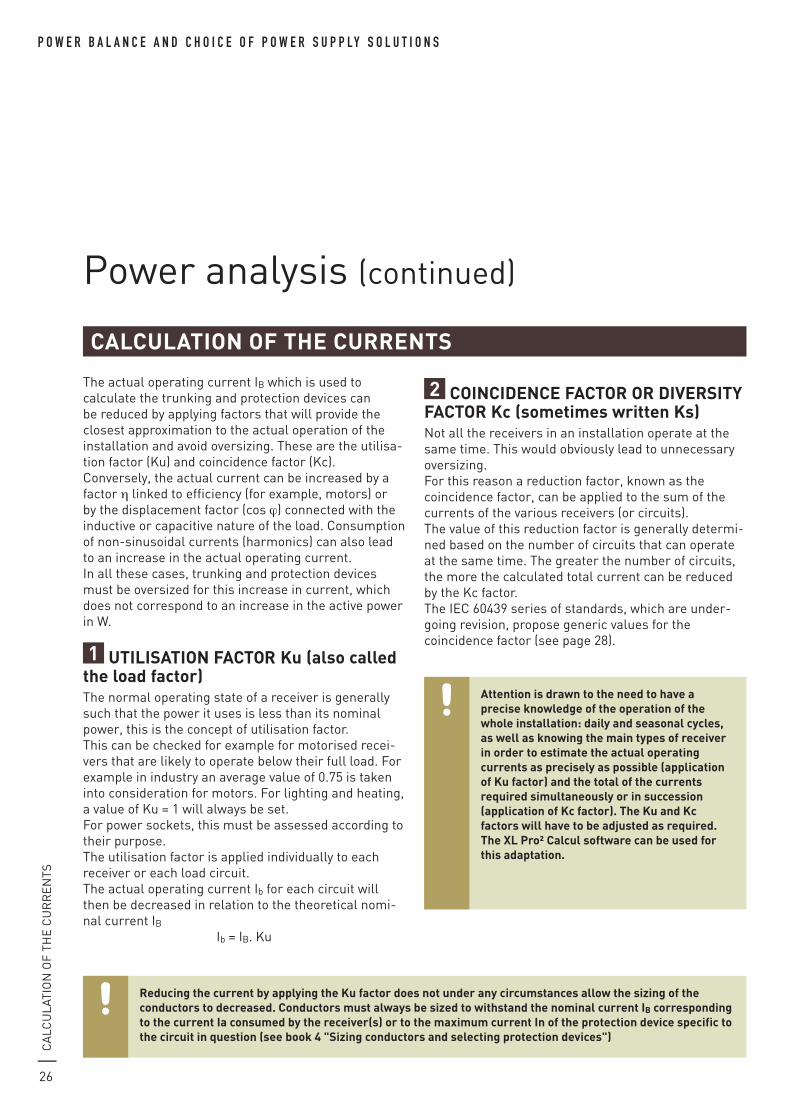
the actual operating current iB which is used to calculate the trunking and protection devices can be reduced by applying factors that will provide the closest approximation to the actual operation of the installation and avoid oversizing. these are the utilisa-tion factor (Ku) and coincidence factor (Kc).Conversely, the actual current can be increased by a factor η linked to efficiency (for example, motors) or by the displacement factor (cos ϕ) connected with the inductive or capacitive nature of the load. Consumption of non-sinusoidal currents (harmonics) can also lead to an increase in the actual operating current. in all these cases, trunking and protection devices must be oversized for this increase in current, which does not correspond to an increase in the active power in W.
1 utilisAtion fActor Ku (also called the load factor)the normal operating state of a receiver is generally such that the power it uses is less than its nominal power, this is the concept of utilisation factor.this can be checked for example for motorised recei-vers that are likely to operate below their full load. for example in industry an average value of 0.75 is taken into consideration for motors. for lighting and heating, a value of Ku = 1 will always be set.for power sockets, this must be assessed according to their purpose.the utilisation factor is applied individually to each receiver or each load circuit.the actual operating current ib for each circuit will then be decreased in relation to the theoretical nomi-nal current iB
ib = iB. Ku
reducing the current by applying the Ku factor does not under any circumstances allow the sizing of the conductors to decreased. conductors must always be sized to withstand the nominal current iB corresponding to the current ia consumed by the receiver(s) or to the maximum current in of the protection device specific to the circuit in question (see book 4 "sizing conductors and selecting protection devices")
Attention is drawn to the need to have a precise knowledge of the operation of the whole installation: daily and seasonal cycles, as well as knowing the main types of receiver in order to estimate the actual operating currents as precisely as possible (application of Ku factor) and the total of the currents required simultaneously or in succession (application of Kc factor). the Ku and Kc factors will have to be adjusted as required. the Xl Pro² calcul software can be used for this adaptation.
2 coincidence fActor or diVersity fActor Kc (sometimes written Ks)not all the receivers in an installation operate at the same time. this would obviously lead to unnecessary oversizing. for this reason a reduction factor, known as the coincidence factor, can be applied to the sum of the currents of the various receivers (or circuits).the value of this reduction factor is generally determi-ned based on the number of circuits that can operate at the same time. the greater the number of circuits, the more the calculated total current can be reduced by the Kc factor. the ieC 60439 series of standards, which are under-going revision, propose generic values for the coincidence factor (see page 28).
CA
lCU
lAti
on
of
the
CU
RR
en
ts
27
the conductors and protection devices of the circuit travelled over by the total cur-rent ib can be sized for the calculated value of this current. it is not necessary to carry out this sizing for the theoretical sum of the currents iB.
the actual operating current ib total of a circuit containing a set of circuits is equal to the sum of the actual operating currents (ib1, ib2, ib3, ibn) of each of the circuits, to which a coincidence factor Kc is applied:
ibtotal = (ib1 + ib2 + ib3 +… ibn) Kcwhich can also be written:
ibtotal = (iB1.Ku1+ iB2.Ku2 + iB3.Ku3+…iBn.Ku) Kcintegrating each of the KU factors specific to each circuit.
to carry out thermal dissipation analyses in enclosures (see book 8 "Protection against external disturbances"), the same calculation principles are used, but the corres-ponding factors are called by analogy u (utilisation) and c (coincidence). their values are applied to power and not to currents like factors Ku and Kc. As these two electrical values are linked by a concept of power squared (P = ri²), the u and Ku factors one the one hand, and the c and Kc factors on the other, are connected according to the same law. thus a utilisation factor Ku of 0.8 on the current consumed by a circuit corresponds to a u factor of 0.64
(0.8 x 0.8) on the power dissipated by this circuit.the same applies for c and Kc where, for example, a Kc factor of 0.75 corresponds to a dissipated power reduced by the c factor of 0.56. (0.75 x 0.75). this concept is parti-cularly important: by comparing the calculations with the actual power values dissipated by the protection devices and their wiring, it enables oversizing of the distribution enclosures to be avoided if their determination has been carried out according to the theoretical maximum power corresponding to the nominal currents.
thermal dissipation analysis
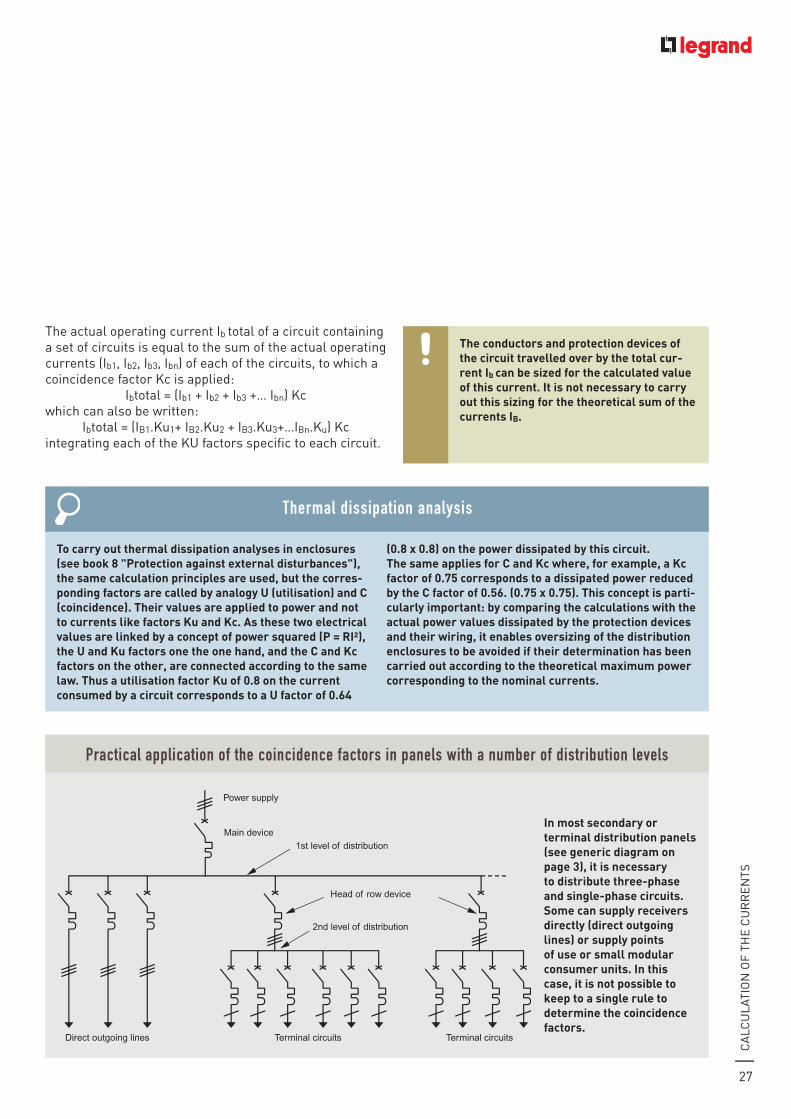
in most secondary or terminal distribution panels (see generic diagram on page 3), it is necessary to distribute three-phase and single-phase circuits. some can supply receivers directly (direct outgoing lines) or supply points of use or small modular consumer units. in this case, it is not possible to keep to a single rule to determine the coincidence factors.
Practical application of the coincidence factors in panels with a number of distribution levels
Power supply
Main device
Head of row device
Direct outgoing lines Terminal circuits Terminal circuits
1st level of distribution
2nd level of distribution
CA
lCU
lAti
on
of
the
CU
RR
en
ts
28
P o w e r b a l a n c e a n d c h o i c e o f P o w e r s u P P ly s o l u t i o n s
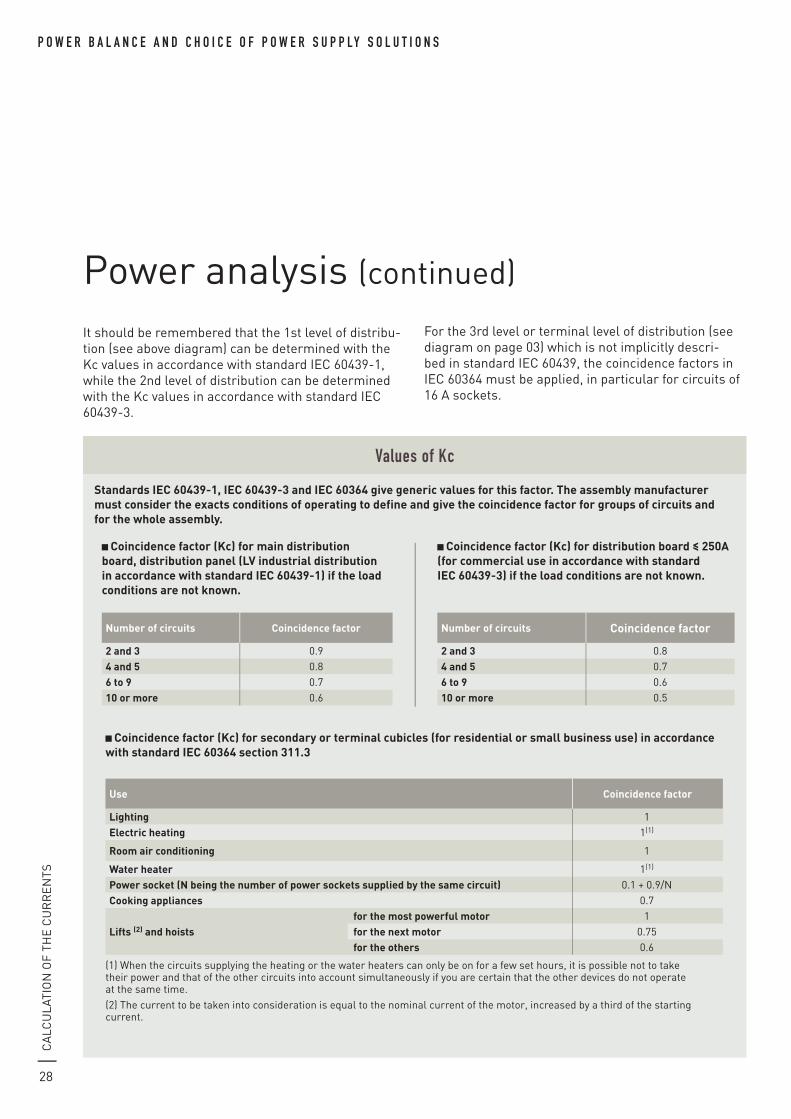
it should be remembered that the 1st level of distribu-tion (see above diagram) can be determined with the Kc values in accordance with standard ieC 60439-1, while the 2nd level of distribution can be determined with the Kc values in accordance with standard ieC 60439-3.
Power analysis (continued)
standards iec 60439-1, iec 60439-3 and iec 60364 give generic values for this factor. the assembly manufacturer must consider the exacts conditions of operating to define and give the coincidence factor for groups of circuits and for the whole assembly.
coincidence factor (Kc) for secondary or terminal cubicles (for residential or small business use) in accordance with standard iec 60364 section 311.3
use coincidence factor
lighting 1electric heating 1(1)
room air conditioning 1
water heater 1(1)
Power socket (n being the number of power sockets supplied by the same circuit) 0.1 + 0.9/ncooking appliances 0.7
lifts (2) and hoistsfor the most powerful motor 1for the next motor 0.75for the others 0.6
(1) When the circuits supplying the heating or the water heaters can only be on for a few set hours, it is possible not to take their power and that of the other circuits into account simultaneously if you are certain that the other devices do not operate at the same time.(2) the current to be taken into consideration is equal to the nominal current of the motor, increased by a third of the starting current.
coincidence factor (Kc) for distribution board < 250A (for commercial use in accordance with standard iec 60439-3) if the load conditions are not known.
number of circuits coincidence factor
2 and 3 0.84 and 5 0.76 to 9 0.610 or more 0.5
coincidence factor (Kc) for main distribution board, distribution panel (lV industrial distribution in accordance with standard iec 60439-1) if the load conditions are not known.
number of circuits coincidence factor
2 and 3 0.94 and 5 0.86 to 9 0.710 or more 0.6
Values of Kc
for the 3rd level or terminal level of distribution (see diagram on page 03) which is not implicitly descri-bed in standard ieC 60439, the coincidence factors in ieC 60364 must be applied, in particular for circuits of 16 A sockets.

CA
lCU
lAti
on
of
the
Po
We
R A
CC
oR
din
g t
o t
he
tyP
e o
f lo
Ad
29
Pn: nominal power (in W; this is the useful power)U: voltage between phases in three-phase, and between phase and neutral in single-phase (in V)η: efficiencycos ϕ: displacement factor
3 cAlculAtion of the current consumed By seVerAl receiVers the example described below shows that the current and power calculations must be carried out in accor-dance with precise mathematical rules in order to clearly distinguish the different components.
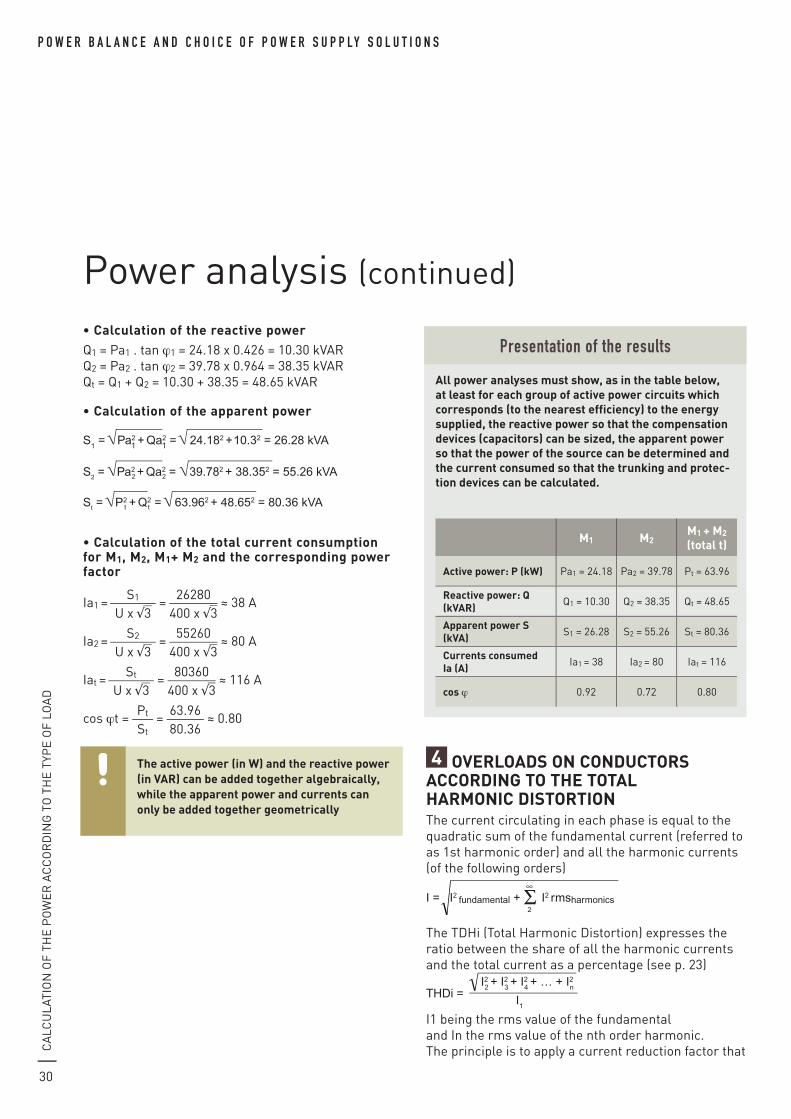
> example of asynchronous motorsA group of circuits consists of two three-phase asyn-chronous motors M1 and M2 connected to the same panel (mains supply: 400 V AC - 50 hz) (see diagram on page 35)the nominal power of the motors are respectively: Pn1 = 22 kW and Pn2 = 37 kWthe displacement factors are cos ϕ1 = 0.92 for M1 and cos ϕ2 = 0.72 for M2
the efficiencies are η1 = 0.91 and η2 = 0.93 respectively.
• Calculation of the power consumed
Pa1 = Pn1
η1 = 22,000
0.91 = 24,176 W # 24.18 kW
Pa2 = Pn2
η2 = 37,000
0.93 = 39,785 W # 39.78 kW
Pt = Pa1 + Pa2 = 63.96 kW
the reactive power can in this case be calculated by determining the value of tan ϕ from cos ϕ. the rela-tionship with the tangent is given by the formula:
Rang = ƒ harmonique
ƒ fondamentale
THD = A 2 2 + A 3
2 + ... + A i 2 + ... + A n 2
A 1
′ Q = P (tan ϕ − 0 , 4 )
tan ϕ = Wp VAr Q
tan ϕ = Q P
P = Wp t
P = U I 3 cos ϕ
tan ϕ =
ϕ
1-(cosϕ)2
cos ϕ
I = P 3 cos U ϕ
IB = Q x 1000 x K 3 U
tan ϕ1 = 0.426tan ϕ2 = 0.964
the current consumed ia corresponds to the nominal current consumed by a receiver independently of the utilisation factor and the coincidence factor, but taking into account the aspects of efficiency (η factor), dis-placement factor or phase shift (cos ϕ) for motors or other inductive or capacitive loads. for non-linear (or distorting) loads, the quadratic sum of the fundamental current and the harmonic currents must be calculated in order to obtain the actual rms current.
1 Purely resistiVe loAdthe current consumed ia of a purely resistive load is calculated by simply applying the formula:
Ia = PnU
for single-phase and Ia = PnU x 3
for three-phase.
But beware, very few loads are totally resistive: incan-descent lighting is losing ground to solutions that offer higher performance levels, but which are on the other hand less “pure” from an electrical viewpoint.
2 non distorting loAd thAt is not Purely resistiVethe nominal power (Pn) of a motor corresponds to the mechanical power available on its shaft.the actual power consumed (Pa) corresponds to the active power carried by the line. this is dependent on the efficiency of the motor:
Pa = Pnη
the current consumed (ia) is given by the following formulae:
- single-phase Ia = PnU x η x cosϕ
- three-phase Ia = Pn 3 x U x η x cosϕ
ia: rms current consumed (in A)
cAlculAtion of the Power According to the tyPe of loAd
CA
lCU
lAti
on
of
the
Po
We
R A
CC
oR
din
g t
o t
he
tyP
e o
f lo
Ad
30
P o w e r b a l a n c e a n d c h o i c e o f P o w e r s u P P ly s o l u t i o n s
Power analysis (continued)
4 oVerloAds on conductors According to the totAl hArmonic distortionthe current circulating in each phase is equal to the quadratic sum of the fundamental current (referred to as 1st harmonic order) and all the harmonic currents (of the following orders)
I = I2 fundamental + Σ I2 rmsharmonics
∞
2
K = 1
1 + THDi 2
100( (
1 + 33 2K = 1 = 0,95
100( (
the tdhi (total harmonic distortion) expresses the ratio between the share of all the harmonic currents and the total current as a percentage (see p. 23)
K = 1 1 + THDi
2
THDi = I22 + I2
3 + I2
4 + … + I2
n
I1
THDi = = = 0.357 or 35.7% I22 + I2
3 +… + I2
n
I1
(0.025)2
0,07
Iph = I2 + (0.33 Ih)2 = 1.05 I
I = I2 fundamental + Σ I2 rmsharmonic
∞
2
IN = 3 x Iph
1 + 65 2Kph =
100
= 0.841
( (
1 + 33 2K = 1 = 0.95
100( (
1K
N 1 + THDi2=
1 + 65 2
100( (
( (3 THDi= = 1.63
100365
Ia =Pa
U x η x PF
Ia =Pa
3 x U x η x PF
i1 being the rms value of the fundamental and in the rms value of the nth order harmonic.the principle is to apply a current reduction factor that
• Calculation of the reactive powerQ1 = Pa1 . tan ϕ1 = 24.18 x 0.426 = 10.30 kVARQ2 = Pa2 . tan ϕ2 = 39.78 x 0.964 = 38.35 kVARQt = Q1 + Q2 = 10.30 + 38.35 = 48.65 kVAR
• Calculation of the apparent power
S1 = Pa2 + Qa2 = 24.182 +10.32 = 26.28 kVA1 1
S2 = Pa2 + Qa2 = 39.782 + 38.352 = 55.26 kVA2 2
St = P2 + Q2 = 63.962 + 48.652 = 80.36 kVA
• Calculation of the total current consumption for m1, m2, m1+ m2 and the corresponding power factor
ia1 = s1
U x √3 = 26280
400 x √3 # 38 A
ia2 = s2
U x √3 = 55260
400 x √3 # 80 A
iat = st
U x √3 = 80360
400 x √3 # 116 A
cos ϕt = Pt
st = 63.96
80.36 # 0.80
the active power (in w) and the reactive power (in VAr) can be added together algebraically, while the apparent power and currents can only be added together geometrically
All power analyses must show, as in the table below, at least for each group of active power circuits which corresponds (to the nearest efficiency) to the energy supplied, the reactive power so that the compensation devices (capacitors) can be sized, the apparent power so that the power of the source can be determined and the current consumed so that the trunking and protec-tion devices can be calculated.
Presentation of the results
m1 m2m1 + m2 (total t)
Active power: P (kw) Pa1 = 24.18 Pa2 = 39.78 Pt = 63.96
reactive power: Q (kVAr) Q1 = 10.30 Q2 = 38.35 Qt = 48.65
Apparent power s (kVA) s1 = 26.28 s2 = 55.26 st = 80.36
currents consumed ia (A) ia1 = 38 ia2 = 80 iat = 116
cos ϕ 0.92 0.72 0.80
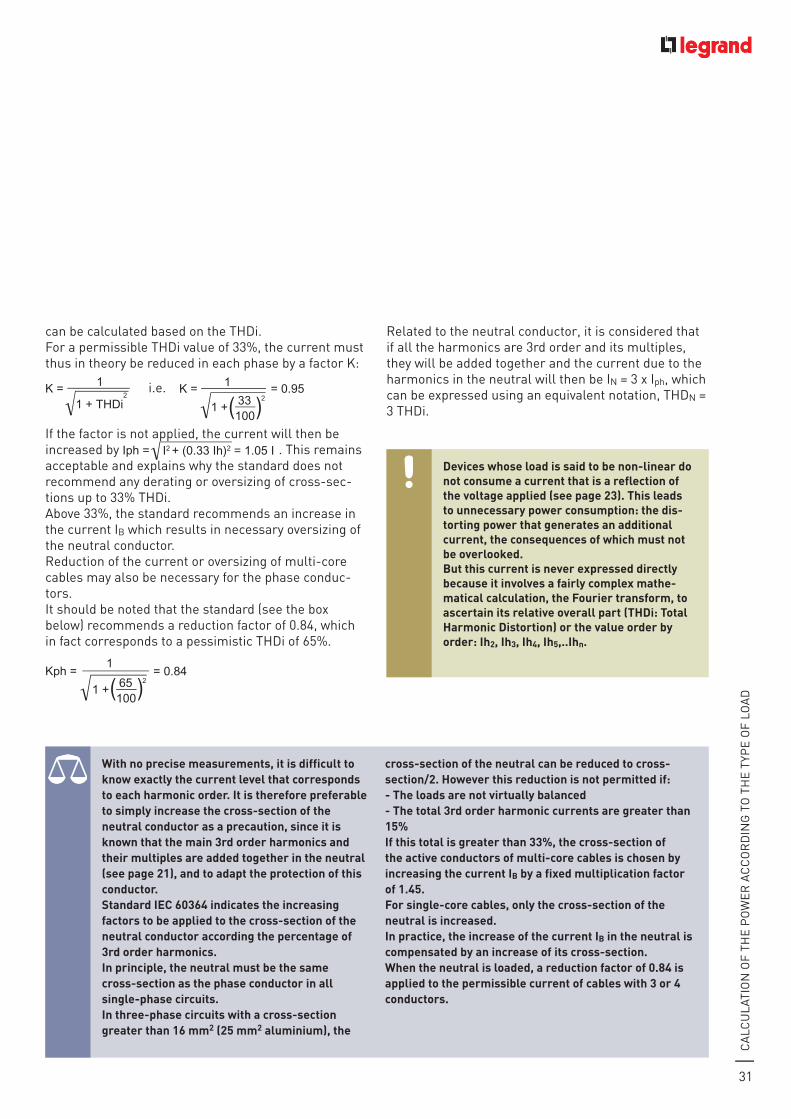
CA
lCU
lAti
on
of
the
Po
We
R A
CC
oR
din
g t
o t
he
tyP
e o
f lo
Ad
31
with no precise measurements, it is difficult to know exactly the current level that corresponds to each harmonic order. it is therefore preferable to simply increase the cross-section of the neutral conductor as a precaution, since it is known that the main 3rd order harmonics and their multiples are added together in the neutral (see page 21), and to adapt the protection of this conductor.standard iec 60364 indicates the increasing factors to be applied to the cross-section of the neutral conductor according the percentage of 3rd order harmonics.in principle, the neutral must be the same cross-section as the phase conductor in all single-phase circuits.in three-phase circuits with a cross-section greater than 16 mm2 (25 mm2 aluminium), the
cross-section of the neutral can be reduced to cross-section/2. however this reduction is not permitted if:- the loads are not virtually balanced- the total 3rd order harmonic currents are greater than 15%if this total is greater than 33%, the cross-section of the active conductors of multi-core cables is chosen by increasing the current iB by a fixed multiplication factor of 1.45.for single-core cables, only the cross-section of the neutral is increased. in practice, the increase of the current iB in the neutral is compensated by an increase of its cross-section.when the neutral is loaded, a reduction factor of 0.84 is applied to the permissible current of cables with 3 or 4 conductors.
devices whose load is said to be non-linear do not consume a current that is a reflection of the voltage applied (see page 23). this leads to unnecessary power consumption: the dis-torting power that generates an additional current, the consequences of which must not be overlooked.But this current is never expressed directly because it involves a fairly complex mathe-matical calculation, the fourier transform, to ascertain its relative overall part (thdi: total harmonic distortion) or the value order by order: ih2, ih3, ih4, ih5,..ihn.
can be calculated based on the thdi.for a permissible thdi value of 33%, the current must thus in theory be reduced in each phase by a factor K:
K = 1
1 + THDi2
THDi = I22 + I2
3 + I2
4 + … + I2
n
I1
THDi = = = 0.357 or 35.7% I22 + I2
3 +… + I2
n
I1
(0.025)2
0,07
Iph = I2 + (0.33 Ih)2 = 1.05 I
I = I2 fundamental + Σ I2 rmsharmonic
∞
2
IN = 3 x Iph
1 + 65 2Kph =
100
= 0.841
( (
1 + 33 2K = 1 = 0.95
100( (
1K
N 1 + THDi2=
1 + 65 2
100( (
( (3 THDi= = 1.63
100365
Ia =Pa
U x η x PF
Ia =Pa
3 x U x η x PF
i.e.
K = 1 1 + THDi
2
THDi = I22 + I2
3 + I2
4 + … + I2
n
I1
THDi = = = 0.357 or 35.7% I22 + I2
3 +… + I2
n
I1
(0.025)2
0,07
Iph = I2 + (0.33 Ih)2 = 1.05 I
I = I2 fundamental + Σ I2 rmsharmonic
∞
2
IN = 3 x Iph
1 + 65 2Kph =
100
= 0.841
( (
1 + 33 2K = 1 = 0.95
100( (
1K
N 1 + THDi2=
1 + 65 2
100( (
( (3 THDi= = 1.63
100365
Ia =Pa
U x η x PF
Ia =Pa
3 x U x η x PF
if the factor is not applied, the current will then be increased by
K = 1 1 + THDi
2
THDi = I22 + I2
3 + I2
4 + … + I2
n
I1
THDi = = = 0.357 or 35.7% I22 + I2
3 +… + I2
n
I1
(0.025)2
0,07
Iph = I2 + (0.33 Ih)2 = 1.05 I
I = I2 fundamental + Σ I2 rmsharmonic
∞
2
IN = 3 x Iph
1 + 65 2Kph =
100
= 0.841
( (
1 + 33 2K = 1 = 0.95
100( (
1K
N 1 + THDi2=
1 + 65 2
100( (
( (3 THDi= = 1.63
100365
Ia =Pa
U x η x PF
Ia =Pa
3 x U x η x PF
. this remains acceptable and explains why the standard does not recommend any derating or oversizing of cross-sec-tions up to 33% thdi.Above 33%, the standard recommends an increase in the current iB which results in necessary oversizing of the neutral conductor.Reduction of the current or oversizing of multi-core cables may also be necessary for the phase conduc-tors.it should be noted that the standard (see the box below) recommends a reduction factor of 0.84, which in fact corresponds to a pessimistic thdi of 65%.
K = 1 1 + THDi
2
THDi = I22 + I2
3 + I2
4 + … + I2
n
I1
THDi = = = 0.357 or 35.7% I22 + I2
3 +… + I2
n
I1
(0.025)2
0,07
Iph = I2 + (0.33 Ih)2 = 1.05 I
I = I2 fundamental + Σ I2 rmsharmonic
∞
2
IN = 3 x Iph
1 + 65 2Kph =
100
= 0.841
( (
1 + 33 2K = 1 = 0.95
100( (
1K
N 1 + THDi2=
1 + 65 2
100( (
( (3 THDi= = 1.63
100365
Ia =Pa
U x η x PF
Ia =Pa
3 x U x η x PF
Related to the neutral conductor, it is considered that if all the harmonics are 3rd order and its multiples, they will be added together and the current due to the harmonics in the neutral will then be in = 3 x iph, which can be expressed using an equivalent notation, thdn = 3 thdi.
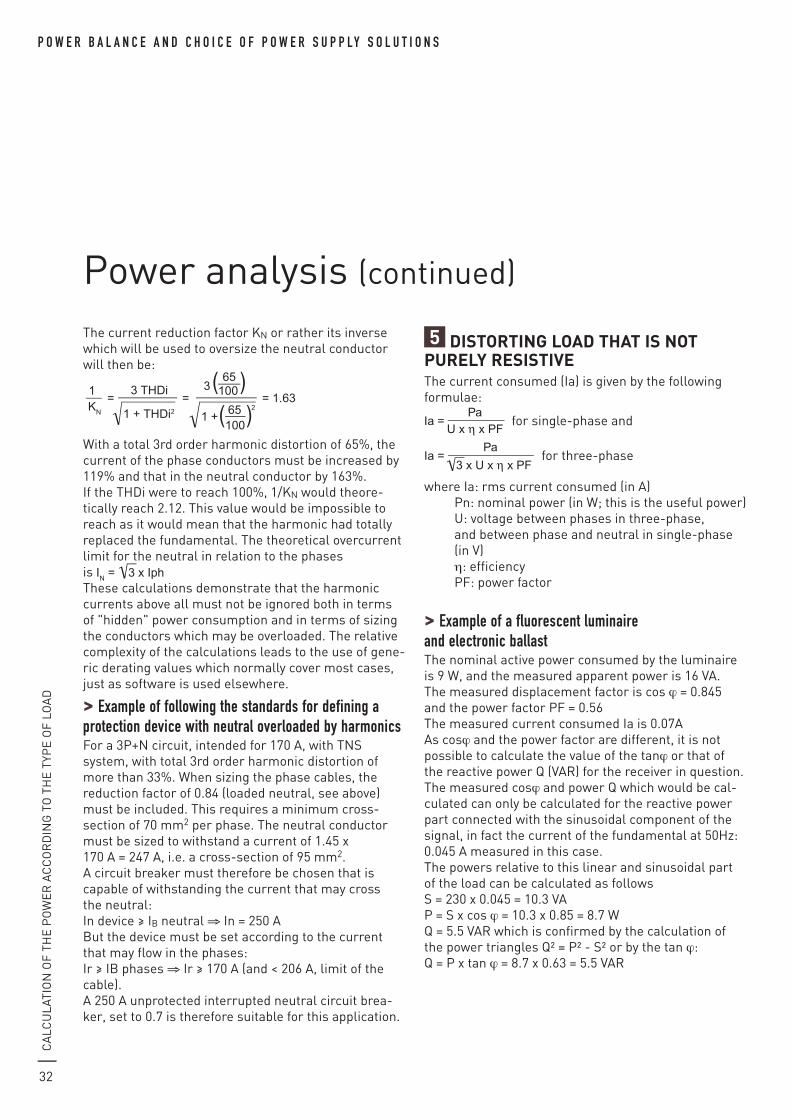
32
P o w e r b a l a n c e a n d c h o i c e o f P o w e r s u P P ly s o l u t i o n sC
alC
ula
tio
n o
f th
e p
ow
er
aC
Co
rd
ing
to
th
e t
ype
of
loa
d
the current reduction factor Kn or rather its inverse which will be used to oversize the neutral conductor will then be:
K = 1 1 + THDi
2
THDi = I22 + I2
3 + I2
4 + … + I2
n
I1
THDi = = = 0.357 or 35.7% I22 + I2
3 +… + I2
n
I1
(0.025)2
0.07
Iph = I2 + (0.33 Ih)2 = 1.05 I
I = I2 fundamental + Σ I2 rmsharmonic
∞
2
IN = 3 x Iph
1 + 65 2Kph =
100
= 0.841
( (
1 + 33 2K = 1 = 0.95
100( (
1K
N 1 + THDi2=
1 + 65 2
100( (
( (3 THDi= = 1.63
100365
Ia =Pa
U x η x PF
Ia =Pa
3 x U x η x PF
with a total 3rd order harmonic distortion of 65%, the current of the phase conductors must be increased by 119% and that in the neutral conductor by 163%.if the thdi were to reach 100%, 1/Kn would theore-tically reach 2.12. this value would be impossible to reach as it would mean that the harmonic had totally replaced the fundamental. the theoretical overcurrent limit for the neutral in relation to the phases is
K = 1 1 + THDi
2
THDi = I22 + I2
3 + I2
4 + … + I2
n
I1
THDi = = = 0.357 or 35.7% I22 + I2
3 +… + I2
n
I1
(0.025)2
0.07
Iph = I2 + (0.33 Ih)2 = 1.05 I
I = I2 fundamental + Σ I2 rmsharmonic
∞
2
IN = 3 x Iph
1 + 65 2Kph =
100
= 0.841
( (
1 + 33 2K = 1 = 0.95
100( (
1K
N 1 + THDi2=
1 + 65 2
100( (
( (3 THDi= = 1.63
100365
Ia =Pa
U x η x PF
Ia =Pa
3 x U x η x PF
these calculations demonstrate that the harmonic currents above all must not be ignored both in terms of "hidden" power consumption and in terms of sizing the conductors which may be overloaded. the relative complexity of the calculations leads to the use of gene-ric derating values which normally cover most cases, just as software is used elsewhere.
> example of following the standards for defining a protection device with neutral overloaded by harmonicsfor a 3p+n circuit, intended for 170 a, with tnS system, with total 3rd order harmonic distortion of more than 33%. when sizing the phase cables, the reduction factor of 0.84 (loaded neutral, see above) must be included. this requires a minimum cross- section of 70 mm2 per phase. the neutral conductor must be sized to withstand a current of 1.45 x 170 a = 247 a, i.e. a cross-section of 95 mm2.a circuit breaker must therefore be chosen that is capable of withstanding the current that may cross the neutral:in device > iB neutral ⇒ in = 250 aBut the device must be set according to the current that may flow in the phases:ir > iB phases ⇒ ir > 170 a (and < 206 a, limit of the cable).a 250 a unprotected interrupted neutral circuit brea-ker, set to 0.7 is therefore suitable for this application.
5 Distorting loaD that is not purely resistive the current consumed (ia) is given by the following formulae:
K = 1 1 + THDi
2
THDi = I22 + I2
3 + I2
4 + … + I2
n
I1
THDi = = = 0.357 or 35.7% I22 + I2
3 +… + I2
n
I1
(0.025)2
0.07
Iph = I2 + (0.33 Ih)2 = 1.05 I
I = I2 fundamental + Σ I2 rmsharmonic
∞
2
IN = 3 x Iph
1 + 65 2Kph =
100
= 0.841
( (
1 + 33 2K = 1 = 0.95
100( (
1K
N 1 + THDi2=
1 + 65 2
100( (
( (3 THDi= = 1.63
100365
Ia =Pa
U x η x PF
Ia =Pa
3 x U x η x PF
for single-phase and
K = 1 1 + THDi
2
THDi = I22 + I2
3 + I2
4 + … + I2
n
I1
THDi = = = 0.357 or 35.7% I22 + I2
3 +… + I2
n
I1
(0.025)2
0.07
Iph = I2 + (0.33 Ih)2 = 1.05 I
I = I2 fundamental + Σ I2 rmsharmonic
∞
2
IN = 3 x Iph
1 + 65 2Kph =
100
= 0.841
( (
1 + 33 2K = 1 = 0.95
100( (
1K
N 1 + THDi2=
1 + 65 2
100( (
( (3 THDi= = 1.63
100365
Ia =Pa
U x η x PF
Ia =Pa
3 x U x η x PF for three-phase
where ia: rms current consumed (in a) pn: nominal power (in w; this is the useful power) u: voltage between phases in three-phase, and between phase and neutral in single-phase (in V) η: efficiency pf: power factor
> example of a fluorescent luminaire and electronic ballast the nominal active power consumed by the luminaire is 9 w, and the measured apparent power is 16 Va.the measured displacement factor is cos ϕ = 0.845 and the power factor pf = 0.56the measured current consumed ia is 0.07aas cosϕ and the power factor are different, it is not possible to calculate the value of the tanϕ or that of the reactive power Q (Var) for the receiver in question.the measured cosϕ and power Q which would be cal-culated can only be calculated for the reactive power part connected with the sinusoidal component of the signal, in fact the current of the fundamental at 50hz: 0.045 a measured in this case. the powers relative to this linear and sinusoidal part of the load can be calculated as follows S = 230 x 0.045 = 10.3 Va p = S x cos ϕ = 10.3 x 0.85 = 8.7 w Q = 5.5 Var which is confirmed by the calculation of the power triangles Q² = p² - S² or by the tan ϕ: Q = p x tan ϕ = 8.7 x 0.63 = 5.5 Var
power analysis (continued)
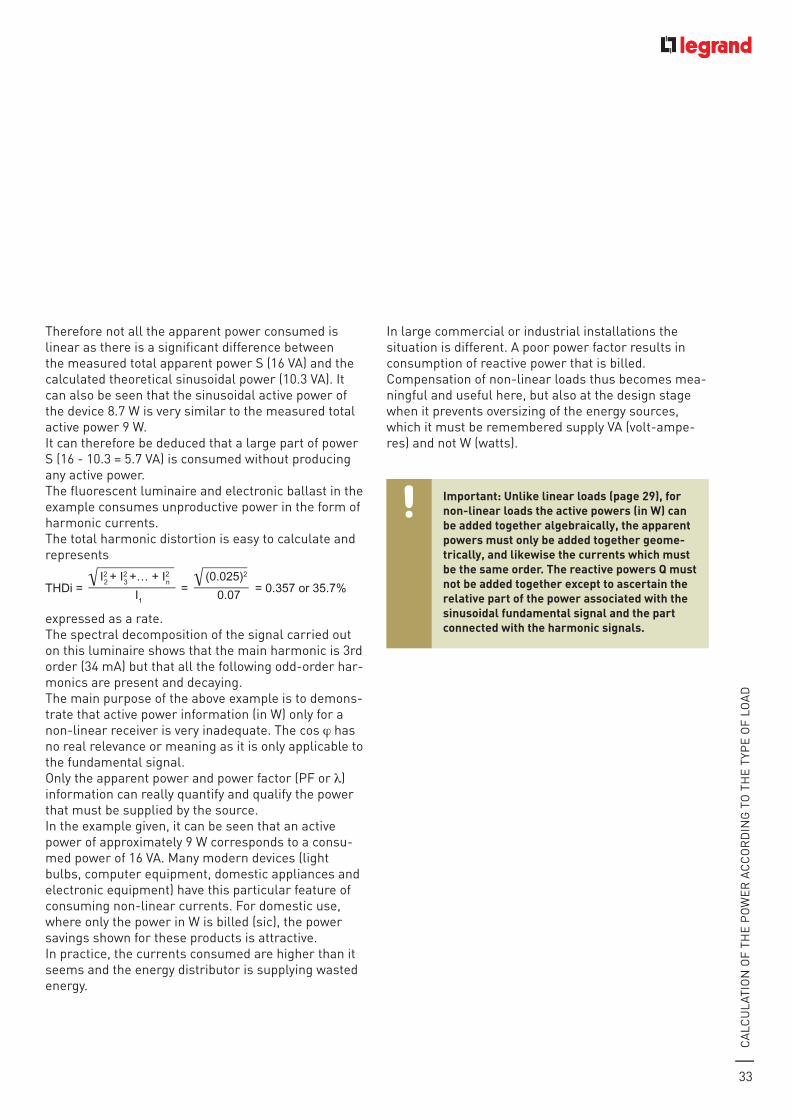
33
Ca
lCu
lati
on
of
the
po
we
r a
CC
or
din
g t
o t
he
typ
e o
f lo
ad
therefore not all the apparent power consumed is linear as there is a significant difference between the measured total apparent power S (16 Va) and the calculated theoretical sinusoidal power (10.3 Va). it can also be seen that the sinusoidal active power of the device 8.7 w is very similar to the measured total active power 9 w.it can therefore be deduced that a large part of power S (16 - 10.3 = 5.7 Va) is consumed without producing any active power.the fluorescent luminaire and electronic ballast in the example consumes unproductive power in the form of harmonic currents.the total harmonic distortion is easy to calculate and represents
K = 1 1 + THDi
2
THDi = I22 + I2
3 + I2
4 + … + I2
n
I1
THDi = = = 0.357 or 35.7% I22 + I2
3 +… + I2
n
I1
(0.025)2
0.07
Iph = I2 + (0.33 Ih)2 = 1.05 I
I = I2 fundamental + Σ I2 rmsharmonic
∞
2
IN = 3 x Iph
1 + 65 2Kph =
100
= 0.841
( (
1 + 33 2K = 1 = 0.95
100( (
1K
N 1 + THDi2=
1 + 65 2
100( (
( (3 THDi= = 1.63
100365
Ia =Pa
U x η x PF
Ia =Pa
3 x U x η x PF
expressed as a rate.the spectral decomposition of the signal carried out on this luminaire shows that the main harmonic is 3rd order (34 ma) but that all the following odd-order har-monics are present and decaying.the main purpose of the above example is to demons-trate that active power information (in w) only for a non-linear receiver is very inadequate. the cos ϕ has no real relevance or meaning as it is only applicable to the fundamental signal.only the apparent power and power factor (pf or λ) information can really quantify and qualify the power that must be supplied by the source.in the example given, it can be seen that an active power of approximately 9 w corresponds to a consu-med power of 16 Va. Many modern devices (light bulbs, computer equipment, domestic appliances and electronic equipment) have this particular feature of consuming non-linear currents. for domestic use, where only the power in w is billed (sic), the power savings shown for these products is attractive.in practice, the currents consumed are higher than it seems and the energy distributor is supplying wasted energy.
in large commercial or industrial installations the situation is different. a poor power factor results in consumption of reactive power that is billed.Compensation of non-linear loads thus becomes mea-ningful and useful here, but also at the design stage when it prevents oversizing of the energy sources, which it must be remembered supply Va (volt-ampe-res) and not w (watts).
important: unlike linear loads (page 29), for non-linear loads the active powers (in W) can be added together algebraically, the apparent powers must only be added together geome-trically, and likewise the currents which must be the same order. the reactive powers Q must not be added together except to ascertain the relative part of the power associated with the sinusoidal fundamental signal and the part connected with the harmonic signals.
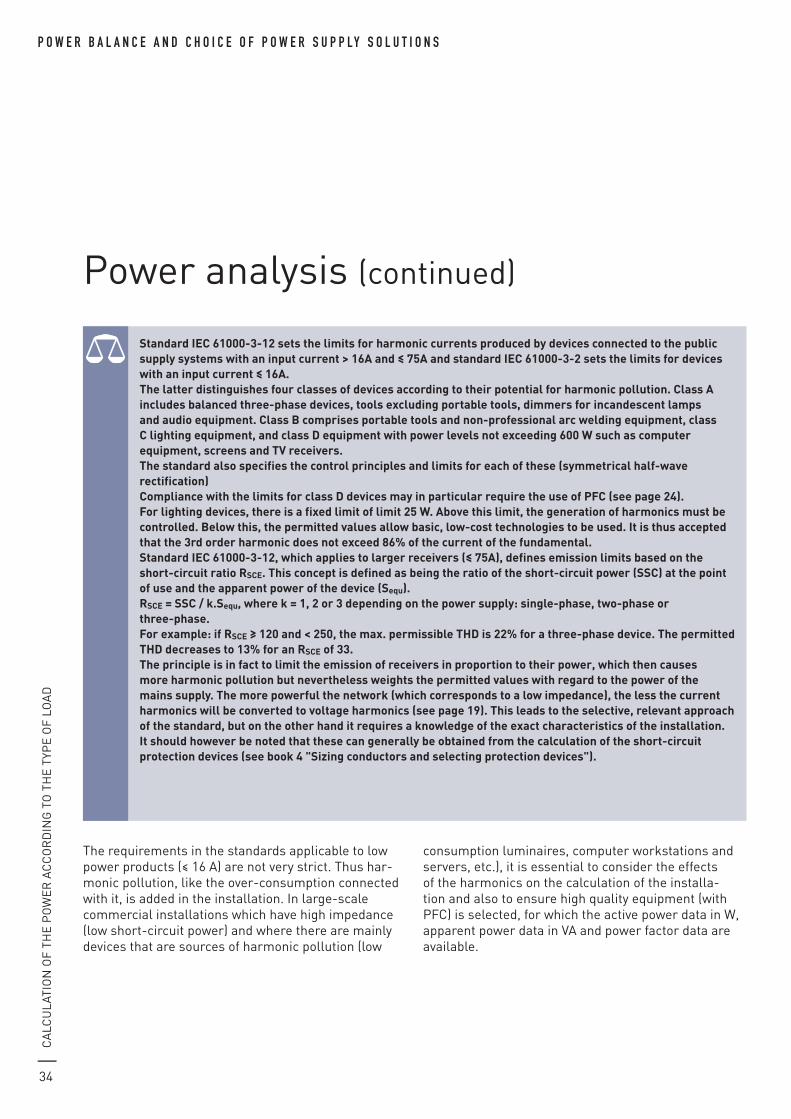
34
P o w e r b a l a n c e a n d c h o i c e o f P o w e r s u P P ly s o l u t i o n s C
alC
ula
tio
n o
f th
e p
ow
er
aC
Co
rd
ing
to
th
e t
ype
of
loa
d
power analysis (continued)
standard ieC 61000-3-12 sets the limits for harmonic currents produced by devices connected to the public supply systems with an input current > 16a and < 75a and standard ieC 61000-3-2 sets the limits for devices with an input current < 16a. the latter distinguishes four classes of devices according to their potential for harmonic pollution. Class a includes balanced three-phase devices, tools excluding portable tools, dimmers for incandescent lamps and audio equipment. Class B comprises portable tools and non-professional arc welding equipment, class C lighting equipment, and class D equipment with power levels not exceeding 600 W such as computer equipment, screens and tv receivers. the standard also specifies the control principles and limits for each of these (symmetrical half-wave rectification) Compliance with the limits for class D devices may in particular require the use of pFC (see page 24). For lighting devices, there is a fixed limit of limit 25 W. above this limit, the generation of harmonics must be controlled. Below this, the permitted values allow basic, low-cost technologies to be used. it is thus accepted that the 3rd order harmonic does not exceed 86% of the current of the fundamental.standard ieC 61000-3-12, which applies to larger receivers (< 75a), defines emission limits based on the short-circuit ratio rsCe. this concept is defined as being the ratio of the short-circuit power (ssC) at the point of use and the apparent power of the device (sequ). rsCe = ssC / k.sequ, where k = 1, 2 or 3 depending on the power supply: single-phase, two-phase or three-phase.For example: if rsCe > 120 and < 250, the max. permissible thD is 22% for a three-phase device. the permitted thD decreases to 13% for an rsCe of 33.the principle is in fact to limit the emission of receivers in proportion to their power, which then causes more harmonic pollution but nevertheless weights the permitted values with regard to the power of the mains supply. the more powerful the network (which corresponds to a low impedance), the less the current harmonics will be converted to voltage harmonics (see page 19). this leads to the selective, relevant approach of the standard, but on the other hand it requires a knowledge of the exact characteristics of the installation. it should however be noted that these can generally be obtained from the calculation of the short-circuit protection devices (see book 4 "sizing conductors and selecting protection devices").
the requirements in the standards applicable to low power products (< 16 a) are not very strict. thus har-monic pollution, like the over-consumption connected with it, is added in the installation. in large-scale commercial installations which have high impedance (low short-circuit power) and where there are mainly devices that are sources of harmonic pollution (low
consumption luminaires, computer workstations and servers, etc.), it is essential to consider the effects of the harmonics on the calculation of the installa-tion and also to ensure high quality equipment (with pfC) is selected, for which the active power data in w, apparent power data in Va and power factor data are available.
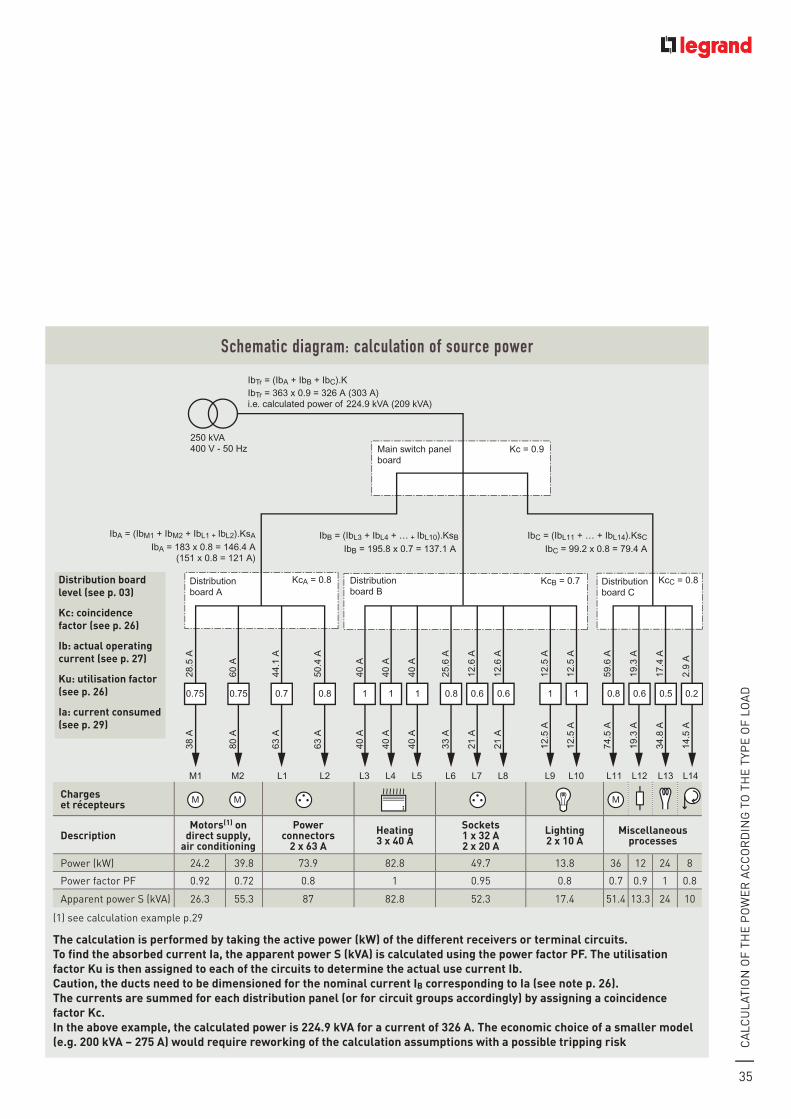
35
Ca
lCu
lati
on
of
the
po
we
r a
CC
or
din
g t
o t
he
typ
e o
f lo
ad
schematic diagram: calculation of source power
Charges et récepteurs
DescriptionMotors(1) on
direct supply, air conditioning
power connectors
2 x 63 aheating 3 x 40 a
sockets 1 x 32 a 2 x 20 a
lighting 2 x 10 a
Miscellaneous processes
power (kw) 24.2 39.8 73.9 82.8 49.7 13.8 36 12 24 8
power factor pf 0.92 0.72 0.8 1 0.95 0.8 0.7 0.9 1 0.8
apparent power S (kVa) 26.3 55.3 87 82.8 52.3 17.4 51.4 13.3 24 10
(1) see calculation example p.29
the calculation is performed by taking the active power (kW) of the different receivers or terminal circuits. to find the absorbed current ia, the apparent power s (kva) is calculated using the power factor pF. the utilisation factor Ku is then assigned to each of the circuits to determine the actual use current ib.Caution, the ducts need to be dimensioned for the nominal current iB corresponding to ia (see note p. 26).the currents are summed for each distribution panel (or for circuit groups accordingly) by assigning a coincidence factor Kc.in the above example, the calculated power is 224.9 kva for a current of 326 a. the economic choice of a smaller model (e.g. 200 kva – 275 a) would require reworking of the calculation assumptions with a possible tripping risk
M M M
40 A
40 A
40 A
25.6
A
12.6
A
12.6
A
12.5
A
12.5
A
59.6
A
19.3
A
17.4
A
2.9
A
28.5
A
60 A
44.1
A
50.4
A
40 A
40 A
40 A
33 A
21 A
21 A
12.5
A
12.5
A
74.5
A
19.3
A
34.8
A
14.5
A
38 A
80 A
63 A
63 A
KcA = 0.8Distribution board A
Distribution board B
Distributionboard C
KcB = 0.7 KcC = 0.8
Kc = 0.9Main switch panel board
M1 L1 L2 L3 L4 L5 L6 L7 L8 L9 L10 L11 L12 L13 L14 M2
IbTr = 363 x 0.9 = 326 A (303 A)i.e. calculated power of 224.9 kVA (209 kVA)
IbTr = (IbA + IbB + IbC).K
IbA = (IbM1 + IbM2 + IbL1 + IbL2).KsA
IbA = 183 x 0.8 = 146.4 A (151 x 0.8 = 121 A)
IbB = (IbL3 + IbL4 + … + IbL10).KsB
IbB = 195.8 x 0.7 = 137.1 A
IbC = (IbL11 + … + IbL14).KsC
IbC = 99.2 x 0.8 = 79.4 A
250 kVA400 V - 50 Hz
0.75 0.75 0.7 0.8 1 1 1 0.8 0.6 0.6 1 0.8 0.6 0.5 0.2 1
Distribution board level (see p. 03)
Kc: coincidence factor (see p. 26)
ib: actual operating current (see p. 27)
Ku: utilisation factor (see p. 26)
ia: current consumed (see p. 29)
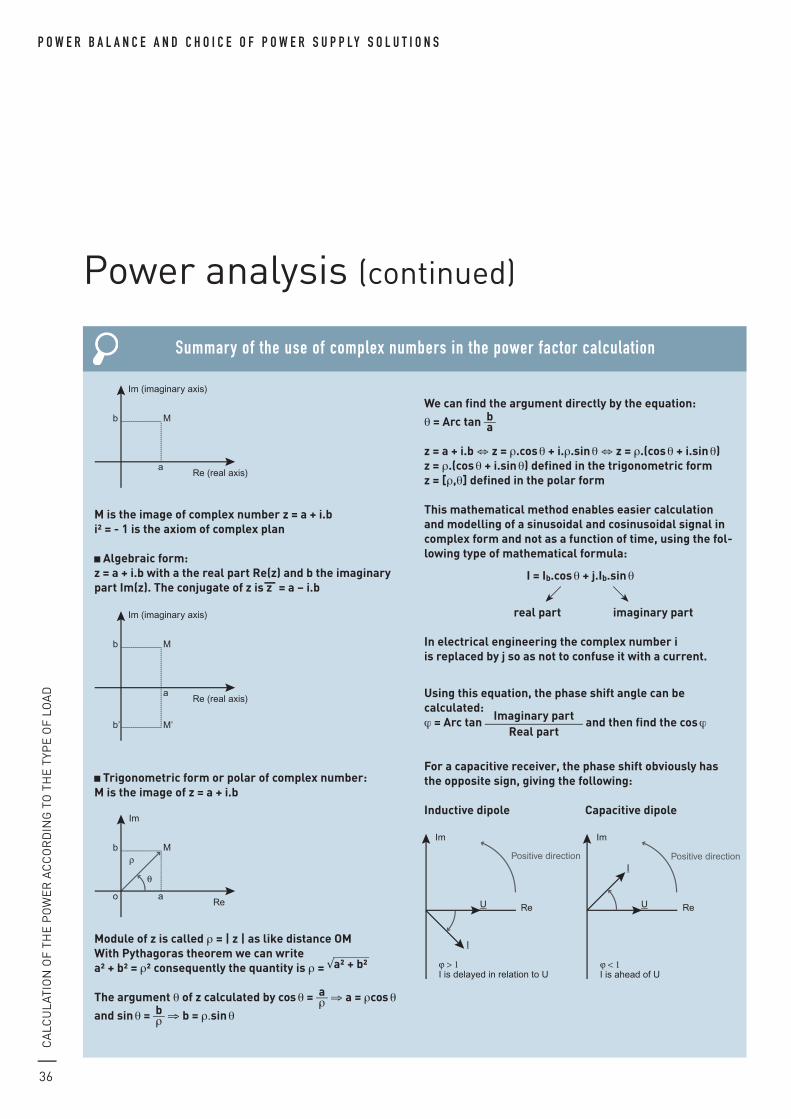
36
P o w e r b a l a n c e a n d c h o i c e o f P o w e r s u P P ly s o l u t i o n s C
alC
ula
tio
n o
f th
e p
ow
er
aC
Co
rd
ing
to
th
e t
ype
of
loa
d
power analysis (continued)
M is the image of complex number z = a + i.bi² = - 1 is the axiom of complex plan
algebraic form:z = a + i.b with a the real part re(z) and b the imaginary part im(z). the conjugate of z is z— = a – i.b
trigonometric form or polar of complex number:M is the image of z = a + i.b
Module of z is called ρ= | z | as like distance oMWith pythagoras theorem we can write a² + b² = ρ² consequently the quantity is ρ=√a² + b²
the argument θ of z calculated by cos θ = aρ ⇒a = ρcos θ
and sin θ = bρ
⇒b = ρ.sin θ
We can find the argument directly by the equation: θ = arc tan b
a
z = a + i.b ⇔ z = ρ.cos θ + i.ρ.sin θ ⇔ z = ρ.(cos θ + i.sin θ)z = ρ.(cos θ + i.sin θ) defined in the trigonometric formz = [ρ,θ] defined in the polar form
this mathematical method enables easier calculation and modelling of a sinusoidal and cosinusoidal signal in complex form and not as a function of time, using the fol-lowing type of mathematical formula:
i = ib.cos θ + j.ib.sin θ
real part imaginary part
in electrical engineering the complex number i is replaced by j so as not to confuse it with a current.
using this equation, the phase shift angle can be calculated:ϕ = arc tan imaginary part
real part and then find the cos ϕ
For a capacitive receiver, the phase shift obviously has the opposite sign, giving the following:
inductive dipole Capacitive dipole
summary of the use of complex numbers in the power factor calculation
Im (imaginary axis)
Re (real axis)
b M
a
Im (imaginary axis)
Re (real axis)
b
b’
M
M’
a
Im
Re
b M
ao
ρ
θ
Im
ReU
I
Positive direction
ϕ > 1I is delayed in relation to U
Im
ReU
Positive direction
ϕ < 1I is ahead of U
I
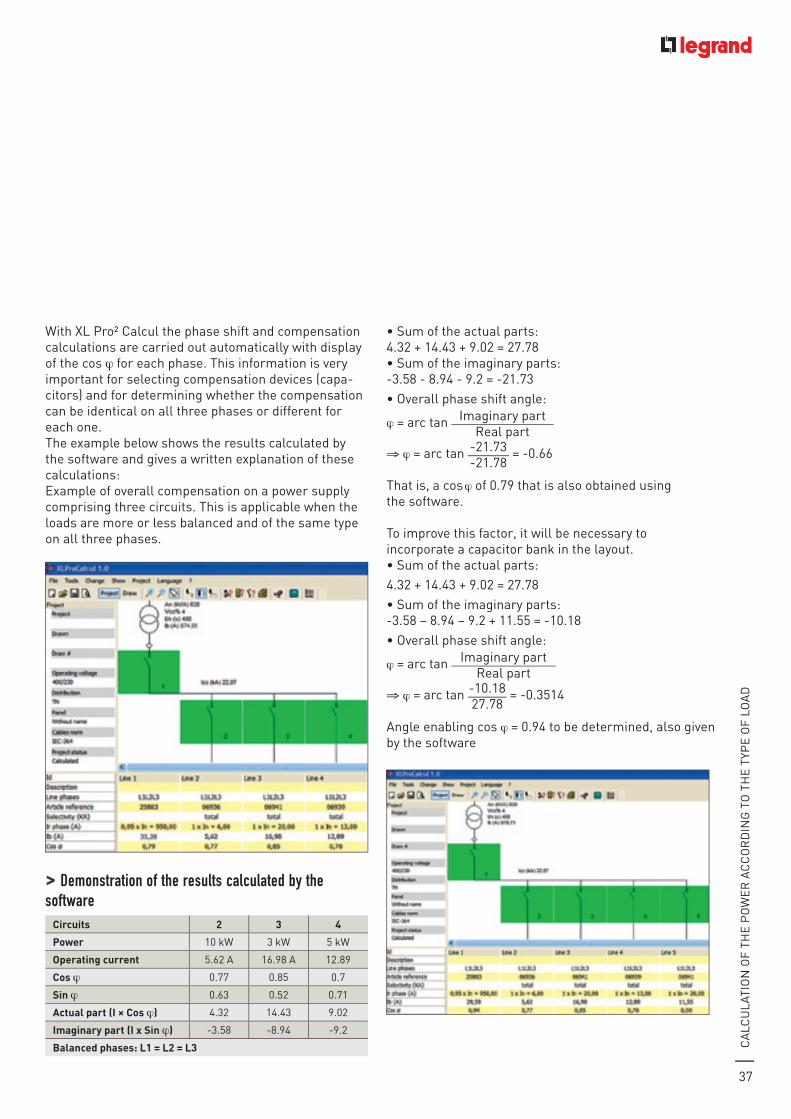
37
Ca
lCu
lati
on
of
the
po
we
r a
CC
or
din
g t
o t
he
typ
e o
f lo
ad
• Sum of the actual parts:4.32 + 14.43 + 9.02 = 27.78• Sum of the imaginary parts:-3.58 - 8.94 - 9.2 = -21.73• Overall phase shift angle:
ϕ = arc tan imaginary partreal part
⇒ϕ = arc tan -21.73-21.78
= -0.66
that is, a cos ϕ of 0.79 that is also obtained using the software.
to improve this factor, it will be necessary to incorporate a capacitor bank in the layout.• Sum of the actual parts:4.32 + 14.43 + 9.02 = 27.78• Sum of the imaginary parts:-3.58 – 8.94 – 9.2 + 11.55 = -10.18• Overall phase shift angle:
ϕ = arc tan imaginary partreal part
⇒ϕ = arc tan -10.1827.78
= -0.3514
angle enabling cos ϕ = 0.94 to be determined, also given by the software
with Xl pro² Calcul the phase shift and compensation calculations are carried out automatically with display of the cos ϕ for each phase. this information is very important for selecting compensation devices (capa-citors) and for determining whether the compensation can be identical on all three phases or different for each one.the example below shows the results calculated by the software and gives a written explanation of these calculations:example of overall compensation on a power supply comprising three circuits. this is applicable when the loads are more or less balanced and of the same type on all three phases.
> demonstration of the results calculated by the software
Circuits 2 3 4
power 10 kw 3 kw 5 kw
operating current 5.62 a 16.98 a 12.89
Cos ϕ 0.77 0.85 0.7
sin ϕ 0.63 0.52 0.71
actual part (i x Cos ϕ) 4.32 14.43 9.02
imaginary part (i x sin ϕ) -3.58 -8.94 -9.2
Balanced phases: l1 = l2 = l3
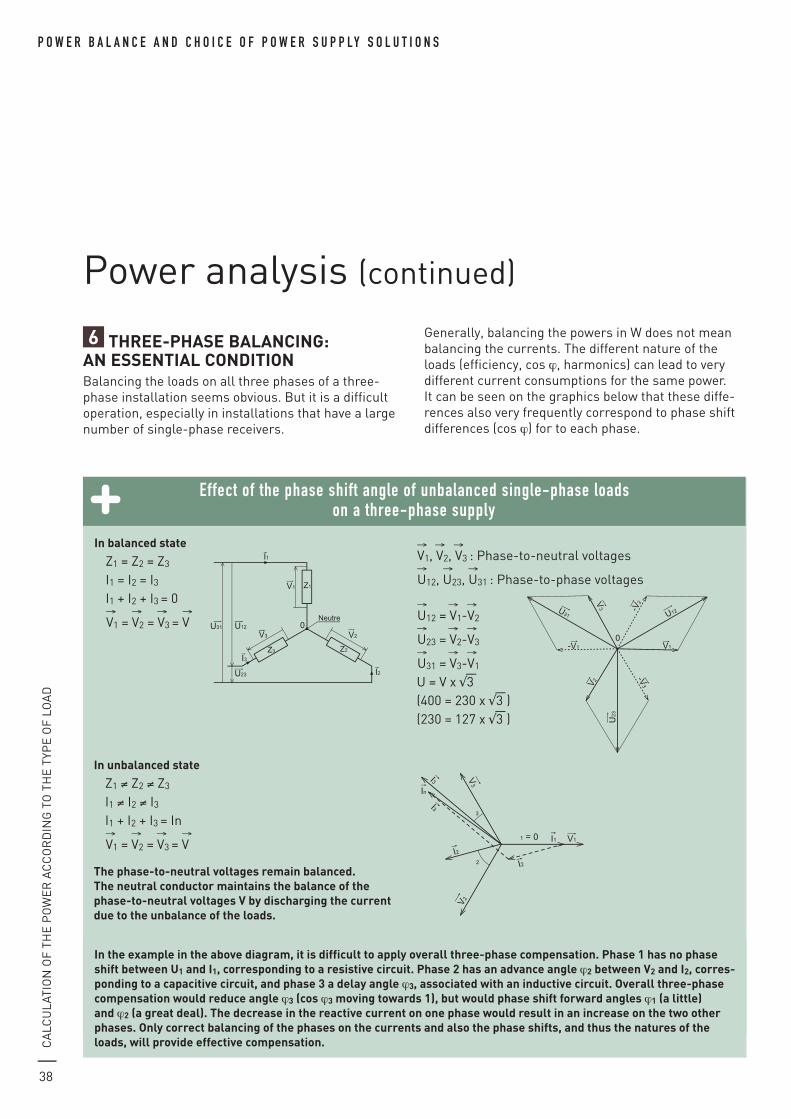
38
P o w e r b a l a n c e a n d c h o i c e o f P o w e r s u P P ly s o l u t i o n s C
alC
ula
tio
n o
f th
e p
ow
er
aC
Co
rd
ing
to
th
e t
ype
of
loa
d
6 three-phase BalanCing: an essential ConDitionBalancing the loads on all three phases of a three-phase installation seems obvious. But it is a difficult operation, especially in installations that have a large number of single-phase receivers.
generally, balancing the powers in w does not mean balancing the currents. the different nature of the loads (efficiency, cos ϕ, harmonics) can lead to very different current consumptions for the same power. it can be seen on the graphics below that these diffe-rences also very frequently correspond to phase shift differences (cos ϕ) for to each phase.
power analysis (continued)
in balanced state
Z1 = Z2 = Z3
i1 = i2 = i3
i1 + i2 + i3 = 0→ → → → V1 = V2 = V3 = V
→→ → V1, V2, V3 : phase-to-neutral voltages → → → u12, u23, u31 : phase-to-phase voltages
→ → → u12 = V1-V2 → → → u23 = V2-V3→ → → u31 = V3-V1
u = V x √3—
(400 = 230 x √3—
)(230 = 127 x √3
—)
in unbalanced state
Z1 ≠ Z2 ≠ Z3
i1 ≠ i2 ≠ i3
i1 + i2 + i3 = in→ → → → V1 = V2 = V3 = V
the phase-to-neutral voltages remain balanced. the neutral conductor maintains the balance of the phase-to-neutral voltages v by discharging the current due to the unbalance of the loads.
0
V3 -V
2
-V1 V1
V2
-V3
U12U31U
23
V1
V2
V3
I1
I2
I2
I3
I3
In
1 = 0
2
3
Neutre0
V1
V2V3
I1
I2
I3
U31 U12
U23
Z1
Z2Z3
effect of the phase shift angle of unbalanced single-phase loads on a three-phase supply
in the example in the above diagram, it is difficult to apply overall three-phase compensation. phase 1 has no phase shift between u1 and i1, corresponding to a resistive circuit. phase 2 has an advance angle ϕ2 between v2 and i2, corres-ponding to a capacitive circuit, and phase 3 a delay angle ϕ3, associated with an inductive circuit. overall three-phase compensation would reduce angle ϕ3 (cos ϕ3 moving towards 1), but would phase shift forward angles ϕ1 (a little) and ϕ2 (a great deal). the decrease in the reactive current on one phase would result in an increase on the two other phases. only correct balancing of the phases on the currents and also the phase shifts, and thus the natures of the loads, will provide effective compensation.
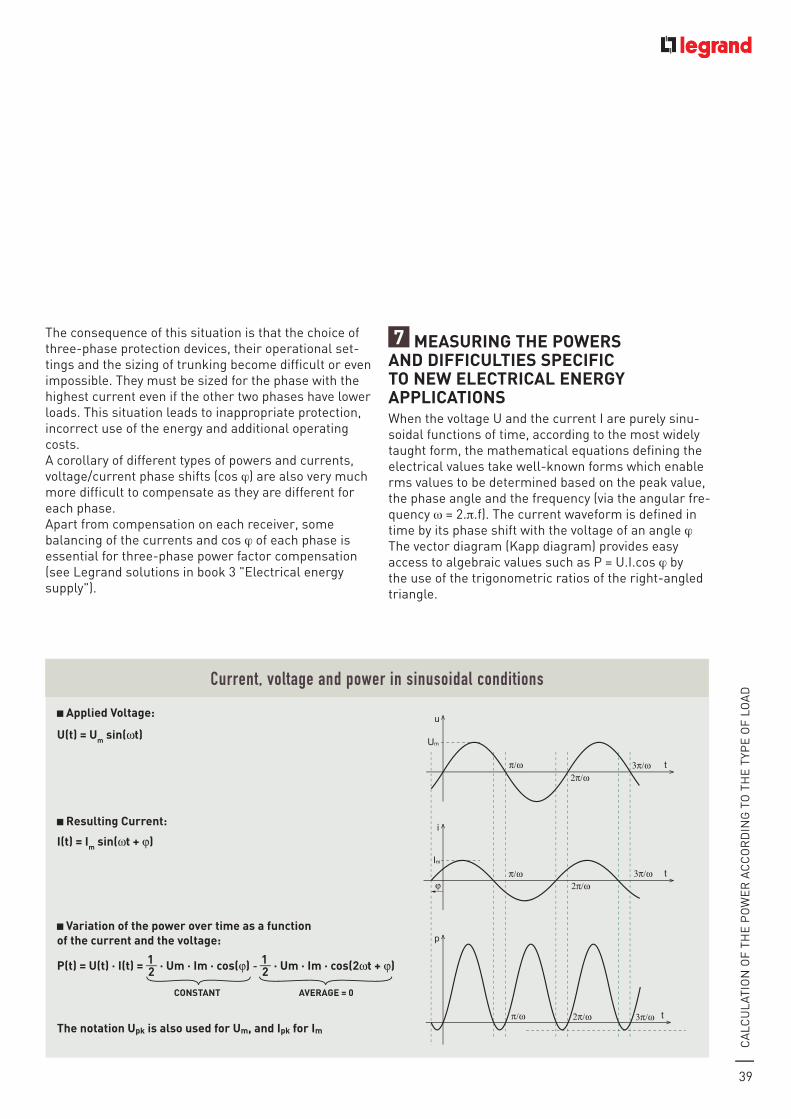
39
Ca
lCu
lati
on
of
the
po
we
r a
CC
or
din
g t
o t
he
typ
e o
f lo
ad
the consequence of this situation is that the choice of three-phase protection devices, their operational set-tings and the sizing of trunking become difficult or even impossible. they must be sized for the phase with the highest current even if the other two phases have lower loads. this situation leads to inappropriate protection, incorrect use of the energy and additional operating costs.a corollary of different types of powers and currents, voltage/current phase shifts (cos ϕ) are also very much more difficult to compensate as they are different for each phase.apart from compensation on each receiver, some balancing of the currents and cos ϕ of each phase is essential for three-phase power factor compensation (see legrand solutions in book 3 "electrical energy supply").
7 Measuring the poWers anD DiFFiCulties speCiFiC to neW eleCtriCal energy appliCationswhen the voltage u and the current i are purely sinu-soidal functions of time, according to the most widely taught form, the mathematical equations defining the electrical values take well-known forms which enable rms values to be determined based on the peak value, the phase angle and the frequency (via the angular fre-quency ω= 2.π.f). the current waveform is defined in time by its phase shift with the voltage of an angle ϕ the vector diagram (Kapp diagram) provides easy access to algebraic values such as p = u.i.cos ϕ by the use of the trigonometric ratios of the right-angled triangle.
applied voltage:ω = 2πf
U(t) = Um sin(ωt)
I(t) = Im sin(ωt + ϕ)
21
21P(t) = U(t) · I(t) = · Um · Im · cos(ϕ) - · Um · Im · cos(2ωt + ϕ)
CONSTANT AVERAGE = 0
U = ∫u2(t) · dtT
0T1
W = ∫P·dtt
0
I = ∫i2(t) · dtT
0T1
W = P·t
Paverage = ∫p(t) · dtT
0T1
P = tW
WR = Q·t
resulting Current:
ω = 2πf
U(t) = Um sin(ωt)
I(t) = Im sin(ωt + ϕ)
21
21P(t) = U(t) · I(t) = · Um · Im · cos(ϕ) - · Um · Im · cos(2ωt + ϕ)
CONSTANT AVERAGE = 0
U = ∫u2(t) · dtT
0T1
W = ∫P·dtt
0
I = ∫i2(t) · dtT
0T1
W = P·t
Paverage = ∫p(t) · dtT
0T1
P = tW
WR = Q·t
variation of the power over time as a function of the current and the voltage:
ω = 2πf
U(t) = Um sin(ωt)
I(t) = Im sin(ωt + ϕ)
21
21P(t) = U(t) · I(t) = · Um · Im · cos(ϕ) - · Um · Im · cos(2ωt + ϕ)
CONSTANT AVERAGE = 0
U = ∫u2(t) · dtT
0T1
W = ∫P·dtt
0
I = ∫i2(t) · dtT
0T1
W = P·t
Paverage = ∫p(t) · dtT
0T1
P = tW
WR = Q·t
the notation upk is also used for um, and ipk for im
current, voltage and power in sinusoidal conditions
u
tπ/ω2π/ω
3π/ω
Um
i
tπ/ω2π/ωϕ
3π/ωIm
p
tπ/ω 2π/ω 3π/ω
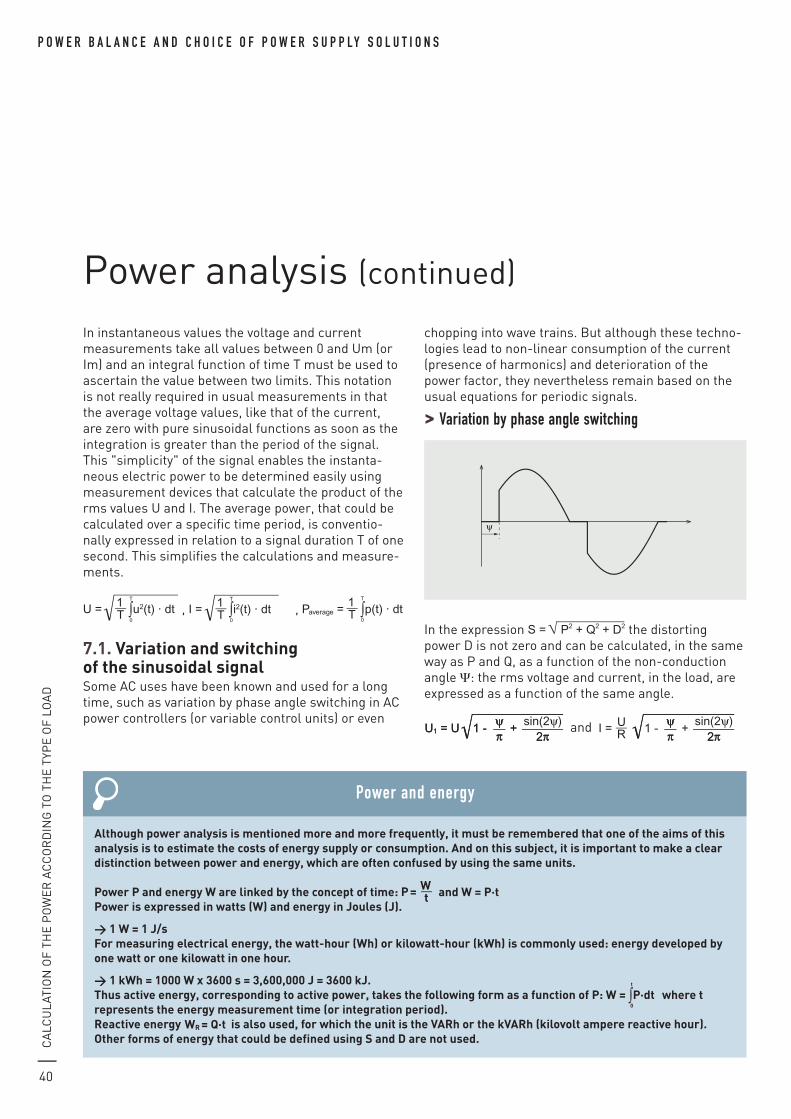
40
P o w e r b a l a n c e a n d c h o i c e o f P o w e r s u P P ly s o l u t i o n s C
alC
ula
tio
n o
f th
e p
ow
er
aC
Co
rd
ing
to
th
e t
ype
of
loa
d
in instantaneous values the voltage and current measurements take all values between 0 and um (or im) and an integral function of time t must be used to ascertain the value between two limits. this notation is not really required in usual measurements in that the average voltage values, like that of the current, are zero with pure sinusoidal functions as soon as the integration is greater than the period of the signal. this "simplicity" of the signal enables the instanta-neous electric power to be determined easily using measurement devices that calculate the product of the rms values u and i. the average power, that could be calculated over a specific time period, is conventio-nally expressed in relation to a signal duration t of one second. this simplifies the calculations and measure-ments.
ω = 2πf
U(t) = Um sin(ωt)
I(t) = Im sin(ωt + ϕ)
21
21P(t) = U(t) · I(t) = · Upk · Ipk · cos(ϕ) - · Upk · Ipk · cos(2ωt + ϕ)
CONSTANT AVERAGE = 0
U = ∫u2(t) · dtT
0T1
W = ∫P·dtt
0
I = ∫i2(t) · dtT
0T1
W = P·t
Paverage = ∫p(t) · dtT
0T1
P = tW
,
ω = 2πf
U(t) = Um sin(ωt)
I(t) = Im sin(ωt + ϕ)
21
21P(t) = U(t) · I(t) = · Upk · Ipk · cos(ϕ) - · Upk · Ipk · cos(2ωt + ϕ)
CONSTANT AVERAGE = 0
U = ∫u2(t) · dtT
0T1
W = ∫P·dtt
0
I = ∫i2(t) · dtT
0T1
W = P·t
Paverage = ∫p(t) · dtT
0T1
P = tW
,
ω = 2πf
U(t) = Um sin(ωt)
I(t) = Im sin(ωt + ϕ)
21
21P(t) = U(t) · I(t) = · Upk · Ipk · cos(ϕ) - · Upk · Ipk · cos(2ωt + ϕ)
CONSTANT AVERAGE = 0
U = ∫u2(t) · dtT
0T1
W = ∫P·dtt
0
I = ∫i2(t) · dtT
0T1
W = P·t
Paverage = ∫p(t) · dtT
0T1
P = tW7.1. variation and switching
of the sinusoidal signalSome aC uses have been known and used for a long time, such as variation by phase angle switching in aC power controllers (or variable control units) or even
chopping into wave trains. But although these techno-logies lead to non-linear consumption of the current (presence of harmonics) and deterioration of the power factor, they nevertheless remain based on the usual equations for periodic signals.
> Variation by phase angle switching
in the expression S = P2 + Q2 + D2 the distorting power d is not zero and can be calculated, in the same way as p and Q, as a function of the non-conduction angle Ψ: the rms voltage and current, in the load, are expressed as a function of the same angle.
πψ
2πU1 = U 1 - +
πψ
2πsin(2ψ)
U1 = U 1 - +
I = RU
S = RU2
P = RU2
D = - -RU2
PF =
πψ
2π1 - +
πψ
2πsin(2ψ)
πψ
2π1 - +
πψ
2πsin(2ψ)
πψ
2π1 - +
πψ
2πsin(2ψ)
Q = RU2
2π2π1 - cos(2ψ)
2π2π1 - cos(2ψ)
πψ
2π1 - +
πψ
2πsin(2ψ)
πψ
2π1 - +
πψ
2πsin(2ψ) 2
πψ
2π1 - +
πψ
2πsin(2ψ)
and
πψ
2πU1 = U 1 - +
πψ
2πsin(2ψ)
U1 = U 1 - +
I = RU
S = RU2
P = RU2
D = - -RU2
PF =
πψ
2π1 - +
πψ
2πsin(2ψ)
πψ
2π1 - +
πψ
2πsin(2ψ)
πψ
2π1 - +
πψ
2πsin(2ψ)
Q = RU2
2π2π1 - cos(2ψ)
2π2π1 - cos(2ψ)
πψ
2π1 - +
πψ
2πsin(2ψ)
πψ
2π1 - +
πψ
2πsin(2ψ) 2
πψ
2π1 - +
πψ
2πsin(2ψ)
power analysis (continued)
although power analysis is mentioned more and more frequently, it must be remembered that one of the aims of this analysis is to estimate the costs of energy supply or consumption. and on this subject, it is important to make a clear distinction between power and energy, which are often confused by using the same units.
power p and energy W are linked by the concept of time:
ω = 2πf
U(t) = Um sin(ωt)
I(t) = Im sin(ωt + ϕ)
21
21P(t) = U(t) · I(t) = · Um · Im · cos(ϕ) - · Um · Im · cos(2ωt + ϕ)
CONSTANT AVERAGE = 0
U = ∫u2(t) · dtT
0T1
W = ∫P·dtt
0
I = ∫i2(t) · dtT
0T1
W = P·t
Paverage = ∫p(t) · dtT
0T1
P = tW
WR = Q·t
and
ω = 2πf
U(t) = Um sin(ωt)
I(t) = Im sin(ωt + ϕ)
21
21P(t) = U(t) · I(t) = · Um · Im · cos(ϕ) - · Um · Im · cos(2ωt + ϕ)
CONSTANT AVERAGE = 0
U = ∫u2(t) · dtT
0T1
W = ∫P·dtt
0
I = ∫i2(t) · dtT
0T1
W = P·t
Paverage = ∫p(t) · dtT
0T1
P = tW
WR = Q·t
power is expressed in watts (W) and energy in Joules (J).
w 1 W = 1 J/sFor measuring electrical energy, the watt-hour (Wh) or kilowatt-hour (kWh) is commonly used: energy developed by one watt or one kilowatt in one hour.
w 1 kWh = 1000 W x 3600 s = 3,600,000 J = 3600 kJ. thus active energy, corresponding to active power, takes the following form as a function of p:
ω = 2πf
U(t) = Um sin(ωt)
I(t) = Im sin(ωt + ϕ)
21
21P(t) = U(t) · I(t) = · Um · Im · cos(ϕ) - · Um · Im · cos(2ωt + ϕ)
CONSTANT AVERAGE = 0
U = ∫u2(t) · dtT
0T1
W = ∫P·dtt
0
I = ∫i2(t) · dtT
0T1
W = P·t
Paverage = ∫p(t) · dtT
0T1
P = tW
WR = Q·t
where t represents the energy measurement time (or integration period). reactive energy
ω = 2πf
U(t) = Um sin(ωt)
I(t) = Im sin(ωt + ϕ)
21
21P(t) = U(t) · I(t) = · Um · Im · cos(ϕ) - · Um · Im · cos(2ωt + ϕ)
CONSTANT AVERAGE = 0
U = ∫u2(t) · dtT
0T1
W = ∫P·dtt
0
I = ∫i2(t) · dtT
0T1
W = P·t
Paverage = ∫p(t) · dtT
0T1
P = tW
WR = Q·t is also used, for which the unit is the varh or the kvarh (kilovolt ampere reactive hour). other forms of energy that could be defined using s and D are not used.
Power and energy
ψ
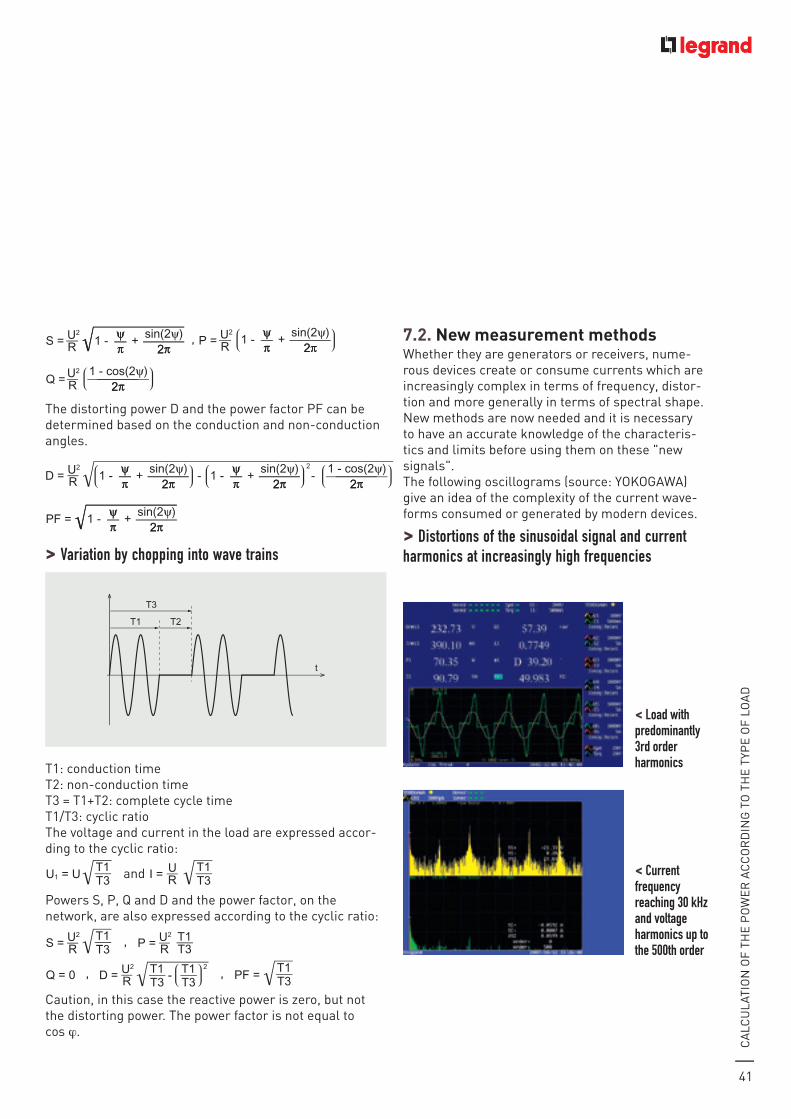
41
Ca
lCu
lati
on
of
the
po
we
r a
CC
or
din
g t
o t
he
typ
e o
f lo
ad
πψ
2πU1 = U 1 - +
πψ
2πsin(2ψ)
U1 = U 1 - +
I = RU
S = RU2
P = RU2
D = - -RU2
PF =
πψ
2π1 - +
πψ
2πsin(2ψ)
πψ
2π1 - +
πψ
2πsin(2ψ)
πψ
2π1 - +
πψ
2πsin(2ψ)
Q = RU2
2π2π1 - cos(2ψ)
2π2π1 - cos(2ψ)
πψ
2π1 - +
πψ
2πsin(2ψ)
πψ
2π1 - +
πψ
2πsin(2ψ) 2
πψ
2π1 - +
πψ
2πsin(2ψ)
,
πψ
2πU1 = U 1 - +
πψ
2πsin(2ψ)
U1 = U 1 - +
I = RU
S = RU2
P = RU2
D = - -RU2
PF =
πψ
2π1 - +
πψ
2πsin(2ψ)
πψ
2π1 - +
πψ
2πsin(2ψ)
πψ
2π1 - +
πψ
2πsin(2ψ)
Q = RU2
2π2π1 - cos(2ψ)
2π2π1 - cos(2ψ)
πψ
2π1 - +
πψ
2πsin(2ψ)
πψ
2π1 - +
πψ
2πsin(2ψ) 2
πψ
2π1 - +
πψ
2πsin(2ψ)
πψ
2πU1 = U 1 - +
πψ
2πsin(2ψ)
U1 = U 1 - +
I = RU
S = RU2
P = RU2
D = - -RU2
PF =
πψ
2π1 - +
πψ
2πsin(2ψ)
πψ
2π1 - +
πψ
2πsin(2ψ)
πψ
2π1 - +
πψ
2πsin(2ψ)
Q = RU2
2π2π1 - cos(2ψ)
2π2π1 - cos(2ψ)
πψ
2π1 - +
πψ
2πsin(2ψ)
πψ
2π1 - +
πψ
2πsin(2ψ) 2
πψ
2π1 - +
πψ
2πsin(2ψ)
the distorting power d and the power factor pf can be determined based on the conduction and non-conduction angles.
πψ
2πU1 = U 1 - +
πψ
2πsin(2ψ)
U1 = U 1 - +
I = RU
S = RU2
P = RU2
D = - -RU2
PF =
πψ
2π1 - +
πψ
2πsin(2ψ)
πψ
2π1 - +
πψ
2πsin(2ψ)
πψ
2π1 - +
πψ
2πsin(2ψ)
Q = RU2
2π2π1 - cos(2ψ)
2π2π1 - cos(2ψ)
πψ
2π1 - +
πψ
2πsin(2ψ)
πψ
2π1 - +
πψ
2πsin(2ψ) 2
πψ
2π1 - +
πψ
2πsin(2ψ)
> Variation by chopping into wave trains
t
T1 T2
T3
t1: conduction timet2: non-conduction timet3 = t1+t2: complete cycle timet1/t3: cyclic ratiothe voltage and current in the load are expressed accor-ding to the cyclic ratio:
T3T1
U1 = U
T3T1
I = RU
T3T1
S = RU2
T3T1P = R
U2
Q = 0
D = -RU2 2
T3T1
T3T1
PF = T3T1
and
T3T1
U1 = U
T3T1
I = RU
T3T1
S = RU2
T3T1P = R
U2
Q = 0
D = -RU2 2
T3T1
T3T1
PF = T3T1
powers S, p, Q and d and the power factor, on the network, are also expressed according to the cyclic ratio:
T3T1
U1 = U
T3T1
I = RU
T3T1
S = RU2
T3T1P = R
U2
Q = 0
D = -RU2 2
T3T1
T3T1
PF = T3T1
,
T3T1
U1 = U
T3T1
I = RU
T3T1
S = RU2
T3T1P = R
U2
Q = 0
D = -RU2 2
T3T1
T3T1
PF = T3T1
T3T1
U1 = U
T3T1
I = RU
T3T1
S = RU2
T3T1P = R
U2
Q = 0
D = -RU2 2
T3T1
T3T1
PF = T3T1
,
T3T1
U1 = U
T3T1
I = RU
T3T1
S = RU2
T3T1P = R
U2
Q = 0
D = -RU2 2
T3T1
T3T1
PF = T3T1
,
T3T1
U1 = U
T3T1
I = RU
T3T1
S = RU2
T3T1P = R
U2
Q = 0
D = -RU2 2
T3T1
T3T1
PF = T3T1
Caution, in this case the reactive power is zero, but not the distorting power. the power factor is not equal to cos ϕ.
7.2. new measurement methodswhether they are generators or receivers, nume-rous devices create or consume currents which are increasingly complex in terms of frequency, distor-tion and more generally in terms of spectral shape. new methods are now needed and it is necessary to have an accurate knowledge of the characteris-tics and limits before using them on these "new signals".the following oscillograms (source: yoKogawa) give an idea of the complexity of the current wave-forms consumed or generated by modern devices.
> distortions of the sinusoidal signal and current harmonics at increasingly high frequencies
< load with predominantly 3rd order harmonics
< current frequency reaching 30 khz and voltage harmonics up to the 500th order
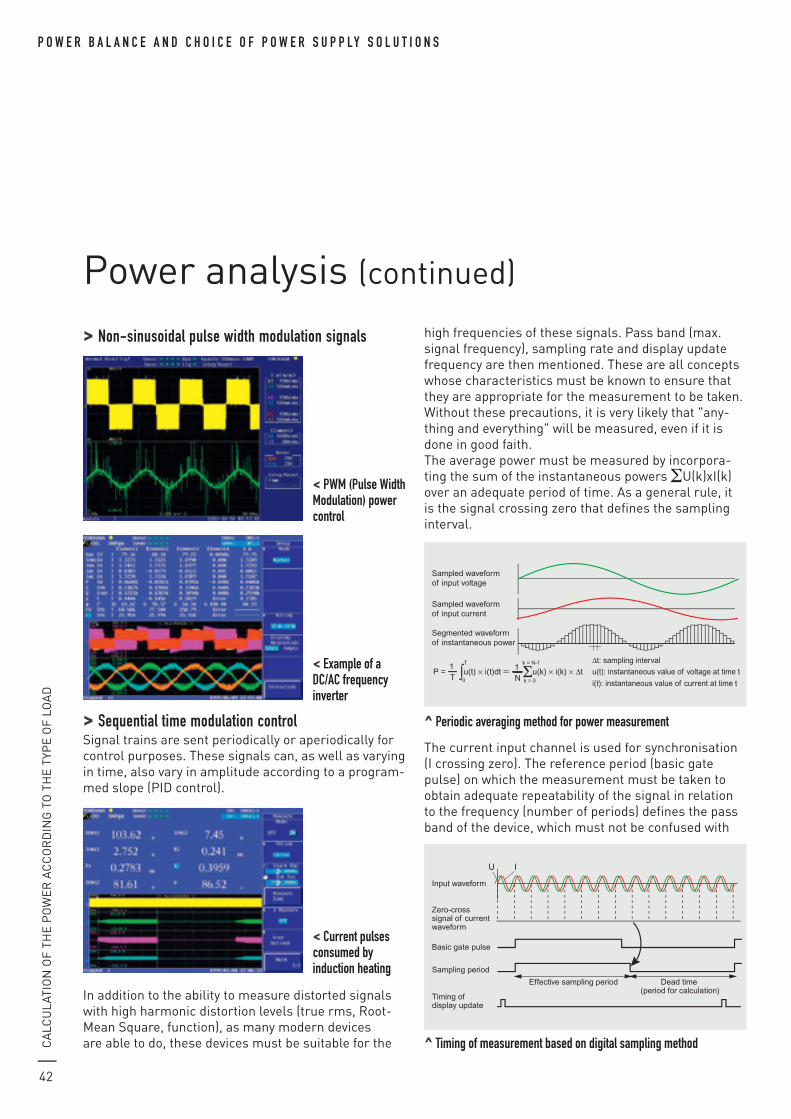
42
P o w e r b a l a n c e a n d c h o i c e o f P o w e r s u P P ly s o l u t i o n s C
alC
ula
tio
n o
f th
e p
ow
er
aC
Co
rd
ing
to
th
e t
ype
of
loa
d
> non-sinusoidal pulse width modulation signals
> sequential time modulation controlSignal trains are sent periodically or aperiodically for control purposes. these signals can, as well as varying in time, also vary in amplitude according to a program-med slope (pid control).
in addition to the ability to measure distorted signals with high harmonic distortion levels (true rms, root-Mean Square, function), as many modern devices are able to do, these devices must be suitable for the
high frequencies of these signals. pass band (max. signal frequency), sampling rate and display update frequency are then mentioned. these are all concepts whose characteristics must be known to ensure that they are appropriate for the measurement to be taken.without these precautions, it is very likely that "any-thing and everything" will be measured, even if it is done in good faith.the average power must be measured by incorpora-ting the sum of the instantaneous powers Σu(k)xi(k) over an adequate period of time. as a general rule, it is the signal crossing zero that defines the sampling interval.
the current input channel is used for synchronisation (i crossing zero). the reference period (basic gate pulse) on which the measurement must be taken to obtain adequate repeatability of the signal in relation to the frequency (number of periods) defines the pass band of the device, which must not be confused with
power analysis (continued)
< PwM (Pulse width Modulation) power control
< example of a dc/ac frequency inverter
^ Periodic averaging method for power measurement
< current pulses consumed by induction heating
Sampled waveform of input voltage
∆t: sampling intervalu(t): instantaneous value of voltage at time t
i(t): instantaneous value of current at time t
Sampled waveform of input current
Segmented waveform of instantaneous power
P = ∫u(t) × i(t)dt ≈ Σu(k) × i(k) × ∆t1T
1N0
k = N-1T
k = 0
^ timing of measurement based on digital sampling method
Input waveform
Zero-cross signal of current waveform
Basic gate pulse
Sampling period
Timing of display update
Effective sampling period Dead time (period for calculation)
U I
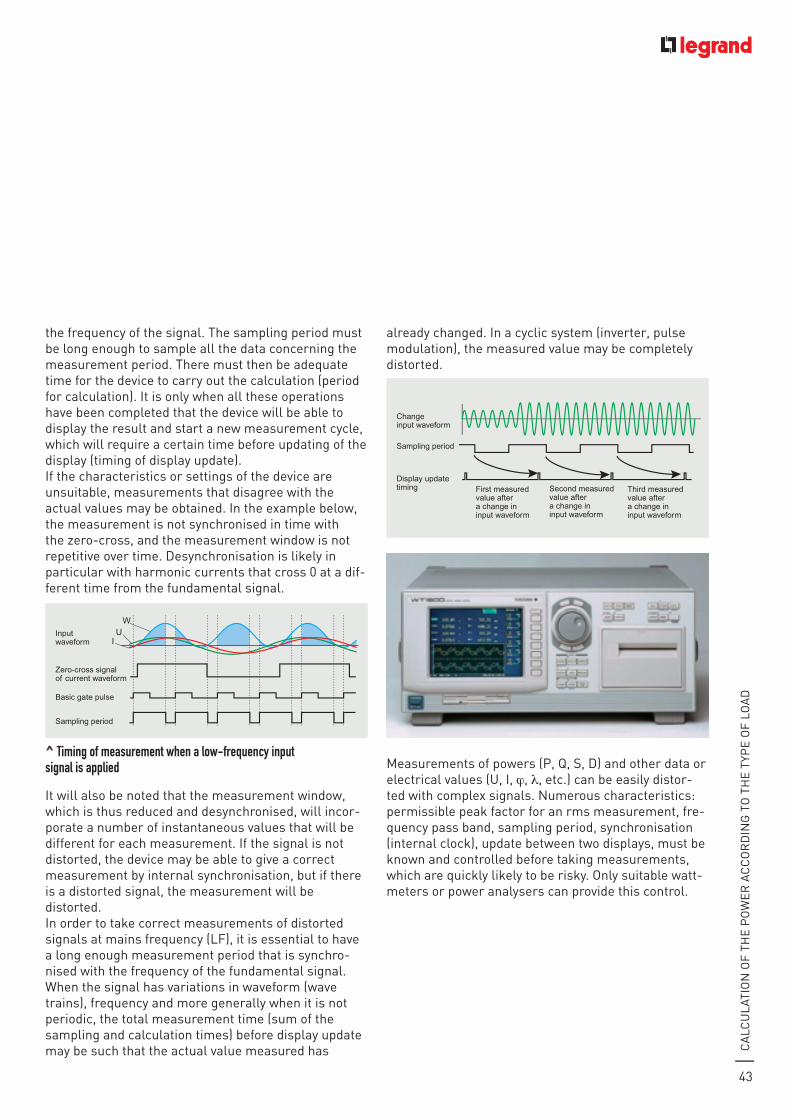
43
Ca
lCu
lati
on
of
the
po
we
r a
CC
or
din
g t
o t
he
typ
e o
f lo
ad
the frequency of the signal. the sampling period must be long enough to sample all the data concerning the measurement period. there must then be adequate time for the device to carry out the calculation (period for calculation). it is only when all these operations have been completed that the device will be able to display the result and start a new measurement cycle, which will require a certain time before updating of the display (timing of display update).if the characteristics or settings of the device are unsuitable, measurements that disagree with the actual values may be obtained. in the example below, the measurement is not synchronised in time with the zero-cross, and the measurement window is not repetitive over time. desynchronisation is likely in particular with harmonic currents that cross 0 at a dif-ferent time from the fundamental signal.
it will also be noted that the measurement window, which is thus reduced and desynchronised, will incor-porate a number of instantaneous values that will be different for each measurement. if the signal is not distorted, the device may be able to give a correct measurement by internal synchronisation, but if there is a distorted signal, the measurement will be distorted.in order to take correct measurements of distorted signals at mains frequency (lf), it is essential to have a long enough measurement period that is synchro-nised with the frequency of the fundamental signal.when the signal has variations in waveform (wave trains), frequency and more generally when it is not periodic, the total measurement time (sum of the sampling and calculation times) before display update may be such that the actual value measured has
already changed. in a cyclic system (inverter, pulse modulation), the measured value may be completely distorted.
Measurements of powers (p, Q, S, d) and other data or electrical values (u, i, ϕ, λ, etc.) can be easily distor-ted with complex signals. numerous characteristics: permissible peak factor for an rms measurement, fre-quency pass band, sampling period, synchronisation (internal clock), update between two displays, must be known and controlled before taking measurements, which are quickly likely to be risky. only suitable watt-meters or power analysers can provide this control.
Change input waveform
Sampling period
Display update timing First measured
value after a change in input waveform
Third measured value after a change in input waveform
Second measuredvalue after a change in input waveform
^ timing of measurement when a low-frequency input signal is applied
Input waveform
Zero-cross signal of current waveform
Basic gate pulse
Sampling period
UI
W
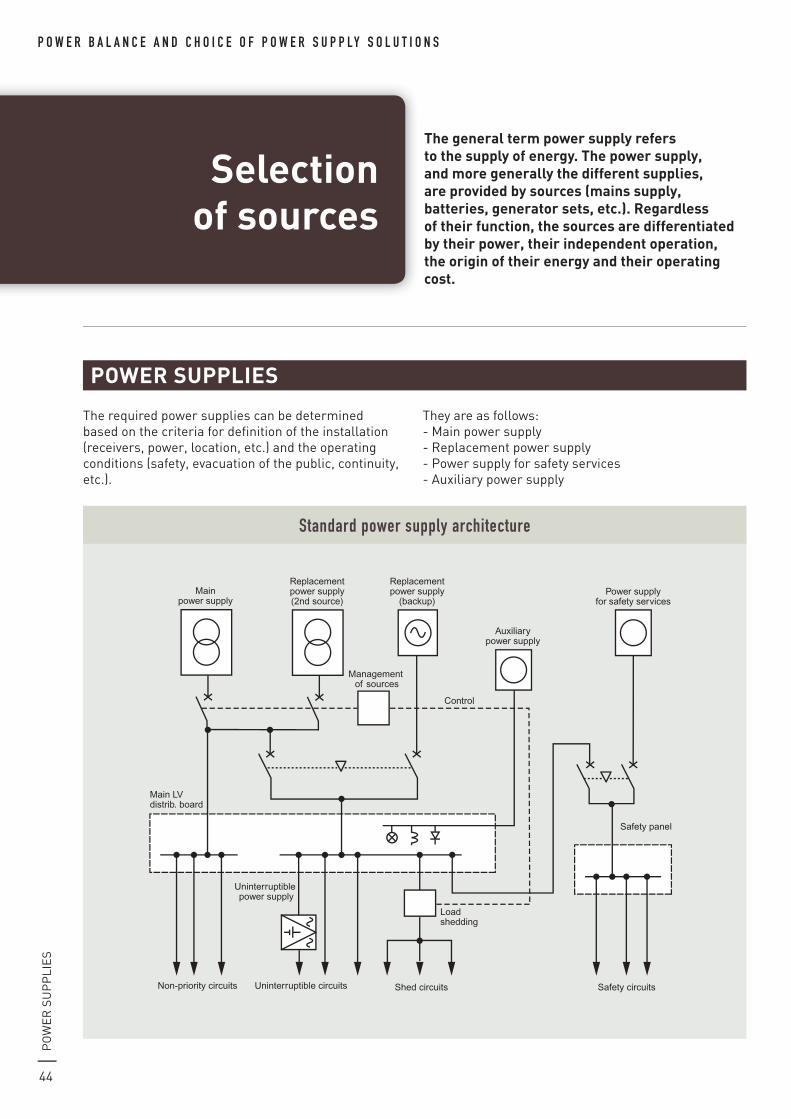
44
P o w e r b a l a n c e a n d c h o i c e o f P o w e r s u P P ly s o l u t i o n sp
ow
er
Su
pp
lie
S
selection of sources
the general term power supply refers to the supply of energy. the power supply, and more generally the different supplies, are provided by sources (mains supply, batteries, generator sets, etc.). regardless of their function, the sources are differentiated by their power, their independent operation, the origin of their energy and their operating cost.
the required power supplies can be determined based on the criteria for definition of the installation (receivers, power, location, etc.) and the operating conditions (safety, evacuation of the public, continuity, etc.).
they are as follows:- Main power supply- replacement power supply- power supply for safety services- auxiliary power supply
Replacement power supply
(backup)
Replacement power supply(2nd source)
Auxiliary power supply
Uninterruptible power supply
Control
Management of sources
Shed circuitsNon-priority circuits
Load shedding
Main LV distrib. board
Uninterruptible circuits Safety circuits
Power supply for safety services
Safety panel
Main power supply
standard power supply architecture
poWer supplies

45
po
we
r S
up
pli
eS
1 Main poWer supplythis is intended to supply the installation continuously. it generally comes from the public distribution network. the choice between high and low voltage is made according to the power requirement (see book 3 “electrical energy supply”)
2 replaCeMent poWer supplythis is intended to replace the main power supply. it is used:- either in the event of failure (backup), to maintain operation (hospitals, computers, industrial processes, food processing, military applications, retail supersto-res, etc.)- or for economic reasons, replacing all or part of the main power supply (load shedding option, bi-energy, renewable energies, etc.).
3 poWer supply For saFety serviCesthis is intended to maintain the power supply by sup-plying the necessary energy to ensure safety of the site in the event of failure of the main and/or replacement power supply.
the power supply must be maintained for:- Safety installations that must operate in the event of fire (minimum lighting, signalling, fire alarm and safety, smoke clearance, etc.)- other safety installations such as remote control systems, telecommunications, equipment involved in the safety of people (lifts, emergency lighting, operating theatre, etc.).they are characterised by how they are switched on (automatic or manual) and their stand-alone operation.
4 auxiliary poWer supplythis is intended for the operation of “auxiliaries” (control and signalling circuits and devices). it is provi-ded by a separate source which may or may not come from the main power supply. its independence gives the installation a degree of operational safety. it often has a different voltage or is of a different type from the main power supply (example: elV aC or dC). when it is protected and it meets certain criteria (power, stand-alone operation, etc.) it can be similar to a power supply for safety services.
^ Zucchini dry-type transformers for main power supply
^ supply of the auxiliaries adapted to the voltage and power requirements with legrand control and signalling transformers
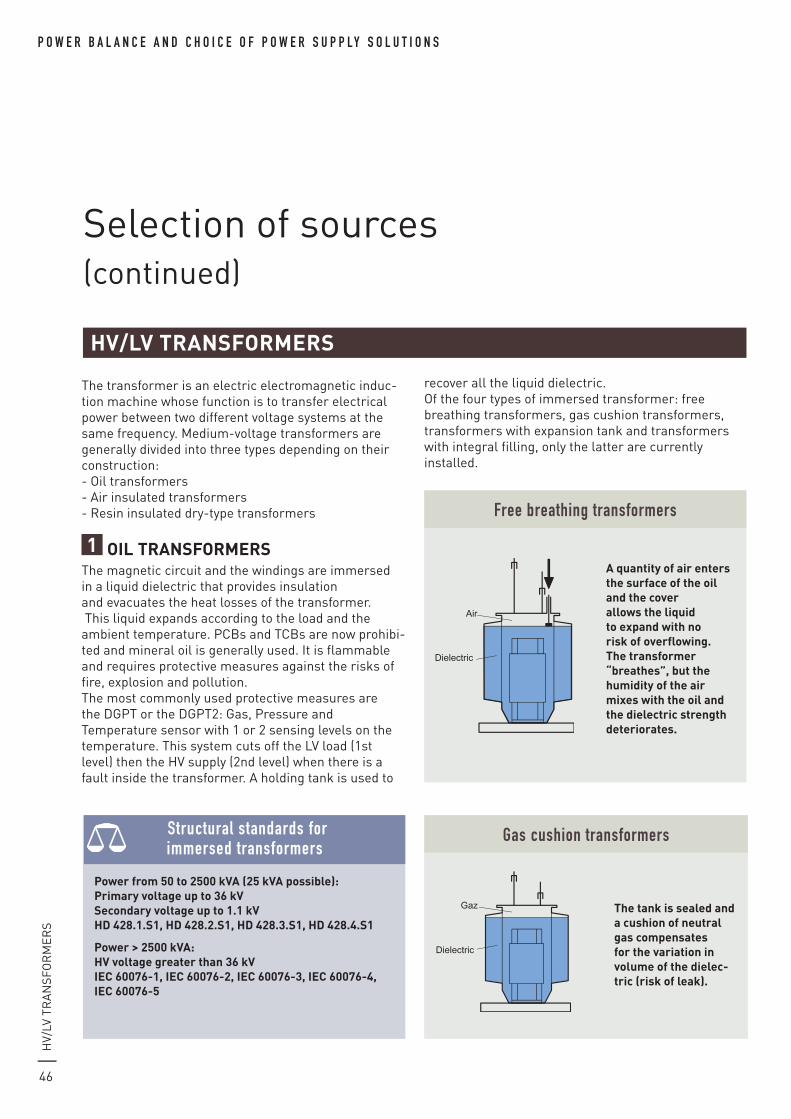
46
P o w e r b a l a n c e a n d c h o i c e o f P o w e r s u P P ly s o l u t i o n s
Selection of sources (continued)
hV/
lV t
ra
nSf
or
Me
rS
hv/lv transForMers
the transformer is an electric electromagnetic induc-tion machine whose function is to transfer electrical power between two different voltage systems at the same frequency. Medium-voltage transformers are generally divided into three types depending on their construction:- oil transformers- air insulated transformers- resin insulated dry-type transformers
1 oil transForMersthe magnetic circuit and the windings are immersed in a liquid dielectric that provides insulation and evacuates the heat losses of the transformer. this liquid expands according to the load and the ambient temperature. pCBs and tCBs are now prohibi-ted and mineral oil is generally used. it is flammable and requires protective measures against the risks of fire, explosion and pollution.the most commonly used protective measures are the dgpt or the dgpt2: gas, pressure and temperature sensor with 1 or 2 sensing levels on the temperature. this system cuts off the lV load (1st level) then the hV supply (2nd level) when there is a fault inside the transformer. a holding tank is used to
Dielectric
Air
free breathing transformers
a quantity of air enters the surface of the oil and the cover allows the liquid to expand with no risk of overflowing. the transformer “breathes”, but the humidity of the air mixes with the oil and the dielectric strength deteriorates.
Dielectric
Gaz
Gas cushion transformers
the tank is sealed and a cushion of neutral gas compensates for the variation in volume of the dielec-tric (risk of leak).
recover all the liquid dielectric.of the four types of immersed transformer: free breathing transformers, gas cushion transformers, transformers with expansion tank and transformers with integral filling, only the latter are currently installed.
power from 50 to 2500 kva (25 kva possible):primary voltage up to 36 kvsecondary voltage up to 1.1 kvhD 428.1.s1, hD 428.2.s1, hD 428.3.s1, hD 428.4.s1
power > 2500 kva:hv voltage greater than 36 kvieC 60076-1, ieC 60076-2, ieC 60076-3, ieC 60076-4, ieC 60076-5
structural standards for immersed transformers
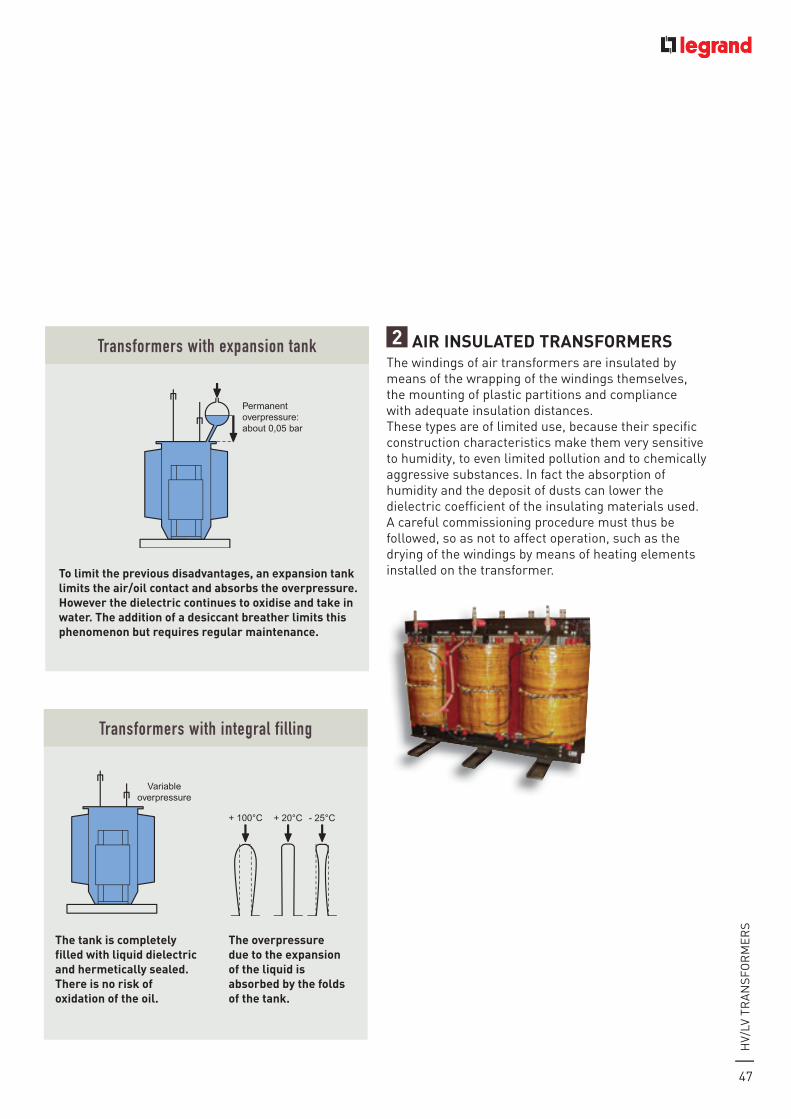
47
hV/
lV t
ra
nSf
or
Me
rS
2 air insulateD transForMersthe windings of air transformers are insulated by means of the wrapping of the windings themselves, the mounting of plastic partitions and compliance with adequate insulation distances.these types are of limited use, because their specifi c construction characteristics make them very sensitive to humidity, to even limited pollution and to chemically aggressive substances. in fact the absorption of humidity and the deposit of dusts can lower the dielectric coeffi cient of the insulating materials used. a careful commissioning procedure must thus be followed, so as not to affect operation, such as the drying of the windings by means of heating elements installed on the transformer.
Permanent overpressure: about 0,05 bar
transformers with expansion tank
to limit the previous disadvantages, an expansion tank limits the air/oil contact and absorbs the overpressure. however the dielectric continues to oxidise and take in water. the addition of a desiccant breather limits this phenomenon but requires regular maintenance.
Variableoverpressure
transformers with integral filling
the tank is completely filled with liquid dielectric and hermetically sealed. there is no risk of oxidation of the oil.
the overpressure due to the expansion of the liquid is absorbed by the folds of the tank.
+ 100°C + 20°C - 25°C

P o W e r b a l a n C e a n d C h o i C e o f P o W e r S u P P ly S o l u t i o n S
48
selection of sources (continued)
HV/
LV t
ra
nsf
or
me
rs
3 CaST reSIn TranSforMerS
3.1. DescriptionDry-type transformers, with one or more enclosed windings, are usually called cast resin transformers. these types, due to developments in construction techniques, are more and more widely used because
Cast resin transformers
The magnetic circuit is insulated (or coated) in insulating resin. Cooling takes place in the ambient air with no intermediate liquid.
3.2. applicationsCast resin transformers are used in a wide range of applications and represent the most reliable answer for distribution systems, power production, rectifica-tion, traction and for special requirements.
> distribution of electrical powerService sector:
– Hospitals– Banks– schools – shopping and cultural centres– management centres
Infrastructures:– airports– military installations– Ports and off-shore installations
Industry in general
of their reliability, their lower environmental impact compared to oil transformers, and because they reduce the risks of fire and spreading polluting sub-stances in the environment.medium-voltage windings, made with wire coils or, even better, insulated aluminium strips, are placed in a mould into which the epoxy resin is poured under vacuum, to avoid inclusions of gas in the insulation. the windings are then enclosed in a cylindrical enclo-sure, which is totally sealed, mechanically strong and has a smooth surface which impedes both the deposit of dust and the action of polluting agents.Low-voltage windings are generally made of a single aluminium sheet, the same height as the coil, insulated by suitable material and heat treatment.Cast resin transfor-mers use class f 155°C insulating material, allowing for a maximum tempe-rature rise of 100°K.
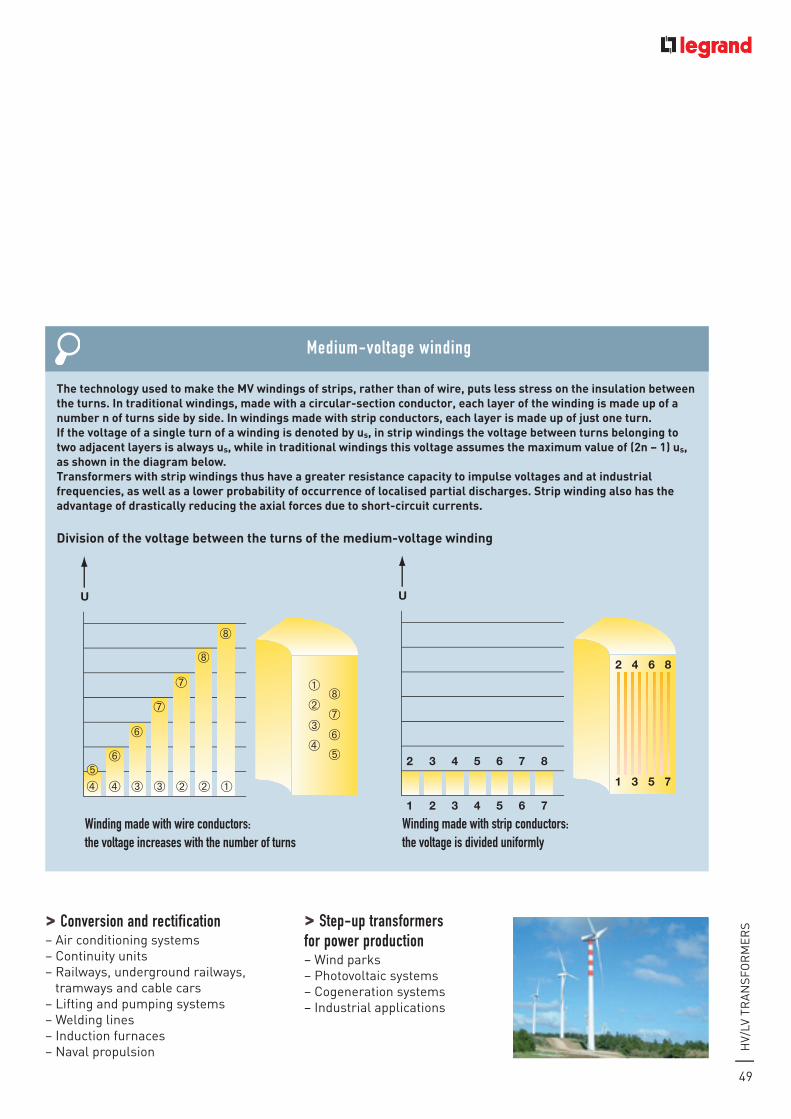
49
HV/
LV t
ra
nsf
or
me
rs> Conversion and rectification
– air conditioning systems– Continuity units– railways, underground railways, tramways and cable cars– Lifting and pumping systems– Welding lines– Induction furnaces– naval propulsion
> Step-up transformers for power production– Wind parks– Photovoltaic systems– Cogeneration systems– Industrial applications
The technology used to make the MV windings of strips, rather than of wire, puts less stress on the insulation between the turns. In traditional windings, made with a circular-section conductor, each layer of the winding is made up of a number n of turns side by side. In windings made with strip conductors, each layer is made up of just one turn.If the voltage of a single turn of a winding is denoted by us, in strip windings the voltage between turns belonging to two adjacent layers is always us, while in traditional windings this voltage assumes the maximum value of (2n – 1) us, as shown in the diagram below.Transformers with strip windings thus have a greater resistance capacity to impulse voltages and at industrial frequencies, as well as a lower probability of occurrence of localised partial discharges. Strip winding also has the advantage of drastically reducing the axial forces due to short-circuit currents.
Medium-voltage winding
➃
➄
➅
➆
➇
➃
➂
➁
➀
➅
➃➄
➅
➂
➆
➂
➆
➁
➇
➁
➇
➀
U
1 2 3 4 5 6 7
2 3 4 5 6 7 8
U
1
2
3
4
5
6
7
8
➃
➄
➅
➆
➇
➃
➂
➁
➀
➅
➃➄
➅
➂
➆
➂
➆
➁
➇
➁
➇
➀
U
1 2 3 4 5 6 7
2 3 4 5 6 7 8
U
1
2
3
4
5
6
7
8
Division of the voltage between the turns of the medium-voltage winding
Winding made with wire conductors: the voltage increases with the number of turns
Winding made with strip conductors: the voltage is divided uniformly
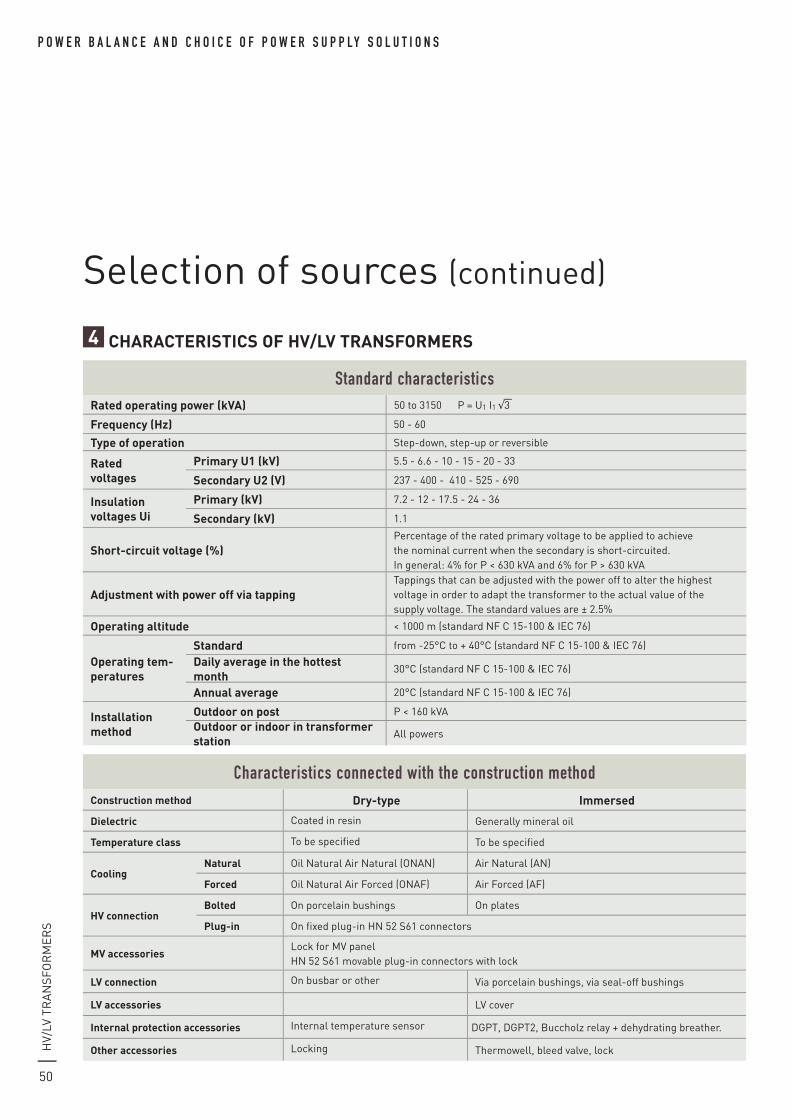
50
P o W e r b a l a n C e a n d C h o i C e o f P o W e r S u P P ly S o l u t i o n S
selection of sources (continued)
HV/
LV t
ra
nsf
or
me
rs
4 CharaCTerISTICS of hV/LV TranSforMerS
Standard characteristicsrated operating power (kVa) 50 to 3150 P = U1 I1 √3
—
frequency (hz) 50 - 60
Type of operation step-down, step-up or reversible
rated voltages
Primary U1 (kV) 5.5 - 6.6 - 10 - 15 - 20 - 33
Secondary U2 (V) 237 - 400 - 410 - 525 - 690
Insulation voltages Ui
Primary (kV) 7.2 - 12 - 17.5 - 24 - 36
Secondary (kV) 1.1
Short-circuit voltage (%)Percentage of the rated primary voltage to be applied to achieve the nominal current when the secondary is short-circuited. In general: 4% for P < 630 kVa and 6% for P > 630 kVa
adjustment with power off via tappingtappings that can be adjusted with the power off to alter the highest voltage in order to adapt the transformer to the actual value of the supply voltage. the standard values are ± 2.5%
operating altitude < 1000 m (standard nf C 15-100 & IeC 76)
operating tem-peratures
Standard from -25°C to + 40°C (standard nf C 15-100 & IeC 76)
Daily average in the hottest month
30°C (standard nf C 15-100 & IeC 76)
annual average 20°C (standard nf C 15-100 & IeC 76)
Installation method
outdoor on post P < 160 kVaoutdoor or indoor in transformer station
all powers
Characteristics connected with the construction methodConstruction method Dry-type Immersed
Dielectric Coated in resin Generally mineral oil
Temperature class to be specified to be specified
Coolingnatural oil natural air natural (onan) air natural (an)
forced oil natural air forced (onaf) air forced (af)
hV connectionBolted on porcelain bushings on plates
Plug-in on fixed plug-in Hn 52 s61 connectors
MV accessoriesLock for mV panelHn 52 s61 movable plug-in connectors with lock
LV connection on busbar or other Via porcelain bushings, via seal-off bushings
LV accessories LV cover
Internal protection accessories Internal temperature sensor DGPt, DGPt2, Buccholz relay + dehydrating breather.
other accessories Locking thermowell, bleed valve, lock
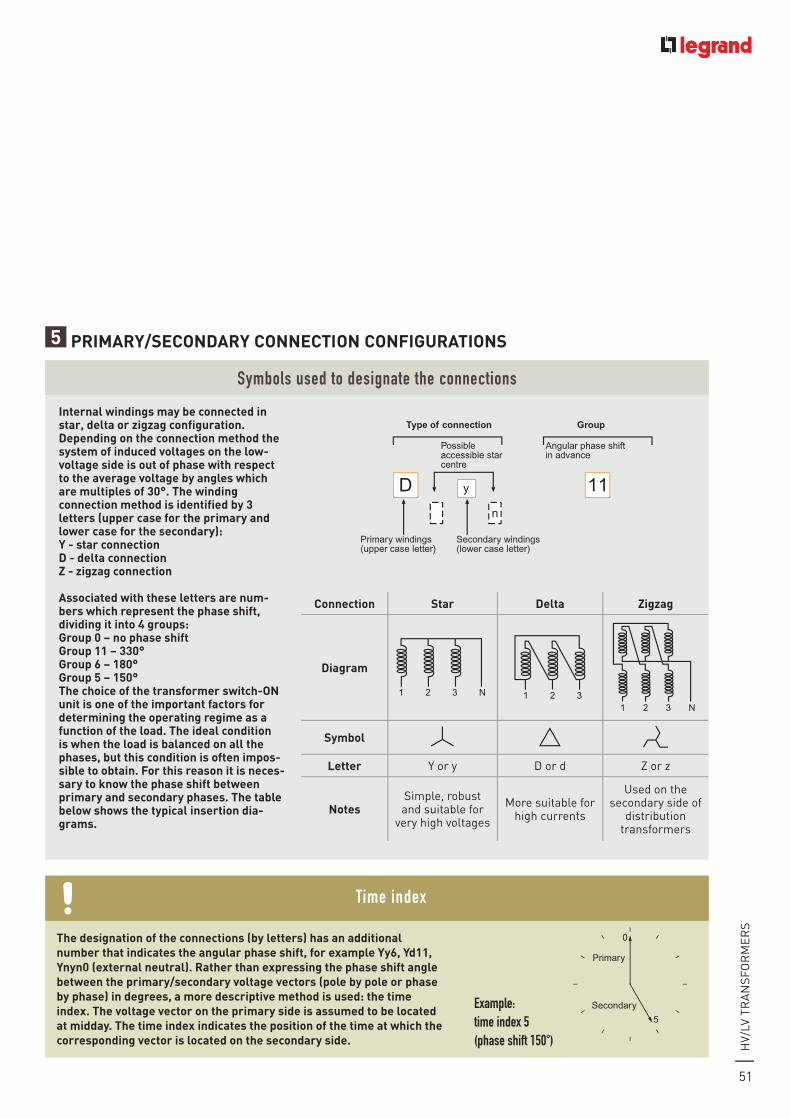
51
Symbols used to designate the connections
Internal windings may be connected in star, delta or zigzag configuration. Depending on the connection method the system of induced voltages on the low-voltage side is out of phase with respect to the average voltage by angles which are multiples of 30°. The winding connection method is identified by 3 letters (upper case for the primary and lower case for the secondary):Y - star connectionD - delta connectionZ - zigzag connection
associated with these letters are num-bers which represent the phase shift, dividing it into 4 groups:Group 0 – no phase shiftGroup 11 – 330°Group 6 – 180°Group 5 – 150°The choice of the transformer switch-on unit is one of the important factors for determining the operating regime as a function of the load. The ideal condition is when the load is balanced on all the phases, but this condition is often impos-sible to obtain. for this reason it is neces-sary to know the phase shift between primary and secondary phases. The table below shows the typical insertion dia-grams.
Primary windings (upper case letter)
Secondary windings (lower case letter)
1 2 3 N 1 2 31 2 3 N
n
11D y
Type of connection
Possible accessible star centre
Group
Angular phase shift in advance
HV/
LV t
ra
nsf
or
me
rs
5 PrIMarY/SeConDarY ConneCTIon ConfIGUraTIonS
Connection Star Delta Zigzag
Diagram
Symbol
Letter Y or y D or d Z or z
notessimple, robust and suitable for
very high voltages
more suitable for high currents
Used on the secondary side of
distribution transformers
The designation of the connections (by letters) has an additional number that indicates the angular phase shift, for example Yy6, Yd11, Ynyn0 (external neutral). rather than expressing the phase shift angle between the primary/secondary voltage vectors (pole by pole or phase by phase) in degrees, a more descriptive method is used: the time index. The voltage vector on the primary side is assumed to be located at midday. The time index indicates the position of the time at which the corresponding vector is located on the secondary side.
time index
0
5
Primary
Secondaryexample: time index 5 (phase shift 150°)
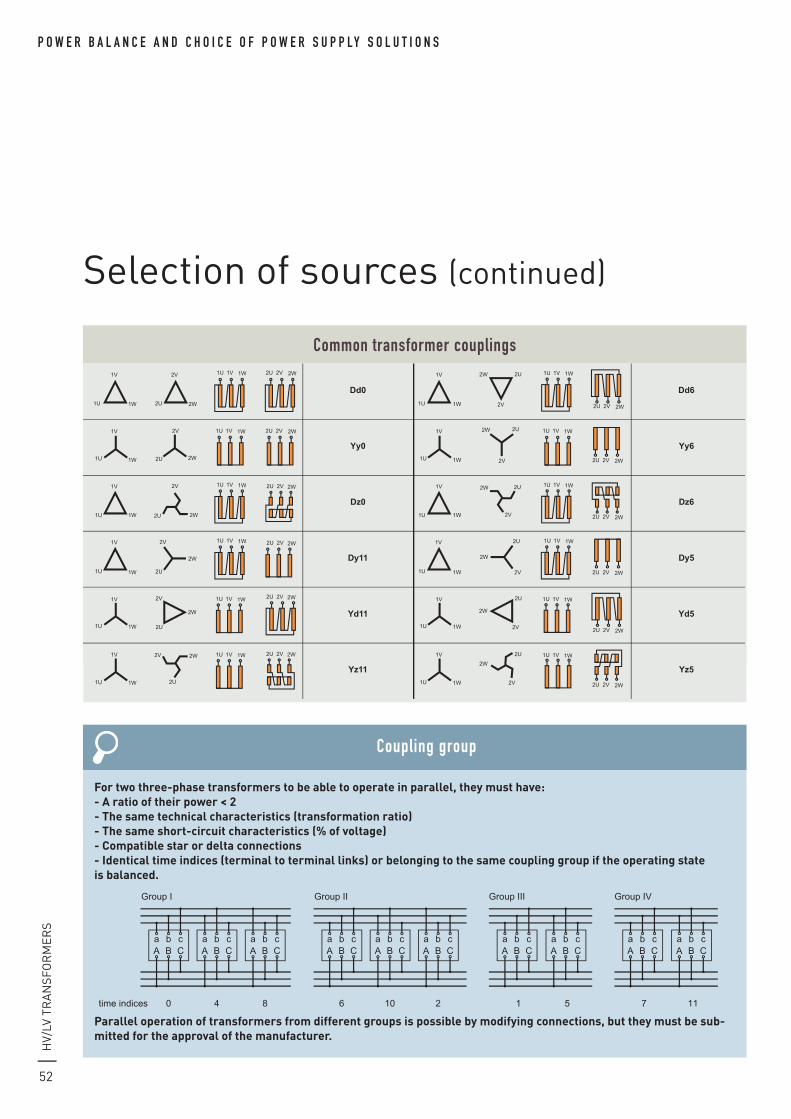
52
P o W e r b a l a n C e a n d C h o i C e o f P o W e r S u P P ly S o l u t i o n S
selection of sources (continued)
HV/
LV t
ra
nsf
or
me
rs
for two three-phase transformers to be able to operate in parallel, they must have:- a ratio of their power < 2- The same technical characteristics (transformation ratio)- The same short-circuit characteristics (% of voltage)- Compatible star or delta connections- Identical time indices (terminal to terminal links) or belonging to the same coupling group if the operating state is balanced.
Parallel operation of transformers from different groups is possible by modifying connections, but they must be sub-mitted for the approval of the manufacturer.
Coupling group
A B C a b c
A B C a b c
A B
0 4 8
C a b c
A B C a b c
A B C a b c
6 time indices
Group I
A B C a b c
A B C a b c
A B C a b c
Group II Group III
10 2 1 5 7 11
Group IV
A B C a b c
A B C a b c
Common transformer couplings
1W1U
1V
2W2U
2V
Dd0
1W1U 1V 2W2U 2V
1W1U
1V
2W2U
2V
Yy0
2W2U 2V1W1U 1V
1W1U
1V
Dz02W2U
2V 1W1U 1V 2W2U 2V
1W1U
1V
Dy112W
2U
2V 2W2U 2V1W1U 1V
1W1U
1V
Yd11
1W1U 1V
2W
2U
2V 2W2U 2V
1W1U
1V
Yz11
1W1U 1V2W
2U
2V 2W2U 2V
1W1U
1V 2W 2U
2V
Dd6
1W1U 1V
2W2U 2V
1W1U
1V 2W 2U
2V
Yy62W2U 2V
1W1U 1V
1W1U
1V
Dz6
2W 2U
2V
1W1U 1V
2W2U 2V
1W1U
1V
Yz51W1U 1V
2W
2U
2V
1W1U
1V
Yd5
1W1U 1V
2W
2U
2V
1U
1V
1W
Dy52W
2U
2V
1W1U 1V
2W2U 2V
2W2U 2V
2W2U 2V

53
Ge
ne
rat
or
se
ts
Generator sets are being increasingly used:- as main sources if there is no public distribution network- or to ensure continuity of energy supply
In the latter case, and depending on their characteris-tics, they may be:- replacement power supplies taking the place of the main supply if it has a fault (with, if required, load shedding if the power of the set is inadequate)- replacement power supplies acting as a second source for the main power supply in order to supple-ment the main source for reasons of economy or at times of peak demand- Power supplies for safety services associated, if required, with a UPs to ensure and maintain the safety of installations over periods that are not compatible with the working reserves of batteries.In all cases, it is the ability to operate independently, for long periods, that is the main reason for choosing a generator set. the ranges from generator set manufac-turers are virtually unlimited.they range from small portable sets supplying a few kVa, used as stand-alone sources, to power plants supplying several mVa, and include mobile sets on wheels (intended for example for supplying the public network in the event of a breakdown) or fixed sets sup-plying a few hundred kVa (mostly intended for a safety or replacement service). energy sources are changing. although oil is still very widely used, the use of gas is growing, as is steam in cogeneration plants.
GeneraTor SeTS
Generator sets and their components, motors, alternators, etc. form the subject of standards in the ISo 8528-x series.
new generation technologies are coming onto the market to replace or be used together with generator sets. They are not all at a commercial stage, but they will undoubtedly change the concept of stand-alone production and above all its electrical management. These include:- high-speed turbogenerators (gas microturbines)- fuel cells- aerogenerators (wind turbines)- Photovoltaic cellsall these technologies have the underlying advantage of the development of power electronics which is used to convert the current produced (DC, variable, hf) to a usable 50 hz current.
other energy sources
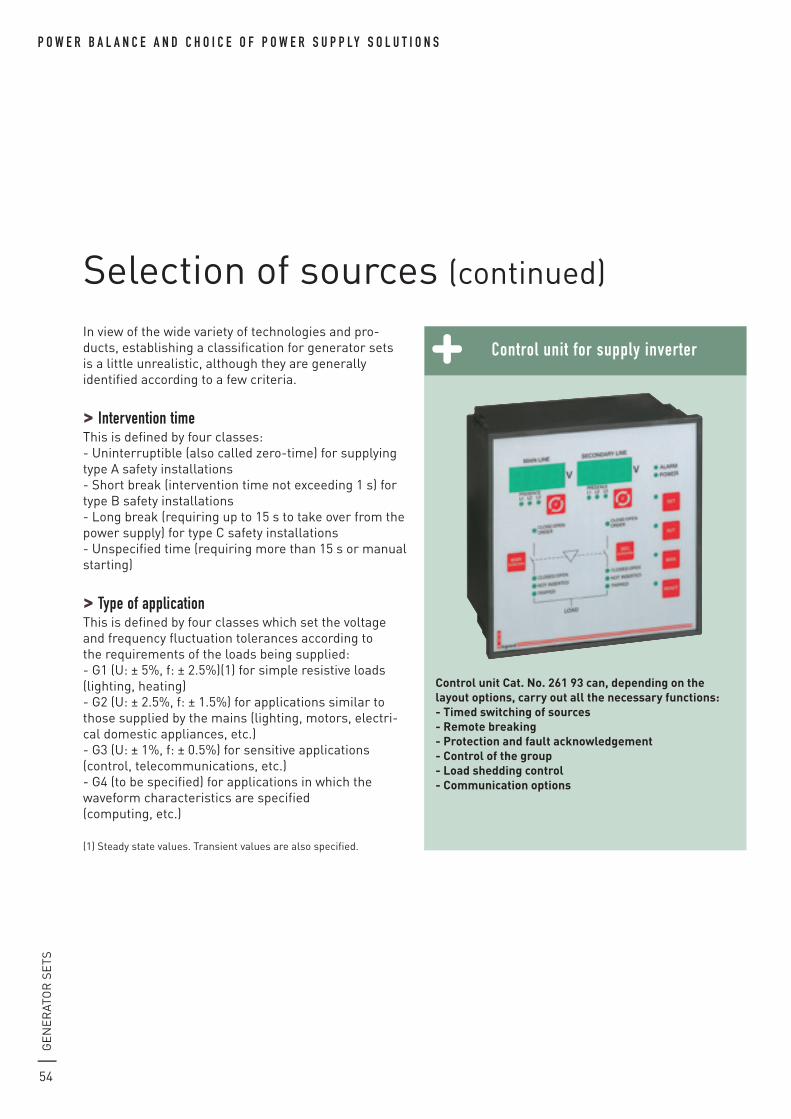
54
P o W e r b a l a n C e a n d C h o i C e o f P o W e r S u P P ly S o l u t i o n S
selection of sources (continued)
Ge
ne
rat
or
se
ts
In view of the wide variety of technologies and pro-ducts, establishing a classification for generator sets is a little unrealistic, although they are generally identified according to a few criteria.
> intervention time this is defined by four classes:- Uninterruptible (also called zero-time) for supplying type a safety installations- short break (intervention time not exceeding 1 s) for type B safety installations- Long break (requiring up to 15 s to take over from the power supply) for type C safety installations- Unspecified time (requiring more than 15 s or manual starting)
> type of applicationthis is defined by four classes which set the voltage and frequency fluctuation tolerances according to the requirements of the loads being supplied:- G1 (U: ± 5%, f: ± 2.5%)(1) for simple resistive loads (lighting, heating)- G2 (U: ± 2.5%, f: ± 1.5%) for applications similar to those supplied by the mains (lighting, motors, electri-cal domestic appliances, etc.)- G3 (U: ± 1%, f: ± 0.5%) for sensitive applications (control, telecommunications, etc.)- G4 (to be specified) for applications in which the waveform characteristics are specified (computing, etc.)
(1) steady state values. transient values are also specified.
Control unit Cat. no. 261 93 can, depending on the layout options, carry out all the necessary functions:- Timed switching of sources- remote breaking- Protection and fault acknowledgement- Control of the group- Load shedding control- Communication options
Control unit for supply inverter
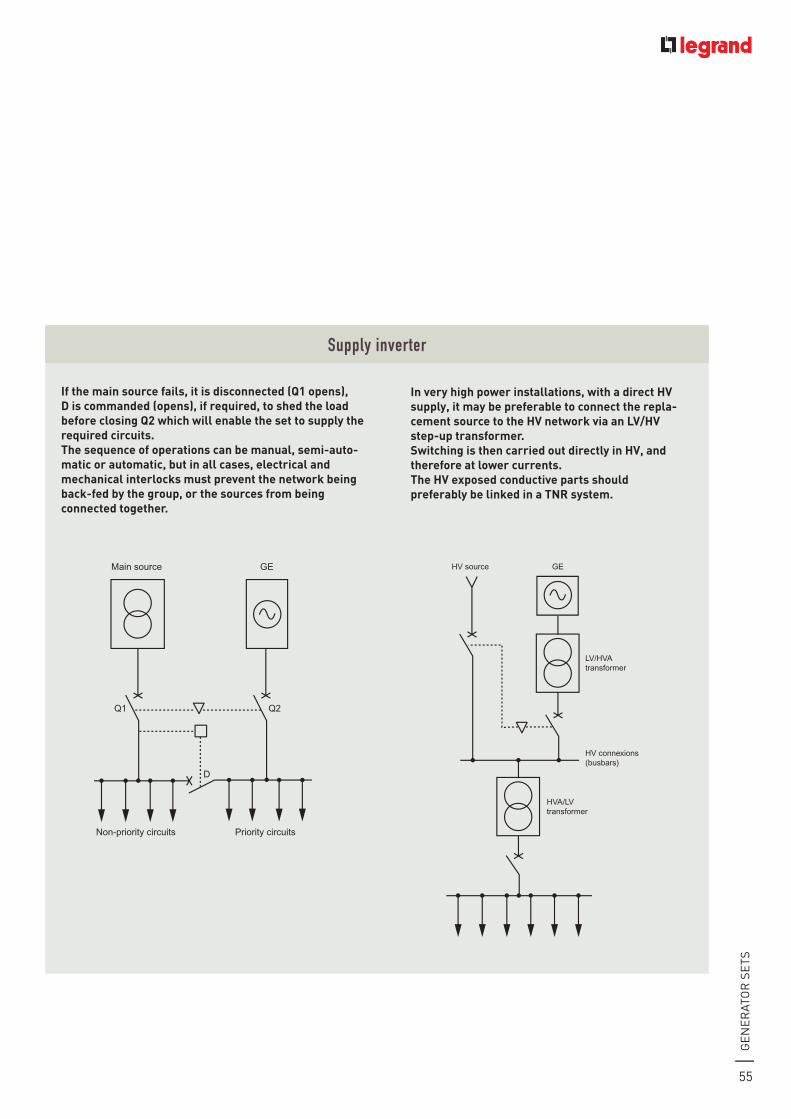
55
Ge
ne
rat
or
se
ts
Supply inverter
If the main source fails, it is disconnected (Q1 opens), D is commanded (opens), if required, to shed the load before closing Q2 which will enable the set to supply the required circuits.The sequence of operations can be manual, semi-auto-matic or automatic, but in all cases, electrical and mechanical interlocks must prevent the network being back-fed by the group, or the sources from being connected together.
GE
Q1 Q2
D
Main source
Non-priority circuits Priority circuits
GE
LV/HVAtransformer
HVA/LVtransformer
HV connexions (busbars)
HV source
In very high power installations, with a direct hV supply, it may be preferable to connect the repla-cement source to the hV network via an LV/hV step-up transformer. Switching is then carried out directly in hV, and therefore at lower currents.The hV exposed conductive parts should preferably be linked in a Tnr system.
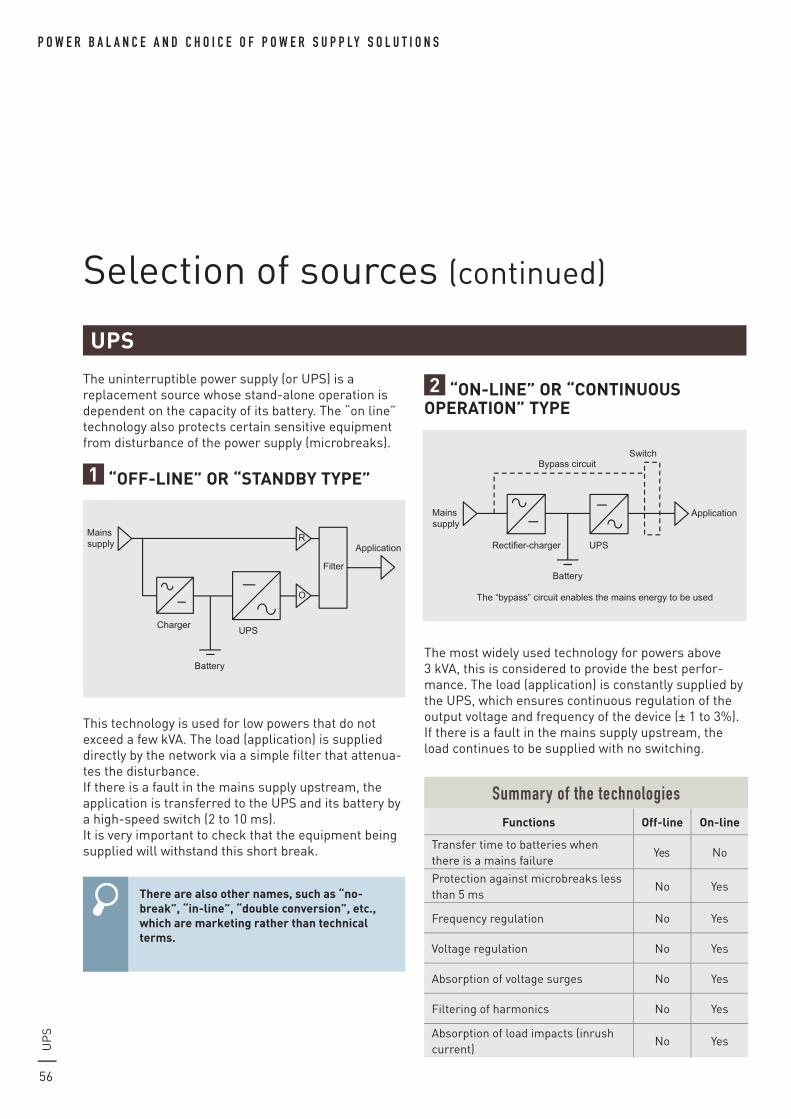
56
P o W e r b a l a n C e a n d C h o i C e o f P o W e r S u P P ly S o l u t i o n S
selection of sources (continued)
UP
s
the uninterruptible power supply (or UPs) is a replacement source whose stand-alone operation is dependent on the capacity of its battery. the “on line” technology also protects certain sensitive equipment from disturbance of the power supply (microbreaks).
1 “off-LIne” or “STanDBY TYPe”
this technology is used for low powers that do not exceed a few kVa. the load (application) is supplied directly by the network via a simple filter that attenua-tes the disturbance.If there is a fault in the mains supply upstream, the application is transferred to the UPs and its battery by a high-speed switch (2 to 10 ms). It is very important to check that the equipment being supplied will withstand this short break.
Summary of the technologiesfunctions off-line on-line
transfer time to batteries when there is a mains failure
Yes no
Protection against microbreaks less than 5 ms
no Yes
frequency regulation no Yes
Voltage regulation no Yes
absorption of voltage surges no Yes
filtering of harmonics no Yes
absorption of load impacts (inrush current)
no Yes
2 “on-LIne” or “ConTInUoUS oPeraTIon” TYPe
the most widely used technology for powers above 3 kVa, this is considered to provide the best perfor-mance. the load (application) is constantly supplied by the UPs, which ensures continuous regulation of the output voltage and frequency of the device (± 1 to 3%).If there is a fault in the mains supply upstream, the load continues to be supplied with no switching.
Application
UPS
Battery
Charger
Mains supply
Filter
R
O
Bypass circuitSwitch
Application
UPS
Battery
The “bypass” circuit enables the mains energy to be used
Rectifier-charger
Mains supply
UPS
There are also other names, such as “no-break”, “in-line”, “double conversion”, etc., which are marketing rather than technical terms.

57
Bat
ter
Ies
a battery is made up of accumulator cells that are connected to one another. there are two types of battery:- open batteries, made up of cells that have openings for releasing the gas mixture (oxygen and hydrogen) into the atmosphere and for topping up the electro-lyte level. these are used in large configurations and require a ventilated room.- maintenance-free batteries, made up of cells with a recombination rate of at least 95%. these do not require the addition of any water during use. these are used for powers up to 250 kVa.the room must have appropriate ventilation.as a general rule, batteries are installed on a special support called the “base”.the working reserve and lifetime of batteries depend on their conditions of use: power to be supplied, dis-charge rate, ambient temperature, age, discharge state.this type of source is often used for one-off require-ments, such as safety source (safety lighting, protected stabilised power supply, etc.).
BaTTerIeS
In france, areas in which batteries with powers of more than 10 kW DC are charged constitute “classified installations” for pro-tection of the environment and are subject to notification.
The installation and operating conditions for battery packs (defined by standard IeC 60364-5-55) are depen-dent on their power and the amount of gas they emit. • An electrical service area is necessary if the product p is greater than 1000: p = C x UC: capacity in ahU: voltage in VIf the product p does not exceed 1000, the batteries can be placed in an enclosure (with reserved access) in a non-specific room.• Natural or mechanical ventilation is compulsory. The ventilation system must not be closed circuit and must provide an air change rate Q in m3/h of at least: Q = k x n x Ik: factor dependent on the type of battery (k = 0.0025 for recombination batteries, k = 0.05 for open batte-ries)n: number of cells in the batteryI: rated current (in a) of the protection device linked to the current of the load system• Switching off the load system must be controlled by the switching off of the ventilation for open batteries.for recombination batteries, normal ventilation conditions applicable to polluted areas are generally adequate. for batteries in enclosures, high and low grilles are also generally adequate.
using batteries
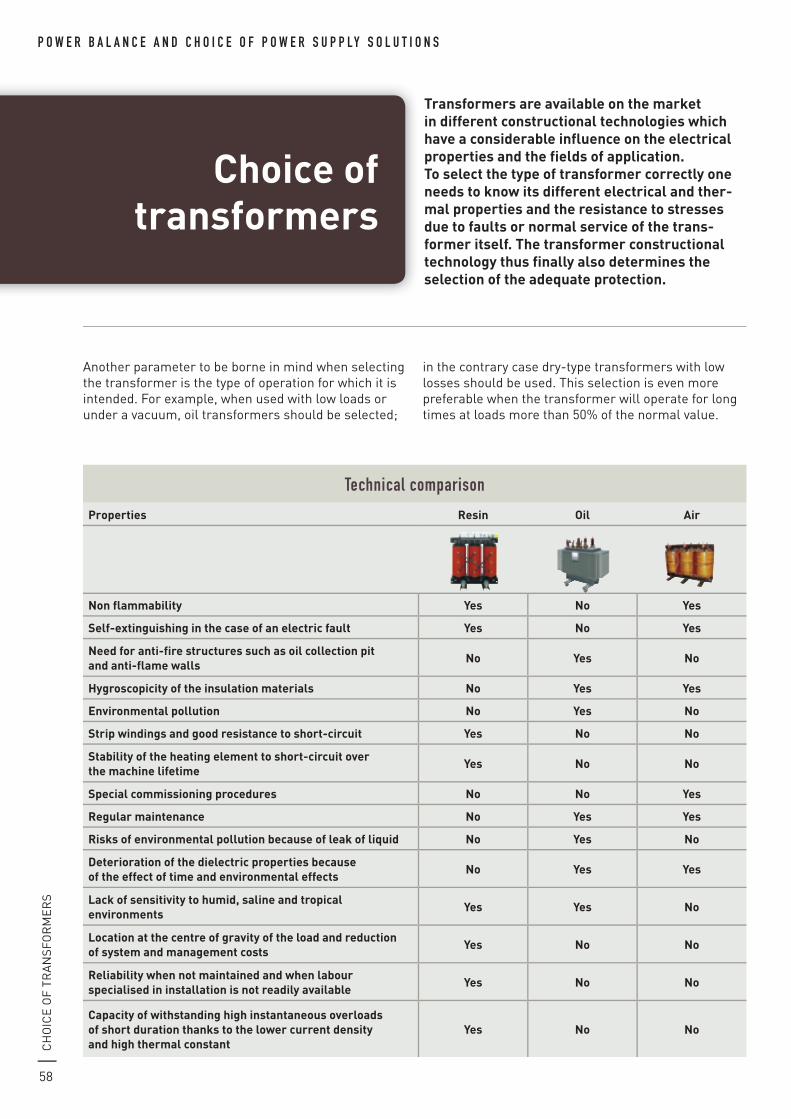
58
P o W e r b a l a n C e a n d C h o i C e o f P o W e r S u P P ly S o l u t i o n S
Choice of transformers
Transformers are available on the market in different constructional technologies which have a considerable influence on the electrical properties and the fields of application. To select the type of transformer correctly one needs to know its different electrical and ther-mal properties and the resistance to stresses due to faults or normal service of the trans-former itself. The transformer constructional technology thus finally also determines the selection of the adequate protection.
another parameter to be borne in mind when selectingthe transformer is the type of operation for which it is intended. for example, when used with low loads or under a vacuum, oil transformers should be selected;
in the contrary case dry-type transformers with low losses should be used. this selection is even more preferable when the transformer will operate for long times at loads more than 50% of the normal value.
technical comparison
Properties resin oil air
non flammability Yes no Yes
Self-extinguishing in the case of an electric fault Yes no Yes
need for anti-fire structures such as oil collection pit and anti-flame walls
no Yes no
hygroscopicity of the insulation materials no Yes Yes
environmental pollution no Yes no
Strip windings and good resistance to short-circuit Yes no no
Stability of the heating element to short-circuit over the machine lifetime
Yes no no
Special commissioning procedures no no Yes
regular maintenance no Yes Yes
risks of environmental pollution because of leak of liquid no Yes no
Deterioration of the dielectric properties because of the effect of time and environmental effects
no Yes Yes
Lack of sensitivity to humid, saline and tropical environments
Yes Yes no
Location at the centre of gravity of the load and reduction of system and management costs
Yes no no
reliability when not maintained and when labour specialised in installation is not readily available
Yes no no
Capacity of withstanding high instantaneous overloads of short duration thanks to the lower current density and high thermal constant
Yes no no
CH
oIC
e o
f tr
an
sfo
rm
er
s
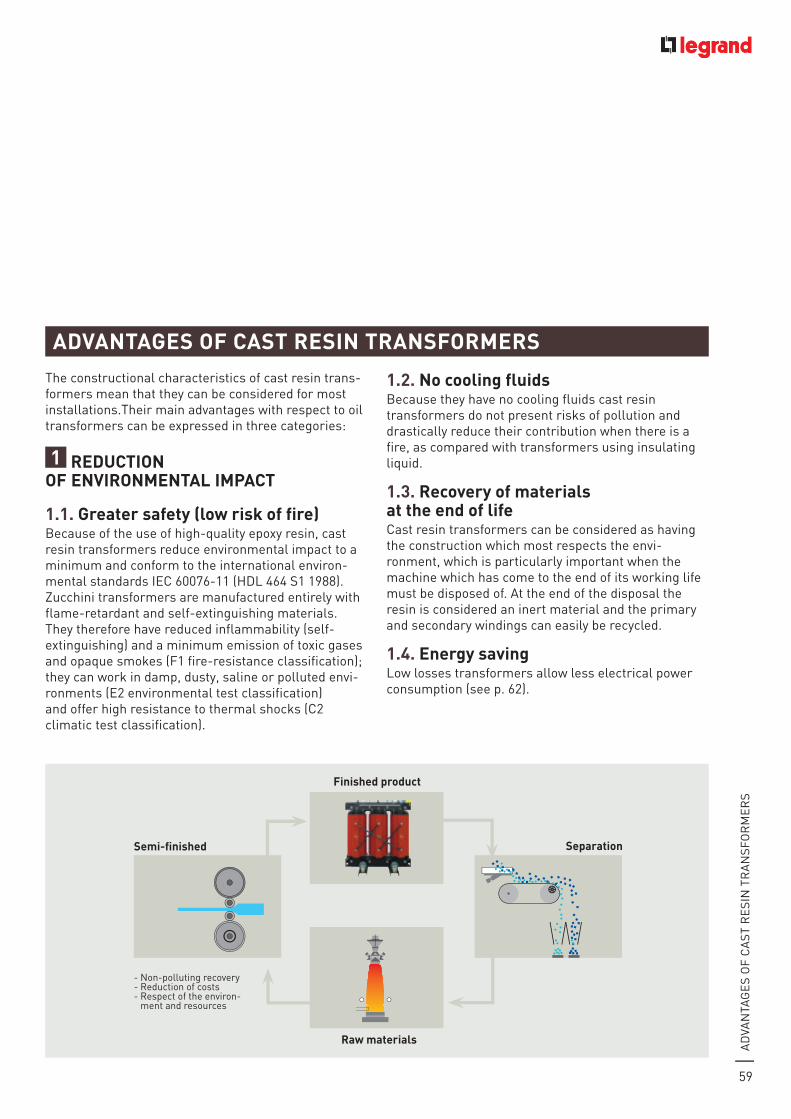
59
aD
Van
taG
es
of
Ca
st r
esI
n t
ra
nsf
or
me
rs
the constructional characteristics of cast resin trans-formers mean that they can be considered for most installations.their main advantages with respect to oil transformers can be expressed in three categories:
1 reDUCTIon of enVIronMenTaL IMPaCT
1.1. Greater safety (low risk of fire)Because of the use of high-quality epoxy resin, cast resin transformers reduce environmental impact to a minimum and conform to the international environ-mental standards IeC 60076-11 (HDL 464 s1 1988). Zucchini transformers are manufactured entirely with flame-retardant and self-extinguishing materials. they therefore have reduced inflammability (self-extinguishing) and a minimum emission of toxic gases and opaque smokes (f1 fire-resistance classification); they can work in damp, dusty, saline or polluted envi-ronments (e2 environmental test classification) and offer high resistance to thermal shocks (C2 climatic test classification).
1.2. no cooling fluidsBecause they have no cooling fluids cast resin transformers do not present risks of pollution and drastically reduce their contribution when there is a fire, as compared with transformers using insulating liquid.
1.3. recovery of materials at the end of lifeCast resin transformers can be considered as having the construction which most respects the envi-ronment, which is particularly important when the machine which has come to the end of its working life must be disposed of. at the end of the disposal the resin is considered an inert material and the primary and secondary windings can easily be recycled.
1.4. energy savingLow losses transformers allow less electrical power consumption (see p. 62).
aDVanTaGeS of CaST reSIn TranSforMerS
Semi-finished
finished product
raw materials
Separation
- non-polluting recovery- reduction of costs- respect of the environ-
ment and resources
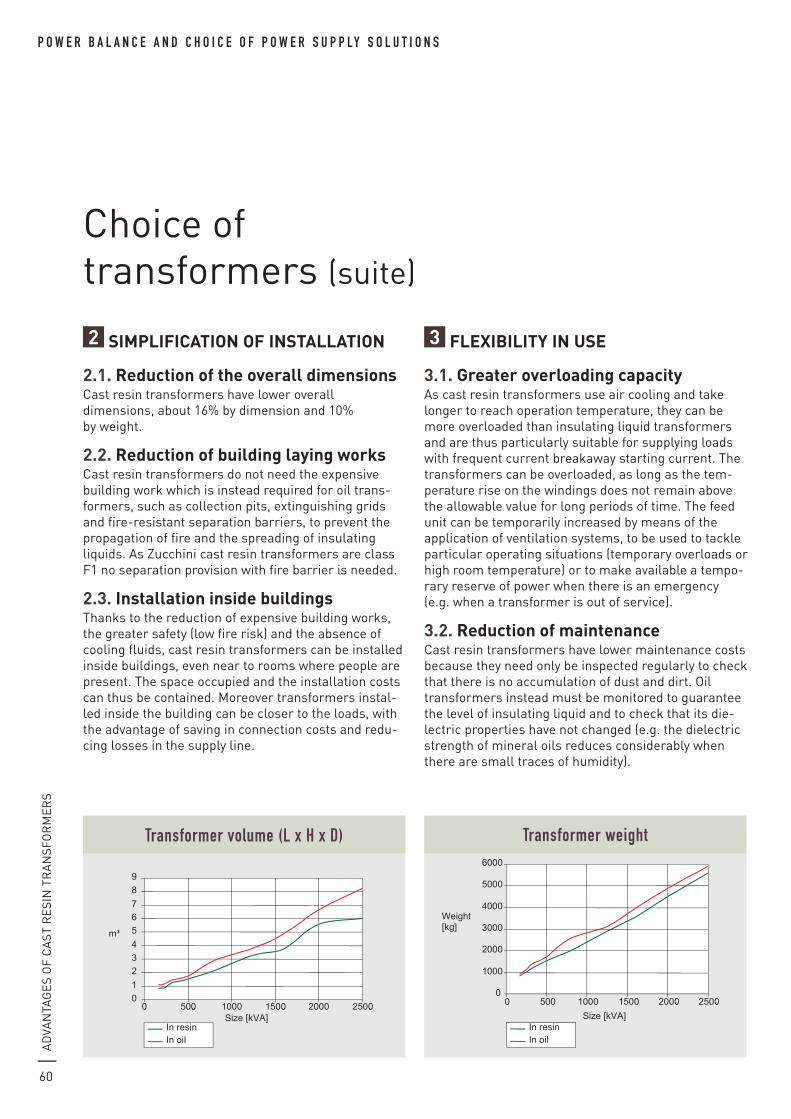
60
P o W e r b a l a n C e a n d C h o i C e o f P o W e r S u P P ly S o l u t i o n Sa
DVa
nta
Ge
s o
f C
ast
re
sIn
tr
an
sfo
rm
er
s
Choice of transformers (suite)
2 SIMPLIfICaTIon of InSTaLLaTIon
2.1. reduction of the overall dimensionsCast resin transformers have lower overalldimensions, about 16% by dimension and 10%by weight.
2.2. reduction of building laying worksCast resin transformers do not need the expensive building work which is instead required for oil trans-formers, such as collection pits, extinguishing grids and fire-resistant separation barriers, to prevent the propagation of fire and the spreading of insulating liquids. as Zucchini cast resin transformers are class f1 no separation provision with fire barrier is needed.
2.3. Installation inside buildingsthanks to the reduction of expensive building works, the greater safety (low fire risk) and the absence of cooling fluids, cast resin transformers can be installed inside buildings, even near to rooms where people are present. the space occupied and the installation costs can thus be contained. moreover transformers instal-led inside the building can be closer to the loads, with the advantage of saving in connection costs and redu-cing losses in the supply line.
3 fLexIBILITY In USe
3.1. Greater overloading capacityas cast resin transformers use air cooling and take longer to reach operation temperature, they can be more overloaded than insulating liquid transformers and are thus particularly suitable for supplying loads with frequent current breakaway starting current. the transformers can be overloaded, as long as the tem-perature rise on the windings does not remain above the allowable value for long periods of time. the feed unit can be temporarily increased by means of the application of ventilation systems, to be used to tackle particular operating situations (temporary overloads or high room temperature) or to make available a tempo-rary reserve of power when there is an emergency (e.g. when a transformer is out of service).
3.2. reduction of maintenanceCast resin transformers have lower maintenance costs because they need only be inspected regularly to check that there is no accumulation of dust and dirt. oil transformers instead must be monitored to guarantee the level of insulating liquid and to check that its die-lectric properties have not changed (e.g. the dielectric strength of mineral oils reduces considerably when there are small traces of humidity).
0 1 2 3 4 5 6 7 8 9
0 500 1000 1500 2000 2500Size [kVA]
m³
In resinIn oil
In resinIn oil
0
1000
2000
3000
4000
5000
6000
0 500 1000 1500 2000 2500Size [kVA]
Weight[kg]
transformer volume (l x h x d)
0 1 2 3 4 5 6 7 8 9
0 500 1000 1500 2000 2500Size [kVA]
m³
In resinIn oil
In resinIn oil
0
1000
2000
3000
4000
5000
6000
0 500 1000 1500 2000 2500Size [kVA]
Weight[kg]
transformer weight
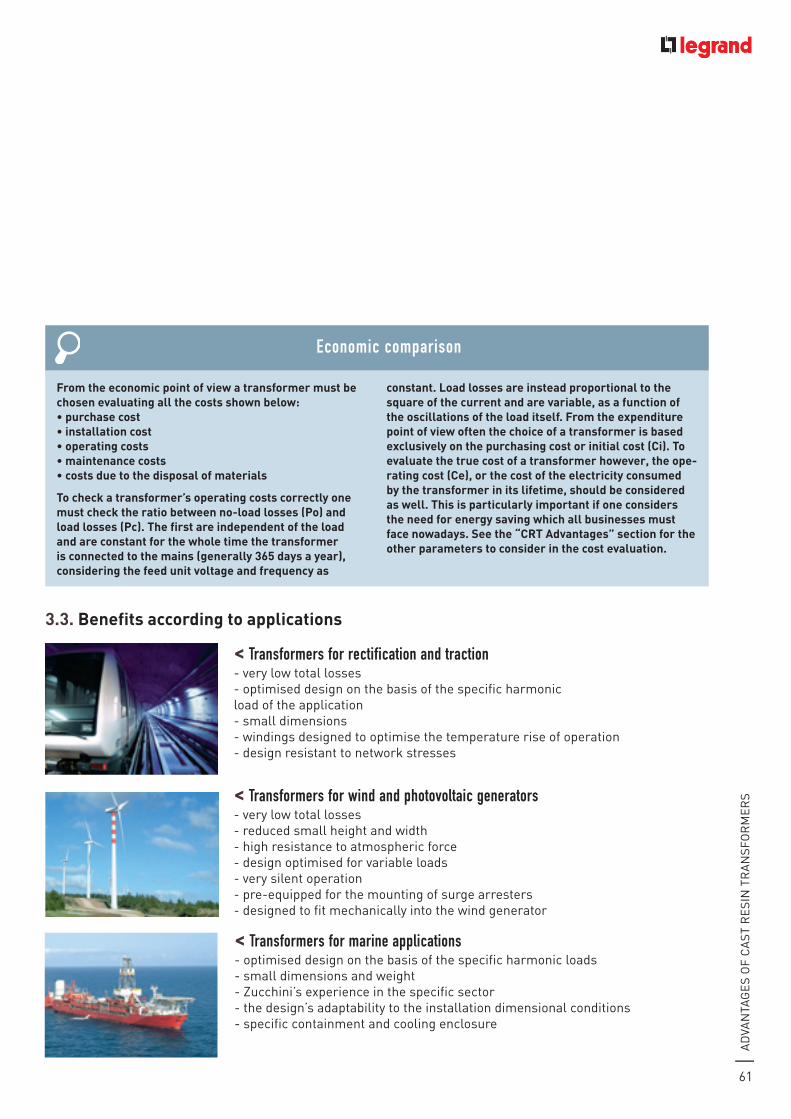
61
aD
Van
taG
es
of
Ca
st r
esI
n t
ra
nsf
or
me
rs
< transformers for rectification and traction- very low total losses- optimised design on the basis of the specific harmonic load of the application- small dimensions- windings designed to optimise the temperature rise of operation- design resistant to network stresses
< transformers for wind and photovoltaic generators- very low total losses- reduced small height and width- high resistance to atmospheric force- design optimised for variable loads- very silent operation- pre-equipped for the mounting of surge arresters- designed to fit mechanically into the wind generator
< transformers for marine applications- optimised design on the basis of the specific harmonic loads- small dimensions and weight- Zucchini’s experience in the specific sector- the design’s adaptability to the installation dimensional conditions- specific containment and cooling enclosure
3.3. Benefits according to applications
from the economic point of view a transformer must be chosen evaluating all the costs shown below:• purchase cost• installation cost• operating costs• maintenance costs• costs due to the disposal of materials
To check a transformer’s operating costs correctly one must check the ratio between no-load losses (Po) and load losses (Pc). The first are independent of the load and are constant for the whole time the transformer is connected to the mains (generally 365 days a year), considering the feed unit voltage and frequency as
constant. Load losses are instead proportional to the square of the current and are variable, as a function of the oscillations of the load itself. from the expenditure point of view often the choice of a transformer is based exclusively on the purchasing cost or initial cost (Ci). To evaluate the true cost of a transformer however, the ope-rating cost (Ce), or the cost of the electricity consumed by the transformer in its lifetime, should be considered as well. This is particularly important if one considers the need for energy saving which all businesses must face nowadays. See the “CrT advantages” section for the other parameters to consider in the cost evaluation.
economic comparison
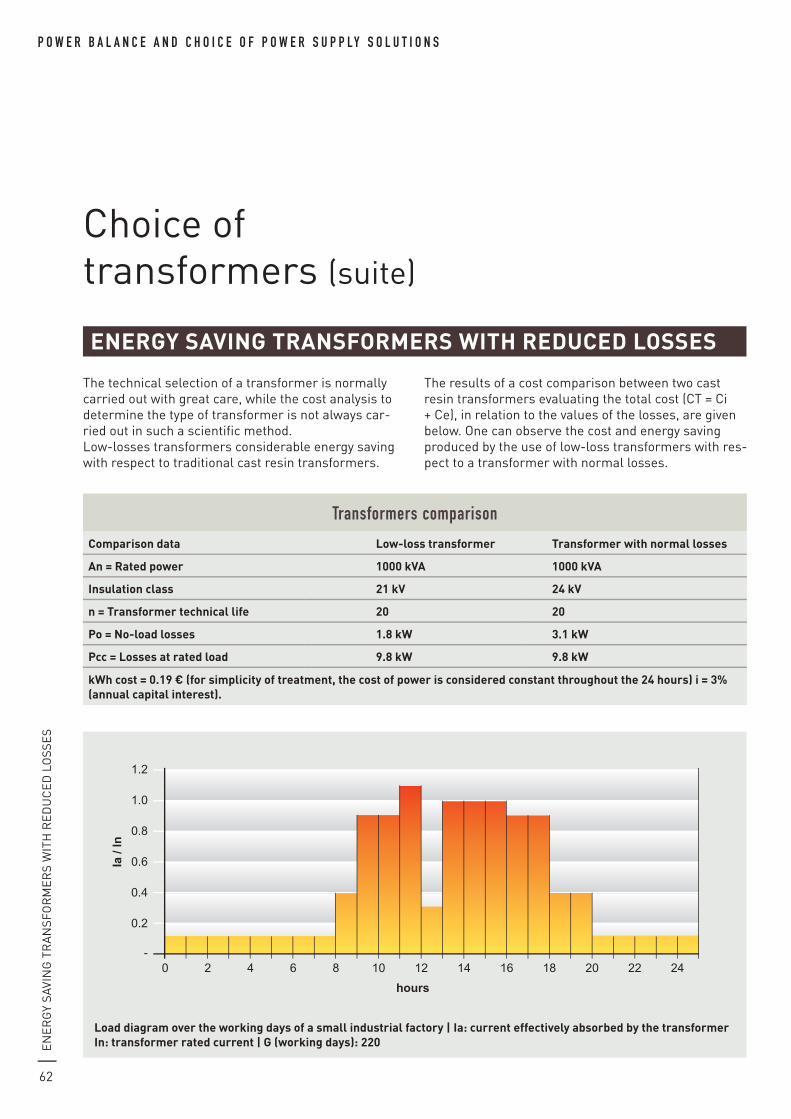
62
P o W e r b a l a n C e a n d C h o i C e o f P o W e r S u P P ly S o l u t i o n S
Choice of transformers (suite)
en
er
GY
saVI
nG
tr
an
sfo
rm
er
s W
ItH
re
DU
Ce
D L
oss
es
enerGY SaVInG TranSforMerS WITh reDUCeD LoSSeS
the technical selection of a transformer is normally carried out with great care, while the cost analysis to determine the type of transformer is not always car-ried out in such a scientific method. Low-losses transformers considerable energy saving with respect to traditional cast resin transformers.
the results of a cost comparison between two cast resin transformers evaluating the total cost (Ct = Ci + Ce), in relation to the values of the losses, are given below. one can observe the cost and energy saving produced by the use of low-loss transformers with res-pect to a transformer with normal losses.
transformers comparison
Comparison data Low-loss transformer Transformer with normal losses
an = rated power 1000 kVa 1000 kVa
Insulation class 21 kV 24 kV
n = Transformer technical life 20 20
Po = no-load losses 1.8 kW 3.1 kW
Pcc = Losses at rated load 9.8 kW 9.8 kW
kWh cost = 0.19 € (for simplicity of treatment, the cost of power is considered constant throughout the 24 hours) i = 3% (annual capital interest).
Load diagram over the working days of a small industrial factory | Ia: current effectively absorbed by the transformerIn: transformer rated current | G (working days): 220
0-
la /
ln
0.2
hours
0.4
0.6
0.8
1.0
1.2
2 4 6 8 10 12 14 16 18 20 22 24
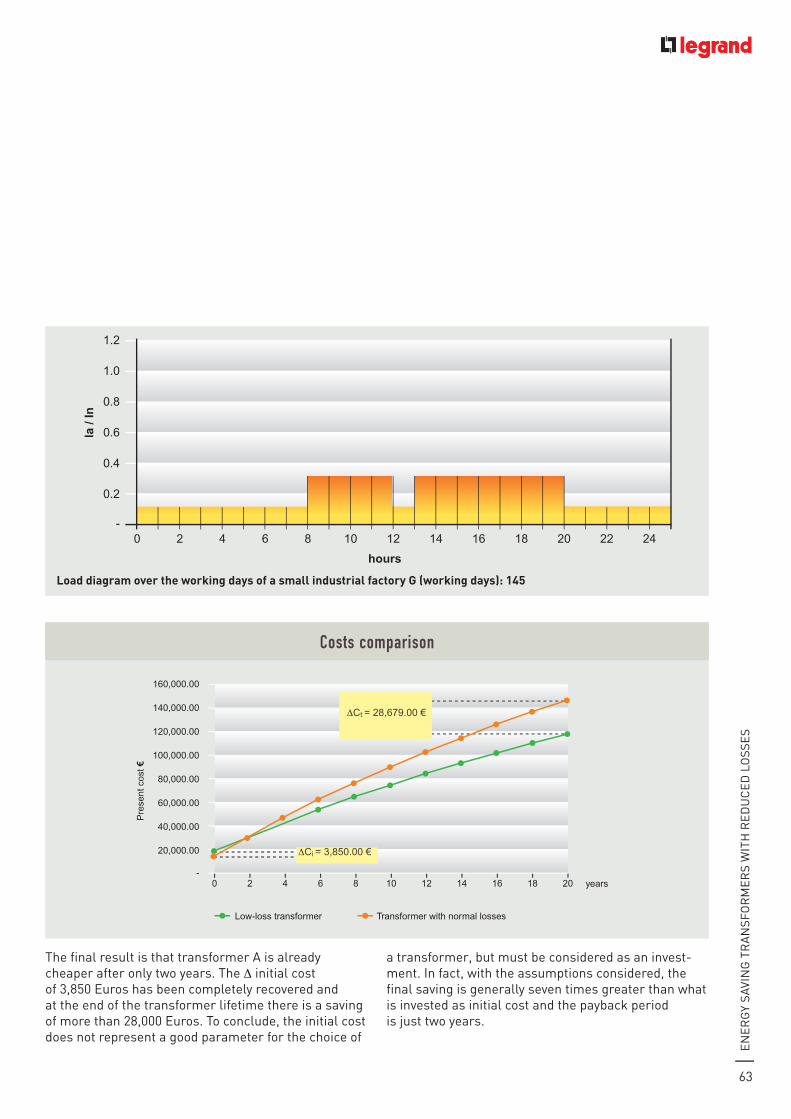
63
en
er
GY
saVI
nG
tr
an
sfo
rm
er
s W
ItH
re
DU
Ce
D L
oss
es
the final result is that transformer a is already cheaper after only two years. the Δ initial cost of 3,850 euros has been completely recovered and at the end of the transformer lifetime there is a saving of more than 28,000 euros. to conclude, the initial cost does not represent a good parameter for the choice of
a transformer, but must be considered as an invest-ment. In fact, with the assumptions considered, the final saving is generally seven times greater than what is invested as initial cost and the payback period is just two years.
Load diagram over the working days of a small industrial factory G (working days): 145
0-
la /
ln
hours
0.2
0.4
0.6
0.8
1.0
1.2
2 4 6 8 10 12 14 16 18 20 22 24
Costs comparison
0-
20,000.00
40,000.00
60,000.00
80,000.00
100,000.00
120,000.00
140,000.00
2
160,000.00
4 6
Low-loss transformer Transformer with normal losses
8 10 12 14 16 18 20
Pre
sent
cos
t ¤
years
ΔCi = 3,850.00 ¤
ΔCt = 28,679.00 ¤

64
P o w e r b a l a n c e a n d c h o i c e o f P o w e r s u P P ly s o l u t i o n s
Choice of transformers (suite)
En
vir
on
mE
nta
l a
nd
Cli
mat
iC f
Eat
ur
Es
an
d f
irE
rE
sist
an
CE
EnvironmEntal and climatic fEaturEs and firE rEsistancE
standard iEC 60076-11 (Hdl 464 s1 1988) uses an alphanumeric code to identify the environmental, climatic and fire behaviour classes of dry-type transformers.– environmental class (E0 – E1 – E2) – climatic class (C1 – C2)– fire-behaviour class (f0 – f1)
1 EnvironmEntal tEstsE0: no condensation on the transformer, negligible pollution, installation in a clean and dry room
E1: occasional condensation and little pollution.
E2: the transformer is subject to consistent condensation, to intense pollution, or to both phenomena.
2 climatic tEstsc1: the transformer will not operate at temperatures lower than -5°C, but may be exposed to -25°C , during transport and storage.
c2: the transformer can operate and be transported and stored at temperatures down to -25°C.
3 firE rEsistancEf0: the risk of fire is not expected and no measures are taken to limit inflammability
f1: the transformer is subject to the risk of fire and reduced inflamma-bility is required. fire on the transformer must be extinguished within laid-down limits.
thanks to the use of a high-quality epoxy resin, all the Zucchini transformers reduce environmental impact to a minimum and conform to the following classes:– environmental class E2– climatic class c2– fire-behaviour class f1the thermal class of the insulating materials used corresponds to class f and the tempe-rature rises are those given in the specific standards for the transformer product.

65
example of an electromagnetic emission and noise measurement report
loW
ElE
Ctr
om
ag
nE
tiC
Em
issi
on
the ClE system with low electromagnetic emission conforms to dPCm 8/7/2003 and is applied to subs-tations and electrical cabinets in medium and low voltage. the ClE (Certified low Emission) transfor-mation system consists in a range of special cast resin transformers housed in enclosures, designed and constructed for use in working environments where people are always present. the construction adop-ted for ClE transformation systems in fact limit the electromagnetic emission to values much lower than 10 microtesla (the quality objective is 3 microtesla) in any direction, as required by dPCm 8/7/2003. Each ClE transformation system comes with a specific elec-tromagnetic emission measurement report. Zucchini possesses a state-of-the-art anechoic chamber for testing, thus Zucchini’s ClE system transformers also come with a measurement report of the noise subdivi-ded by emission range.
loW ElEctromagnEtic Emission
< low electromagnetic emission transformers can be placed in a room in direct proximity to areas with public or workers present or sensitive equipment (hospitals, it rooms…)
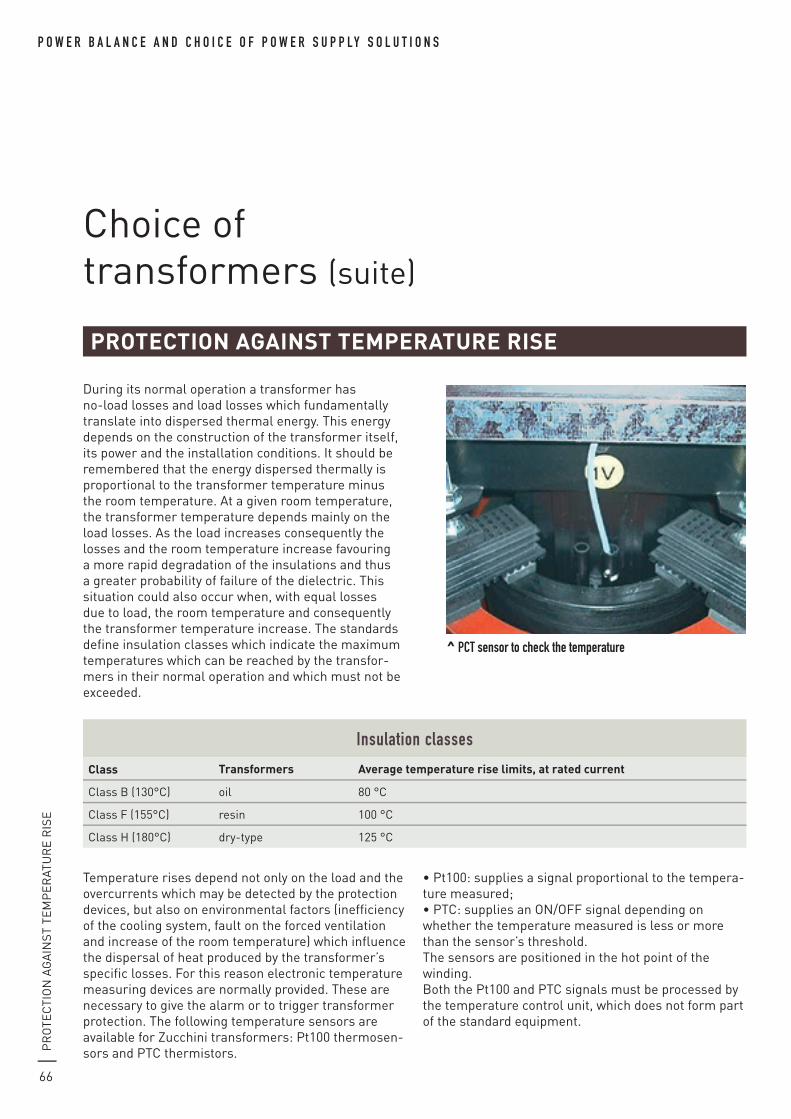
66
P o w e r b a l a n c e a n d c h o i c e o f P o w e r s u P P ly s o l u t i o n s
Choice of transformers (suite)
Pr
otE
Cti
on
ag
ain
st t
Em
PE
rat
ur
E r
isE
ProtEction against tEmPEraturE risE
during its normal operation a transformer has no-load losses and load losses which fundamentally translate into dispersed thermal energy. this energy depends on the construction of the transformer itself, its power and the installation conditions. it should be remembered that the energy dispersed thermally is proportional to the transformer temperature minus the room temperature. at a given room temperature, the transformer temperature depends mainly on the load losses. as the load increases consequently the losses and the room temperature increase favouring a more rapid degradation of the insulations and thus a greater probability of failure of the dielectric. this situation could also occur when, with equal losses due to load, the room temperature and consequently the transformer temperature increase. the standards define insulation classes which indicate the maximum temperatures which can be reached by the transfor-mers in their normal operation and which must not be exceeded.
temperature rises depend not only on the load and the overcurrents which may be detected by the protection devices, but also on environmental factors (inefficiency of the cooling system, fault on the forced ventilation and increase of the room temperature) which influence the dispersal of heat produced by the transformer’s specific losses. for this reason electronic temperature measuring devices are normally provided. these are necessary to give the alarm or to trigger transformer protection. the following temperature sensors are available for Zucchini transformers: Pt100 thermosen-sors and PtC thermistors.
• Pt100: supplies a signal proportional to the tempera-ture measured;• PTC: supplies an ON/OFF signal depending on whether the temperature measured is less or more than the sensor’s threshold.the sensors are positioned in the hot point of the winding.Both the Pt100 and PtC signals must be processed by the temperature control unit, which does not form part of the standard equipment.
^ Pct sensor to check the temperature
insulation classes
class transformers average temperature rise limits, at rated current
Class B (130°C) oil 80 °C
Class f (155°C) resin 100 °C
Class H (180°C) dry-type 125 °C
67
Pr
otE
Cti
on
ag
ain
st t
Em
PE
rat
ur
E r
isE
typical transformer alarm and release temperature values
transformer type room (°c) alarm (°c) release (°c)
oil 40 105 118
resin 40 140 155
air 40 165 180
temperature rise limits for cast resin transformers
Part insulating system temperature (°c) maximum temperature rises (°c)
Windings:(temperature rise measured with the heating element variation method)
105 (a) 60
120 (E) 75
130 (B) 80
155 (f) 100
180 (H) 125
200 135
220 150
Core, metal parts and adjacent materials
-in no case must the temperature reach values which would damage the core itself, other parts or adjacent materials
on request other accessories are available to check the temperature:• a separate temperature display, to be installed on the control panel;• an output relay for alarm and release and control of the fans.
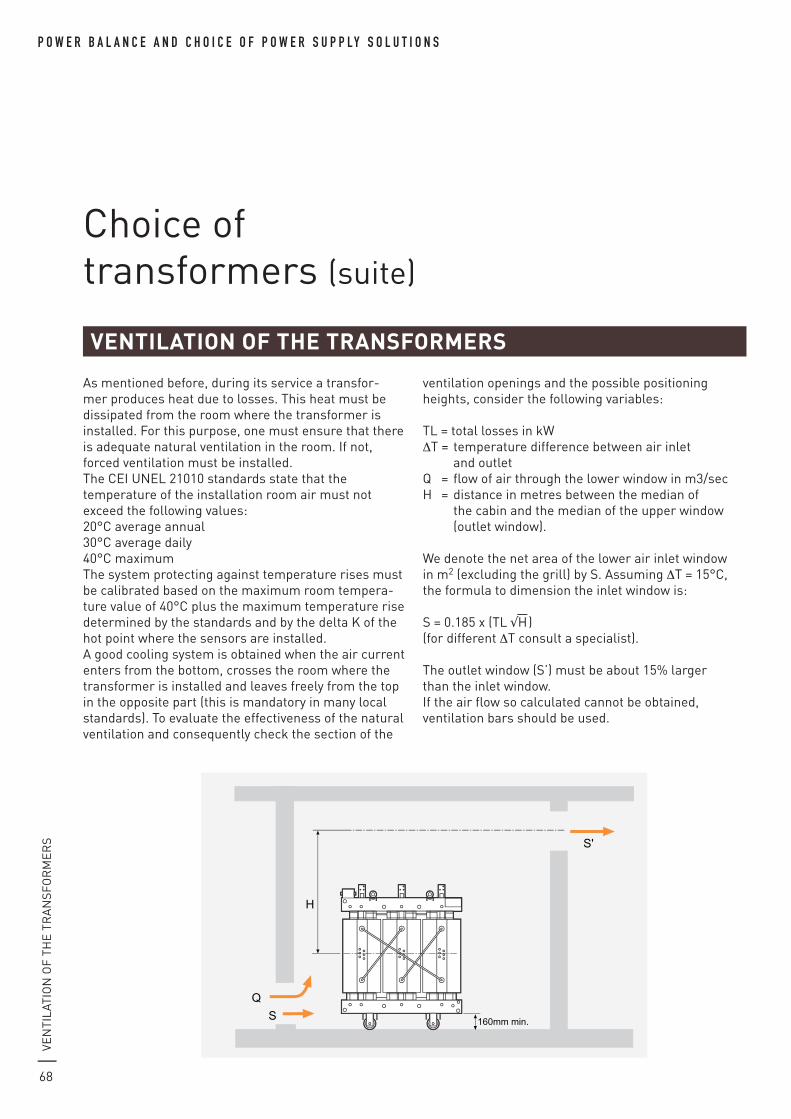
68
P o w e r b a l a n c e a n d c h o i c e o f P o w e r s u P P ly s o l u t i o n s
Choice of transformers (suite)
vEn
tila
tio
n o
f tH
E t
ra
nsf
or
mE
rs
vEntilation of thE transformErs
as mentioned before, during its service a transfor-mer produces heat due to losses. this heat must be dissipated from the room where the transformer is installed. for this purpose, one must ensure that there is adequate natural ventilation in the room. if not, forced ventilation must be installed.the CEi unEl 21010 standards state that the temperature of the installation room air must not exceed the following values:20°C average annual30°C average daily40°C maximumthe system protecting against temperature rises must be calibrated based on the maximum room tempera-ture value of 40°C plus the maximum temperature rise determined by the standards and by the delta K of the hot point where the sensors are installed. a good cooling system is obtained when the air current enters from the bottom, crosses the room where the transformer is installed and leaves freely from the top in the opposite part (this is mandatory in many local standards). to evaluate the effectiveness of the natural ventilation and consequently check the section of the
ventilation openings and the possible positioning heights, consider the following variables:
tl = total losses in kWΔt = temperature difference between air inlet and outletQ = flow of air through the lower window in m3/secH = distance in metres between the median of the cabin and the median of the upper window (outlet window).
We denote the net area of the lower air inlet window in m2 (excluding the grill) by s. assuming Δt = 15°C, the formula to dimension the inlet window is:
s = 0.185 x (tl √H—
)(for different Δt consult a specialist).
the outlet window (s’) must be about 15% larger than the inlet window.if the air flow so calculated cannot be obtained, ventilation bars should be used.
SQ
160mm min.
S'
160mm min.
S'
H
H
S
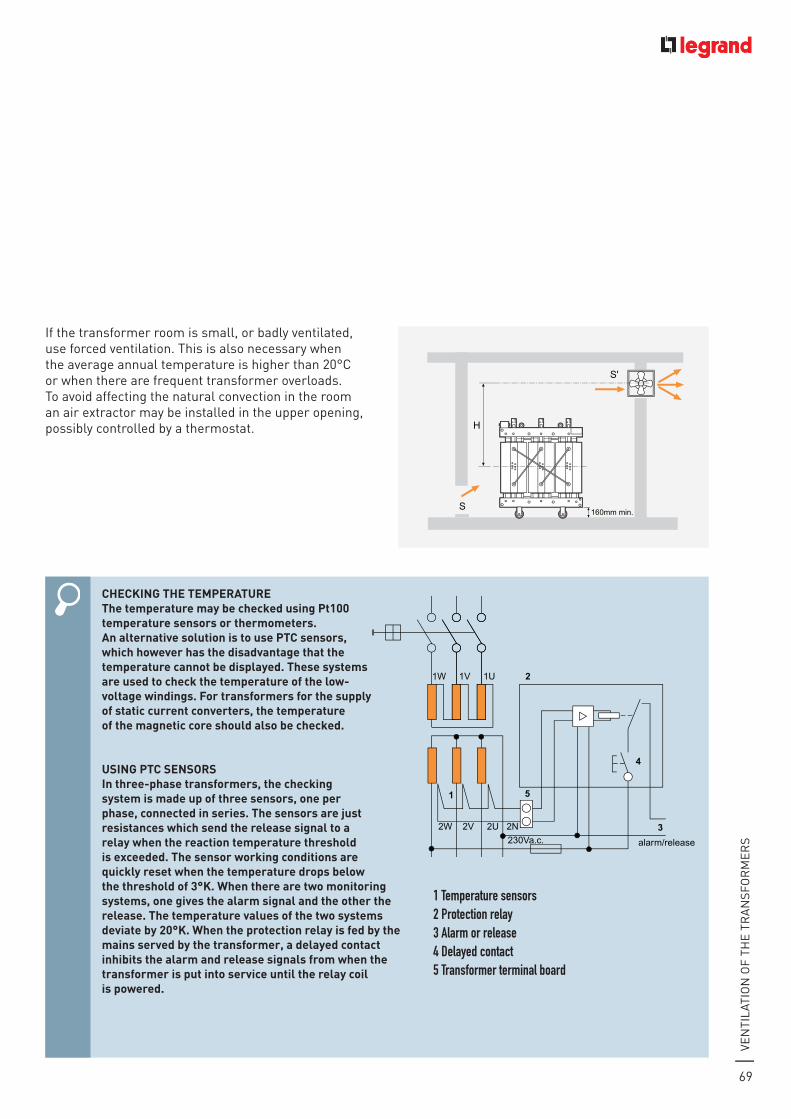
69
chEcKing thE tEmPEraturEthe temperature may be checked using Pt100 temperature sensors or thermometers. an alternative solution is to use Ptc sensors, which however has the disadvantage that the temperature cannot be displayed. these systems are used to check the temperature of the low- voltage windings. for transformers for the supply of static current converters, the temperature of the magnetic core should also be checked.
using Ptc sEnsorsin three-phase transformers, the checking system is made up of three sensors, one per phase, connected in series. the sensors are just resistances which send the release signal to a relay when the reaction temperature threshold is exceeded. the sensor working conditions are quickly reset when the temperature drops below the threshold of 3°K. When there are two monitoring systems, one gives the alarm signal and the other the release. the temperature values of the two systems deviate by 20°K. When the protection relay is fed by the mains served by the transformer, a delayed contact inhibits the alarm and release signals from when the transformer is put into service until the relay coil is powered.
vEn
tila
tio
n o
f tH
E t
ra
nsf
or
mE
rs
if the transformer room is small, or badly ventilated, use forced ventilation. this is also necessary when the average annual temperature is higher than 20°C or when there are frequent transformer overloads. to avoid affecting the natural convection in the room an air extractor may be installed in the upper opening, possibly controlled by a thermostat.
SQ
160mm min.
S'
160mm min.
S'
H
H
S
Schema di principio per supervisione temperatura del trasformatore
1W 1V 1U
1 5
2W 2V 2U 2N 3
2
4
230Va.c. alarm/release
1 temperature sensors2 Protection relay3 alarm or release4 delayed contact5 transformer terminal board
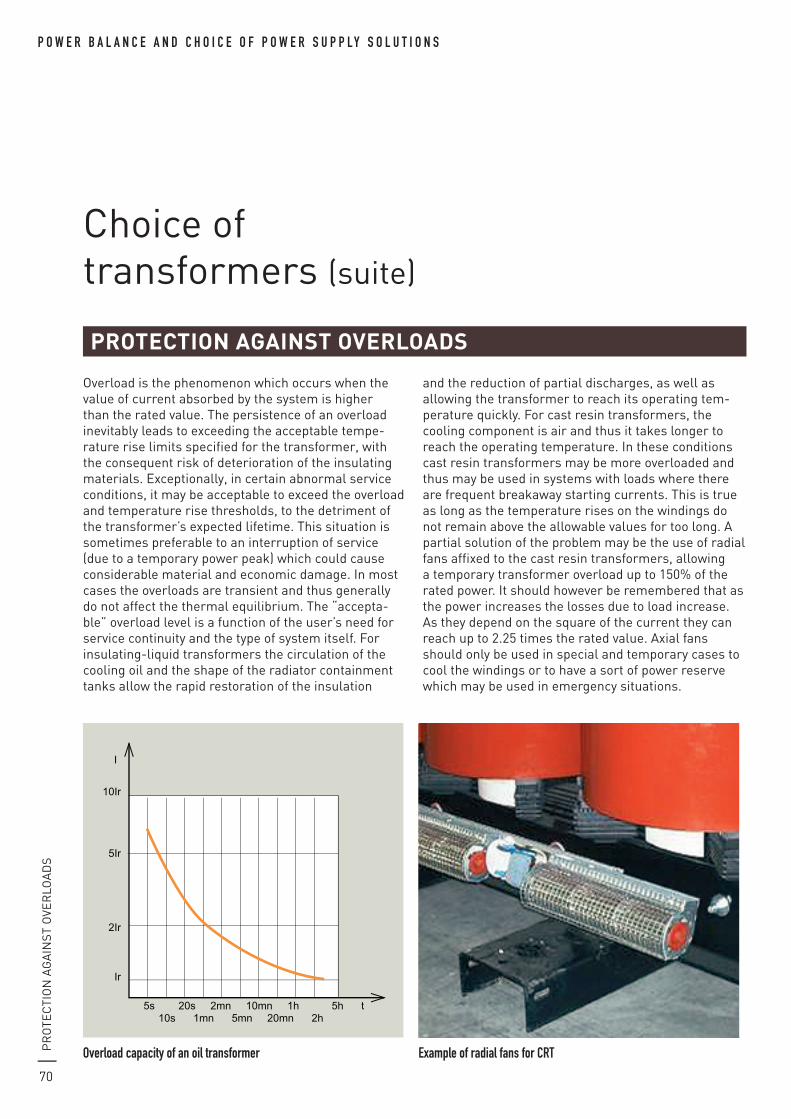
70
P o w e r b a l a n c e a n d c h o i c e o f P o w e r s u P P ly s o l u t i o n s
Choice of transformers (suite)
Pr
otE
Cti
on
ag
ain
st o
vEr
loa
ds
ProtEction against ovErloads
overload is the phenomenon which occurs when the value of current absorbed by the system is higher than the rated value. the persistence of an overload inevitably leads to exceeding the acceptable tempe-rature rise limits specified for the transformer, with the consequent risk of deterioration of the insulating materials. Exceptionally, in certain abnormal service conditions, it may be acceptable to exceed the overload and temperature rise thresholds, to the detriment of the transformer’s expected lifetime. this situation is sometimes preferable to an interruption of service (due to a temporary power peak) which could cause considerable material and economic damage. in most cases the overloads are transient and thus generally do not affect the thermal equilibrium. the “accepta-ble” overload level is a function of the user’s need for service continuity and the type of system itself. for insulating-liquid transformers the circulation of the cooling oil and the shape of the radiator containment tanks allow the rapid restoration of the insulation
and the reduction of partial discharges, as well as allowing the transformer to reach its operating tem-perature quickly. for cast resin transformers, the cooling component is air and thus it takes longer to reach the operating temperature. in these conditions cast resin transformers may be more overloaded and thus may be used in systems with loads where there are frequent breakaway starting currents. this is true as long as the temperature rises on the windings do not remain above the allowable values for too long. a partial solution of the problem may be the use of radial fans affixed to the cast resin transformers, allowing a temporary transformer overload up to 150% of the rated power. it should however be remembered that as the power increases the losses due to load increase. as they depend on the square of the current they can reach up to 2.25 times the rated value. axial fans should only be used in special and temporary cases to cool the windings or to have a sort of power reserve which may be used in emergency situations.
I
I
5kA
10mA15kV 75kV U
10Ir
5Ir
2Ir
Ir
5s 20s 2mn 10mn 1h 5h t 10s 1mn 5mn 20mn 2h
overload capacity of an oil transformer example of radial fans for crt

71
Pr
otE
Cti
on
ag
ain
st o
vEr
loa
ds
1 ovErload in PuBlic distriButionin public distribution, in the short term priority is given to continuity of service. for this reason overloads do not generally lead to switching the transformer off. again for the same reason generally low-voltage cir-cuits are always overdimensioned and consequently an overload of the transformer never corresponds to an overload of the conductors. attention should be paid however when the overloads repeat too frequently. in this situation the distributing organisation should replace the transformer with a model of greater power.
2 ovErload in industrial distriButionin an industrial installation, the overload can last for a short or long time. in these installations the main distribution board equipped with protective circuit breakers against overload and short-circuit is always immediately downstream of the transformers. management of the overload is in fact delegated to the circuit breakers on the low-voltage side which will detach the loads in an automatic or controlled way.
3 ovErload in sErvicE distriButionin service installations, such as offices and shopping centres, continuity of service is fundamental. in these types of application conditions of regular load which have starting regimes or similar behaviour rarely occur. to guarantee maximum continuity of service even when there are overloads it is essential that the loads considered non-priority are managed and dis-connected when needed by the transformer on the low-voltage side.
^ airport
^ factory
^ shopping centre
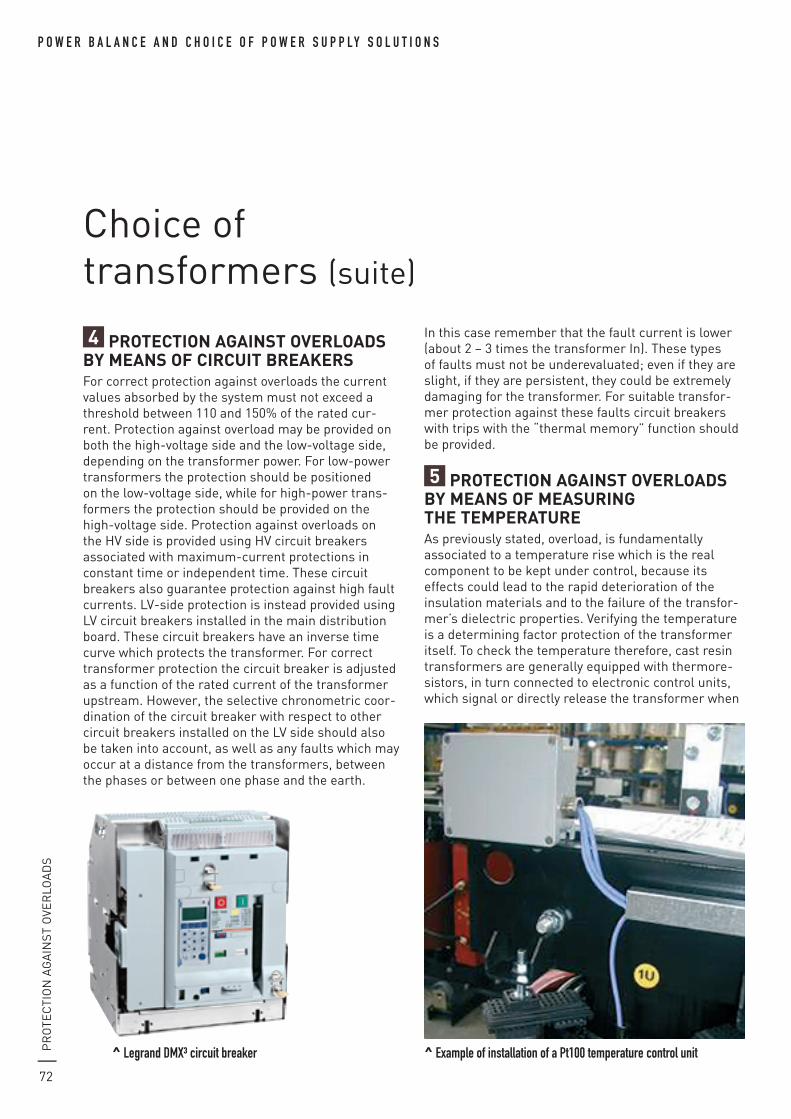
72
P o w e r b a l a n c e a n d c h o i c e o f P o w e r s u P P ly s o l u t i o n s
Choice of transformers (suite)
4 ProtEction against ovErloads BY mEans of circuit BrEaKErsfor correct protection against overloads the current values absorbed by the system must not exceed a threshold between 110 and 150% of the rated cur-rent. Protection against overload may be provided on both the high-voltage side and the low-voltage side, depending on the transformer power. for low-power transformers the protection should be positioned on the low-voltage side, while for high-power trans-formers the protection should be provided on the high-voltage side. Protection against overloads on the Hv side is provided using Hv circuit breakers associated with maximum-current protections in constant time or independent time. these circuit breakers also guarantee protection against high fault currents. lv-side protection is instead provided using lv circuit breakers installed in the main distribution board. these circuit breakers have an inverse time curve which protects the transformer. for correct transformer protection the circuit breaker is adjusted as a function of the rated current of the transformer upstream. However, the selective chronometric coor-dination of the circuit breaker with respect to other circuit breakers installed on the lv side should also be taken into account, as well as any faults which may occur at a distance from the transformers, between the phases or between one phase and the earth.
in this case remember that the fault current is lower (about 2 – 3 times the transformer in). these types of faults must not be underevaluated; even if they are slight, if they are persistent, they could be extremely damaging for the transformer. for suitable transfor-mer protection against these faults circuit breakers with trips with the “thermal memory” function should be provided.
5 ProtEction against ovErloads BY mEans of mEasuring thE tEmPEraturEas previously stated, overload, is fundamentally associated to a temperature rise which is the real component to be kept under control, because its effects could lead to the rapid deterioration of the insulation materials and to the failure of the transfor-mer’s dielectric properties. verifying the temperature is a determining factor protection of the transformer itself. to check the temperature therefore, cast resin transformers are generally equipped with thermore-sistors, in turn connected to electronic control units, which signal or directly release the transformer when
Pr
otE
Cti
on
ag
ain
st o
vEr
loa
ds
^ legrand dMX³ circuit breaker ^ example of installation of a Pt100 temperature control unit
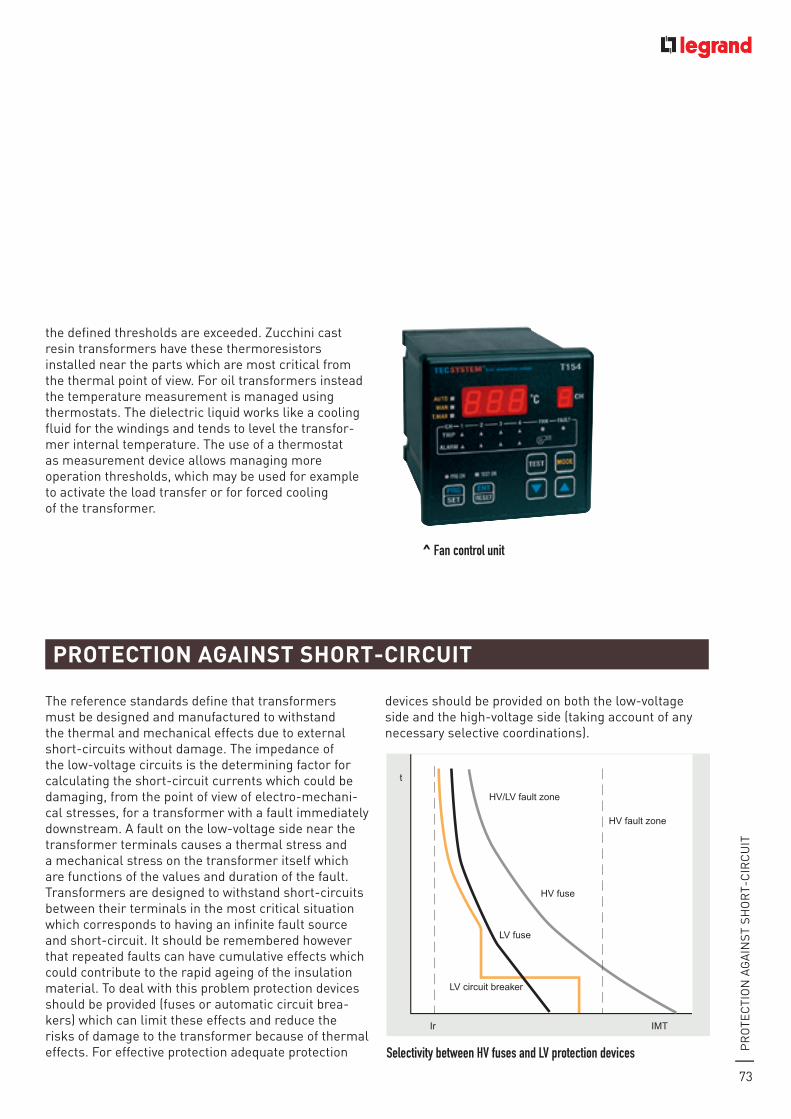
73
the defined thresholds are exceeded. Zucchini cast resin transformers have these thermoresistors installed near the parts which are most critical from the thermal point of view. for oil transformers instead the temperature measurement is managed using thermostats. the dielectric liquid works like a cooling fluid for the windings and tends to level the transfor-mer internal temperature. the use of a thermostat as measurement device allows managing more operation thresholds, which may be used for example to activate the load transfer or for forced cooling of the transformer.
Pr
otE
Cti
on
ag
ain
st s
Ho
rt-
Cir
Cu
it
^ fan control unit
ProtEction against short-circuit
the reference standards define that transformers must be designed and manufactured to withstand the thermal and mechanical effects due to external short-circuits without damage. the impedance of the low-voltage circuits is the determining factor for calculating the short-circuit currents which could be damaging, from the point of view of electro-mechani-cal stresses, for a transformer with a fault immediately downstream. a fault on the low-voltage side near the transformer terminals causes a thermal stress and a mechanical stress on the transformer itself which are functions of the values and duration of the fault. transformers are designed to withstand short-circuits between their terminals in the most critical situation which corresponds to having an infinite fault source and short-circuit. it should be remembered however that repeated faults can have cumulative effects which could contribute to the rapid ageing of the insulation material. to deal with this problem protection devices should be provided (fuses or automatic circuit brea-kers) which can limit these effects and reduce the risks of damage to the transformer because of thermal effects. for effective protection adequate protection
devices should be provided on both the low-voltage side and the high-voltage side (taking account of any necessary selective coordinations).
t
Ir IMT
HV fault zone
HV/LV fault zone
HV fuse
LV fuse
LV circuit breaker
selectivity between hV fuses and lV protection devices

74
P o w e r b a l a n c e a n d c h o i c e o f P o w e r s u P P ly s o l u t i o n s
Choice of transformers (suite)
1 ProtEction against short-circuit With hv fusEs Because fuses are inexpensive and easy to use they are widely used to protect distribution transformers in public networks. While simplicity and price are definite advantages it is however true that there are limits in the use of fuses. they are often used in conditions of low protection where special requirements of selective coordination or continuity of service are not required. fuses have a rated current value and a time/current melting property. Hv fuses are generally available in 2 versions: expulsion fuses and limitation fuses. the first are generally used in the air distribution system. the second are generally more widely used because of their capacity of response to high currents within a few milliseconds. the high response speed is the parameter which offers the capacity of limitation of the fuse itself and which allows adequate protection, even in the most serious conditions, reducing the risk of damage to the transformer and the associa-ted circuits. the choice of the most suitable fuse for protection reasons is however very complex and must take account of various factors. an error in choosing the fuse could in fact lead to faulty service due to its melting, if it is underdimensioned, or to lack of protec-tion if it is overdimensioned.the criteria for correct choice of a fuse are:• the transformer service voltage;• the switch ON currents;• the transformer temporary overload level;• the time taken to remove the fault on the LV side;• the selectivity level with the LV protections.
2 ProtEction against short-circuit With hv circuit BrEaKErto obtain more effective protection, with adjustment levels of the current thresholds and the operating times and to obtain selectivity with respect to the pro-tections placed downstream of the transformer on the lv side, high-voltage circuit breakers are more and more commonly used. Hv circuit breakers placed upstream of the transformer have protection relays with thresholds which rarely correspond to the rated current of the transformer monitored. this means that the protection curves move towards higher cur-rent values, with a consequent increase of the level of selectivity.a protection circuit breaker dedicated to the Hv trans-former must have the following properties:• greater speed of operation of the HV protection device immediately upstream;• greatest possible speed for higher current values of the short-circuit current on the lv side;• they must let the switch ON current pass;• they must guarantee monitoring of the overload zone.
Pr
otE
Cti
on
ag
ain
st s
Ho
rt-
Cir
Cu
it
example of an hV fuse example of an hV circuit breaker
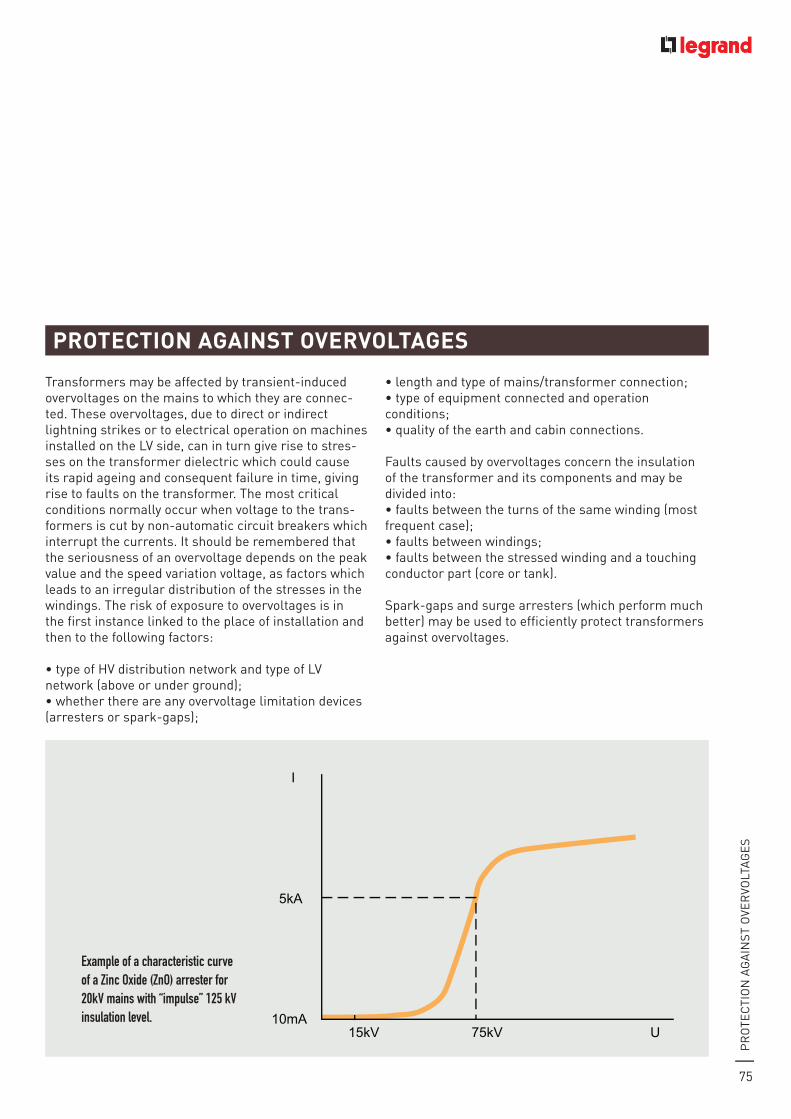
75
Pr
otE
Cti
on
ag
ain
st o
vEr
volt
ag
Es
ProtEction against ovErvoltagEs
transformers may be affected by transient-induced overvoltages on the mains to which they are connec-ted. these overvoltages, due to direct or indirect lightning strikes or to electrical operation on machines installed on the lv side, can in turn give rise to stres-ses on the transformer dielectric which could cause its rapid ageing and consequent failure in time, giving rise to faults on the transformer. the most critical conditions normally occur when voltage to the trans-formers is cut by non-automatic circuit breakers which interrupt the currents. it should be remembered that the seriousness of an overvoltage depends on the peak value and the speed variation voltage, as factors which leads to an irregular distribution of the stresses in the windings. the risk of exposure to overvoltages is in the first instance linked to the place of installation and then to the following factors:
• type of HV distribution network and type of LV network (above or under ground);• whether there are any overvoltage limitation devices (arresters or spark-gaps);
• length and type of mains/transformer connection;• type of equipment connected and operation conditions;• quality of the earth and cabin connections.
faults caused by overvoltages concern the insulation of the transformer and its components and may be divided into:• faults between the turns of the same winding (most frequent case);• faults between windings;• faults between the stressed winding and a touching conductor part (core or tank).
spark-gaps and surge arresters (which perform much better) may be used to efficiently protect transformers against overvoltages.
I
5kA
10mA15kV 75kV U
example of a characteristic curve of a Zinc oxide (Zno) arrester for 20kV mains with “impulse” 125 kV insulation level.
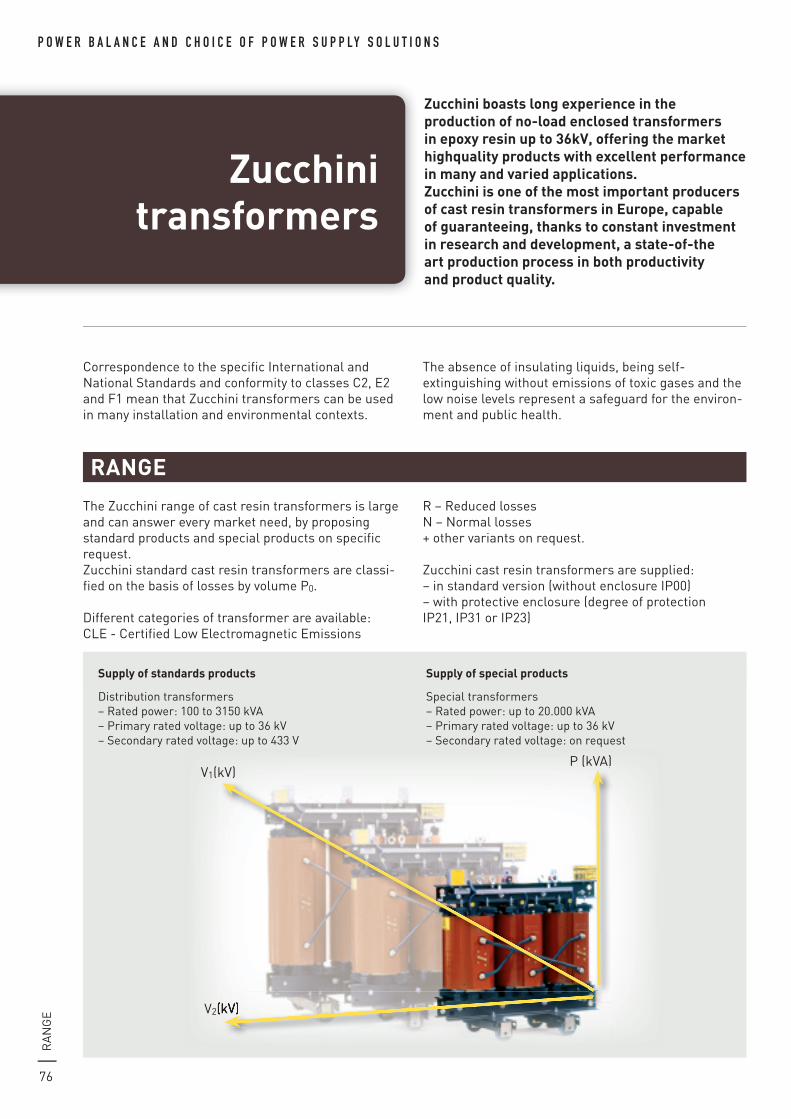
ra
ng
E
76
P o w e r b a l a n c e a n d c h o i c e o f P o w e r s u P P ly s o l u t i o n s
Zucchinitransformers
Zucchini boasts long experience in the production of no-load enclosed transformers in epoxy resin up to 36kv, offering the market highquality products with excellent performance in many and varied applications.Zucchini is one of the most important producersof cast resin transformers in Europe, capableof guaranteeing, thanks to constant investmentin research and development, a state-of-theart production process in both productivity and product quality.
Correspondence to the specific international and national standards and conformity to classes C2, E2 and f1 mean that Zucchini transformers can be used in many installation and environmental contexts.
the absence of insulating liquids, being self-extinguishing without emissions of toxic gases and the low noise levels represent a safeguard for the environ-ment and public health.
the Zucchini range of cast resin transformers is large and can answer every market need, by proposing standard products and special products on specific request. Zucchini standard cast resin transformers are classi-fied on the basis of losses by volume P0.
different categories of transformer are available:ClE - Certified low Electromagnetic Emissions
r – reduced lossesn – normal losses+ other variants on request.
Zucchini cast resin transformers are supplied:– in standard version (without enclosure iP00)– with protective enclosure (degree of protection iP21, iP31 or iP23)
rangE
supply of standards products supply of special products
distribution transformers– rated power: 100 to 3150 kva– Primary rated voltage: up to 36 kv– secondary rated voltage: up to 433 v
special transformers– rated power: up to 20.000 kva– Primary rated voltage: up to 36 kv– secondary rated voltage: on request
P (kva)
v2(kv)
v1(kv)
(kv)(kv)
P (kva)
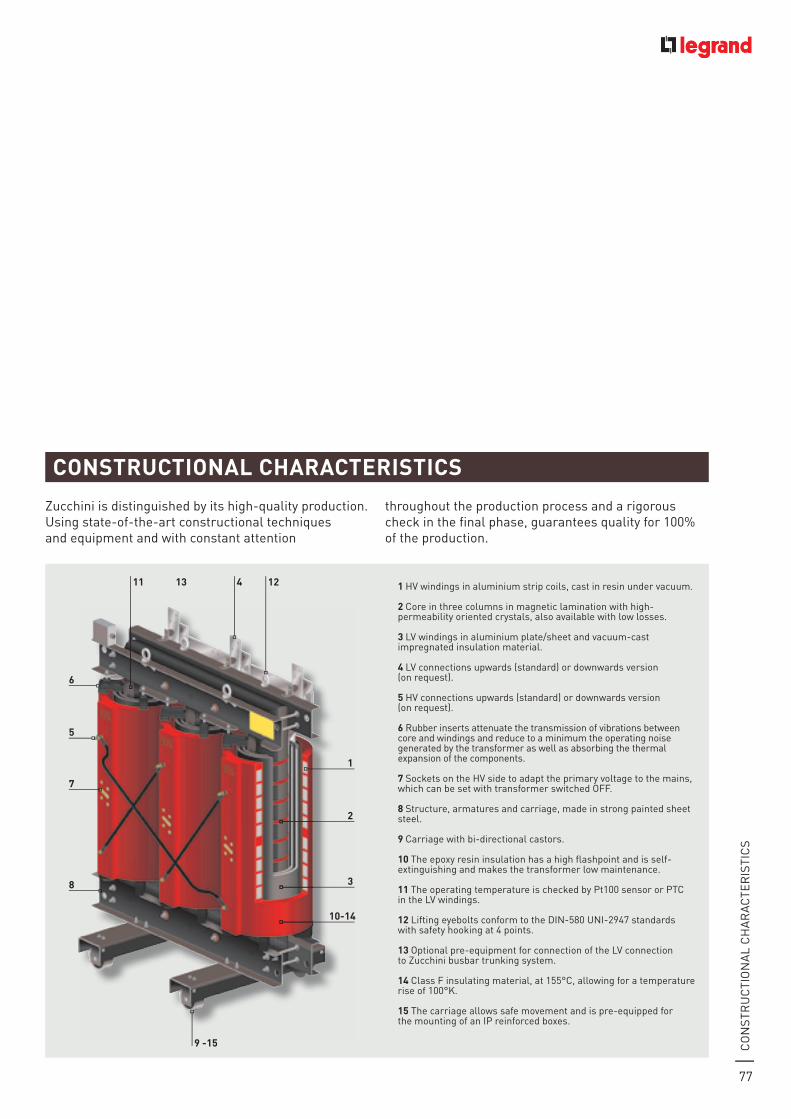
Co
nst
ru
Cti
on
al
CH
ar
aC
tEr
isti
Cs
77
Zucchini is distinguished by its high-quality production. using state-of-the-art constructional techniques and equipment and with constant attention
throughout the production process and a rigorous check in the final phase, guarantees quality for 100% of the production.
constructional charactEristics
1 Hv windings in aluminium strip coils, cast in resin under vacuum.
2 Core in three columns in magnetic lamination with high-permeability oriented crystals, also available with low losses.
3 lv windings in aluminium plate/sheet and vacuum-cast impregnated insulation material.
4 lv connections upwards (standard) or downwards version (on request).
5 Hv connections upwards (standard) or downwards version (on request).
6 rubber inserts attenuate the transmission of vibrations between core and windings and reduce to a minimum the operating noise generated by the transformer as well as absorbing the thermal expansion of the components.
7 sockets on the Hv side to adapt the primary voltage to the mains, which can be set with transformer switched off.
8 structure, armatures and carriage, made in strong painted sheet steel.
9 Carriage with bi-directional castors.
10 the epoxy resin insulation has a high flashpoint and is self-extinguishing and makes the transformer low maintenance. 11 the operating temperature is checked by Pt100 sensor or PtC in the lv windings.
12 lifting eyebolts conform to the din-580 uni-2947 standards with safety hooking at 4 points.
13 optional pre-equipment for connection of the lv connection to Zucchini busbar trunking system.
14 Class f insulating material, at 155°C, allowing for a temperature rise of 100°K.
15 the carriage allows safe movement and is pre-equipped for the mounting of an iP reinforced boxes.
5
7
8
6
1
2
3
10-14
9 -15
11 13 4 12
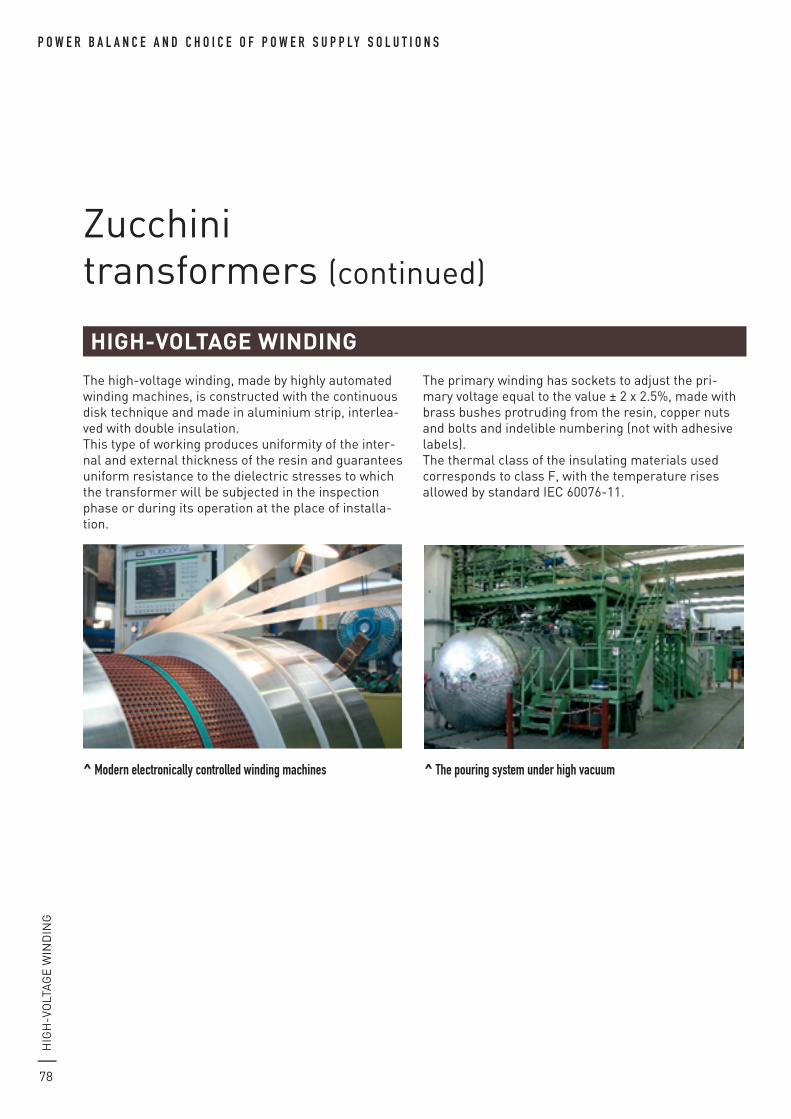
Hig
H-v
olt
ag
E W
ind
ing
78
P o w e r b a l a n c e a n d c h o i c e o f P o w e r s u P P ly s o l u t i o n s
Zucchini transformers (continued)
the high-voltage winding, made by highly automated winding machines, is constructed with the continuous disk technique and made in aluminium strip, interlea-ved with double insulation.this type of working produces uniformity of the inter-nal and external thickness of the resin and guarantees uniform resistance to the dielectric stresses to which the transformer will be subjected in the inspection phase or during its operation at the place of installa-tion.
the primary winding has sockets to adjust the pri-mary voltage equal to the value ± 2 x 2.5%, made with brass bushes protruding from the resin, copper nuts and bolts and indelible numbering (not with adhesive labels).the thermal class of the insulating materials used corresponds to class f, with the temperature rises allowed by standard iEC 60076-11.
high-voltagE Winding
^ Modern electronically controlled winding machines ^ the pouring system under high vacuum

loW
-vo
lta
gE
Win
din
g
79
the low-voltage winding, is made up of a single aluminium strip, of the same mechanical height as the Hv electrical winding, with an interleaved sheet of insulating material which can be class f or class H. the winding made in this way guarantees a compac-tness which forms a single cylinder which resists any axial and radial forces which may arise from a short-circuit. all the welds of the conductor strip with the output bars are made by butt welding in inert atmos-phere and under electronic control, so as to avoid any excess of material which could by repeated stress affect or damage the insulation interposed between output terminal and the following turn.this winding is then impregnated with epoxy resin, by means of treatment under vacuum, to confer the necessary compactness and homogeneity, as well as avoiding the absorption of humidity during the trans-former’s lifetime, wherever it may operate.this treatment allows to obtain the system classifica-tion at level f1 according to standards iEC 60726 and iEC 60076-11.
loW-voltagE Winding
< tiG welding in controlled atmosphere for lV connections.
^ lV winding system
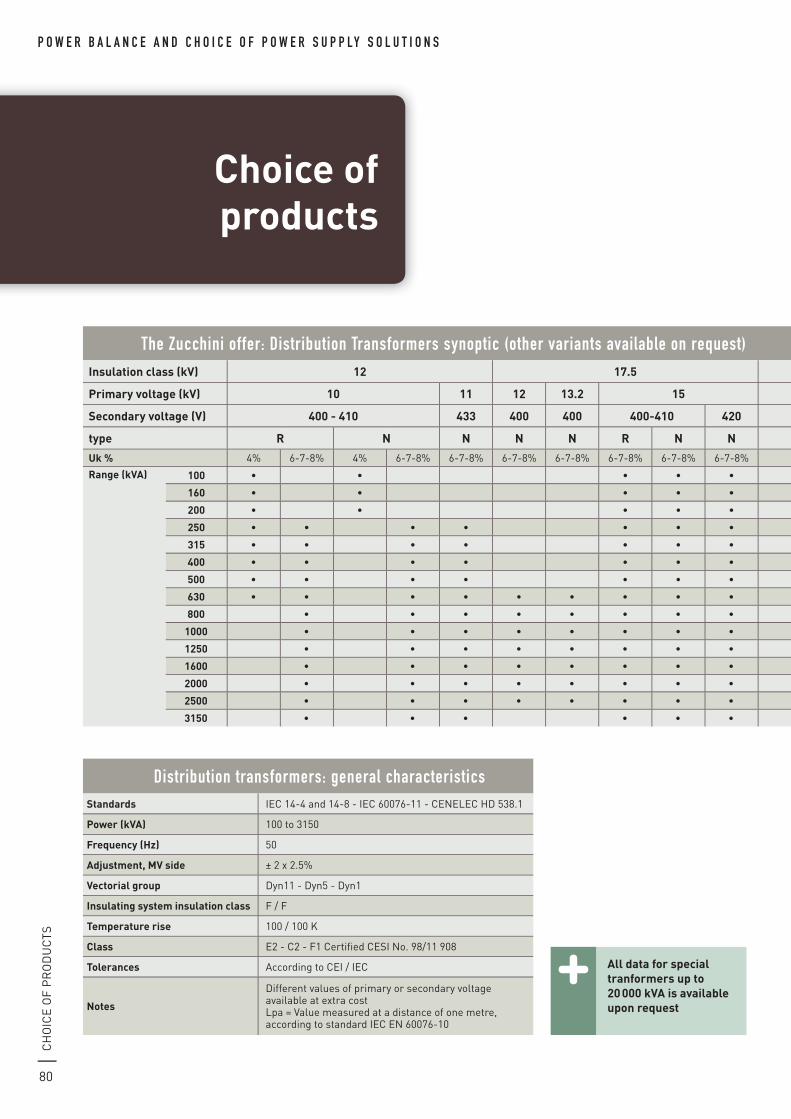
80
P o w e r b a l a n c e a n D c H o i c e o f P o w e r S u P P ly S o l u T i o n Sc
ho
ice
of
pr
od
uc
ts
Choice of products
Distribution transformers: general characteristicsStandards iec 14-4 and 14-8 - iec 60076-11 - ceNeLec hd 538.1
Power (kVA) 100 to 3150
Frequency (Hz) 50
Adjustment, MV side ± 2 x 2.5%
Vectorial group dyn11 - dyn5 - dyn1
Insulating system insulation class f / f
Temperature rise 100 / 100 K
Class e2 - c2 - f1 certifi ed cesi No. 98/11 908
Tolerances According to cei / iec
Notes
different values of primary or secondary voltage available at extra costLpa = Value measured at a distance of one metre, according to standard iec eN 60076-10
The Zucchini offer: Distribution Transformers synoptic (other variants available on request)Insulation class (kV) 12 17.5 24 36
Primary voltage (kV) 10 11 12 13.2 15 20 23 25 33
Secondary voltage (V) 400 - 410 433 400 400 400-410 420 400-410 420 400 400 420 400
type R N N N N R N N R N N N N N N
Uk % 4% 6-7-8% 4% 6-7-8% 6-7-8% 6-7-8% 6-7-8% 6-7-8% 6-7-8% 6-7-8% 4% 6-7-8% 4% 6-7-8% 6-7-8% 4% 6-7-8% 6-7-8% 6-7-8% 6-7-8%
Range (kVA) 100 • • • • • • • • • • • •
160 • • • • • • • • • • • •
200 • • • • • • • • • • • •
250 • • • • • • • • • • • • • • • • •
315 • • • • • • • • • • • • • • • • •
400 • • • • • • • • • • • • • • • • •
500 • • • • • • • • • • • • • • • • •
630 • • • • • • • • • • • • • • • • • •
800 • • • • • • • • • • • • • • •
1000 • • • • • • • • • • • • • • •
1250 • • • • • • • • • • • • • • •
1600 • • • • • • • • • • • • • • •
2000 • • • • • • • • • • • • • • •
2500 • • • • • • • • • • • • • • •
3150 • • • • • • • • • •
All data for special tranformers up to 20 000 kVA is available upon request
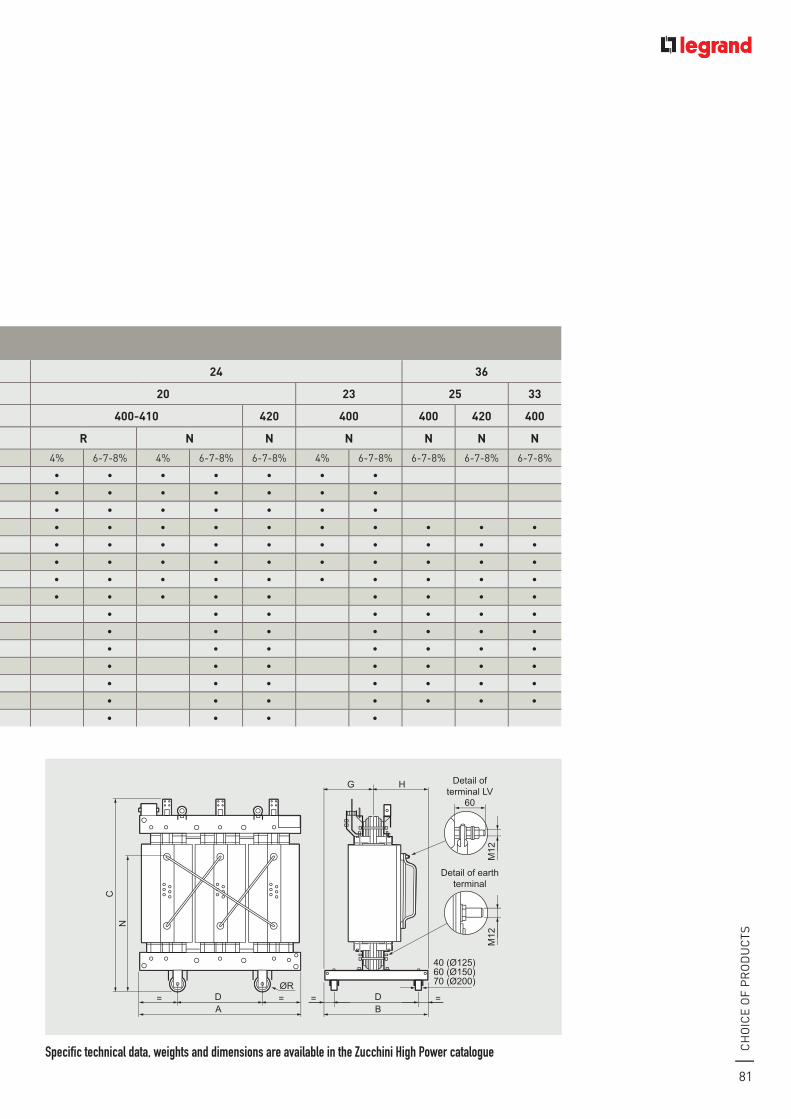
81
ch
oic
e o
f p
ro
du
cts
H
60
Detail ofterminal LV
Detail of earthterminal
M12
M12
40 (Ø125)60 (Ø150)70 (Ø200)
G
DB
DØR
= = ==
CN
A
The Zucchini offer: Distribution Transformers synoptic (other variants available on request)Insulation class (kV) 12 17.5 24 36
Primary voltage (kV) 10 11 12 13.2 15 20 23 25 33
Secondary voltage (V) 400 - 410 433 400 400 400-410 420 400-410 420 400 400 420 400
type R N N N N R N N R N N N N N N
Uk % 4% 6-7-8% 4% 6-7-8% 6-7-8% 6-7-8% 6-7-8% 6-7-8% 6-7-8% 6-7-8% 4% 6-7-8% 4% 6-7-8% 6-7-8% 4% 6-7-8% 6-7-8% 6-7-8% 6-7-8%
Range (kVA) 100 • • • • • • • • • • • •
160 • • • • • • • • • • • •
200 • • • • • • • • • • • •
250 • • • • • • • • • • • • • • • • •
315 • • • • • • • • • • • • • • • • •
400 • • • • • • • • • • • • • • • • •
500 • • • • • • • • • • • • • • • • •
630 • • • • • • • • • • • • • • • • • •
800 • • • • • • • • • • • • • • •
1000 • • • • • • • • • • • • • • •
1250 • • • • • • • • • • • • • • •
1600 • • • • • • • • • • • • • • •
2000 • • • • • • • • • • • • • • •
2500 • • • • • • • • • • • • • • •
3150 • • • • • • • • • •
Specific technical data, weights and dimensions are available in the Zucchini High Power catalogue
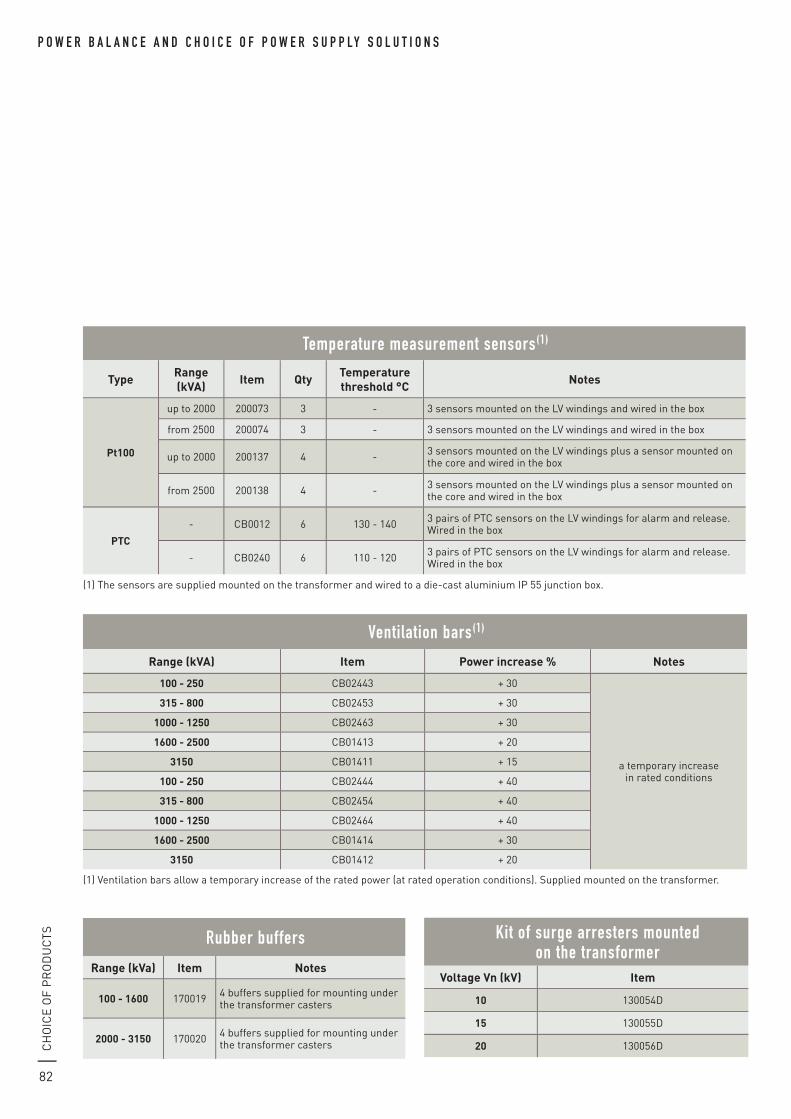
82
P o w e r b a l a n c e a n D c H o i c e o f P o w e r S u P P ly S o l u T i o n Sc
ho
ice
of
pr
od
uc
ts
Temperature measurement sensors(1)
Type Range (kVA) Item Qty Temperature
threshold °C Notes
Pt100
up to 2000 200073 3 - 3 sensors mounted on the LV windings and wired in the box
from 2500 200074 3 - 3 sensors mounted on the LV windings and wired in the box
up to 2000 200137 4 - 3 sensors mounted on the LV windings plus a sensor mounted on the core and wired in the box
from 2500 200138 4 - 3 sensors mounted on the LV windings plus a sensor mounted on the core and wired in the box
PTC
- cB0012 6 130 - 140 3 pairs of ptc sensors on the LV windings for alarm and release. Wired in the box
- cB0240 6 110 - 120 3 pairs of ptc sensors on the LV windings for alarm and release. Wired in the box
(1) the sensors are supplied mounted on the transformer and wired to a die-cast aluminium ip 55 junction box.
Ventilation bars(1)
Range (kVA) Item Power increase % Notes
100 - 250 cB02443 + 30
a temporary increase in rated conditions
315 - 800 cB02453 + 30
1000 - 1250 cB02463 + 30
1600 - 2500 cB01413 + 20
3150 cB01411 + 15
100 - 250 cB02444 + 40
315 - 800 cB02454 + 40
1000 - 1250 cB02464 + 40
1600 - 2500 cB01414 + 30
3150 cB01412 + 20
(1) Ventilation bars allow a temporary increase of the rated power (at rated operation conditions). supplied mounted on the transformer.
rubber buffers
Range (kVa) Item Notes
100 - 1600 170019 4 buffers supplied for mounting under the transformer casters
2000 - 3150 170020 4 buffers supplied for mounting under the transformer casters
Kit of surge arresters mounted on the transformer
Voltage Vn (kV) Item
10 130054d
15 130055d
20 130056d
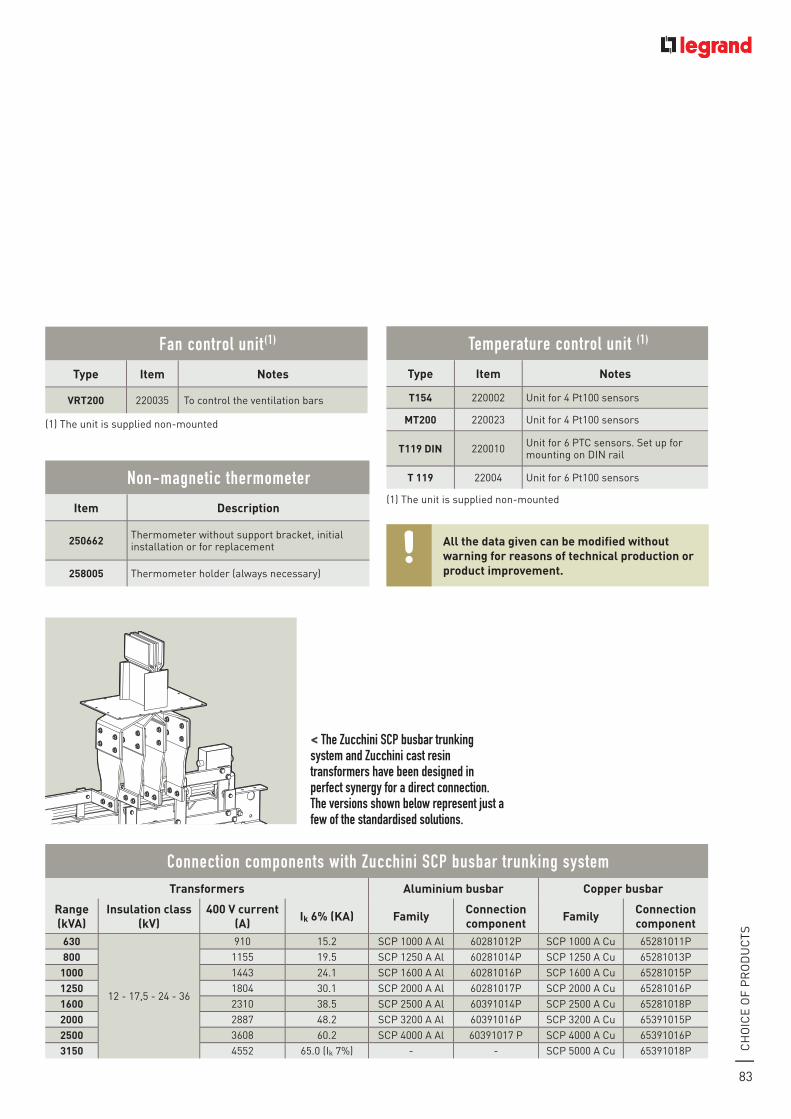
83
ch
oic
e o
f p
ro
du
cts
fan control unit(1)
Type Item Notes
VRT200 220035 to control the ventilation bars
(1) the unit is supplied non-mounted
Temperature control unit (1)
Type Item Notes
T154 220002 unit for 4 pt100 sensors
MT200 220023 unit for 4 pt100 sensors
T119 DIN 220010 unit for 6 ptc sensors. set up for mounting on diN rail
T 119 22004 unit for 6 pt100 sensors
(1) the unit is supplied non-mounted
non-magnetic thermometer
Item Description
250662 thermometer without support bracket, initial installation or for replacement
258005 thermometer holder (always necessary)
All the data given can be modified without warning for reasons of technical production or product improvement.
< The Zucchini ScP busbar trunking system and Zucchini cast resin transformers have been designed in perfect synergy for a direct connection. The versions shown below represent just a few of the standardised solutions.
connection components with Zucchini ScP busbar trunking systemTransformers Aluminium busbar Copper busbar
Range (kVA)
Insulation class (kV)
400 V current (A) Ik 6% (KA) Family Connection
component Family Connection component
630
12 - 17,5 - 24 - 36
910 15.2 scp 1000 A Al 60281012p scp 1000 A cu 65281011p800 1155 19.5 scp 1250 A Al 60281014p scp 1250 A cu 65281013p
1000 1443 24.1 scp 1600 A Al 60281016p scp 1600 A cu 65281015p1250 1804 30.1 scp 2000 A Al 60281017p scp 2000 A cu 65281016p1600 2310 38.5 scp 2500 A Al 60391014p scp 2500 A cu 65281018p2000 2887 48.2 scp 3200 A Al 60391016p scp 3200 A cu 65391015p2500 3608 60.2 scp 4000 A Al 60391017 p scp 4000 A cu 65391016p3150 4552 65.0 (ik 7%) - - scp 5000 A cu 65391018p
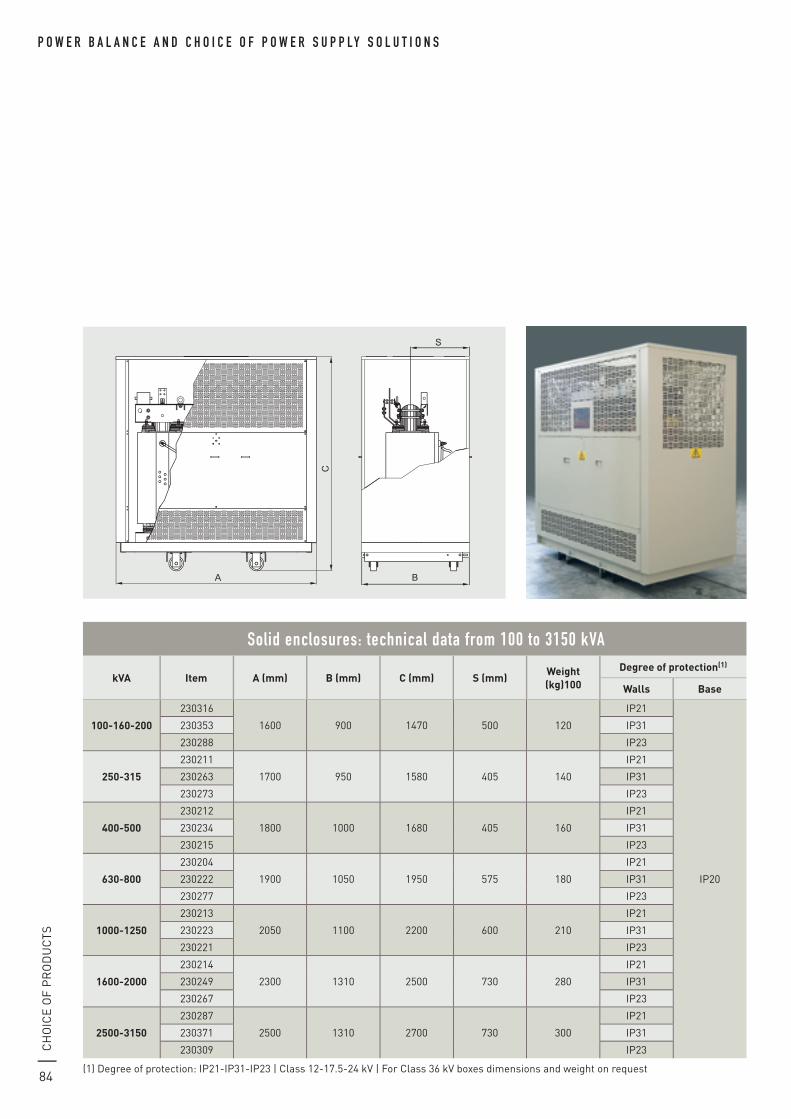
84
P o w e r b a l a n c e a n D c H o i c e o f P o w e r S u P P ly S o l u T i o n Sc
ho
ice
of
pr
od
uc
ts
Solid enclosures: technical data from 100 to 3150 kVa
kVA Item A (mm) B (mm) C (mm) S (mm)Weight (kg)100
Degree of protection(1)
Walls Base
100-160-200
230316
1600 900 1470 500 120
ip21
ip20
230353 ip31
230288 ip23
250-315
230211
1700 950 1580 405 140
ip21
230263 ip31
230273 ip23
400-500
230212
1800 1000 1680 405 160
ip21
230234 ip31
230215 ip23
630-800
230204
1900 1050 1950 575 180
ip21
230222 ip31
230277 ip23
1000-1250
230213
2050 1100 2200 600 210
ip21
230223 ip31
230221 ip23
1600-2000
230214
2300 1310 2500 730 280
ip21
230249 ip31
230267 ip23
2500-3150
230287
2500 1310 2700 730 300
ip21
230371 ip31
230309 ip23
(1) degree of protection: ip21-ip31-ip23 | class 12-17.5-24 kV | for class 36 kV boxes dimensions and weight on request
A
C
S
B

08 | Protection against external disturbances
09 | Operating functions
CERTIFIED
10 | Enclosures and assembly certification
11 | Cabling components and control auxiliaries
12 | Busbars and distribution
13 | Transport and distribution inside an installation
Annexes Glossary Lexicon
07 | Protection against lightning effects
06 | Electrical hazards and protecting people
05 | Breaking and protection devices
04 | Sizing conductors and selecting protection devices
03 | Electrical energy supply
01 | Sustainable development
POwEr GuidE:A complete set of technical documentation
02 | Power balance and choice of power supply solutions
world Headquarters and international department87045 Limoges Cedex - France☎ : + 33 (0) 5 55 06 87 87 Fax : + 33 (0) 5 55 06 74 55
EX29
006