Embed Size (px)
Citation preview

Subject to change – Dr. René Desquiotz 04/2002 – 1GP47_0E
Products: Power Reflection Meter NRT
Power Measurements on GSM/EDGE Signals
with an NRT Power Reflection Meter
The NRT power reflection meter can measure the average burst power of TDMA signals. This application note shows how to use this feature to measure the average power in the useful part of GSM/EDGE bursts.
The procedure given here can also be modified for use with other TDMA systems.
Power Measurements on EDGE Signals with NRT
1GP47_0E 2 Rohde & Schwarz
Contents 1 Introduction.............................................................................................. 2 2 Measurement Principle ........................................................................... 2 3 Properties of EDGE Signals.................................................................... 4 4 Power Measurements on EDGE, Equivalent Burst Width ...................... 9 5 Equivalent burst width for GMSK normal bursts ................................... 14 6 Effect of Multiframe Structure, Idle Burst .............................................. 15 7 NRT Operation ...................................................................................... 15 8 Virtual NRT Operation........................................................................... 18 9 References............................................................................................ 20 10 Ordering Information ............................................................................. 21
1 Introduction This application note deals with power measurements on GSM/EDGE signals. EDGE enhances the GSM system on the physical layer by using 8PSK modulation instead of GMSK. 8PSK has three bits per symbol and therefore allows a three times higher nominal bit rate. The TDMA structure of GSM is retained by EDGE, an EDGE burst has nearly the same structure as a GSM Normal Burst, only with three times more bits.
Power measurements on GSM/EDGE signals mostly means measuring the average power in one or several bursts, or more exactly, measuring the average power in the useful parts of the bursts.
NRT measures the average burst power by multiplying the average power with the ratio of burst period to burst width. Thus, the power of the entire burst, not only the useful part, is taken into account. This application note shows how the useful part and the other burst parts contribute to the total power of the burst, and determines the correct burst width to be set. The burst period is a GSM frame.
The two burst parameters must either be user-defined or the ratio is automatically determined by NRT. The method used is not restricted to GSM/EDGE, and can be applied to power measurements for other TDMA scenarios.
2 Measurement Principle
2.1 Test setup To confirm our calculations by experiment, we use the following measurement setup. The EDGE signals are generated by an SMIQ03B vector signal generator with options SMIQB20 and B11. The signal passes a 10 Watt class A amplifier (Amplifier Research Model 10S1G4A) to obtain a suitable power range for NRT. NRT-Z43 is used as power sensor. As an additional measurement tool, an FSIQ signal analyzer completes the setup. Calculations on EDGE signals are performed with the software WinIQSIM.
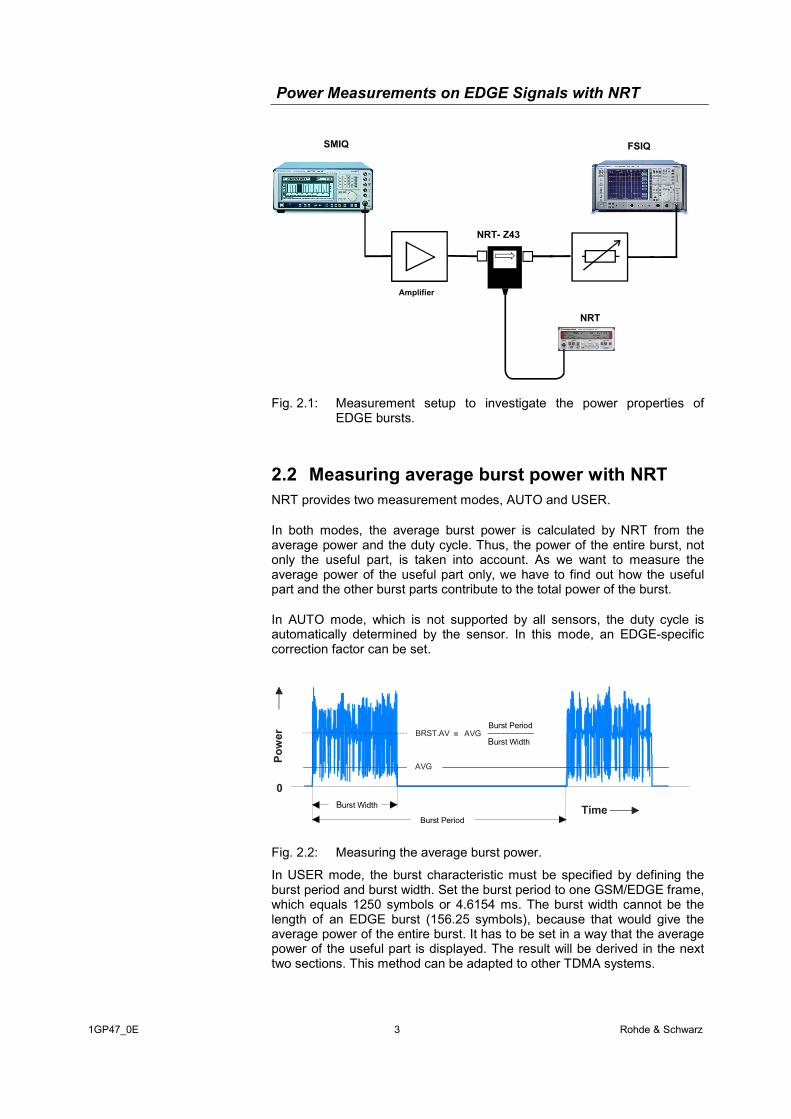
Power Measurements on EDGE Signals with NRT
1GP47_0E 3 Rohde & Schwarz
FSIQ
NRT
NRT- Z43
SMIQ
Amplifier
Fig. 2.1: Measurement setup to investigate the power properties of EDGE bursts.
2.2 Measuring average burst power with NRT NRT provides two measurement modes, AUTO and USER.
In both modes, the average burst power is calculated by NRT from the average power and the duty cycle. Thus, the power of the entire burst, not only the useful part, is taken into account. As we want to measure the average power of the useful part only, we have to find out how the useful part and the other burst parts contribute to the total power of the burst.
In AUTO mode, which is not supported by all sensors, the duty cycle is automatically determined by the sensor. In this mode, an EDGE-specific correction factor can be set.
BRST.AV
AVG
Time
0Burst Width
Burst Period
Burst Width
Burst Period= AVG
Pow
er
Fig. 2.2: Measuring the average burst power.
In USER mode, the burst characteristic must be specified by defining the burst period and burst width. Set the burst period to one GSM/EDGE frame, which equals 1250 symbols or 4.6154 ms. The burst width cannot be the length of an EDGE burst (156.25 symbols), because that would give the average power of the entire burst. It has to be set in a way that the average power of the useful part is displayed. The result will be derived in the next two sections. This method can be adapted to other TDMA systems.
Power Measurements on EDGE Signals with NRT
1GP47_0E 4 Rohde & Schwarz
3 Properties of EDGE Signals
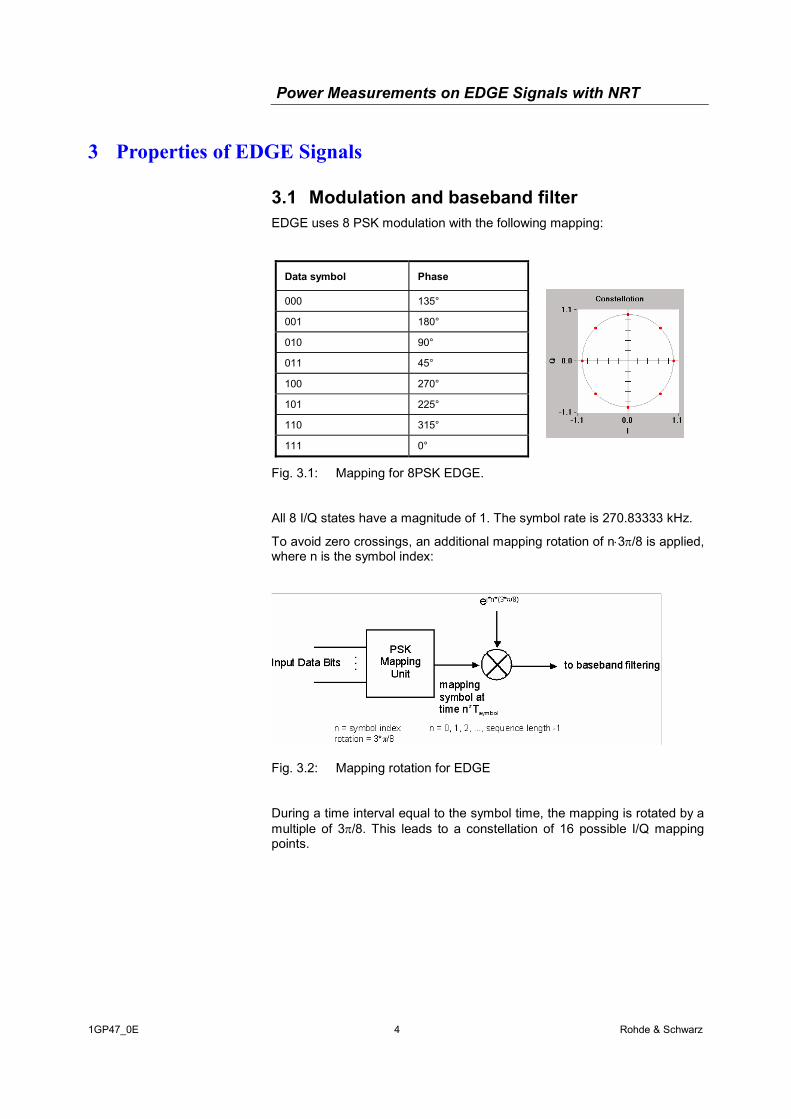
3.1 Modulation and baseband filter EDGE uses 8 PSK modulation with the following mapping:
Fig. 3.1: Mapping for 8PSK EDGE.
All 8 I/Q states have a magnitude of 1. The symbol rate is 270.83333 kHz.
To avoid zero crossings, an additional mapping rotation of n⋅3π/8 is applied, where n is the symbol index:
Fig. 3.2: Mapping rotation for EDGE
During a time interval equal to the symbol time, the mapping is rotated by a multiple of 3π/8. This leads to a constellation of 16 possible I/Q mapping points.
Data symbol Phase
000 135°
001 180°
010 90°
011 45°
100 270°
101 225°
110 315°
111 0°
Power Measurements on EDGE Signals with NRT
1GP47_0E 5 Rohde & Schwarz
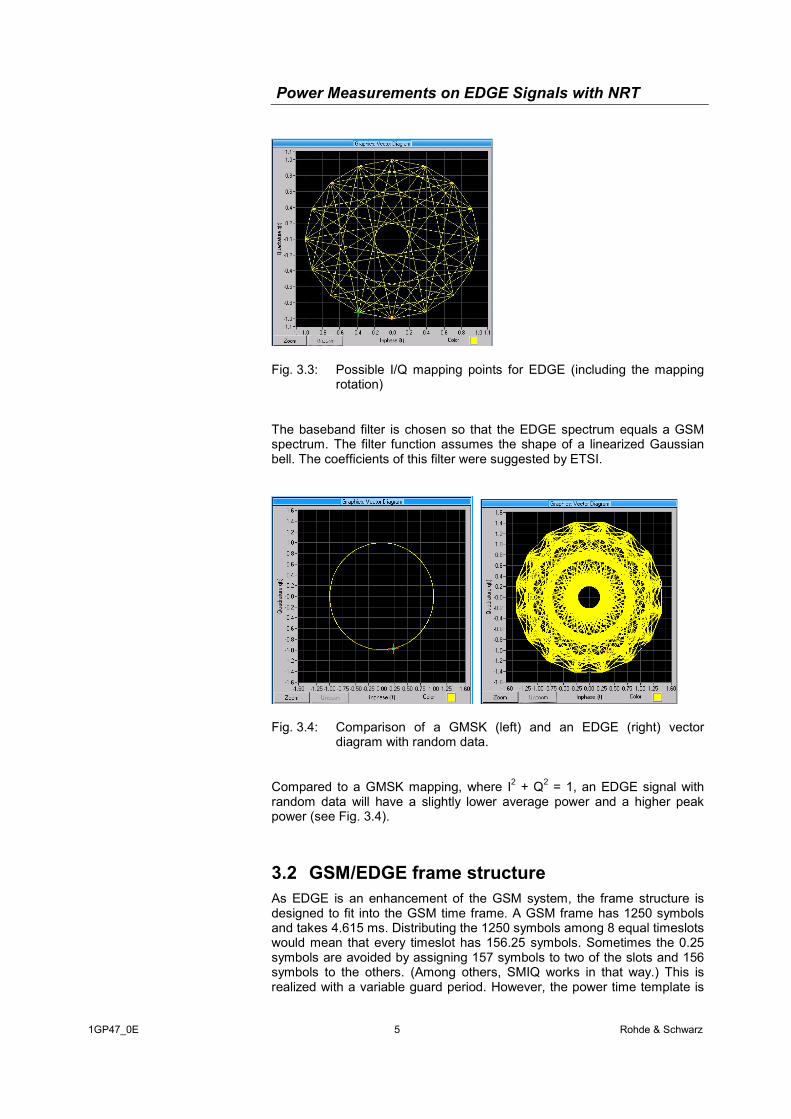
Fig. 3.3: Possible I/Q mapping points for EDGE (including the mapping rotation)
The baseband filter is chosen so that the EDGE spectrum equals a GSM spectrum. The filter function assumes the shape of a linearized Gaussian bell. The coefficients of this filter were suggested by ETSI.
Fig. 3.4: Comparison of a GMSK (left) and an EDGE (right) vector diagram with random data.
Compared to a GMSK mapping, where I2 + Q2 = 1, an EDGE signal with random data will have a slightly lower average power and a higher peak power (see Fig. 3.4).
3.2 GSM/EDGE frame structure As EDGE is an enhancement of the GSM system, the frame structure is designed to fit into the GSM time frame. A GSM frame has 1250 symbols and takes 4.615 ms. Distributing the 1250 symbols among 8 equal timeslots would mean that every timeslot has 156.25 symbols. Sometimes the 0.25 symbols are avoided by assigning 157 symbols to two of the slots and 156 symbols to the others. (Among others, SMIQ works in that way.) This is realized with a variable guard period. However, the power time template is
Power Measurements on EDGE Signals with NRT
1GP47_0E 6 Rohde & Schwarz
the same for all slots in the frame. EDGE uses 8PSK modulation, i.e. 3 bits per symbol. An EDGE burst (mapped to a 156-symbol timeslot) is as follows:
Fig. 3.5: Structure of an EDGE burst. The numbers indicate the number of symbols in the different burst parts.
For a 157-symbol timeslot, the guard field contains 9 symbols instead of 8.
The main difference between EDGE and standard GMSK signals is that EDGE signals do not have a constant envelope (compare the two vector diagrams in Fig. 3.4). An EDGE timeslot can have an "inherent" peak to average ratio of up to 3.4 dB, depending on the data bits that are transmitted.
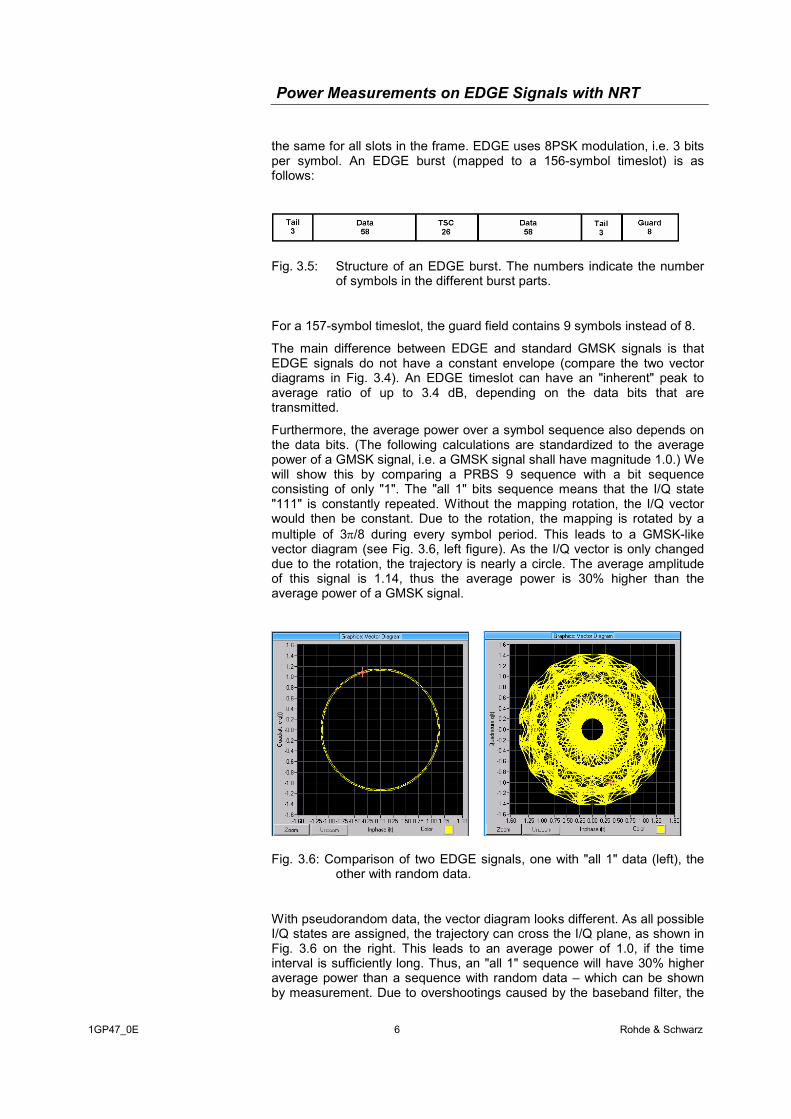
Furthermore, the average power over a symbol sequence also depends on the data bits. (The following calculations are standardized to the average power of a GMSK signal, i.e. a GMSK signal shall have magnitude 1.0.) We will show this by comparing a PRBS 9 sequence with a bit sequence consisting of only "1". The "all 1" bits sequence means that the I/Q state "111" is constantly repeated. Without the mapping rotation, the I/Q vector would then be constant. Due to the rotation, the mapping is rotated by a multiple of 3π/8 during every symbol period. This leads to a GMSK-like vector diagram (see Fig. 3.6, left figure). As the I/Q vector is only changed due to the rotation, the trajectory is nearly a circle. The average amplitude of this signal is 1.14, thus the average power is 30% higher than the average power of a GMSK signal.
Fig. 3.6: Comparison of two EDGE signals, one with "all 1" data (left), the other with random data.
With pseudorandom data, the vector diagram looks different. As all possible I/Q states are assigned, the trajectory can cross the I/Q plane, as shown in Fig. 3.6 on the right. This leads to an average power of 1.0, if the time interval is sufficiently long. Thus, an "all 1" sequence will have 30% higher average power than a sequence with random data – which can be shown by measurement. Due to overshootings caused by the baseband filter, the
Power Measurements on EDGE Signals with NRT
1GP47_0E 7 Rohde & Schwarz
peak amplitude is about 1.44. Therefore the peak power of an EDGE signal with random data is somewhat more than twice the average power (3.2 dB higher).
3.3 Power vs. time in an EDGE burst
Fig. 3.7: Timing of an EDGE burst. The power up ramp takes the last 4 symbols of the preceding timeslot. The useful part is 147 symbols long and starts in the middle of symbol 0 (the first tail symbol).
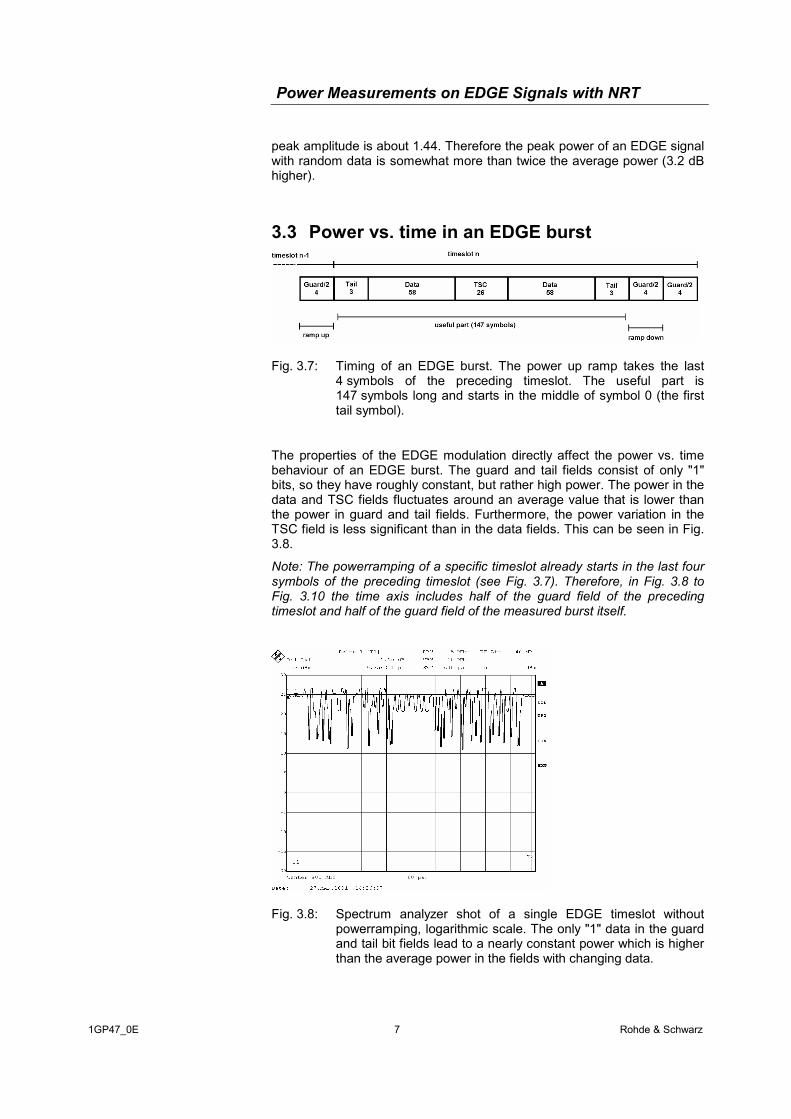
The properties of the EDGE modulation directly affect the power vs. time behaviour of an EDGE burst. The guard and tail fields consist of only "1" bits, so they have roughly constant, but rather high power. The power in the data and TSC fields fluctuates around an average value that is lower than the power in guard and tail fields. Furthermore, the power variation in the TSC field is less significant than in the data fields. This can be seen in Fig. 3.8.
Note: The powerramping of a specific timeslot already starts in the last four symbols of the preceding timeslot (see Fig. 3.7). Therefore, in Fig. 3.8 to Fig. 3.10 the time axis includes half of the guard field of the preceding timeslot and half of the guard field of the measured burst itself.
Fig. 3.8: Spectrum analyzer shot of a single EDGE timeslot without powerramping, logarithmic scale. The only "1" data in the guard and tail bit fields lead to a nearly constant power which is higher than the average power in the fields with changing data.
Power Measurements on EDGE Signals with NRT
1GP47_0E 8 Rohde & Schwarz
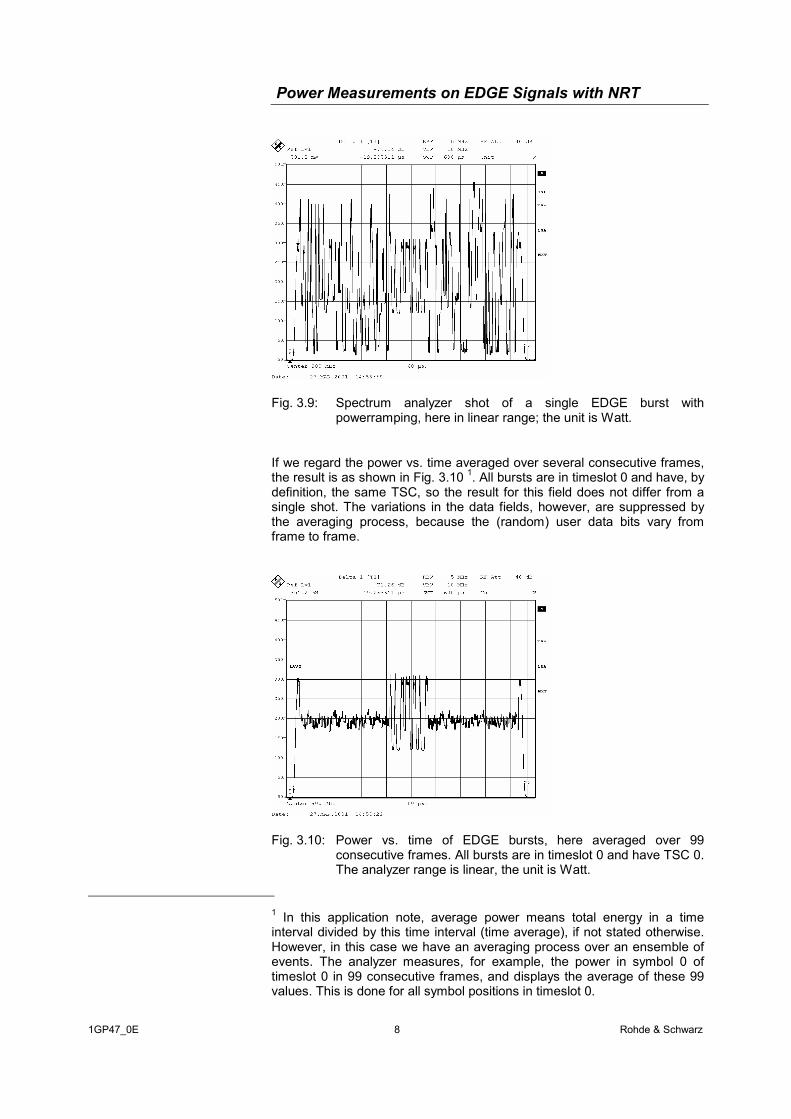
Fig. 3.9: Spectrum analyzer shot of a single EDGE burst with powerramping, here in linear range; the unit is Watt.
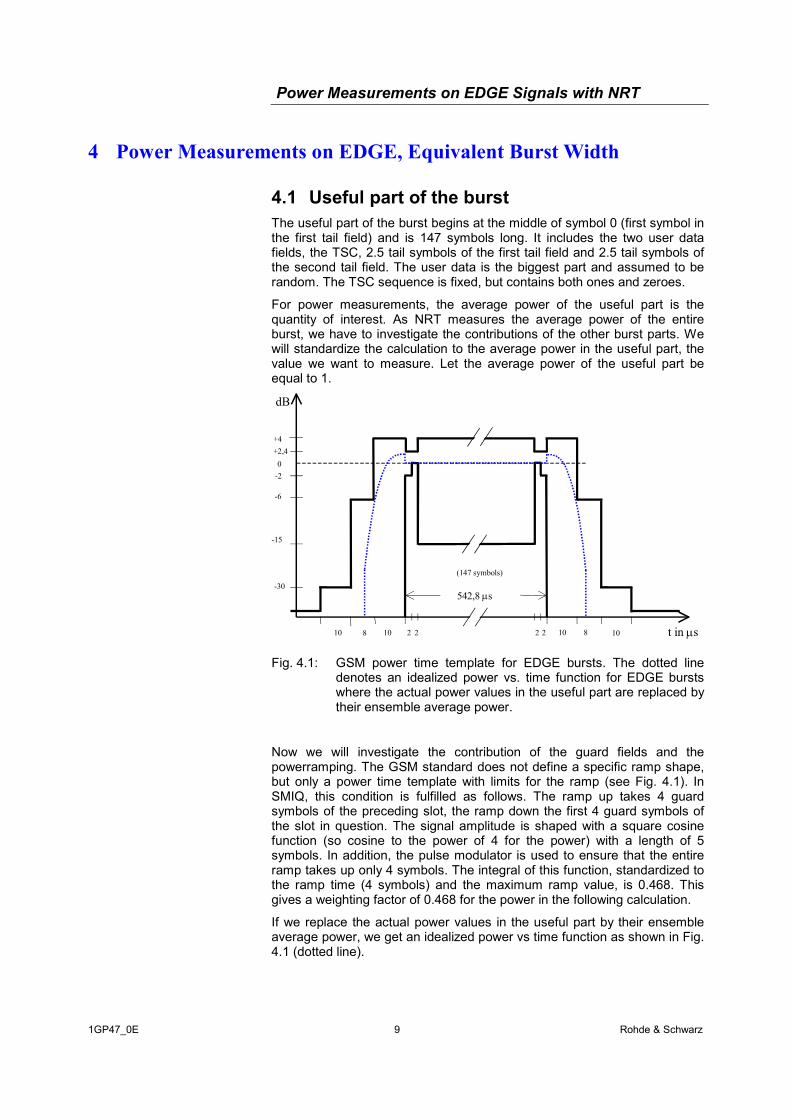
If we regard the power vs. time averaged over several consecutive frames, the result is as shown in Fig. 3.10 1. All bursts are in timeslot 0 and have, by definition, the same TSC, so the result for this field does not differ from a single shot. The variations in the data fields, however, are suppressed by the averaging process, because the (random) user data bits vary from frame to frame.
Fig. 3.10: Power vs. time of EDGE bursts, here averaged over 99 consecutive frames. All bursts are in timeslot 0 and have TSC 0. The analyzer range is linear, the unit is Watt.
1 In this application note, average power means total energy in a time interval divided by this time interval (time average), if not stated otherwise. However, in this case we have an averaging process over an ensemble of events. The analyzer measures, for example, the power in symbol 0 of timeslot 0 in 99 consecutive frames, and displays the average of these 99 values. This is done for all symbol positions in timeslot 0.
Power Measurements on EDGE Signals with NRT
1GP47_0E 9 Rohde & Schwarz
4 Power Measurements on EDGE, Equivalent Burst Width
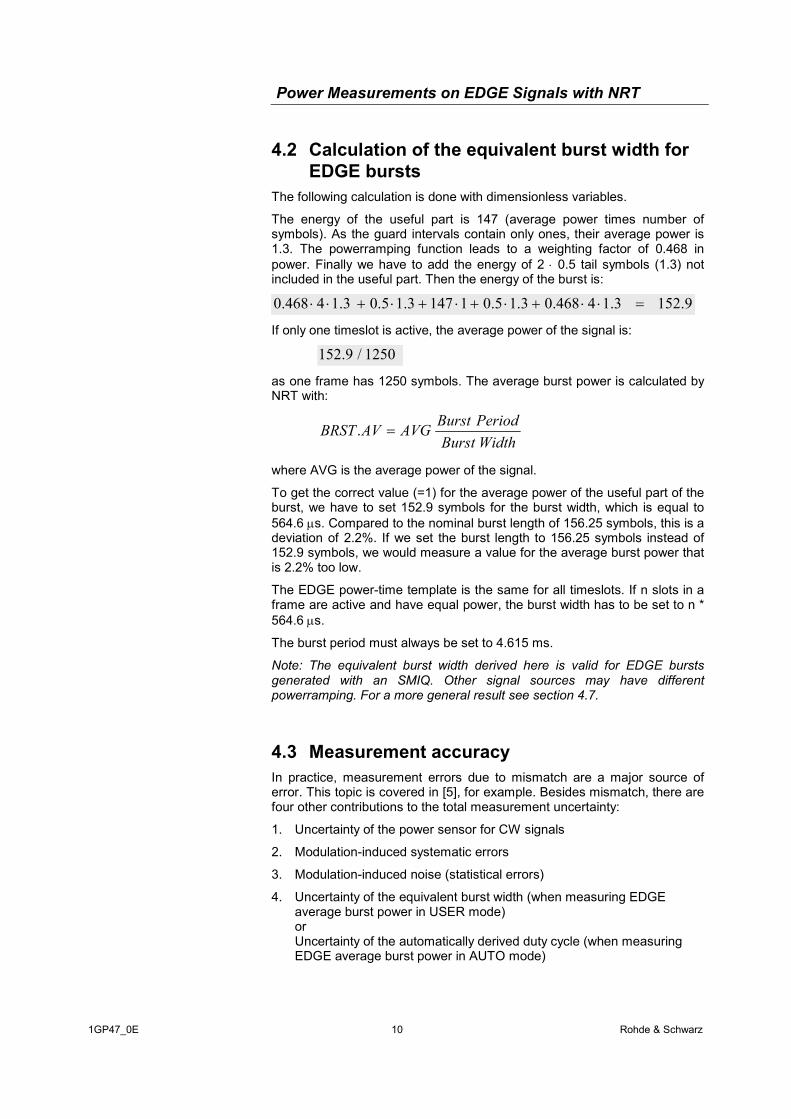
4.1 Useful part of the burst The useful part of the burst begins at the middle of symbol 0 (first symbol in the first tail field) and is 147 symbols long. It includes the two user data fields, the TSC, 2.5 tail symbols of the first tail field and 2.5 tail symbols of the second tail field. The user data is the biggest part and assumed to be random. The TSC sequence is fixed, but contains both ones and zeroes.
For power measurements, the average power of the useful part is the quantity of interest. As NRT measures the average power of the entire burst, we have to investigate the contributions of the other burst parts. We will standardize the calculation to the average power in the useful part, the value we want to measure. Let the average power of the useful part be equal to 1.
10 8 10 10 8 10 t in µs
dB
-30
-6
+2,4+4
-15
-2
2 2 22
542,8 µs
(147 symbols)
0
Fig. 4.1: GSM power time template for EDGE bursts. The dotted line denotes an idealized power vs. time function for EDGE bursts where the actual power values in the useful part are replaced by their ensemble average power.
Now we will investigate the contribution of the guard fields and the powerramping. The GSM standard does not define a specific ramp shape, but only a power time template with limits for the ramp (see Fig. 4.1). In SMIQ, this condition is fulfilled as follows. The ramp up takes 4 guard symbols of the preceding slot, the ramp down the first 4 guard symbols of the slot in question. The signal amplitude is shaped with a square cosine function (so cosine to the power of 4 for the power) with a length of 5 symbols. In addition, the pulse modulator is used to ensure that the entire ramp takes up only 4 symbols. The integral of this function, standardized to the ramp time (4 symbols) and the maximum ramp value, is 0.468. This gives a weighting factor of 0.468 for the power in the following calculation.
If we replace the actual power values in the useful part by their ensemble average power, we get an idealized power vs time function as shown in Fig. 4.1 (dotted line).
Power Measurements on EDGE Signals with NRT
1GP47_0E 10 Rohde & Schwarz
4.2 Calculation of the equivalent burst width for EDGE bursts
The following calculation is done with dimensionless variables.
The energy of the useful part is 147 (average power times number of symbols). As the guard intervals contain only ones, their average power is 1.3. The powerramping function leads to a weighting factor of 0.468 in power. Finally we have to add the energy of 2 ⋅ 0.5 tail symbols (1.3) not included in the useful part. Then the energy of the burst is:
9.1523.14468.03.15.011473.15.03.14468.0 =⋅⋅+⋅+⋅+⋅+⋅⋅
If only one timeslot is active, the average power of the signal is:
1250/9.152
as one frame has 1250 symbols. The average burst power is calculated by NRT with:
WidthBurstPeriodBurstAVGAVBRST =.
where AVG is the average power of the signal.
To get the correct value (=1) for the average power of the useful part of the burst, we have to set 152.9 symbols for the burst width, which is equal to 564.6 µs. Compared to the nominal burst length of 156.25 symbols, this is a deviation of 2.2%. If we set the burst length to 156.25 symbols instead of 152.9 symbols, we would measure a value for the average burst power that is 2.2% too low.
The EDGE power-time template is the same for all timeslots. If n slots in a frame are active and have equal power, the burst width has to be set to n * 564.6 µs.
The burst period must always be set to 4.615 ms.
Note: The equivalent burst width derived here is valid for EDGE bursts generated with an SMIQ. Other signal sources may have different powerramping. For a more general result see section 4.7.
4.3 Measurement accuracy In practice, measurement errors due to mismatch are a major source of error. This topic is covered in [5], for example. Besides mismatch, there are four other contributions to the total measurement uncertainty:
1. Uncertainty of the power sensor for CW signals
2. Modulation-induced systematic errors
3. Modulation-induced noise (statistical errors)
4. Uncertainty of the equivalent burst width (when measuring EDGE average burst power in USER mode) or Uncertainty of the automatically derived duty cycle (when measuring EDGE average burst power in AUTO mode)
Power Measurements on EDGE Signals with NRT
1GP47_0E 11 Rohde & Schwarz
4.4 Uncertainty contribution of the power sensor with CW signals
The NRT data sheet specifies 3.2 % (coverage factor 2) plus the effect from residual zero offsets. If the latter is neglected, one gets:
%6.1sens =u
4.5 Modulation-induced systematic errors Although exclusivley operated in the square-law region, NRT sensors tend to indicate slightly more or less than true average power with envelope-modulated signals. The effect is proportional to power and due to the fact that the square-law region does not have a firm upper boundary but smoothly turns into another region. R&S specifies typical uncertainties of 1% to 3% at nominal power Pnom (30 W for NRT-Z43, 120 W for NRT-Z44) for some common modulation types. Although of systematic nature, the effect will be considered by means of its uncertainty contribution. Since the amplitude distribution of an 8-PSK modulation scheme used for GSM/EDGE lies between those for 80% AM and π/4-DQPSK, a very conservative estimation would result in a standard uncertainty of:
nom
AVBRSTEDGE %5.2
PP
u ×=
NRT provides a modulation correction for EDGE. When using this function, uEDGE will be reduced to a neglectible small value.
4.6 Modulation induced noise In contrast to GMSK, the time-variant power envelope of EDGE signals leads to statistical fluctuations of any measurement result that is achieved over a finite integration time.
For this statistical error, we have evaluated sets of 1000 single measurements for different average filter values (1, 2, 4, 16). With a value of n for the averaging filter, the power sensor takes n single measurements to output one measurement value. By setting low values, measurement speed can be improved. On the other hand, higher values decrease result fluctuations.
The evaluated signal is a GSM/EDGE frame with one EDGE burst, the other seven timeslots inactive, and an average burst power of 40 Watt. The integration time has been set to 110 ms.
Long term fluctuations like power amplifier drift have been separated by polynomial regression first, to take only statistical fluctuations into account. For each set of 1000 single measurements the standard deviation s has been calculated according to:
( )2/1
1
2AVBRST1
1
−
−= ∑
=
n
ii PP
ns
with n=1000, Pi being a single measurement result and PAVBRST the mean of the 1000 values. (PAVBRST = 40 W). The results are shown in Table 4.1.
Power Measurements on EDGE Signals with NRT
1GP47_0E 12 Rohde & Schwarz
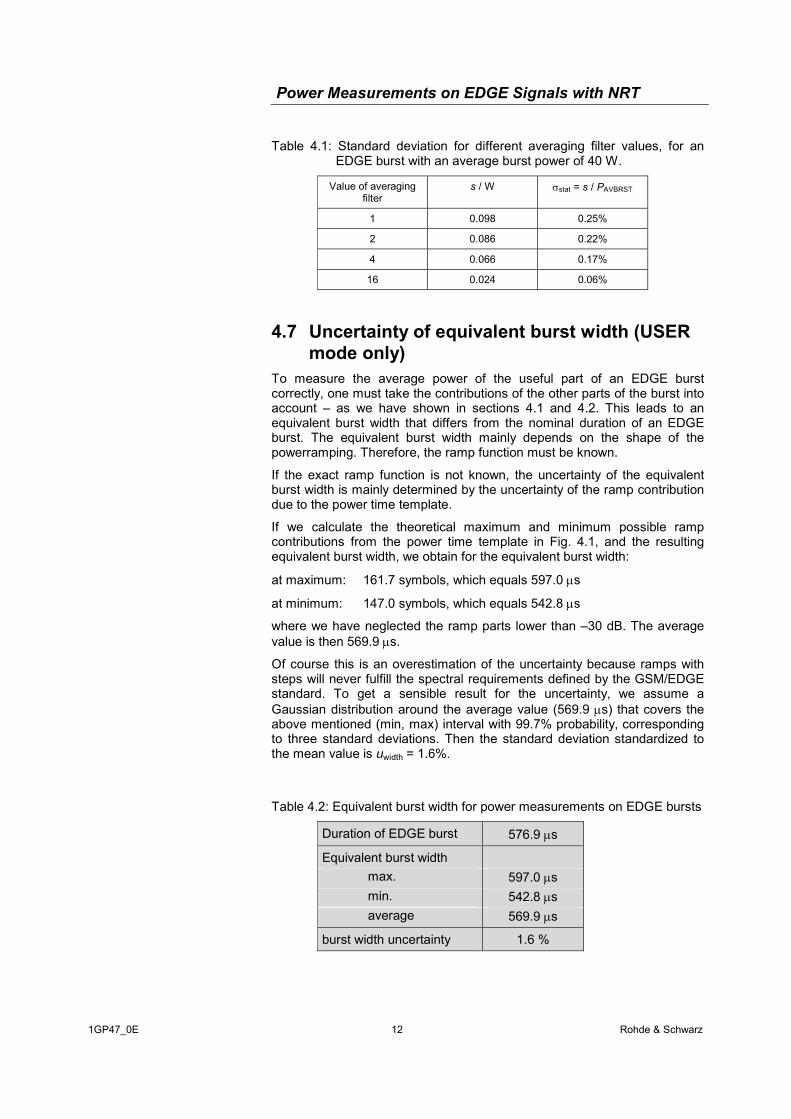
Table 4.1: Standard deviation for different averaging filter values, for an EDGE burst with an average burst power of 40 W.
Value of averaging filter
s / W σstat = s / PAVBRST
1 0.098 0.25%
2 0.086 0.22%
4 0.066 0.17%
16 0.024 0.06%
4.7 Uncertainty of equivalent burst width (USER mode only)
To measure the average power of the useful part of an EDGE burst correctly, one must take the contributions of the other parts of the burst into account – as we have shown in sections 4.1 and 4.2. This leads to an equivalent burst width that differs from the nominal duration of an EDGE burst. The equivalent burst width mainly depends on the shape of the powerramping. Therefore, the ramp function must be known.
If the exact ramp function is not known, the uncertainty of the equivalent burst width is mainly determined by the uncertainty of the ramp contribution due to the power time template.
If we calculate the theoretical maximum and minimum possible ramp contributions from the power time template in Fig. 4.1, and the resulting equivalent burst width, we obtain for the equivalent burst width:
at maximum: 161.7 symbols, which equals 597.0 µs
at minimum: 147.0 symbols, which equals 542.8 µs
where we have neglected the ramp parts lower than –30 dB. The average value is then 569.9 µs.
Of course this is an overestimation of the uncertainty because ramps with steps will never fulfill the spectral requirements defined by the GSM/EDGE standard. To get a sensible result for the uncertainty, we assume a Gaussian distribution around the average value (569.9 µs) that covers the above mentioned (min, max) interval with 99.7% probability, corresponding to three standard deviations. Then the standard deviation standardized to the mean value is uwidth = 1.6%.
Table 4.2: Equivalent burst width for power measurements on EDGE bursts
Duration of EDGE burst 576.9 µs
Equivalent burst width max. 597.0 µs min. 542.8 µs average 569.9 µs
burst width uncertainty 1.6 %
Power Measurements on EDGE Signals with NRT
1GP47_0E 13 Rohde & Schwarz
4.8 Uncertainty contribution from automatic burst detection (AUTO mode only)
The automatic determination of duty cycle takes into account the effects of guard intervals, tail symbols and power ramping by definition. However, there remain some influences from electronic circuitry. All in all two effects should be considered.
• A general uncertainty contribution, that takes into account several effects:
%5.1AUTO,1 =u
• The nonlinearity of the D/A converter. It should be considered at very low power levels:
AVBRST
nomAUTO,2 %06.0
PP
u ×= ,
4.9 Total measurement uncertainty Combining the individual uncertainty contributions in an RSS manner leads to total measurement uncertainty. The formulas below additionally consider a coverage factor of 2, which for a normal distribution of the final result, leads to a coverage probability of approximately 95 %. Note that these formulas are valid for activated modulation correction for EDGE, that means there is no significant modulation-induced systematic error.
Depending on the mode of operation, one must distinguish between two formulas. In USER mode, where the burst parameters width (according to chapter 4.2) and period must be given by the user, expanded combined uncertainty is given by:
2width
2stat
2sens2 uuU ++⋅= σ
AUTO mode can be characterized by an expanded combined uncertainty of:
2AUTO,2
2AUTO,1
2stat
2sens2 uuuU +++⋅= σ .
Example 1:
PAVBRST = 40 W, Sensor NRT-Z44, USER mode, averaging factor = 1 → U = 4.5 %
Example 2:
PAVBRST = 8 W, Sensor NRT-Z43, AUTO mode, averaging factor = 1 → U = 4.4 %
Power Measurements on EDGE Signals with NRT
1GP47_0E 14 Rohde & Schwarz
Since the noise contribution is rather small compared with the other uncertainties, its effect on combined uncertainty can be neglected in most cases.
Note: All uncertainty calculations assume a PRBS sequence as signal content. They are unvalid with other signals.
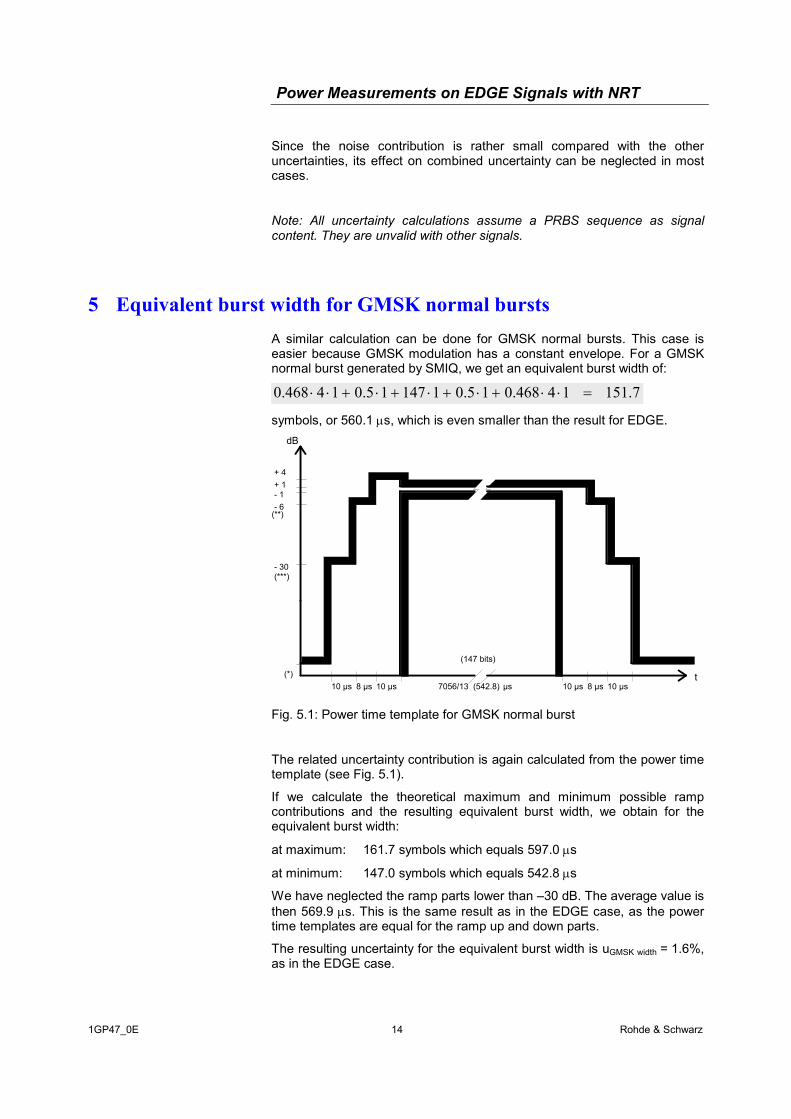
5 Equivalent burst width for GMSK normal bursts A similar calculation can be done for GMSK normal bursts. This case is easier because GMSK modulation has a constant envelope. For a GMSK normal burst generated by SMIQ, we get an equivalent burst width of:
7.15114468.015.0114715.014468.0 =⋅⋅+⋅+⋅+⋅+⋅⋅
symbols, or 560.1 µs, which is even smaller than the result for EDGE. dB
t
- 6
- 30
+ 4
8 µs 10 µs 10 µs 8 µs
(147 bits)
7056/13 (542.8) µs 10 µs(*)
10 µs
- 1+ 1
(***)
(**)
Fig. 5.1: Power time template for GMSK normal burst
The related uncertainty contribution is again calculated from the power time template (see Fig. 5.1).
If we calculate the theoretical maximum and minimum possible ramp contributions and the resulting equivalent burst width, we obtain for the equivalent burst width:
at maximum: 161.7 symbols which equals 597.0 µs
at minimum: 147.0 symbols which equals 542.8 µs
We have neglected the ramp parts lower than –30 dB. The average value is then 569.9 µs. This is the same result as in the EDGE case, as the power time templates are equal for the ramp up and down parts.
The resulting uncertainty for the equivalent burst width is uGMSK width = 1.6%, as in the EDGE case.
Power Measurements on EDGE Signals with NRT
1GP47_0E 15 Rohde & Schwarz
The total measurement uncertainty is calculated in the same way as described in section 4.9, only without the modulation induced error uEDGE, which does not appear with GMSK.
6 Effect of Multiframe Structure, Idle Burst In a real environment, the multiframe structure of GSM/EDGE signals must be taken into account. A multiframe consists of 26 frames and takes 120 ms. The most common multiframe structure is the following. Most of the 26 frames are used to transmit a traffic channel as logical channel. This means that, for example, a base station transmits normal bursts in timeslot 0 to a specific mobile. In the 13th frame, a different logical channel is transmitted, the SACCH. This has no effect on the average power of the signal. However, in frame 26 no transmission occurs (idle burst). The reason for this is to gain some time for handover procedures.
This means that every 26th frame is inactive. Therefore, the correct result for the average burst power in USER mode will be
measAVBRST,measAVBRST,AVBRST 04.12526 PPP ==
which is 4% higher than PAVBRST,meas, the value measured in a time interval of 120 ms.
In AUTO mode the idle burst is automatically taken into account, not leading to an error or an additional uncertainty.
If modern GSM modes as GPRS or HSCSD are used, the multiframe structure can be even more complex.
Anyway, the integration time of NRT-Z43/44 should be set to the maximum value of 111.0 ms. This minimizes effects due to multiframe structures as well as fluctuations from one burst to the following.
7 NRT Operation
7.1 Measuring single burst signals (one active slot per frame) in USER mode
1. Enter the carrier frequency Press the CORR key on the NRT front panel. The menu for frequency
correction appears.
Select USER with the cursor left and right keys and press the SEL key.
Enter the desired carrier frequency and press the SEL key.
2. Set the correction for EDGE modulation For this feature the NRT-Z43/44 firmware version 1.62 or higher is required, as well as NRT firmware 2.22 or higher.
Press the CORR key. Use the cursor down key twice to get to the MODULATION menu.
Power Measurements on EDGE Signals with NRT
1GP47_0E 16 Rohde & Schwarz
Select EDGE with the cursor keys and press the SEL key.
3. Set the integration time We recommend to set the integration time to the maximum value (111.0 ms) to minimize effects due to multiframe structures or power fluctuations from burst to burst.
Press the CONF key on the NRT front panel. Use the cursor up/down keys to get to the INT.TIME menu.
Select USER with the cursor left/right keys and press the SEL key.
Enter 111.0 ms (maximum value) and press the SEL key.
4. Zero the NRT Switch off the RF power of the signal source.
Press the CORR key. Use the cursor down key to get to the ZERO function.
Press the SEL key. The instrument indicates "ZEROING..." and switches to normal power indication after approximately 4 seconds.
5. Choose Average Burst power and set the correct values for burst period and burst width.
Press the CONF button. The ENV KEY menu appears.
Select AV.BRST with the cursor keys and press the SEL key.
Select USER with the cursor keys and press the SEL key
Enter the correct value for the burst width (with SMIQ signals: 564.6 µs for EDGE bursts or 560.1 µs for GMSK normal bursts) and press the SEL key.
Enter 4.615 ms as burst period and press the SEL key.
Note: With idle bursts present, correct the measuring result according to section 6 or use a burst width that is 4% smaller than given (with SMIQ signals: 542.9 µs for EDGE bursts or 538.6 µs for GMSK normal bursts).
7.2 Measuring multiple burst signals (n active timeslots per frame) in USER mode
The procedure is the same as for a single burst, except for the value of the burst width. If n timeslots per frame are active (and all have equal nominal power), set the burst width to n * 564.6 µs.
Power Measurements on EDGE Signals with NRT
1GP47_0E 17 Rohde & Schwarz
7.3 Measuring EDGE bursts in AUTO mode In this mode the duty cycle is automatically determined by the power sensor. For proper operation, the video filter has to be set to 4 kHz. To increase the measurement accuracy, the influence of the EDGE modulation can be taken into account.
1. Enter the carrier frequency Press the CORR key on the NRT front panel. The menu for frequency
correction appears.
Select USER with the cursor left and right keys and press the SEL key.
Enter the desired carrier frequency and press the SEL key.
2. Set the correction for EDGE modulation For this feature the NRT-Z43/44 firmware version 1.62 or higher is required, as well as NRT firmware 2.22 or higher.
Press the CORR key. Use the cursor down key twice to get to the MODULATION menu.
Select EDGE with the cursor keys and press the SEL key.
3. Set the integration time We recommend to set the integration time to the maximum value (111.0 ms) to minimize effects due to multiframe structures or power fluctuations from burst to burst.
Press the CONF key on the NRT front panel. Use the cursor up/down keys to get to the INT.TIME menu.
Select USER with the cursor left/right keys and press the SEL key.
Enter 111.0 ms (maximum value) and press the SEL key.
4. Zero the NRT Switch off the RF power of the signal source.
Press the CORR key. Use the cursor down key to get to the ZERO function.
Press the SEL key. The instrument indicates "ZEROING..." and switches to normal power indication after approximately 4 seconds.
5. Choose Average Burst power and set the correct value for the video filter.
Press the CONF button. The ENV KEY menu appears.
Select AV.BRST with the cursor keys and press the SEL key.
Power Measurements on EDGE Signals with NRT
1GP47_0E 18 Rohde & Schwarz
Select AUTO with the cursor keys and press the SEL key
Select 4 kHz with the cursor keys and press the SEL key.
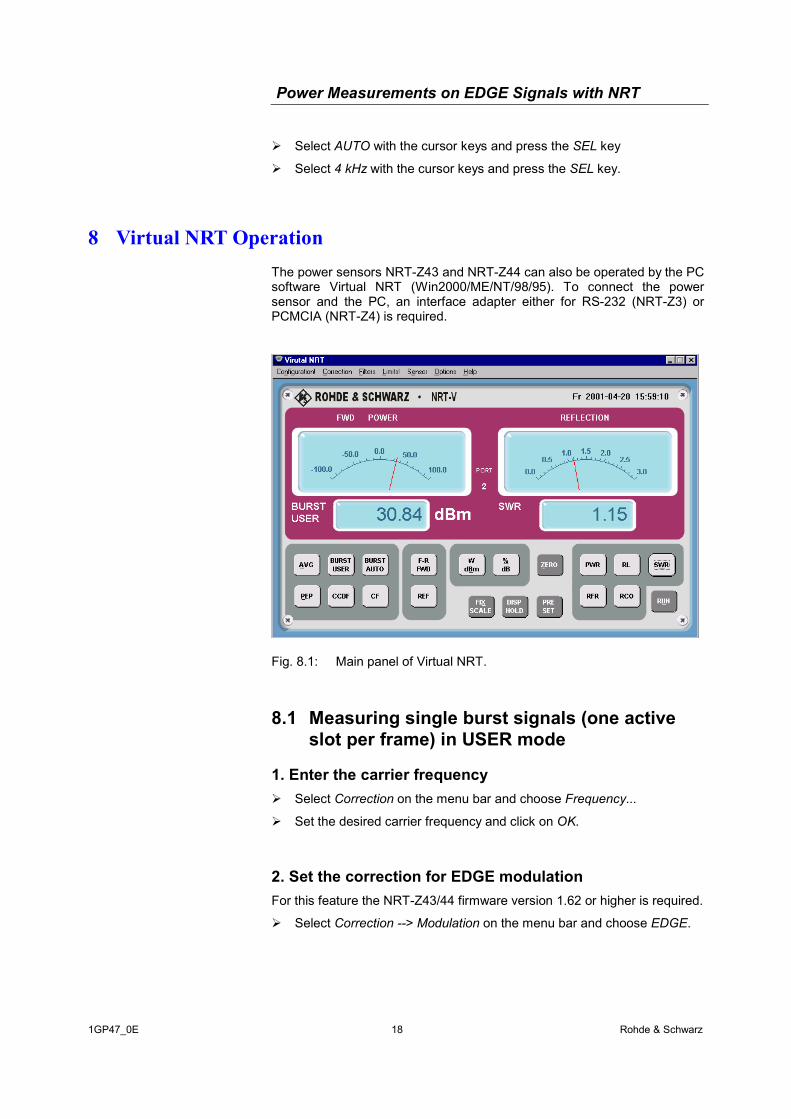
8 Virtual NRT Operation The power sensors NRT-Z43 and NRT-Z44 can also be operated by the PC software Virtual NRT (Win2000/ME/NT/98/95). To connect the power sensor and the PC, an interface adapter either for RS-232 (NRT-Z3) or PCMCIA (NRT-Z4) is required.
Fig. 8.1: Main panel of Virtual NRT.
8.1 Measuring single burst signals (one active slot per frame) in USER mode
1. Enter the carrier frequency Select Correction on the menu bar and choose Frequency...
Set the desired carrier frequency and click on OK.
2. Set the correction for EDGE modulation For this feature the NRT-Z43/44 firmware version 1.62 or higher is required.
Select Correction --> Modulation on the menu bar and choose EDGE.
Power Measurements on EDGE Signals with NRT
1GP47_0E 19 Rohde & Schwarz
3. Enter the configuration parameters Select Configuration! on the menu bar to open the Configuration panel.
Set the burst width to the appropriate value (with SMIQ signals: 564.6 µs for EDGE bursts or 560.1 µs for GMSK normal bursts), the burst period to 4.615 ms and the integration time to 111.0 ms. Click on APPLY or CLOSE to validate the settings.
4. Zero the Virtual NRT Switch off the RF signal and click on the ZERO button on Virtual NRT's
main panel.
5. Measuring Click on BURST USER on the main panel to display the average burst power.
Note: With idle bursts present, correct the measuring result according to section 6 or use a burst width that is 4% smaller than given (with SMIQ signals: 542.9 µs for EDGE bursts or 538.6 µs for GMSK normal bursts).
8.2 Measuring multiple burst signals (n active timeslots per frame) in USER mode
The procedure is the same as for a single burst, except for the value of the burst width. If n timeslots per frame are active (and all have equal nominal power), set the burst width to n times the appropriate burst width used in the single burst case.
8.3 Measuring EDGE bursts in AUTO mode In this mode the duty cycle is automatically determined by the power sensor. For proper operation, the video filter has to be set to 4 kHz. To increase the measurement accuracy, the influence of the EDGE modulation should be taken into account.
1. Enter the carrier frequency Select Correction on the menu bar and choose Frequency...
Set the desired carrier frequency and click on OK.
2. Set the correction for EDGE modulation For this feature the NRT-Z43/44 firmware version 1.62 or higher is required.
Select Correction --> Modulation on the menu bar and choose EDGE.
Power Measurements on EDGE Signals with NRT
1GP47_0E 20 Rohde & Schwarz
3. Enter the configuration parameters Select Configuration! on the menu bar to open the Configuration panel.
Set the integration time to 111.0 ms. Click on APPLY or CLOSE to validate the settings.
4. Zero the Virtual NRT Switch off the RF signal and click on the ZERO button on Virtual NRT's
main panel.
5. Set the appropriate video filter Select Filters --> Video on the menu bar and choose 4 kHz.
6. Measuring Click on BURST AUTO on the main panel to display the average burst power.
8.4 Selecting appropriate averaging values With Virtual NRT, the averaging filter for the measurement result can be set manually. By setting low values, measurement speed can be improved. On the other hand, higher values decrease the statistical error of a single measurement and therefore lead to a more stable display. For a detailed discussion see section 4.6.
To set an averaging value, proceed as follows:
Select Filters --> Smoothing Length and choose the desired value. If you decide to use AUTO averaging, note that the averaging factor is affected by the resolution setting.
Select Filters --> Resolution on the menu bar and choose the desired display resolution (low = 2 ½ digits, high = 3 ½ digits). High resolution not only leads to a better resolution but also to an averaging factor that is at least four times the value used for low resolution.
9 References [1] GSM 05.02 version 8.2.0 Release 1999, Draft ETSI EN 300 908 (2000)
[2] GSM 05.04 version 8.1.0 Release 1999, ETSI (1999)
[3] Power Reflection Meter NRT, Operating Manual, PD 1081.0483.12, Rohde & Schwarz (2001)
[4] Power Sensors NRT-Z43/44, Operating Manual, PD 1081.1544.12, Rohde & Schwarz (2001)
[5] Voltage and Power Measurements, PD 757.0835.23, Rohde & Schwarz (1999)
Power Measurements on EDGE Signals with NRT
1GP47_0E 21 Rohde & Schwarz
10 Ordering Information Power Reflection Meter NRT 1080.9506.02 Directional Power Sensors NRT-Z43 30 (75) W, 0.4 to 4 GHz 1081.2905.02 NRT-Z44 120 (300) W, 0.2 to 4 GHz 1081.1309.02 NRT-CAL Calibration at delivery
NRT-Z43 / -Z44 (CAL-1) 0240.8727.06
Options NRT-B2 Two rear inputs for NRT-Z
sensors 1081.0702.02
NRT-B3 Battery supply with built-in charger and NiMH battery
1081.0502.02
Recommended extras NRT-Z3 RS-232 Interface Adapter for
NRT-Z Power Sensors including AC Power Supply
1081.2705.02
NRT-Z4 PC Card Interface Adapter for NRT-Z Power Sensors
1120.5005.02
Vector Signal Generator: SMIQ02B 300 kHz to 2.2 GHz 1125.5555.02 SMIQ03B 300 kHz to 3.3 GHz 1125.5555.03 SMIQ04B 300 kHz to 4.4 GHz 1125.5555.04 SMIQ06B 300 kHz to 6.4 GHz 1125.5555.06 Options: SMIQB11 Data Generator 1085.4502.04 SMIQB12 Memory Extension 1085.2800.04 SMIQB20 Modulation Coder 1125.5190.02 Signal Analyzer FSIQ3 20 Hz to 3 GHz 1119.5005.13 FSIQ7 20 Hz to 7 GHz 1119.5005.17 FSIQ26 20 Hz to 26.5 GHz 1119.6001.27
ROHDE & SCHWARZ GmbH & Co. KG . Mühldorfstraße 15 . D-81671 München . P.O.B 80 14 69 . D-81614 München .
Telephone +49 89 4129 -0 . Fax +49 89 4129 - 13777 . Internet: http://www.rohde-schwarz.com
This application note and the supplied programs may only be used subject to the conditions of use set forth in the download area of the Rohde & Schwarz website.