Embed Size (px)
Citation preview
UNF Digital Commons
UNF Graduate Theses and Dissertations Student Scholarship
2018
Power Mobility Sensor Data Collection Verifiedthrough Standardized Pediatric AssessmentsAyshka Elise Rodriguez-VelezUniversity of North Florida
This Master's Thesis is brought to you for free and open access by theStudent Scholarship at UNF Digital Commons. It has been accepted forinclusion in UNF Graduate Theses and Dissertations by an authorizedadministrator of UNF Digital Commons. For more information, pleasecontact Digital Projects.© 2018 All Rights Reserved
Suggested CitationRodriguez-Velez, Ayshka Elise, "Power Mobility Sensor Data Collection Verified through Standardized Pediatric Assessments" (2018).UNF Graduate Theses and Dissertations. 828.https://digitalcommons.unf.edu/etd/828
Power Mobility Sensor Data Collection Verified through Standardized Pediatric Assessments
by
Ayshka Elise Rodriguez-Velez
A Thesis submitted to the Department of Engineering
in partial fulfillment of the requirements for the degree of
Master of Science in Electrical Engineering
UNIVERSITY OF NORTH FLORIDA
COLLEGE OF COMPUTING, ENGINEERING, AND CONSTRUCTION
August 2018
Unpublished work © Ayshka Elise Rodriguez-Velez

P a g e | 2
DEDICATION
In memory of my grandfather Roberto Velez Colon (Abu).
You motivated & inspired me to continue my education.
This one is for you!
P a g e | 3
ACKNOWLEDGEMENTS
I would like to acknowledge Dr. Juan Aceros, Dr. Mary Lundy, and Dr. Patrick Kreidl.
Without their help I wouldn’t have achieved my masters and found my passion in engineering. I
would also like to acknowledge Dr. Murat Tiryakigolu and Dr. Mark Tumeo for mentoring me
through my years at the University of North Florida.
This work was supported in part by the Florida Center for Cybersecurity under
subagreements 2108-1072-10-B and 2108-1072-10-C.
P a g e | 4
TABLE OF CONTENTS DEDICATION ................................................................................................................................ 2
ACKNOWLEDGEMENTS ............................................................................................................ 3
LIST OF TABLES .......................................................................................................................... 6
LIST OF EQUATIONS .................................................................................................................. 6
LIST OF FIGURES ........................................................................................................................ 7
ABSTRACT .................................................................................................................................... 8
CHAPTER 1: MOTIVATION ........................................................................................................ 9
CHAPTER 2: BACKGROUND ................................................................................................... 10
CHAPTER 3: CLINICAL Intervention for case study ................................................................. 12
3.1 Spina Bifida ........................................................................................................................ 12
3.2 International Classification of Functioning Model ............................................................. 12
3.3 Rehabilitation Management of Condition ........................................................................... 13
3.3.2 Strength & Manual Muscle Test .................................................................................. 14
3.3.3 Function & Inventory Tests ......................................................................................... 16
CHAPTER 4: Case Study ............................................................................................................. 18
4.1 Timeline .............................................................................................................................. 19
4.2 Approach ............................................................................................................................. 22
CHAPTER 5: POWER MOBILITY DESIGN ............................................................................. 23
5.1 Ride-On Car Selection ........................................................................................................ 23
5.2 Mechanical Modifications .................................................................................................. 23
5.2.1 Tires ............................................................................................................................. 24
5.2.2 Steering Column........................................................................................................... 24
5.3 Electrical Modifications ...................................................................................................... 25
5.3.1 Push Button Adaptations ............................................................................................. 25
5.3.2 Motor Controller .......................................................................................................... 26
5.3.3 Pressure Sensors .......................................................................................................... 27
5.3.4 Printed Circuit Board Design ...................................................................................... 28
CHAPTER 6: RESEARCH METHODOLOGY .......................................................................... 30
6.1 “Play” Track........................................................................................................................ 30
6.2 Physical Therapy Data Collection Process ......................................................................... 31
6.3 Ride-On Toy Car Data Collection Process ......................................................................... 31
CHAPTER 7: RESULTS .............................................................................................................. 32
7.1 Standard Physical Therapy Methods .................................................................................. 32

P a g e | 5
7.2 New Methodology Based on Sensor Technology ............................................................... 38
CHAPTER 8: DISCUSSION ........................................................................................................ 42
CHAPTER 9: CONCLUSION ..................................................................................................... 44
RECOMMENDATIONS .............................................................................................................. 45
REFERENCES ............................................................................................................................. 47
VITA ............................................................................................................................................. 49

P a g e | 6
LIST OF TABLES
Table 1: Normal Ranges for Range of Motion Test ..................................................................... 14
Table 2: Manual Muscle Test Grading Scale ................................................................................ 16
Table 3: Functional Skills Assessment Results Values ................................................................ 33
Table 4: Caregiver Assistance Assessment Results Values .......................................................... 33
Table 5: PEDI Calculated Differences .......................................................................................... 34
Table 6: PedsQL Percentage Results ............................................................................................ 35
Table 7: Minimal Clinically Significant Difference Calculations ................................................ 35
Table 8: Range of Motion Test Results ........................................................................................ 36
Table 9: Manual Muscle Test Results ........................................................................................... 37
Table 10: Timed Up-and-Go Test Results .................................................................................... 37
Table 11: Correlation Test ............................................................................................................ 41
LIST OF EQUATIONS
Equation 1 ..................................................................................................................................... 18
Equation 2 ..................................................................................................................................... 29
P a g e | 7
LIST OF FIGURES
Figure 1: Spina Bifida Types ........................................................................................................ 12
Figure 2: ICF Model for Spina Bifida Patient .............................................................................. 13
Figure 3: Lumbosacral Joint ......................................................................................................... 18
Figure 4: Cascade DAFO 3.5 Braces ............................................................................................ 19
Figure 5: Excess Plantarflexion & Knee Hypertension ................................................................ 20
Figure 6: Walk Easy Forearm Crutches ........................................................................................ 20
Figure 7: DAFO Fixed Ankle Braces ........................................................................................... 21
Figure 8: Ambulation Timeline .................................................................................................... 21
Figure 9: Powered Ride-On Care Unmodified ............................................................................. 23
Figure 10 Unmodified & Modified Front Right Wheel ................................................................ 24
Figure 11: Raspberry Pi B+ .......................................................................................................... 25
Figure 12: Sabertooth 2x32 Motor-Controller .............................................................................. 26
Figure 13: Load Cell Sensor & Machined Foot Plate ................................................................... 28
Figure 14: Printed Circuit Board (PCB) Final Design .................................................................. 28
Figure 15: Modified Ride-on Toy Car .......................................................................................... 29
Figure 16: Experiment Track ........................................................................................................ 30
Figure 17: Functional Skills Assessment Results ......................................................................... 32
Figure 18: Caregiver Assistance Assessment Results .................................................................. 33
Figure 19: PedsQL Results ........................................................................................................... 35
Figure 20: Cumulative Trial Graph............................................................................................... 38
Figure 21: Weight Distribution Graph .......................................................................................... 40
P a g e | 8
ABSTRACT
The collaboration between the School of Engineering and the Department of Physical
Therapy at the University of North Florida has introduced the possibility of creating a new
environment for pediatric physical therapy assessments. There are currently no methods for
remotely monitoring children with impairments. However, with embedded sensor technology in
the form of power mobility and accepted therapy assessment tools, remote monitoring can become
a possibility. As a part of this work, a ride-on toy car was developed as a remote monitoring device
and a case study with a child with a mobility impairment was used as a proof of concept. In this
thesis, the background information on the project, the case study diagnosis and history, and the
model used to develop this project are detailed.
P a g e | 9
CHAPTER 1: MOTIVATION
Children with developmental disabilities that impair independent mobility often require
rehabilitation services such as physical therapy. The therapy services provided are usually based
on a one-on-one session with the child in an outpatient rehabilitation setting. This can be
prohibitive for parents with limited resources, transportation, and accessibility. If a therapeutic
alternative for remote monitoring could be created for use at home that was easy, safe, and fun for
the child to use then greater improvements in impairments could be realized.
Impairments responsible for weakened independent mobility can be classified as
decreased muscle strength, decreased range of motion, decreased postural stability, and poor
weight shifting in postures against gravity. One diagnosis that encompasses these impairments is
spina bifida. Children who are born with this health condition have limitations in their functional
and emotional maturation and require persistent monitoring.
Improvements in functional skills for these children have typically been monitored through
standardized pediatric rehabilitation assessments. A licensed pediatric physical therapist and a
parent of the children conduct the assessments. However, it has been acknowledged that pediatric
rehabilitation assessments are limited by being strictly qualitative.
Quantitative measurements of postural stability and activity levels of these children are
required. A device to monitor children in their own environment would give therapists a remote
way to measure improvements of postural sway and activity levels quantitatively. A modified ride-
on toy car with embedded sensors was created to test this possibility. A device that can remotely
monitor a child in their home environment that is also economical for the patients and their families
was fashioned and compared to standardized qualitative assessments for data correlations. This
study presents this proof of concept with a single case study.
P a g e | 10
CHAPTER 2: BACKGROUND
Physical therapy monitoring of children with impairments is conducted intermittently in a
clinic throughout the child’s lifetime. The occurrence of these visits is dependent on the severity
of the condition. During these visits, various tests are conducted to show the level of improvement.
These tests consist of hands-on physical assessments, inventory surveys, and performance trials
[1]. From these tests, the measure of improvement is determined. However, improvements in the
physical function of a child can sometimes be misread. Furthermore, impairments in children can
also hinder family mobility. Having to transport the child between their home and the therapy
clinic may not always be feasible for the family. Another limitation with clinical rehabilitation is
the child’s willingness to participate in the associated rehabilitation activities. Children need
stimulation and motivation to be accurately tested. To overcome this obstacle, ride-on toy cars
have been built to enable children to be independently mobile. This freedom allows children to
participate in activities that better their therapeutic goals.
Although these ride-on cars enable children to be mobile and improve in certain functions,
there is no form of monitoring on the ride-on cars. The impact of using such power mobility for
children with special needs has been reported by many groups to enhance the training abilities of
children while exploring their environment [2,16,17]. Sam Logan at Oregon State University has
demonstrated through social tests that a child with powered mobility engages more with other
children. The socialization of children, with emphasis on the enjoyment of “play”, has been the
primary focus of pioneer groups such as Sam Logan and Cole Galloway at the University of
Delaware and the GoBabyGo organization. Through their studies, power mobility has been shown
to have direct impact on a child’s enjoyment level [16]. However, these outcomes have all been
measured using standardized pediatric therapy assessments, such as the Pediatric Evaluation of
P a g e | 11
Disability Inventory (PEDI) and the Pediatric Quality of Life Inventory (PedsQL) [16, 25]. These
assessments are primary survey tools used to monitor children’s progression or regression and are
widely used throughout pediatric rehabilitation around the world. Although these assessments are
widely accepted, there are some discrepancies in the collection of the data, most stemming from
parents’ influenced belief of their child’s condition or the child’s overall willingness to participate.
A collaboration between power mobility play, and physical therapy assessments can help
overcome these issues and help determine improvement in children’s physical function. The use
of embedded sensor technology to measure physical improvements of children has not been
explored. There are no reports on embedded sensor technology to remotely monitor a child through
power mobility play. The work conducted in this thesis aimed to verify that sensor technology data
from a powered ride-on car can be used as part of remote, in-home clinical interventions.
P a g e | 12
CHAPTER 3: CLINICAL INTERVENTION FOR CASE STUDY
3.1 Spina Bifida
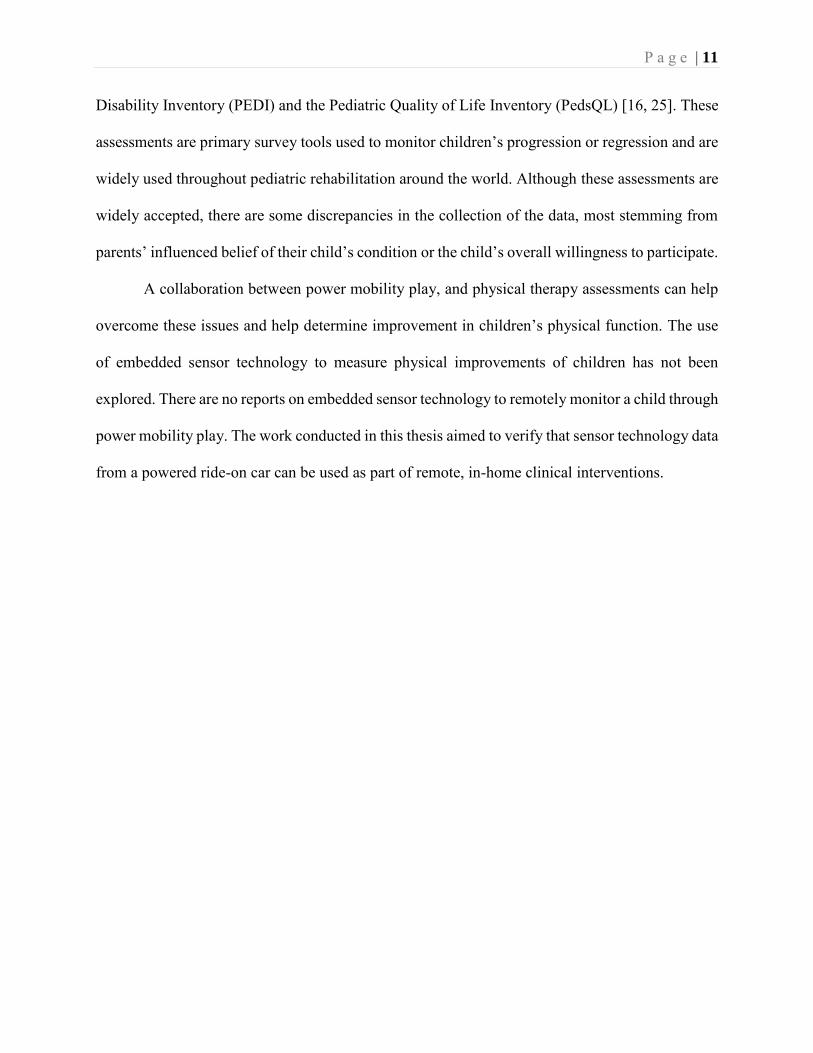
Spina bifida is a neural tube defect. It occurs when the tube formed around the brain and
spine does not close properly [3]. There are two types of spina bifida - aperta (meningocele and
myelomeningocele) and occulta. Figure 1 shows images of the different forms of spina bifida and
the differences in the neural tube defect.
Figure 1: Spina Bifida Types
The most severe condition of spina bifida aperta, Myelomeningocele, occurs when the
spinal cord fills the fluid sac and protrudes from the baby’s back. The protrusion can occur within
any part of the spine. Common side effects of myelomeningocele include, but are not limited to,
paralysis or limited function below the lesion level, and loss or limited control of bowel and
bladder function.
3.2 International Classification of Functioning Model
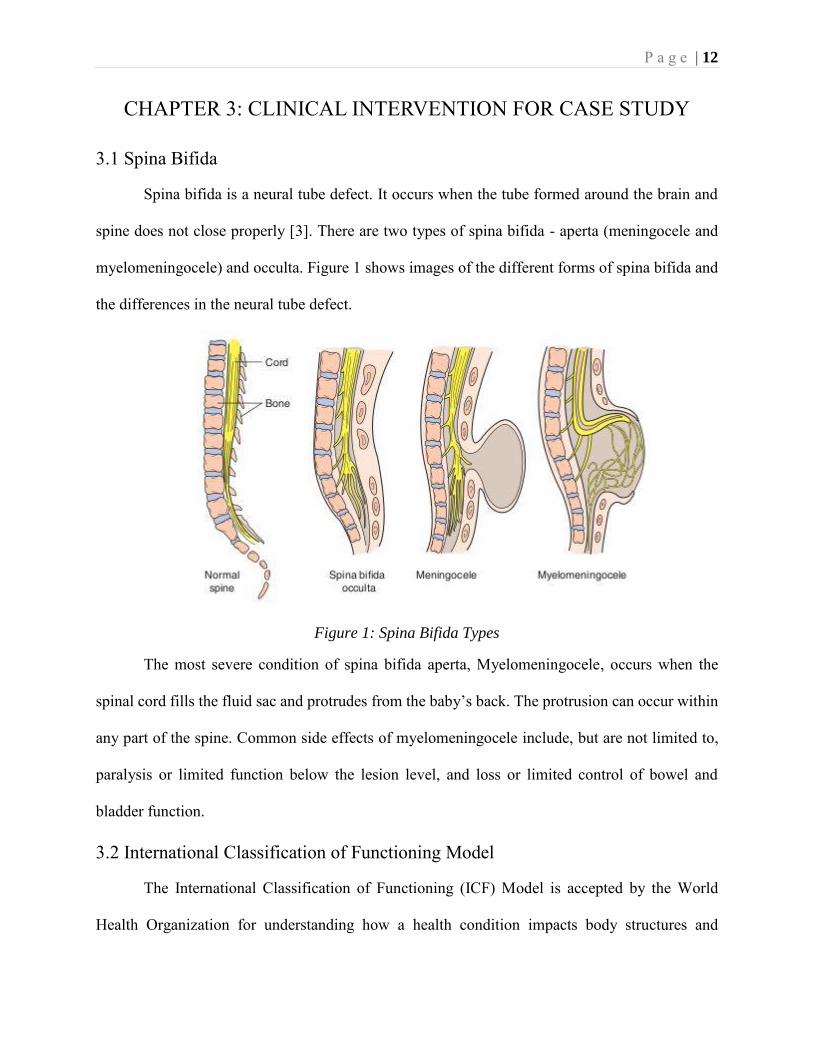
The International Classification of Functioning (ICF) Model is accepted by the World
Health Organization for understanding how a health condition impacts body structures and
P a g e | 13
functions, such as muscle strength as well as activity level and participation in life activities such
as mobility and play. This model also considers certain environmental and personal factors that
may influence the prognosis [5]. The level of functioning of the patient was detailed in the ICF
before the device was given to our subject to verify throughout the experimental process. Figure 2
shows the ICF model for the case study. This model was used as a reference for the experimental
portion of this thesis.
Figure 1: ICF Model for Spina Bifida Patient
3.3 Rehabilitation Management of Condition
Once a child is diagnosed with spina bifida, the only means of repairing the exposure is
through surgery. This surgery is usually conducted 24 to 48 hours after birth. After the surgery is
conducted, years of physical therapy follow to ensure the best level of functioning can be
achieved through physical and emotional improvements. This section will detail some typical
rehabilitation management options for a child diagnosed with spina bifida.
P a g e | 14
3.3.1 Range of Motion & Test
Range of Motion (ROM) measures the flexibility of the body at each joint. Joint flexibility,
especially in the lower extremities, allows for ease of walking. A child with spina bifida will have
trouble with flexibility in their hips, knees, and ankles. Due to the hindrance of mobility in these
joints testing their flexibility is important. There were seven range of motion tests administered in
our case study. At the hip joint, there were four separate motions on each side that were tested.
These are external rotation, internal rotation, flexion and extension of each hip. For the knee,
flexion and extension were tested. On the ankle, dorsiflexion was tested on both sides. A
goniometer was used to measure the angle of each of these motions. For each motion there is a
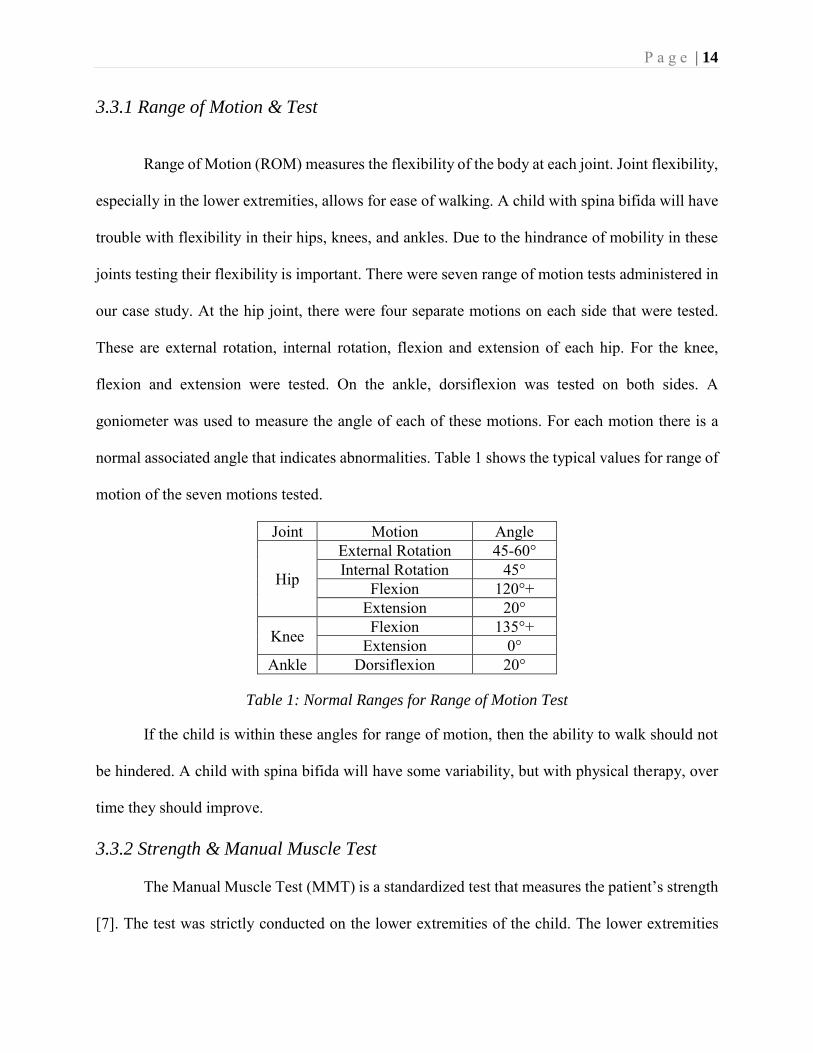
normal associated angle that indicates abnormalities. Table 1 shows the typical values for range of
motion of the seven motions tested.
Joint Motion Angle
Hip
External Rotation 45-60° Internal Rotation 45°
Flexion 120°+ Extension 20°
Knee Flexion 135°+ Extension 0°
Ankle Dorsiflexion 20°
Table 1: Normal Ranges for Range of Motion Test
If the child is within these angles for range of motion, then the ability to walk should not
be hindered. A child with spina bifida will have some variability, but with physical therapy, over
time they should improve.
3.3.2 Strength & Manual Muscle Test
The Manual Muscle Test (MMT) is a standardized test that measures the patient’s strength
[7]. The test was strictly conducted on the lower extremities of the child. The lower extremities
P a g e | 15
were chosen specifically to note the muscles mainly used for walking and standing. The gravity
resisted knee flexion test, which tests the hamstrings, was done by having the child lay on their
belly and their knee bent at a 90° angle. The therapist told the child to resist the force placed on
the leg. The gravity resisted knee extension test, which tests the quadriceps, was done by having
the child sit on a bench with legs dangling. The child held the leg straight up, resisting the therapist
pushing down.
Testing hip flexion focused on the iliopsoas muscle. The child sat on a bench and pushed
the knee up against the therapist’s hand pushing down. For hip extension testing the child laid on
their belly, bent the knee at a 90° angle and pushed the leg up towards the ceiling while the therapist
pushed down on the foot. Hip extension test primarily examines the gluteus maximus muscle.
The final manual muscle test was the ankle dorsiflexion test. The muscle tested is the
tibialis anterior. The child laid flat and kept their foot flexed to prevent the therapist from pushing
it down.
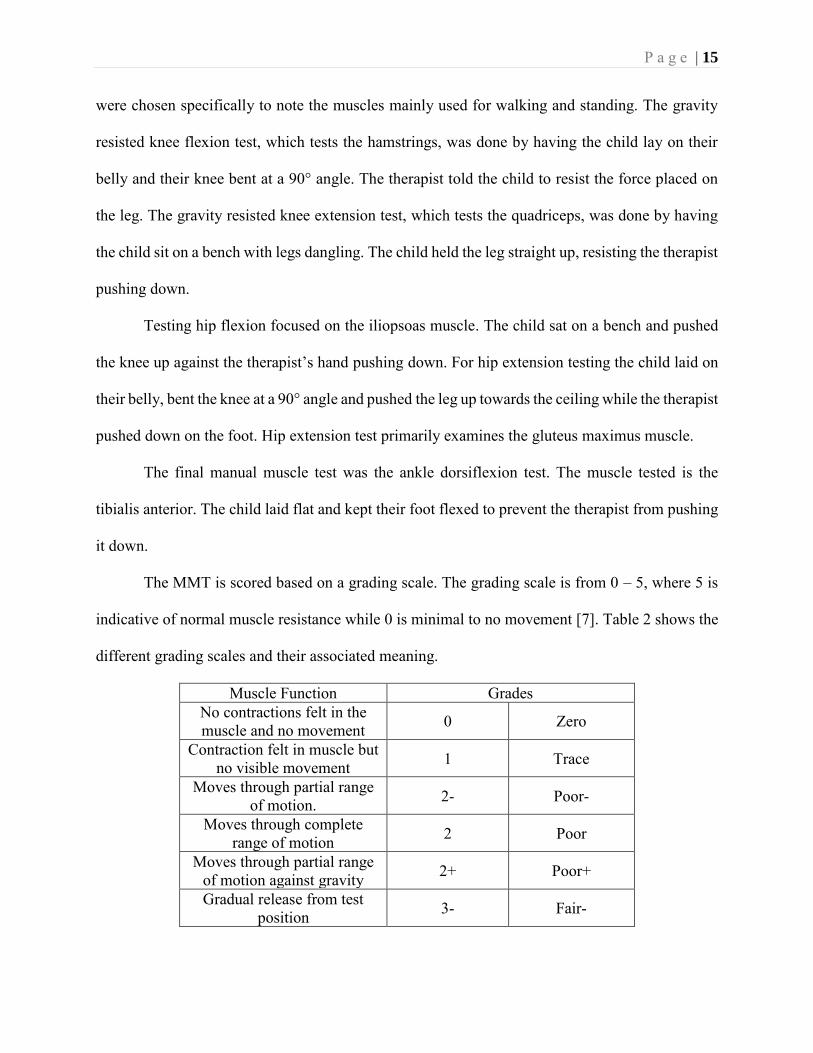
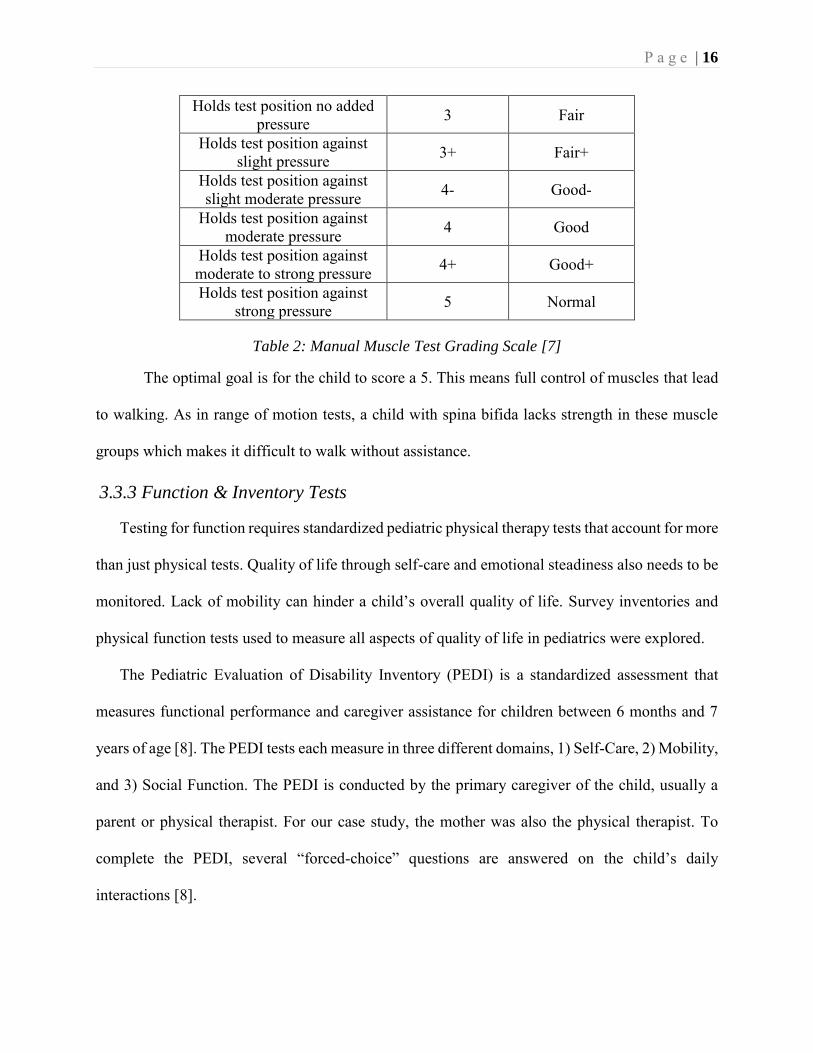
The MMT is scored based on a grading scale. The grading scale is from 0 – 5, where 5 is
indicative of normal muscle resistance while 0 is minimal to no movement [7]. Table 2 shows the
different grading scales and their associated meaning.
Muscle Function Grades No contractions felt in the muscle and no movement 0 Zero
Contraction felt in muscle but no visible movement 1 Trace
Moves through partial range of motion. 2- Poor-
Moves through complete range of motion 2 Poor
Moves through partial range of motion against gravity 2+ Poor+
Gradual release from test position 3- Fair-
P a g e | 16
Holds test position no added pressure 3 Fair
Holds test position against slight pressure 3+ Fair+
Holds test position against slight moderate pressure 4- Good-
Holds test position against moderate pressure 4 Good
Holds test position against moderate to strong pressure 4+ Good+
Holds test position against strong pressure 5 Normal
Table 2: Manual Muscle Test Grading Scale [7]
The optimal goal is for the child to score a 5. This means full control of muscles that lead
to walking. As in range of motion tests, a child with spina bifida lacks strength in these muscle
groups which makes it difficult to walk without assistance.
3.3.3 Function & Inventory Tests
Testing for function requires standardized pediatric physical therapy tests that account for more
than just physical tests. Quality of life through self-care and emotional steadiness also needs to be
monitored. Lack of mobility can hinder a child’s overall quality of life. Survey inventories and
physical function tests used to measure all aspects of quality of life in pediatrics were explored.
The Pediatric Evaluation of Disability Inventory (PEDI) is a standardized assessment that
measures functional performance and caregiver assistance for children between 6 months and 7
years of age [8]. The PEDI tests each measure in three different domains, 1) Self-Care, 2) Mobility,
and 3) Social Function. The PEDI is conducted by the primary caregiver of the child, usually a
parent or physical therapist. For our case study, the mother was also the physical therapist. To
complete the PEDI, several “forced-choice” questions are answered on the child’s daily
interactions [8].
P a g e | 17
The PEDI was chosen for assessment of this case study for various reasons. One reason is due
to its reliability and validity in pediatric physical therapy practice. The reliability of this survey
has been shown to range between 95% - 100% [8]. With such high reliability levels, the outcomes
of this assessment are dependable. Another reason for using the PEDI was because of its ability to
detect function deficits, monitor individual progress, and evaluate outcomes [8]. It was required
for this study to have a method of monitoring progression of a single subject over time, making
the PEDI an ideal survey for this experiment.
Like the PEDI, the Pediatric Quality of Life Inventory (PedsQL) is a standardized
measurement of quality of life for children between 2 – 7 years of age. There are four components
to the PedsQL - 1) Physical Functioning, 2) Emotional Functioning, 3) Social Functioning, and 4)
School Functioning. Each assessment targets the problematic level of the child within that domain.
For this case study, only physical and emotional functioning were analyzed.
The reasoning behind choosing the PedsQL as an assessment tool was due to its reliability and
validity, just like PEDI. For children with chronic illnesses or mobility impairments, quality of life
is an important health measure [25]. Treatments are usually monitored as being beneficial through
results of the PedsQL.
The PEDI and PedsQL inventories were chosen to monitor the quality of life of the child.
The focus of the experiment was physical function. To enhance the Range of Motion and Manual
Muscle tests, another test was administered to test walking function. The Timed Up-and-Go (TUG)
test measures the walking speed of the child. The reasoning for the TUG test was to determine if
the child fell within normal range of walking time based on age. The TUG test measures “basic
ambulatory mobility of dynamic balance” [9]. Patients with spina bifida are a primary target for
P a g e | 18
this test. Equation 1 determines what the TUG, in seconds, should be based on age in year and
weight in kg. [10]
𝑇𝑈𝐺(𝑠) = 6.837 − [𝑎𝑔𝑒(𝑦) ∗ 0.166] + [𝑤𝑒𝑖𝑔ℎ𝑡(𝑘𝑔) ∗ 0.014] (1)
The TUG test is important for a child with spina bifida because the ability to walk is often
not possible. This test assists in determining the child’s walking ability.
CHAPTER 4: CASE STUDY
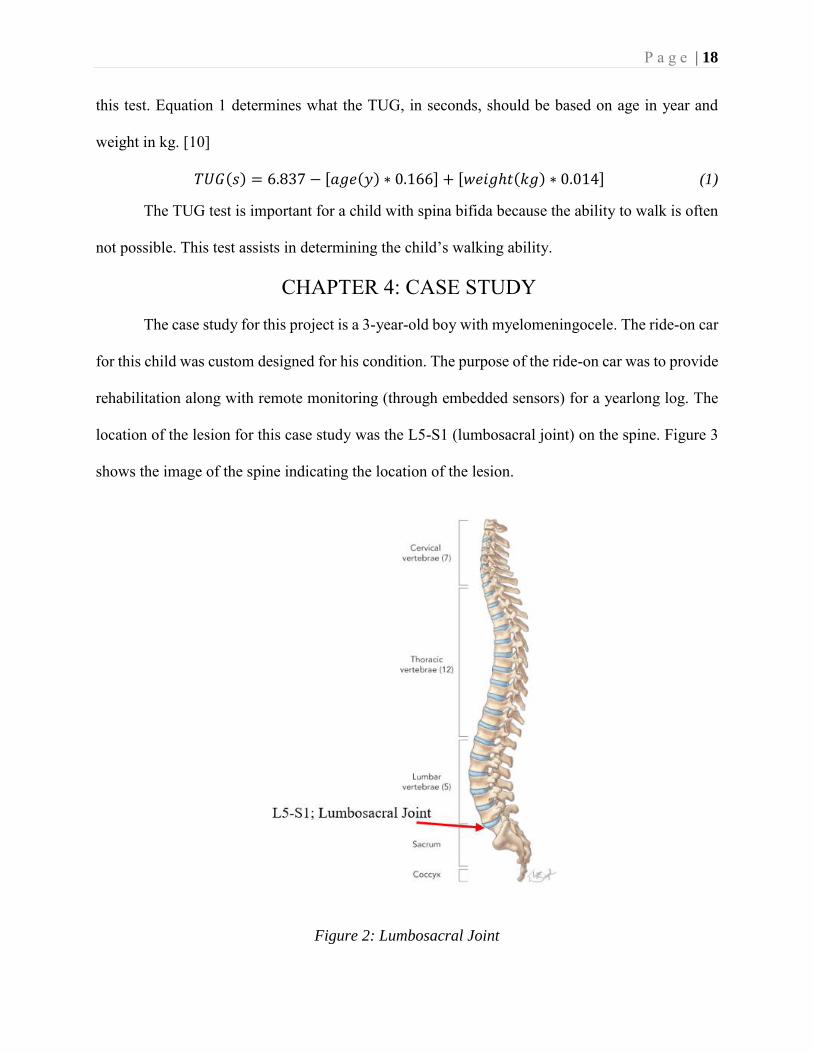
The case study for this project is a 3-year-old boy with myelomeningocele. The ride-on car
for this child was custom designed for his condition. The purpose of the ride-on car was to provide
rehabilitation along with remote monitoring (through embedded sensors) for a yearlong log. The
location of the lesion for this case study was the L5-S1 (lumbosacral joint) on the spine. Figure 3
shows the image of the spine indicating the location of the lesion.
Figure 2: Lumbosacral Joint
P a g e | 19
Due to the location of lesion level, lower limb paralysis and paresis were present. Upon
meeting the child, the ability to ambulate was achieved with the use of an assistive device (a
walker). In developing children, the capability to maneuver through the environment is more than
simply movement: it promotes the ability to learn, to socialize, and to develop cognitively. While
this child had assistive mobility, there was no ability to ambulate independently without an
assistive device. The child’s ability to ambulate independent of assistive devices was the main goal
for the parents and physical therapist.
4.1 Timeline
During the year, a few key observations were made about the child that were necessary for
documentation. Various factors contributed to the child’s ability and willingness to ride the toy
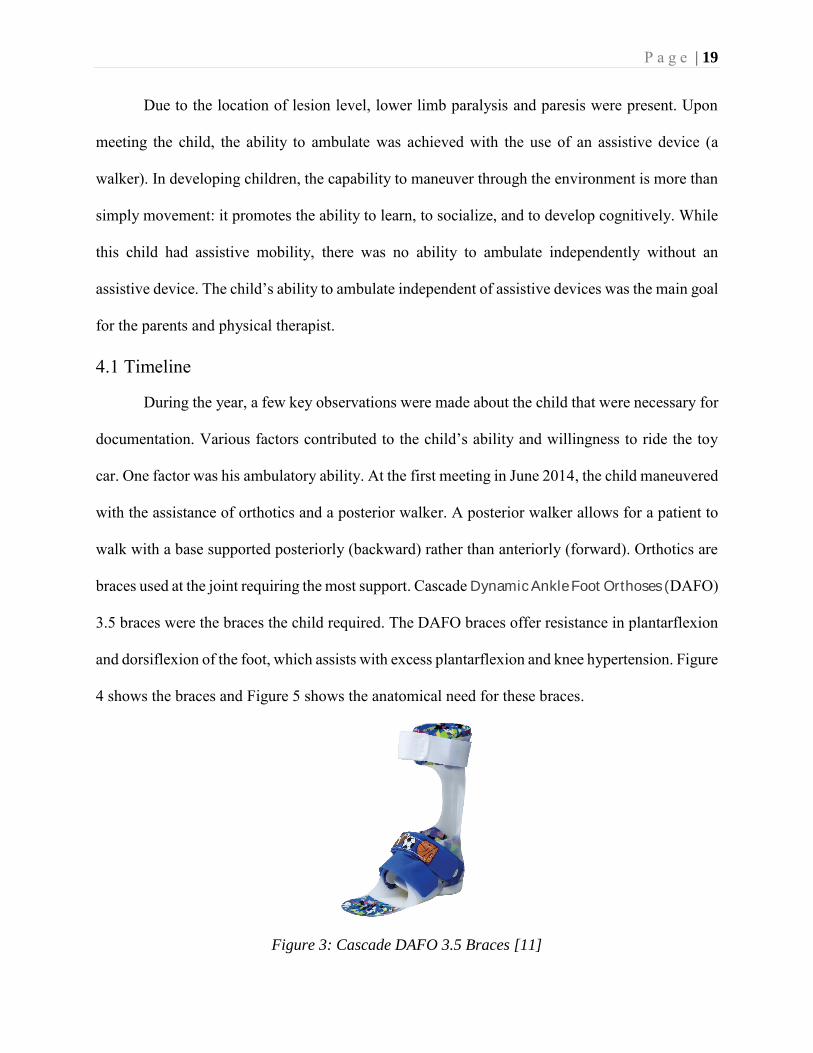
car. One factor was his ambulatory ability. At the first meeting in June 2014, the child maneuvered
with the assistance of orthotics and a posterior walker. A posterior walker allows for a patient to
walk with a base supported posteriorly (backward) rather than anteriorly (forward). Orthotics are
braces used at the joint requiring the most support. Cascade Dynamic Ankle Foot Orthoses (DAFO)
3.5 braces were the braces the child required. The DAFO braces offer resistance in plantarflexion
and dorsiflexion of the foot, which assists with excess plantarflexion and knee hypertension. Figure
4 shows the braces and Figure 5 shows the anatomical need for these braces.
Figure 3: Cascade DAFO 3.5 Braces [11]
P a g e | 20
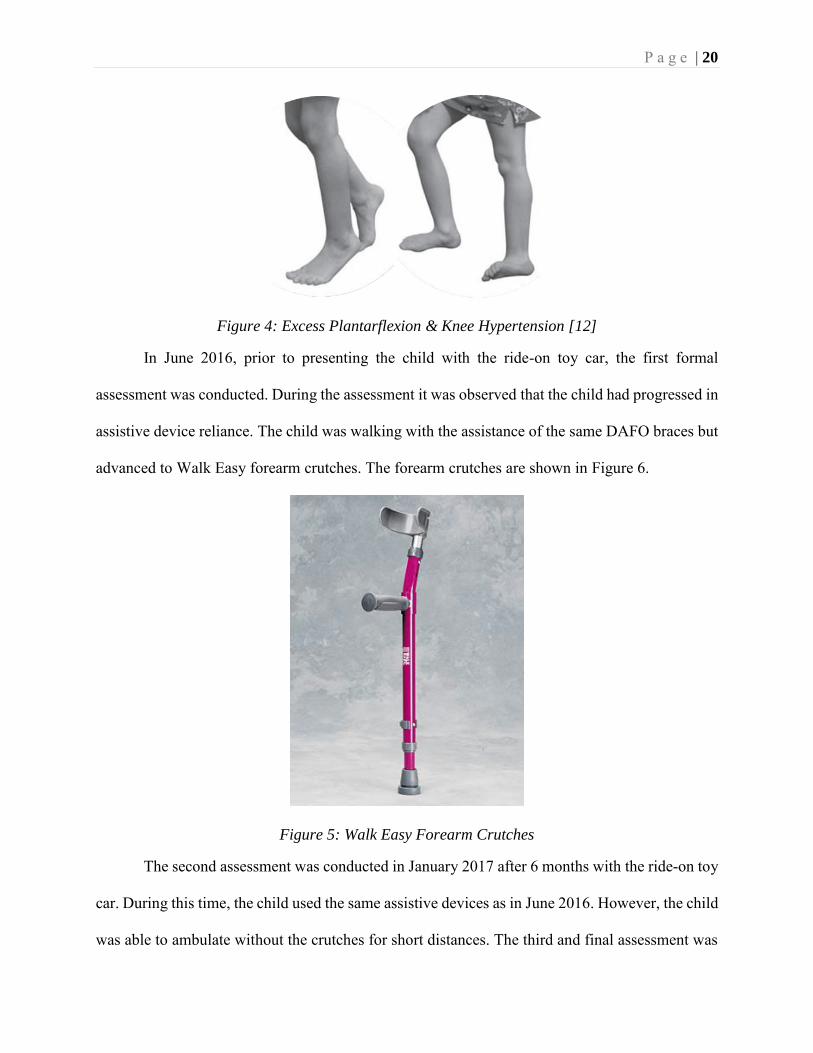
Figure 4: Excess Plantarflexion & Knee Hypertension [12]
In June 2016, prior to presenting the child with the ride-on toy car, the first formal
assessment was conducted. During the assessment it was observed that the child had progressed in
assistive device reliance. The child was walking with the assistance of the same DAFO braces but
advanced to Walk Easy forearm crutches. The forearm crutches are shown in Figure 6.
Figure 5: Walk Easy Forearm Crutches
The second assessment was conducted in January 2017 after 6 months with the ride-on toy
car. During this time, the child used the same assistive devices as in June 2016. However, the child
was able to ambulate without the crutches for short distances. The third and final assessment was
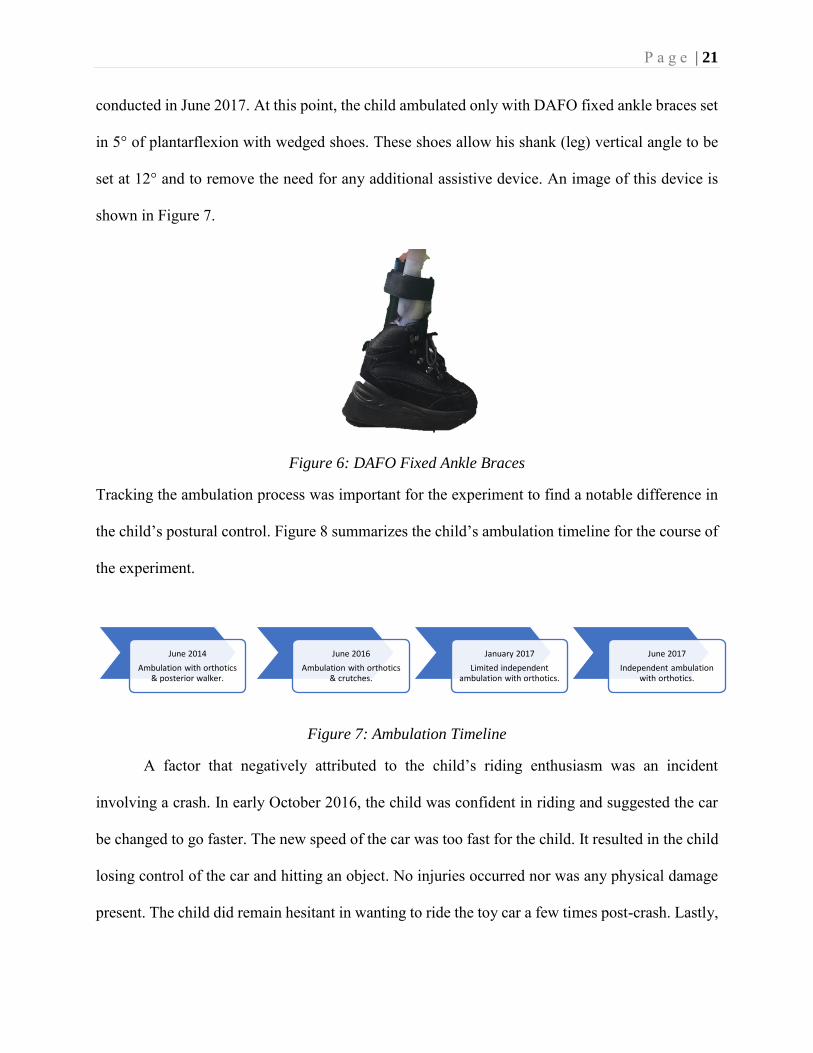
P a g e | 21
conducted in June 2017. At this point, the child ambulated only with DAFO fixed ankle braces set
in 5° of plantarflexion with wedged shoes. These shoes allow his shank (leg) vertical angle to be
set at 12° and to remove the need for any additional assistive device. An image of this device is
shown in Figure 7.
Figure 6: DAFO Fixed Ankle Braces
Tracking the ambulation process was important for the experiment to find a notable difference in
the child’s postural control. Figure 8 summarizes the child’s ambulation timeline for the course of
the experiment.
Figure 7: Ambulation Timeline
A factor that negatively attributed to the child’s riding enthusiasm was an incident
involving a crash. In early October 2016, the child was confident in riding and suggested the car
be changed to go faster. The new speed of the car was too fast for the child. It resulted in the child
losing control of the car and hitting an object. No injuries occurred nor was any physical damage
present. The child did remain hesitant in wanting to ride the toy car a few times post-crash. Lastly,
June 2014
Ambulation with orthotics & posterior walker.
June 2016
Ambulation with orthotics & crutches.
January 2017
Limited independent ambulation with orthotics.
June 2017
Independent ambulation with orthotics.
P a g e | 22
a factor that attributed to the child’s willingness to ride the toy car was surgery. In late October
2016 the child had an appendicostomy. An appendicostomy repairs fecal inconsistencies that
occurred due to myelomeningocele [13]. Although the surgery did not limit the child’s physical
ability to ride the toy-car, the energy level and emotional state were hindered. Having a change in
his emotional state did deter the child from wanting to play. These factors were kept in mind while
the research and data analysis took place.
4.2 Approach
A shift in a child’s weight-bearing from forward weight-bearing to backward weight-bearing
indicates improvements in lower-trunk control, which is needed for ambulation. It was proposed
as the premise of this study to show that quantitative measurements of weight bearing changes
correlate with an increase in quality of life and physical ability of a child, as measured through
standardized physical therapy assessments. To this end, the child would play for a year with the
ride-on toy car in his neighborhood with his brothers, and once a week, a physical therapy student
and an engineering student would visit the family and monitor the progress of the child.
In this thesis, the design approach for the ride-on toy car is detailed, the specifications of the
case study experiments are told, and the research methodology analyzed. In Chapter 5, the full
modifications of the ride-on car are detailed. In Chapter 6, the experiment is explained through the
timeline of the study. In Chapter 7, the data from the qualitative and quantitative methods are
clarified. Finally, a conclusion is drawn from the observed data and future work is discussed.
P a g e | 23
CHAPTER 5: POWER MOBILITY DESIGN
5.1 Ride-On Car Selection
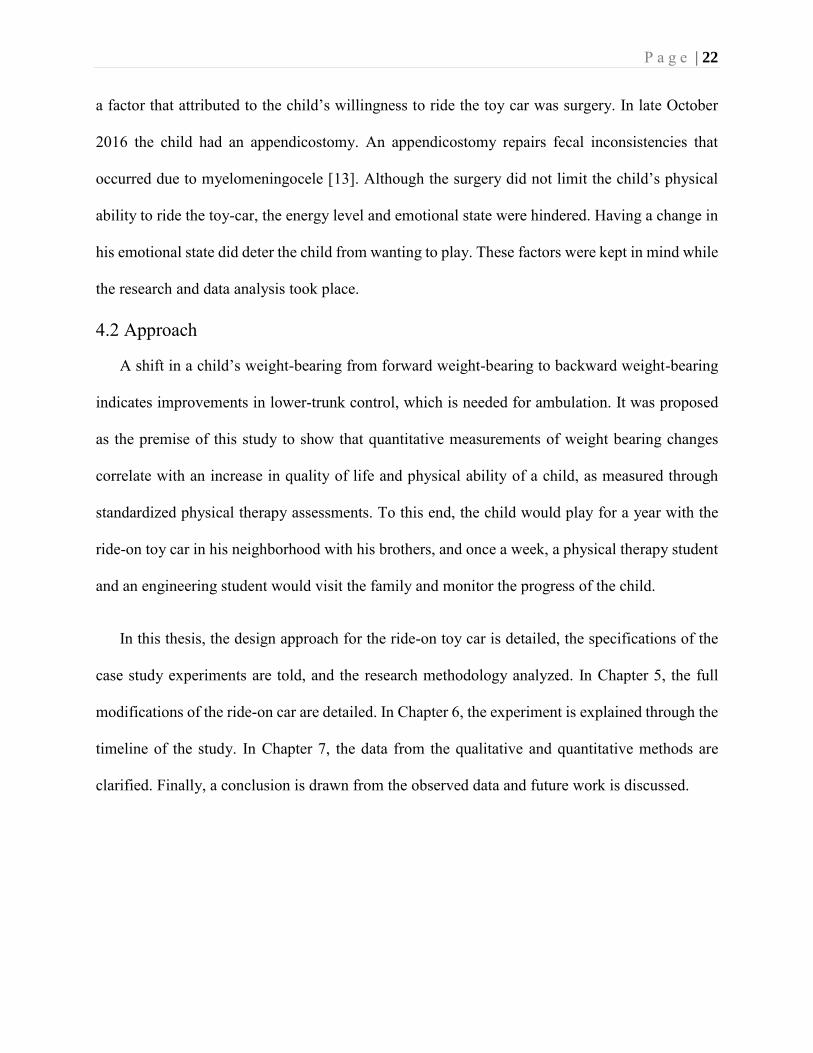
The ride-on car chosen for the child in our case study was based on several factors. One
factor was the idea of challenging the child while riding. Due to the child’s condition of spina
bifida, an ATV style car was chosen, specifically the Power Wheels Kawasaki KFX 12-Volt ride-
on in green, shown below. The intended modifications for sensor monitoring and physical therapy
challenges were achievable with an ATV style ride-on. To modify the ride-on car, mechanical and
electrical changes were made. They will be discussed in detail in proceeding sections.
Figure 9: Powered Ride-On Care Unmodified [14]
5.2 Mechanical Modifications
Major mechanical changes were made to the tires and the steering column. The tires were
changed from hollow hard plastic tires to pneumatic traction tires that would allow the car to
maneuver on multiple surfaces, especially outdoors. The steering column was altered for data
collection purposes that will be discussed in other chapters.
P a g e | 24
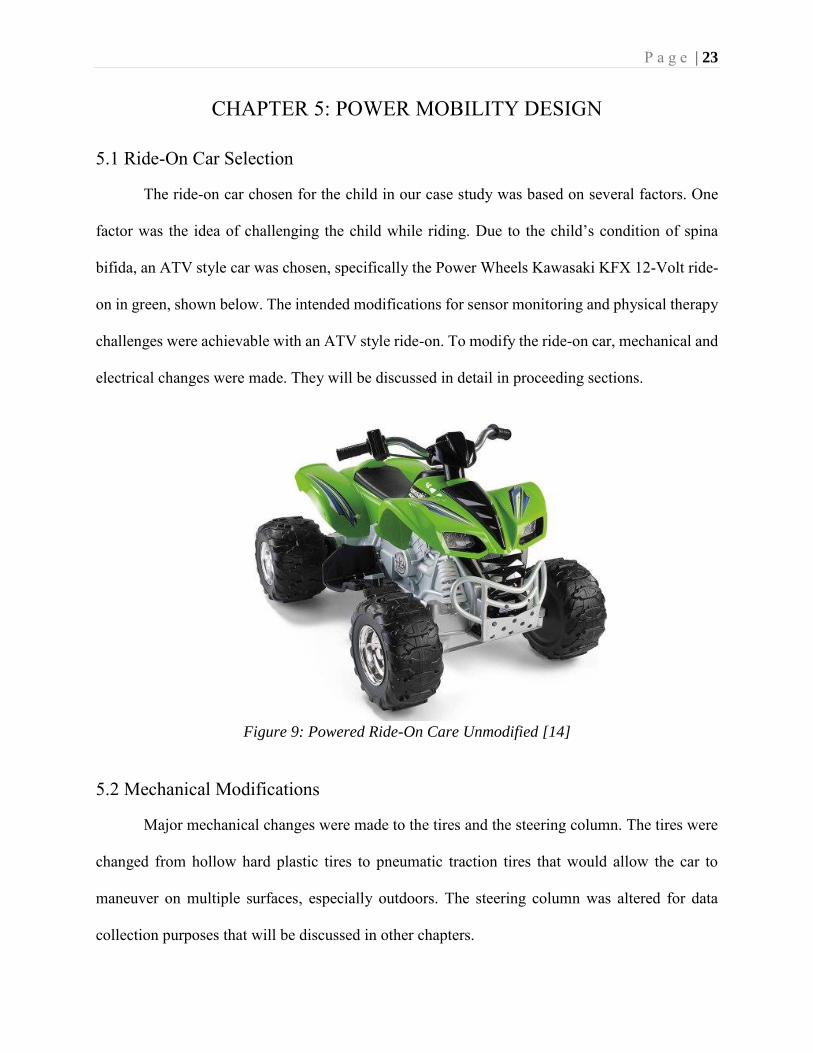
5.2.1 Tires
Pneumatic tires were required for the ride-on to ensure the child could play on multiple
terrains. There are seven steps in the process to change the tires from plastic to rubber. The details
for this assembly can be found in the Power Wheels with Rubber Wheels manual [15]. Figure 10
shows the store-bought tires compared to the enhanced pneumatic tires.
Figure 10: Unmodified[14] & Modified Front Right Wheel
5.2.2 Steering Column
The modifications to the steering column were required for a few reasons. First, a
potentiometer, which measures the steering angle of direction, was attached to the column using a
set of gears. Second, the steering column, as it comes from the manufacturer, had very low
dimensional tolerance. A slight wiggle during steering was also present causing measurements
errors from the sensor.
The first step in modifying the steering column was the assembly of the gear box. The
gearbox was printed using ABS plastic material with a Prusa i3 3D printer [26]. It was designed
to fit the potentiometer inside with the bottom piece extended with holes for screws. A gear was
attached to the top of the potentiometer that protruded from the box slightly and was secured with
a pin. The second step was to attach a gear into the steering column itself. This was done by cutting
a gear in half and attaching it to the steering column with a pin. Before permanently placing the
P a g e | 25
gear on the steering column, the gear box that housed the potentiometer was screwed into the ride-
on toy car. The gear on the steering column was then placed and tested to ensure full range of
handle-bar turning was recorded on the potentiometer.
5.3 Electrical Modifications
The store-bought ride-on car has a simple configuration for the motor controls. A push
button is used to make the car go from stop to full speed, another switch allows the car to alternate
between slow and fast speed, and a 12-Volt battery powers the toy car. The electrical changes to
this ride-on were selected based on the child’s physical attributes, the monitoring scheme, and to
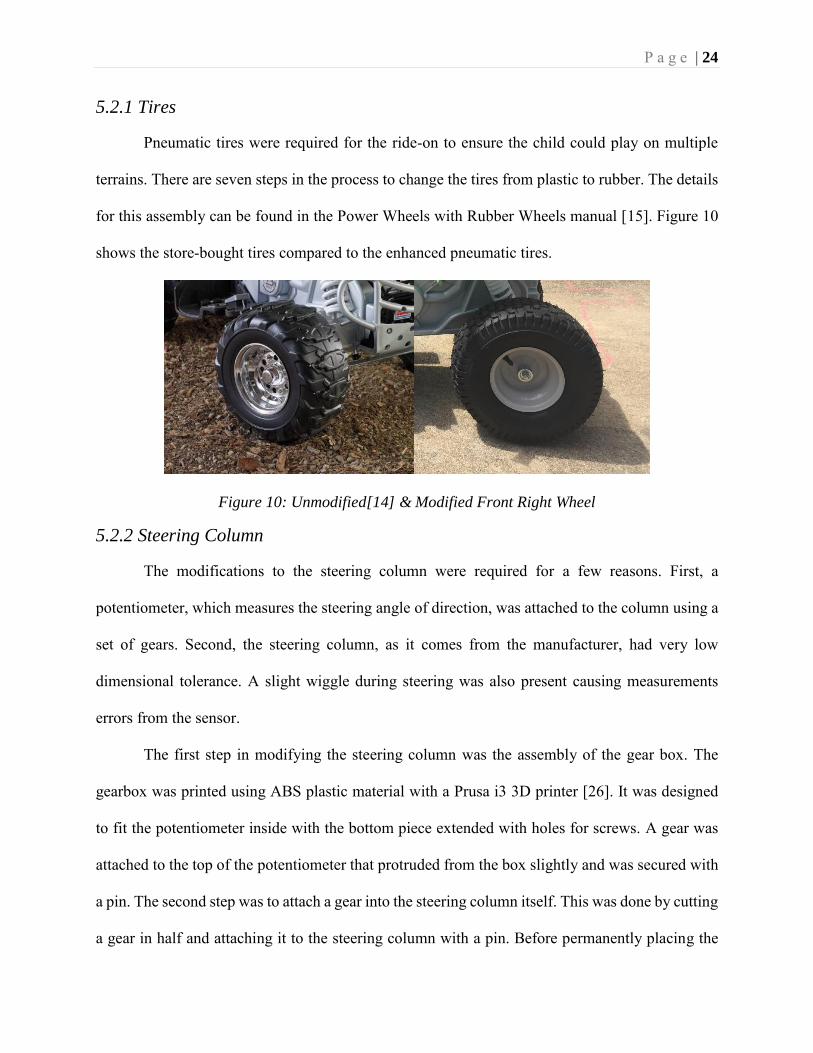
fit the specific physical therapy intervention. To coordinate all electrical systems, a Raspberry Pi
B+ microprocessor (shown in Figure 11) was selected and programmed using Python.
Figure 11: Raspberry Pi B+
5.3.1 Push Button Adaptations
The push button that actuates the ride-on was located on the foot pedal, which made the
car unusable by the child due to paralysis in his ankles. From this obstacle, a new design for the
push button was created. To challenge the child physically for postural control, a push button on
the seat was added. A seat switch would encourage the child to stand on the ride-on while playing
rather than to sit down.
P a g e | 26
As a safety precaution a secondary switch was required. The child was required to stand
while on the ride-on car as well as press a secondary switch to make the ride-on car move forward.
The secondary push-button switch was added on the handle bar of the steering column. This push
button would serve as a safety check to ensure the child was riding the toy car. With these two
switch modifications the car would service as both an accessible toy and as a physical therapy tool.
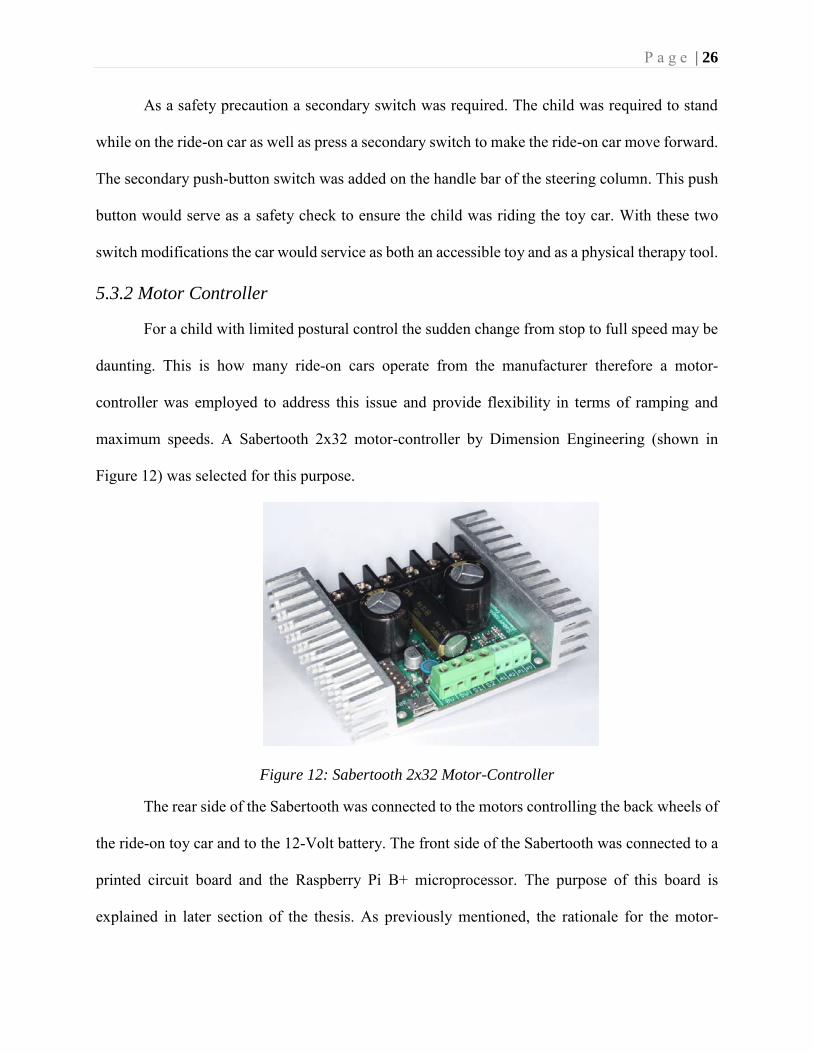
5.3.2 Motor Controller
For a child with limited postural control the sudden change from stop to full speed may be
daunting. This is how many ride-on cars operate from the manufacturer therefore a motor-
controller was employed to address this issue and provide flexibility in terms of ramping and
maximum speeds. A Sabertooth 2x32 motor-controller by Dimension Engineering (shown in
Figure 12) was selected for this purpose.
Figure 12: Sabertooth 2x32 Motor-Controller
The rear side of the Sabertooth was connected to the motors controlling the back wheels of
the ride-on toy car and to the 12-Volt battery. The front side of the Sabertooth was connected to a
printed circuit board and the Raspberry Pi B+ microprocessor. The purpose of this board is
explained in later section of the thesis. As previously mentioned, the rationale for the motor-
P a g e | 27
controller is to limit the maximum speed of the ride-on car and to control its velocity through a
ramping function up and down. The Raspberry Pi “tells” the Sabertooth the maximum speed and
commands it to ramp up/down. The applied speed is determined by the serial command sent to the
Sabertooth. The speed of the ride-on car can be varied from 0 - 7.8 miles-per-hour. The serial
communication of the Raspberry Pi varies from 0 to 2047. For a maximum speed of 7.8mph, the
serial command is 2047. For walking speed of (3.1mph), the serial command is 813. The speed
was maintained at or below walking speed for the duration of this case study. To create a ramping
effect on the ride-on car, a simple command was added to the Raspberry Pi to ensure it ramps-up
and ramps-down in accordance with the push button configuration. By controlling the motors from
the ride-on, the child was able to ride with no jerking and a slower speed allowing for a safe and
enjoyable ride.
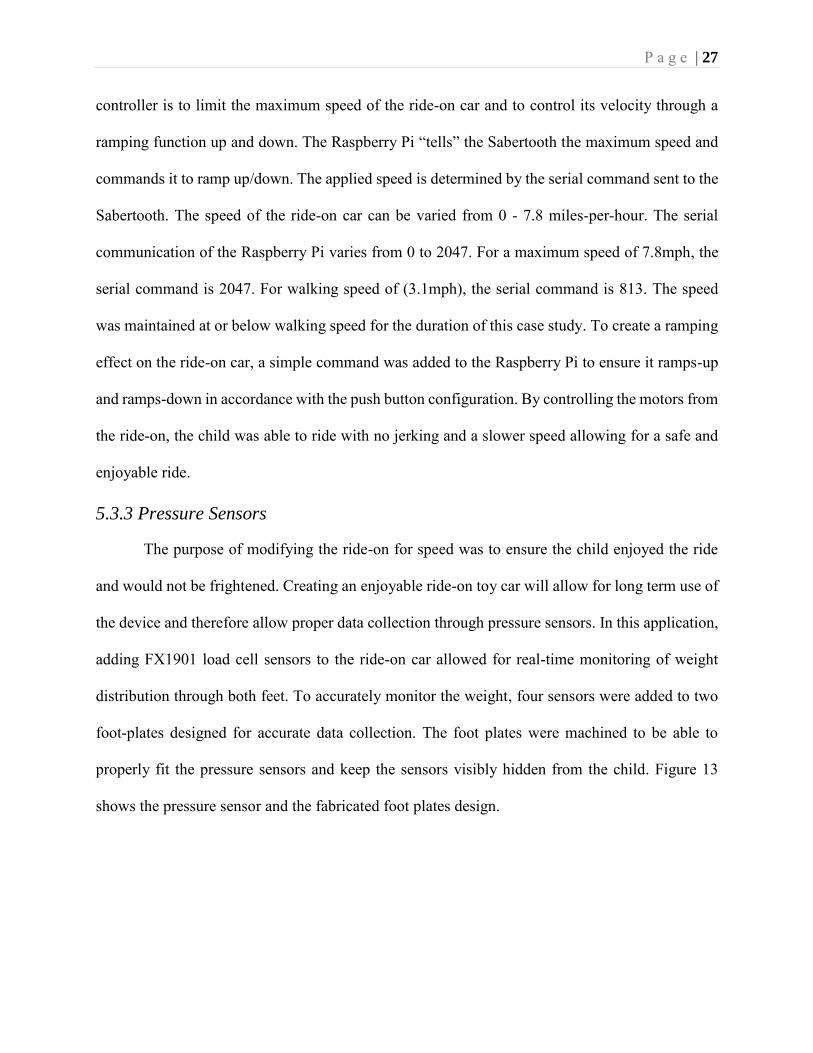
5.3.3 Pressure Sensors
The purpose of modifying the ride-on for speed was to ensure the child enjoyed the ride
and would not be frightened. Creating an enjoyable ride-on toy car will allow for long term use of
the device and therefore allow proper data collection through pressure sensors. In this application,
adding FX1901 load cell sensors to the ride-on car allowed for real-time monitoring of weight
distribution through both feet. To accurately monitor the weight, four sensors were added to two
foot-plates designed for accurate data collection. The foot plates were machined to be able to
properly fit the pressure sensors and keep the sensors visibly hidden from the child. Figure 13
shows the pressure sensor and the fabricated foot plates design.
P a g e | 28
Figure 13: Load Cell Sensor & Machined Foot Plate
The load cell sensor takes the applied force and translates it to a differential voltage reading.
The load cell sensor reads up to 100lbs per sensor. If the maximum voltage input is 5V, then the
differential voltage output for this child’s weight would be very small. Due to the small voltage, a
printed circuit board (PCB) was designed to enhance the communication between the Raspberry
Pi and pressure sensors.
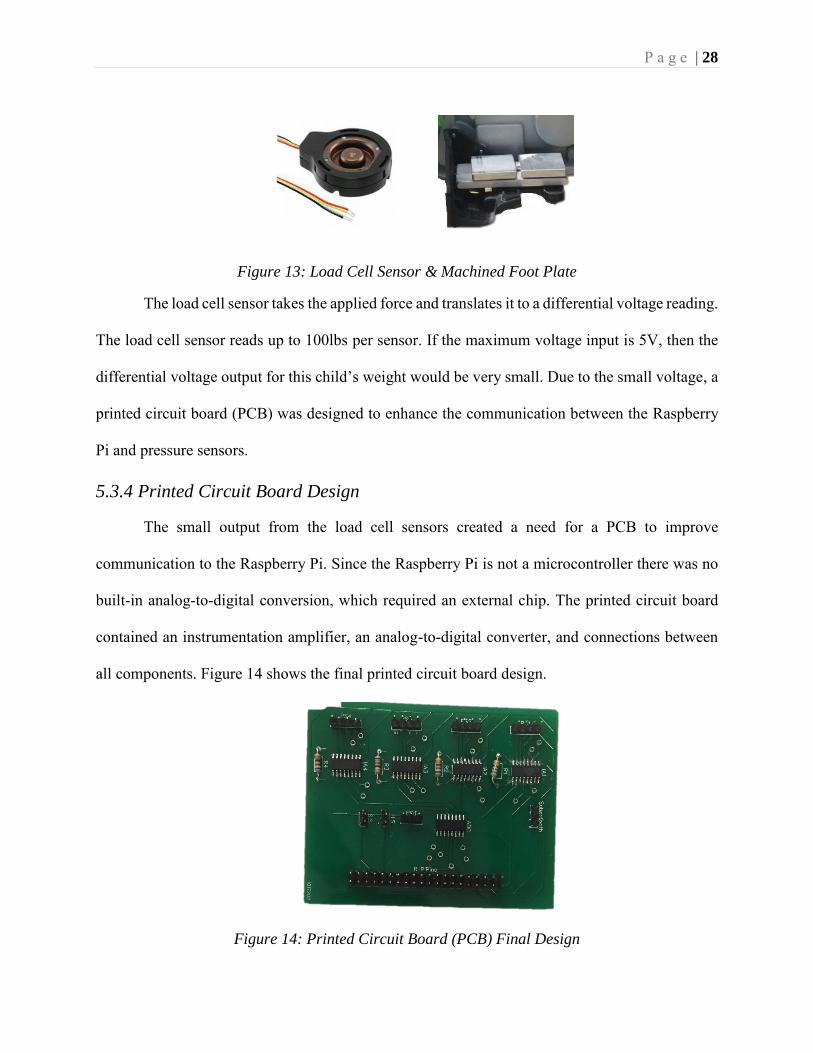
5.3.4 Printed Circuit Board Design
The small output from the load cell sensors created a need for a PCB to improve
communication to the Raspberry Pi. Since the Raspberry Pi is not a microcontroller there was no
built-in analog-to-digital conversion, which required an external chip. The printed circuit board
contained an instrumentation amplifier, an analog-to-digital converter, and connections between
all components. Figure 14 shows the final printed circuit board design.
Figure 14: Printed Circuit Board (PCB) Final Design
P a g e | 29
There were four instrumentation amplifiers for each pressure sensor. Each pressure sensor
was amplified by 100. There was one analog-to-digital converter that fed the outputs of the load
cell sensors and the potentiometer to the input of the Raspberry Pi. The conversion equation for
the analog-to-digital converter is
𝐷𝑖𝑔𝑖𝑡𝑎𝑙 𝑂𝑢𝑡𝑝𝑢𝑡 = (4096∗𝑉𝑖𝑛)
𝑉𝑟𝑒𝑓 (2)
The conversion from the pressure sensors is 1mV = 1lb. The weight conversion is 30lbs ~
2457 digital output. Through this conversion, all weight changes were monitored and recorded on
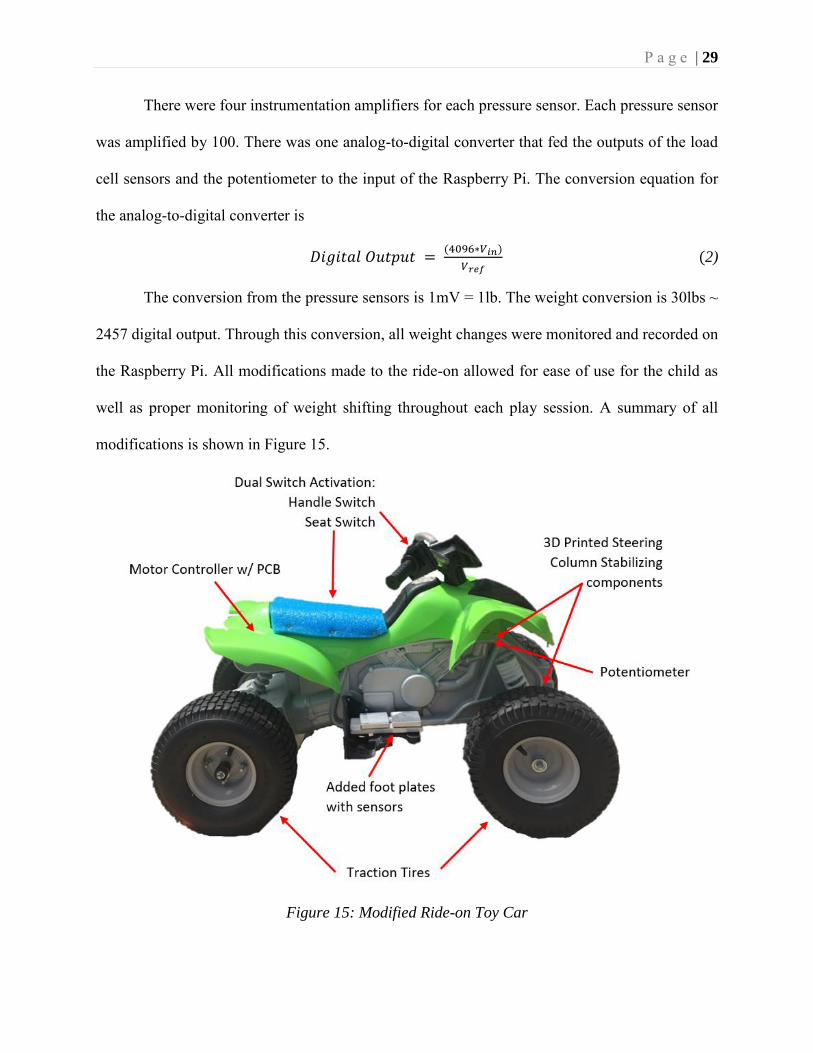
the Raspberry Pi. All modifications made to the ride-on allowed for ease of use for the child as
well as proper monitoring of weight shifting throughout each play session. A summary of all
modifications is shown in Figure 15.
Figure 15: Modified Ride-on Toy Car
P a g e | 30
CHAPTER 6: RESEARCH METHODOLOGY
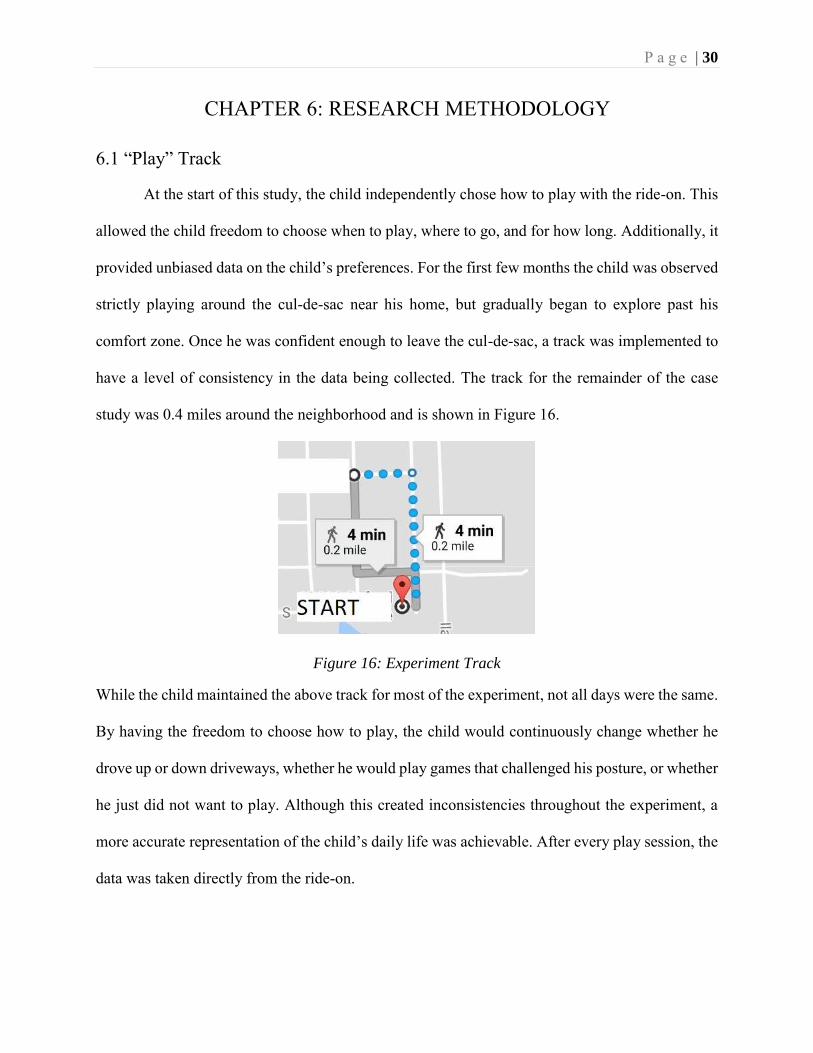
6.1 “Play” Track
At the start of this study, the child independently chose how to play with the ride-on. This
allowed the child freedom to choose when to play, where to go, and for how long. Additionally, it
provided unbiased data on the child’s preferences. For the first few months the child was observed
strictly playing around the cul-de-sac near his home, but gradually began to explore past his
comfort zone. Once he was confident enough to leave the cul-de-sac, a track was implemented to
have a level of consistency in the data being collected. The track for the remainder of the case
study was 0.4 miles around the neighborhood and is shown in Figure 16.
Figure 16: Experiment Track
While the child maintained the above track for most of the experiment, not all days were the same.
By having the freedom to choose how to play, the child would continuously change whether he
drove up or down driveways, whether he would play games that challenged his posture, or whether
he just did not want to play. Although this created inconsistencies throughout the experiment, a
more accurate representation of the child’s daily life was achievable. After every play session, the
data was taken directly from the ride-on.
P a g e | 31
6.2 Physical Therapy Data Collection Process
The collection process for the standardized physical therapy data was conducted by the
child’s parents. It is noted that the child’s mother is a pediatric physical therapist. The PEDI and
the PEDsQL were completed three times: June 2016 as the pre-assessment, January 2017 as a 6-
month follow-up, and June 2017 as a 1-year follow-up. The father or the mother filled out the
survey intermittently. This created some inconsistency in the completion of the forms throughout
the year, however it was not significant to the results. The physical assessments were conducted
after January 2017. The three physical assessments were chosen to enhance the validity of the
child’s postural stability over time. The child’s mother performed each test at the home. The first
test was conducted in February 2017 and the follow-up was in October 2017. With the addition of
these tests, the ride-on car data could be correlated with more precision.
6.3 Ride-On Toy Car Data Collection Process
To maintain safety of patient information, wireless communication was not added to the
Raspberry Pi. The data was directly stored into the Raspberry Pi as a .csv file that was easily
converted to an excel file. The excel file contained the time stamp for each data point collected,
the four recorded pressure sensors, and the potentiometer steering. Each trial consisted of one visit
to the family. The SD card was taken from the ride-on car and inserted into a different raspberry
pi that was connected to a monitor. The files were copied from the documents folder on the
Raspberry Pi onto a USB drive. The data was then transferred to a laptop and taken for analysis.
This process occurred at every session for the year long duration of the experiment.
P a g e | 32
CHAPTER 7: RESULTS
The objective of this study was to determine a correlation between standardized pediatric
physical therapy assessments and quantitative data obtained from the sensors in the ride-on toy
car. Before a correlation between qualitative and quantitative data could be made each test was
looked at independently to monitor changes throughout the course of the experiment.
7.1 Standard Physical Therapy Methods
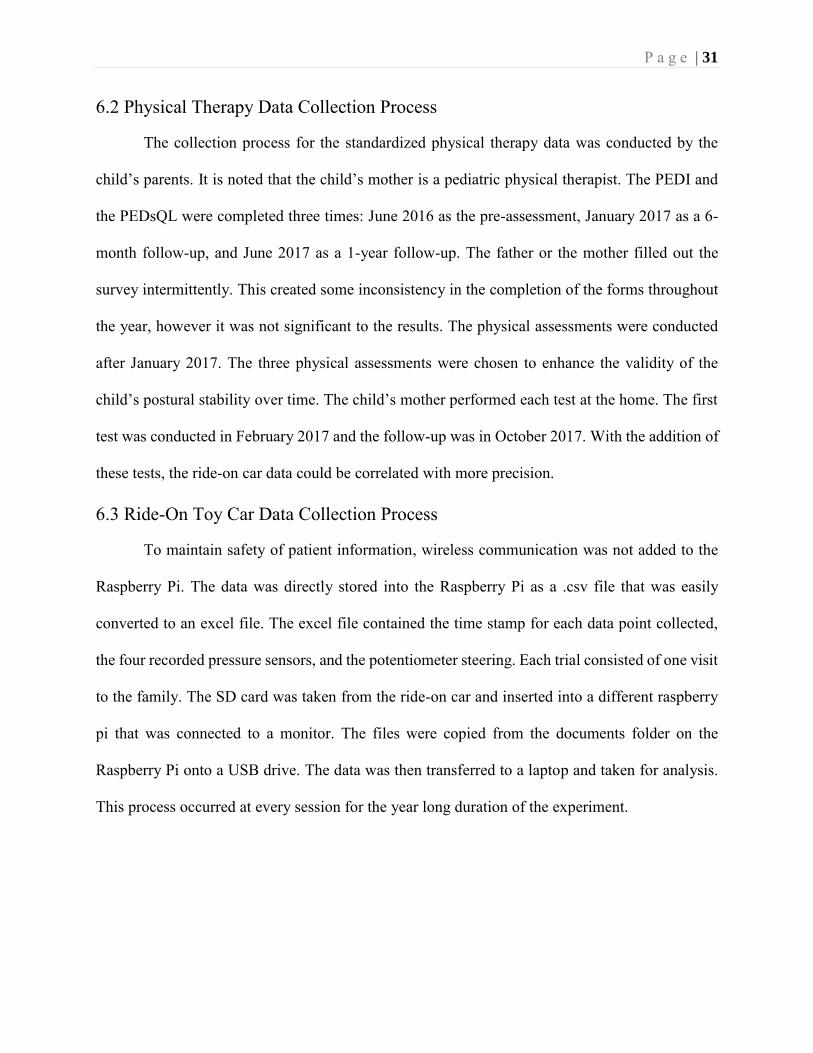
The PEDI evaluates: 1) functional skills and 2) caregiver assistance by looking at 1) self-
care and 2) mobility of the child. Functional skills detail the child’s personal growth in self-care
and mobility, while caregiver assistance details the need for parental intervention. Self-care is
expressed as any task required in a daily routine, i.e. brushing teeth, putting on clothes etc. The
requirements for mobility are determined by the child’s ability to maneuver through daily tasks,
from requiring transportation to walking up and down stairs. Based on the data collected, the
Functional Skills Scale results were plotted in Figure 17 and quantified in Table 3 [16]. The green
arrow is used to indicate that an increase in percentage signifies improvement in functional skills.
Figure 17: Functional Skills Assessment Results
P a g e | 33
Date Functional Skills Scale Scores
Self-Care Mobility June 2016 42.5 79.7
January 2017 50.7 79.7 June 2017 63.0 84.7
Table 3: Functional Skills Assessment Results Values
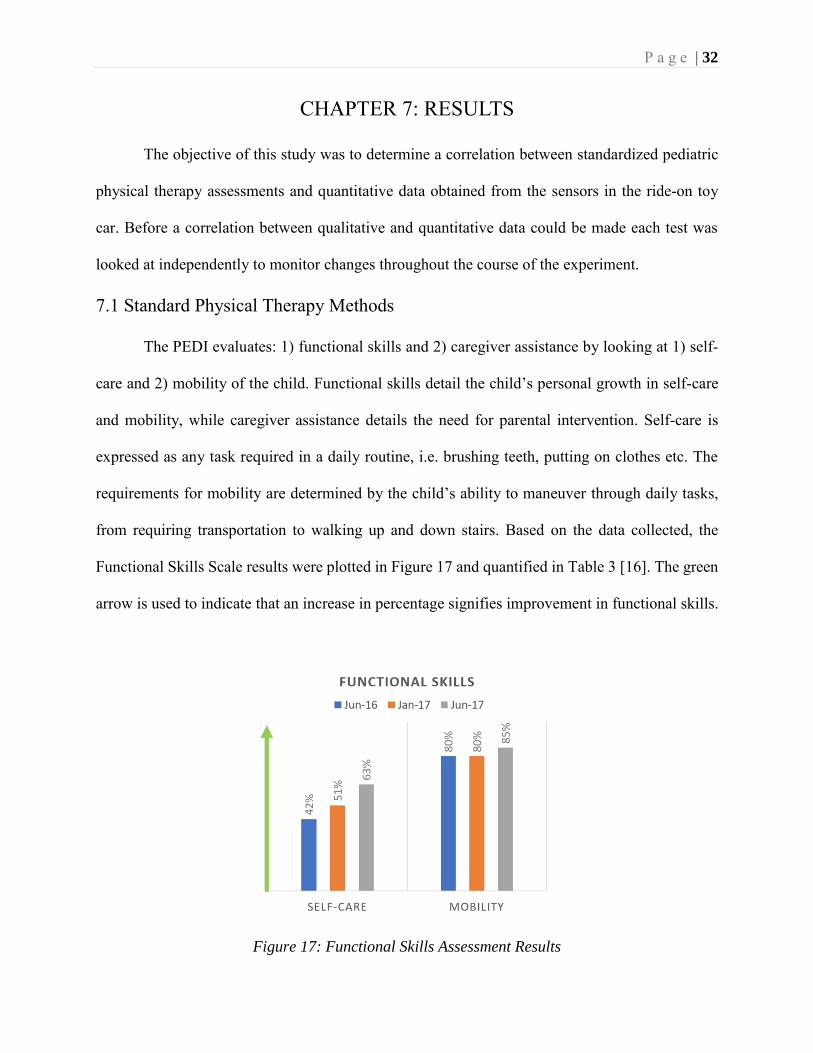
As in functional skills, caregiver assistance monitors the level at which the child needs
assistance. Based on the data collected, the caregiver assistance was plotted in Figure 18 and
quantified in Table 4. The green arrow in Figure 18 is used to indicate that a decrease in percentage
signifies improvement, and therefore greater independence of the child.
Figure 18: Caregiver Assistance Assessment Results
Date Caregiver Assistance
Self-Care Mobility June 2016 42.5 88.6
January 2017 40.0 74.3 June 2017 55.0 82.9
Table 4: Caregiver Assistance Assessment Results Values
These results clearly indicate that for functional skills there was an increase in both self-
care and mobility from June 2016 to June 2017, and for caregiver assistance there was an increase
in self-care but a decrease in mobility for the same period. These results were further analyzed to
P a g e | 34
determine if these observed changes are clinically significant. The difference (increase or decrease)
in each data collection was compared to the clinically significant benchmark of 11% which ranges
from 6 to 15 points for all PEDI scales [20]. A difference of 11% up or down in the child’s overall
score has clinical significance in the improvement or regression of their condition. The benchmark
difference of 11% was determined from a large study of children under the PEDI criteria in 1996
[8]. From the study this method of comparison has been used as the reference point for PEDI
analysis. Table 5 shows the PEDI data differences based on the collected data.
PEDI Jun ’16 – Jan ‘17 Jan ’17 – Jun ’17 Jun ’16 – Jun ’17 Functional
Skills Self-Care +8.2 +12.3 +20.5 Mobility 0 +4.3 +4.3
Caregiver Assistance
Self-Care -2.5 +15 +12.5
Mobility -14.3 +8.6 -5.7
Table 5: PEDI Calculated Differences
From the data collected for functional skills and caregiver assistance, there were noticeable
significant differences. It can be said that self-care in functional skills had a drastic increase. Self-
care in caregiver assistance had a large increase in the first six months of the experiment. Mobility
in caregiver assistance had a large decrease. The results from the PEDI concluded that the child
had improved in his ability to care for himself. The increase in self-care from caregiver assistance
can be attributed to the surgery that occurred in October 2016. The large decrease in caregiver
assistance in mobility expresses the child’s decrease of dependence on the caregiver for mobility
within the first six months of the experiment.
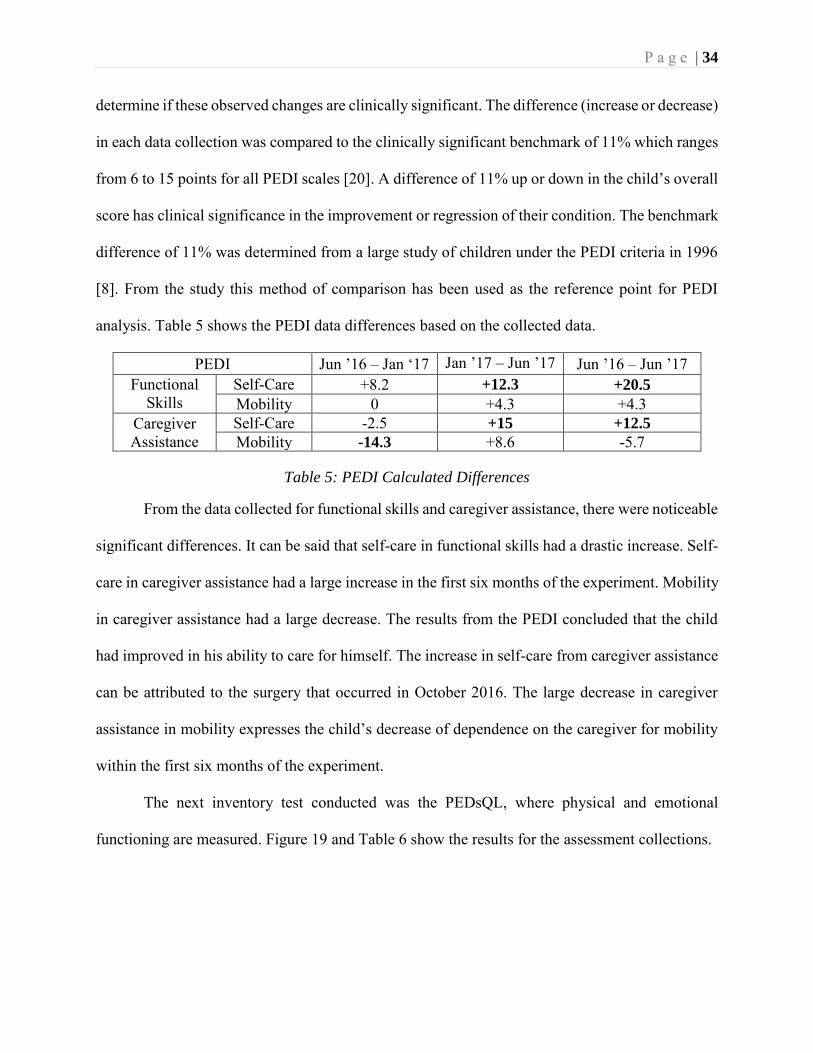
The next inventory test conducted was the PEDsQL, where physical and emotional
functioning are measured. Figure 19 and Table 6 show the results for the assessment collections.
P a g e | 35
Figure 19: PedsQL Results
Date PedsQL Results
Physical Functioning
Emotional Functioning
June 2016 55% 93.75% January 2017 60% 62.5%
June 2017 55% 75%
Table 6: PedsQL Percentage Results
The PedsQL works as the PEDI, where an increase in function is considered an
improvement. To determine whether there was any significant change in the results over the course
of the experiment a minimal clinically significant difference had to be determined. These
differences were determined for physical functioning to be ±6.76% and for emotional functioning
±10.37% [25]. Clinically significant values for the PedsQL are a standard of measure for analysis
that were determined from studies conducted on a large sample of children [25].
Jun ’16 – Jan ‘17 Jan ’17 – Jun ’17 Jun ’16 – Jun ’17
PedsQL
Physical Functioning -5% +5% 0%
Emotional Functioning -31.25% +12.5% -18.75%
Table 7: Minimal Clinically Significant Difference Calculations
P a g e | 36
For the PedsQL, there was no significant change in physical functioning, but large
increases and decreases in emotional functioning throughout the year were significant. Over the
course of the experiment the emotional function of the child varied. The decrease in emotional
function from June 2016 to January 2017 can be attributed to the surgery in October 2016. The
increase from January 2017 to June 2017 can be correlated with the child’s increase in independent
mobility. The decrease in emotional function overall can be attributed to the child’s awareness of
his condition as he grows up. The trend of emotional functioning follows the trend of the PEDI
caregiver assistance in both mobility and self-care.
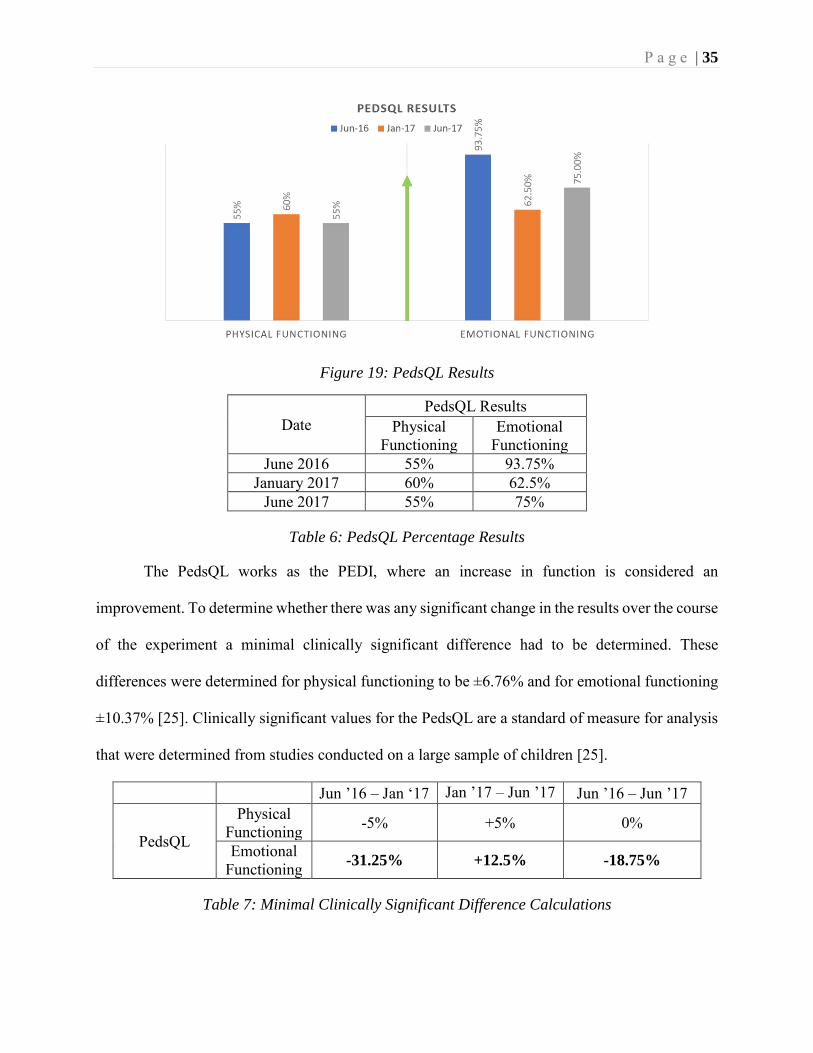
The physical assessments of the child were conducted twice from February 2017 to October
2017. Each test was conducted and analyzed searching for improvements. The results for range of
motion tests indicated a dramatic increase in hip external rotation. The hips went from less than
normal to excessively, externally rotated. This increase leads to believe that the child can now
stand straighter. Although hip extension remained weak, it did get better within the 8-month span
of data collection. Knee flexion and extension showed no significant improvement. Dorsiflexion
got better over time. Since the child has paralysis in the ankles, the increased range of motion to
nearly normal on the left shows an improvement in ankle motion. These results are quantified in
Table 8.
Range of Motion Test & Side
Normal Range
02/25/2017 10/12/2017 Right Left Right Left
Hip Internal Rotation 45-60° 68° 70° 75° 80° Hip External Rotation 45° 36° 30° 80° 70°
Hip Flexion 120°+ Full Full 145° 148° Hip Extension 20° 0° -3° 5° 5° Knee Flexion 135°+ 150° 150° 150° 150°
Knee Extension 0° 0° 0° -5° -5° Dorsiflexion 20° 2° 2° 5° 15°
Table 8: Range of Motion Test Results
P a g e | 37
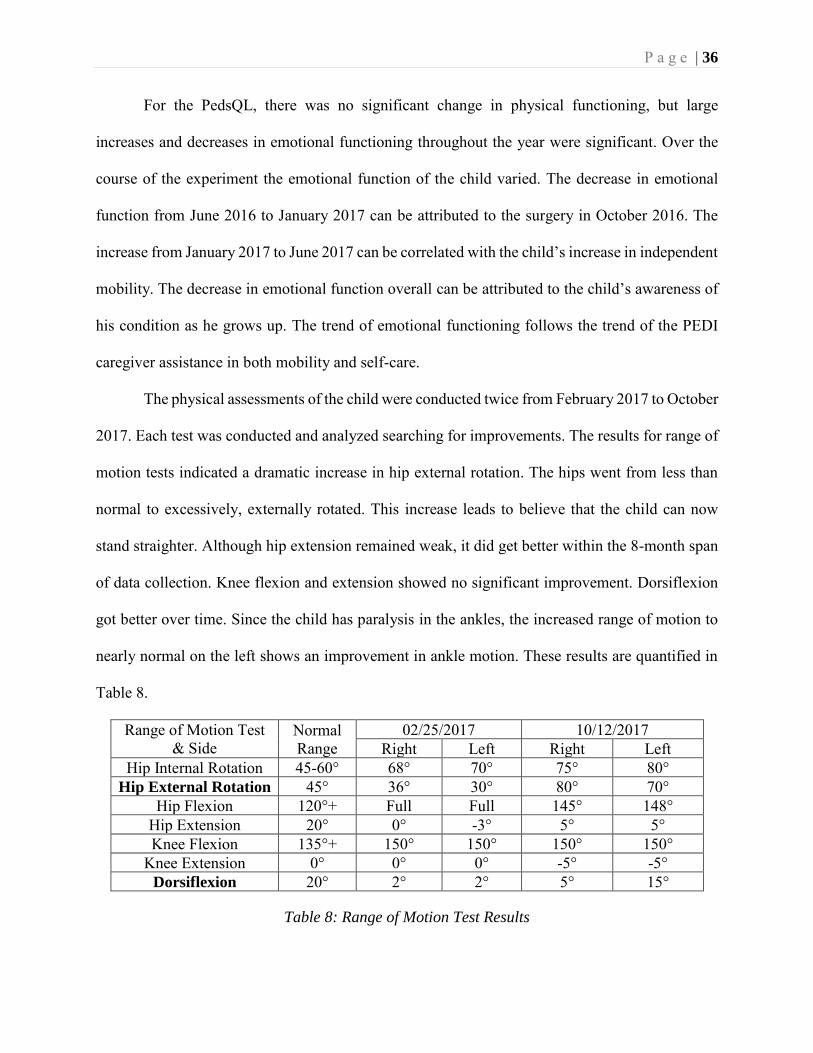
The results for the manual muscle test indicated that ankle and hip flexion and extension
did not show any improvement. In addition, knee flexion on the left side improved along with knee
extension. The improvements in the knee flexion and extension are indicators for postural
improvement. However, the lack of muscular improvement in the hips when compared to the
improved range of motion contradicts the improvement of postural control. These results are
tabulated in Table 9.
Muscle Test & Side
02/04/2017 10/12/2017 Right Left Right Left
Hip Flexion 5/5 5/5 5/5 5/5
Hip Extension 2/5 2+/5 2/5 2+/5
Knee Flexion 4-/5 4-/5 4-/5 4/5
Knee Extension 4+/5 4+/5 5/5 5/5
Ankle 0/5 0/5 0/5 0/5
Table 9: Manual Muscle Test Results
Finally, the Timed Up-and-Go Test (TUG) was conducted. Based on the child in our case
study and the previously explained formula (Equation 1) the TUG test result should be 6.589
seconds. The results obtained from the TUG tests are shown in table 10.
Date 02/25/2017 10/12/2017 Time (sec) 5.76 4.10
Table 10: Timed Up-and-Go Test Results
These results are both less than the calculated time for the TUG test. In addition, there is
an improvement of 1.66 second between both dates. It is concluded from these results that postural
control is present. Although no increase in hip extension in muscle was present, the increase in hip
external rotation and a TUG time less than normal are strong indicators that the child possesses
good postural control.
P a g e | 38
7.2 New Methodology Based on Sensor Technology
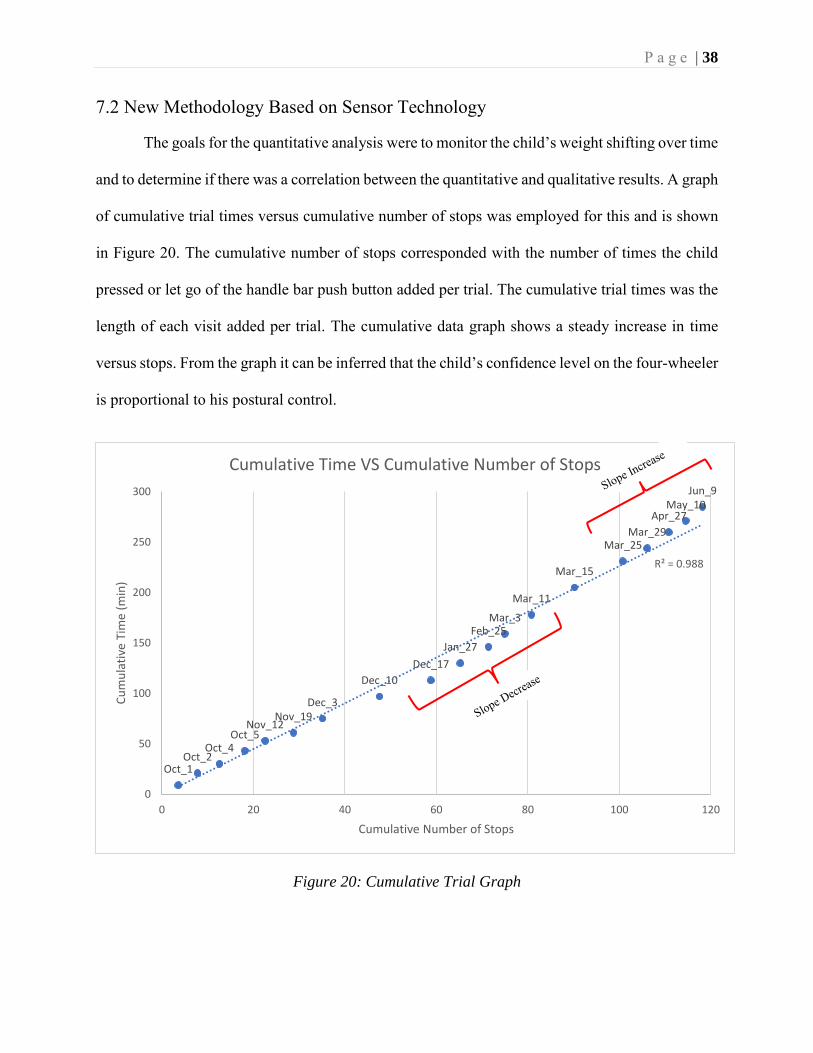
The goals for the quantitative analysis were to monitor the child’s weight shifting over time
and to determine if there was a correlation between the quantitative and qualitative results. A graph
of cumulative trial times versus cumulative number of stops was employed for this and is shown
in Figure 20. The cumulative number of stops corresponded with the number of times the child
pressed or let go of the handle bar push button added per trial. The cumulative trial times was the
length of each visit added per trial. The cumulative data graph shows a steady increase in time
versus stops. From the graph it can be inferred that the child’s confidence level on the four-wheeler
is proportional to his postural control.
Figure 20: Cumulative Trial Graph
Oct_1Oct_2
Oct_4Oct_5
Nov_12Nov_19
Dec_3
Dec_10
Dec_17
Jan_27
Feb_25Mar_3
Mar_11
Mar_15
Mar_25Mar_29
Apr_27May_10
Jun_9
R² = 0.988
0
50
100
150
200
250
300
0 20 40 60 80 100 120
Cu
mu
lati
ve T
ime
(min
)
Cumulative Number of Stops
Cumulative Time VS Cumulative Number of Stops
P a g e | 39
A tendency noticed from the cumulative trial graph is the change in the overall trend.
Although the trendline is seemingly linear, there is a dip in the linearity around the six months
mark, between December 10 and February 25. This data can be correlated to the pressure sensors
data and to life events in the child’s life to reveal effects in the physical therapy intervention.
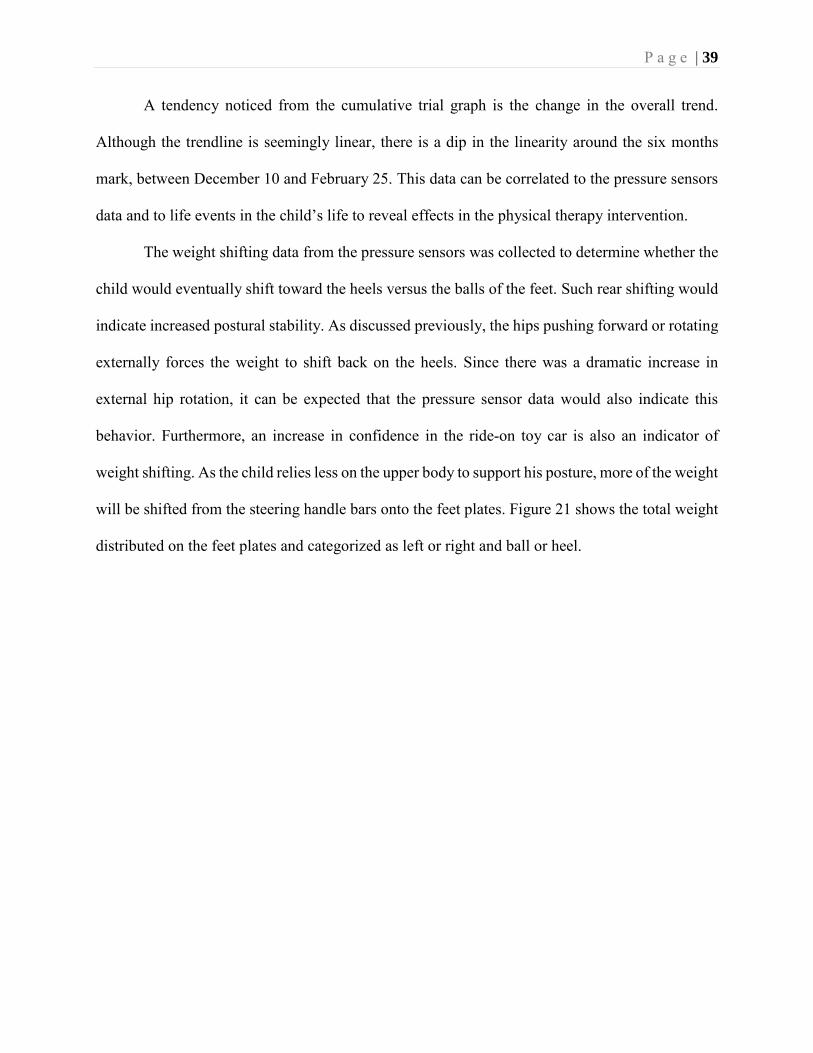
The weight shifting data from the pressure sensors was collected to determine whether the
child would eventually shift toward the heels versus the balls of the feet. Such rear shifting would
indicate increased postural stability. As discussed previously, the hips pushing forward or rotating
externally forces the weight to shift back on the heels. Since there was a dramatic increase in
external hip rotation, it can be expected that the pressure sensor data would also indicate this
behavior. Furthermore, an increase in confidence in the ride-on toy car is also an indicator of
weight shifting. As the child relies less on the upper body to support his posture, more of the weight
will be shifted from the steering handle bars onto the feet plates. Figure 21 shows the total weight
distributed on the feet plates and categorized as left or right and ball or heel.
P a g e | 40
Figure 21: Weight Distribution Graph
At the start of the experiment, the child was placing most of the weight on the balls of the
feet with no preference to right or left. The weight began to shift backwards between November
and December. Between January and early March, the weight distributed completely forward.
From mid-March until June, most of the weight was on the heels and more of the total weight was
on the feet plates. The change in weight shifting from heels – balls – heels follows the same trend
as the cumulative trial graph. The graph also shows that near the end of the experiment the child
was putting more of the weight on the feet plates than on the handle bars. This trend shows the
increase in confidence on the lower body than on the upper body.
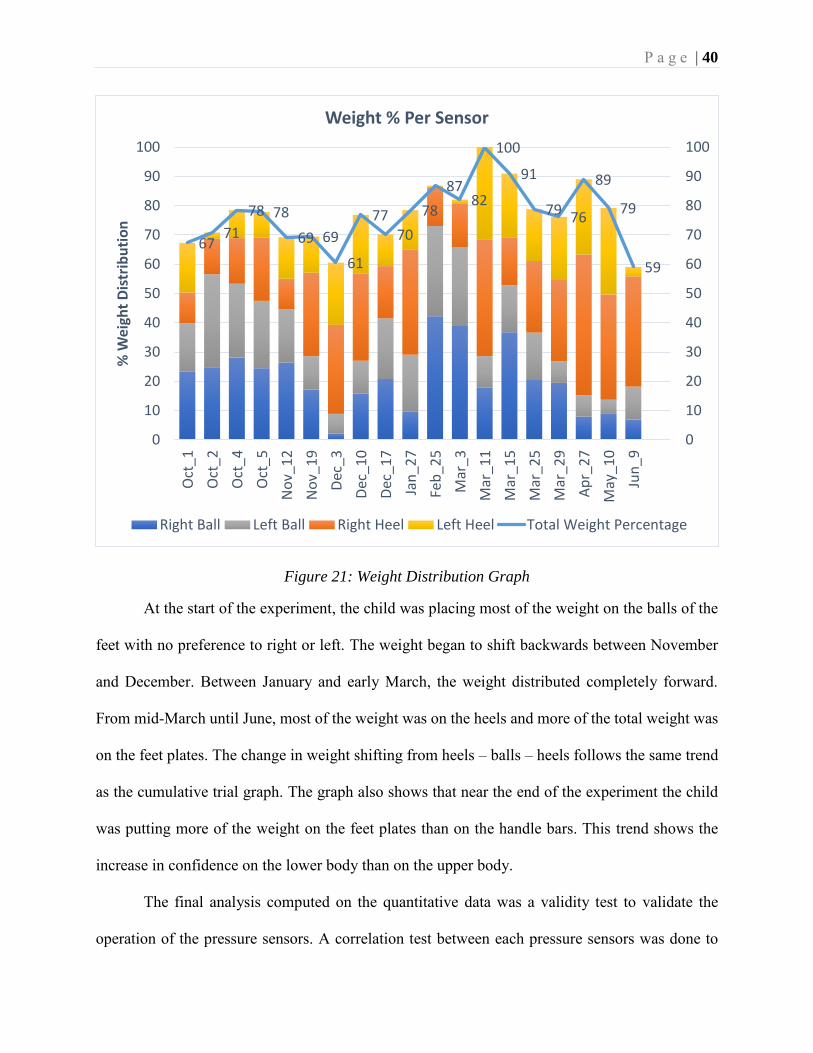
The final analysis computed on the quantitative data was a validity test to validate the
operation of the pressure sensors. A correlation test between each pressure sensors was done to
6771
78 78
69 69
61
7770
78
8782
100
91
79 76
89
79
59
0
10
20
30
40
50
60
70
80
90
100
0
10
20
30
40
50
60
70
80
90
100
Oct
_1
Oct
_2
Oct
_4
Oct
_5
No
v_1
2
No
v_1
9
Dec
_3
Dec
_10
Dec
_17
Jan
_27
Feb
_25
Mar
_3
Mar
_11
Mar
_15
Mar
_25
Mar
_29
Ap
r_2
7
May
_10
Jun
_9
% W
eigh
t D
istr
ibu
tio
nWeight % Per Sensor
Right Ball Left Ball Right Heel Left Heel Total Weight Percentage
P a g e | 41
ensure that the recording was behaving as anticipated. Table 11 shows the correlation test between
the pressure sensors.
Correlation
Right Ball – Right Heel
Left Ball – Left Heel
Right Ball – Left Heel
Right Heel – Left Heel
Left Ball – Right Ball
Left Ball – Right Heel
-0.739 -0.755 -0.432 0.571 0.737 -0.704
Table 11: Correlation Test
From the correlation test there is a positive relationship between the heels of the feet and the balls
of the feet, while there is a negative correlation between the other relationships. These results
validate the operation of the pressure sensors.
P a g e | 42
CHAPTER 8: DISCUSSION
Over the course of this study, the child improved in physical function and reached the
milestone of being able to walk with limited assistive devices. The results that clearly revealed this
increase in walking function were collected using the ROM test, the MMT, and the TUG test.
Furthermore, results from the weight-distribution graph (Figure 21) correlate with these tests. An
increase in external hip rotation and a TUG time less than the minimally significant time lead to a
conclusion of good postural control, although no substantial increase in muscular hip extension
was present. The postural control necessary to stand upright requires a weight distribution change
from weight-bearing on the balls of the feet to weight-bearing on the heels of the feet. Such weight
distribution was measured using the pressure sensors in the ride-on car. These results indicate that
the child went from applying 41% of his weight on his heels to placing 66% of his weight on his
heels. Additionally, there was an increase from 72% of his total body weight on the pressure
sensors to 82%, indicating less reliance on his hands/handle bars and more on his feet. Hence, it is
noted that both tests (quantitative or sensor based, and qualitative standardize assessments) detect
this change.
The trends between the PEDI, the PedsQL, the cumulative graph, and the weight
distribution graph also display correlation. Each trend shows a depression around January 2017,
the six-month mark. The PEDI caregiver assistance and the PedsQL emotional functioning
depression shows that the child’s surgery had an impact on his quality of life. The cumulative
graph and the weight distribution graph also shows a depression during the January 2017 time
frame. Although the cumulative graph and the weight distribution graph do not give specific causes
for the depression, it is noted that a deviation in trend has occurred, indicating a change in the
P a g e | 43
child’s life. As a proof of concept for a remote monitoring device this deviation in trend indicates
to the therapist that a closer look at the intervention and to the child in general is necessary.
P a g e | 44
CHAPTER 9: CONCLUSION
The purpose of this study was to determine whether a correlation was present between
standard, commonly employed pediatric physical therapy assessments and a remote monitoring
device in the form of a modified ride-on toy car. Based on the collected results, it is concluded that
it is possible to have remote, quantitative monitoring of a child through a ride-on car. This is an
important conclusion with potential impact for remote rehabilitation (e.g. telemedicine)
interventions and the future prognosis of children with disabilities who would benefit from such
interventions.
P a g e | 45
RECOMMENDATIONS
Suggestions to expand the usability of the ride-on toy car as a remote monitoring device
are described throughout this section. Types of pediatric physical therapy assessments should
exceed the types listed in this paper. This recommendation is due to the requirement of hands-on
physical therapy assessments from the beginning of the project. Having a balanced list of
assessments to be conducted from the start of the experiment is important. To ensure there are no
discrepancies in the survey assessments, the same parent should fill out the forms and a physical
therapist who is not the parent should also conduct all the hands-on assessments. It is recommended
that these steps be taken and recorded throughout the duration of the project to eliminate any
inconsistencies or biases.
Recommendation for the building and design of the ride-on car should be done with an
Arduino microcontroller instead of a Raspberry Pi microprocessor. Although a microprocessor can
be a more powerful tool, the needs for this project are easily met with an Arduino-based
microcontroller. The use of pressure sensors on the handle bars as well as the foot plates for total
weight distribution measurements is an important addition. Having the measurement of weight
displaced on the handle bars will allow for a precise total body weight distribution. The pressure
sensors should continually record weight distribution even when no movement in occurring.
Knowing the weight distribution of the child when no movement is occurring on the ride-on
presents the data of static motion. Static motion can give important indicators to the postural
stability of the child. These modifications on the build of the car allow for easy data interpretation
and analysis.
For the experiment, data should be recorded and obtained at least once a week. Maintaining
accountability of at least one riding session a week is important for fluidity of data collection. If
P a g e | 46
changing speed is a goal, then providing slight increases will ensure the child will be challenged
without being frightened. The changes should occur in a strategic manner throughout the year long
experiment.
With these alterations, the data collected from the ride-on toy car could be used to
determine inconsistencies with the child’s postural control precisely, rather than a vague
determination of an issue.
P a g e | 47
REFERENCES
[1]"List of Assessment Tools Used in Pediatric Physical Therapy", Med.unc.edu, 2018. [Online]. Available: https://www.med.unc.edu/ahs/physical/files/school-based-pt-docs/Ped%20Assessment%20Tools.pdf. [Accessed: 19- Mar- 2018].
[2]A. Lynch, J. Ryu, S. Agrawal and J. Galloway, "Power Mobility Training for a 7-Month-Old Infant with Spina Bifida", Pediatric Physical Therapy, vol. 21, no. 4, pp. 362-368, 2009.
[3]"Facts | Spina Bifida | NCBDDD | CDC", Centers for Disease Control and Prevention, 2018. [Online]. Available: https://www.cdc.gov/ncbddd/spinabifida/facts.html. [Accessed: 19- Mar- 2018].
[4]M. Therapeutics and M. Therapeutics, "Spina Bifida Awareness Month", 2018. [Online]. Available: http://www.milestonestherapeutics.net/blog/spina-bifida-awareness-month/2016/10/26. [Accessed: 19- Mar- 2018].
[5]"THE ICF: AN OVERVIEW", Cdc.gov, 2018. [Online]. Available: https://www.cdc.gov/nchs/data/icd/icfoverview_finalforwho10sept.pdf. [Accessed: 19- Mar- 2018].
[6]"Spina Bifida Treatment", Mychildwithoutlimits.org, 2018. [Online]. Available: http://www.mychildwithoutlimits.org/understand/spina-bifida/spina-bifida-treatment/. [Accessed: 19- Mar- 2018].
[7]"MANUAL MUSCLE TESTING PROCEDURES", Niehs.nih.gov, 2018. [Online]. Available: https://www.niehs.nih.gov/research/resources/assets/docs/muscle_grading_and_testing_procedures_508.pdf. [Accessed: 19- Mar- 2018].
[8]D. Nichols and J. Case-Smith, "Reliability and Validity of the Pediatric Evaluation of Disability Inventory", Pediatric Physical Therapy, vol. 8, no. 1, pp. 15???24, 1996.
[9]K. Sibley, M. Beauchamp, K. Van Ooteghem, M. Paterson and K. Wittmeier, "Components of Standing Postural Control Evaluated in Pediatric Balance Measures: A Scoping Review", Archives of Physical Medicine and Rehabilitation, vol. 98, no. 10, pp. 2066-2078.e4, 2017.
[10]R. Nicolini-Panisson and M. Donadio, "Normative values for the Timed ‘Up and Go’ test in children and adolescents and validation for individuals with Down syndrome", Developmental Medicine & Child Neurology, vol. 56, no. 5, pp. 490-497, 2013.
[11]"DAFO 3.5", Cascadedafo.com, 2018. [Online]. Available: https://cascadedafo.com/products/dafo-3.5. [Accessed: 19- Mar- 2018].
[12]"DAFO Guide", Cascadedafo.com, 2018. [Online]. Available: https://cascadedafo.com/dafo-guide#excess-plantarflexion. [Accessed: 19- Mar- 2018].
[13]"Appendicostomy (Malone Procedure) for Bowel Management OR | Self-Administered Enemas", Cincinnatichildrens.org, 2018. [Online]. Available:
P a g e | 48
https://www.cincinnatichildrens.org/service/c/colorectal/treatments/appendicostomy. [Accessed: 19- Mar- 2018].
[14]"Power Wheels Ride-On", Walmart.com, 2018. [Online]. Available: https://www.walmart.com/ip/Power-Wheels-Kawasaki-KFX-12-Volt-Battery-Powered-Ride-On-Green/26094898#customer-reviews. [Accessed: 19- Mar- 2018].
[15]A. Katada, Pediatric Rehabilitation Final Report. pp. 135-147.
[16]S. Logan, H. Feldner, J. Galloway and H. Huang, "Modified Ride-on Car Use by Children With Complex Medical Needs", Pediatric Physical Therapy, vol. 28, no. 1, pp. 100-107, 2016.
[17]S. Logan, M. Lobo, H. Feldner, M. Schreiber, M. MacDonald, H. Winden, T. Stoner and J. Galloway, "Power-Up", Pediatric Physical Therapy, vol. 29, no. 1, pp. 30-37, 2017.
[18]E. Verbecque, L. Vereeck and A. Hallemans, "Postural sway in children: A literature review", Gait & Posture, vol. 49, pp. 402-410, 2016.
[19]M. Schoenmakers, C. Uiterwaal, V. Gulmans, R. Gooskens and P. Helders, "Determinants of functional independence and quality of life in children with spina bifida", Clinical
Rehabilitation, vol. 19, no. 6, pp. 677-685, 2005.
[20]"Establishing Minimal Clinically Important Differences for Scores on the Pediatric Evaluation of Disability Inventory for Inpatient Rehabilitation", Physical Therapy, 2003.
[21]J. Varni, M. Seid and P. Kurtin, "PedsQL™ 4.0: Reliability and Validity of the Pediatric Quality of Life Inventory™ Version 4.0 Generic Core Scales in Healthy and Patient Populations", Medical Care, vol. 39, no. 8, pp. 800-812, 2001.
[22]R. Johansson, M. Magnusson and M. Akesson, "Identification of human postural dynamics", IEEE Transactions on Biomedical Engineering, vol. 35, no. 10, pp. 858-869, 1988.
[23]A. Ishida and S. Miyazaki, "Maximum Likelihood Identification of a Posture Control System", IEEE Transactions on Biomedical Engineering, vol. -34, no. 1, pp. 1-5, 1987.
[24]"Interpreting Change Scores of Tests and Measures Used in Physical Therapy", Physical
Therapy, 2006.
[25]M. Hilliard, J. Lawrence, A. Modi, A. Anderson, T. Crume, L. Dolan, A. Merchant, J. Yi-Frazier and K. Hood, "Identification of Minimal Clinically Important Difference Scores of the PedsQL in Children, Adolescents, and Young Adults With Type 1 and Type 2 Diabetes", Diabetes Care, vol. 36, no. 7, pp. 1891-1897, 2013.
[26] Rep Rap Guru. (2018). Resources. [online] Available at https://reprapguru.com/pages/resources [Accessed 26 Jul. 2018].
P a g e | 49
VITA
Education University of North Florida, Jacksonville, FL College of Computing, Engineering & Construction, ABET Accredited Master of Science, Electrical Engineering Expected Graduation August 2018 Bachelor of Science, Electrical Engineering Graduated April 2016
Publications Mary Lundy, Ayshka Rodriguez, Juan Aceros, “Engineering, Physical Therapy and the Community: A Service Learning Course,” 40th Eng. in Med. and Biol. Conf., July (2018) –Under Review Lundy M, Rodriguez-Velez A, Aceros J. Modified Ride-On Toy Cars With Proportional Joysticks For Children With Multiple Complex Disabilities: Technical Report. Submitted to Pediatric Physical Therapy. Under review with revisions requested.
Poster Presentations Rodriguez A, Lundy M, Aceros L, St. Germain E, Kreidl, O. Functional activity monitoring through embedded sensors in a modified ride on toy car. Presented at RESNA 2017 Annual
Conference: AT Innovations Across the Lifespan in New Orleans June 26-30, 2017. Rodriguez A, Emord N, Aceros J, Lundy M. Early-Childhood Exploration and Cognitive Development. Presented at the 6th Annual Florida Undergraduate Research Conference,
February 2016, Tampa, FL.
Awards Albert D Ernest Caring Award Fall 2016 Outreach Medallion Award Spring 2016
![Parasitic Mobility for Pervasive Sensor Networks · multimodal wireless sensor nodes. ... [18], and balloon-borne modules for surveillance and proposed planetary exploration [19]](https://img.pdfslide.net/doc/110x75/5b7b876e7f8b9adb4c8ccac7/parasitic-mobility-for-pervasive-sensor-networks-multimodal-wireless-sensor.jpg)

![Parasitic Mobility for Pervasive Sensor Networks Mobility for Pervasive Sensor Networks 257 recently the Spec [11]. The Mote is currently the most popular platform for experimenting](https://img.pdfslide.net/doc/110x75/5ad94cff7f8b9ab8378e7daf/parasitic-mobility-for-pervasive-sensor-networks-mobility-for-pervasive-sensor-networks.jpg)