Embed Size (px)
Citation preview
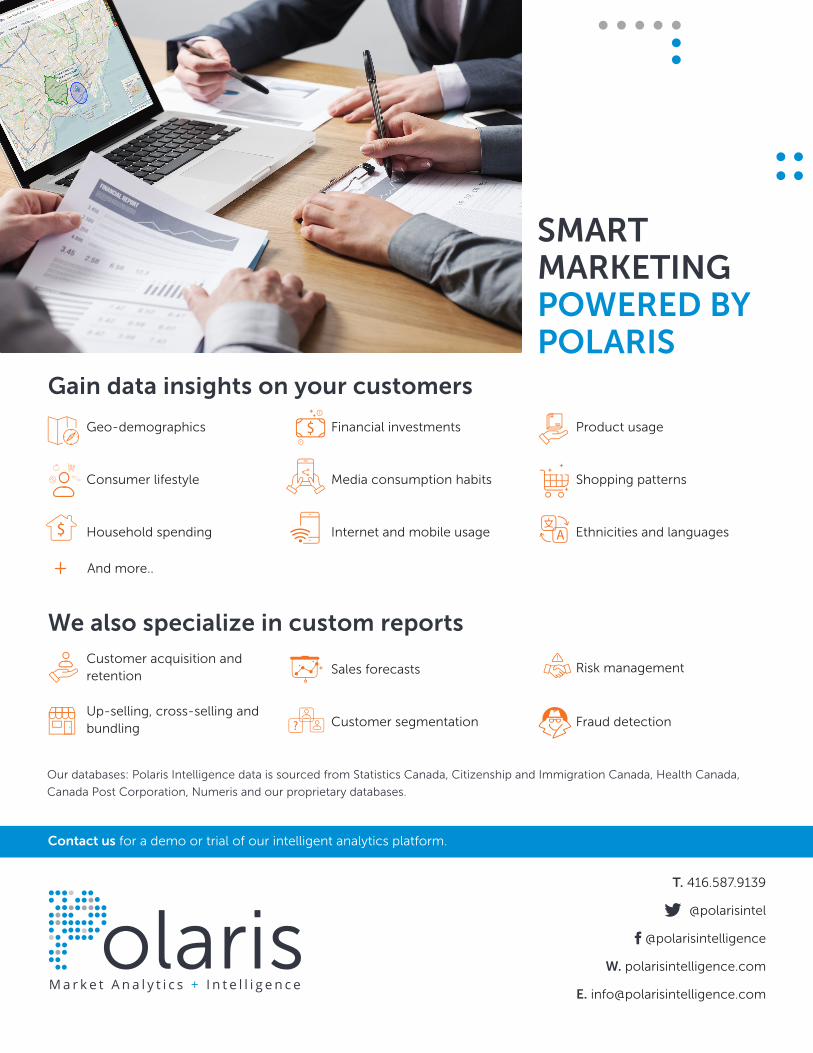
T. 416.587.9139
W. polarisintelligence.com
ONLINE ANALYTICS PLATFORM | SMART DATA | ACTIONABLE INSIGHTS
POWERINGSMARTERDECISIONS
WHAT IS POLARIS?
Knowledge is power — Polaris Intelligence helps deliver the market insights your
team needs to answer your most important questions.
Polaris is an online research solution that connects your business with strategic
consumer data, spatial and analytical intelligence.
Our dynamic reporting tools let you dive deep, slicing and dicing market reports and
consumer data and turning those insights into action with a better understanding of
your customers, market conditions, competitive activities and promotional trends.
From in-depth demographics and lifestyle reports to consumer behaviour and
product usage data, Polaris empowers you to tap into the key insights and competitive
intelligence that help your business grow and prosper.
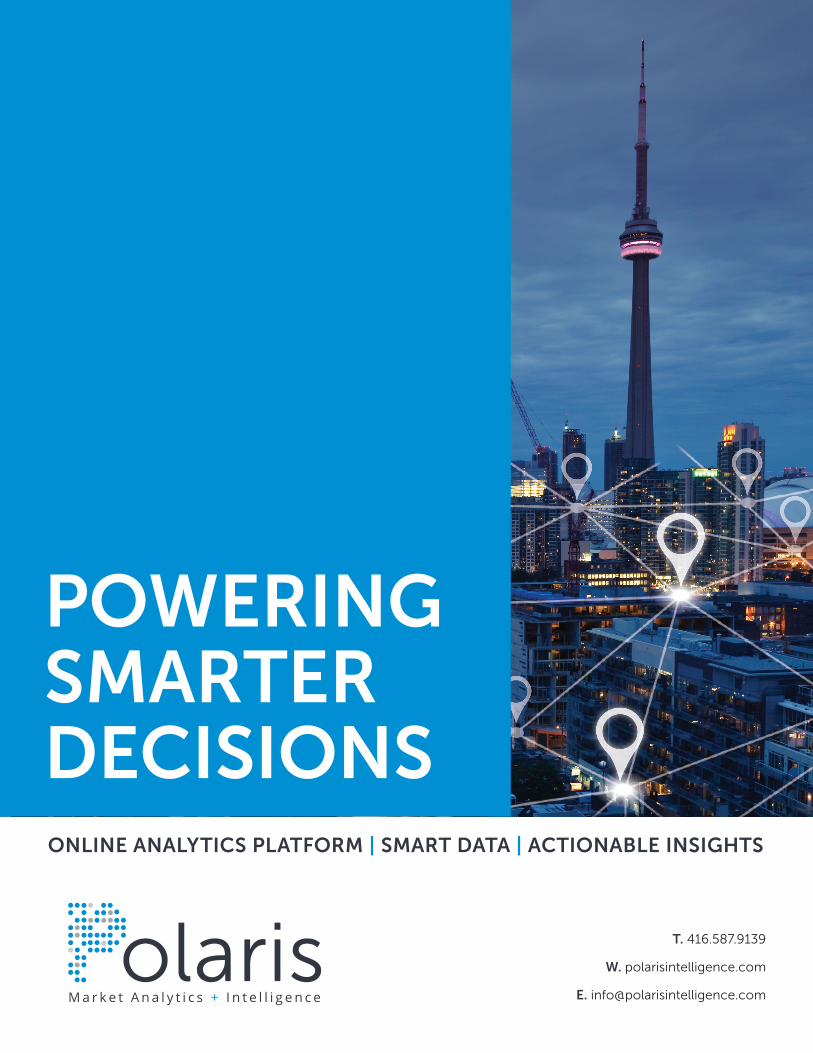
This Lifestyle Report shows consumer spending on pet supplies in a given trade area, then compares
it to average pet supplies spending in Toronto as a whole. Similar reports are available for beverage,
food, travel, finance, media consumption, telecom and much more.
Uncover consumer patterns within a given drive time or
geographic radius of your target location.
This POI map identifies competitors both inside and outside a
custom polygon trade area selected by the client.
Customer Profiling
Gain competitive insights into who your
customers are, where they live, as well
as their lifestyle, shopping patterns and
media consumption.
Trade Area Analysis
Get to know the neighbourhood with
demographics and consumer behaviour
data on your target locations. Flexible
reporting allows you to designate areas
by drive time, radius, postal code and
city, or draw your own mapping boundaries
with custom circles or polygons.
Points of Interest (POI)Analysis
Our analytics equip you with a competitive
advantage as you discover market insights
your rivals miss. Evaluate the size, distance
and drive time of nearby competitors before
you open a new location.
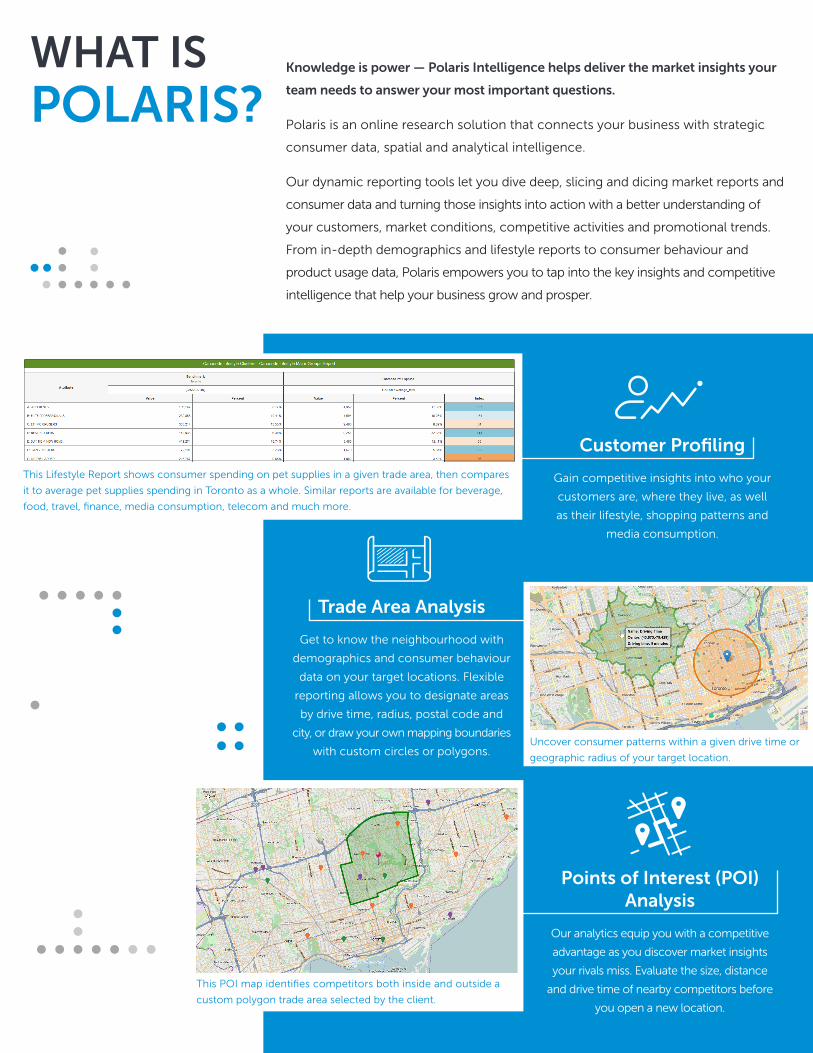
This heat map identifies the top 10% of prospects
that spend heavily on pet supplies. Similar reports are
available for beverage, food, travel, finance and more.
Targeting Top Prospects
Maximize your marketing ROI by targeting top
prospects. Polaris’ sophisticated algorithms
combine multiple variables and create a target
score for each prospect so that you can focus
your marketing efforts on the populations with
the highest potential.
Mapping
Immediately pinpoint where to find your
ideal customers with colorful heat maps
and thematic maps. Gain spatial insight
into customer patterns, demographic
profiles and business locations.
Data Mining
Analyze your data and identify trends and
segmentation. Integrate marketplace data
with your own data to find key characteristics
of your best customers.
Polaris data insights help you learn your market’s demographics, spending patterns and media habits, giving you a complete
picture of who they are, what they buy and what’s really important to them so you can build stronger connections.
Thematic map of income overlaid with a customer heat map.
This distribution of segments illustrates three distinct customer segments, allowing you to compare variables and identify outliers.
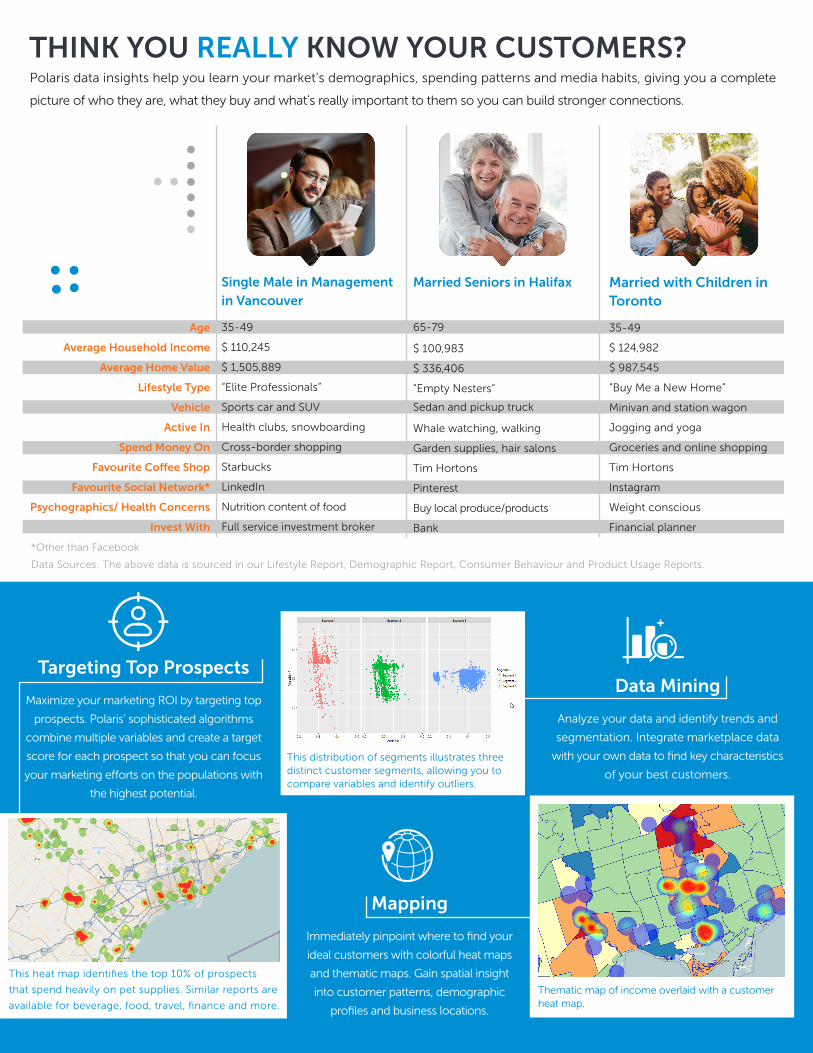
Data Sources: The above data is sourced in our Lifestyle Report, Demographic Report, Consumer Behaviour and Product Usage Reports.
*Other than Facebook
THINK YOU REALLY KNOW YOUR CUSTOMERS?
Single Male in Management
in Vancouver
35-49
$ 110,245
$ 1,505,889
“Elite Professionals”
Sports car and SUV
Health clubs, snowboarding
Cross-border shopping
Starbucks
Nutrition content of food
Full service investment broker
Age
Average Household Income
Average Home Value
Lifestyle Type
Vehicle
Active In
Spend Money On
Favourite Coffee Shop
Favourite Social Network*
Psychographics/ Health Concerns
Invest With
Married Seniors in Halifax
65-79
$ 100,983
$ 336,406
“Empty Nesters”
Sedan and pickup truck
Whale watching, walking
Garden supplies, hair salons
Tim Hortons
Buy local produce/products
Bank
Married with Children in Toronto
35-49
$ 124,982
$ 987,545
“Buy Me a New Home”
Minivan and station wagon
Jogging and yoga
Groceries and online shopping
Tim Hortons
Weight conscious
Financial planner
T. 416.587.9139
@polarisintel
@polarisintelligence
W. polarisintelligence.com
Geo-demographics
Consumer lifestyle
Household spending
Financial investments
Media consumption habits
Internet and mobile usage
Product usage
Shopping patterns
Ethnicities and languages
We also specialize in custom reports
Gain data insights on your customers
Customer acquisition and retention
Up-selling, cross-selling and bundling
Sales forecasts
Customer segmentation
Risk management
Fraud detection
Contact us for a demo or trial of our intelligent analytics platform.
And more..
SMART MARKETING POWERED BY POLARIS
?
Our databases: Polaris Intelligence data is sourced from Statistics Canada, Citizenship and Immigration Canada, Health Canada,
Canada Post Corporation, Numeris and our proprietary databases.