Embed Size (px)
Citation preview
1
Index
2
Page
3
4 - 12
13
14 - 15
16
17 - 24
25
26 - 37
38 - 55
• Investment case overview
• Tongaat Hulett’s sugar production and
markets
• Reducing the cost of sugar production
• Animal feeds, Electricity and Ethanol
• Socio-economic impact of the sugar industry
• Growing starch and glucose
• Momentum in land development
• Supporting sugar production data
• Financial information to accompany the
Interim Results Announcement for the six
months ended 30 September 2015
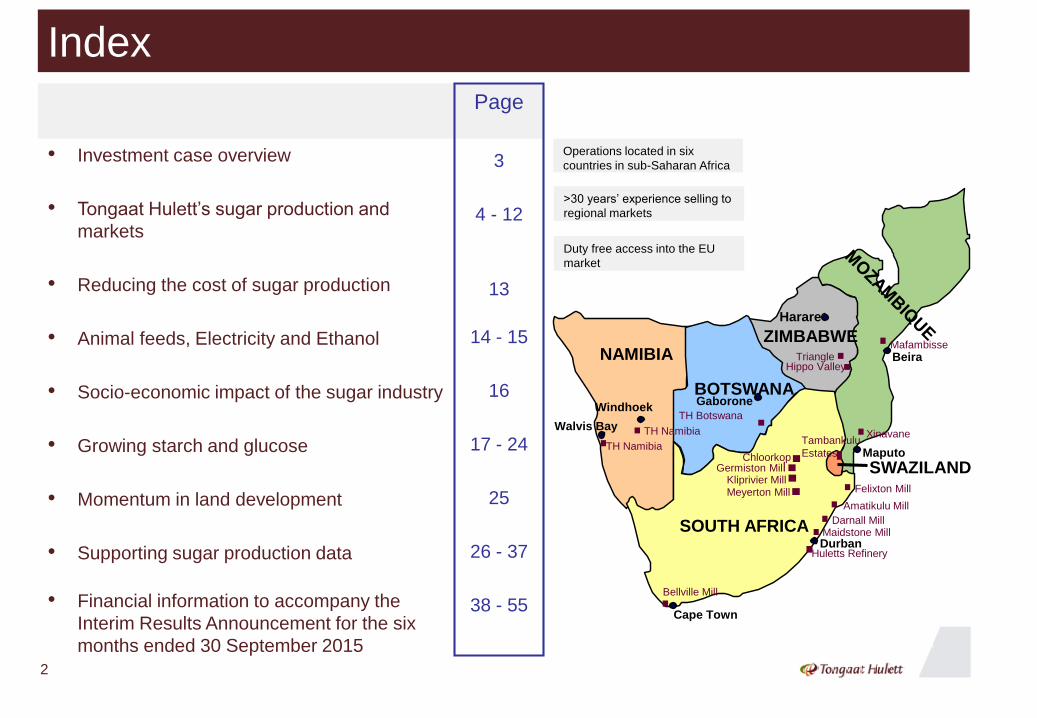
Operations located in six
countries in sub-Saharan Africa
>30 years’ experience selling to
regional markets
Duty free access into the EU
market
Darnall Mill
ZIMBABWE
SWAZILANDFelixton Mill
Amatikulu Mill
Maidstone Mill
Xinavane
Mafambisse
Hippo ValleyTriangle
Tambankulu
Estates
Bellville Mill
TH Namibia
BOTSWANA
TH Botswana
NAMIBIA
Huletts Refinery
SOUTH AFRICA
Kliprivier MillMeyerton Mill
Germiston MillChloorkop
Harare
Durban
Cape Town
Maputo
Beira
Walvis Bay
GaboroneWindhoek
TH Namibia
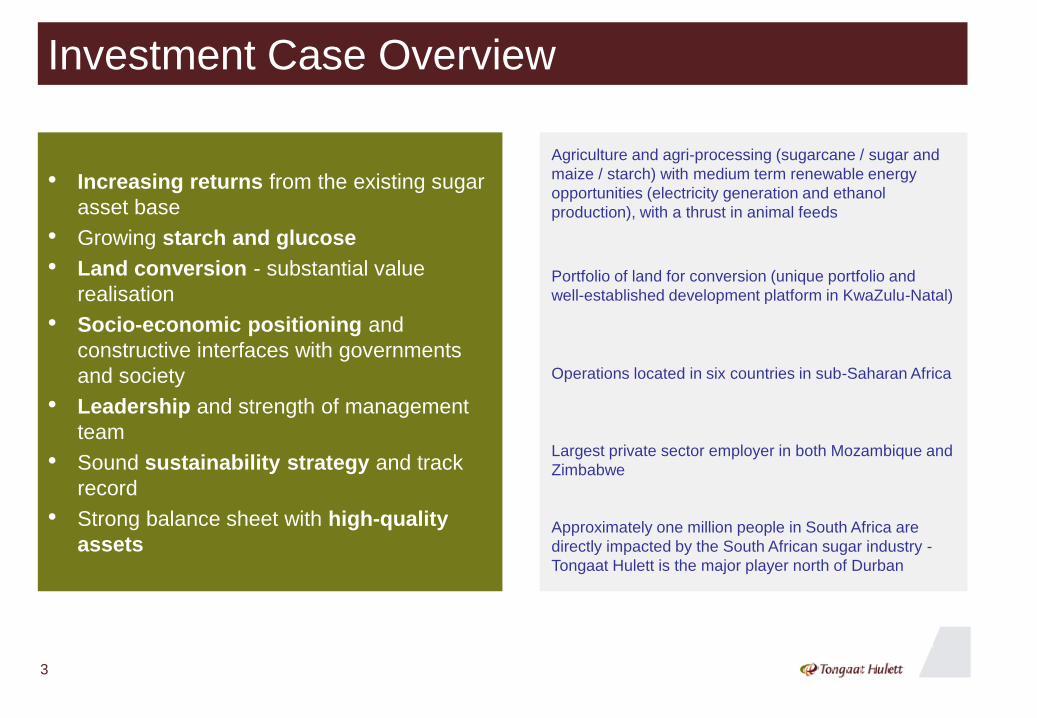
Investment Case Overview
3
• Increasing returns from the existing sugar
asset base
• Growing starch and glucose
• Land conversion - substantial value
realisation
• Socio-economic positioning and
constructive interfaces with governments
and society
• Leadership and strength of management
team
• Sound sustainability strategy and track
record
• Strong balance sheet with high-quality
assets
Agriculture and agri-processing (sugarcane / sugar and
maize / starch) with medium term renewable energy
opportunities (electricity generation and ethanol
production), with a thrust in animal feeds
Portfolio of land for conversion (unique portfolio and
well-established development platform in KwaZulu-Natal)
Operations located in six countries in sub-Saharan Africa
Largest private sector employer in both Mozambique and
Zimbabwe
Approximately one million people in South Africa are
directly impacted by the South African sugar industry -
Tongaat Hulett is the major player north of Durban
Tongaat Hulett’s Sugar Production and Markets
4
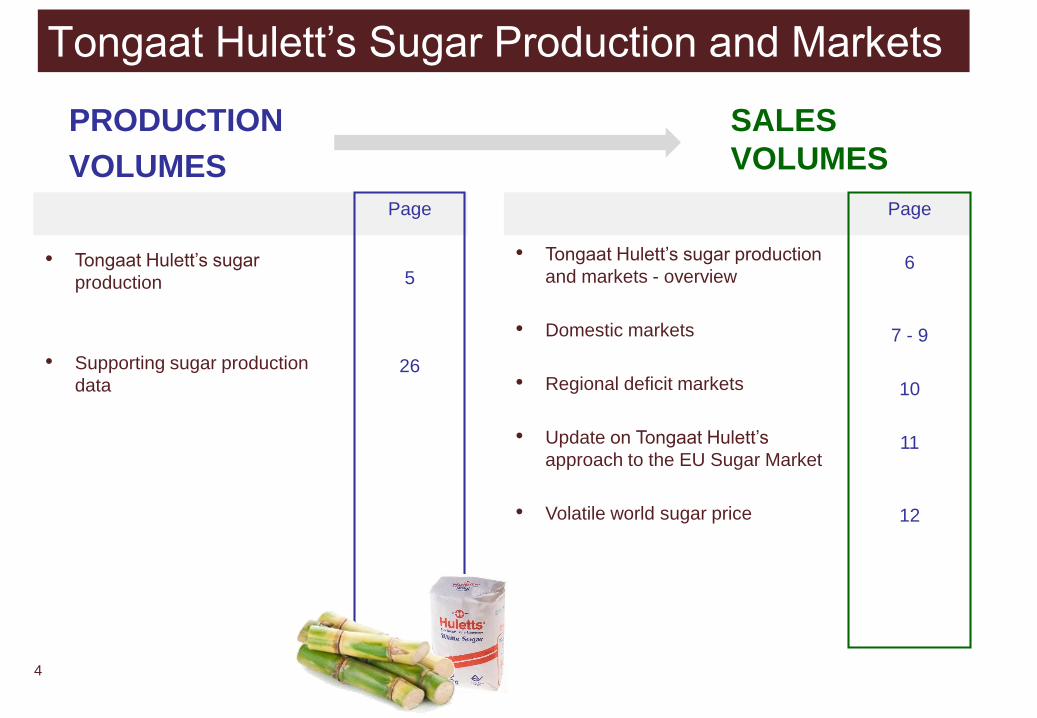
SALES
VOLUMES
PRODUCTION
VOLUMES
Page
5
26
• Tongaat Hulett’s sugar
production
• Supporting sugar production
data
• Tongaat Hulett’s sugar production
and markets - overview
• Domestic markets
• Regional deficit markets
• Update on Tongaat Hulett’s
approach to the EU Sugar Market
• Volatile world sugar price
Page
6
7 - 9
10
11
12
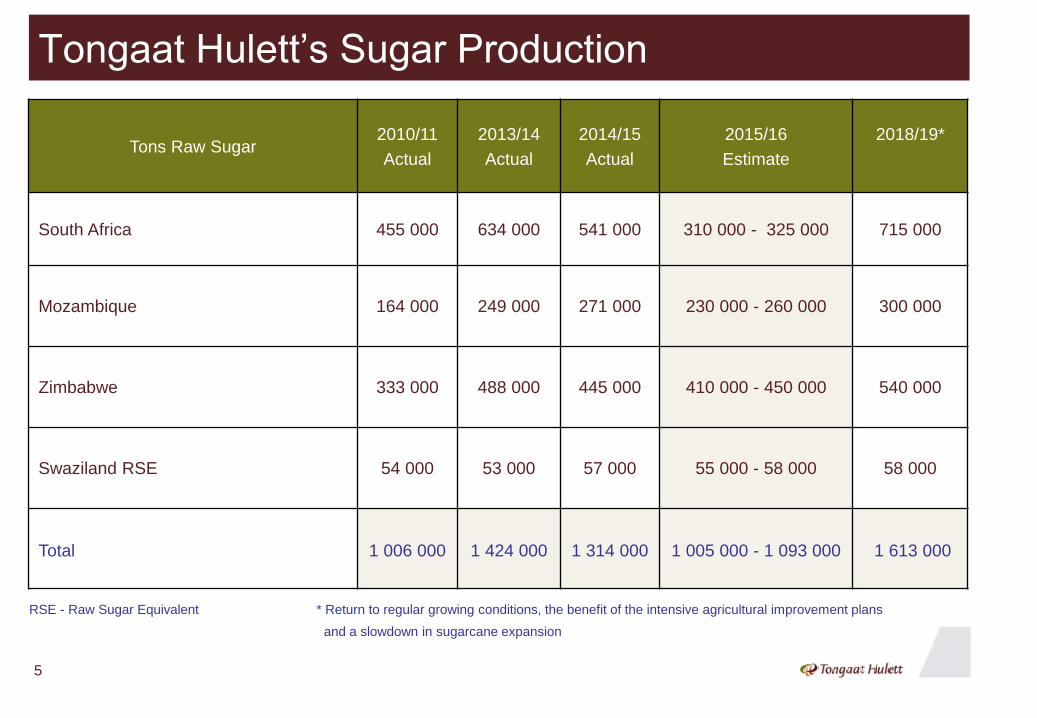
Tons Raw Sugar2010/11
Actual
2013/14
Actual
2014/15
Actual
2015/16
Estimate
2018/19*
South Africa 455 000 634 000 541 000 310 000 - 325 000 715 000
Mozambique 164 000 249 000 271 000 230 000 - 260 000 300 000
Zimbabwe 333 000 488 000 445 000 410 000 - 450 000 540 000
Swaziland RSE 54 000 53 000 57 000 55 000 - 58 000 58 000
Total 1 006 000 1 424 000 1 314 000 1 005 000 - 1 093 000 1 613 000
RSE - Raw Sugar Equivalent * Return to regular growing conditions, the benefit of the intensive agricultural improvement plans
and a slowdown in sugarcane expansion
Tongaat Hulett’s Sugar Production
5
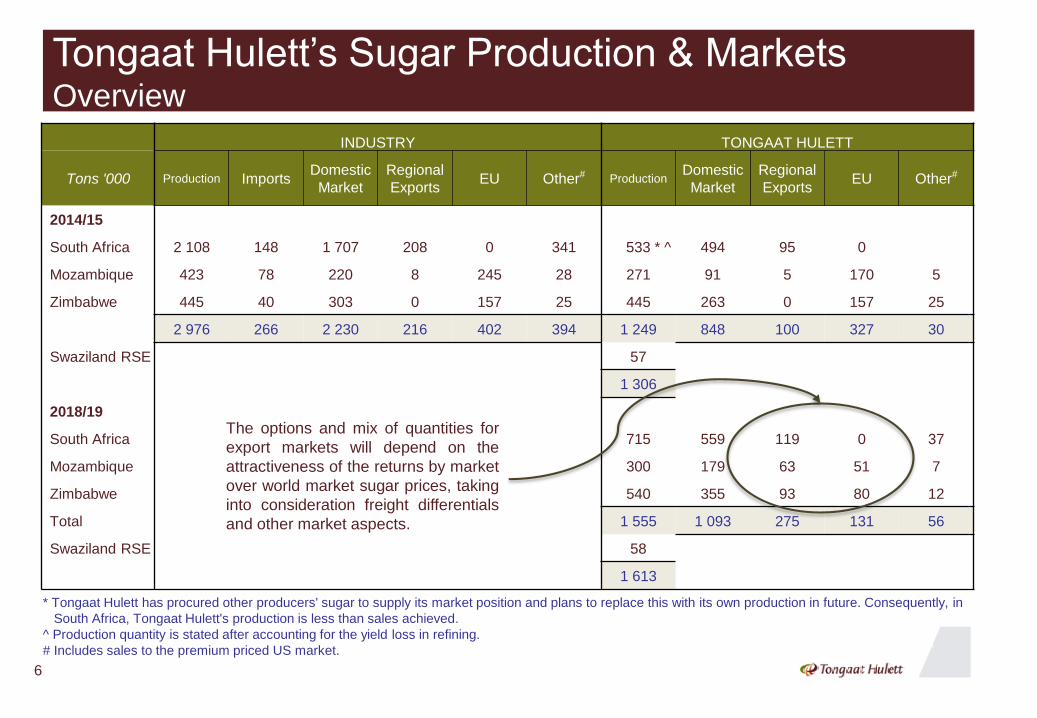
Tongaat Hulett’s Sugar Production & Markets Overview
INDUSTRY TONGAAT HULETT
Tons '000 Production ImportsDomestic
Market
Regional
ExportsEU Other# Production
Domestic
Market
Regional
ExportsEU Other#
2014/15
South Africa 2 108 148 1 707 208 0 341 533 * ^ 494 95 0
Mozambique 423 78 220 8 245 28 271 91 5 170 5
Zimbabwe 445 40 303 0 157 25 445 263 0 157 25
2 976 266 2 230 216 402 394 1 249 848 100 327 30
Swaziland RSE 57
1 306
2018/19
South Africa 715 559 119 0 37
Mozambique 300 179 63 51 7
Zimbabwe 540 355 93 80 12
Total 1 555 1 093 275 131 56
Swaziland RSE 58
1 613
* Tongaat Hulett has procured other producers' sugar to supply its market position and plans to replace this with its own production in future. Consequently, in
South Africa, Tongaat Hulett's production is less than sales achieved.
^ Production quantity is stated after accounting for the yield loss in refining.
# Includes sales to the premium priced US market.
The options and mix of quantities for
export markets will depend on the
attractiveness of the returns by market
over world market sugar prices, taking
into consideration freight differentials
and other market aspects.
6
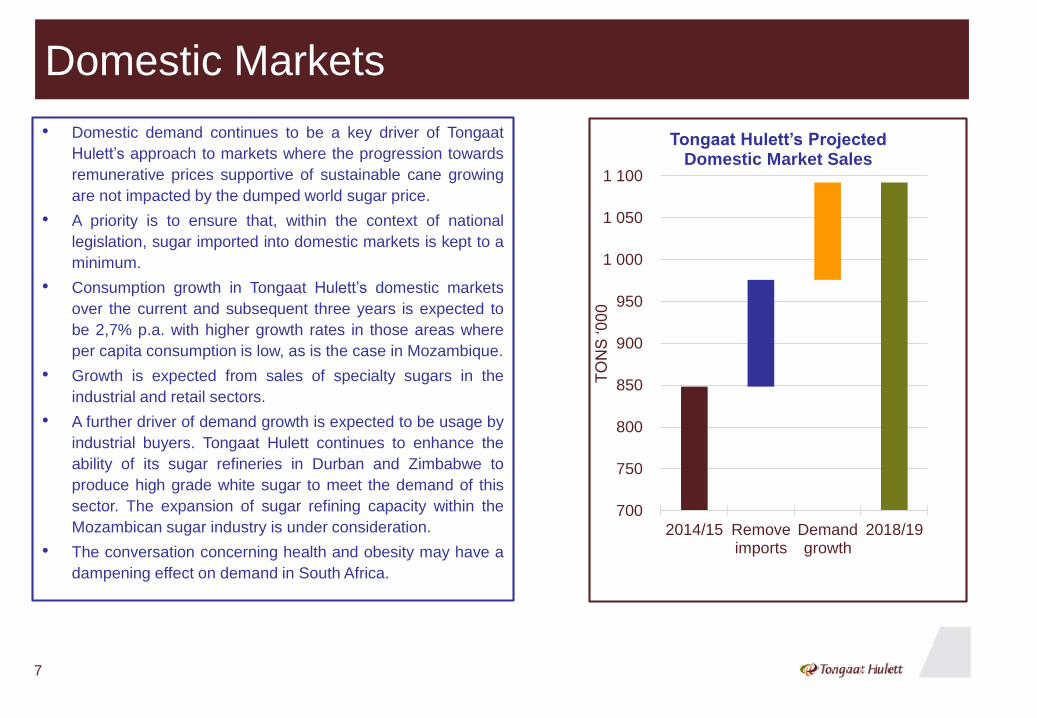
Domestic Markets
• Domestic demand continues to be a key driver of Tongaat
Hulett’s approach to markets where the progression towards
remunerative prices supportive of sustainable cane growing
are not impacted by the dumped world sugar price.
• A priority is to ensure that, within the context of national
legislation, sugar imported into domestic markets is kept to a
minimum.
• Consumption growth in Tongaat Hulett’s domestic markets
over the current and subsequent three years is expected to
be 2,7% p.a. with higher growth rates in those areas where
per capita consumption is low, as is the case in Mozambique.
• Growth is expected from sales of specialty sugars in the
industrial and retail sectors.
• A further driver of demand growth is expected to be usage by
industrial buyers. Tongaat Hulett continues to enhance the
ability of its sugar refineries in Durban and Zimbabwe to
produce high grade white sugar to meet the demand of this
sector. The expansion of sugar refining capacity within the
Mozambican sugar industry is under consideration.
• The conversation concerning health and obesity may have a
dampening effect on demand in South Africa.
700
750
800
850
900
950
1 000
1 050
1 100
2014/15 Removeimports
Demandgrowth
2018/19
TO
NS
‘00
0
Tongaat Hulett’s ProjectedDomestic Market Sales
7
Supporting Domestic Sugar Markets
• In the face of dumped world sugar prices, local
sugar industries (farmers and processors)
worldwide struggle to remain viable without
some form of government assistance.
• Assistance comprises direct payment support as
in the EU and India, indirect payment support as
in Brazil, and supportive internal prices in many
sugar producing countries including US and
Thailand.
• Support in South Africa, Mozambique and
Zimbabwe is provided by tariff and non-tariff
barriers that allow internal sugar prices to rise to
a level supportive of sustainable rural
communities.
In Mozambique new, higher reference prices
were implemented in August.
In Zimbabwe an import permit is required for
all imported sugar.
• In South Africa direct support for farmers is
emerging with recent announcements of drought
support and the provision of grant funding for
cane expansion by small scale farmers.
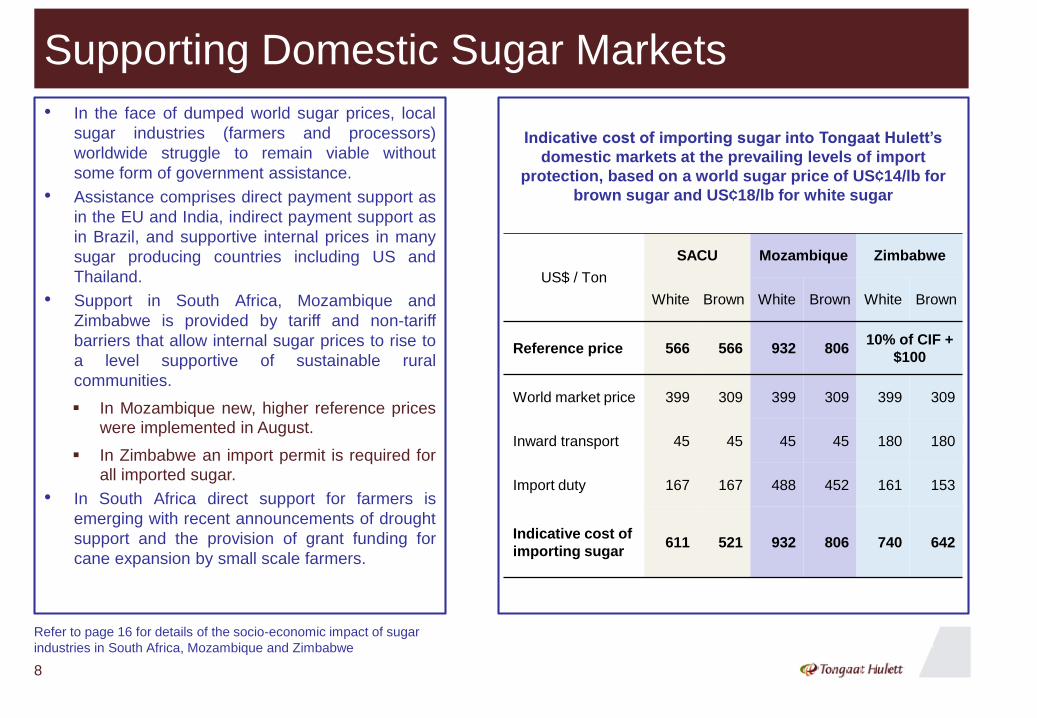
Indicative cost of importing sugar into Tongaat Hulett’s
domestic markets at the prevailing levels of import
protection, based on a world sugar price of US¢14/lb for
brown sugar and US¢18/lb for white sugar
US$ / Ton
SACU Mozambique Zimbabwe
White Brown White Brown White Brown
Reference price 566 566 932 806 10% of CIF +
$100
World market price 399 309 399 309 399 309
Inward transport 45 45 45 45 180 180
Import duty 167 167 488 452 161 153
Indicative cost of
importing sugar611 521 932 806 740 642
Refer to page 16 for details of the socio-economic impact of sugar
industries in South Africa, Mozambique and Zimbabwe
8
9
Brand StrengthLeading Sugar Brands in South Africa, Zimbabwe, Botswana and Namibia
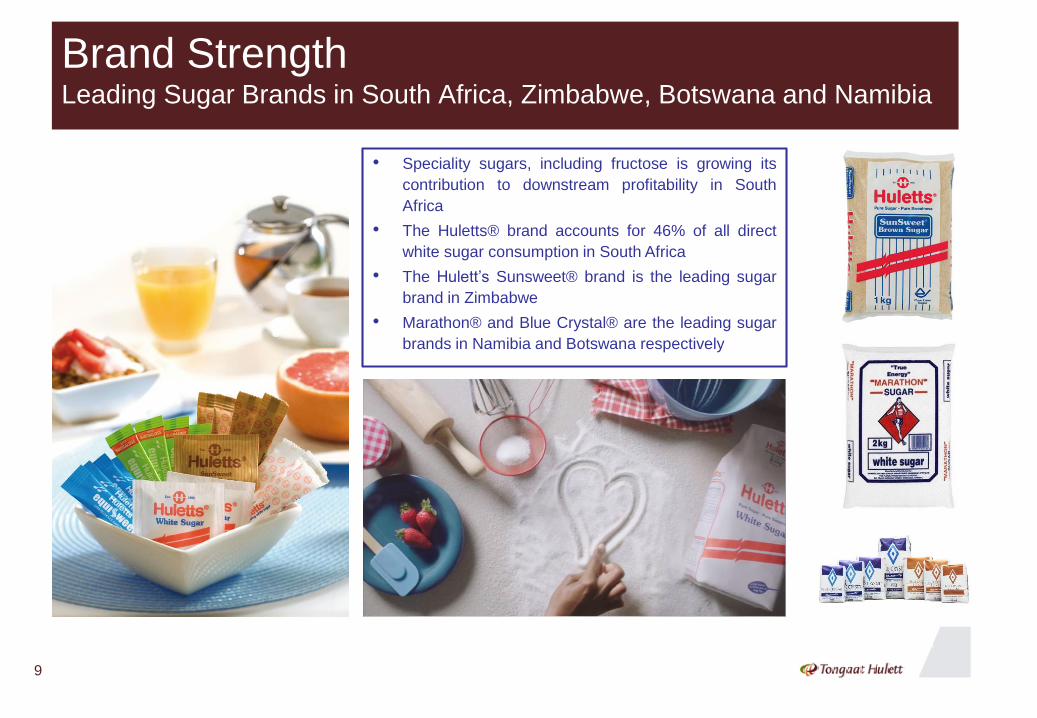
• Speciality sugars, including fructose is growing its
contribution to downstream profitability in South
Africa
• The Huletts® brand accounts for 46% of all direct
white sugar consumption in South Africa
• The Hulett’s Sunsweet® brand is the leading sugar
brand in Zimbabwe
• Marathon® and Blue Crystal® are the leading sugar
brands in Namibia and Botswana respectively
Regional Deficit Markets
10
• The countries of East and South Eastern Africa that either do not produce
sugar or produce less than domestic demand, require some 1,6 million tons of
imported sugar per annum, which has been supplied by both the regions’
producers and also by sugar from India, Thailand, Saudi Arabia, Dubai and
Brazil.
• Prices in these markets trade at a premium to world market prices for sugar
and move in tandem with changes in those prices.
• Tongaat Hulett has supplied on average over the past number of years
100 000 tons of high grade white sugar per annum into the region,
predominantly to industrial users, and the Tongaat Hulett name is already well
established in the regional sugar markets.
• In the deficit markets of East and South Eastern Africa per capita annual sugar
consumption is markedly lower (7 kg - 12 kg) than in the SA Customs Union.
• With the regions’ population growth expected to be in the region of 2% - 3% per
annum this is the minimum level of demand growth that should be seen over
the coming years. Expectations of greater demand growth will depend on
economic growth rates.
• Tongaat Hulett’s Mafambisse and Xinavane sugar mills and the Huletts refinery
in Durban are close to ports providing efficient access to regional markets.
• Zimbabwe is well located for supplying regional deficit markets, benefiting from
being a member of the COMESA trade bloc.
• Most deficit markets of East and South Eastern Africa aspire to establish their
own sugar industries or expand the current level of sugar production over time.
Typically the journey to establish new cane growing areas and invest in the
associated milling capacity and other infrastructure takes in excess of 5 years.
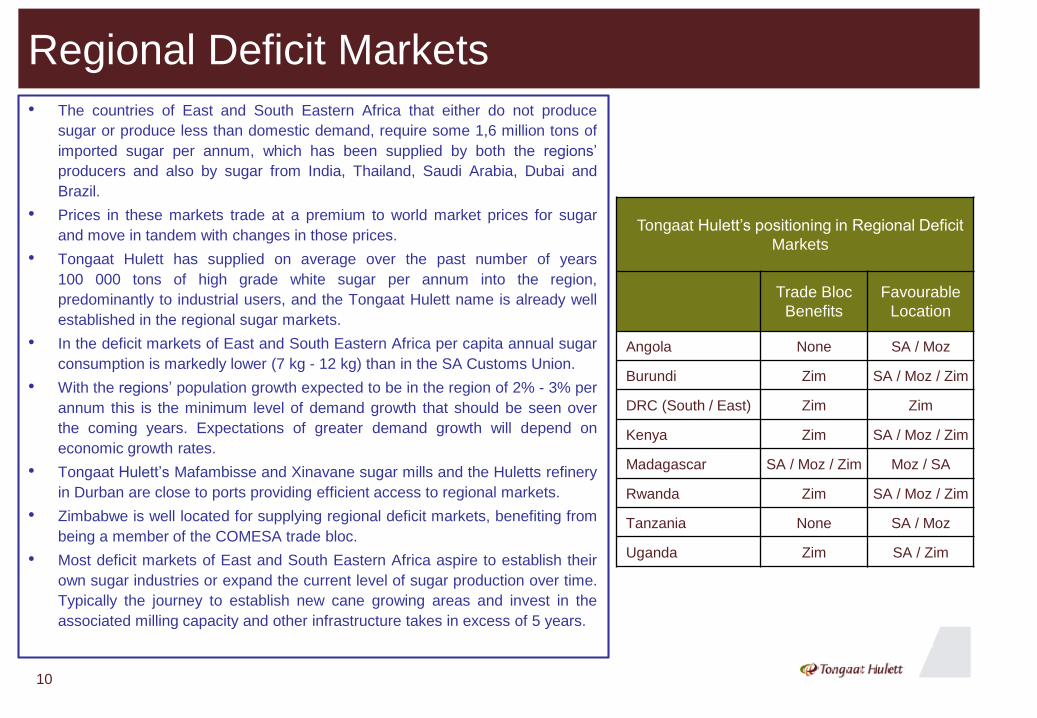
Tongaat Hulett’s positioning in Regional Deficit
Markets
Trade Bloc
Benefits
Favourable
Location
Angola None SA / Moz
Burundi Zim SA / Moz / Zim
DRC (South / East) Zim Zim
Kenya Zim SA / Moz / Zim
Madagascar SA / Moz / Zim Moz / SA
Rwanda Zim SA / Moz / Zim
Tanzania None SA / Moz
Uganda Zim SA / Zim
Update on Tongaat Hulett’s Approach to the EU Sugar Market
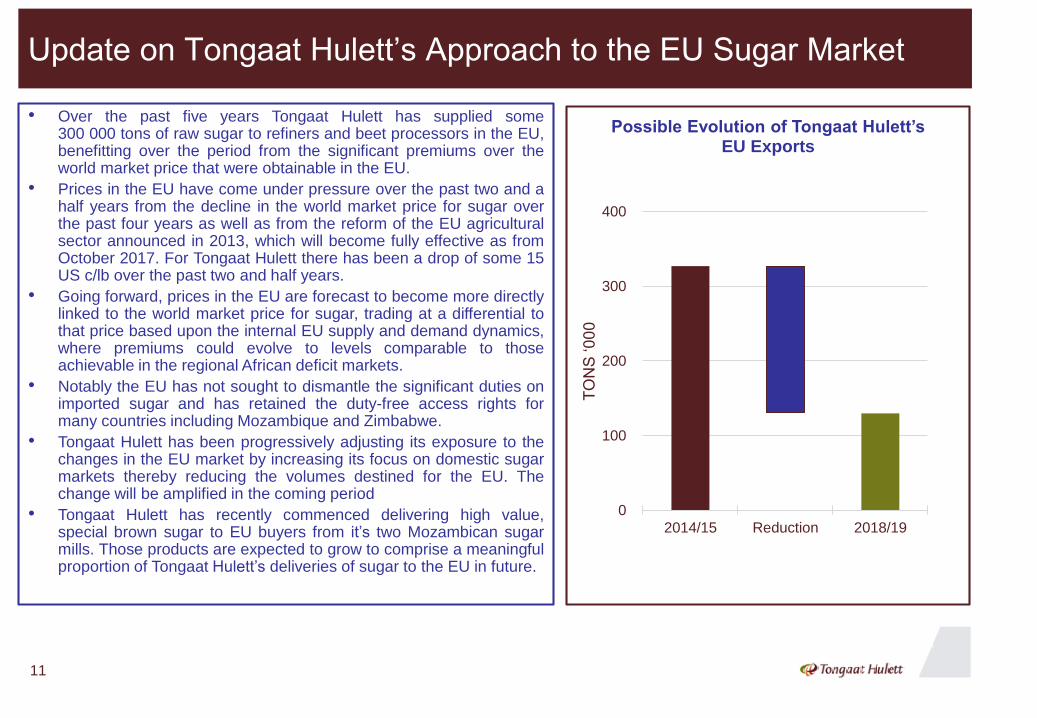
• Over the past five years Tongaat Hulett has supplied some300 000 tons of raw sugar to refiners and beet processors in the EU,benefitting over the period from the significant premiums over theworld market price that were obtainable in the EU.
• Prices in the EU have come under pressure over the past two and ahalf years from the decline in the world market price for sugar overthe past four years as well as from the reform of the EU agriculturalsector announced in 2013, which will become fully effective as fromOctober 2017. For Tongaat Hulett there has been a drop of some 15US c/lb over the past two and half years.
• Going forward, prices in the EU are forecast to become more directlylinked to the world market price for sugar, trading at a differential tothat price based upon the internal EU supply and demand dynamics,where premiums could evolve to levels comparable to thoseachievable in the regional African deficit markets.
• Notably the EU has not sought to dismantle the significant duties onimported sugar and has retained the duty-free access rights formany countries including Mozambique and Zimbabwe.
• Tongaat Hulett has been progressively adjusting its exposure to thechanges in the EU market by increasing its focus on domestic sugarmarkets thereby reducing the volumes destined for the EU. Thechange will be amplified in the coming period
• Tongaat Hulett has recently commenced delivering high value,special brown sugar to EU buyers from it’s two Mozambican sugarmills. Those products are expected to grow to comprise a meaningfulproportion of Tongaat Hulett’s deliveries of sugar to the EU in future.
0
100
200
300
400
2014/15 Reduction 2018/19
TO
NS
‘00
0
Possible Evolution of Tongaat Hulett’s EU Exports
11
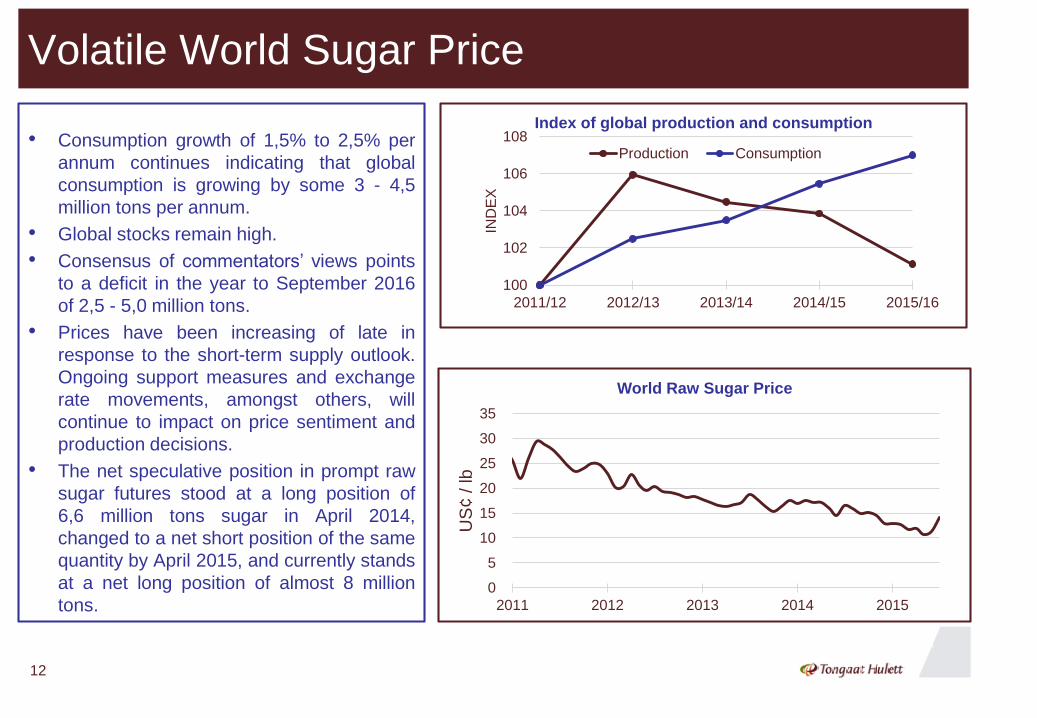
Volatile World Sugar Price
• Consumption growth of 1,5% to 2,5% per
annum continues indicating that global
consumption is growing by some 3 - 4,5
million tons per annum.
• Global stocks remain high.
• Consensus of commentators’ views points
to a deficit in the year to September 2016
of 2,5 - 5,0 million tons.
• Prices have been increasing of late in
response to the short-term supply outlook.
Ongoing support measures and exchange
rate movements, amongst others, will
continue to impact on price sentiment and
production decisions.
• The net speculative position in prompt raw
sugar futures stood at a long position of
6,6 million tons sugar in April 2014,
changed to a net short position of the same
quantity by April 2015, and currently stands
at a net long position of almost 8 million
tons.
100
102
104
106
108
2011/12 2012/13 2013/14 2014/15 2015/16
IND
EX
Index of global production and consumption
Production Consumption
0
5
10
15
20
25
30
35
2011 2012 2013 2014 2015
US
¢ / lb
World Raw Sugar Price
12
Reducing the Cost of Sugar Production
• Detailed assessment of cost by country will be presented with the year-end financial results
• The sustainable cost reductions achieved over the past two years, while having to absorb input price
increases, provided a good base for the next steps in the concerted cost reduction process in the sugar
operations
• Over the past two years effective cost reduction of R950 million in real terms achieved
• Focus on further reductions from the R5,2 billion cost base going forward
13
14
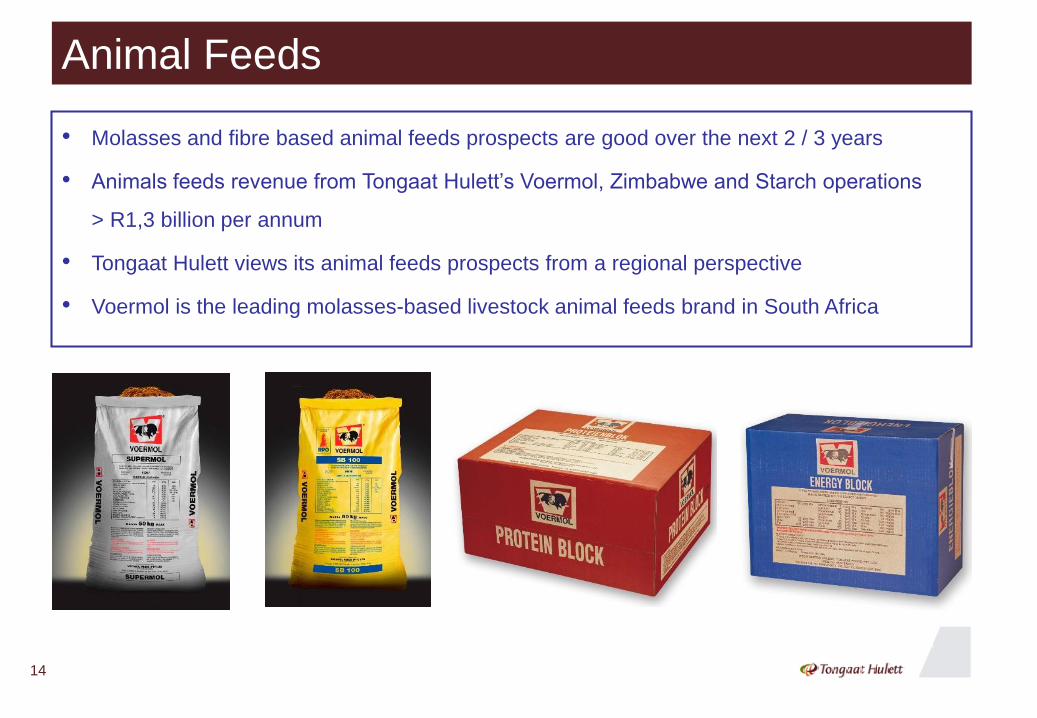
Animal Feeds
• Molasses and fibre based animal feeds prospects are good over the next 2 / 3 years
• Animals feeds revenue from Tongaat Hulett’s Voermol, Zimbabwe and Starch operations
> R1,3 billion per annum
• Tongaat Hulett views its animal feeds prospects from a regional perspective
• Voermol is the leading molasses-based livestock animal feeds brand in South Africa
15
Electricity and Ethanol
Electricity
• First round Request for Bid (RFB) for Co-Generation (June 2015) designed for low tariff small, quick
implementation projects - not suitable for Tongaat Hulett
• RFB for large scale Co-Generation projects promised for 2016
Objective: - Create value for fibre components of sugarcane
- Improved sustainability of cane growing
- Fill mills with new cane development and rural job creation
Ethanol
• Cabinet request for additional economic evaluation on Biofuels
• Policy paper to be re-submitted to cabinet (2016)
Objective: - Expand current portfolio to include ethanol
- Reduce exports and exposure to volatile world market sugar price
- Improve capacity utilisation through longer season
- Priority to established industry
- Further cane developments and rural job creation
16
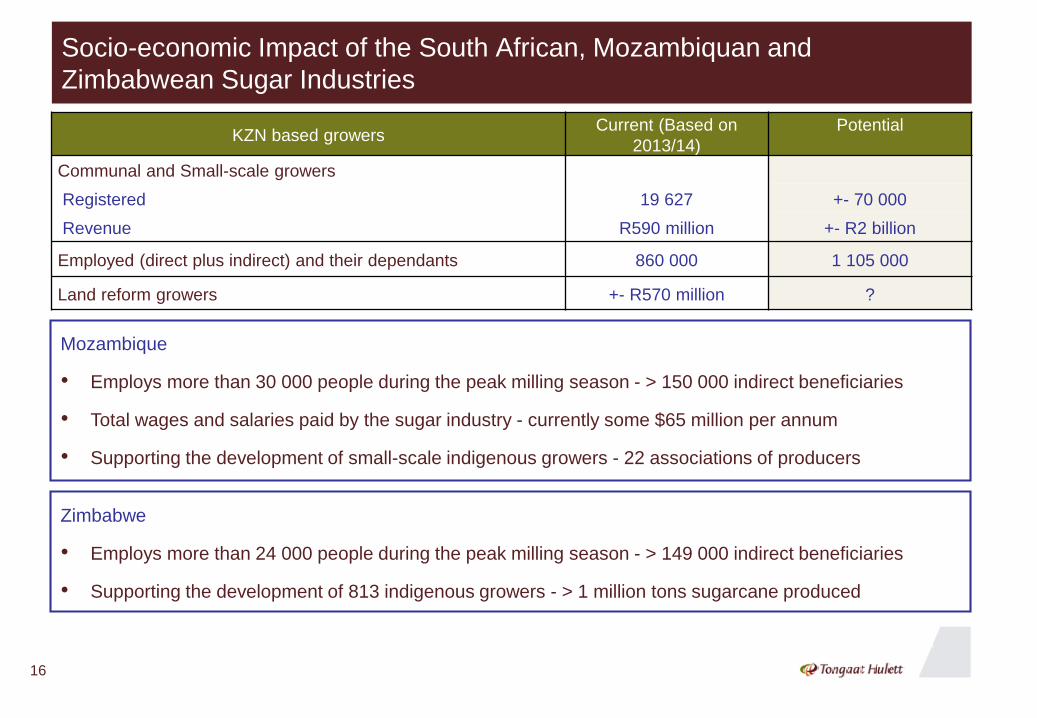
Socio-economic Impact of the South African, Mozambiquan and
Zimbabwean Sugar Industries
Zimbabwe
• Employs more than 24 000 people during the peak milling season - > 149 000 indirect beneficiaries
• Supporting the development of 813 indigenous growers - > 1 million tons sugarcane produced
KZN based growersCurrent (Based on
2013/14)
Potential
Communal and Small-scale growers
Registered 19 627 +- 70 000
Revenue R590 million +- R2 billion
Employed (direct plus indirect) and their dependants 860 000 1 105 000
Land reform growers +- R570 million ?
Mozambique
• Employs more than 30 000 people during the peak milling season - > 150 000 indirect beneficiaries
• Total wages and salaries paid by the sugar industry - currently some $65 million per annum
• Supporting the development of small-scale indigenous growers - 22 associations of producers
17
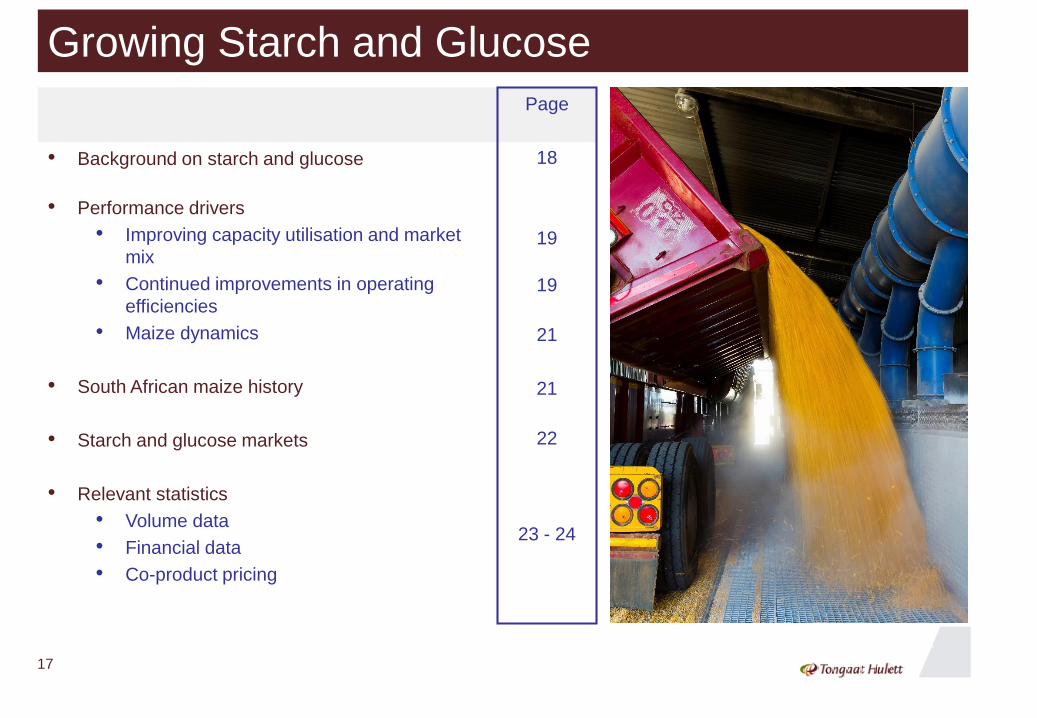
Growing Starch and Glucose
Page
18
19
19
21
21
22
23 - 24
• Background on starch and glucose
• Performance drivers
• Improving capacity utilisation and market
mix
• Continued improvements in operating
efficiencies
• Maize dynamics
• South African maize history
• Starch and glucose markets
• Relevant statistics
• Volume data
• Financial data
• Co-product pricing
18
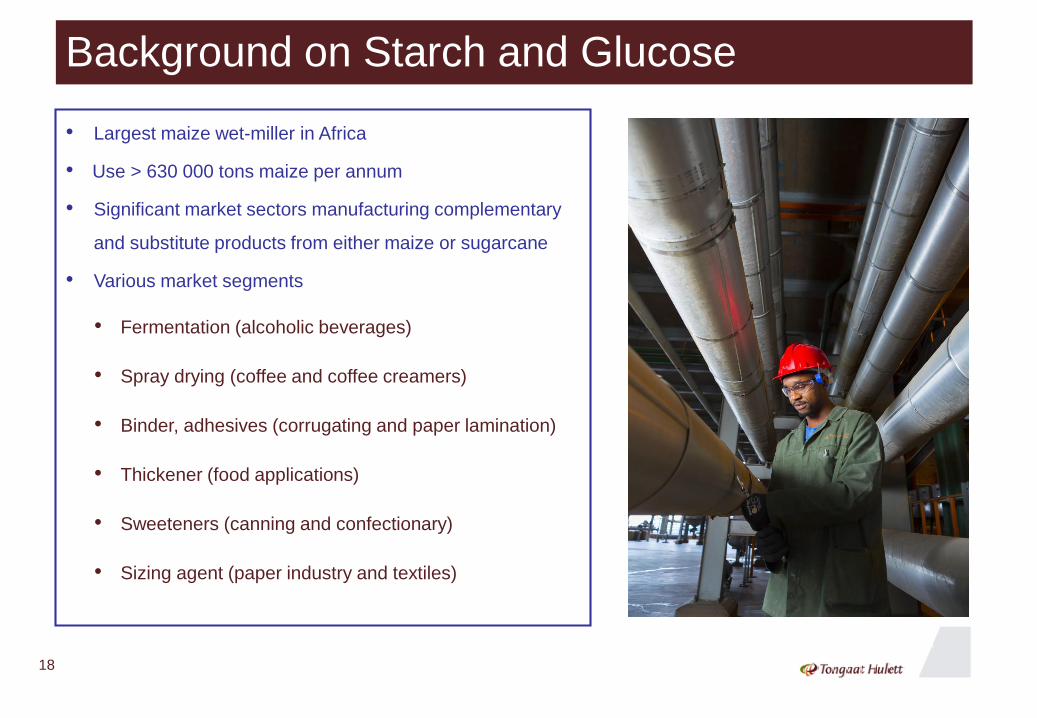
Background on Starch and Glucose
• Largest maize wet-miller in Africa
• Use > 630 000 tons maize per annum
• Significant market sectors manufacturing complementary
and substitute products from either maize or sugarcane
• Various market segments
• Fermentation (alcoholic beverages)
• Spray drying (coffee and coffee creamers)
• Binder, adhesives (corrugating and paper lamination)
• Thickener (food applications)
• Sweeteners (canning and confectionary)
• Sizing agent (paper industry and textiles)
19
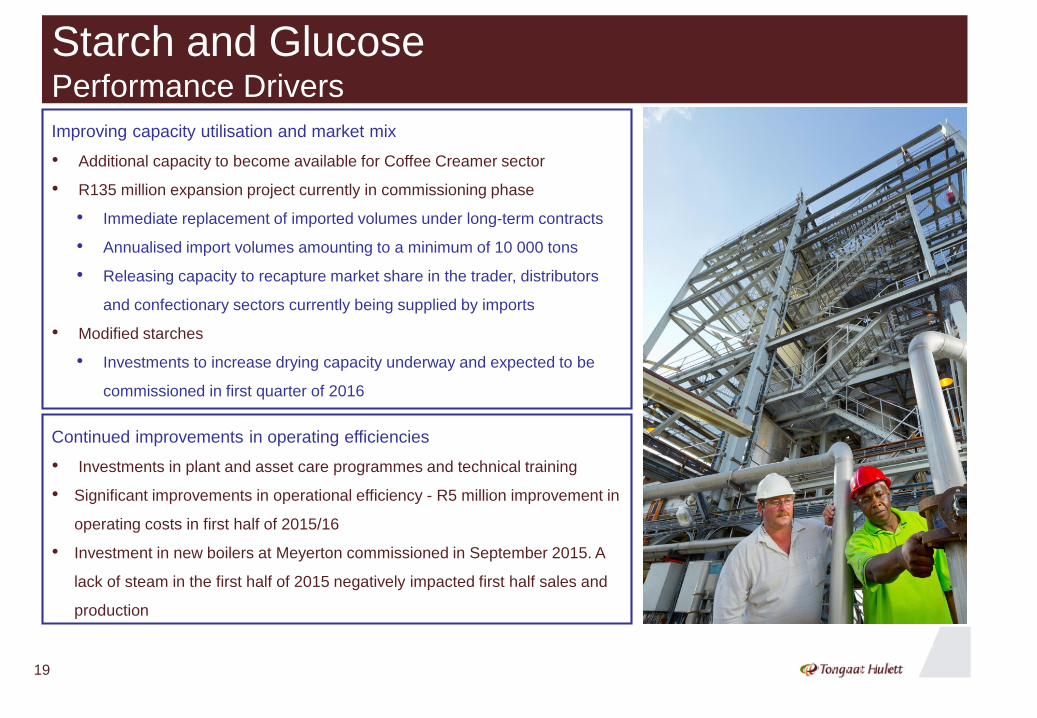
Starch and GlucosePerformance Drivers
Improving capacity utilisation and market mix
• Additional capacity to become available for Coffee Creamer sector
• R135 million expansion project currently in commissioning phase
• Immediate replacement of imported volumes under long-term contracts
• Annualised import volumes amounting to a minimum of 10 000 tons
• Releasing capacity to recapture market share in the trader, distributors
and confectionary sectors currently being supplied by imports
• Modified starches
• Investments to increase drying capacity underway and expected to be
commissioned in first quarter of 2016
Continued improvements in operating efficiencies
• Investments in plant and asset care programmes and technical training
• Significant improvements in operational efficiency - R5 million improvement in
operating costs in first half of 2015/16
• Investment in new boilers at Meyerton commissioned in September 2015. A
lack of steam in the first half of 2015 negatively impacted first half sales and
production
20
Starch and GlucosePerformance Drivers
Maize dynamics (2014/15 – maize season)
• Carry out crop from 2014/15 reduced impact of the lower 2015/16 crop of
9,94 million tons (2014/15: 14,25 million tons)
• 85% of remaining maize requirements priced for 2015/16
• Margins slightly below equivalent prior year period
• Co-product benefit offsetting some of high price impact
Maize dynamics (2015/16 – maize season)
• Lack of rain and forecasts for a strong El Nino event in South Africa
• Rain required to facilitate planting - which can continue in some areas into
early January
• Proportion of SA maize crop under irrigation more than doubled since 2001
to 240 000 hectares. Typical yields of 10 tons per hectare
• Margins earned on approx. 55% of 2016/17 sales volumes will be influenced
by the extent to which local maize prices trade closer to import parity
21
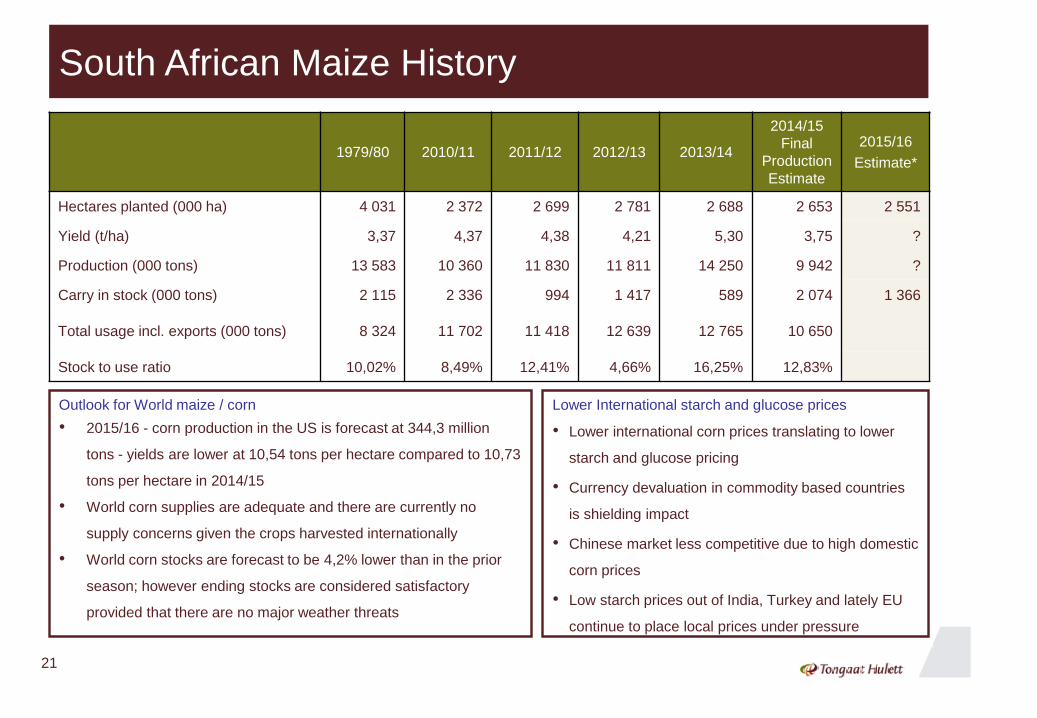
South African Maize History
1979/80 2010/11 2011/12 2012/13 2013/14
2014/15
Final
Production
Estimate
2015/16
Estimate*
Hectares planted (000 ha) 4 031 2 372 2 699 2 781 2 688 2 653 2 551
Yield (t/ha) 3,37 4,37 4,38 4,21 5,30 3,75 ?
Production (000 tons) 13 583 10 360 11 830 11 811 14 250 9 942 ?
Carry in stock (000 tons) 2 115 2 336 994 1 417 589 2 074 1 366
Total usage incl. exports (000 tons) 8 324 11 702 11 418 12 639 12 765 10 650
Stock to use ratio 10,02% 8,49% 12,41% 4,66% 16,25% 12,83%
Outlook for World maize / corn
• 2015/16 - corn production in the US is forecast at 344,3 million
tons - yields are lower at 10,54 tons per hectare compared to 10,73
tons per hectare in 2014/15
• World corn supplies are adequate and there are currently no
supply concerns given the crops harvested internationally
• World corn stocks are forecast to be 4,2% lower than in the prior
season; however ending stocks are considered satisfactory
provided that there are no major weather threats
Lower International starch and glucose prices
• Lower international corn prices translating to lower
starch and glucose pricing
• Currency devaluation in commodity based countries
is shielding impact
• Chinese market less competitive due to high domestic
corn prices
• Low starch prices out of India, Turkey and lately EU
continue to place local prices under pressure
22
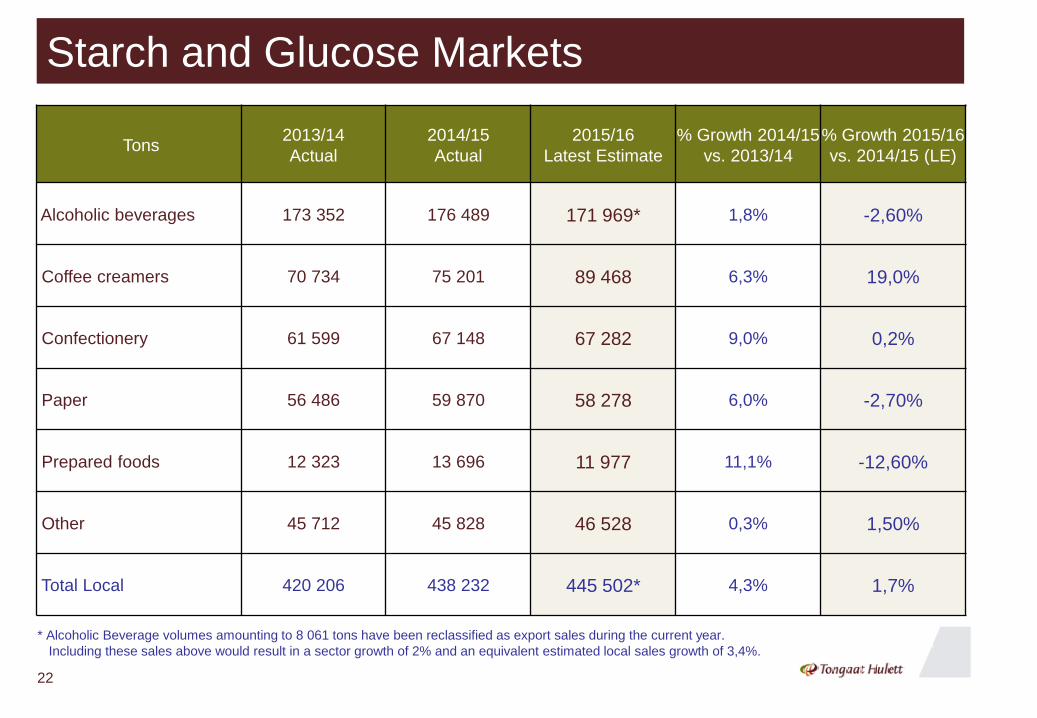
Starch and Glucose Markets
Tons2013/14
Actual
2014/15
Actual
2015/16
Latest Estimate
% Growth 2014/15
vs. 2013/14
% Growth 2015/16
vs. 2014/15 (LE)
Alcoholic beverages 173 352 176 489 171 969* 1,8% -2,60%
Coffee creamers 70 734 75 201 89 468 6,3% 19,0%
Confectionery 61 599 67 148 67 282 9,0% 0,2%
Paper 56 486 59 870 58 278 6,0% -2,70%
Prepared foods 12 323 13 696 11 977 11,1% -12,60%
Other 45 712 45 828 46 528 0,3% 1,50%
Total Local 420 206 438 232 445 502* 4,3% 1,7%
* Alcoholic Beverage volumes amounting to 8 061 tons have been reclassified as export sales during the current year.
Including these sales above would result in a sector growth of 2% and an equivalent estimated local sales growth of 3,4%.
23
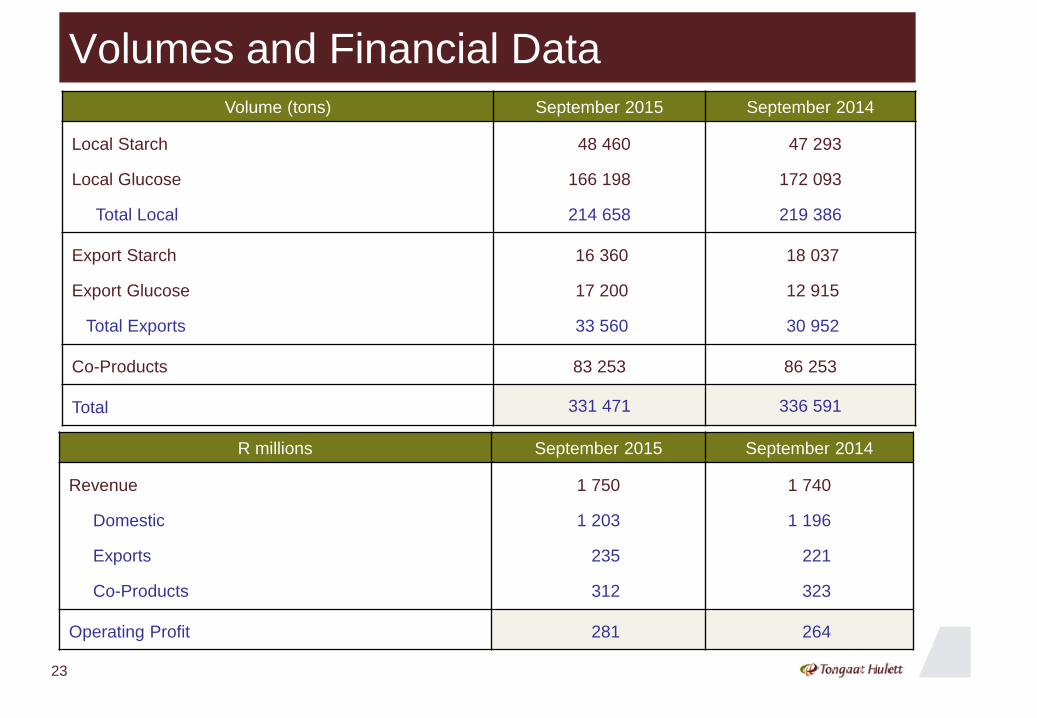
Volumes and Financial Data Volume (tons) September 2015 September 2014
Local Starch
Local Glucose
Total Local
48 460
166 198
214 658
47 293
172 093
219 386
Export Starch
Export Glucose
Total Exports
16 360
17 200
33 560
18 037
12 915
30 952
Co-Products 83 253 86 253
Total 331 471 336 591
R millions September 2015 September 2014
Revenue
Domestic
Exports
Co-Products
1 750
1 203
235
312
1 740
1 196
221
323
Operating Profit 281 264
24
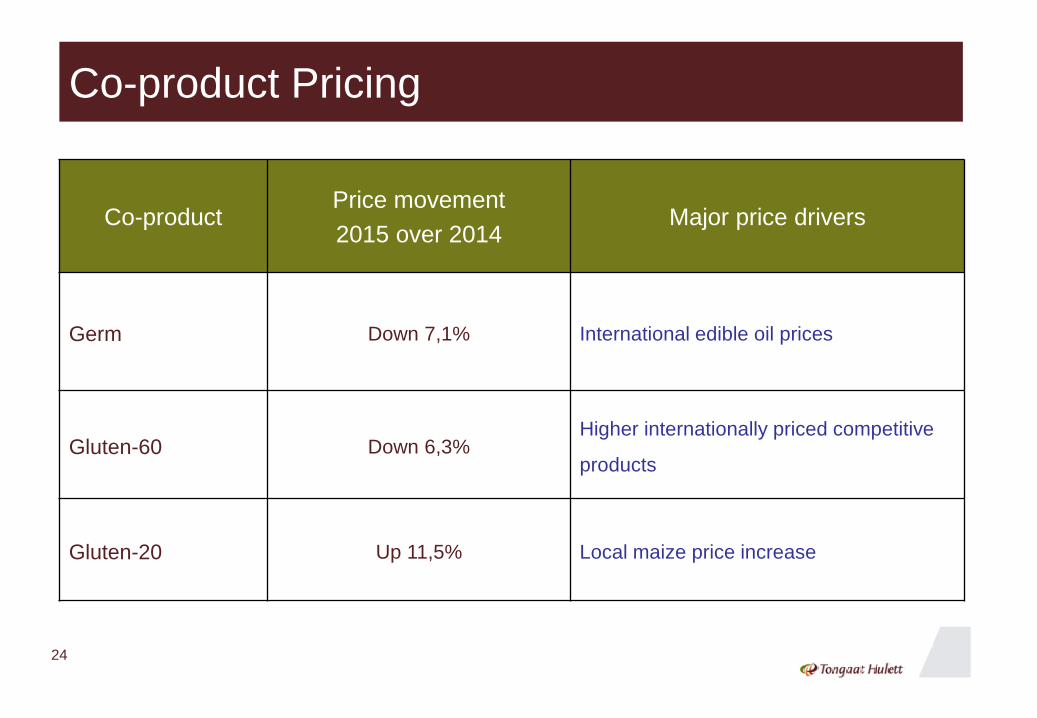
Co-product Pricing
Co-productPrice movement
2015 over 2014Major price drivers
Germ Down 7,1% International edible oil prices
Gluten-60 Down 6,3%Higher internationally priced competitive
products
Gluten-20 Up 11,5% Local maize price increase
25
Momentum in Land Development
Go to www.tongaat.com for an updated copy of the
Portfolio of Land for Conversion in KwaZulu-Natal
26
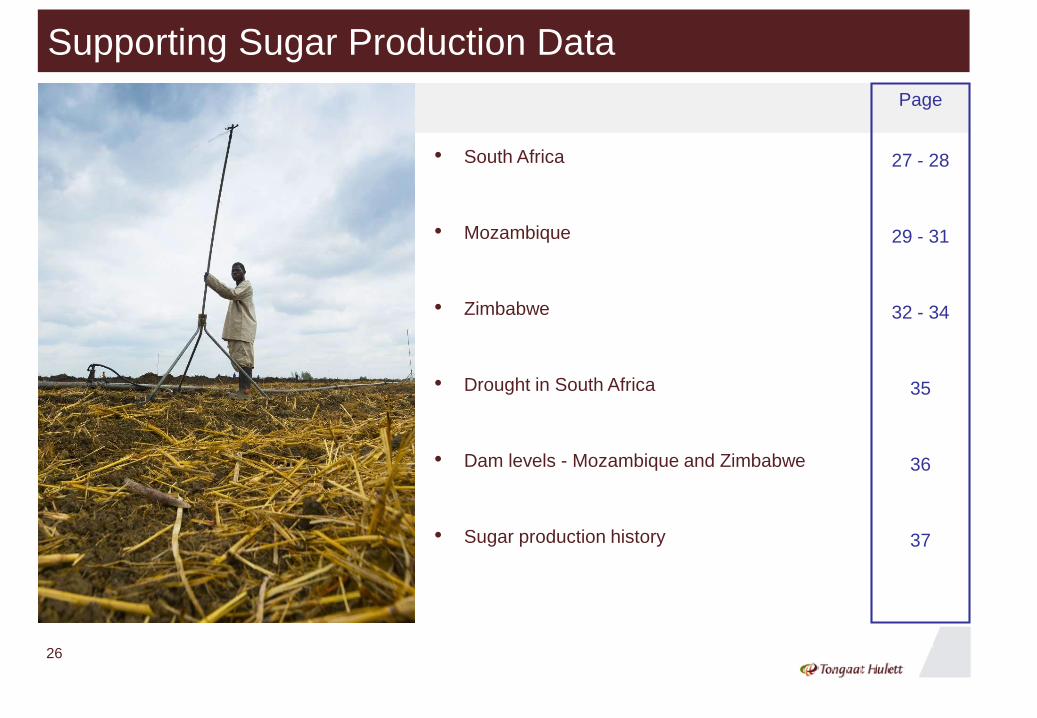
Supporting Sugar Production Data
Page
27 - 28
29 - 31
32 - 34
35
36
37
• South Africa
• Mozambique
• Zimbabwe
• Drought in South Africa
• Dam levels - Mozambique and Zimbabwe
• Sugar production history
27
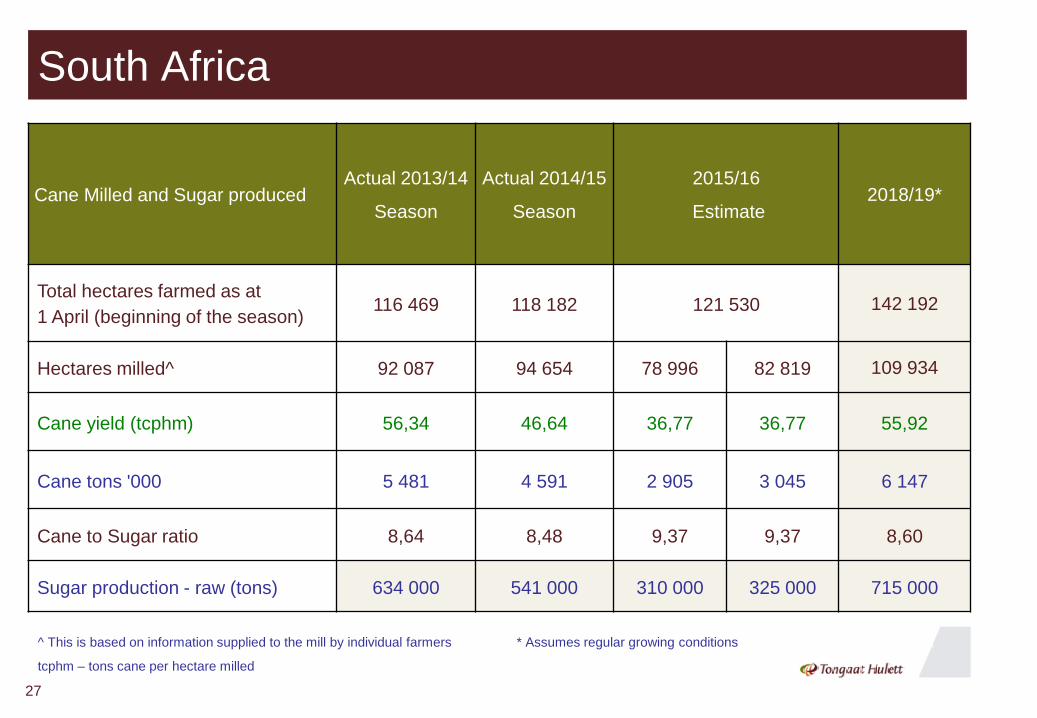
South Africa
Cane Milled and Sugar producedActual 2013/14
Season
Actual 2014/15
Season
2015/16
Estimate2018/19*
Total hectares farmed as at
1 April (beginning of the season)116 469 118 182 121 530 142 192
Hectares milled^ 92 087 94 654 78 996 82 819 109 934
Cane yield (tcphm) 56,34 46,64 36,77 36,77 55,92
Cane tons '000 5 481 4 591 2 905 3 045 6 147
Cane to Sugar ratio 8,64 8,48 9,37 9,37 8,60
Sugar production - raw (tons) 634 000 541 000 310 000 325 000 715 000
^ This is based on information supplied to the mill by individual farmers * Assumes regular growing conditions
tcphm – tons cane per hectare milled
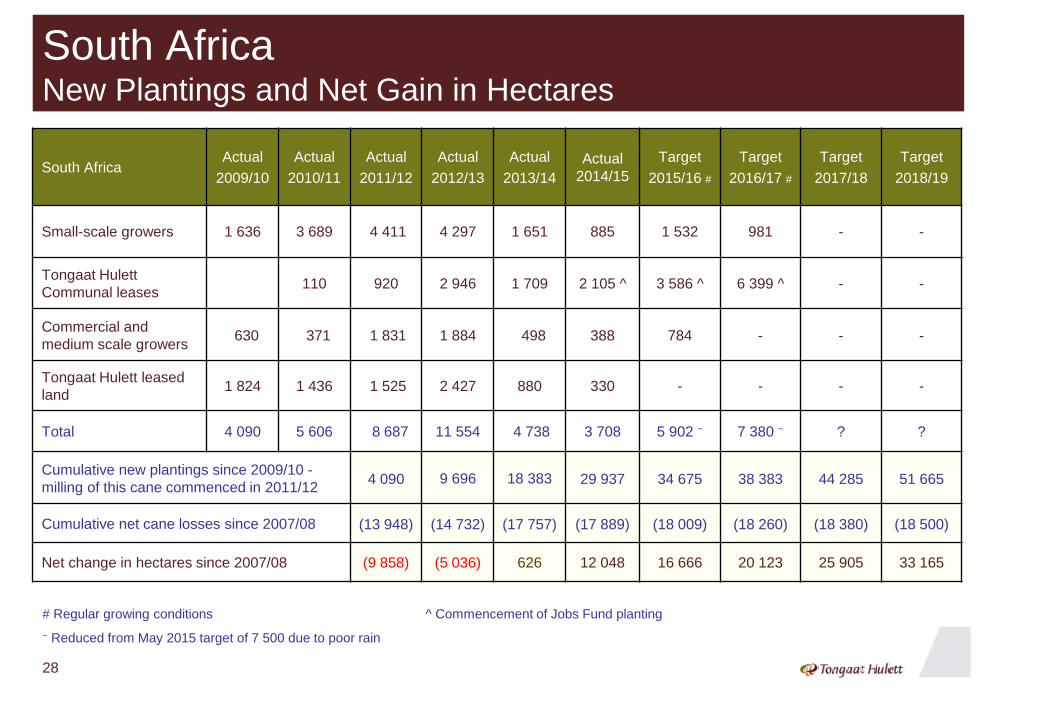
South AfricaNew Plantings and Net Gain in Hectares
South AfricaActual
2009/10
Actual
2010/11
Actual
2011/12
Actual
2012/13
Actual
2013/14
Actual
2014/15
Target
2015/16 #
Target
2016/17 #
Target
2017/18
Target
2018/19
Small-scale growers 1 636 3 689 4 411 4 297 1 651 885 1 532 981 - -
Tongaat Hulett
Communal leases110 920 2 946 1 709 2 105 ^ 3 586 ^ 6 399 ^ - -
Commercial and
medium scale growers630 371 1 831 1 884 498 388 784 - - -
Tongaat Hulett leased
land1 824 1 436 1 525 2 427 880 330 - - - -
Total 4 090 5 606 8 687 11 554 4 738 3 708 5 902 ~ 7 380 ~ ? ?
Cumulative new plantings since 2009/10 -
milling of this cane commenced in 2011/124 090 9 696 18 383 29 937 34 675 38 383 44 285 51 665
Cumulative net cane losses since 2007/08 (13 948) (14 732) (17 757) (17 889) (18 009) (18 260) (18 380) (18 500)
Net change in hectares since 2007/08 (9 858) (5 036) 626 12 048 16 666 20 123 25 905 33 165
# Regular growing conditions ^ Commencement of Jobs Fund planting
~ Reduced from May 2015 target of 7 500 due to poor rain
28
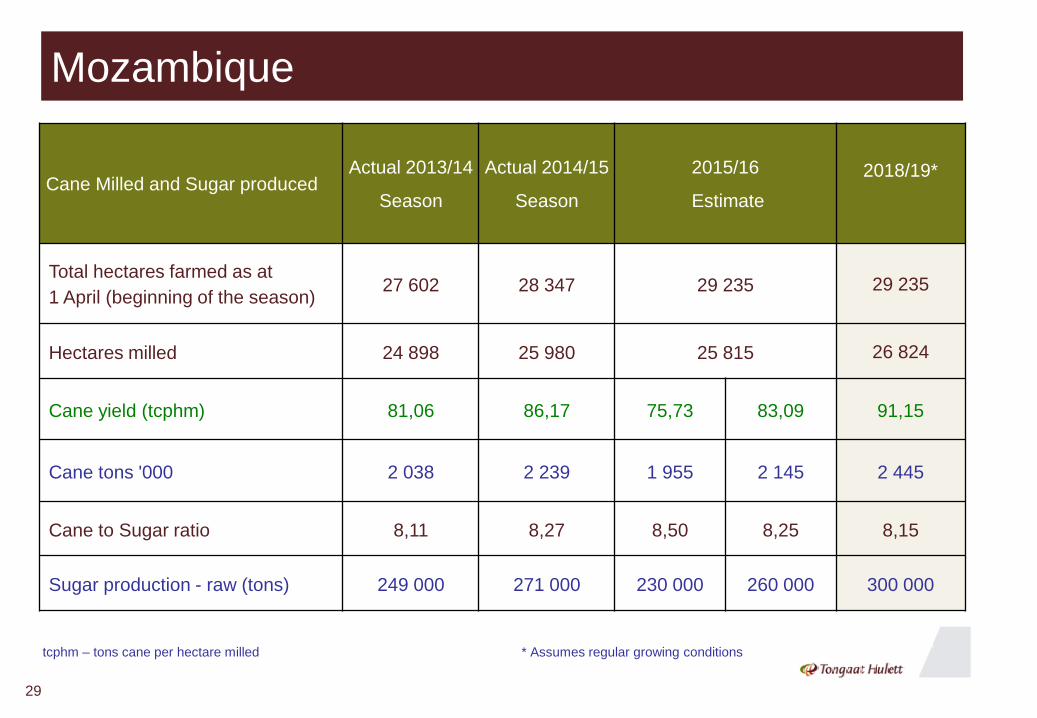
29
Cane Milled and Sugar producedActual 2013/14
Season
Actual 2014/15
Season
2015/16
Estimate
2018/19*
Total hectares farmed as at
1 April (beginning of the season)27 602 28 347 29 235 29 235
Hectares milled 24 898 25 980 25 815 26 824
Cane yield (tcphm) 81,06 86,17 75,73 83,09 91,15
Cane tons '000 2 038 2 239 1 955 2 145 2 445
Cane to Sugar ratio 8,11 8,27 8,50 8,25 8,15
Sugar production - raw (tons) 249 000 271 000 230 000 260 000 300 000
tcphm – tons cane per hectare milled * Assumes regular growing conditions
Mozambique
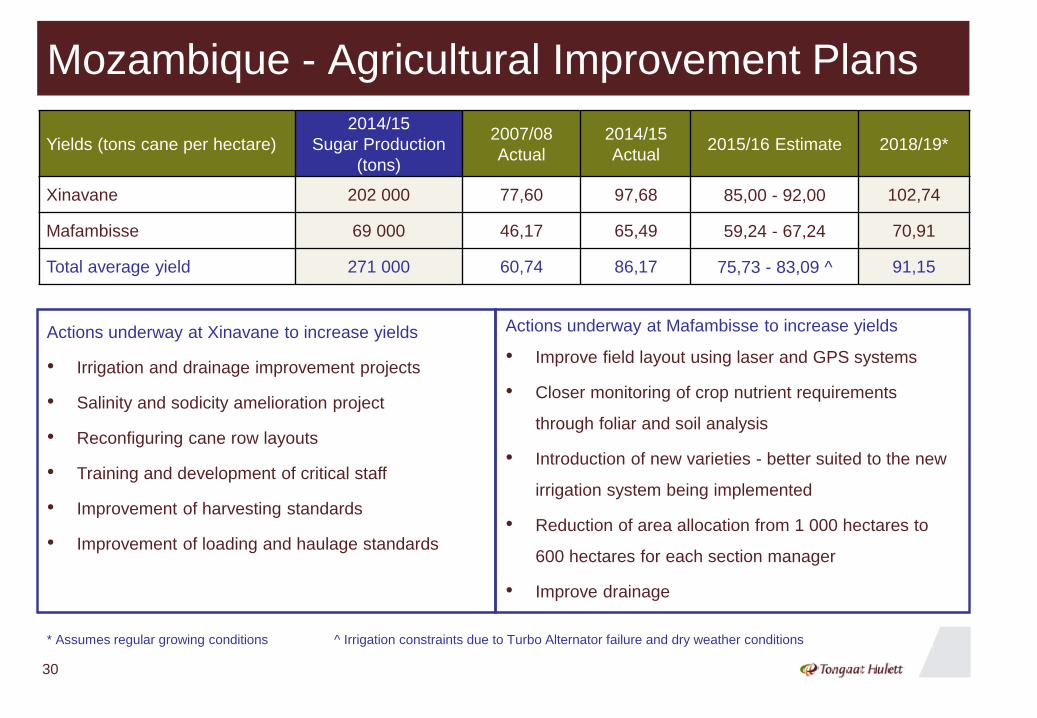
Mozambique - Agricultural Improvement Plans
30
Yields (tons cane per hectare)
2014/15
Sugar Production
(tons)
2007/08
Actual
2014/15
Actual2015/16 Estimate 2018/19*
Xinavane 202 000 77,60 97,68 85,00 - 92,00 102,74
Mafambisse 69 000 46,17 65,49 59,24 - 67,24 70,91
Total average yield 271 000 60,74 86,17 75,73 - 83,09 ^ 91,15
Actions underway at Xinavane to increase yields
• Irrigation and drainage improvement projects
• Salinity and sodicity amelioration project
• Reconfiguring cane row layouts
• Training and development of critical staff
• Improvement of harvesting standards
• Improvement of loading and haulage standards
Actions underway at Mafambisse to increase yields
• Improve field layout using laser and GPS systems
• Closer monitoring of crop nutrient requirements
through foliar and soil analysis
• Introduction of new varieties - better suited to the new
irrigation system being implemented
• Reduction of area allocation from 1 000 hectares to
600 hectares for each section manager
• Improve drainage
* Assumes regular growing conditions ^ Irrigation constraints due to Turbo Alternator failure and dry weather conditions
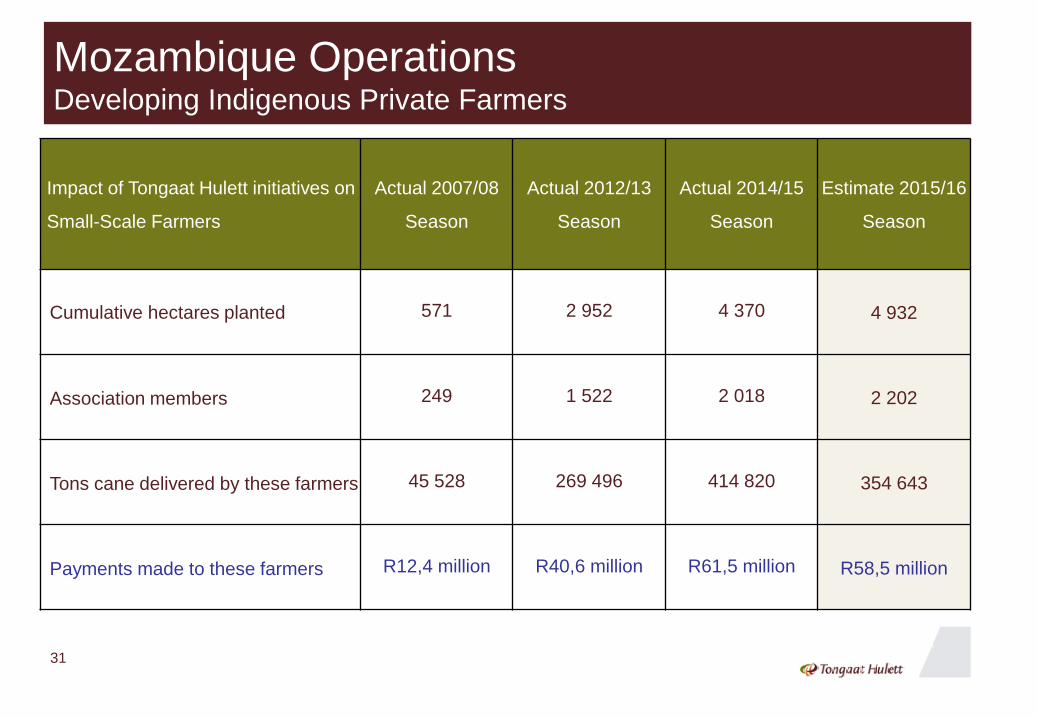
Mozambique OperationsDeveloping Indigenous Private Farmers
31
Impact of Tongaat Hulett initiatives on
Small-Scale Farmers
Actual 2007/08
Season
Actual 2012/13
Season
Actual 2014/15
Season
Estimate 2015/16
Season
Cumulative hectares planted 571 2 952 4 370 4 932
Association members 249 1 522 2 018 2 202
Tons cane delivered by these farmers 45 528 269 496 414 820 354 643
Payments made to these farmers R12,4 million R40,6 million R61,5 million R58,5 million
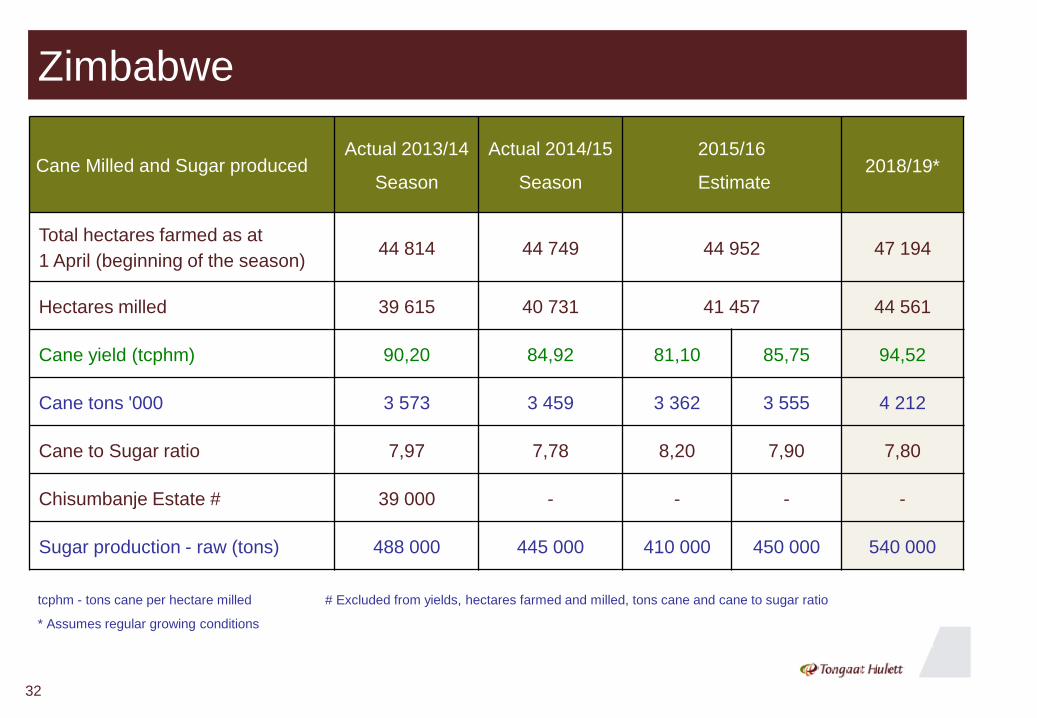
32
Cane Milled and Sugar producedActual 2013/14
Season
Actual 2014/15
Season
2015/16
Estimate2018/19*
Total hectares farmed as at
1 April (beginning of the season)44 814 44 749 44 952 47 194
Hectares milled 39 615 40 731 41 457 44 561
Cane yield (tcphm) 90,20 84,92 81,10 85,75 94,52
Cane tons '000 3 573 3 459 3 362 3 555 4 212
Cane to Sugar ratio 7,97 7,78 8,20 7,90 7,80
Chisumbanje Estate # 39 000 - - - -
Sugar production - raw (tons) 488 000 445 000 410 000 450 000 540 000
tcphm - tons cane per hectare milled # Excluded from yields, hectares farmed and milled, tons cane and cane to sugar ratio
* Assumes regular growing conditions
Zimbabwe
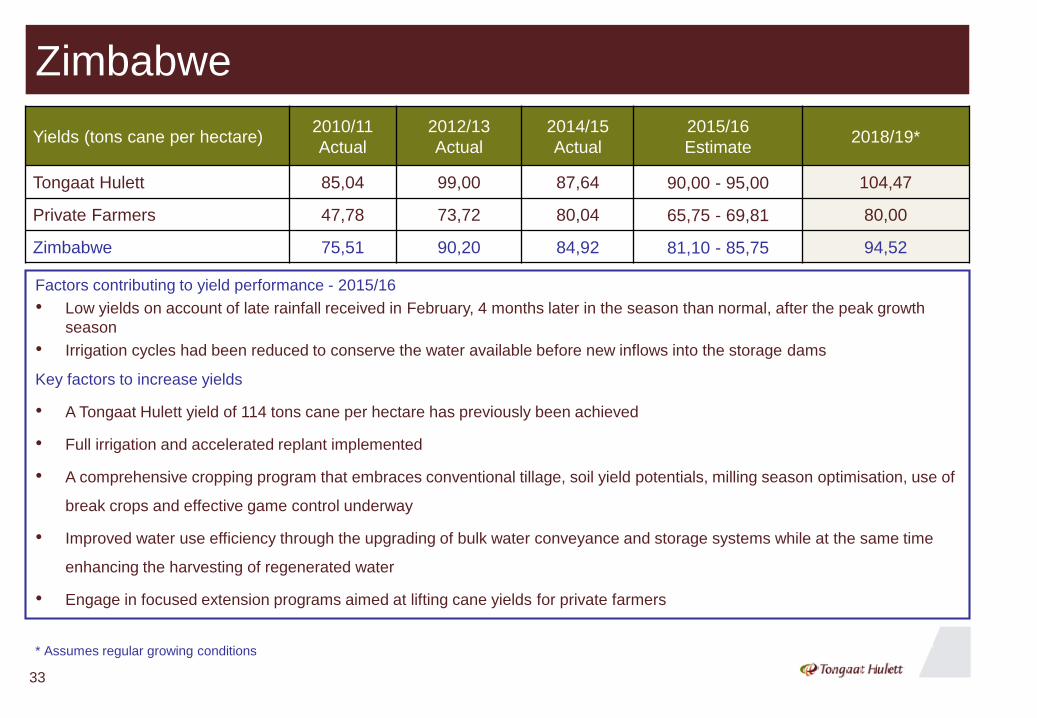
33
Yields (tons cane per hectare)2010/11
Actual
2012/13
Actual
2014/15
Actual
2015/16
Estimate2018/19*
Tongaat Hulett 85,04 99,00 87,64 90,00 - 95,00 104,47
Private Farmers 47,78 73,72 80,04 65,75 - 69,81 80,00
Zimbabwe 75,51 90,20 84,92 81,10 - 85,75 94,52
Factors contributing to yield performance - 2015/16
• Low yields on account of late rainfall received in February, 4 months later in the season than normal, after the peak growth
season
• Irrigation cycles had been reduced to conserve the water available before new inflows into the storage dams
Key factors to increase yields
• A Tongaat Hulett yield of 114 tons cane per hectare has previously been achieved
• Full irrigation and accelerated replant implemented
• A comprehensive cropping program that embraces conventional tillage, soil yield potentials, milling season optimisation, use of
break crops and effective game control underway
• Improved water use efficiency through the upgrading of bulk water conveyance and storage systems while at the same time
enhancing the harvesting of regenerated water
• Engage in focused extension programs aimed at lifting cane yields for private farmers
* Assumes regular growing conditions
Zimbabwe
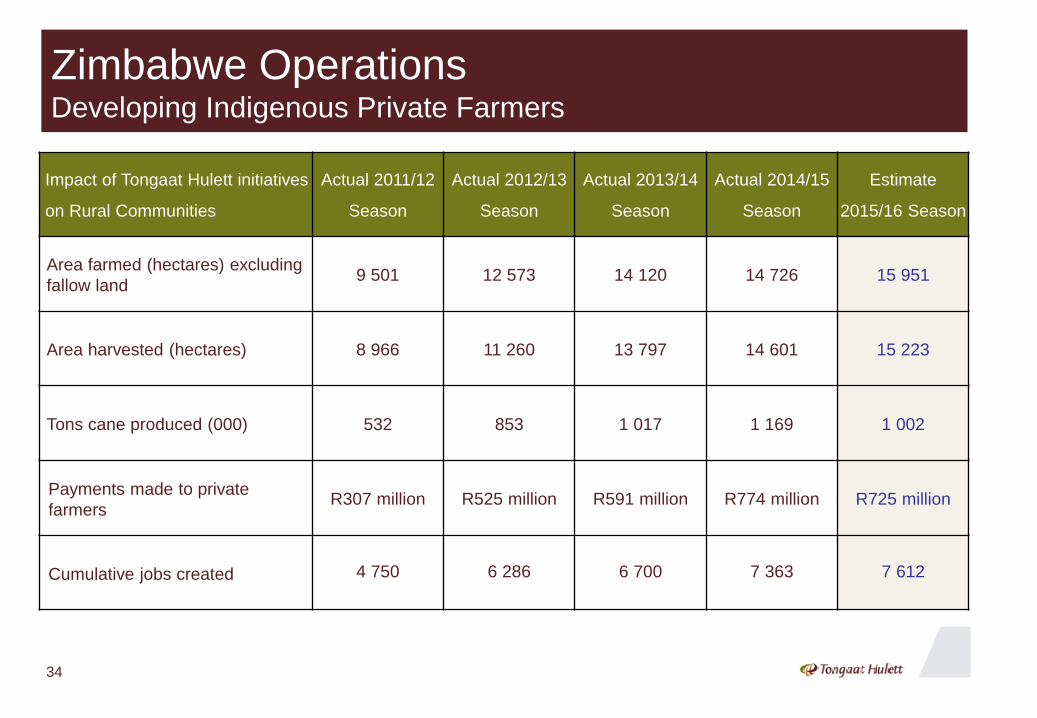
Zimbabwe OperationsDeveloping Indigenous Private Farmers
34
Impact of Tongaat Hulett initiatives
on Rural Communities
Actual 2011/12
Season
Actual 2012/13
Season
Actual 2013/14
Season
Actual 2014/15
Season
Estimate
2015/16 Season
Area farmed (hectares) excluding
fallow land9 501 12 573 14 120 14 726 15 951
Area harvested (hectares) 8 966 11 260 13 797 14 601 15 223
Tons cane produced (000) 532 853 1 017 1 169 1 002
Payments made to private
farmersR307 million R525 million R591 million R774 million R725 million
Cumulative jobs created 4 750 6 286 6 700 7 363 7 612
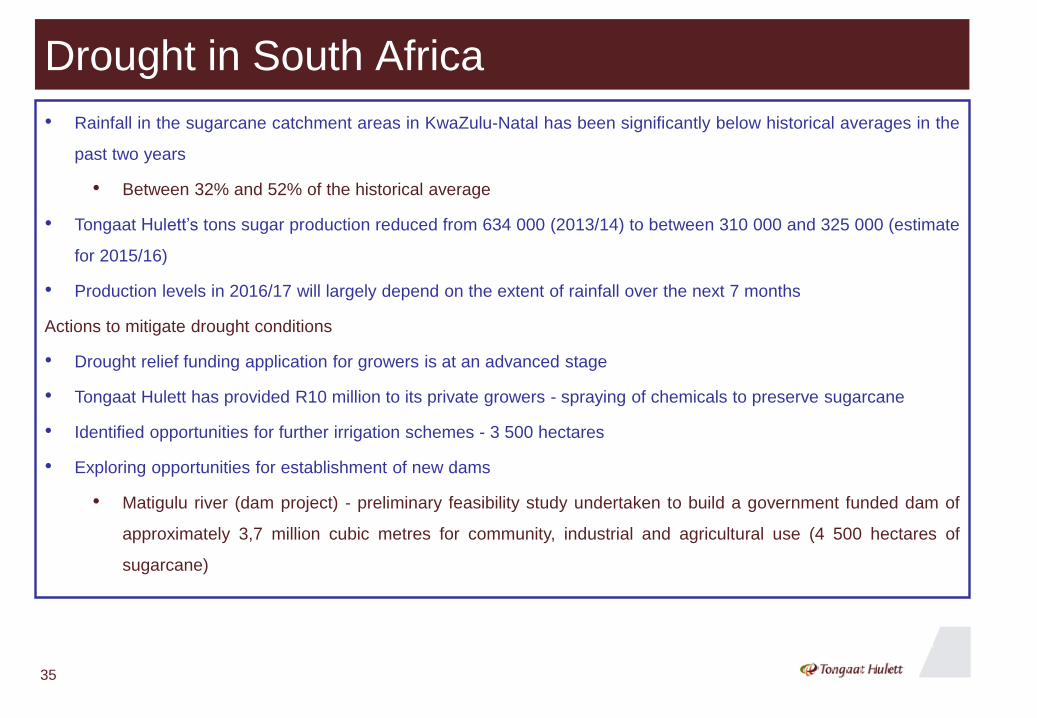
35
• Rainfall in the sugarcane catchment areas in KwaZulu-Natal has been significantly below historical averages in the
past two years
• Between 32% and 52% of the historical average
• Tongaat Hulett’s tons sugar production reduced from 634 000 (2013/14) to between 310 000 and 325 000 (estimate
for 2015/16)
• Production levels in 2016/17 will largely depend on the extent of rainfall over the next 7 months
Actions to mitigate drought conditions
• Drought relief funding application for growers is at an advanced stage
• Tongaat Hulett has provided R10 million to its private growers - spraying of chemicals to preserve sugarcane
• Identified opportunities for further irrigation schemes - 3 500 hectares
• Exploring opportunities for establishment of new dams
• Matigulu river (dam project) - preliminary feasibility study undertaken to build a government funded dam of
approximately 3,7 million cubic metres for community, industrial and agricultural use (4 500 hectares of
sugarcane)
Drought in South Africa
Dam Levels - Mozambique and Zimbabwe
36
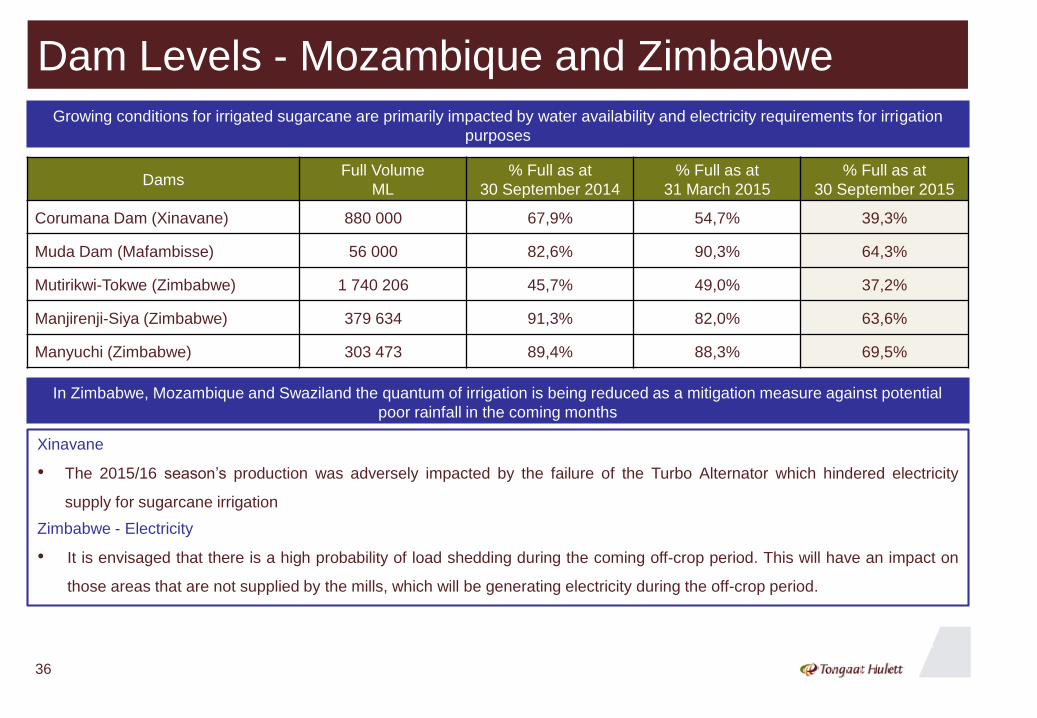
Growing conditions for irrigated sugarcane are primarily impacted by water availability and electricity requirements for irrigation
purposes
DamsFull Volume
ML
% Full as at
30 September 2014
% Full as at
31 March 2015
% Full as at
30 September 2015
Corumana Dam (Xinavane) 880 000 67,9% 54,7% 39,3%
Muda Dam (Mafambisse) 56 000 82,6% 90,3% 64,3%
Mutirikwi-Tokwe (Zimbabwe) 1 740 206 45,7% 49,0% 37,2%
Manjirenji-Siya (Zimbabwe) 379 634 91,3% 82,0% 63,6%
Manyuchi (Zimbabwe) 303 473 89,4% 88,3% 69,5%
Xinavane
• The 2015/16 season’s production was adversely impacted by the failure of the Turbo Alternator which hindered electricity
supply for sugarcane irrigation
Zimbabwe - Electricity
• It is envisaged that there is a high probability of load shedding during the coming off-crop period. This will have an impact on
those areas that are not supplied by the mills, which will be generating electricity during the off-crop period.
In Zimbabwe, Mozambique and Swaziland the quantum of irrigation is being reduced as a mitigation measure against potential
poor rainfall in the coming months
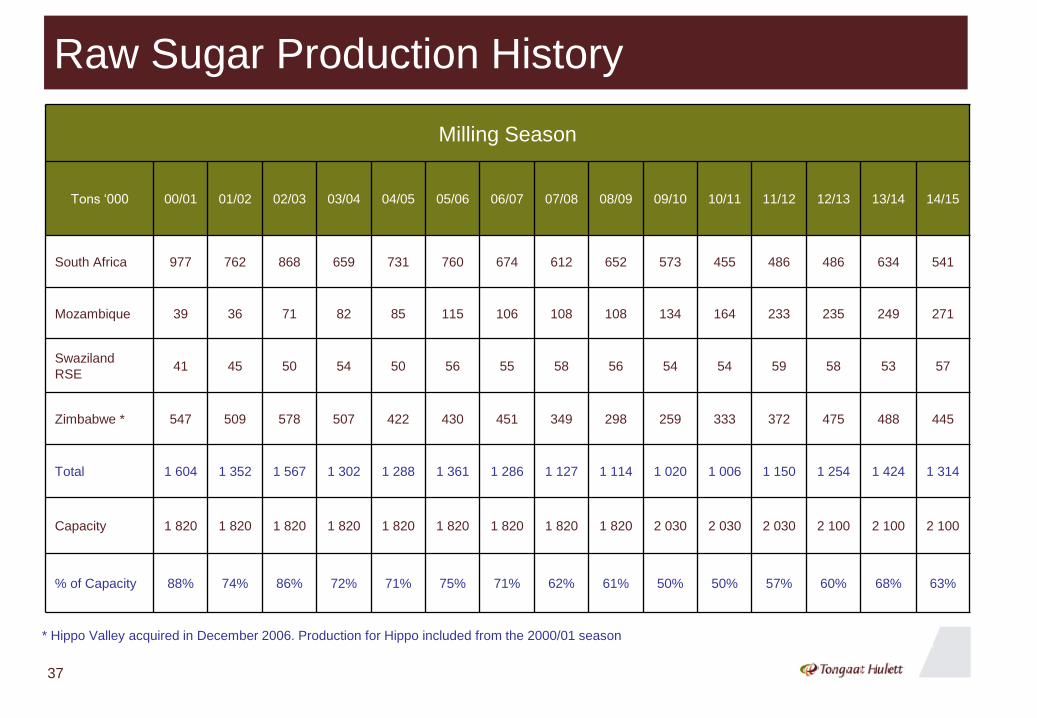
Raw Sugar Production History
Milling Season
Tons ‘000 00/01 01/02 02/03 03/04 04/05 05/06 06/07 07/08 08/09 09/10 10/11 11/12 12/13 13/14 14/15
South Africa 977 762 868 659 731 760 674 612 652 573 455 486 486 634 541
Mozambique 39 36 71 82 85 115 106 108 108 134 164 233 235 249 271
Swaziland
RSE41 45 50 54 50 56 55 58 56 54 54 59 58 53 57
Zimbabwe * 547 509 578 507 422 430 451 349 298 259 333 372 475 488 445
Total 1 604 1 352 1 567 1 302 1 288 1 361 1 286 1 127 1 114 1 020 1 006 1 150 1 254 1 424 1 314
Capacity 1 820 1 820 1 820 1 820 1 820 1 820 1 820 1 820 1 820 2 030 2 030 2 030 2 100 2 100 2 100
% of Capacity 88% 74% 86% 72% 71% 75% 71% 62% 61% 50% 50% 57% 60% 68% 63%
* Hippo Valley acquired in December 2006. Production for Hippo included from the 2000/01 season
37
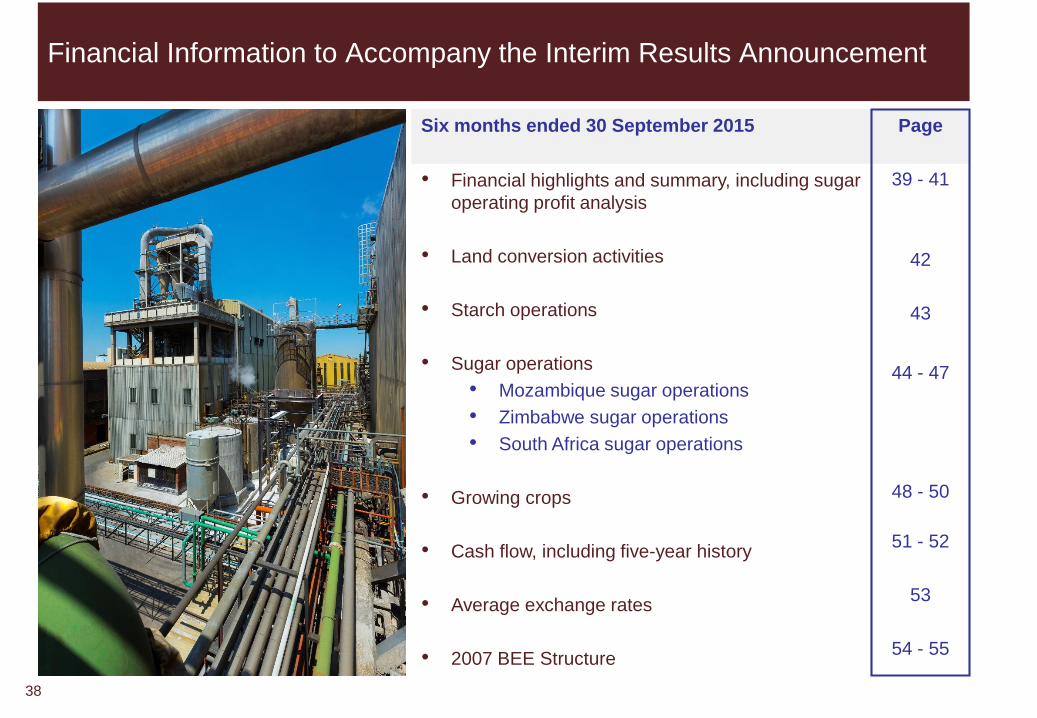
Financial Information to Accompany the Interim Results Announcement
38
Six months ended 30 September 2015 Page
39 - 41
42
43
44 - 47
48 - 50
51 - 52
53
54 - 55
• Financial highlights and summary, including sugar
operating profit analysis
• Land conversion activities
• Starch operations
• Sugar operations
• Mozambique sugar operations
• Zimbabwe sugar operations
• South Africa sugar operations
• Growing crops
• Cash flow, including five-year history
• Average exchange rates
• 2007 BEE Structure
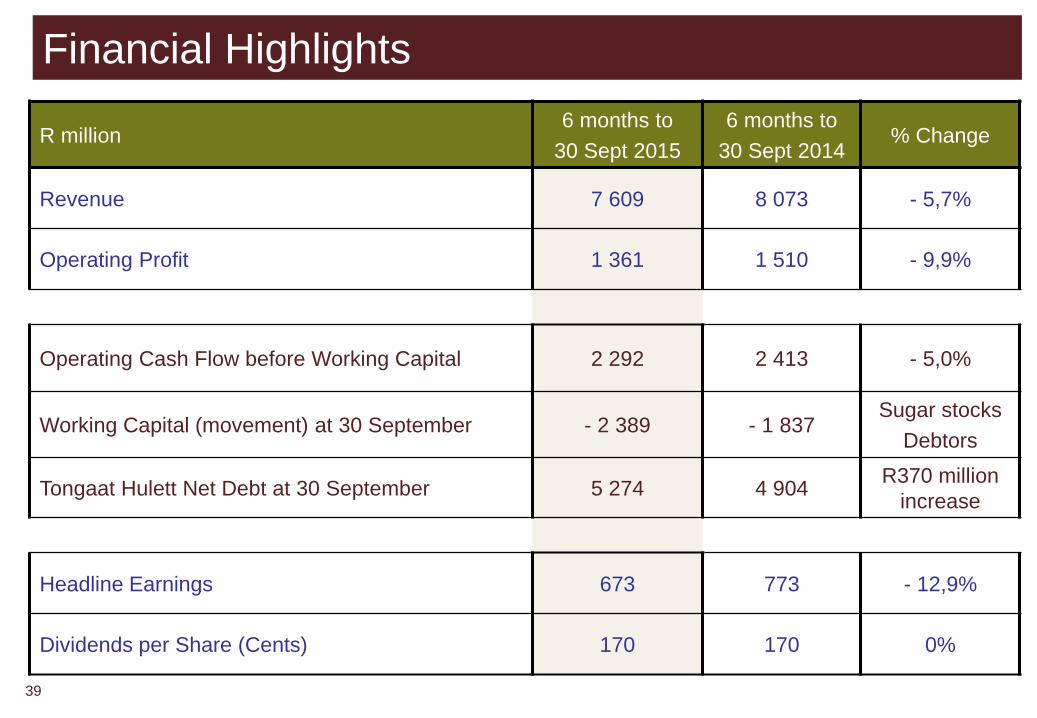
Financial Highlights
R million6 months to
30 Sept 2015
6 months to
30 Sept 2014% Change
Revenue 7 609 8 073 - 5,7%
Operating Profit 1 361 1 510 - 9,9%
Operating Cash Flow before Working Capital 2 292 2 413 - 5,0%
Working Capital (movement) at 30 September - 2 389 - 1 837Sugar stocks
Debtors
Tongaat Hulett Net Debt at 30 September 5 274 4 904R370 million
increase
Headline Earnings 673 773 - 12,9%
Dividends per Share (Cents) 170 170 0%
39
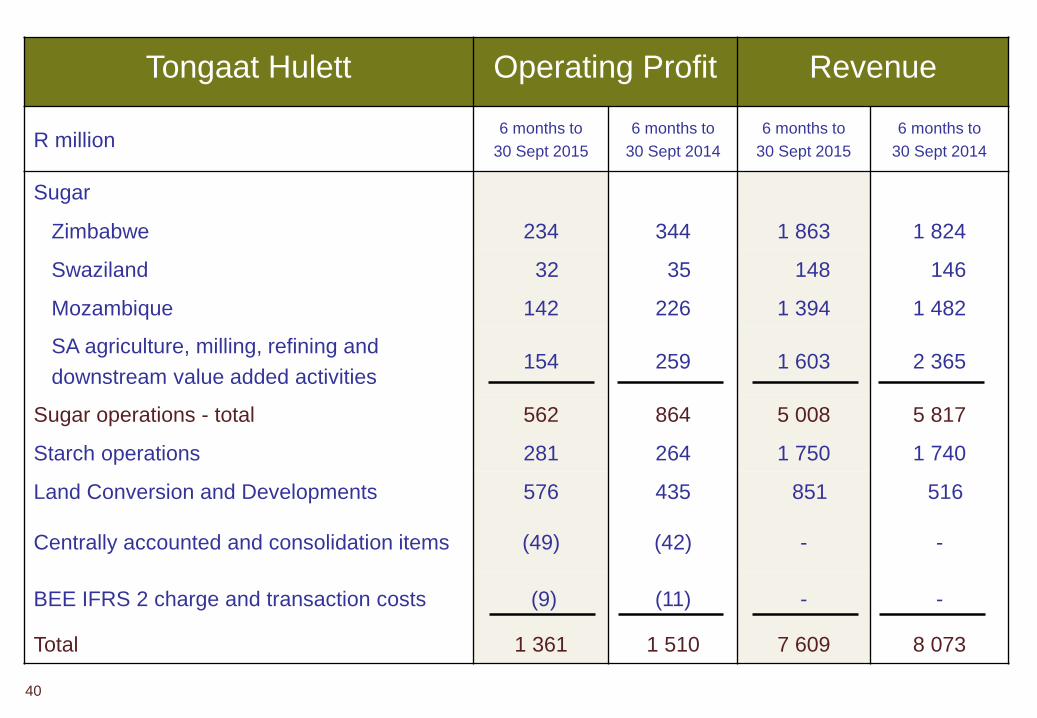
Tongaat Hulett Operating Profit Revenue
R million6 months to
30 Sept 2015
6 months to
30 Sept 2014
6 months to
30 Sept 2015
6 months to
30 Sept 2014
Sugar
Zimbabwe 234 344 1 863 1 824
Swaziland 32 35 148 146
Mozambique 142 226 1 394 1 482
SA agriculture, milling, refining and
downstream value added activities154 259 1 603 2 365
Sugar operations - total 562 864 5 008 5 817
Starch operations 281 264 1 750 1 740
Land Conversion and Developments 576 435 851 516
Centrally accounted and consolidation items (49) (42) - -
BEE IFRS 2 charge and transaction costs (9) (11) - -
Total 1 361 1 510 7 609 8 073
40
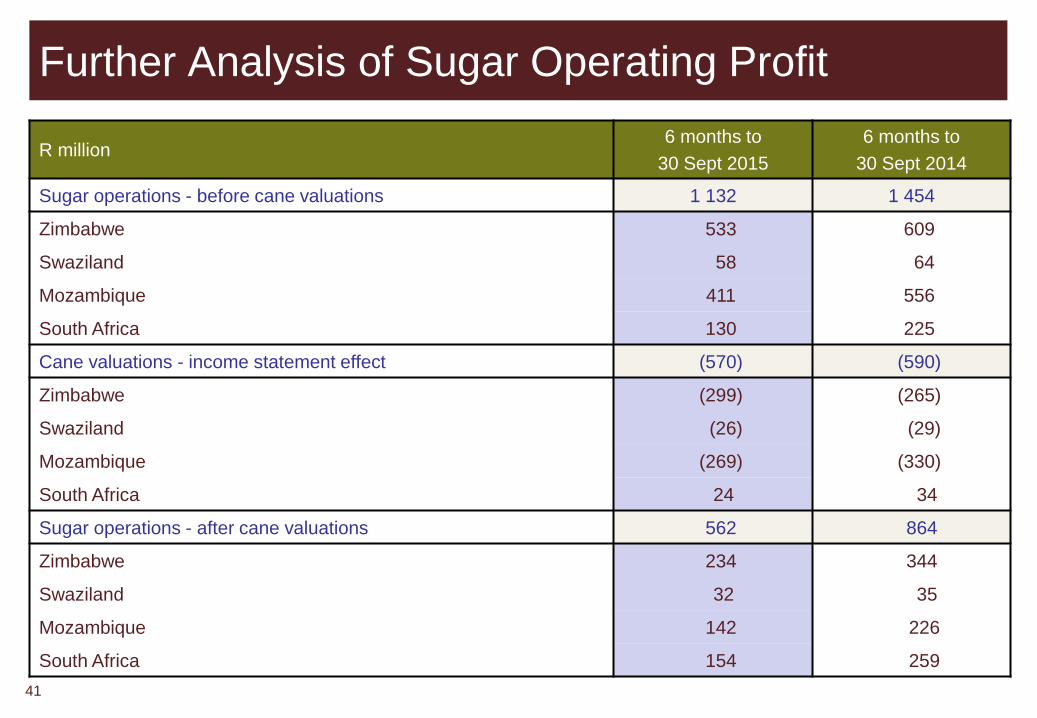
Further Analysis of Sugar Operating Profit
R million6 months to
30 Sept 2015
6 months to
30 Sept 2014
Sugar operations - before cane valuations 1 132 1 454
Zimbabwe 533 609
Swaziland 58 64
Mozambique 411 556
South Africa 130 225
Cane valuations - income statement effect (570) (590)
Zimbabwe (299) (265)
Swaziland (26) (29)
Mozambique (269) (330)
South Africa 24 34
Sugar operations - after cane valuations 562 864
Zimbabwe 234 344
Swaziland 32 35
Mozambique 142 226
South Africa 154 259
41
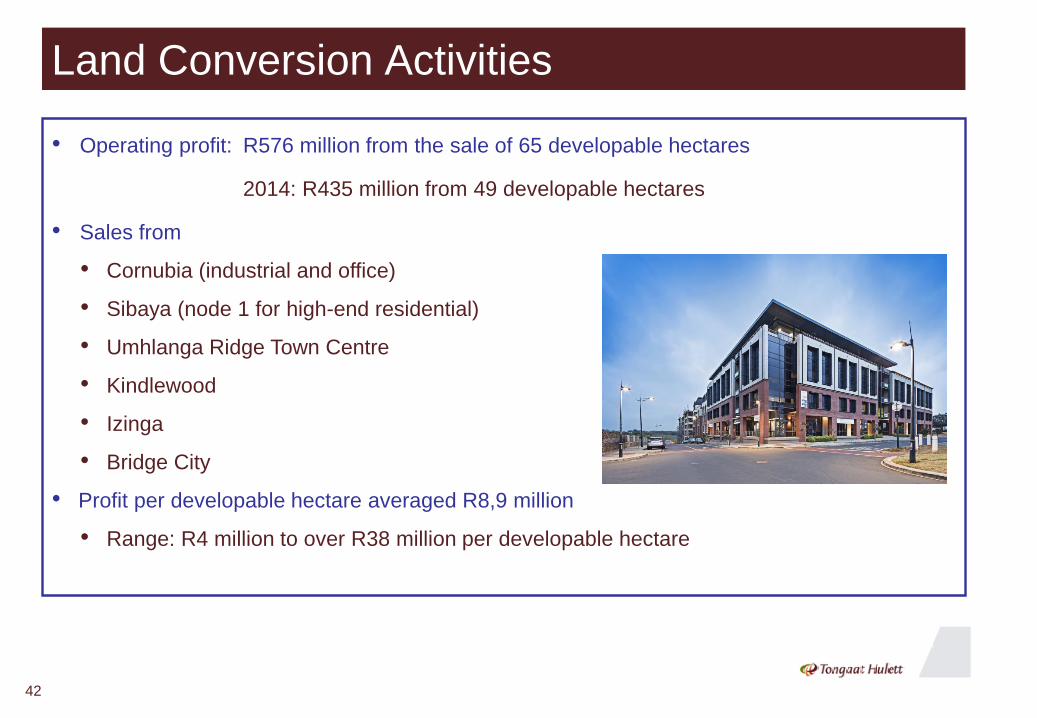
Land Conversion Activities
42
• Operating profit: R576 million from the sale of 65 developable hectares
2014: R435 million from 49 developable hectares
• Sales from
• Cornubia (industrial and office)
• Sibaya (node 1 for high-end residential)
• Umhlanga Ridge Town Centre
• Kindlewood
• Izinga
• Bridge City
• Profit per developable hectare averaged R8,9 million
• Range: R4 million to over R38 million per developable hectare
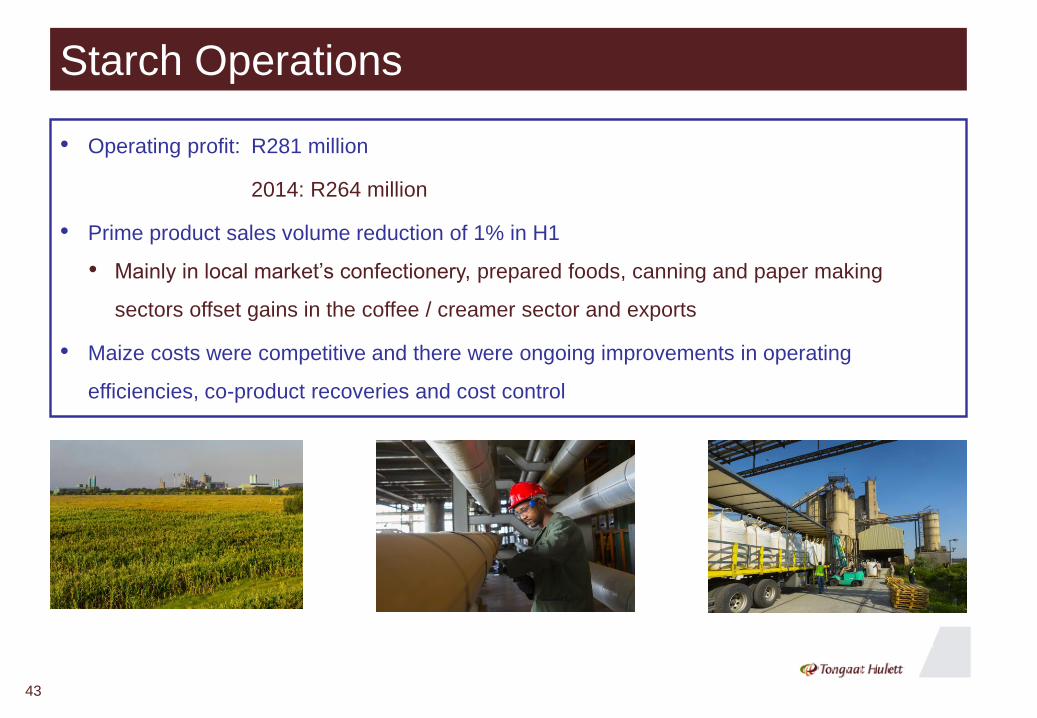
Starch Operations
43
• Operating profit: R281 million
2014: R264 million
• Prime product sales volume reduction of 1% in H1
• Mainly in local market’s confectionery, prepared foods, canning and paper making
sectors offset gains in the coffee / creamer sector and exports
• Maize costs were competitive and there were ongoing improvements in operating
efficiencies, co-product recoveries and cost control
Sugar Operations
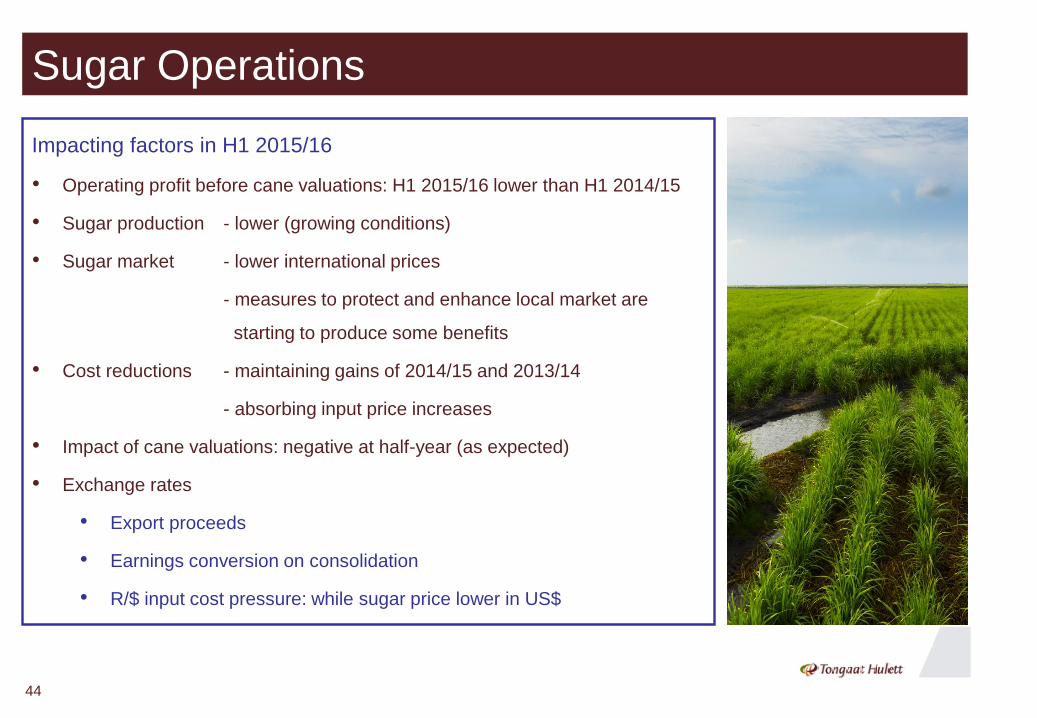
Impacting factors in H1 2015/16
• Operating profit before cane valuations: H1 2015/16 lower than H1 2014/15
• Sugar production - lower (growing conditions)
• Sugar market - lower international prices
- measures to protect and enhance local market are
starting to produce some benefits
• Cost reductions - maintaining gains of 2014/15 and 2013/14
- absorbing input price increases
• Impact of cane valuations: negative at half-year (as expected)
• Exchange rates
• Export proceeds
• Earnings conversion on consolidation
• R/$ input cost pressure: while sugar price lower in US$
44
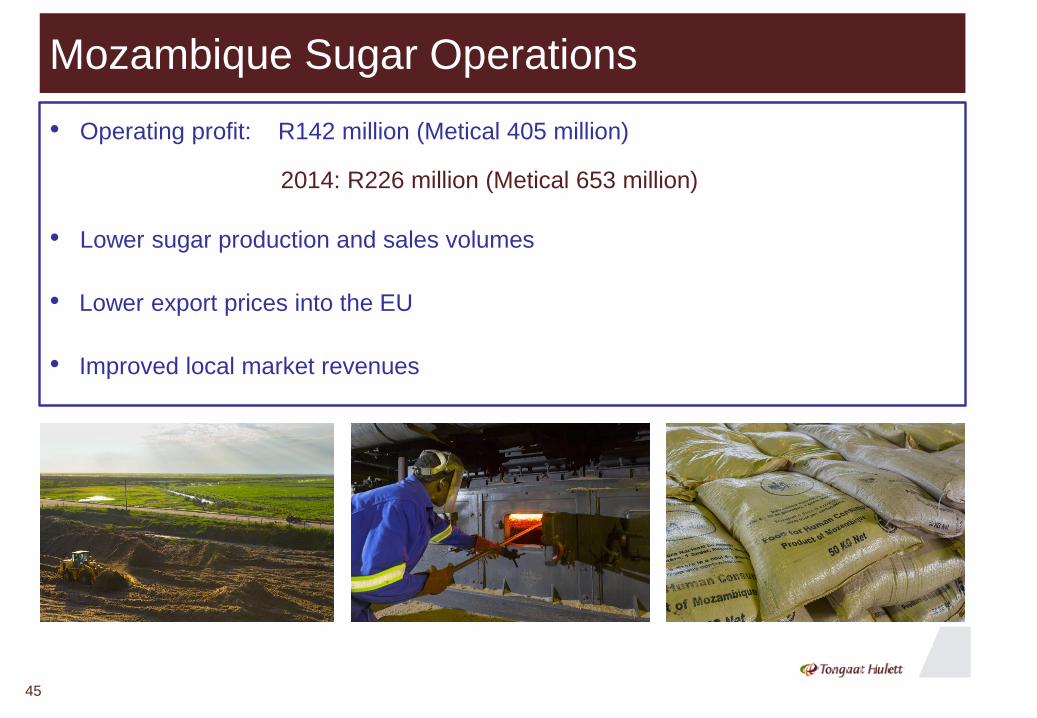
Mozambique Sugar Operations
• Operating profit: R142 million (Metical 405 million)
2014: R226 million (Metical 653 million)
• Lower sugar production and sales volumes
• Lower export prices into the EU
• Improved local market revenues
45
Zimbabwe Sugar OperationsTriangle and Hippo Valley Estates
• Operating profit: R234 million (US$ 19 million)
2014: R344 million (US$ 32 million)
• Domestic market sugar sales volumes maintained
• Lower export volumes in the half-year
• Export prices into the EU were lower
• Strength of US Dollar
• Pressure on US Dollar-based costs (for example, salaries and wages)
• Reduced export revenue on conversion of Euro to US Dollars
• Benefit of conversion of US Dollar profits to Rands on consolidation
46
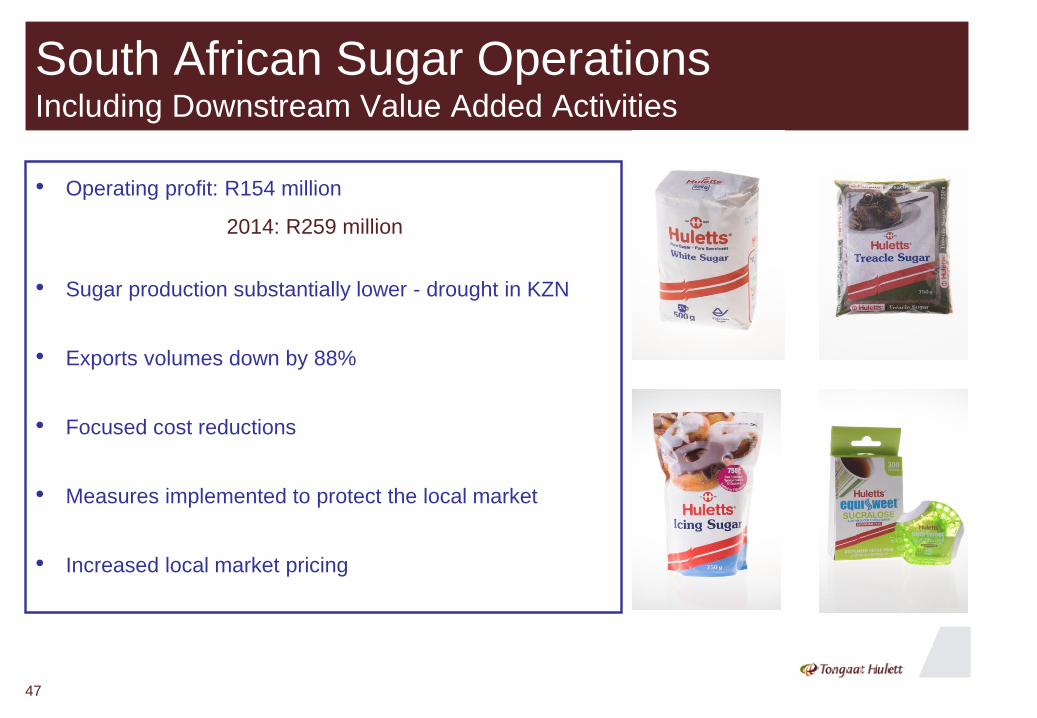
South African Sugar OperationsIncluding Downstream Value Added Activities
• Operating profit: R154 million
2014: R259 million
• Sugar production substantially lower - drought in KZN
• Exports volumes down by 88%
• Focused cost reductions
• Measures implemented to protect the local market
• Increased local market pricing
47
Growing Crops - Change in Fair Value: 2015/16
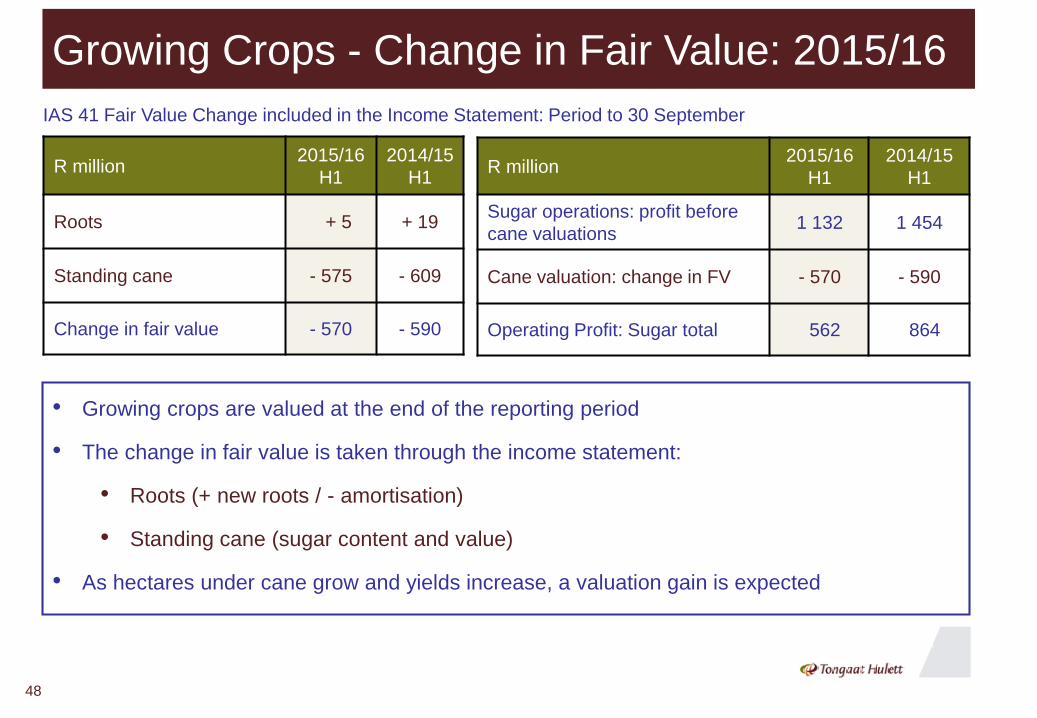
IAS 41 Fair Value Change included in the Income Statement: Period to 30 September
R million2015/16
H1
2014/15
H1
Roots + 5 + 19
Standing cane - 575 - 609
Change in fair value - 570 - 590
• Growing crops are valued at the end of the reporting period
• The change in fair value is taken through the income statement:
• Roots (+ new roots / - amortisation)
• Standing cane (sugar content and value)
• As hectares under cane grow and yields increase, a valuation gain is expected
R million2015/16
H1
2014/15
H1
Sugar operations: profit before
cane valuations 1 132 1 454
Cane valuation: change in FV - 570 - 590
Operating Profit: Sugar total 562 864
48
Growing Crops - Change in Fair Value: 2015/16 (cont.)
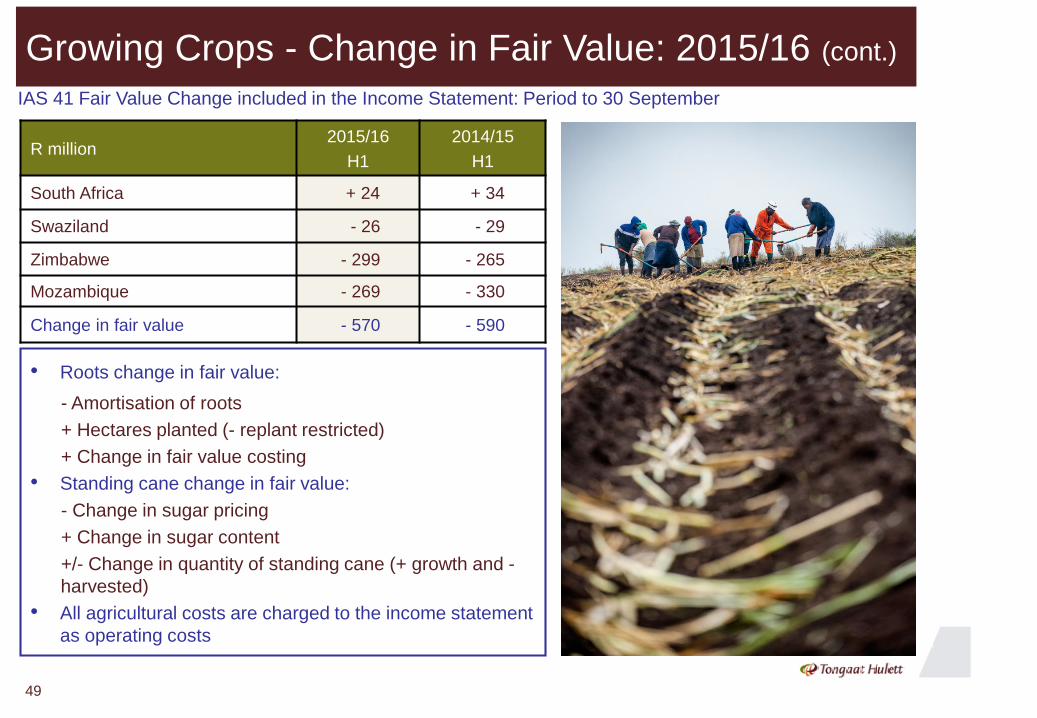
IAS 41 Fair Value Change included in the Income Statement: Period to 30 September
R million2015/16
H1
2014/15
H1
South Africa + 24 + 34
Swaziland - 26 - 29
Zimbabwe - 299 - 265
Mozambique - 269 - 330
Change in fair value - 570 - 590
• Roots change in fair value:
- Amortisation of roots
+ Hectares planted (- replant restricted)
+ Change in fair value costing
• Standing cane change in fair value:
- Change in sugar pricing
+ Change in sugar content
+/- Change in quantity of standing cane (+ growth and -
harvested)
• All agricultural costs are charged to the income statement
as operating costs
49
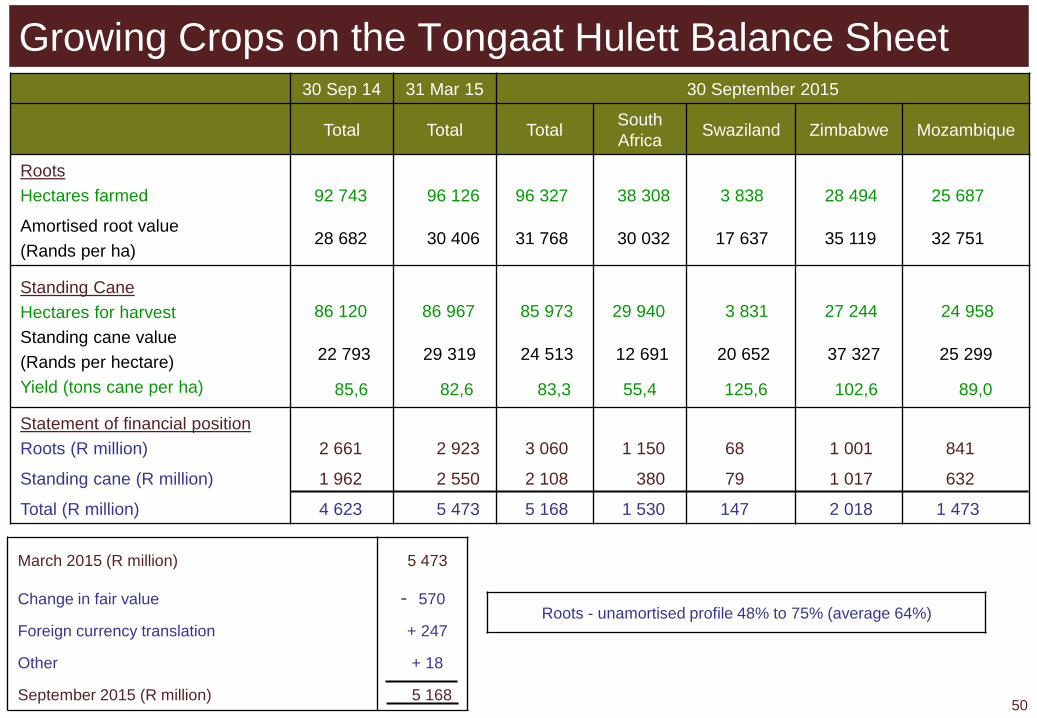
Growing Crops on the Tongaat Hulett Balance Sheet30 Sep 14 31 Mar 15 30 September 2015
Total Total TotalSouth
AfricaSwaziland Zimbabwe Mozambique
Roots
Hectares farmed 92 743 96 126 96 327 38 308 3 838 28 494 25 687
Amortised root value
(Rands per ha)28 682 30 406 31 768 30 032 17 637 35 119 32 751
Standing Cane
Hectares for harvest
Standing cane value
(Rands per hectare)
Yield (tons cane per ha)
86 120
22 793
85,6
86 967
29 319
82,6
85 973
24 513
83,3
29 940
12 691
55,4
3 831
20 652
125,6
27 244
37 327
102,6
24 958
25 299
89,0
Statement of financial position
Roots (R million) 2 661 2 923 3 060 1 150 68 1 001 841
Standing cane (R million) 1 962 2 550 2 108 380 79 1 017 632
Total (R million) 4 623 5 473 5 168 1 530 147 2 018 1 473
March 2015 (R million) 5 473
Change in fair value - 570
Foreign currency translation + 247
Other + 18
September 2015 (R million) 5 16850
Roots - unamortised profile 48% to 75% (average 64%)
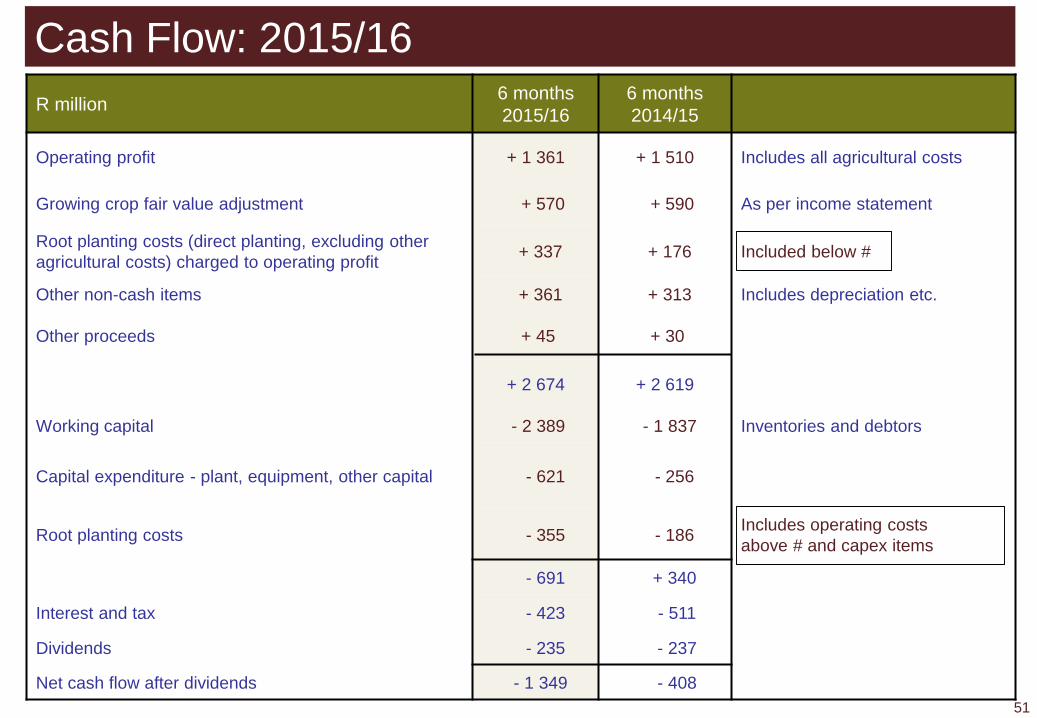
Cash Flow: 2015/16
R million6 months
2015/16
6 months
2014/15
Operating profit + 1 361 + 1 510 Includes all agricultural costs
Growing crop fair value adjustment + 570 + 590 As per income statement
Root planting costs (direct planting, excluding other
agricultural costs) charged to operating profit+ 337 + 176 Included below #
Other non-cash items + 361 + 313 Includes depreciation etc.
Other proceeds + 45 + 30
+ 2 674 + 2 619
Working capital - 2 389 - 1 837 Inventories and debtors
Capital expenditure - plant, equipment, other capital - 621 - 256
Root planting costs - 355 - 186Includes operating costs
above # and capex items
- 691 + 340
Interest and tax - 423 - 511
Dividends - 235 - 237
Net cash flow after dividends - 1 349 - 408
51
52
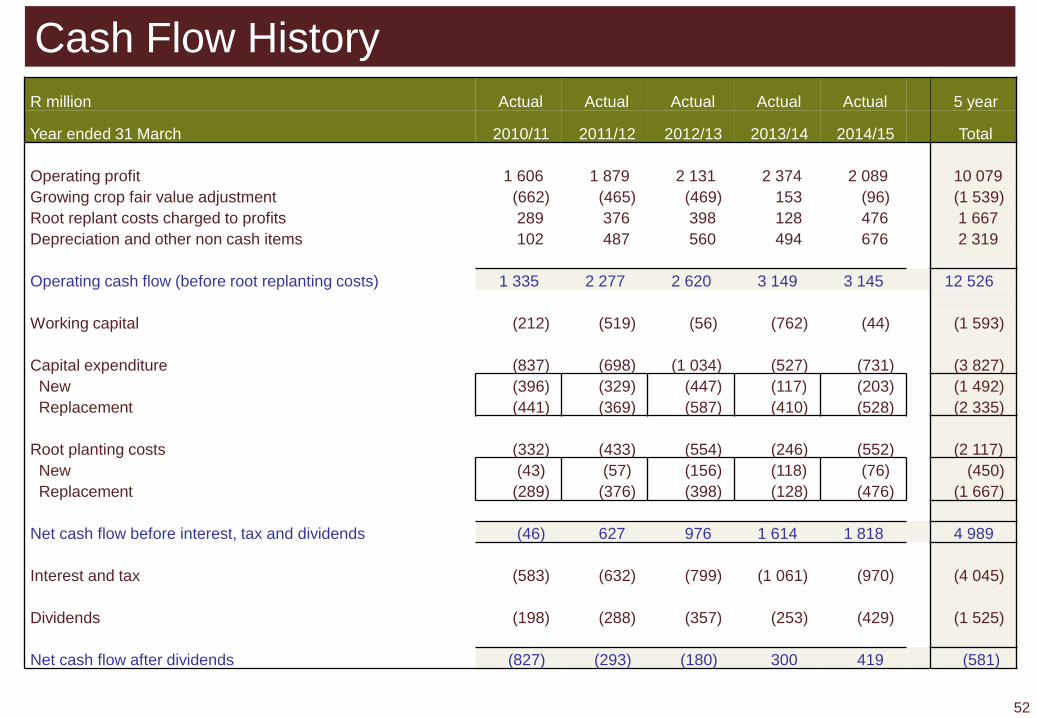
R million Actual Actual Actual Actual Actual 5 year
Year ended 31 March 2010/11 2011/12 2012/13 2013/14 2014/15 Total
Operating profit 1 606 1 879 2 131 2 374 2 089 10 079
Growing crop fair value adjustment (662) (465) (469) 153 (96) (1 539)
Root replant costs charged to profits 289 376 398 128 476 1 667
Depreciation and other non cash items 102 487 560 494 676 2 319
Operating cash flow (before root replanting costs) 1 335 2 277 2 620 3 149 3 145 12 526
Working capital (212) (519) (56) (762) (44) (1 593)
Capital expenditure (837) (698) (1 034) (527) (731) (3 827)
New (396) (329) (447) (117) (203) (1 492)
Replacement (441) (369) (587) (410) (528) (2 335)
Root planting costs (332) (433) (554) (246) (552) (2 117)
New (43) (57) (156) (118) (76) (450)
Replacement (289) (376) (398) (128) (476) (1 667)
Net cash flow before interest, tax and dividends (46) 627 976 1 614 1 818 4 989
Interest and tax (583) (632) (799) (1 061) (970) (4 045)
Dividends (198) (288) (357) (253) (429) (1 525)
Net cash flow after dividends (827) (293) (180) 300 419 (581)
Cash Flow History
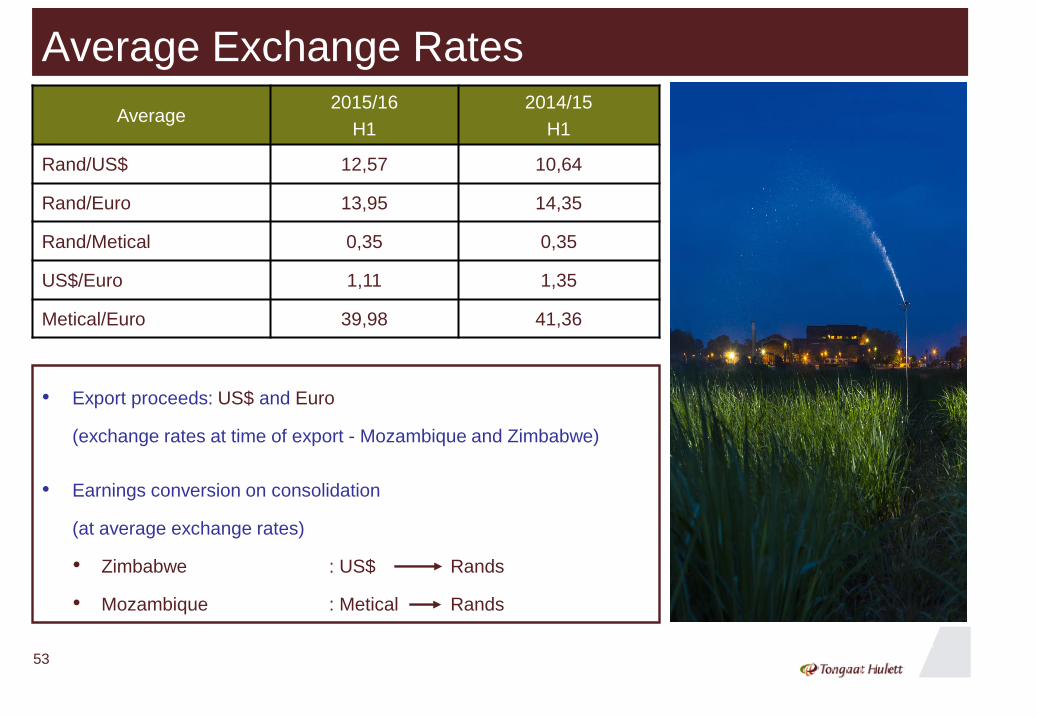
Average Exchange Rates
Average2015/16
H1
2014/15
H1
Rand/US$ 12,57 10,64
Rand/Euro 13,95 14,35
Rand/Metical 0,35 0,35
US$/Euro 1,11 1,35
Metical/Euro 39,98 41,36
• Export proceeds: US$ and Euro
(exchange rates at time of export - Mozambique and Zimbabwe)
• Earnings conversion on consolidation
(at average exchange rates)
• Zimbabwe : US$ Rands
• Mozambique : Metical Rands
53
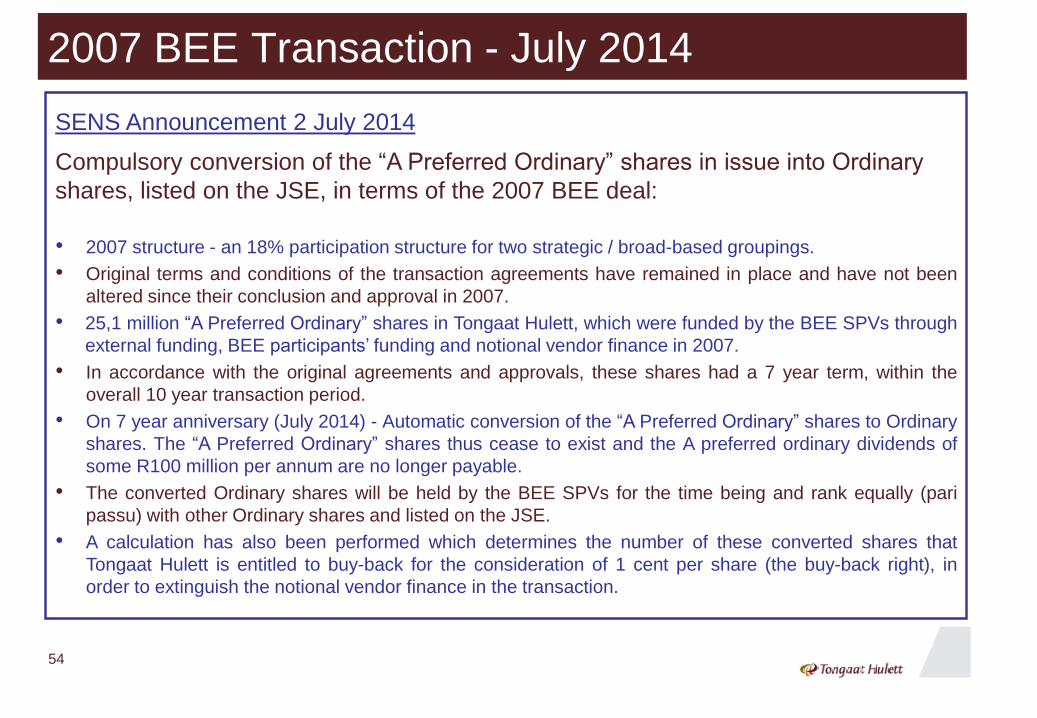
2007 BEE Transaction - July 2014
SENS Announcement 2 July 2014
Compulsory conversion of the “A Preferred Ordinary” shares in issue into Ordinary
shares, listed on the JSE, in terms of the 2007 BEE deal:
• 2007 structure - an 18% participation structure for two strategic / broad-based groupings.
• Original terms and conditions of the transaction agreements have remained in place and have not been
altered since their conclusion and approval in 2007.
• 25,1 million “A Preferred Ordinary” shares in Tongaat Hulett, which were funded by the BEE SPVs through
external funding, BEE participants’ funding and notional vendor finance in 2007.
• In accordance with the original agreements and approvals, these shares had a 7 year term, within the
overall 10 year transaction period.
• On 7 year anniversary (July 2014) - Automatic conversion of the “A Preferred Ordinary” shares to Ordinary
shares. The “A Preferred Ordinary” shares thus cease to exist and the A preferred ordinary dividends of
some R100 million per annum are no longer payable.
• The converted Ordinary shares will be held by the BEE SPVs for the time being and rank equally (pari
passu) with other Ordinary shares and listed on the JSE.
• A calculation has also been performed which determines the number of these converted shares that
Tongaat Hulett is entitled to buy-back for the consideration of 1 cent per share (the buy-back right), in
order to extinguish the notional vendor finance in the transaction.
54
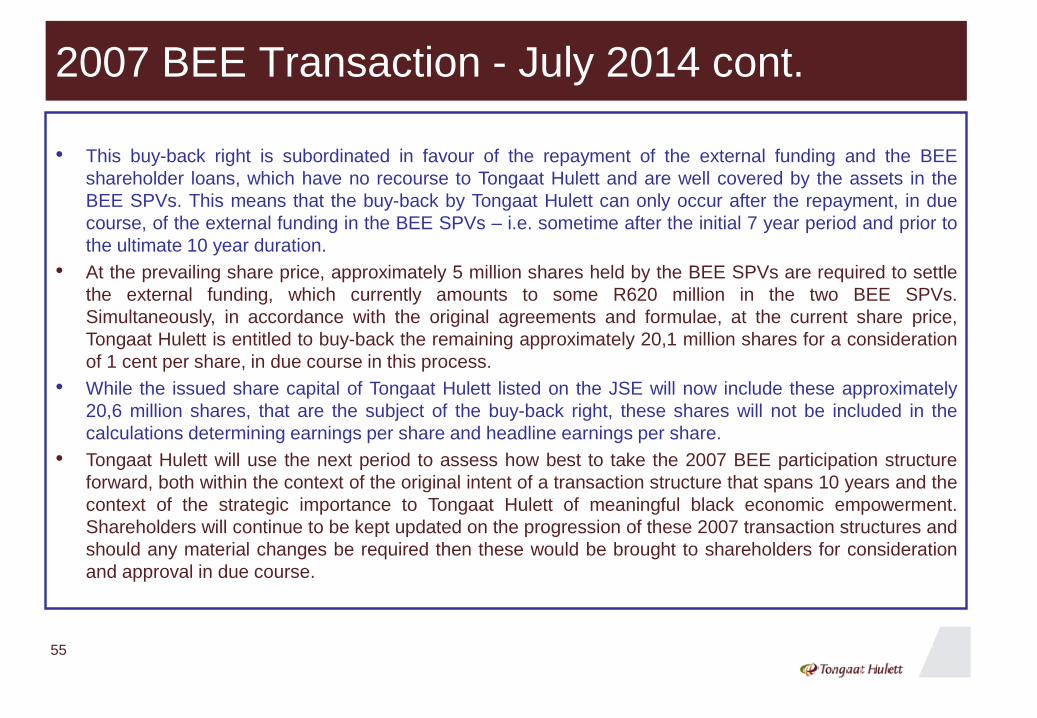
2007 BEE Transaction - July 2014 cont.
• This buy-back right is subordinated in favour of the repayment of the external funding and the BEE
shareholder loans, which have no recourse to Tongaat Hulett and are well covered by the assets in the
BEE SPVs. This means that the buy-back by Tongaat Hulett can only occur after the repayment, in due
course, of the external funding in the BEE SPVs – i.e. sometime after the initial 7 year period and prior to
the ultimate 10 year duration.
• At the prevailing share price, approximately 5 million shares held by the BEE SPVs are required to settle
the external funding, which currently amounts to some R620 million in the two BEE SPVs.
Simultaneously, in accordance with the original agreements and formulae, at the current share price,
Tongaat Hulett is entitled to buy-back the remaining approximately 20,1 million shares for a consideration
of 1 cent per share, in due course in this process.
• While the issued share capital of Tongaat Hulett listed on the JSE will now include these approximately
20,6 million shares, that are the subject of the buy-back right, these shares will not be included in the
calculations determining earnings per share and headline earnings per share.
• Tongaat Hulett will use the next period to assess how best to take the 2007 BEE participation structure
forward, both within the context of the original intent of a transaction structure that spans 10 years and the
context of the strategic importance to Tongaat Hulett of meaningful black economic empowerment.
Shareholders will continue to be kept updated on the progression of these 2007 transaction structures and
should any material changes be required then these would be brought to shareholders for consideration
and approval in due course.
55
56