Embed Size (px)
Citation preview
PPMI Prodromal cohort Hyposmia
Danna Jennings, MD Institute of Neurodegenerative disorders
May 7, 2014
PPMI 2014 Annual Meeting
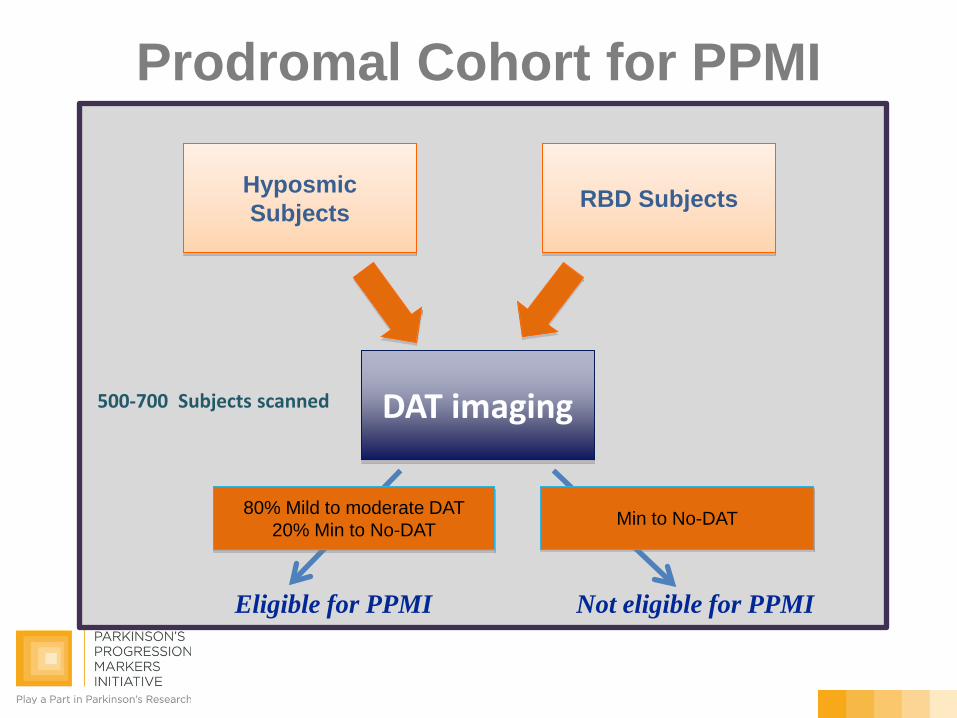
Prodromal Cohort for PPMI
Hyposmic Subjects RBD Subjects
DAT imaging
Eligible for PPMI Not eligible for PPMI
80% Mild to moderate DAT 20% Min to No-DAT Min to No-DAT
500-700 Subjects scanned
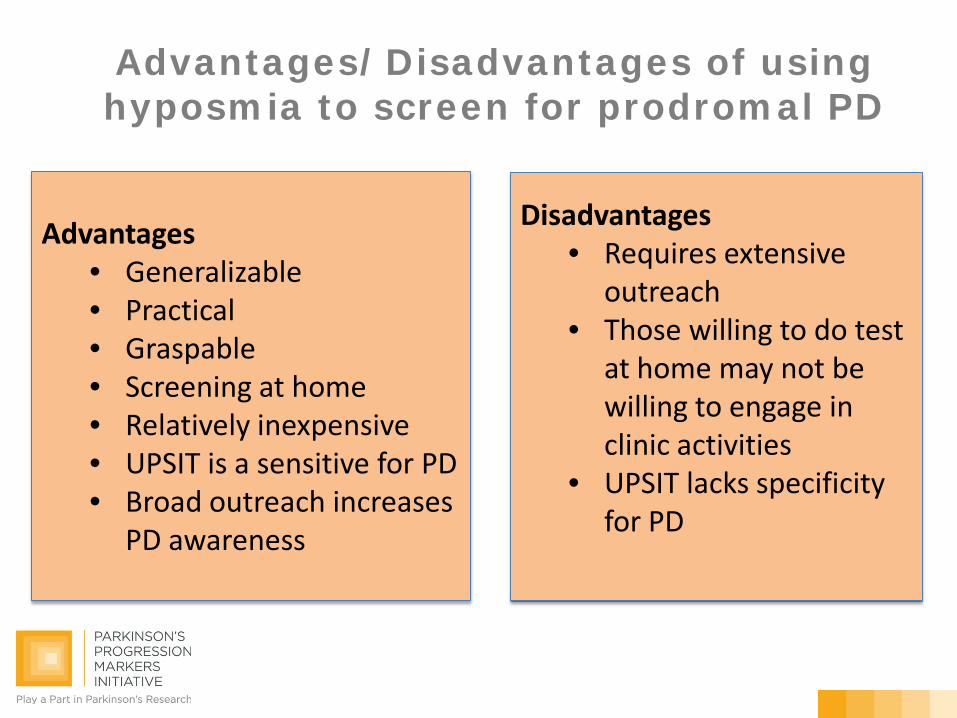
Advantages/Disadvantages of using hyposmia to screen for prodromal PD
Advantages
• Generalizable • Practical • Graspable • Screening at home • Relatively inexpensive • UPSIT is a sensitive for PD • Broad outreach increases
PD awareness
Disadvantages • Requires extensive
outreach • Those willing to do test
at home may not be willing to engage in clinic activities
• UPSIT lacks specificity for PD
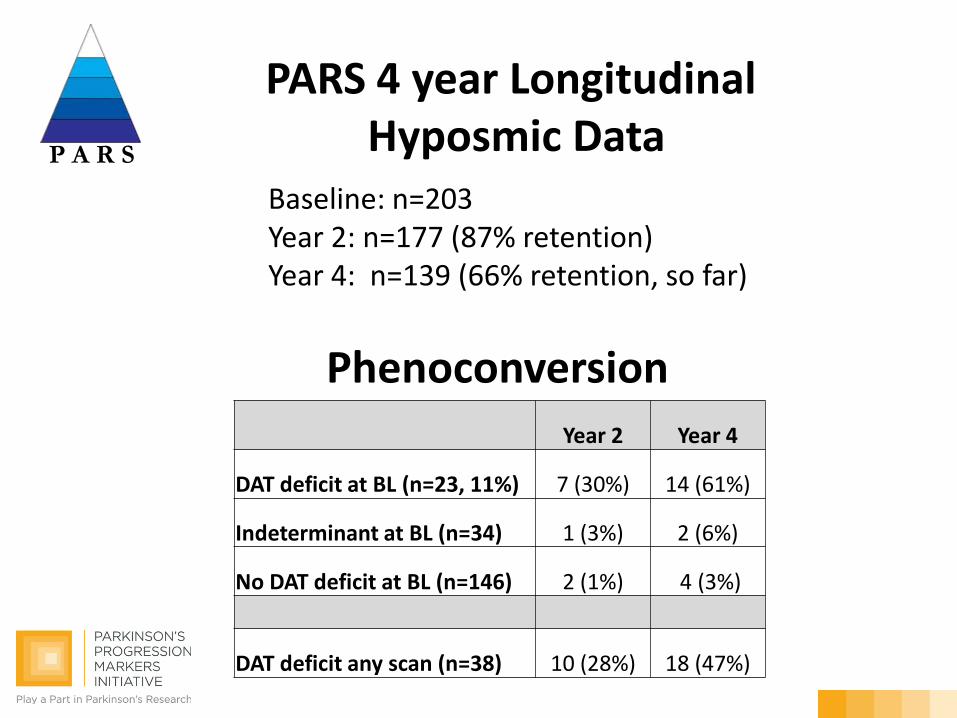
Phenoconversion
P A R S
Year 2 Year 4
DAT deficit at BL (n=23, 11%) 7 (30%) 14 (61%)
Indeterminant at BL (n=34) 1 (3%) 2 (6%)
No DAT deficit at BL (n=146) 2 (1%) 4 (3%)
DAT deficit any scan (n=38) 10 (28%) 18 (47%)
Baseline: n=203 Year 2: n=177 (87% retention) Year 4: n=139 (66% retention, so far)
PARS 4 year Longitudinal Hyposmic Data
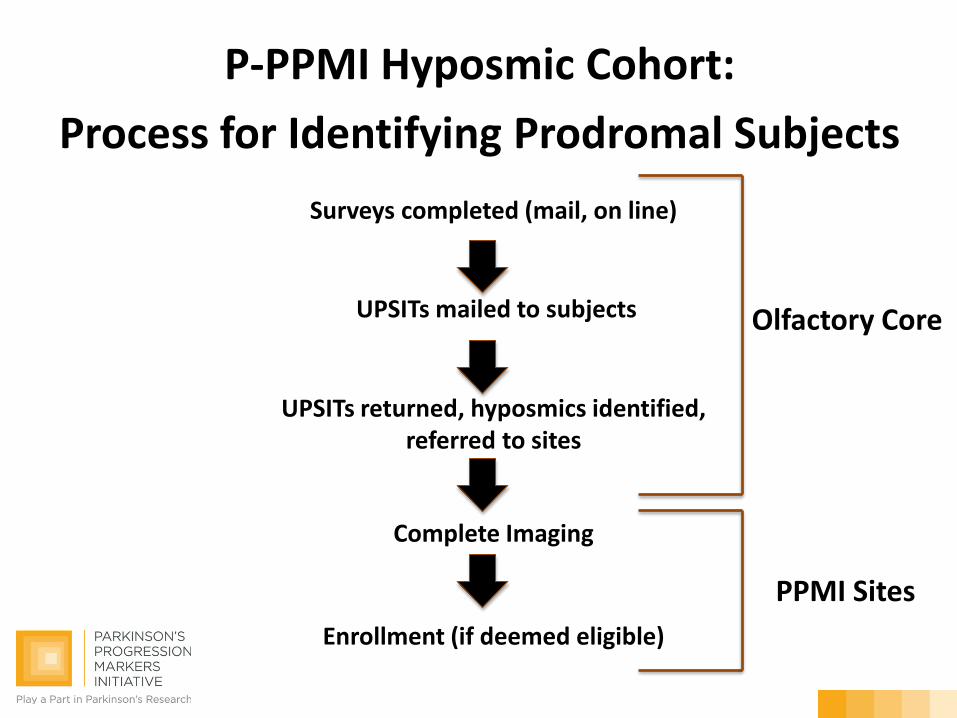
Surveys completed (mail, on line)
UPSITs mailed to subjects
UPSITs returned, hyposmics identified, referred to sites
Complete Imaging
Enrollment (if deemed eligible)
P-PPMI Hyposmic Cohort:
Process for Identifying Prodromal Subjects
Olfactory Core
PPMI Sites
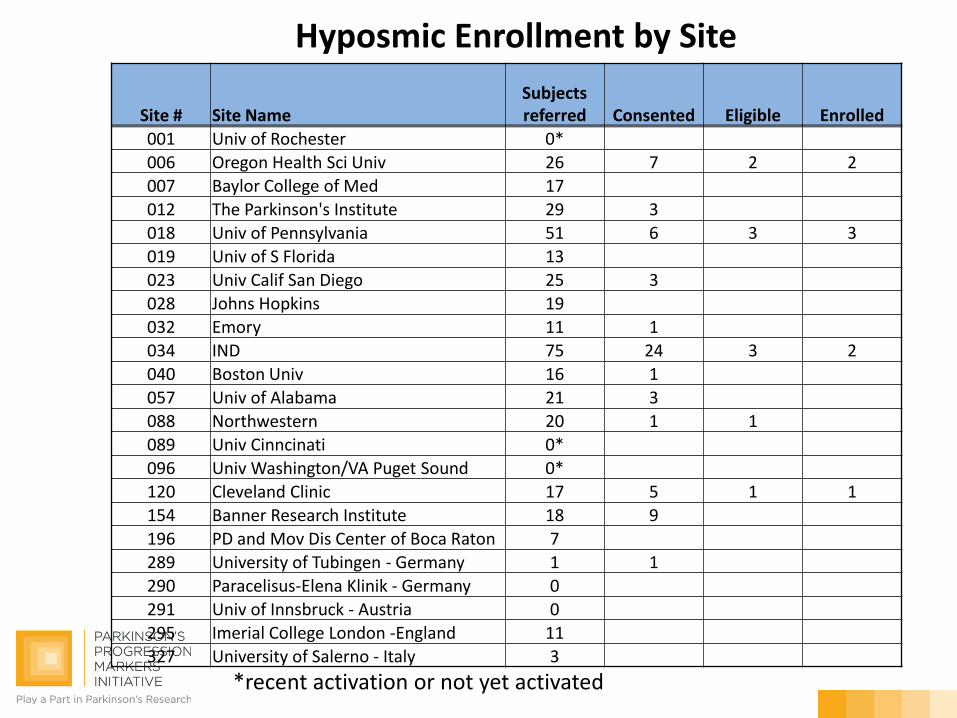
Site # Site Name Subjects referred Consented Eligible Enrolled
001 Univ of Rochester 0* 006 Oregon Health Sci Univ 26 7 2 2 007 Baylor College of Med 17 012 The Parkinson's Institute 29 3 018 Univ of Pennsylvania 51 6 3 3 019 Univ of S Florida 13 023 Univ Calif San Diego 25 3 028 Johns Hopkins 19 032 Emory 11 1 034 IND 75 24 3 2 040 Boston Univ 16 1 057 Univ of Alabama 21 3 088 Northwestern 20 1 1 089 Univ Cinncinati 0* 096 Univ Washington/VA Puget Sound 0* 120 Cleveland Clinic 17 5 1 1 154 Banner Research Institute 18 9 196 PD and Mov Dis Center of Boca Raton 7 289 University of Tubingen - Germany 1 1 290 Paracelisus-Elena Klinik - Germany 0 291 Univ of Innsbruck - Austria 0 295 Imerial College London -England 11 327 University of Salerno - Italy 3
Hyposmic Enrollment by Site
*recent activation or not yet activated
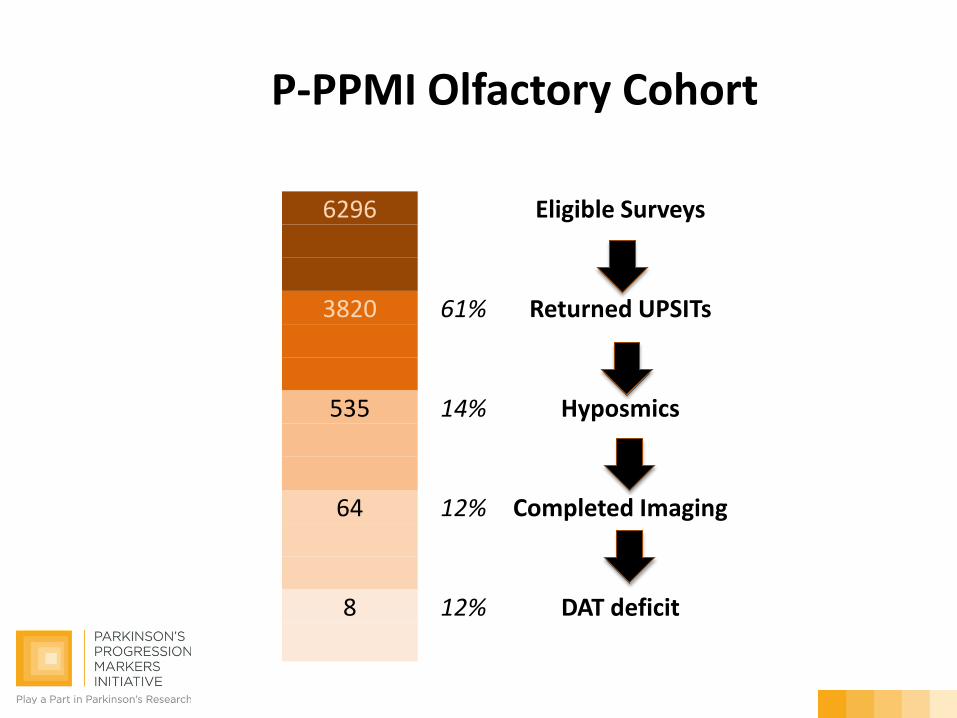
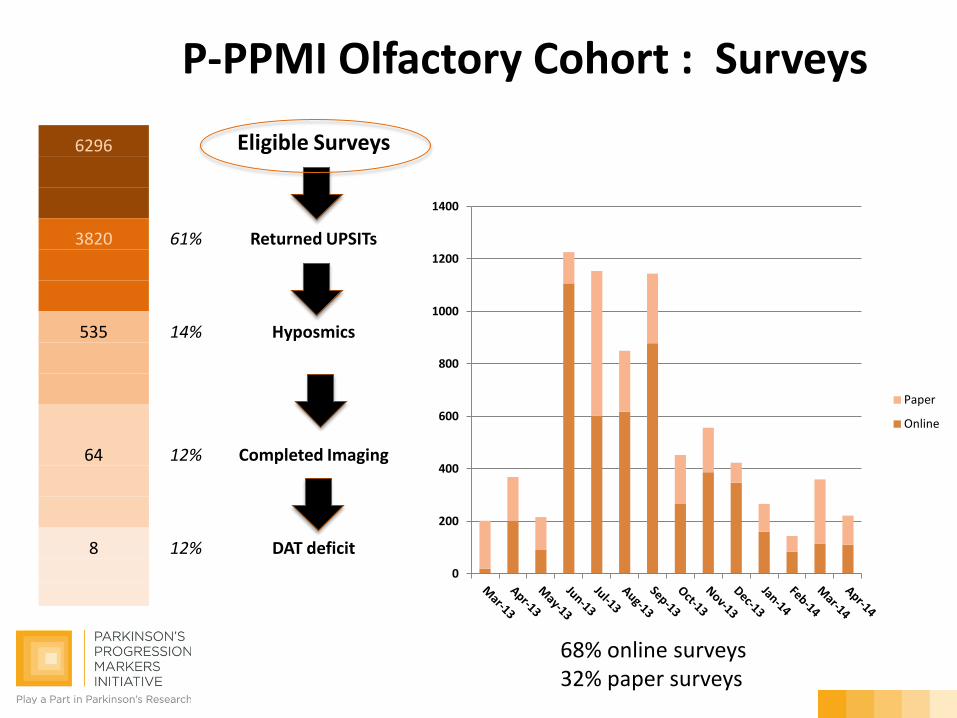
6296 Eligible Surveys
3820 61% Returned UPSITs
535 14% Hyposmics
64 12% Completed Imaging 8 12% DAT deficit
P-PPMI Olfactory Cohort
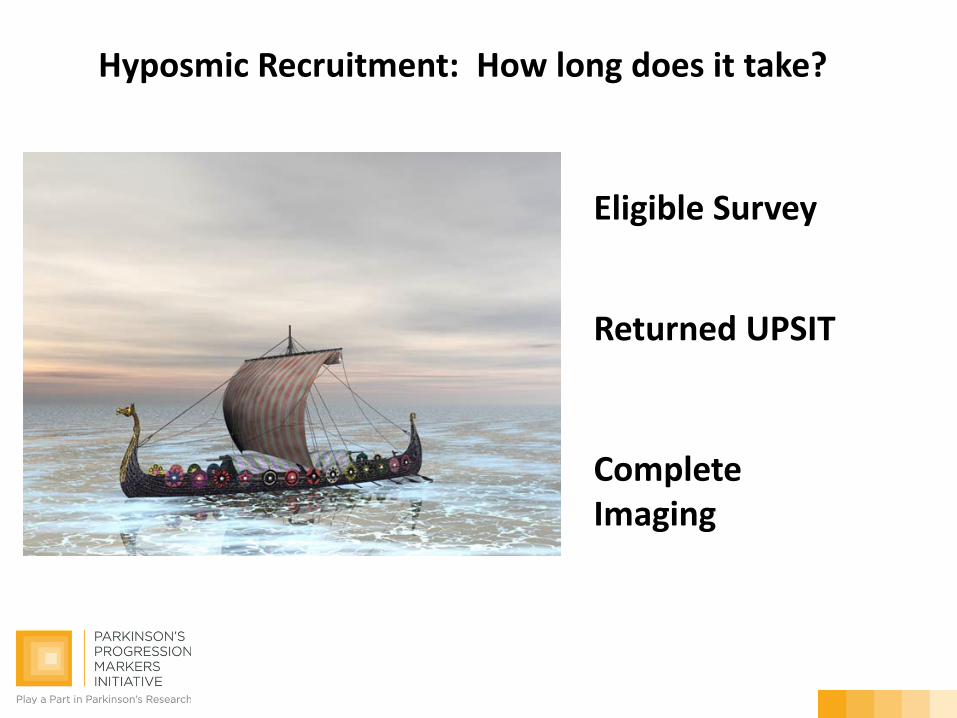
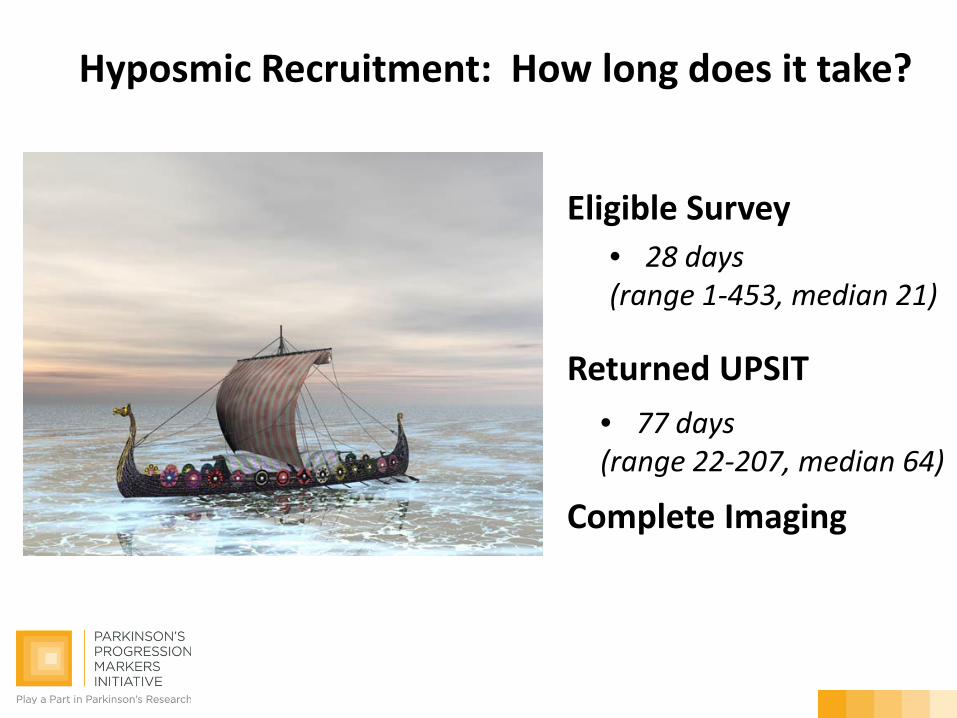
Hyposmic Recruitment: How long does it take?
Eligible Survey
Returned UPSIT
Complete Imaging
Hyposmic Recruitment: How long does it take?
Eligible Survey
Returned UPSIT
Complete Imaging
• 28 days (range 1-453, median 21)
• 77 days (range 22-207, median 64)
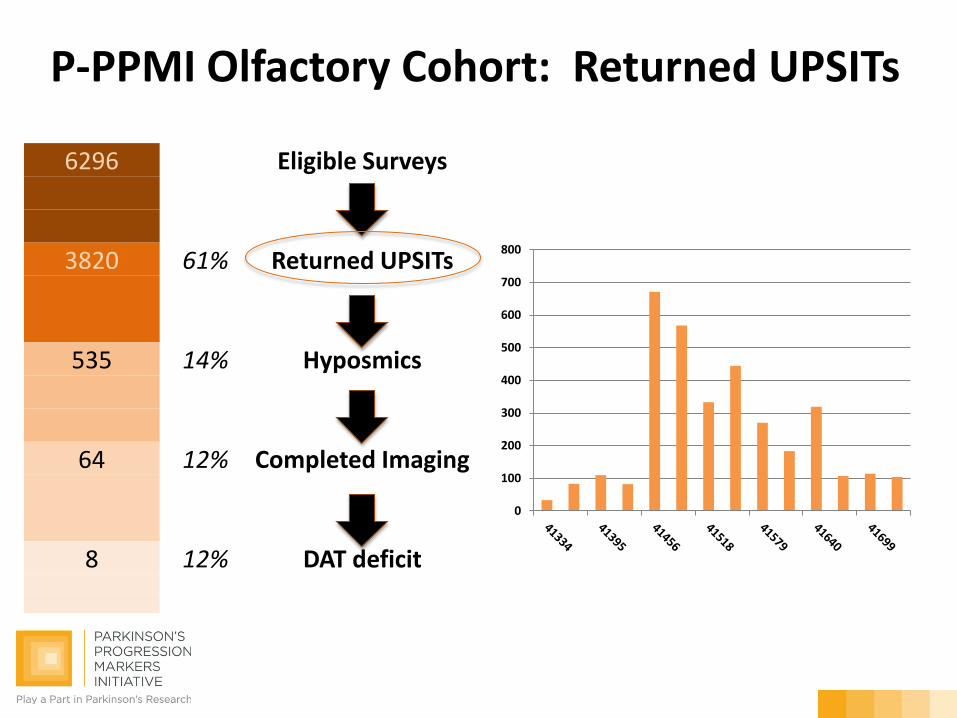
6296 Eligible Surveys
3820 61% Returned UPSITs
535 14% Hyposmics
64 12% Completed Imaging
8 12% DAT deficit
P-PPMI Olfactory Cohort : Surveys
0
200
400
600
800
1000
1200
1400
Paper
Online
68% online surveys 32% paper surveys
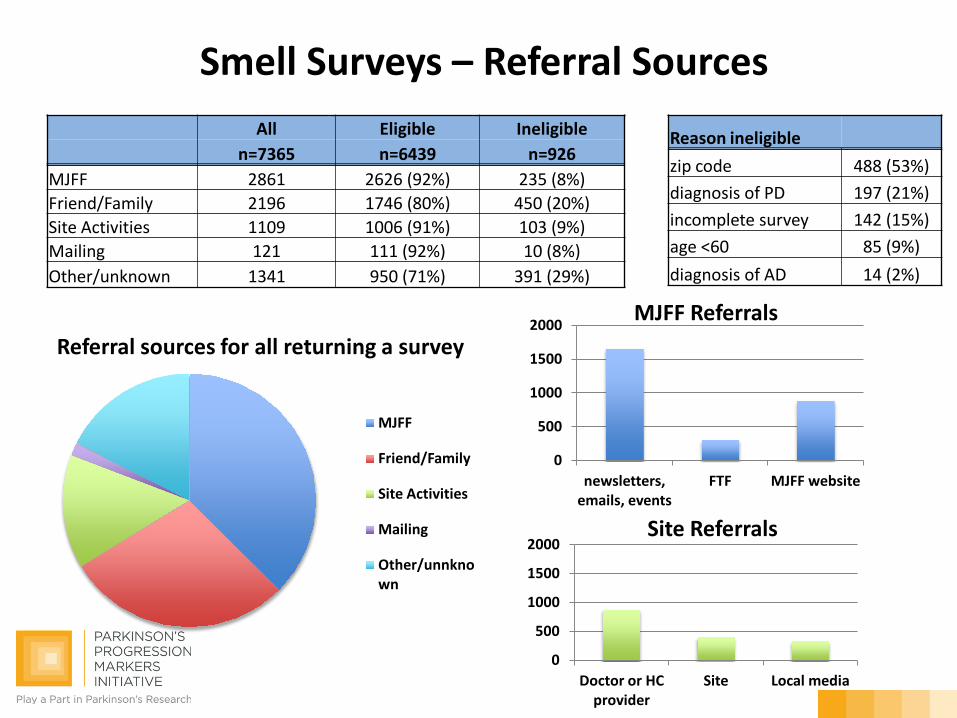
All Eligible Ineligible n=7365 n=6439 n=926 MJFF 2861 2626 (92%) 235 (8%) Friend/Family 2196 1746 (80%) 450 (20%) Site Activities 1109 1006 (91%) 103 (9%) Mailing 121 111 (92%) 10 (8%) Other/unknown 1341 950 (71%) 391 (29%)
MJFF
Friend/Family
Site Activities
Mailing
Other/unnknown
0
500
1000
1500
2000
newsletters, emails, events
FTF MJFF website
Smell Surveys – Referral Sources
Reason ineligible zip code 488 (53%) diagnosis of PD 197 (21%) incomplete survey 142 (15%) age <60 85 (9%) diagnosis of AD 14 (2%)
MJFF Referrals
Site Referrals
Referral sources for all returning a survey
0
500
1000
1500
2000
Doctor or HC provider
Site Local media
6296 Eligible Surveys
3820 61% Returned UPSITs
535 14% Hyposmics
64 12% Completed Imaging 8 12% DAT deficit
P-PPMI Olfactory Cohort: Returned UPSITs
0
100
200
300
400
500
600
700
800
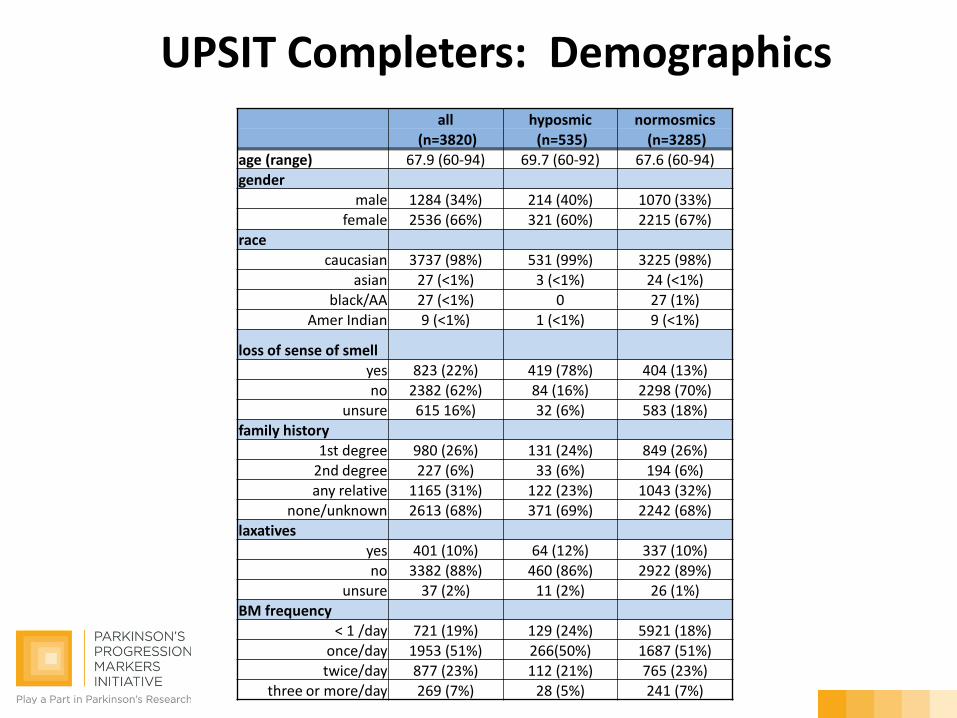
all hyposmic normosmics (n=3820) (n=535) (n=3285) age (range) 67.9 (60-94) 69.7 (60-92) 67.6 (60-94) gender
male 1284 (34%) 214 (40%) 1070 (33%) female 2536 (66%) 321 (60%) 2215 (67%)
race caucasian 3737 (98%) 531 (99%) 3225 (98%)
asian 27 (<1%) 3 (<1%) 24 (<1%) black/AA 27 (<1%) 0 27 (1%)
Amer Indian 9 (<1%) 1 (<1%) 9 (<1%)
loss of sense of smell yes 823 (22%) 419 (78%) 404 (13%) no 2382 (62%) 84 (16%) 2298 (70%)
unsure 615 16%) 32 (6%) 583 (18%) family history
1st degree 980 (26%) 131 (24%) 849 (26%) 2nd degree 227 (6%) 33 (6%) 194 (6%) any relative 1165 (31%) 122 (23%) 1043 (32%)
none/unknown 2613 (68%) 371 (69%) 2242 (68%) laxatives
yes 401 (10%) 64 (12%) 337 (10%) no 3382 (88%) 460 (86%) 2922 (89%)
unsure 37 (2%) 11 (2%) 26 (1%) BM frequency
< 1 /day 721 (19%) 129 (24%) 5921 (18%) once/day 1953 (51%) 266(50%) 1687 (51%) twice/day 877 (23%) 112 (21%) 765 (23%)
three or more/day 269 (7%) 28 (5%) 241 (7%)
UPSIT Completers: Demographics
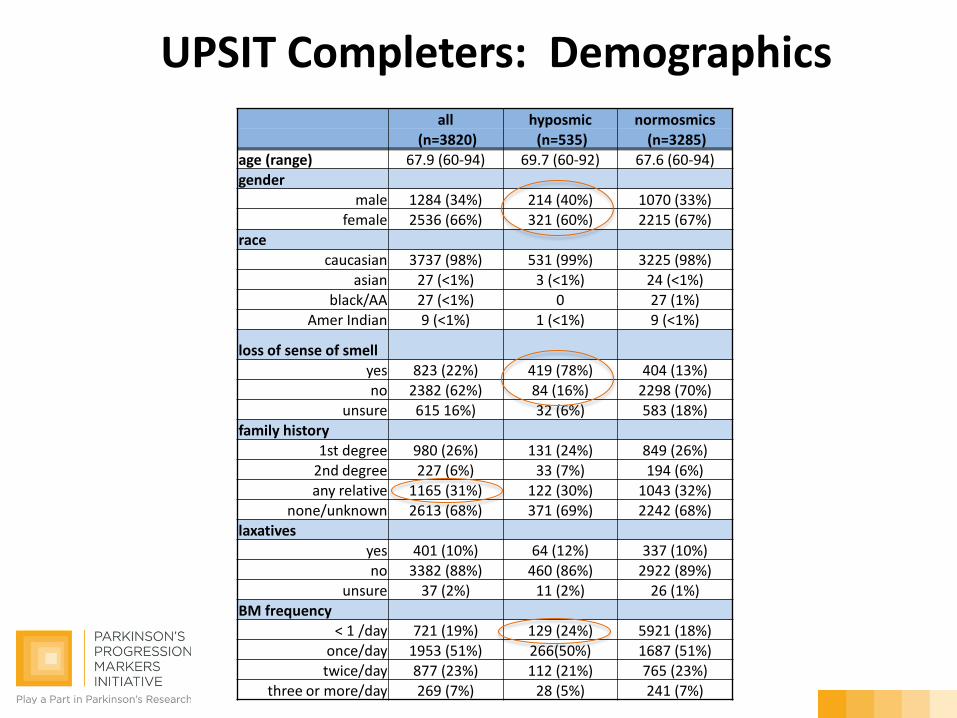
all hyposmic normosmics (n=3820) (n=535) (n=3285) age (range) 67.9 (60-94) 69.7 (60-92) 67.6 (60-94) gender
male 1284 (34%) 214 (40%) 1070 (33%) female 2536 (66%) 321 (60%) 2215 (67%)
race caucasian 3737 (98%) 531 (99%) 3225 (98%)
asian 27 (<1%) 3 (<1%) 24 (<1%) black/AA 27 (<1%) 0 27 (1%)
Amer Indian 9 (<1%) 1 (<1%) 9 (<1%)
loss of sense of smell yes 823 (22%) 419 (78%) 404 (13%) no 2382 (62%) 84 (16%) 2298 (70%)
unsure 615 16%) 32 (6%) 583 (18%) family history
1st degree 980 (26%) 131 (24%) 849 (26%) 2nd degree 227 (6%) 33 (7%) 194 (6%) any relative 1165 (31%) 122 (30%) 1043 (32%)
none/unknown 2613 (68%) 371 (69%) 2242 (68%) laxatives
yes 401 (10%) 64 (12%) 337 (10%) no 3382 (88%) 460 (86%) 2922 (89%)
unsure 37 (2%) 11 (2%) 26 (1%) BM frequency
< 1 /day 721 (19%) 129 (24%) 5921 (18%) once/day 1953 (51%) 266(50%) 1687 (51%) twice/day 877 (23%) 112 (21%) 765 (23%)
three or more/day 269 (7%) 28 (5%) 241 (7%)
UPSIT Completers: Demographics
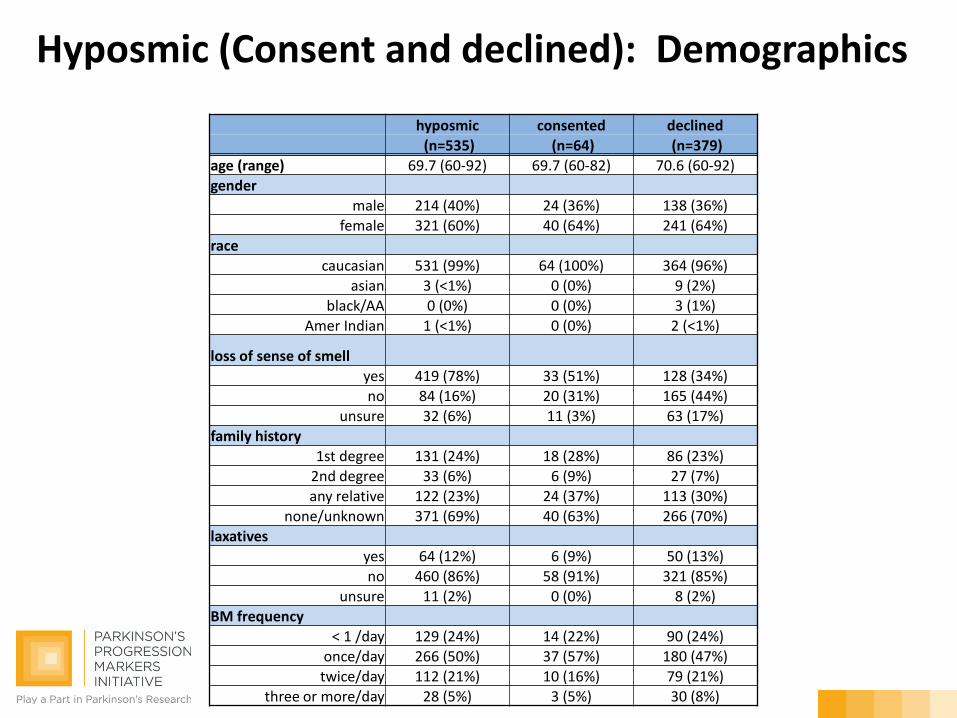
hyposmic consented declined (n=535) (n=64) (n=379) age (range) 69.7 (60-92) 69.7 (60-82) 70.6 (60-92) gender
male 214 (40%) 24 (36%) 138 (36%) female 321 (60%) 40 (64%) 241 (64%)
race caucasian 531 (99%) 64 (100%) 364 (96%)
asian 3 (<1%) 0 (0%) 9 (2%) black/AA 0 (0%) 0 (0%) 3 (1%)
Amer Indian 1 (<1%) 0 (0%) 2 (<1%)
loss of sense of smell yes 419 (78%) 33 (51%) 128 (34%) no 84 (16%) 20 (31%) 165 (44%)
unsure 32 (6%) 11 (3%) 63 (17%) family history
1st degree 131 (24%) 18 (28%) 86 (23%) 2nd degree 33 (6%) 6 (9%) 27 (7%) any relative 122 (23%) 24 (37%) 113 (30%)
none/unknown 371 (69%) 40 (63%) 266 (70%) laxatives
yes 64 (12%) 6 (9%) 50 (13%) no 460 (86%) 58 (91%) 321 (85%)
unsure 11 (2%) 0 (0%) 8 (2%) BM frequency
< 1 /day 129 (24%) 14 (22%) 90 (24%) once/day 266 (50%) 37 (57%) 180 (47%) twice/day 112 (21%) 10 (16%) 79 (21%)
three or more/day 28 (5%) 3 (5%) 30 (8%)
Hyposmic (Consent and declined): Demographics
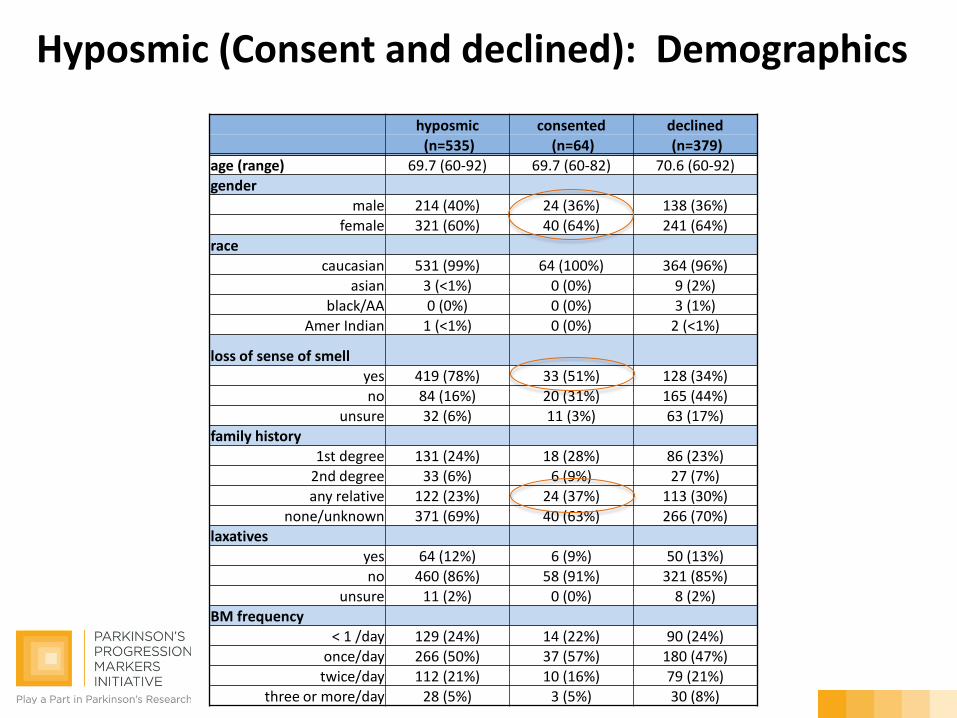
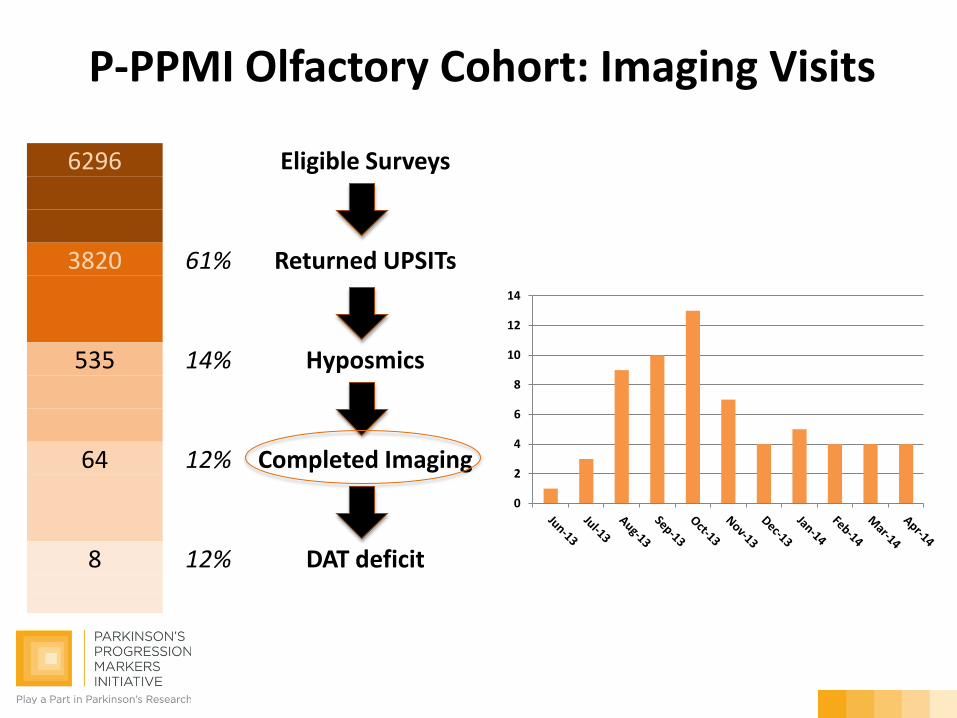
6296 Eligible Surveys
3820 61% Returned UPSITs
535 14% Hyposmics
64 12% Completed Imaging 8 12% DAT deficit
P-PPMI Olfactory Cohort: Imaging Visits
0
2
4
6
8
10
12
14
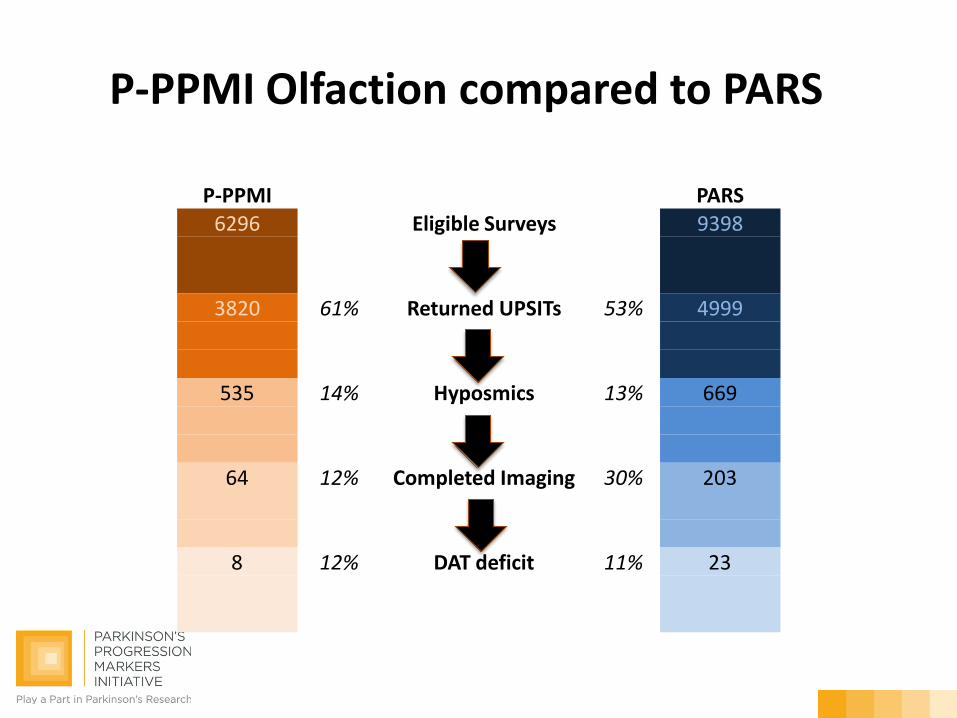
P-PPMI Olfaction compared to PARS
P-PPMI PARS 6296 Eligible Surveys 9398
3820 61% Returned UPSITs 53% 4999
535 14% Hyposmics 13% 669
64 12% Completed Imaging 30% 203 8 12% DAT deficit 11% 23
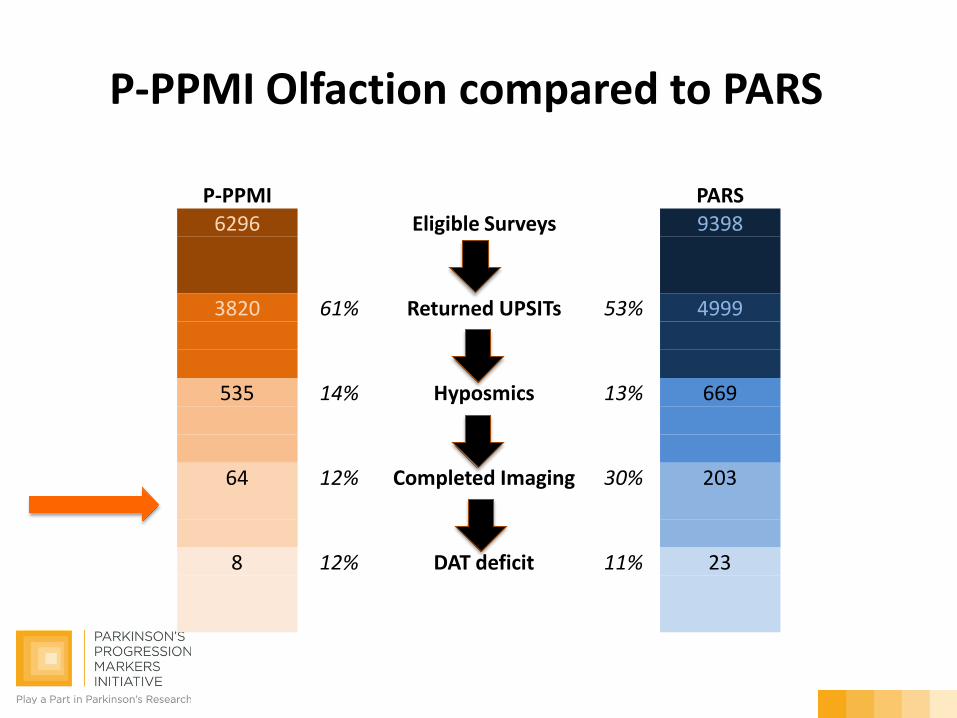
P-PPMI PARS 6296 Eligible Surveys 9398
3820 61% Returned UPSITs 53% 4999
535 14% Hyposmics 13% 669
64 12% Completed Imaging 30% 203 8 12% DAT deficit 11% 23
P-PPMI Olfaction compared to PARS
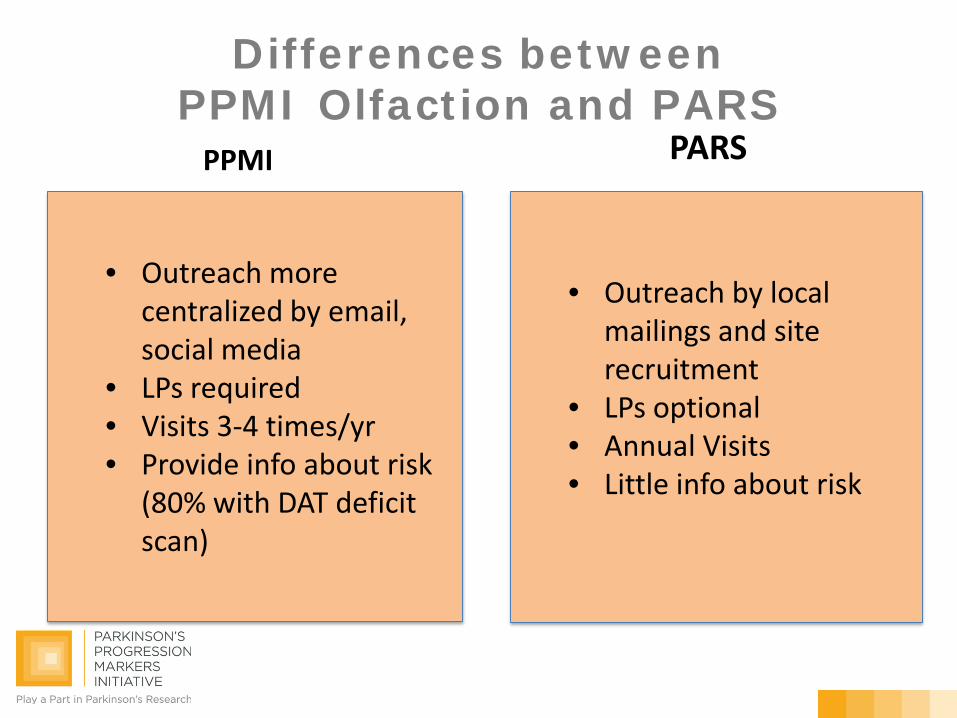
Differences between PPMI Olfaction and PARS
• Outreach more centralized by email, social media
• LPs required • Visits 3-4 times/yr • Provide info about risk
(80% with DAT deficit scan)
• Outreach by local mailings and site recruitment
• LPs optional • Annual Visits • Little info about risk
PPMI PARS
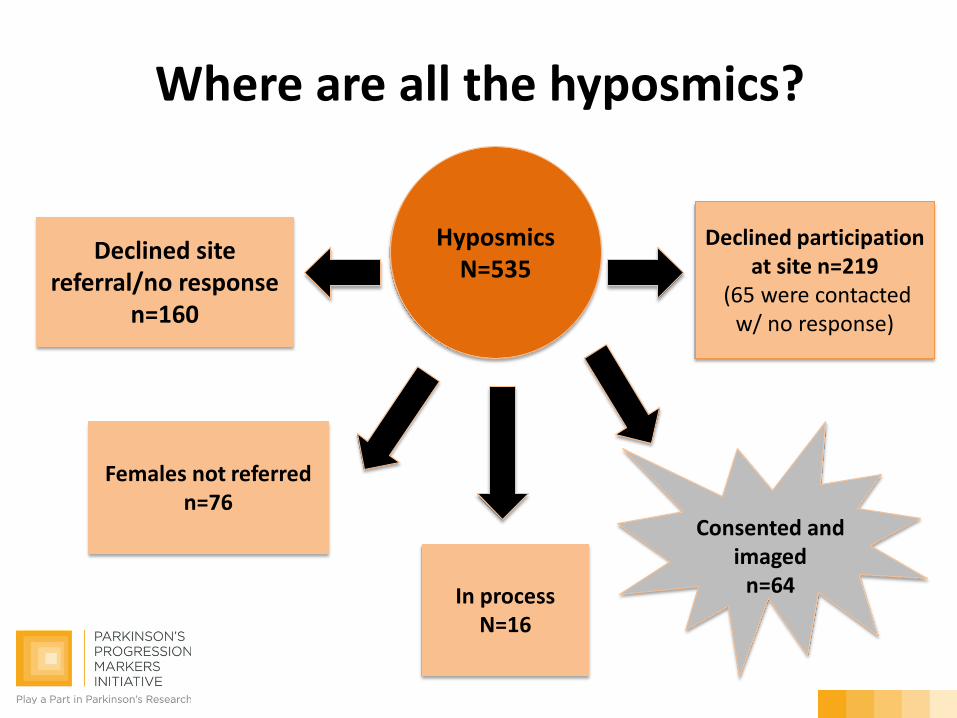
Where are all the hyposmics?
Hyposmics N=535
Consented and
imaged n=64
Declined site referral/no response
n=160
Females not referred n=76
Declined participation at site n=219
(65 were contacted w/ no response)
In process N=16
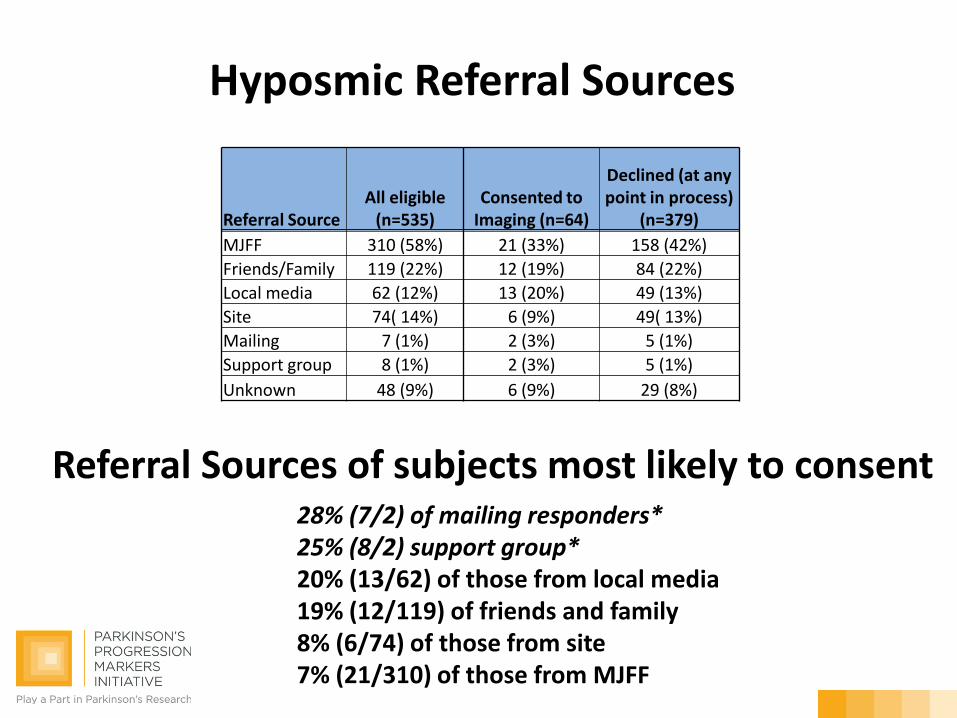
28% (7/2) of mailing responders* 25% (8/2) support group* 20% (13/62) of those from local media 19% (12/119) of friends and family 8% (6/74) of those from site 7% (21/310) of those from MJFF
Referral Source All eligible
(n=535) Consented to
Imaging (n=64)
Declined (at any point in process)
(n=379) MJFF 310 (58%) 21 (33%) 158 (42%) Friends/Family 119 (22%) 12 (19%) 84 (22%) Local media 62 (12%) 13 (20%) 49 (13%) Site 74( 14%) 6 (9%) 49( 13%) Mailing 7 (1%) 2 (3%) 5 (1%) Support group 8 (1%) 2 (3%) 5 (1%) Unknown 48 (9%) 6 (9%) 29 (8%)
Hyposmic Referral Sources
Referral Sources of subjects most likely to consent
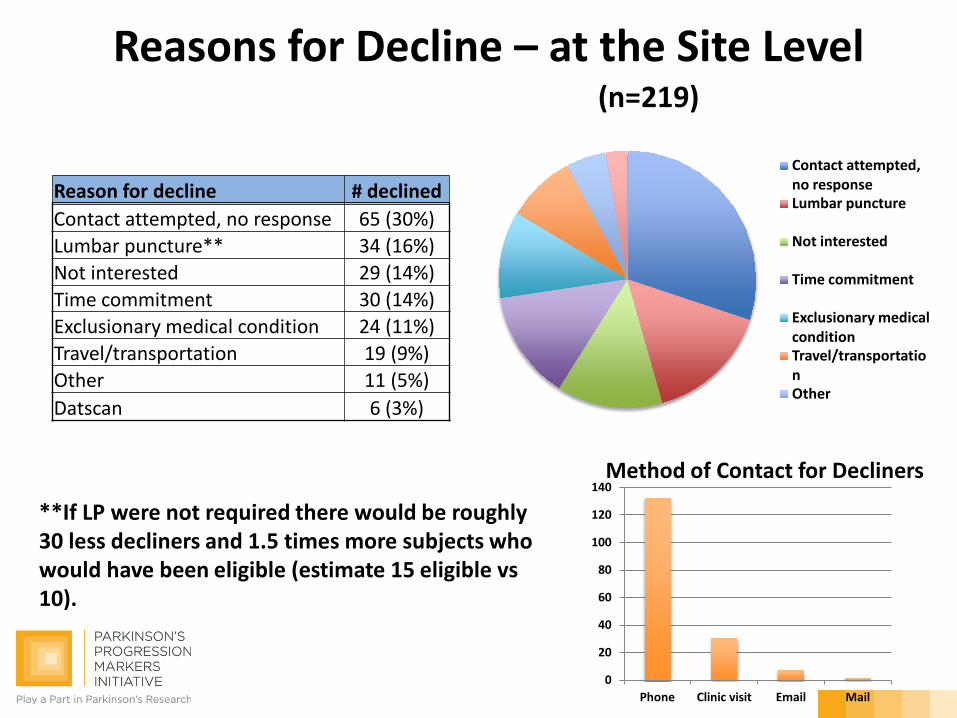
Reasons for Decline – at the Site Level (n=219)
Reason for decline # declined Contact attempted, no response 65 (30%) Lumbar puncture** 34 (16%) Not interested 29 (14%) Time commitment 30 (14%) Exclusionary medical condition 24 (11%) Travel/transportation 19 (9%) Other 11 (5%) Datscan 6 (3%)
**If LP were not required there would be roughly 30 less decliners and 1.5 times more subjects who would have been eligible (estimate 15 eligible vs 10).
Contact attempted, no response Lumbar puncture
Not interested
Time commitment
Exclusionary medical condition Travel/transportation Other
0
20
40
60
80
100
120
140
Phone Clinic visit Email Mail
Method of Contact for Decliners
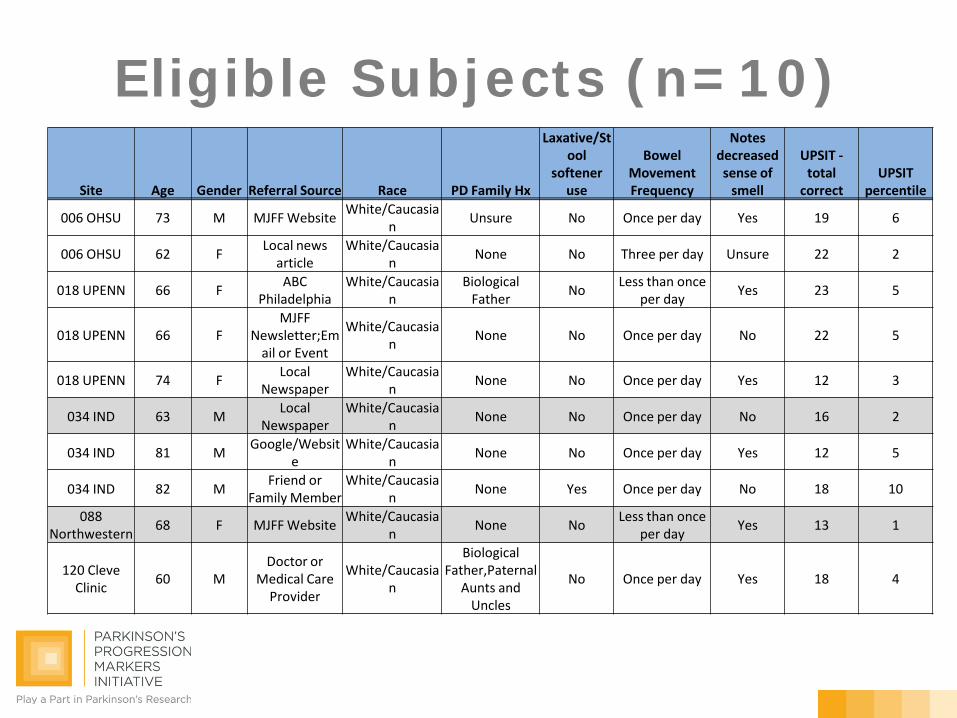
Eligible Subjects (n=10)
Site Age Gender Referral Source Race PD Family Hx
Laxative/Stool
softener use
Bowel Movement Frequency
Notes decreased sense of
smell
UPSIT - total
correct UPSIT
percentile
006 OHSU 73 M MJFF Website White/Caucasian Unsure No Once per day Yes 19 6
006 OHSU 62 F Local news article
White/Caucasian None No Three per day Unsure 22 2
018 UPENN 66 F ABC Philadelphia
White/Caucasian
Biological Father No Less than once
per day Yes 23 5
018 UPENN 66 F MJFF
Newsletter;Email or Event
White/Caucasian None No Once per day No 22 5
018 UPENN 74 F Local Newspaper
White/Caucasian None No Once per day Yes 12 3
034 IND 63 M Local Newspaper
White/Caucasian None No Once per day No 16 2
034 IND 81 M Google/Website
White/Caucasian None No Once per day Yes 12 5
034 IND 82 M Friend or Family Member
White/Caucasian None Yes Once per day No 18 10
088 Northwestern 68 F MJFF Website White/Caucasia
n None No Less than once per day Yes 13 1
120 Cleve Clinic 60 M
Doctor or Medical Care
Provider
White/Caucasian
Biological Father,Paternal
Aunts and Uncles
No Once per day Yes 18 4
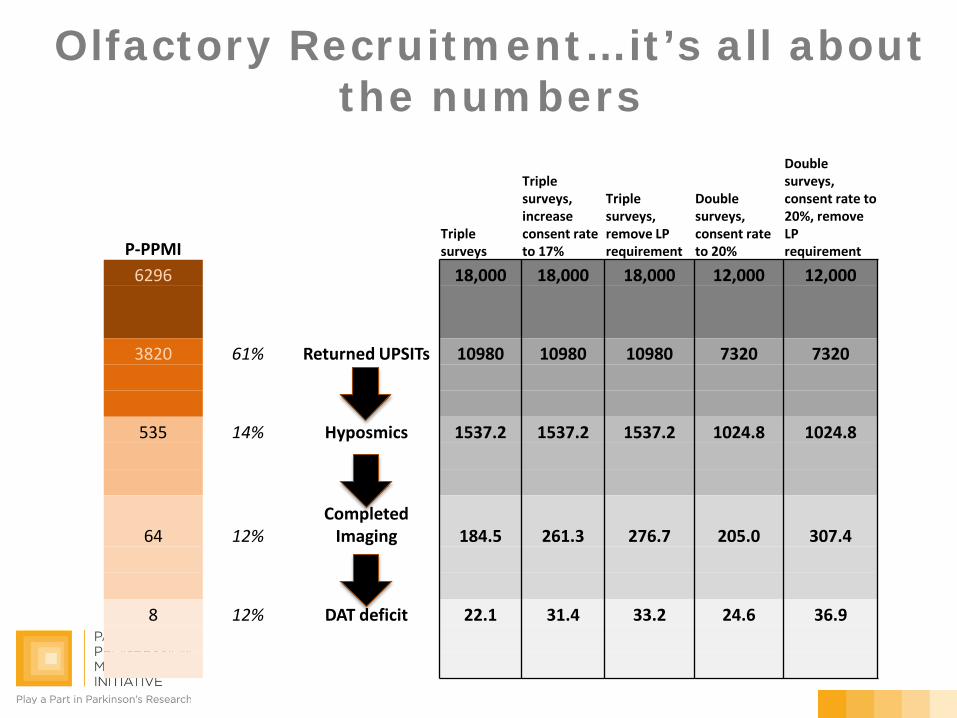
Olfactory Recruitment…it’s all about the numbers
P-PPMI Triple surveys
Triple surveys, increase consent rate to 17%
Triple surveys, remove LP requirement
Double surveys, consent rate to 20%
Double surveys, consent rate to 20%, remove LP requirement
6296 18,000 18,000 18,000 12,000 12,000
3820 61% Returned UPSITs 10980 10980 10980 7320 7320
535 14% Hyposmics 1537.2 1537.2 1537.2 1024.8 1024.8
64 12% Completed
Imaging 184.5 261.3 276.7 205.0 307.4 8 12% DAT deficit 22.1 31.4 33.2 24.6 36.9
Reaching the Olfactory Destination
• 30 subjects (24 DAT deficit, 6 no DAT deficit) and enrolled by end of 2014 (60% males)
• Increase percent of individuals willing to consent – Modify an aspect of the protocol – re-contact declining
subjects – Additional support to sites to reach out to subjects – Modify messaging at initial visit/phone call
• Double the number of surveys – Local media – Engage existing cohorts (Alz Prevention Registry; genetics
gene negative individuals) – Focused mailings with local references – Complete surveys at the clinic/event
• Increase Percentage of Eligible subjects – Increase male:female ratio by monitoring female referrals to
site

“You can’t change the wind, but you can adjust the sails.” Jimmy Dean