Embed Size (px)
Citation preview
i
PR-IRADe-13-2008
Natural Resource Accounting for Goa
Integrated Research and Action for Development,
New Delhi
ii
Natural Resource Accounting for Goa
March 2008
Dr. Jyoti Parikh, Team Leader
Vinay Singh
Saudamini Sharma
Champak Buragohain
Sponsored By
Central Statistical OrganizationMinistry of Statistics and Programme Implementation,
Government of India
Integrated Research and Action for Development,
New Delhi
iii
Preface
This report contains the “Natural Resource Accounting of Goa State” and the valuation of
environment and forest ecosystem of Goa state.
In this report basic concepts on environmental accounting and different approaches of valuation
are described.
More specifically report covers the valuation in the specific sectors viz., air, water, municipal
solid waste, and forestry. Chapter 1 describes the introduction of Goa state and provides the key
indicators, Gross State Domestic Product, economic development of the state, land use and
human development indicators.
Chapter 2 carries out a study of municipal solid waste management and provides the approach
for sector and method to calculate the loss incurred due to solid waste. This chapter deals with
the solid waste generated by hotels, households and market places and economic and
environmental loss due to uncollected solid waste.
Chapter 3 describes the air and water pollution due to industries, households and transport. Air
pollution abatement costs are considered and methodology has been developed. Water pollution
status of various rivers are described and pollution for industries.
Chapter 4 describes forestry sector of Goa state. Forests cover more than 50 percent of land area.
As the forests are not valued properly, here calculations are made for economic valuation of
forest and indirect benefits from the forests, which are generally unaccounted.
Chapter 5 describes the Conceptual Framework for the green accounting and calculation of
overall Green SNP (System of National Products) for Goa as a whole. This chapter describes
pitfalls, problems, and some solutions for methodologies for economic valuation of environment.
The unique elements are: the treatment of Municipal Solid waste analysis done for the first
time in the context of natural resource accounting of a state, the treatment of hotel
industries- a service sector and tourism, corrected state domestic product after
environmental adjustments etc.
We hope that this study will show the feasibility as well as the need for carrying out the
environmental accounting and valuation. Kindly give us your feedback.
Jyoti Parikh
Executive Director, IRADe
iv
Acknowledgements
We express our sincere thanks to Central Statistical Organisation for the cooperation in the study
of “Natural Resource Accounting of Goa”.
We acknowledge the support received from officials of the Central Statistical Organisation and
the following departments of the Government of Goa: Directorate of Planning, Statistics and
Evaluation, State Forest Department,Goa; Pollution Control Board and Department of Tourism.
We are thankful to Prof. Amitabh Kundu, Prof. D N Rao, Mr. J.Dash, Mr. Mohan Singh and Mr.
R C Aggarwal for their valuable suggestions and support.
In particular, we would like to acknowledge the valuable guidance provided by Dr Madhu
Verma, Professor IIFM Bhopal.
We are thankful to past project team members (Saudamini Sharma, Pallavi Maitra, Kapil,
D.Vidya, Manoj and IRADe staffs) for their sincere efforts.
Special thanks to Dr. Kirit Parikh for his valuable guidance and support.
PROJECT TEAM
Dr. Jyoti Parikh, Executive Director, IRADe; Team Leader
Vinay Singh
Saudamini Sharma
Champak Buragohain
v
List of Abbreviations
APC : Air Pollution Control
BIS : Bureau of Indian Standards
BOD : Biological Oxygen Demand
COD : Chemical Oxygen Demand
CNFA : Culturable Non-Forest Area
CSO : Central Statistical Organization
CPCB : Central Pollution Control Board
CVM : Contingent valuation method
DS : Dissolved Solids
ETP : Effluent Treatment Plant
GSDP : Gross State Domestic Product
HPM : Hedonic Pricing Method
HPU : Heavy Polluting Units
HRACC : Hotel and Restaurant Approval and Classification Committee
IRADe : Integrated Research & Action for Development
MC : Municipal Councils
MOSPI : Ministry of Statistics and Programme Implementation, GoI.
MoEF : Ministry of Environment and Forests
MSW : Municipal Solid Waste
NSDP : Net State Domestic Product
NWFPs : Non Wood Forest Products
NO2 : Nitrogen Dioxide
NTFPs : Non-timber Forest Products
RSPM : Respirable Suspended Particulate Matter
SNP : System of National Product
SPCB : State Pollution Control Board
SS : Suspended Solids
SO2 : Sulpur Dioxide
SPM : Suspended Particulate Matter
TCM : Travel Cost Method
TEV : Total Economic Valuation
vi
Units
mg / L : Milligram per Litre
ppm : Parts per million
µg / m3 : Micro gram per cubic metre
vii
CONTENTS
PrefaceAcknowledgementsList of Abbreviations
1 Goa Profile Page No.
1.1 Introduction1.2 Goa Development1.3 Land-use Pattern1.4 Economic Growth1.5 Goa’s Contribution1.6 State Income1.7 NRA for Goa
12345511
2 Municipal Solid Waste Management
2.1 Objectives & Approach2.2 SWM Practices in Goa2.3 Survey Analysis of Hotels in Goa2.4 Tourism Sector in Goa2.5 Analysis of Hotel Survey 2.6 Municipalities in Goa2.7 Methodology2.8 Survey for SWM in Goa2.9 Survey Design2.10 Market Place Survey2.11 Analysis of Municipal Survey2.13 Total Cost of Collection of Solid Waste2.14 Summary
13141415182122232328293134
3 Air and Water Pollution
3.1 Introduction3.2 Types of Industries3.3 Important Industries3.4 Air Pollution in Goa3.5 Outline if Survey3.6 Survey Design3.7 Methodology3.8 Application of Methodology Results3.9 Transport Sector3.10 Energy & Emission Accounts3.11 Water Pollution in Goa3.12 Water Pollution Abatement Cost 3.13 Abatement Cost Function3.14 Summary
3535363839394141464850545556
viii
4 Forest Resource Accounting of Goa
4.1 Introduction4.2 Goa Forest Profile4.3 Forest Values4.4 Valuation Technique4.5 Methodology for Valuation of Forest Resources4.6 Accounting of Forest Resources4.7 Physical Accounts4.8 Monetary Accounts4.9 Valuing Net Timber Accumulation4.10 Valuing Direct Consumptive Benefits4.11 Valuing Direct Non- Consumptive & Indirect Benefits4.12 Estimation of Total Economic Value of Forest 4.13 Composition of TEV with SDP & Expenditure4.14 Economic Value of Forest4.15 Summary
575868687172738082838485878889
5 Conceptual Framework & Green SNP for Goa
5.1 Conceptual Framework5.2 Approaches to Valuation5.3 Green SNP for Goa5.4 Limitations of the study
90929798
ANNEXURES
ANNEX 1 Review of Pilot Project on NRA (Phase I)ANNEX 2 Municipal SWMANNEX 3 Municipal Workers DetailsANNEX 4 Air & Water PollutionANNEX 5 Forestry Details of Goa
100113116119129
References 138
1
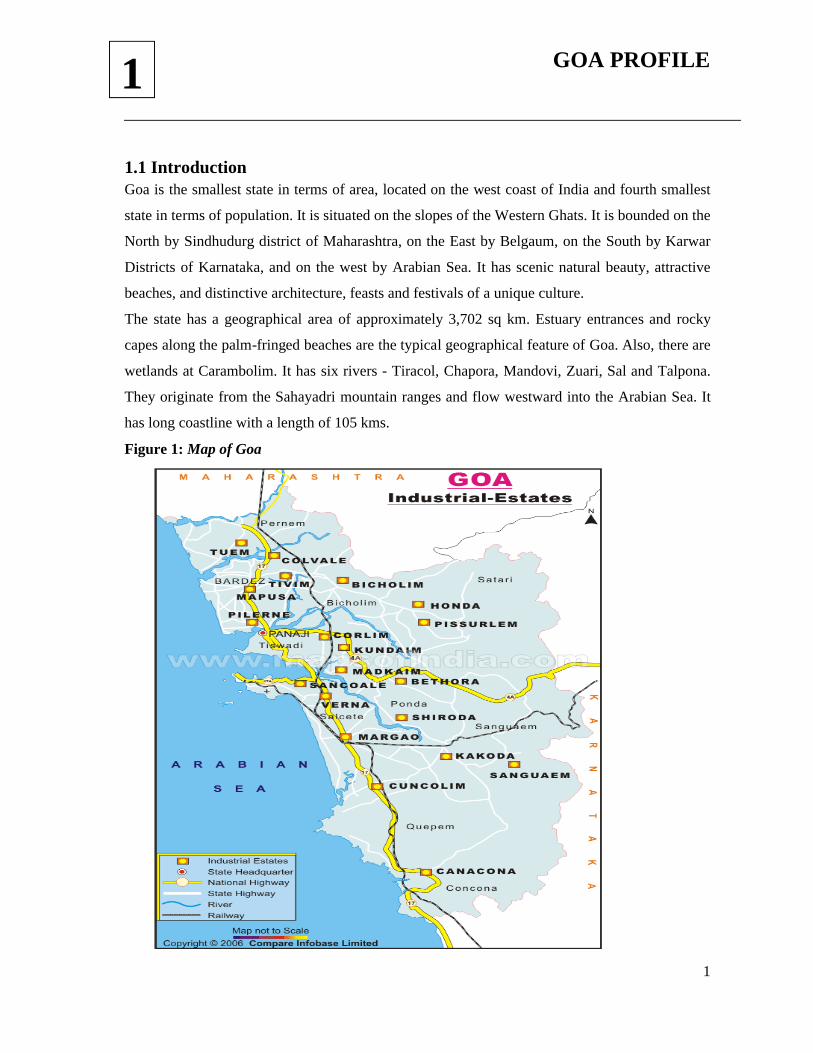
1.1 IntroductionGoa is the smallest state in terms of area, located on the west coast of India and fourth smallest
state in terms of population. It is situated on the slopes of the Western Ghats. It is bounded on the
North by Sindhudurg district of Maharashtra, on the East by Belgaum, on the South by Karwar
Districts of Karnataka, and on the west by Arabian Sea. It has scenic natural beauty, attractive
beaches, and distinctive architecture, feasts and festivals of a unique culture.
The state has a geographical area of approximately 3,702 sq km. Estuary entrances and rocky
capes along the palm-fringed beaches are the typical geographical feature of Goa. Also, there are
wetlands at Carambolim. It has six rivers - Tiracol, Chapora, Mandovi, Zuari, Sal and Talpona.
They originate from the Sahayadri mountain ranges and flow westward into the Arabian Sea. It
has long coastline with a length of 105 kms.
Figure 1: Map of Goa
1 GOA PROFILE
2
The state is distributed among its two districts and 11 talukas (local sub districts). Each of the
State's thirteen tehsils (revenue centers) has an industrial estate, an
industrial training institute and higher secondary level education facilities. The capital city of
Panjim is located on the banks of the Mandovi River. Vasco, Margao, Mapusa and Ponda are the
other major towns.
1.2 Goa’s DevelopmentGoa has emerged as the most progressive State in the country and is ranked No.1 by the Eleventh
Finance Commission as the Best Placed State in the Country in terms of infrastructure facilities.
The National Population Commission has ranked Goa as the First State amongst all States/UTs
in terms of 12 indicators (composite index) on quality of life. CRISIL has declared Goa as the
second fastest growing State in the country. Various human development indicators of Goa are
given in Tables 1.1 and 1.2.
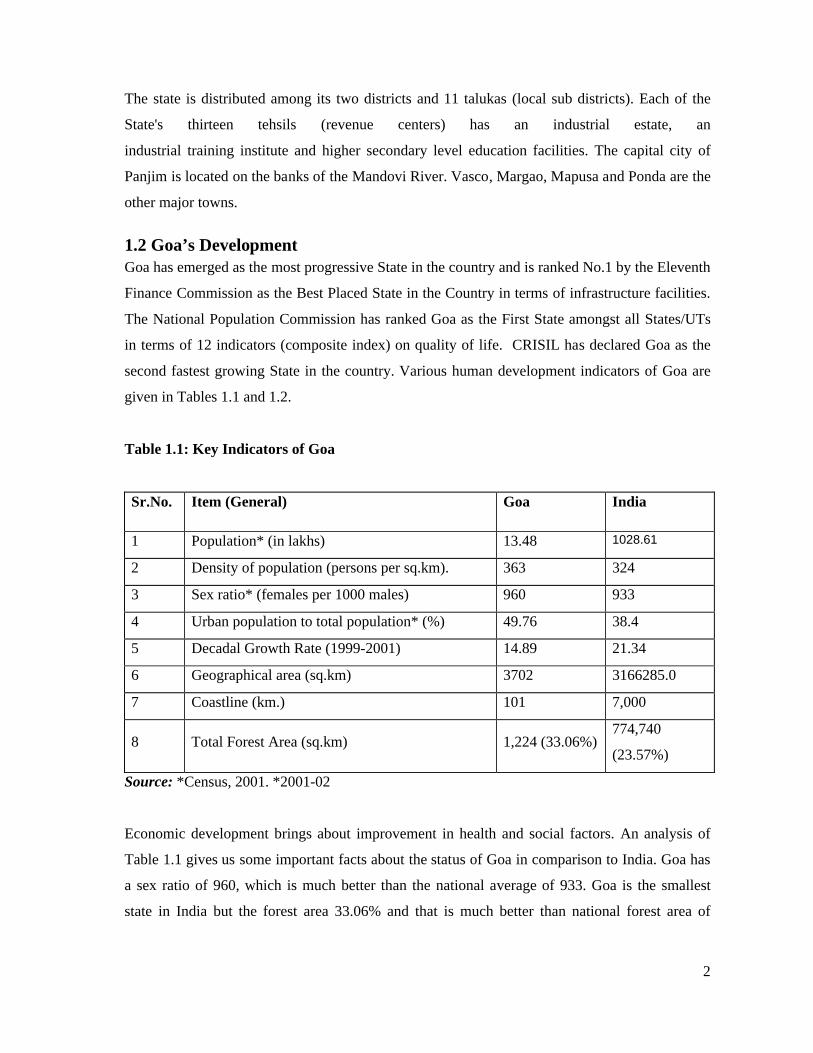
Table 1.1: Key Indicators of Goa
Sr.No. Item (General) Goa India
1 Population* (in lakhs) 13.48 1028.61
2 Density of population (persons per sq.km). 363 324
3 Sex ratio* (females per 1000 males) 960 933
4 Urban population to total population* (%) 49.76 38.4
5 Decadal Growth Rate (1999-2001) 14.89 21.34
6 Geographical area (sq.km) 3702 3166285.0
7 Coastline (km.) 101 7,000
8 Total Forest Area (sq.km) 1,224 (33.06%)774,740
(23.57%)
Source: *Census, 2001. *2001-02
Economic development brings about improvement in health and social factors. An analysis of
Table 1.1 gives us some important facts about the status of Goa in comparison to India. Goa has
a sex ratio of 960, which is much better than the national average of 933. Goa is the smallest
state in India but the forest area 33.06% and that is much better than national forest area of
3
23.57%. The run of coastline of Goa is 101 km. The decadal growth rate of Goa is 14.89 that is
in a balanced position than other states of India.
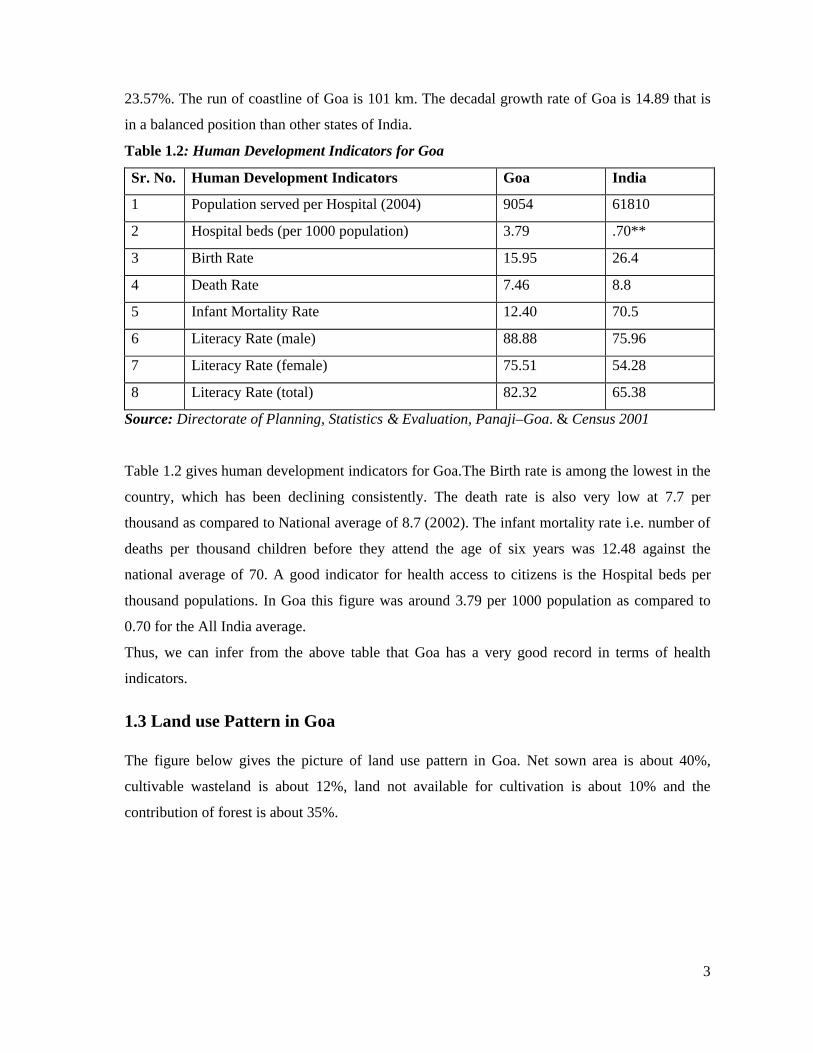
Table 1.2: Human Development Indicators for Goa
Sr. No. Human Development Indicators Goa India
1 Population served per Hospital (2004) 9054 61810
2 Hospital beds (per 1000 population) 3.79 .70**
3 Birth Rate 15.95 26.4
4 Death Rate 7.46 8.8
5 Infant Mortality Rate 12.40 70.5
6 Literacy Rate (male) 88.88 75.96
7 Literacy Rate (female) 75.51 54.28
8 Literacy Rate (total) 82.32 65.38
Source: Directorate of Planning, Statistics & Evaluation, Panaji–Goa. & Census 2001
Table 1.2 gives human development indicators for Goa.The Birth rate is among the lowest in the
country, which has been declining consistently. The death rate is also very low at 7.7 per
thousand as compared to National average of 8.7 (2002). The infant mortality rate i.e. number of
deaths per thousand children before they attend the age of six years was 12.48 against the
national average of 70. A good indicator for health access to citizens is the Hospital beds per
thousand populations. In Goa this figure was around 3.79 per 1000 population as compared to
0.70 for the All India average.
Thus, we can infer from the above table that Goa has a very good record in terms of health
indicators.
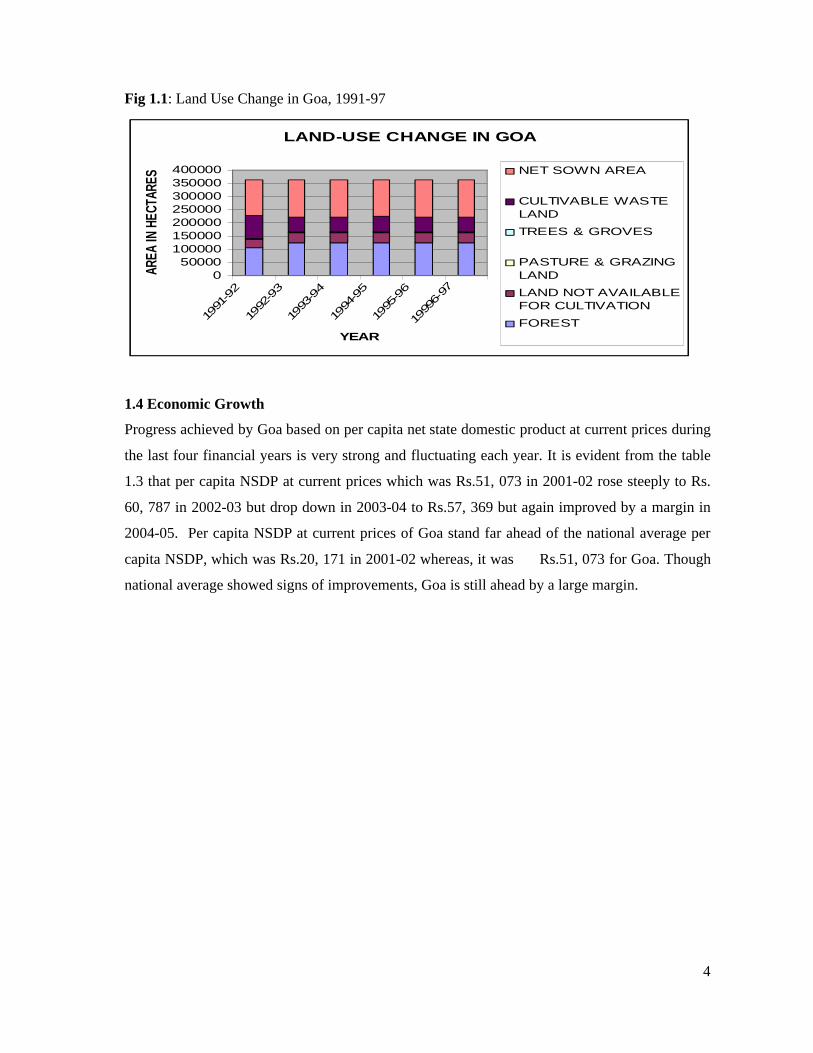
1.3 Land use Pattern in Goa
The figure below gives the picture of land use pattern in Goa. Net sown area is about 40%,
cultivable wasteland is about 12%, land not available for cultivation is about 10% and the
contribution of forest is about 35%.
4
Fig 1.1: Land Use Change in Goa, 1991-97
LAND-USE CHANGE IN GOA
050000
100000150000200000250000300000350000400000
1991
-92
1992
-93
1993
-94
1994
-95
1995
-96
1999
6-97
YEAR
AREA
IN H
ECTA
RES NET SOWN AREA
CULTIVABLE WASTELAND
TREES & GROVES
PASTURE & GRAZINGLAND
LAND NOT AVAILABLEFOR CULTIVATION
FOREST
1.4 Economic Growth
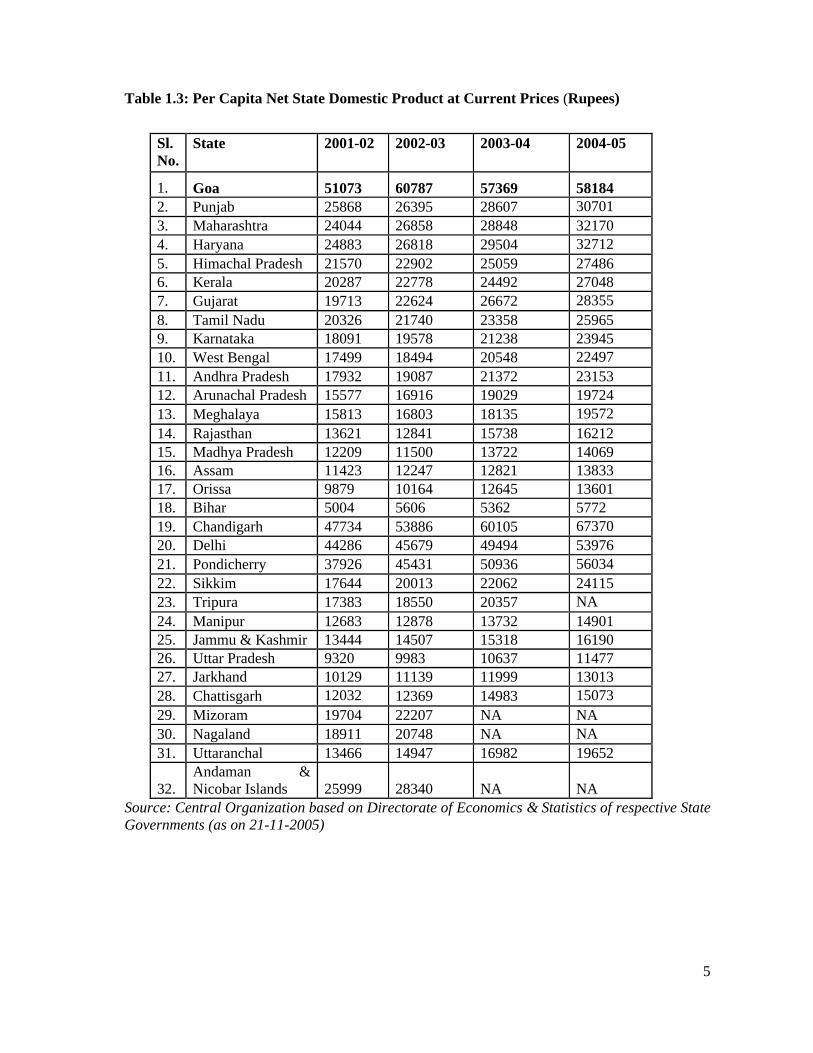
Progress achieved by Goa based on per capita net state domestic product at current prices during
the last four financial years is very strong and fluctuating each year. It is evident from the table
1.3 that per capita NSDP at current prices which was Rs.51, 073 in 2001-02 rose steeply to Rs.
60, 787 in 2002-03 but drop down in 2003-04 to Rs.57, 369 but again improved by a margin in
2004-05. Per capita NSDP at current prices of Goa stand far ahead of the national average per
capita NSDP, which was Rs.20, 171 in 2001-02 whereas, it was Rs.51, 073 for Goa. Though
national average showed signs of improvements, Goa is still ahead by a large margin.
5
Table 1.3: Per Capita Net State Domestic Product at Current Prices (Rupees)
Sl.No.
State 2001-02 2002-03 2003-04 2004-05
1. Goa 51073 60787 57369 581842. Punjab 25868 26395 28607 307013. Maharashtra 24044 26858 28848 321704. Haryana 24883 26818 29504 327125. Himachal Pradesh 21570 22902 25059 274866. Kerala 20287 22778 24492 270487. Gujarat 19713 22624 26672 283558. Tamil Nadu 20326 21740 23358 259659. Karnataka 18091 19578 21238 2394510. West Bengal 17499 18494 20548 2249711. Andhra Pradesh 17932 19087 21372 2315312. Arunachal Pradesh 15577 16916 19029 1972413. Meghalaya 15813 16803 18135 1957214. Rajasthan 13621 12841 15738 1621215. Madhya Pradesh 12209 11500 13722 1406916. Assam 11423 12247 12821 1383317. Orissa 9879 10164 12645 1360118. Bihar 5004 5606 5362 577219. Chandigarh 47734 53886 60105 6737020. Delhi 44286 45679 49494 5397621. Pondicherry 37926 45431 50936 5603422. Sikkim 17644 20013 22062 2411523. Tripura 17383 18550 20357 NA24. Manipur 12683 12878 13732 1490125. Jammu & Kashmir 13444 14507 15318 1619026. Uttar Pradesh 9320 9983 10637 1147727. Jarkhand 10129 11139 11999 1301328. Chattisgarh 12032 12369 14983 1507329. Mizoram 19704 22207 NA NA30. Nagaland 18911 20748 NA NA31. Uttaranchal 13466 14947 16982 19652
32. Andaman & Nicobar Islands 25999 28340 NA NA
Source: Central Organization based on Directorate of Economics & Statistics of respective State Governments (as on 21-11-2005)
6
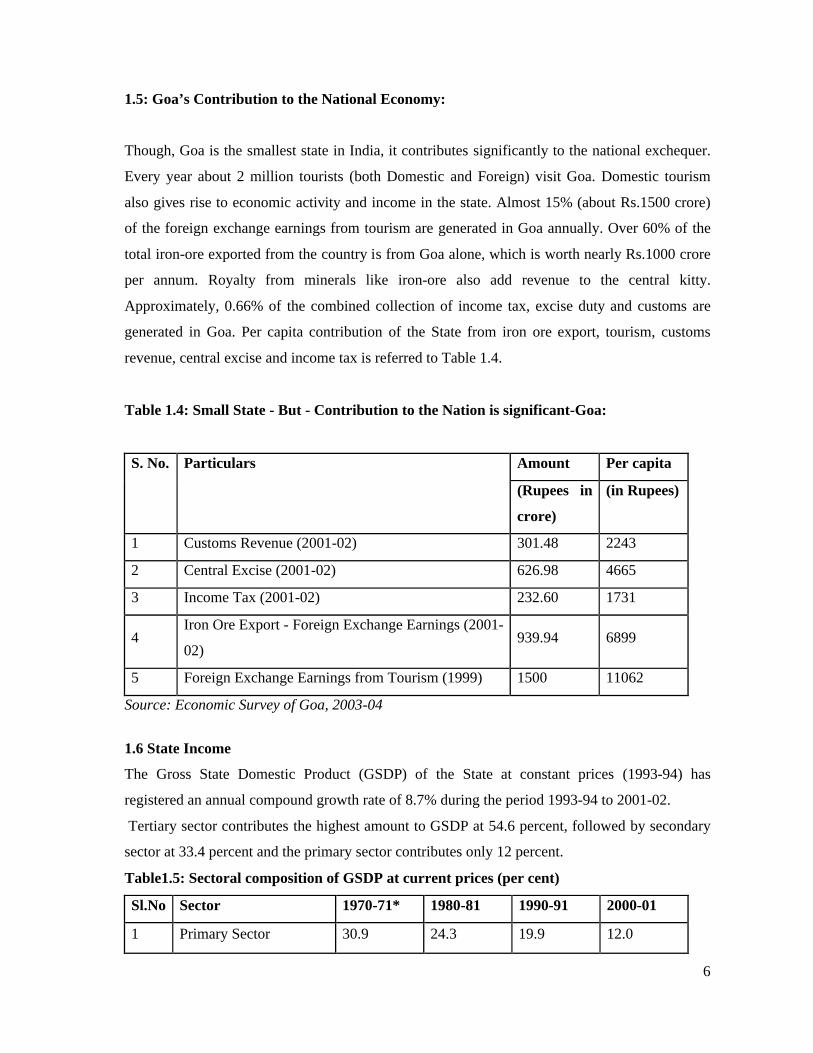
1.5: Goa’s Contribution to the National Economy:
Though, Goa is the smallest state in India, it contributes significantly to the national exchequer.
Every year about 2 million tourists (both Domestic and Foreign) visit Goa. Domestic tourism
also gives rise to economic activity and income in the state. Almost 15% (about Rs.1500 crore)
of the foreign exchange earnings from tourism are generated in Goa annually. Over 60% of the
total iron-ore exported from the country is from Goa alone, which is worth nearly Rs.1000 crore
per annum. Royalty from minerals like iron-ore also add revenue to the central kitty.
Approximately, 0.66% of the combined collection of income tax, excise duty and customs are
generated in Goa. Per capita contribution of the State from iron ore export, tourism, customs
revenue, central excise and income tax is referred to Table 1.4.
Table 1.4: Small State - But - Contribution to the Nation is significant-Goa:
S. No. Particulars Amount Per capita
(Rupees in
crore)
(in Rupees)
1 Customs Revenue (2001-02) 301.48 2243
2 Central Excise (2001-02) 626.98 4665
3 Income Tax (2001-02) 232.60 1731
4Iron Ore Export - Foreign Exchange Earnings (2001-
02)939.94 6899
5 Foreign Exchange Earnings from Tourism (1999) 1500 11062
Source: Economic Survey of Goa, 2003-04
1.6 State Income
The Gross State Domestic Product (GSDP) of the State at constant prices (1993-94) has
registered an annual compound growth rate of 8.7% during the period 1993-94 to 2001-02.
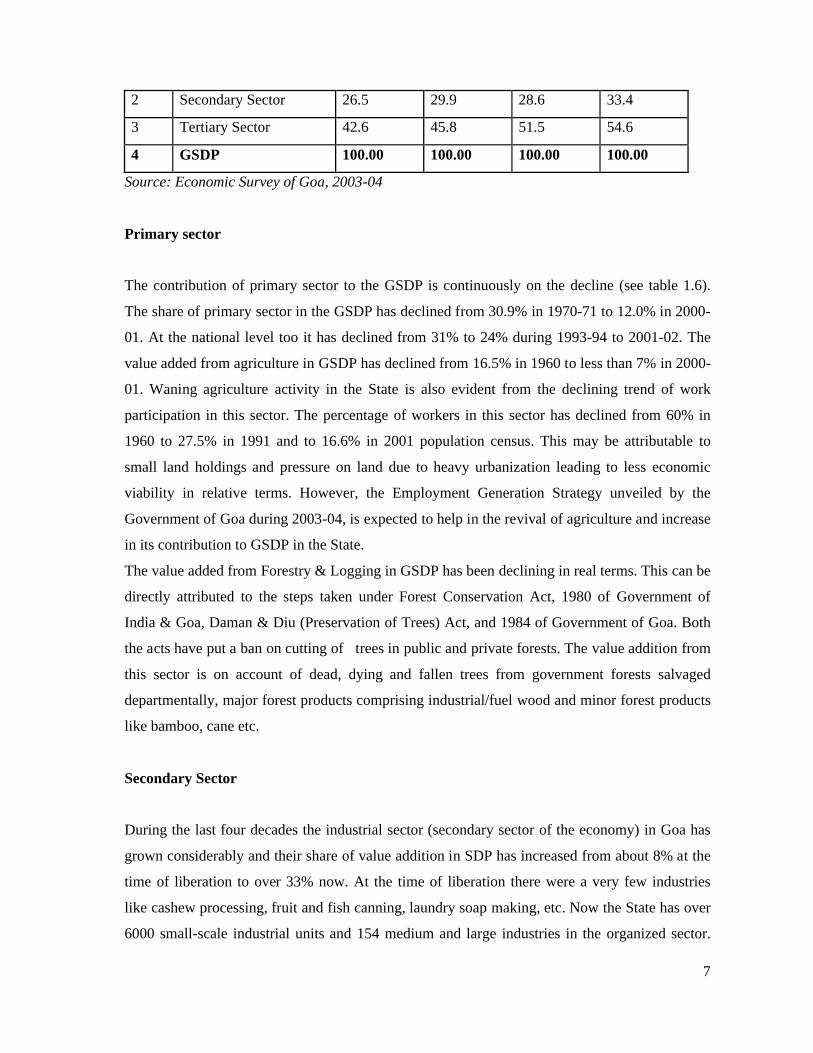
Tertiary sector contributes the highest amount to GSDP at 54.6 percent, followed by secondary
sector at 33.4 percent and the primary sector contributes only 12 percent.
Table1.5: Sectoral composition of GSDP at current prices (per cent)
Sl.No Sector 1970-71* 1980-81 1990-91 2000-01
1 Primary Sector 30.9 24.3 19.9 12.0
7
2 Secondary Sector 26.5 29.9 28.6 33.4
3 Tertiary Sector 42.6 45.8 51.5 54.6
4 GSDP 100.00 100.00 100.00 100.00
Source: Economic Survey of Goa, 2003-04
Primary sector
The contribution of primary sector to the GSDP is continuously on the decline (see table 1.6).
The share of primary sector in the GSDP has declined from 30.9% in 1970-71 to 12.0% in 2000-
01. At the national level too it has declined from 31% to 24% during 1993-94 to 2001-02. The
value added from agriculture in GSDP has declined from 16.5% in 1960 to less than 7% in 2000-
01. Waning agriculture activity in the State is also evident from the declining trend of work
participation in this sector. The percentage of workers in this sector has declined from 60% in
1960 to 27.5% in 1991 and to 16.6% in 2001 population census. This may be attributable to
small land holdings and pressure on land due to heavy urbanization leading to less economic
viability in relative terms. However, the Employment Generation Strategy unveiled by the
Government of Goa during 2003-04, is expected to help in the revival of agriculture and increase
in its contribution to GSDP in the State.
The value added from Forestry & Logging in GSDP has been declining in real terms. This can be
directly attributed to the steps taken under Forest Conservation Act, 1980 of Government of
India & Goa, Daman & Diu (Preservation of Trees) Act, and 1984 of Government of Goa. Both
the acts have put a ban on cutting of trees in public and private forests. The value addition from
this sector is on account of dead, dying and fallen trees from government forests salvaged
departmentally, major forest products comprising industrial/fuel wood and minor forest products
like bamboo, cane etc.
Secondary Sector
During the last four decades the industrial sector (secondary sector of the economy) in Goa has
grown considerably and their share of value addition in SDP has increased from about 8% at the
time of liberation to over 33% now. At the time of liberation there were a very few industries
like cashew processing, fruit and fish canning, laundry soap making, etc. Now the State has over
6000 small-scale industrial units and 154 medium and large industries in the organized sector.
8
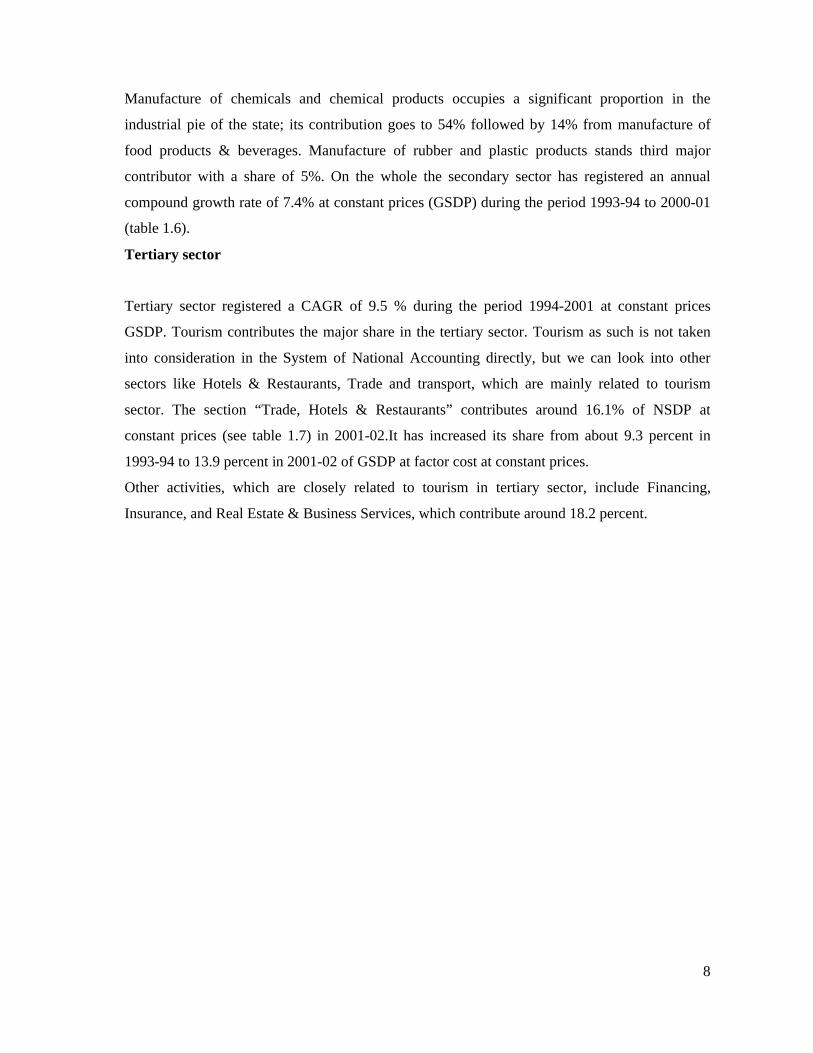
Manufacture of chemicals and chemical products occupies a significant proportion in the
industrial pie of the state; its contribution goes to 54% followed by 14% from manufacture of
food products & beverages. Manufacture of rubber and plastic products stands third major
contributor with a share of 5%. On the whole the secondary sector has registered an annual
compound growth rate of 7.4% at constant prices (GSDP) during the period 1993-94 to 2000-01
(table 1.6).
Tertiary sector
Tertiary sector registered a CAGR of 9.5 % during the period 1994-2001 at constant prices
GSDP. Tourism contributes the major share in the tertiary sector. Tourism as such is not taken
into consideration in the System of National Accounting directly, but we can look into other
sectors like Hotels & Restaurants, Trade and transport, which are mainly related to tourism
sector. The section “Trade, Hotels & Restaurants” contributes around 16.1% of NSDP at
constant prices (see table 1.7) in 2001-02.It has increased its share from about 9.3 percent in
1993-94 to 13.9 percent in 2001-02 of GSDP at factor cost at constant prices.
Other activities, which are closely related to tourism in tertiary sector, include Financing,
Insurance, and Real Estate & Business Services, which contribute around 18.2 percent.
9
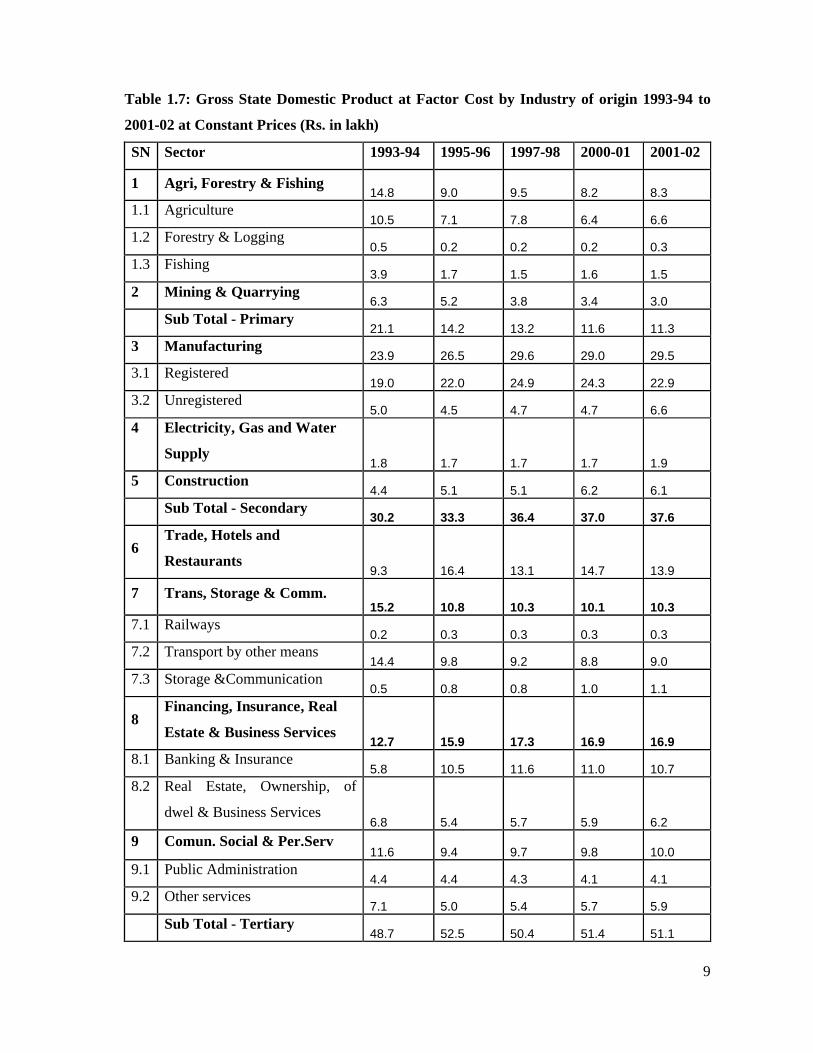
Table 1.7: Gross State Domestic Product at Factor Cost by Industry of origin 1993-94 to
2001-02 at Constant Prices (Rs. in lakh)
SN Sector 1993-94 1995-96 1997-98 2000-01 2001-02
1 Agri, Forestry & Fishing 14.8 9.0 9.5 8.2 8.3
1.1 Agriculture 10.5 7.1 7.8 6.4 6.6
1.2 Forestry & Logging 0.5 0.2 0.2 0.2 0.3
1.3 Fishing 3.9 1.7 1.5 1.6 1.5
2 Mining & Quarrying 6.3 5.2 3.8 3.4 3.0
Sub Total - Primary 21.1 14.2 13.2 11.6 11.3
3 Manufacturing 23.9 26.5 29.6 29.0 29.5
3.1 Registered 19.0 22.0 24.9 24.3 22.9
3.2 Unregistered 5.0 4.5 4.7 4.7 6.6
4 Electricity, Gas and Water
Supply1.8 1.7 1.7 1.7 1.9
5 Construction 4.4 5.1 5.1 6.2 6.1
Sub Total - Secondary 30.2 33.3 36.4 37.0 37.6
6 Trade, Hotels and
Restaurants 9.3 16.4 13.1 14.7 13.9
7 Trans, Storage & Comm. 15.2 10.8 10.3 10.1 10.3
7.1 Railways 0.2 0.3 0.3 0.3 0.3
7.2 Transport by other means 14.4 9.8 9.2 8.8 9.0
7.3 Storage &Communication 0.5 0.8 0.8 1.0 1.1
8 Financing, Insurance, Real
Estate & Business Services 12.7 15.9 17.3 16.9 16.9
8.1 Banking & Insurance 5.8 10.5 11.6 11.0 10.7
8.2 Real Estate, Ownership, of
dwel & Business Services 6.8 5.4 5.7 5.9 6.2
9 Comun. Social & Per.Serv11.6 9.4 9.7 9.8 10.0
9.1 Public Administration 4.4 4.4 4.3 4.1 4.1
9.2 Other services 7.1 5.0 5.4 5.7 5.9
Sub Total - Tertiary 48.7 52.5 50.4 51.4 51.1
10
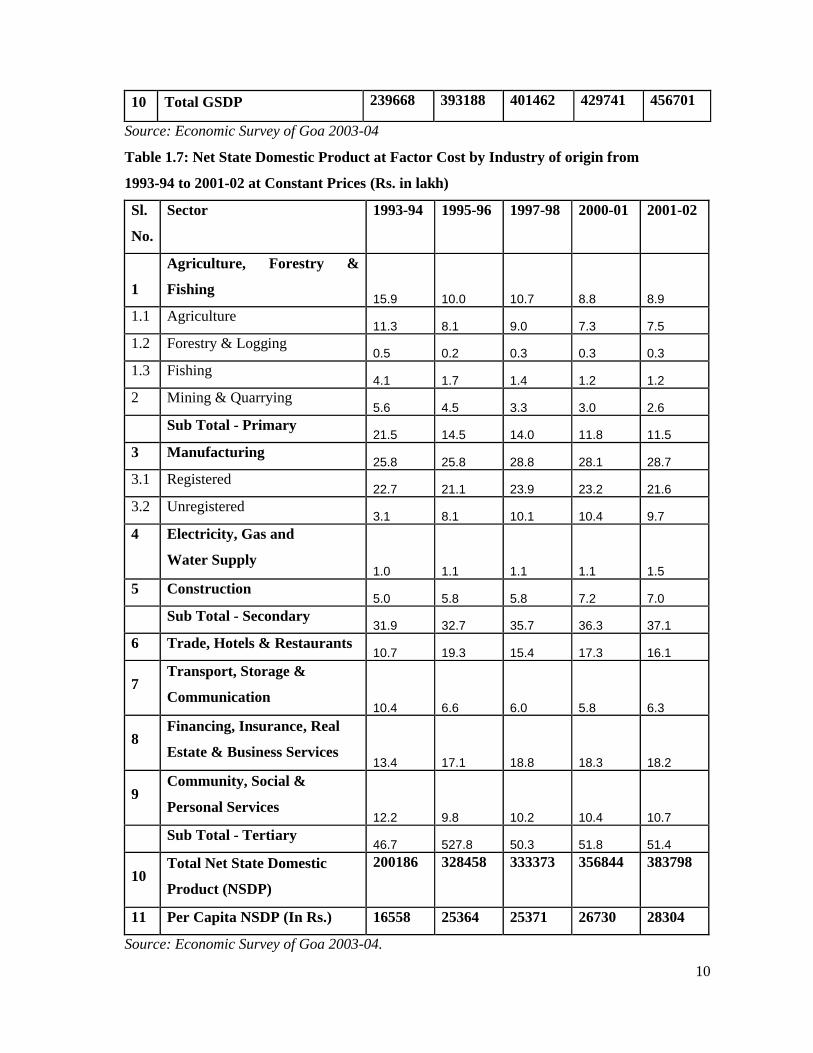
10 Total GSDP 239668 393188 401462 429741 456701
Source: Economic Survey of Goa 2003-04
Table 1.7: Net State Domestic Product at Factor Cost by Industry of origin from
1993-94 to 2001-02 at Constant Prices (Rs. in lakh)
Sl.
No.
Sector 1993-94 1995-96 1997-98 2000-01 2001-02
1
Agriculture, Forestry &
Fishing 15.9 10.0 10.7 8.8 8.9
1.1 Agriculture 11.3 8.1 9.0 7.3 7.5
1.2 Forestry & Logging 0.5 0.2 0.3 0.3 0.3
1.3 Fishing 4.1 1.7 1.4 1.2 1.2
2 Mining & Quarrying 5.6 4.5 3.3 3.0 2.6
Sub Total - Primary 21.5 14.5 14.0 11.8 11.5
3 Manufacturing 25.8 25.8 28.8 28.1 28.7
3.1 Registered 22.7 21.1 23.9 23.2 21.6
3.2 Unregistered 3.1 8.1 10.1 10.4 9.7
4 Electricity, Gas and
Water Supply 1.0 1.1 1.1 1.1 1.5
5 Construction 5.0 5.8 5.8 7.2 7.0
Sub Total - Secondary 31.9 32.7 35.7 36.3 37.1
6 Trade, Hotels & Restaurants 10.7 19.3 15.4 17.3 16.1
7 Transport, Storage &
Communication 10.4 6.6 6.0 5.8 6.3
8 Financing, Insurance, Real
Estate & Business Services 13.4 17.1 18.8 18.3 18.2
9 Community, Social &
Personal Services 12.2 9.8 10.2 10.4 10.7
Sub Total - Tertiary 46.7 527.8 50.3 51.8 51.4
10 Total Net State Domestic
Product (NSDP)
200186 328458 333373 356844 383798
11 Per Capita NSDP (In Rs.) 16558 25364 25371 26730 28304
Source: Economic Survey of Goa 2003-04.
11
1.7 Natural Resource Accounting for Goa
Measures of national income and output provide estimates of the value of goods and services
produced in an economy. The use of system of national accounts or national accounting was first
developed during the 1940s. Some of the more common measures are Gross National Product
(GNP), Gross Domestic Product (GDP), Gross National Income (GNI), Net National Product
(NNP), and Net National Income (NNI).
The need to focus on the development of environmental and resource accounts in the national
accounting framework can be explained by a number of factors. First, the national accounting
framework is well-established, having a history of more than 50 years of implementation around
the world. Second, the national accounts are a very influential source of economic information.
Environmental information linked with the national accounts can, therefore, be quickly and
easily integrated into existing economic decision-making processes. Third and perhaps the most
important reason is the desire by statistical agencies to address the long-standing environmental
criticisms of the national accounts. Briefly, they include neglecting to measure the contribution
of the environment to national wealth; treating the receipts from the depletion of natural
resources as current income rather than capital depletion; measuring the benefits of the use of the
environment but not the costs; and including expenditures to protect the environment as part of
gross production. Many of these criticisms are controversial and not all are accepted as
legitimate by all parties of the debate. Many countries have attempted to address one or more of
them in their environmental and resources accounts.
Some experts argue that so-called defensive expenditures should not be included in GDP because
they do not contribute to well-being but are, in fact, a cost of maintaining social order. GDP is
not intended to measure well-being and therefore should not be adjusted to correct for a failure to
do so. GDP is intended to measure the aggregate value of output in the economy, even if this
output is considered “regrettable” in the eyes of some. Arbitrarily leaving some kinds of output
out of the calculation would distort the picture of economic development and make it impossible
to study the relationship between revenue and expenditure in the economy.
Natural capital is generally considered to be divided into three principal categories: natural
resource stocks, land and environmental systems (or ecosystems). All are considered essential to
the long-term sustainability of the economy. Natural resource stocks are the source of raw
materials used in the production of manufactured goods. Land is essential for the provision of
space in which economic activity can take place. Ecosystems are essential for the services that
12
they provide directly and indirectly to the economy, including cleansing of polluted air and
water; provision of productive soil; provision of biodiversity; provision of a predictable and
relatively stable climate; protection from harmful effects of incident solar radiation; and
provision of reliable flows of renewable natural resources.
The natural resource stock measures that we present reflect those resources that can be profitably
exploited given today’s prices and technologies. As the reserves are depleting, we keep on
searching for new ones to replace them. But all resources are ultimately finite, so this process of
replacement becomes gradually more difficult over time. For some resources (like sand and
gravel) there might be no foreseeable real limit on supply. For others, like conventional crude oil
and natural gas, the depletion of major reserves is already predicted for the first half of this
century. This makes it worthwhile tracking their evolution in physical terms. Another reason
motivates the monetary measure of these resources. This is that the wealth they represent can
make a very substantial difference in the economic position of the government that owns them.
And because the prices of resource commodities fluctuate widely and are determined by market
forces outside of state’s control, this wealth can vary from one year to the next. All-in-all,
tracking the evolution of country’s natural resource stocks makes sense from an environmental
and an economic viewpoint.
13
Municipal Solid Waste Management
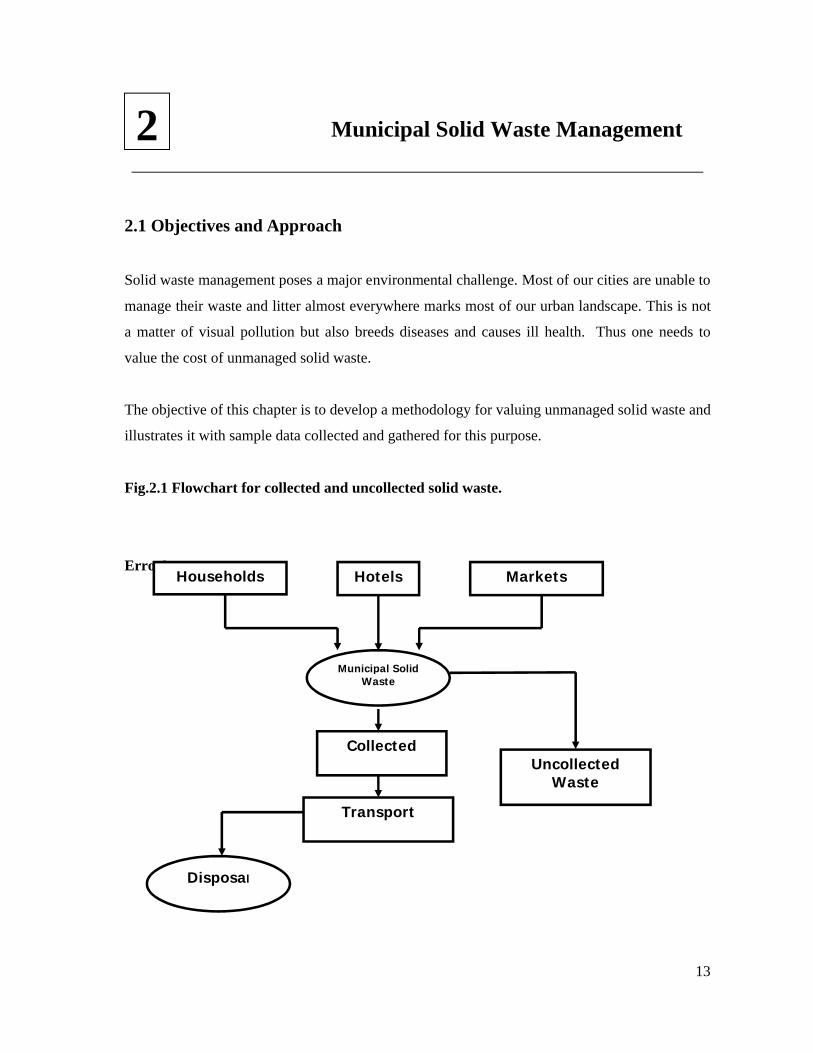
2.1 Objectives and Approach
Solid waste management poses a major environmental challenge. Most of our cities are unable to
manage their waste and litter almost everywhere marks most of our urban landscape. This is not
a matter of visual pollution but also breeds diseases and causes ill health. Thus one needs to
value the cost of unmanaged solid waste.
The objective of this chapter is to develop a methodology for valuing unmanaged solid waste and
illustrates it with sample data collected and gathered for this purpose.
Fig.2.1 Flowchart for collected and uncollected solid waste.
Error!
2
Households Markets
Municipal Solid Waste
Transport
UncollectedWaste
Disposal
Hotels
Collected
14
2. 2 Solid Waste Management practices in Goa:
Municipal Councils (MC) is responsible for collection, transportation and disposal of solid
wastes generated within the municipal limits. Households and establishments including hospitals,
private nursing homes, restaurants, etc., deposit their wastes in communal waste storage bins, for
subsequent collection (manual) and transportation to a dumping site. A large number of waste
pickers make their livelihood by collecting a variety of recyclable wastes from bins and the
disposal site. Silt from storm water drains and construction wastes are collected separately by the
MC’s engineering division for disposal in low-lying areas.
2.3 Survey Analysis of Hotels in Goa
The present survey of hotels in Goa, is carried out to quantify tourism (within the hotel industry)
and its role in the Goa economy. The target population of the survey includes hotels (5 Star, 3
star, 4 star and budget hotels) and the survey design is based on stratified sampling procedure
through a set of 3 separate surveys. These hotels could serve as major arrival and exit points for
an overwhelming majority of the tourists visiting Goa. Further, the geographical coverage of the
survey includes various districts of North and South Goa, with an objective of enhancing the
statistical precision of the estimates. The districts covered under North Goa are Pernem, Mapusa,
Panaji, Valpoi, Bicholim and Ponda. Similarly for South Goa, the districts covered in the survey
include Marmugao, Margao, Quepem, Cancona and Sanguem. The identification and mapping of
localities selected for the survey were conducted as under:
The entire state of Goa was divided into North and South and covered the above-mentioned
districts within both. A total number of 11 districts were selected as the first stage. This
comprehensive survey of hotels, wherein the primary respondents are hotel managers or owners
in Goa provides several details of tourism behavior. The interviewers were provided training for
a period of 3 days prior to the survey. The training was deemed necessary in view of the types of
concepts entailed in understanding and explaining the tourism sector as a whole and it also
enabled the interviewers to better communicate the problems to the field supervisors and survey
managers, and to comprehend the feedback. In addition, the presence of senior researchers
contributed strongly to increasing the motivation and dedication of the investigators.
15
Note that the Hotel and Restaurant Approval and Classification Committee (HRACC), set up by
the Department of Tourism, classify the functioning hotels under the star system into six
categories from one to 5-Star Deluxe. A new category of Heritage Hotels has also been
introduced since 1994. The Department also re-classifies these hotels after every four years to
ensure that these hotels maintain the requisite standards. The Committee set up for the purpose
has representatives from Department of Tourism, Government of India, State Governments and
hotel and travel industry associations.
Some data relating to the average duration of stay by domestic and foreign tourists, total no. of
hotels with no. of rooms and no. of beds and average physical characteristics of waste generation
by hotels of the study areas are collected from the publications of the Central Pollution Control
Board (CPCB), Goa Pollution Control Board and The Department of Tourism (Government of
Goa) in India.
The information about tourist inflow, employment inclusive of wage levels, entry tax, size,
revenue generated, budget allotted for the tourism site are collected. Information is elicited on
type of hotel, structural characteristics, and location comprising distances from major tourist
spots, no. of beds, waste generated, treatment plants (if any), pattern of energy use, total water
intake is also elicited. The survey results for hotels are given in the Annexure.
2.4 The Tourism Sector in Goa
Most of the tourism in Goa is concentrated in the coastal stretches of Bardez, Salcete, Tiswadi
and Marmagao. Over 90 percent of domestic tourists and over 99 percent of the international
tourists frequent these areas. Two types of tourists with distinct needs, which this state satisfies,
visit Goa. The first is the domestic tourists, who comprise 80 percent of all tourists. The second
is the international tourists who visit Goa purely for the natural environment and beaches. Within
the category of international tourists are there are two sub-categories: backpackers and charter
tourists. Although both visit Goa for the beaches, the backpackers are not found in areas of
charter tourists; they prefer to mingle and live with the local communities. Whereas, the charter
tourists tend to stay in the luxury starred hotels.
In previous decades, a clear off-season for all tourists could be identified, today this is not so for
domestic tourists, who come throughout the year albeit in larger numbers in the non-monsoon
16
months. However, international tourists avoid the monsoon months, as for them the use of the
beach is the prime attraction to come to Goa.
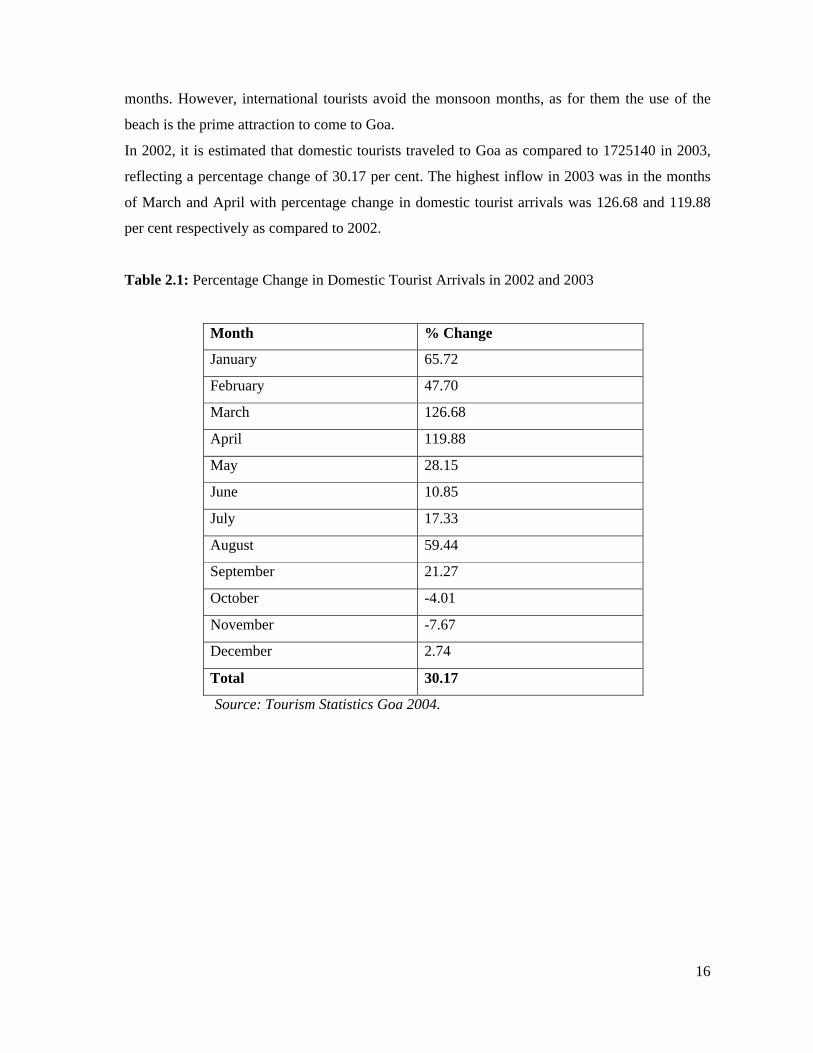
In 2002, it is estimated that domestic tourists traveled to Goa as compared to 1725140 in 2003,
reflecting a percentage change of 30.17 per cent. The highest inflow in 2003 was in the months
of March and April with percentage change in domestic tourist arrivals was 126.68 and 119.88
per cent respectively as compared to 2002.
Table 2.1: Percentage Change in Domestic Tourist Arrivals in 2002 and 2003
Month % Change
January 65.72
February 47.70
March 126.68
April 119.88
May 28.15
June 10.85
July 17.33
August 59.44
September 21.27
October -4.01
November -7.67
December 2.74
Total 30.17
Source: Tourism Statistics Goa 2004.
17
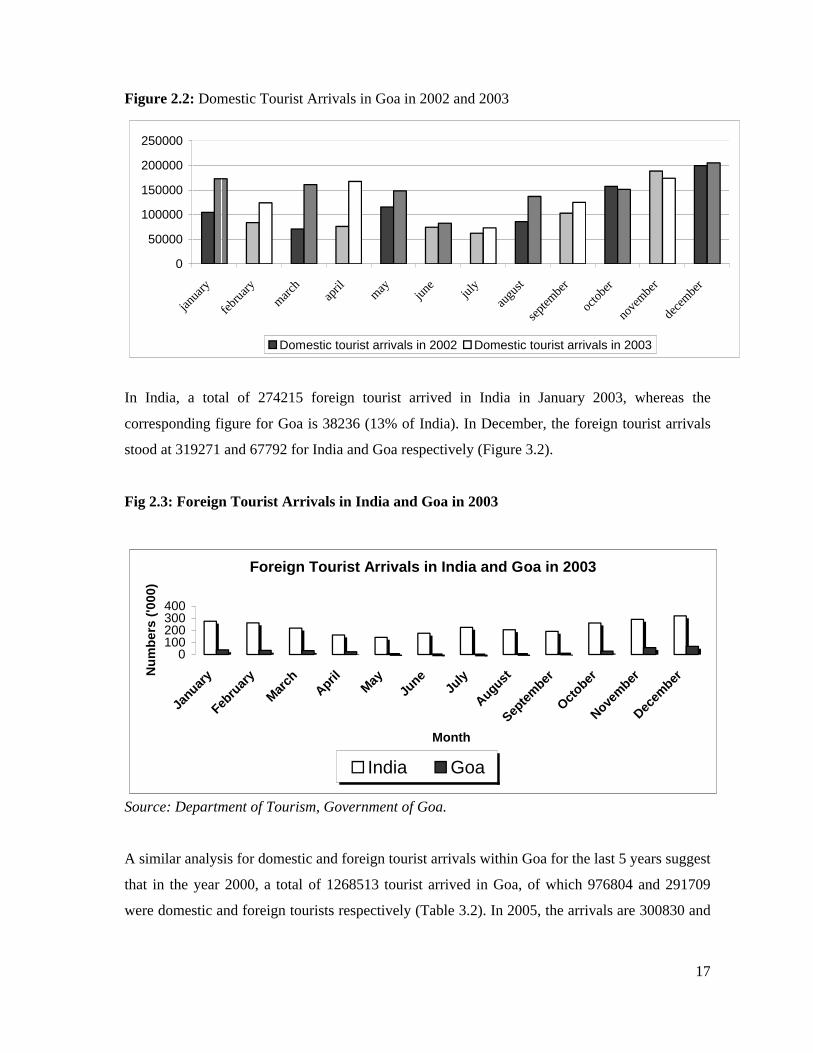
Figure 2.2: Domestic Tourist Arrivals in Goa in 2002 and 2003
0
50000
100000
150000
200000
250000
janua
ry
febru
ary
march
april may
june
july
augu
st
septe
mber
octob
er
nove
mber
dece
mber
Domestic tourist arrivals in 2002 Domestic tourist arrivals in 2003
In India, a total of 274215 foreign tourist arrived in India in January 2003, whereas the
corresponding figure for Goa is 38236 (13% of India). In December, the foreign tourist arrivals
stood at 319271 and 67792 for India and Goa respectively (Figure 3.2).
Fig 2.3: Foreign Tourist Arrivals in India and Goa in 2003
Foreign Tourist Arrivals in India and Goa in 2003
0100200300400
Januar
y
Febru
ary
Mar
chApril
May
June
July
August
Septe
mber
October
Novem
ber
Decem
ber
Month
Nu
mb
ers
('0
00
)
India Goa
Source: Department of Tourism, Government of Goa.
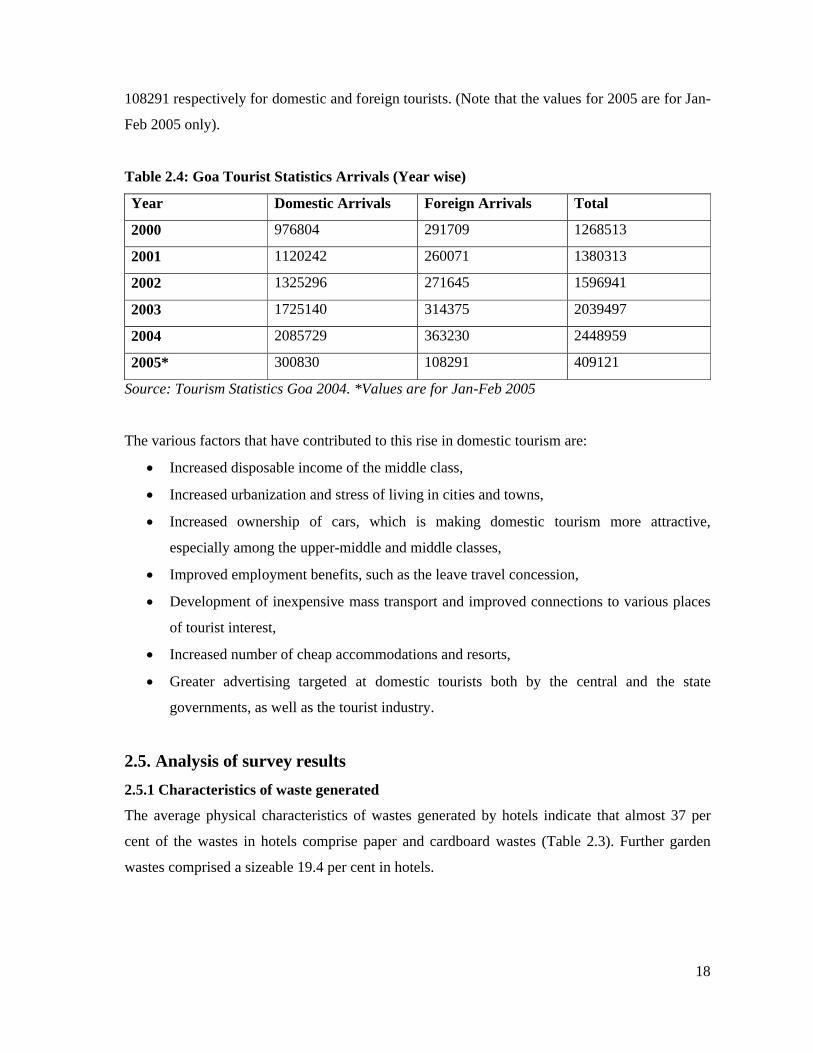
A similar analysis for domestic and foreign tourist arrivals within Goa for the last 5 years suggest
that in the year 2000, a total of 1268513 tourist arrived in Goa, of which 976804 and 291709
were domestic and foreign tourists respectively (Table 3.2). In 2005, the arrivals are 300830 and
18
108291 respectively for domestic and foreign tourists. (Note that the values for 2005 are for Jan-
Feb 2005 only).
Table 2.4: Goa Tourist Statistics Arrivals (Year wise)
Year Domestic Arrivals Foreign Arrivals Total
2000 976804 291709 1268513
2001 1120242 260071 1380313
2002 1325296 271645 1596941
2003 1725140 314375 2039497
2004 2085729 363230 2448959
2005* 300830 108291 409121
Source: Tourism Statistics Goa 2004. *Values are for Jan-Feb 2005
The various factors that have contributed to this rise in domestic tourism are:
Increased disposable income of the middle class,
Increased urbanization and stress of living in cities and towns,
Increased ownership of cars, which is making domestic tourism more attractive,
especially among the upper-middle and middle classes,
Improved employment benefits, such as the leave travel concession,
Development of inexpensive mass transport and improved connections to various places
of tourist interest,
Increased number of cheap accommodations and resorts,
Greater advertising targeted at domestic tourists both by the central and the state
governments, as well as the tourist industry.
2.5. Analysis of survey results
2.5.1 Characteristics of waste generated
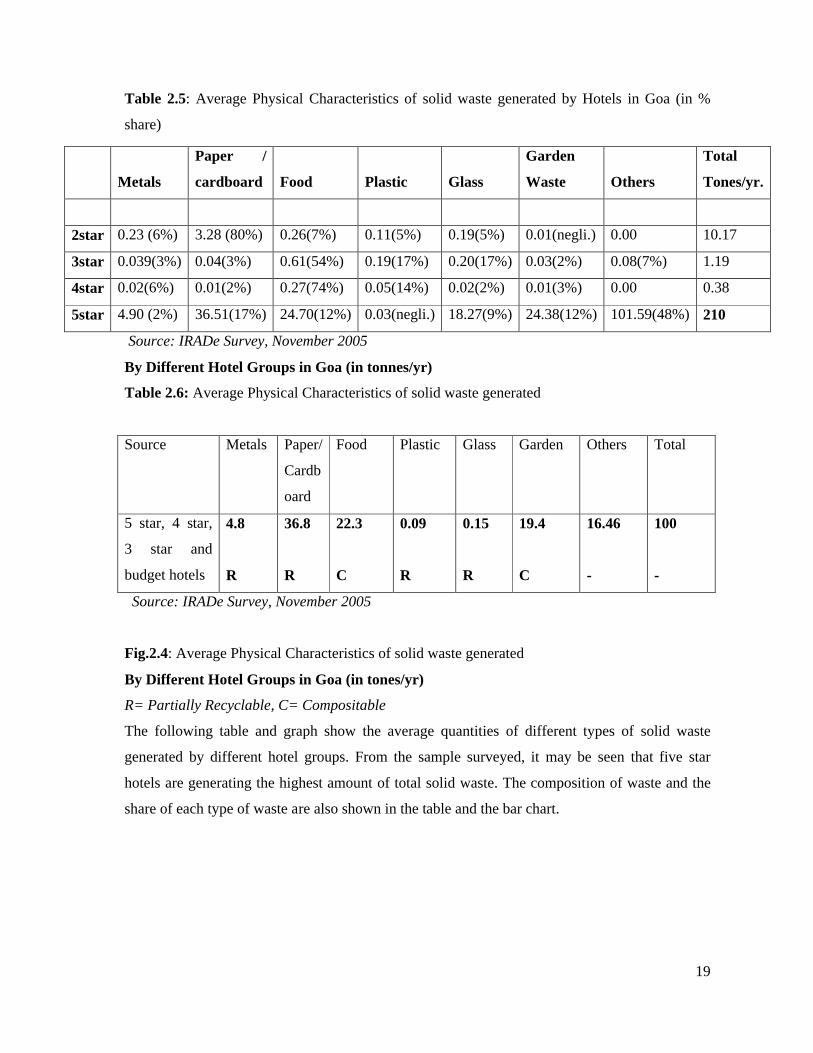
The average physical characteristics of wastes generated by hotels indicate that almost 37 per
cent of the wastes in hotels comprise paper and cardboard wastes (Table 2.3). Further garden
wastes comprised a sizeable 19.4 per cent in hotels.
19
Table 2.5: Average Physical Characteristics of solid waste generated by Hotels in Goa (in %
share)
Source: IRADe Survey, November 2005
By Different Hotel Groups in Goa (in tonnes/yr)
Table 2.6: Average Physical Characteristics of solid waste generated
Source: IRADe Survey, November 2005
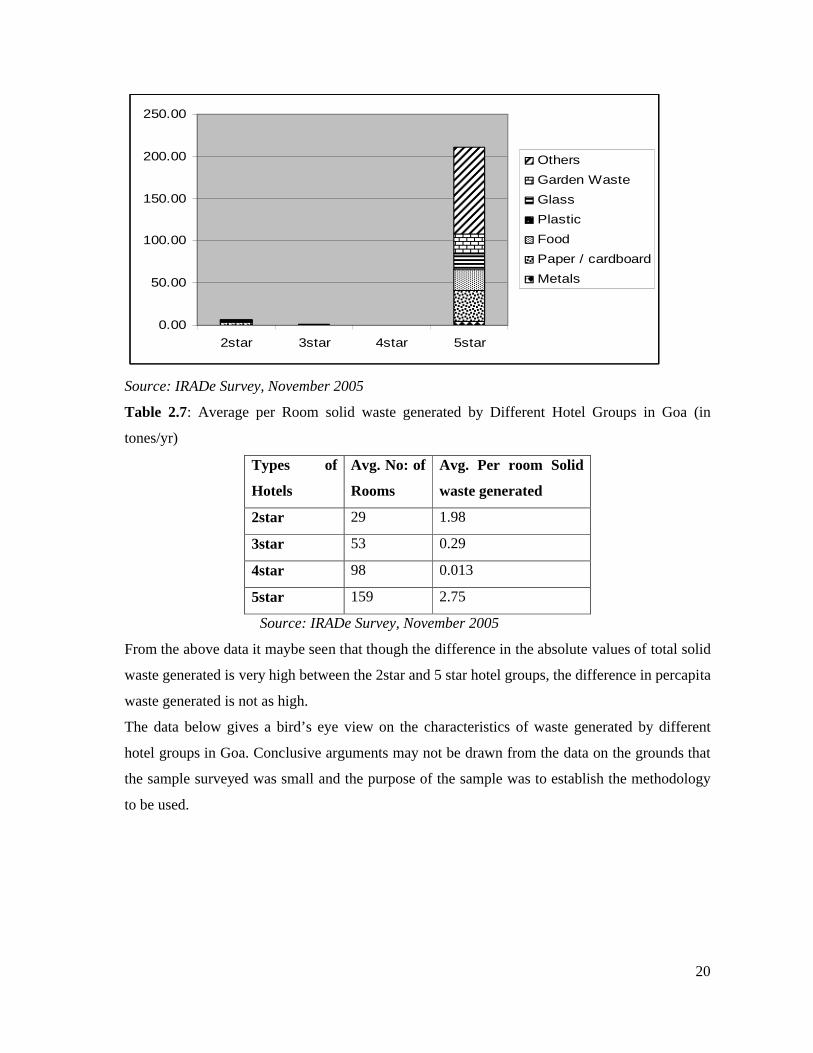
Fig.2.4: Average Physical Characteristics of solid waste generated
By Different Hotel Groups in Goa (in tones/yr)
R= Partially Recyclable, C= Compositable
The following table and graph show the average quantities of different types of solid waste
generated by different hotel groups. From the sample surveyed, it may be seen that five star
hotels are generating the highest amount of total solid waste. The composition of waste and the
share of each type of waste are also shown in the table and the bar chart.
Metals
Paper /
cardboard Food Plastic Glass
Garden
Waste Others
Total
Tones/yr.
2star 0.23 (6%) 3.28 (80%) 0.26(7%) 0.11(5%) 0.19(5%) 0.01(negli.) 0.00 10.17
3star 0.039(3%) 0.04(3%) 0.61(54%) 0.19(17%) 0.20(17%) 0.03(2%) 0.08(7%) 1.19
4star 0.02(6%) 0.01(2%) 0.27(74%) 0.05(14%) 0.02(2%) 0.01(3%) 0.00 0.38
5star 4.90 (2%) 36.51(17%) 24.70(12%) 0.03(negli.) 18.27(9%) 24.38(12%) 101.59(48%) 210
Source Metals Paper/
Cardb
oard
Food Plastic Glass Garden Others Total
5 star, 4 star,
3 star and
budget hotels
4.8
R
36.8
R
22.3
C
0.09
R
0.15
R
19.4
C
16.46
-
100
-
20
0.00
50.00
100.00
150.00
200.00
250.00
2star 3star 4star 5star
Others
Garden Waste
Glass
Plastic
Food
Paper / cardboard
Metals
Source: IRADe Survey, November 2005
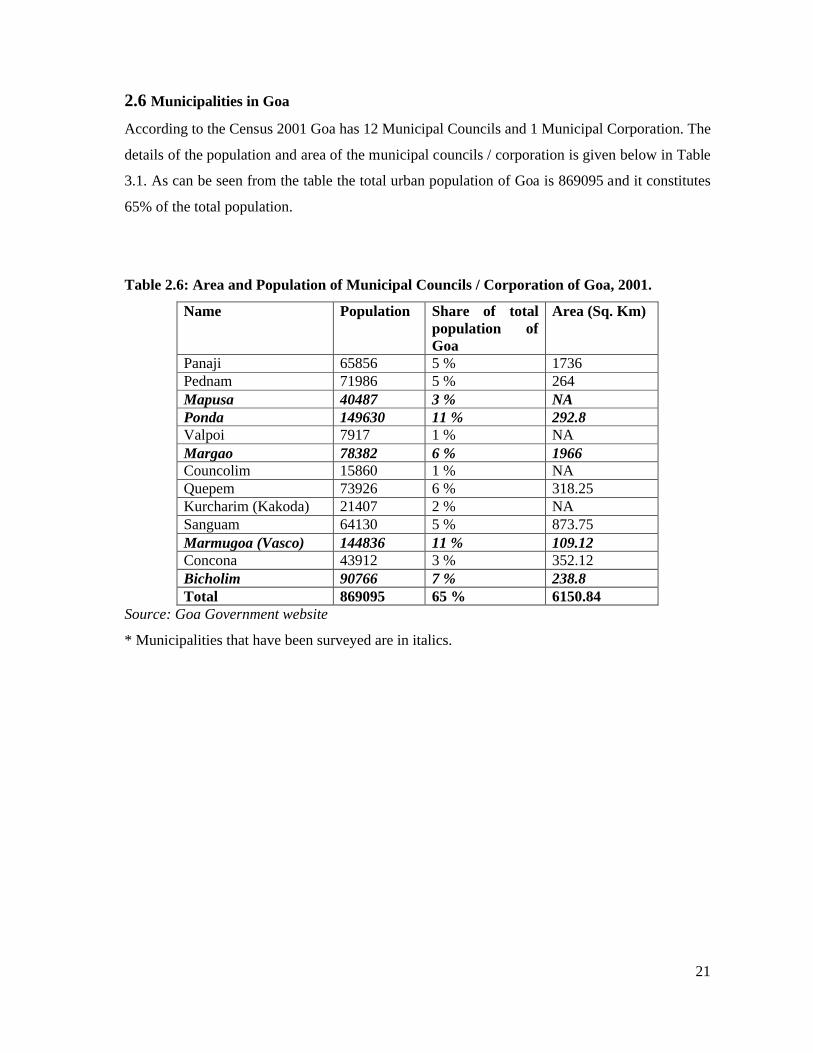
Table 2.7: Average per Room solid waste generated by Different Hotel Groups in Goa (in
tones/yr)
Types of
Hotels
Avg. No: of
Rooms
Avg. Per room Solid
waste generated
2star 29 1.98
3star 53 0.29
4star 98 0.013
5star 159 2.75
Source: IRADe Survey, November 2005
From the above data it maybe seen that though the difference in the absolute values of total solid
waste generated is very high between the 2star and 5 star hotel groups, the difference in percapita
waste generated is not as high.
The data below gives a bird’s eye view on the characteristics of waste generated by different
hotel groups in Goa. Conclusive arguments may not be drawn from the data on the grounds that
the sample surveyed was small and the purpose of the sample was to establish the methodology
to be used.
21
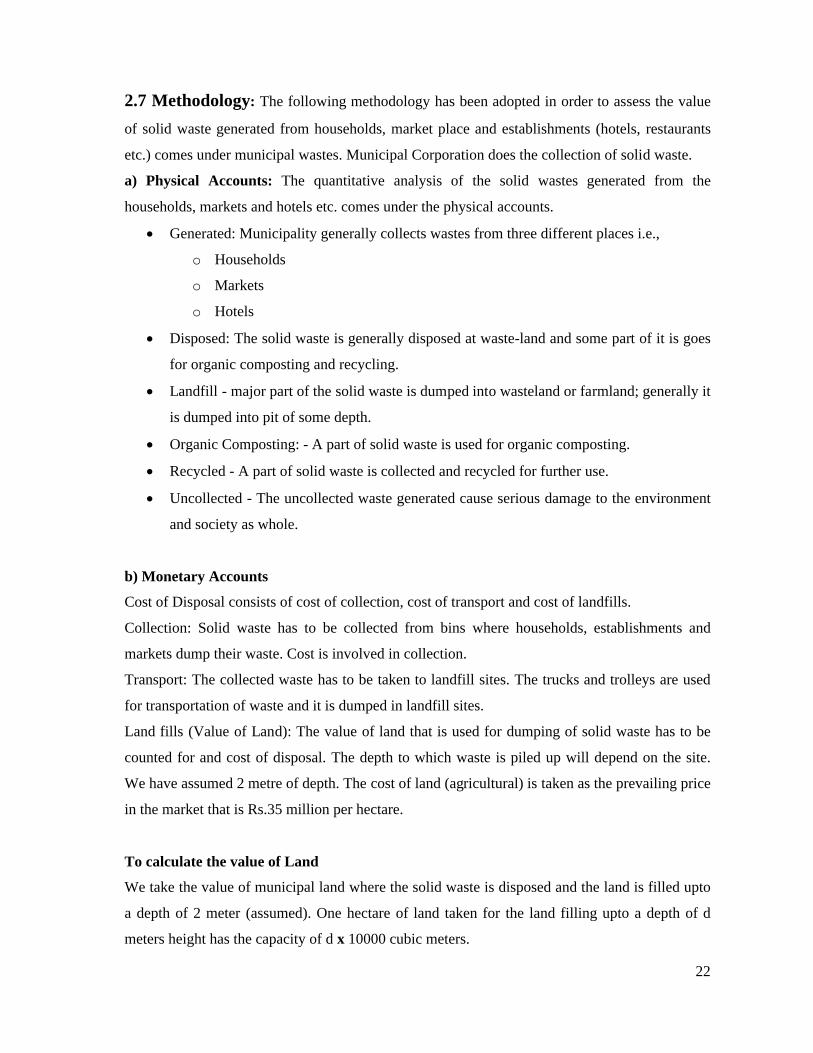
2.6 Municipalities in Goa
According to the Census 2001 Goa has 12 Municipal Councils and 1 Municipal Corporation. The
details of the population and area of the municipal councils / corporation is given below in Table
3.1. As can be seen from the table the total urban population of Goa is 869095 and it constitutes
65% of the total population.
Table 2.6: Area and Population of Municipal Councils / Corporation of Goa, 2001.
Name Population Share of total population of Goa
Area (Sq. Km)
Panaji 65856 5 % 1736Pednam 71986 5 % 264Mapusa 40487 3 % NAPonda 149630 11 % 292.8Valpoi 7917 1 % NAMargao 78382 6 % 1966Councolim 15860 1 % NAQuepem 73926 6 % 318.25Kurcharim (Kakoda) 21407 2 % NASanguam 64130 5 % 873.75Marmugoa (Vasco) 144836 11 % 109.12Concona 43912 3 % 352.12Bicholim 90766 7 % 238.8Total 869095 65 % 6150.84
Source: Goa Government website
* Municipalities that have been surveyed are in italics.
22
2.7 Methodology: The following methodology has been adopted in order to assess the value
of solid waste generated from households, market place and establishments (hotels, restaurants
etc.) comes under municipal wastes. Municipal Corporation does the collection of solid waste.
a) Physical Accounts: The quantitative analysis of the solid wastes generated from the
households, markets and hotels etc. comes under the physical accounts.
Generated: Municipality generally collects wastes from three different places i.e.,
o Households
o Markets
o Hotels
Disposed: The solid waste is generally disposed at waste-land and some part of it is goes
for organic composting and recycling.
Landfill - major part of the solid waste is dumped into wasteland or farmland; generally it
is dumped into pit of some depth.
Organic Composting: - A part of solid waste is used for organic composting.
Recycled - A part of solid waste is collected and recycled for further use.
Uncollected - The uncollected waste generated cause serious damage to the environment
and society as whole.
b) Monetary Accounts
Cost of Disposal consists of cost of collection, cost of transport and cost of landfills.
Collection: Solid waste has to be collected from bins where households, establishments and
markets dump their waste. Cost is involved in collection.
Transport: The collected waste has to be taken to landfill sites. The trucks and trolleys are used
for transportation of waste and it is dumped in landfill sites.
Land fills (Value of Land): The value of land that is used for dumping of solid waste has to be
counted for and cost of disposal. The depth to which waste is piled up will depend on the site.
We have assumed 2 metre of depth. The cost of land (agricultural) is taken as the prevailing price
in the market that is Rs.35 million per hectare.
To calculate the value of Land
We take the value of municipal land where the solid waste is disposed and the land is filled upto
a depth of 2 meter (assumed). One hectare of land taken for the land filling upto a depth of d
meters height has the capacity of d x 10000 cubic meters.
23
Price of Municipal land/hectare, VL = Rs. 35 million
Every Cubic meter uses up 1/d sq. meter of land.
Cost of land for disposal = (1/d) x VL /10000)/ m3 of waste
= ½ x 35/10000 million rupees
= Rs 1750/m3
2.8 Surveys for Solid Waste Management in Goa
The survey for natural resource accounting of solid waste management in Goa was carried out at
three levels:
o Municipality survey
o Household survey
o Market place survey
For administrative purposes Goa is divided into two districts- North Goa and South Goa with
headquarters at Panaji and Margao respectively. Goa has 13 Municipal councils / corporations.
The survey has been designed such that both the above districts are suitably represented.
2. 9 Survey design
Five Municipal Councils / Corporations have been selected such that the northern and southern
regions of Goa are suitably represented. For the study 40% of municipal councils were covered.
The following municipalities have been covered in the survey,
Mapusa Municipal Council
Ponda Municipal Council
Margao Municipal Council
Marmugoa Municipal Council
Bicholim Municipal Council
The key respondents to this survey have been municipal engineers or inspectors. Municipality
survey is being performed for the information on financial aspects of solid waste management as
well as to get an overall view of solid waste generated, collected, treated and disposed in the
State. The municipality survey was aimed to get information on total amount of waste generated
24
and the total expenditure in management of solid waste in Goa. The survey also gives
information on total expenditure on salaries / wages of people employed for solid waste
management as well as expenditure incurred in its transport, treatment and disposal. The
information is collected from the respective Municipal councils in both North and South Goa
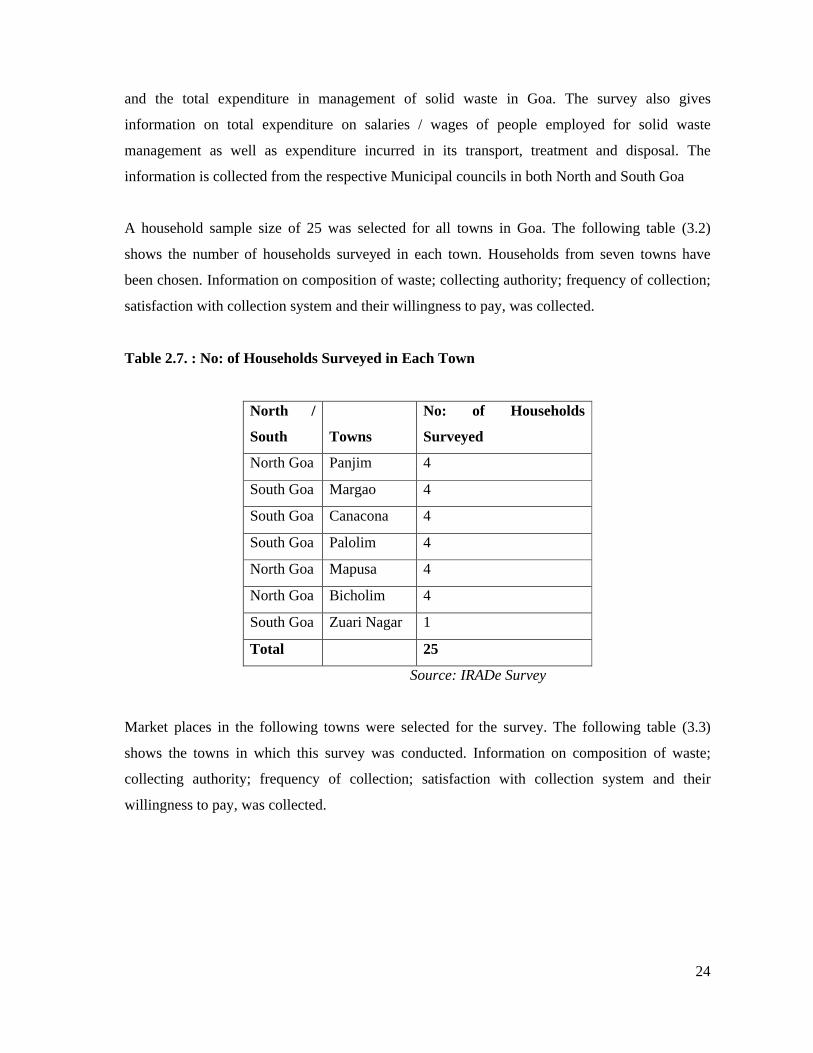
A household sample size of 25 was selected for all towns in Goa. The following table (3.2)
shows the number of households surveyed in each town. Households from seven towns have
been chosen. Information on composition of waste; collecting authority; frequency of collection;
satisfaction with collection system and their willingness to pay, was collected.
Table 2.7. : No: of Households Surveyed in Each Town
North /
South Towns
No: of Households
Surveyed
North Goa Panjim 4
South Goa Margao 4
South Goa Canacona 4
South Goa Palolim 4
North Goa Mapusa 4
North Goa Bicholim 4
South Goa Zuari Nagar 1
Total 25
Source: IRADe Survey
Market places in the following towns were selected for the survey. The following table (3.3)
shows the towns in which this survey was conducted. Information on composition of waste;
collecting authority; frequency of collection; satisfaction with collection system and their
willingness to pay, was collected.
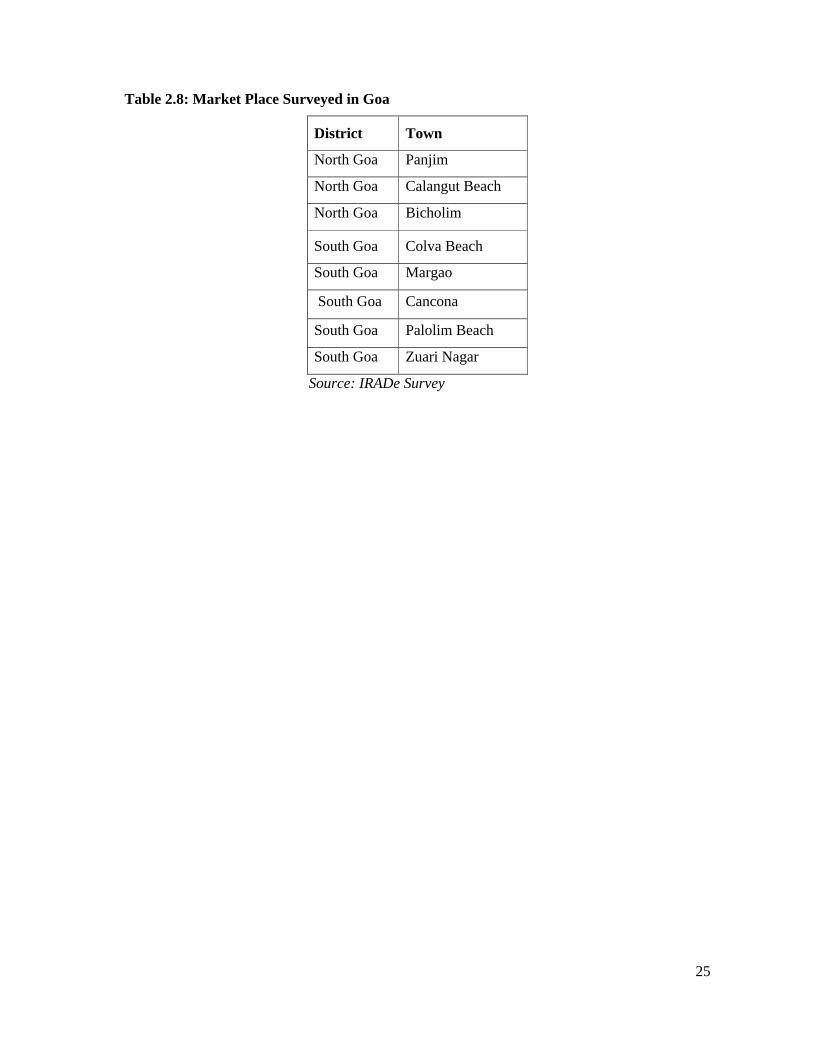
25
Table 2.8: Market Place Surveyed in Goa
District Town
North Goa Panjim
North Goa Calangut Beach
North Goa Bicholim
South Goa Colva Beach
South Goa Margao
South Goa Cancona
South Goa Palolim Beach
South Goa Zuari Nagar
Source: IRADe Survey
26
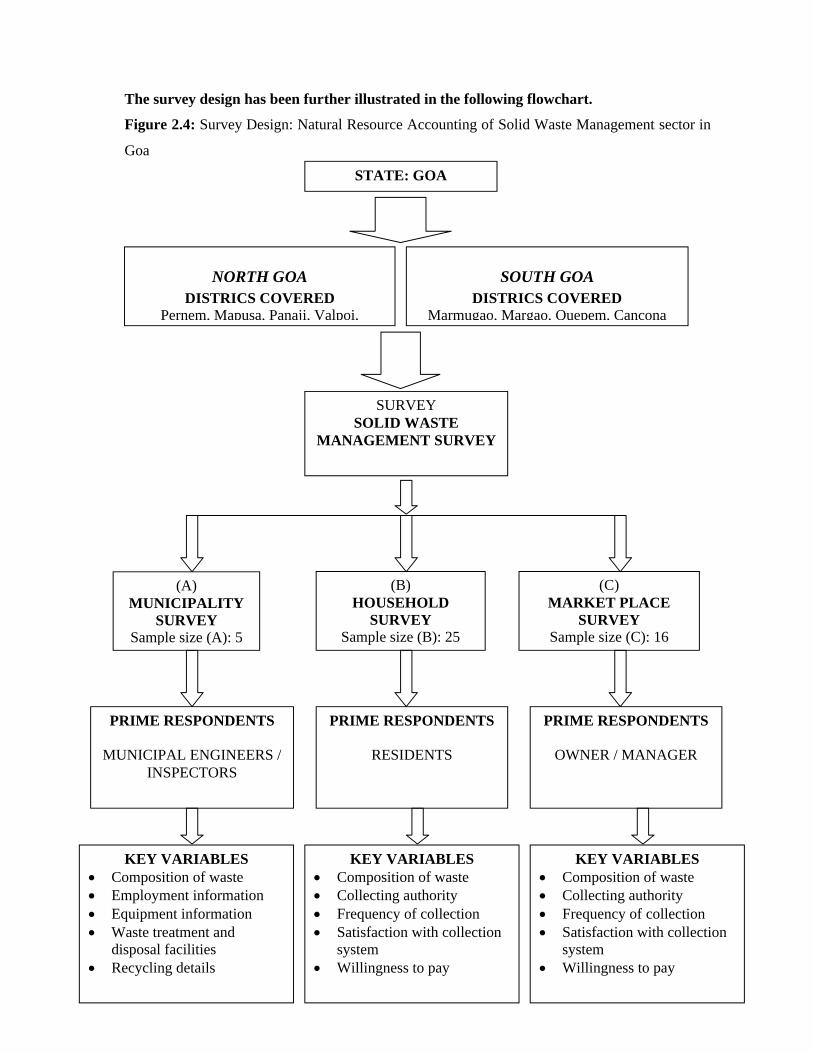
The survey design has been further illustrated in the following flowchart.
Figure 2.4: Survey Design: Natural Resource Accounting of Solid Waste Management sector in
Goa
STATE: GOA
SURVEY SOLID WASTE
MANAGEMENT SURVEY
(A)MUNICIPALITY
SURVEYSample size (A): 5
(B)HOUSEHOLD
SURVEYSample size (B): 25
(C)MARKET PLACE
SURVEYSample size (C): 16
NORTH GOADISTRICS COVERED
Pernem, Mapusa, Panaji, Valpoi,
SOUTH GOADISTRICS COVERED
Marmugao, Margao, Quepem, Cancona
PRIME RESPONDENTS
MUNICIPAL ENGINEERS / INSPECTORS
PRIME RESPONDENTS
RESIDENTS
PRIME RESPONDENTS
OWNER / MANAGER
KEY VARIABLES Composition of waste Employment information Equipment information Waste treatment and
disposal facilities Recycling details
KEY VARIABLES Composition of waste Collecting authority Frequency of collection Satisfaction with collection
system Willingness to pay
KEY VARIABLES Composition of waste Collecting authority Frequency of collection Satisfaction with collection
system Willingness to pay
27
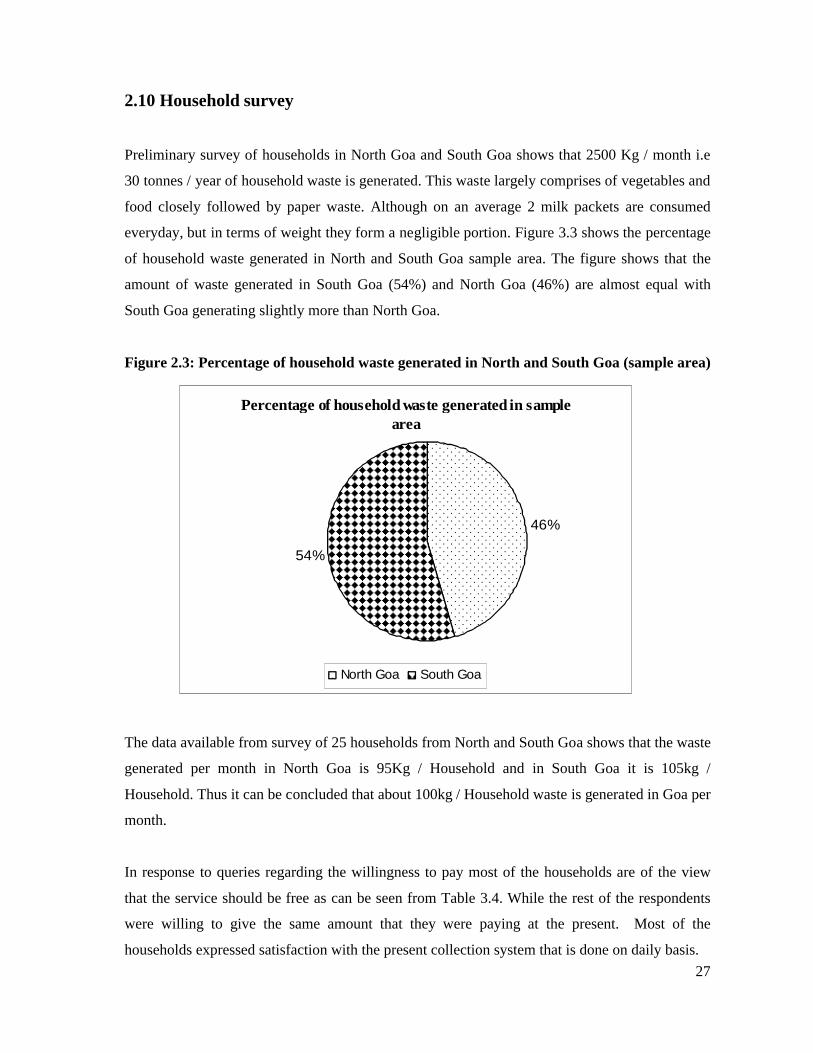
2.10 Household survey
Preliminary survey of households in North Goa and South Goa shows that 2500 Kg / month i.e
30 tonnes / year of household waste is generated. This waste largely comprises of vegetables and
food closely followed by paper waste. Although on an average 2 milk packets are consumed
everyday, but in terms of weight they form a negligible portion. Figure 3.3 shows the percentage
of household waste generated in North and South Goa sample area. The figure shows that the
amount of waste generated in South Goa (54%) and North Goa (46%) are almost equal with
South Goa generating slightly more than North Goa.
Figure 2.3: Percentage of household waste generated in North and South Goa (sample area)
Percentage of household waste generated in sample area
46%
54%
North Goa South Goa
The data available from survey of 25 households from North and South Goa shows that the waste
generated per month in North Goa is 95Kg / Household and in South Goa it is 105kg /
Household. Thus it can be concluded that about 100kg / Household waste is generated in Goa per
month.
In response to queries regarding the willingness to pay most of the households are of the view
that the service should be free as can be seen from Table 3.4. While the rest of the respondents
were willing to give the same amount that they were paying at the present. Most of the
households expressed satisfaction with the present collection system that is done on daily basis.
28
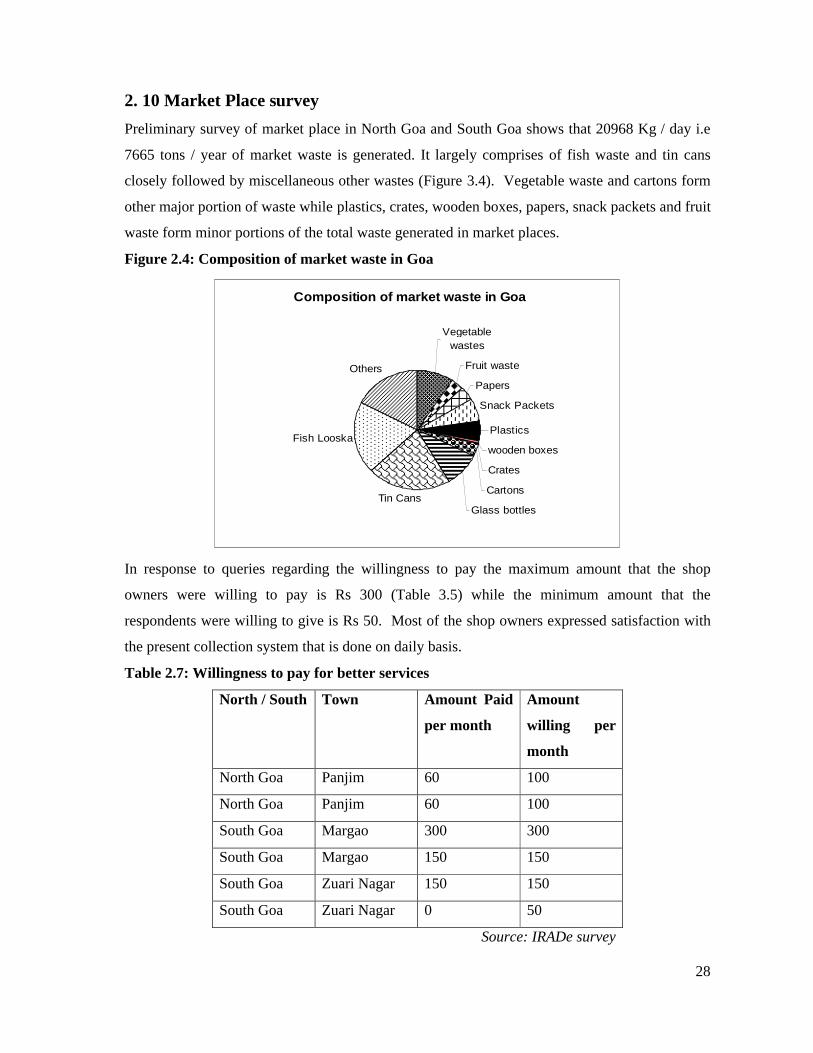
2. 10 Market Place survey
Preliminary survey of market place in North Goa and South Goa shows that 20968 Kg / day i.e
7665 tons / year of market waste is generated. It largely comprises of fish waste and tin cans
closely followed by miscellaneous other wastes (Figure 3.4). Vegetable waste and cartons form
other major portion of waste while plastics, crates, wooden boxes, papers, snack packets and fruit
waste form minor portions of the total waste generated in market places.
Figure 2.4: Composition of market waste in Goa
Composition of market waste in Goa
Vegetable wastes
Fruit waste
Papers
Snack Packets
Plastics
wooden boxes
Crates
Cartons
Glass bottlesTin Cans
Fish Looska
Others
In response to queries regarding the willingness to pay the maximum amount that the shop
owners were willing to pay is Rs 300 (Table 3.5) while the minimum amount that the
respondents were willing to give is Rs 50. Most of the shop owners expressed satisfaction with
the present collection system that is done on daily basis.
Table 2.7: Willingness to pay for better services
North / South Town Amount Paid
per month
Amount
willing per
month
North Goa Panjim 60 100
North Goa Panjim 60 100
South Goa Margao 300 300
South Goa Margao 150 150
South Goa Zuari Nagar 150 150
South Goa Zuari Nagar 0 50
Source: IRADe survey
29
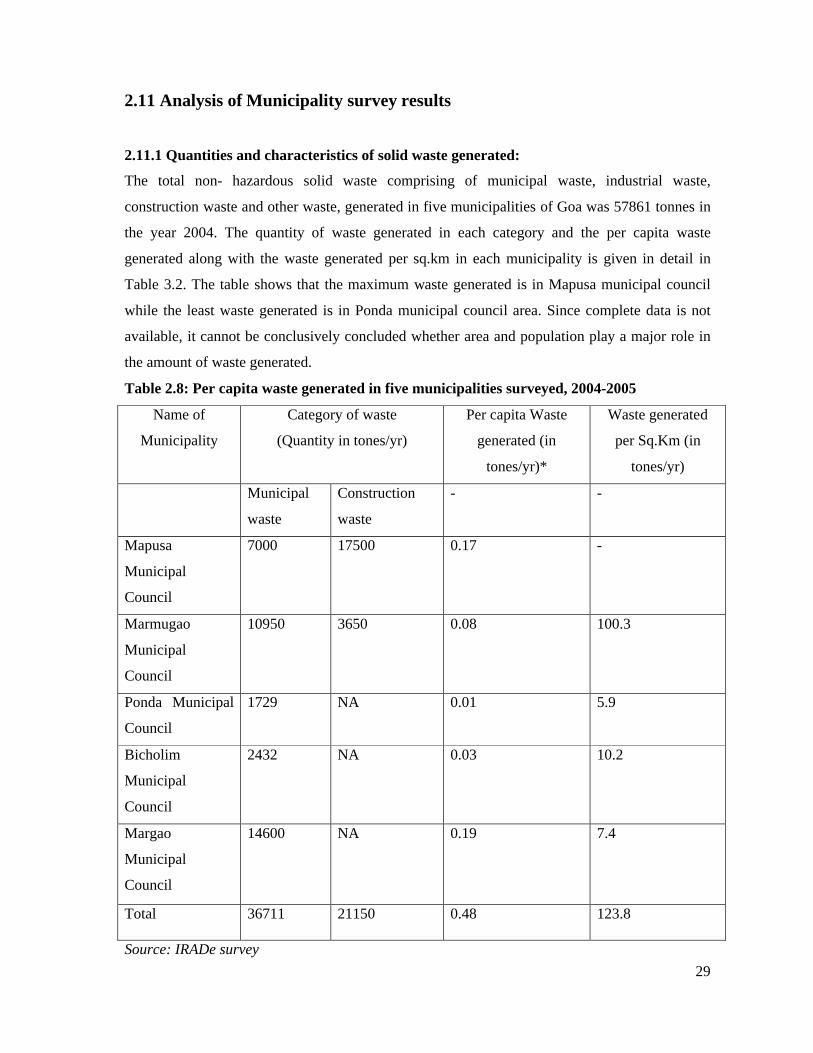
2.11 Analysis of Municipality survey results
2.11.1 Quantities and characteristics of solid waste generated:
The total non- hazardous solid waste comprising of municipal waste, industrial waste,
construction waste and other waste, generated in five municipalities of Goa was 57861 tonnes in
the year 2004. The quantity of waste generated in each category and the per capita waste
generated along with the waste generated per sq.km in each municipality is given in detail in
Table 3.2. The table shows that the maximum waste generated is in Mapusa municipal council
while the least waste generated is in Ponda municipal council area. Since complete data is not
available, it cannot be conclusively concluded whether area and population play a major role in
the amount of waste generated.
Table 2.8: Per capita waste generated in five municipalities surveyed, 2004-2005
Name of
Municipality
Category of waste
(Quantity in tones/yr)
Per capita Waste
generated (in
tones/yr)*
Waste generated
per Sq.Km (in
tones/yr)
Municipal
waste
Construction
waste
- -
Mapusa
Municipal
Council
7000 17500 0.17 -
Marmugao
Municipal
Council
10950 3650 0.08 100.3
Ponda Municipal
Council
1729 NA 0.01 5.9
Bicholim
Municipal
Council
2432 NA 0.03 10.2
Margao
Municipal
Council
14600 NA 0.19 7.4
Total 36711 21150 0.48 123.8
Source: IRADe survey
30
* Per capita is only for Municipal Solid waste
* NA – Not available separately
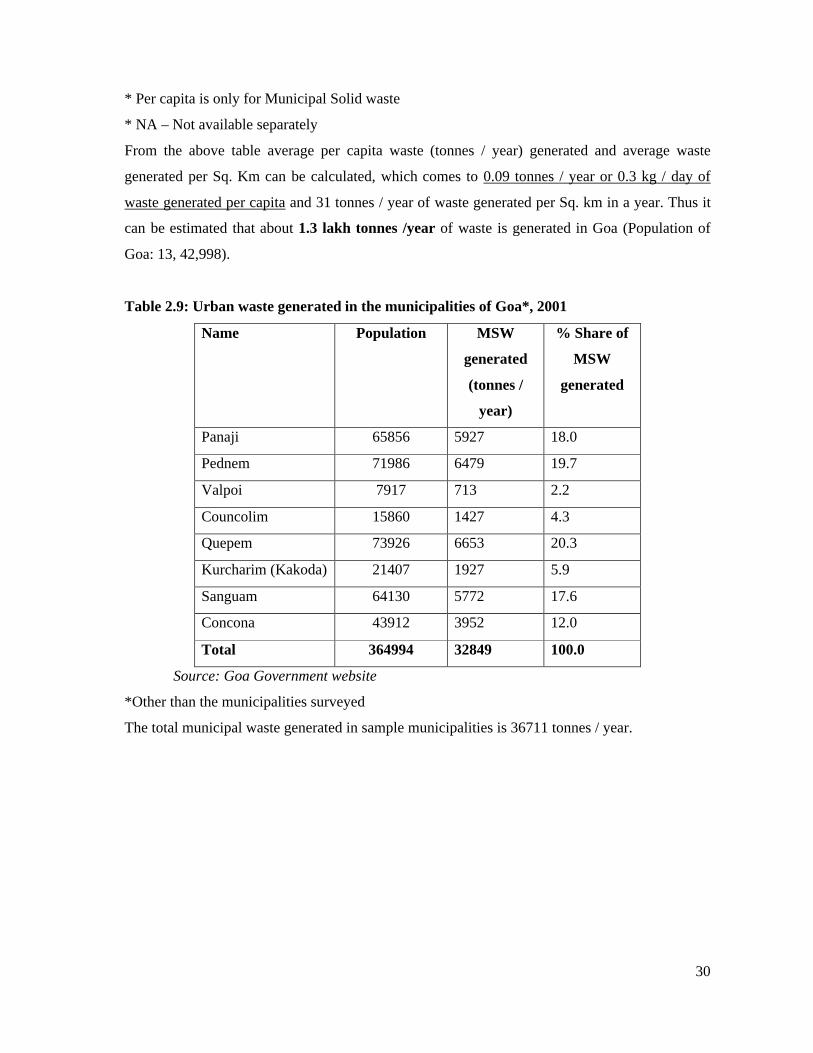
From the above table average per capita waste (tonnes / year) generated and average waste
generated per Sq. Km can be calculated, which comes to 0.09 tonnes / year or 0.3 kg / day of
waste generated per capita and 31 tonnes / year of waste generated per Sq. km in a year. Thus it
can be estimated that about 1.3 lakh tonnes /year of waste is generated in Goa (Population of
Goa: 13, 42,998).
Table 2.9: Urban waste generated in the municipalities of Goa*, 2001
Name Population MSW
generated
(tonnes /
year)
% Share of
MSW
generated
Panaji 65856 5927 18.0
Pednem 71986 6479 19.7
Valpoi 7917 713 2.2
Councolim 15860 1427 4.3
Quepem 73926 6653 20.3
Kurcharim (Kakoda) 21407 1927 5.9
Sanguam 64130 5772 17.6
Concona 43912 3952 12.0
Total 364994 32849 100.0
Source: Goa Government website
*Other than the municipalities surveyed
The total municipal waste generated in sample municipalities is 36711 tonnes / year.
31
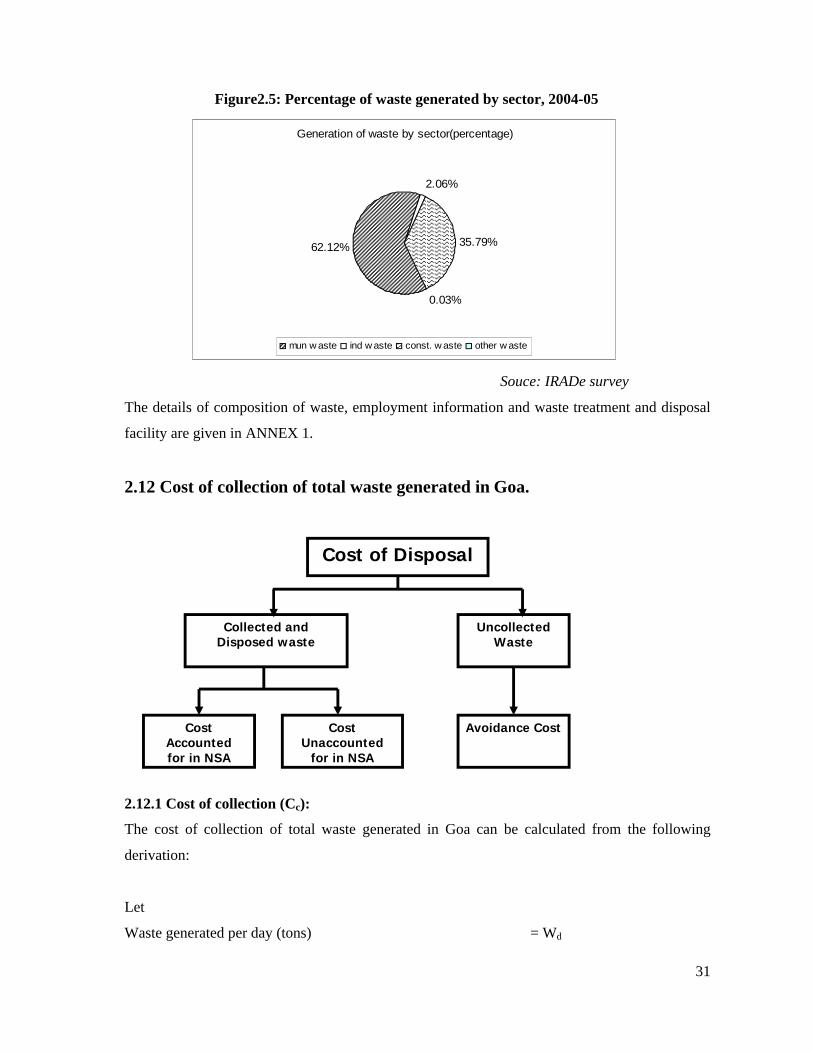
Figure2.5: Percentage of waste generated by sector, 2004-05
Generation of waste by sector(percentage)
0.03%
35.79%
2.06%
62.12%
mun w aste ind w aste const. w aste other w aste
Souce: IRADe survey
The details of composition of waste, employment information and waste treatment and disposal
facility are given in ANNEX 1.
2.12 Cost of collection of total waste generated in Goa.
2.12.1 Cost of collection (Cc):
The cost of collection of total waste generated in Goa can be calculated from the following
derivation:
Let
Waste generated per day (tons) = Wd
Cost Unaccounted
for in NSA
Cost Accountedfor in NSA
Avoidance Cost
Collected and Disposed waste
UncollectedWaste
Cost of Disposal
32
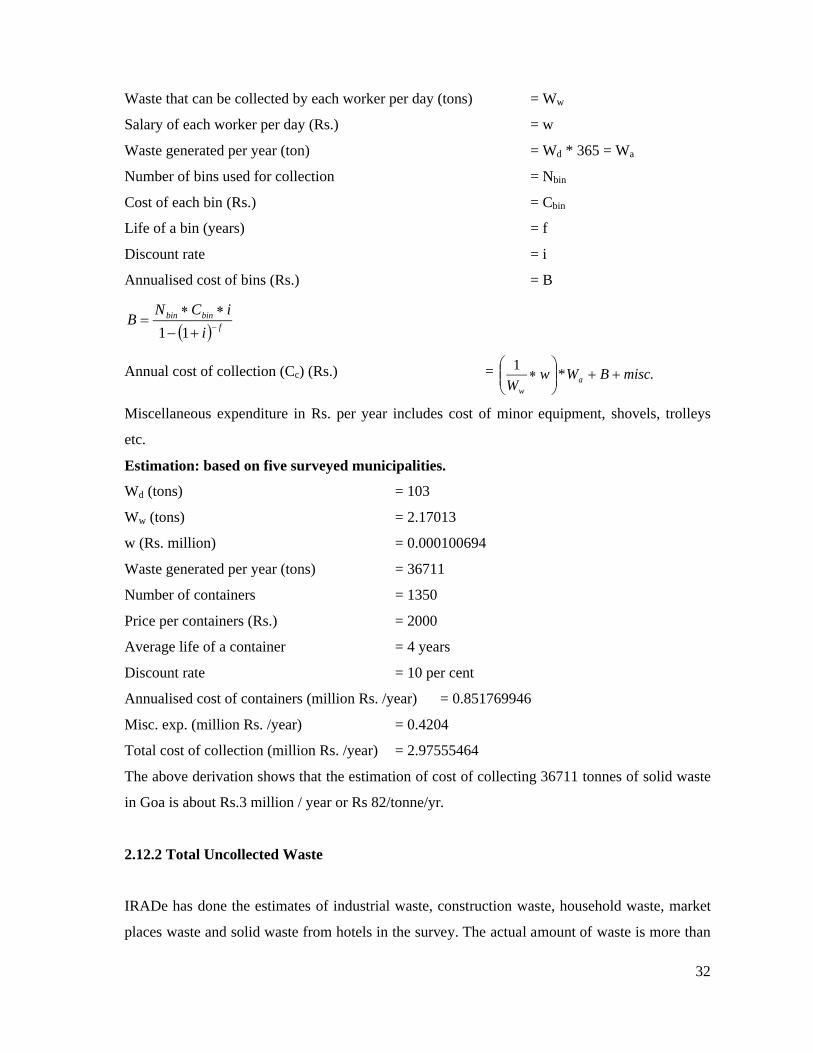
Waste that can be collected by each worker per day (tons) = Ww
Salary of each worker per day (Rs.) = w
Waste generated per year (ton) = Wd * 365 = Wa
Number of bins used for collection = Nbin
Cost of each bin (Rs.) = Cbin
Life of a bin (years) = f
Discount rate = i
Annualised cost of bins (Rs.) = B
fbinbin
i
iCNB
11
Annual cost of collection (Cc) (Rs.) = .*1
miscBWwW a
w
Miscellaneous expenditure in Rs. per year includes cost of minor equipment, shovels, trolleys
etc.
Estimation: based on five surveyed municipalities.
Wd (tons) = 103
Ww (tons) = 2.17013
w (Rs. million) = 0.000100694
Waste generated per year (tons) = 36711
Number of containers = 1350
Price per containers (Rs.) = 2000
Average life of a container = 4 years
Discount rate = 10 per cent
Annualised cost of containers (million Rs. /year) = 0.851769946
Misc. exp. (million Rs. /year) = 0.4204
Total cost of collection (million Rs. /year) = 2.97555464
The above derivation shows that the estimation of cost of collecting 36711 tonnes of solid waste
in Goa is about Rs.3 million / year or Rs 82/tonne/yr.
2.12.2 Total Uncollected Waste
IRADe has done the estimates of industrial waste, construction waste, household waste, market
places waste and solid waste from hotels in the survey. The actual amount of waste is more than
33
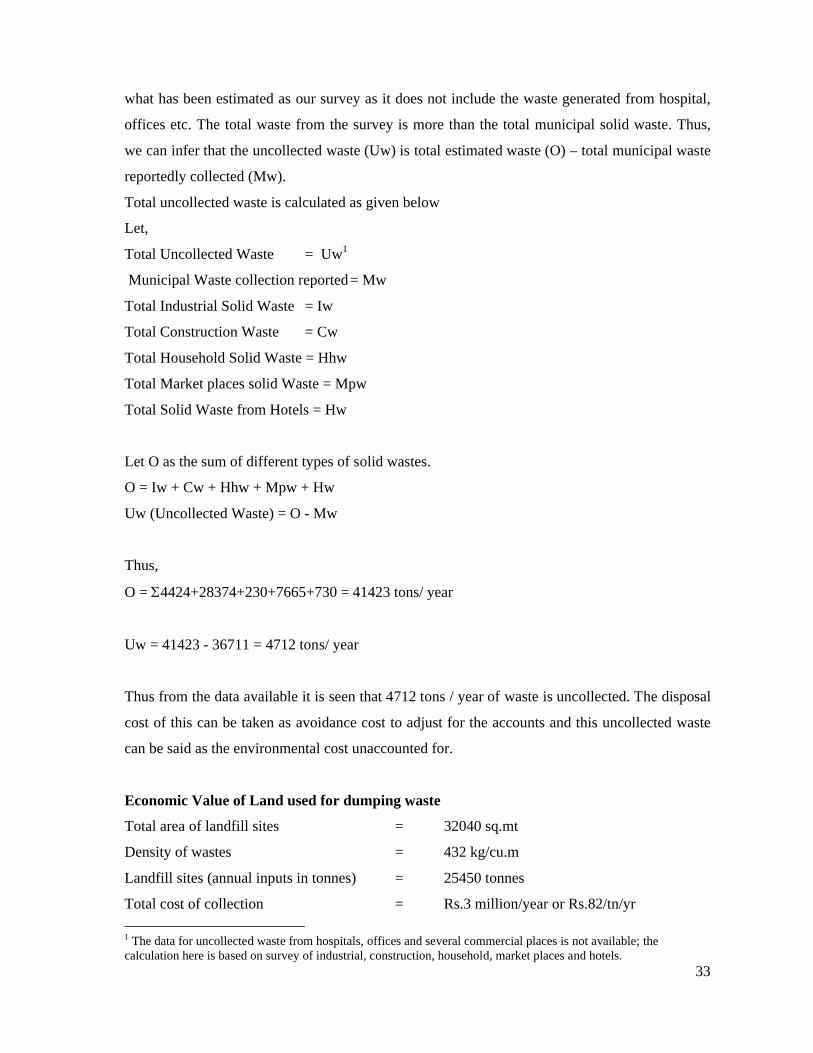
what has been estimated as our survey as it does not include the waste generated from hospital,
offices etc. The total waste from the survey is more than the total municipal solid waste. Thus,
we can infer that the uncollected waste (Uw) is total estimated waste (O) – total municipal waste
reportedly collected (Mw).
Total uncollected waste is calculated as given below
Let,
Total Uncollected Waste = Uw1
Municipal Waste collection reported= Mw
Total Industrial Solid Waste = Iw
Total Construction Waste = Cw
Total Household Solid Waste = Hhw
Total Market places solid Waste = Mpw
Total Solid Waste from Hotels = Hw
Let O as the sum of different types of solid wastes.
O = Iw + Cw + Hhw + Mpw + Hw
Uw (Uncollected Waste) = O - Mw
Thus,
O = 4424+28374+230+7665+730 = 41423 tons/ year
Uw = 41423 - 36711 = 4712 tons/ year
Thus from the data available it is seen that 4712 tons / year of waste is uncollected. The disposal
cost of this can be taken as avoidance cost to adjust for the accounts and this uncollected waste
can be said as the environmental cost unaccounted for.
Economic Value of Land used for dumping waste
Total area of landfill sites = 32040 sq.mt
Density of wastes = 432 kg/cu.m
Landfill sites (annual inputs in tonnes) = 25450 tonnes
Total cost of collection = Rs.3 million/year or Rs.82/tn/yr
1 The data for uncollected waste from hospitals, offices and several commercial places is not available; the calculation here is based on survey of industrial, construction, household, market places and hotels.
34
Total Uncollected Waste Uw = 4712 tn/year
Avoidance Cost of Uncollected wastes = 4712*82 = Rs.390000/tn/yr.
Collected waste = 1750*55500 = Rs.97 million
Uncollected waste = 1750*8100 = Rs.14 million
Where,1750 = Cost of land for disposal in Rs. / m3
2.13 Summary
Goa is one of the best and first choice of tourist from India as well as from foreign countries. The
visit of tourist generates income for locals of Goa and increases the economy of our country.
This has led to increase in solid waste that is generated from hotels, market places and
households. The waste generated from the hotels comprises of metals, paper/cardboard, food,
plastic, glass, garden and others. The maximum solid waste generated is from the 5 star hotels
and it is equal to 210 tonnes /yr. This shows that there is lot of waste generated from the hotels
and five star hotels are contributing the most. The total cost of collection of waste generated by
the hotels surveyed in IRADe survey in 2005 is Rs.19 million / year.
The survey for solid waste management was carried in three parts i.e., municipality, households
and market place. The cost of land was assumed from the prevailing prices of the land in the
market. The economic value of municipal land for disposal comes out to be Rs. 1750/m3. The
percentage of household waste generated per month in North Goa is 95Kg / Household and in
South Goa it is 105kg / Household. The estimated total solid waste generated is about 1.3-lakh
tn/year in Goa. The total cost of collection is Rs.3million/year or Rs. 82/tn/yr. The avoidance
cost of uncollected waste is Rs 4 lakhs/tn/yr. The cost of uncollected waste is Rs.14 million. This
shows that the uncollected waste which costs Rs.14 million and the avoidance cost is Rs 4
lakhs/tn/yr, serious steps needs to be taken for the better disposal and collection of the solid
waste for better environment and economy of the Goa and country as a whole.
35
Air and Water Pollution
3.1 Introduction
Industries are growing at a fast pace in India. Industries also are potential contributors to the
degradation of the environment leading to water pollution, air pollution, noise pollution and so
on. Unplanned and uncontrolled industrial development leads to incompatible land use patterns
thereby increasing the risks on the receiving environment.
The protection of the environment can be achieved by proper planning and management of
various spatial entities viz. water resources, land, settlements, forests etc. in the most effective
manner. As in many other parts of the country, developmental activities and human pressure,
including tourism, have had an adverse impact on the environment of Goa. Like other states
being affected by the rapid industrialization
Goa too now is at the stage of great concern for the environmental conservation. Several issues,
which need to be looked upon, include Waste management, pollution of wells in villages,
uncontrolled construction with little attention given to protect delicate ecosystem and many
others. There seems lack of basic infrastructure for proper management and sustain the pressure
of the massive flow of tourists every year.
Though Goa aspires to be a modern state in many ways. Unlike some specially protected states it
has been a kind of open house to welcome for new industries and other developmental activities.
3.2 Different types of industries causing Air Pollution in Goa
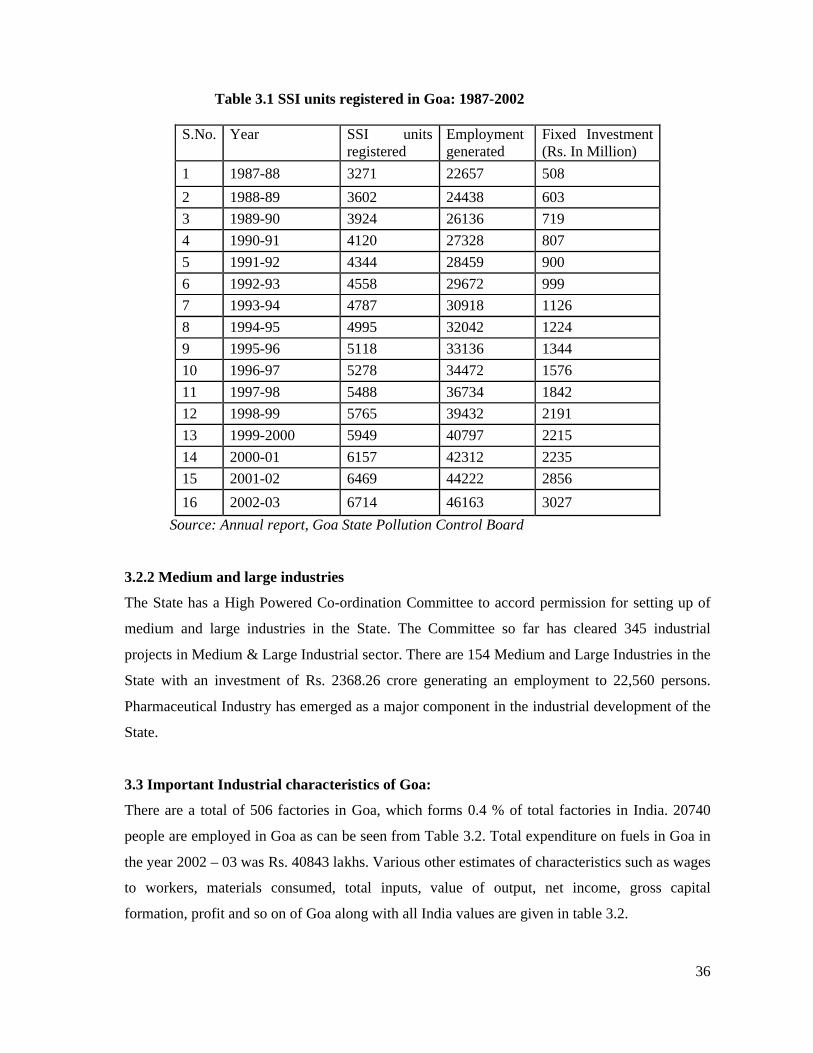
3.2.1 Small-scale industries
During the year 2003-04 upto December 2003, 101 SSI units have been permanently registered
with an investment of Rs. 696.10 lakh providing employment to 618 persons. In addition, 582
SSI units have been registered provisionally with an investment of Rs. 4109.20 lakh generating
employment to 4588 persons. Trend in registration of small-scale units, employment generation
and investment during the post-statehood period of Goa is given in table 3.1.
3
36
Table 3.1 SSI units registered in Goa: 1987-2002
S.No. Year SSI units registered
Employment generated
Fixed Investment (Rs. In Million)
1 1987-88 3271 22657 508
2 1988-89 3602 24438 603
3 1989-90 3924 26136 719
4 1990-91 4120 27328 807
5 1991-92 4344 28459 900
6 1992-93 4558 29672 999
7 1993-94 4787 30918 1126
8 1994-95 4995 32042 1224
9 1995-96 5118 33136 1344
10 1996-97 5278 34472 1576
11 1997-98 5488 36734 1842
12 1998-99 5765 39432 2191
13 1999-2000 5949 40797 2215
14 2000-01 6157 42312 2235
15 2001-02 6469 44222 2856
16 2002-03 6714 46163 3027
Source: Annual report, Goa State Pollution Control Board
3.2.2 Medium and large industries
The State has a High Powered Co-ordination Committee to accord permission for setting up of
medium and large industries in the State. The Committee so far has cleared 345 industrial
projects in Medium & Large Industrial sector. There are 154 Medium and Large Industries in the
State with an investment of Rs. 2368.26 crore generating an employment to 22,560 persons.
Pharmaceutical Industry has emerged as a major component in the industrial development of the
State.
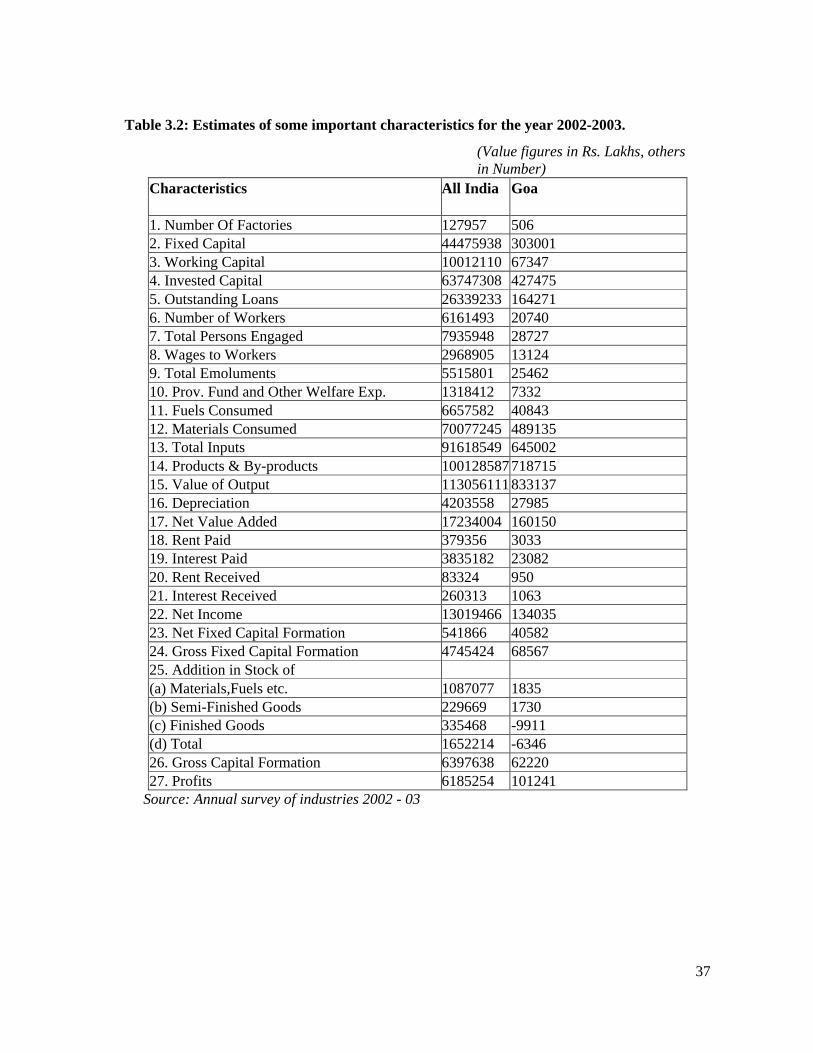
3.3 Important Industrial characteristics of Goa:
There are a total of 506 factories in Goa, which forms 0.4 % of total factories in India. 20740
people are employed in Goa as can be seen from Table 3.2. Total expenditure on fuels in Goa in
the year 2002 – 03 was Rs. 40843 lakhs. Various other estimates of characteristics such as wages
to workers, materials consumed, total inputs, value of output, net income, gross capital
formation, profit and so on of Goa along with all India values are given in table 3.2.
37
Table 3.2: Estimates of some important characteristics for the year 2002-2003.
(Value figures in Rs. Lakhs, others in Number)
Characteristics All India Goa
1. Number Of Factories 127957 5062. Fixed Capital 44475938 3030013. Working Capital 10012110 673474. Invested Capital 63747308 4274755. Outstanding Loans 26339233 1642716. Number of Workers 6161493 207407. Total Persons Engaged 7935948 287278. Wages to Workers 2968905 131249. Total Emoluments 5515801 2546210. Prov. Fund and Other Welfare Exp. 1318412 733211. Fuels Consumed 6657582 4084312. Materials Consumed 70077245 48913513. Total Inputs 91618549 64500214. Products & By-products 100128587 71871515. Value of Output 113056111 83313716. Depreciation 4203558 2798517. Net Value Added 17234004 16015018. Rent Paid 379356 303319. Interest Paid 3835182 2308220. Rent Received 83324 95021. Interest Received 260313 106322. Net Income 13019466 13403523. Net Fixed Capital Formation 541866 4058224. Gross Fixed Capital Formation 4745424 6856725. Addition in Stock of(a) Materials,Fuels etc. 1087077 1835(b) Semi-Finished Goods 229669 1730(c) Finished Goods 335468 -9911(d) Total 1652214 -634626. Gross Capital Formation 6397638 6222027. Profits 6185254 101241
Source: Annual survey of industries 2002 - 03
38
3.4 AIR POLLUTION IN GOA
The 18 industrial estates, from Pernem in the north to Madcaim in the heart of Goa, and down to
Canacona in the South, have led to a severe pollution in the last few years. The metallurgical
units and the steel rolling mills at Kundaim plateau emit voluminous fumes, as scrap iron is
openly melted in blast furnaces. The carbon dioxide fumes generated during the production is a
threat to the temple towns of Mardol, Mangueshi and Kundaim. The Tapobhumi temple complex
is in the windward direction of the Kundil steel rolling mill directly affected by the acid rains
generated by the heavy smog produced by the carbon dioxide and the sulphur dioxide fumes of
the plant. The steel units around Pernem have polluted the atmosphere in that region. Likewise,
the industrial estates in Cuncolim and Madcaim had led to many health hazards to the local
villagers.
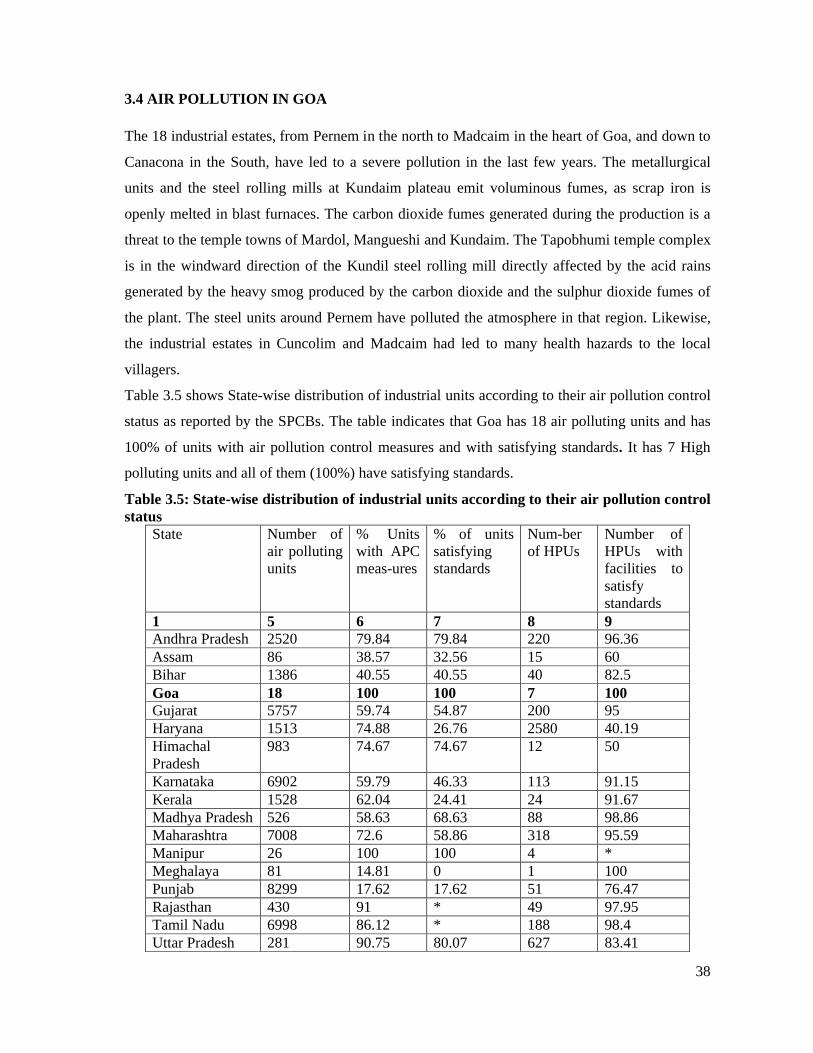
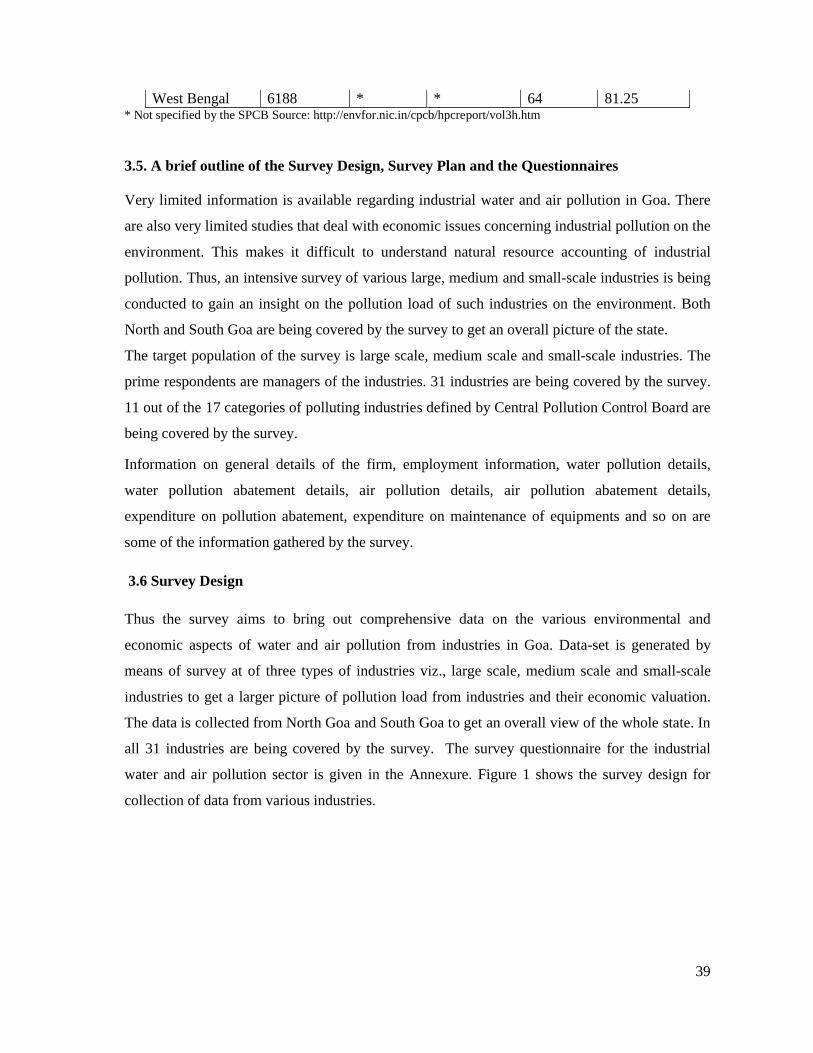
Table 3.5 shows State-wise distribution of industrial units according to their air pollution control
status as reported by the SPCBs. The table indicates that Goa has 18 air polluting units and has
100% of units with air pollution control measures and with satisfying standards. It has 7 High
polluting units and all of them (100%) have satisfying standards.
Table 3.5: State-wise distribution of industrial units according to their air pollution control status
State Number of air polluting units
% Units with APC meas-ures
% of units satisfying standards
Num-ber of HPUs
Number of HPUs with facilities to satisfy standards
1 5 6 7 8 9Andhra Pradesh 2520 79.84 79.84 220 96.36Assam 86 38.57 32.56 15 60Bihar 1386 40.55 40.55 40 82.5Goa 18 100 100 7 100Gujarat 5757 59.74 54.87 200 95Haryana 1513 74.88 26.76 2580 40.19Himachal Pradesh
983 74.67 74.67 12 50
Karnataka 6902 59.79 46.33 113 91.15Kerala 1528 62.04 24.41 24 91.67Madhya Pradesh 526 58.63 68.63 88 98.86Maharashtra 7008 72.6 58.86 318 95.59Manipur 26 100 100 4 *Meghalaya 81 14.81 0 1 100Punjab 8299 17.62 17.62 51 76.47Rajasthan 430 91 * 49 97.95Tamil Nadu 6998 86.12 * 188 98.4Uttar Pradesh 281 90.75 80.07 627 83.41
39
West Bengal 6188 * * 64 81.25* Not specified by the SPCB Source: http://envfor.nic.in/cpcb/hpcreport/vol3h.htm
3.5. A brief outline of the Survey Design, Survey Plan and the Questionnaires
Very limited information is available regarding industrial water and air pollution in Goa. There
are also very limited studies that deal with economic issues concerning industrial pollution on the
environment. This makes it difficult to understand natural resource accounting of industrial
pollution. Thus, an intensive survey of various large, medium and small-scale industries is being
conducted to gain an insight on the pollution load of such industries on the environment. Both
North and South Goa are being covered by the survey to get an overall picture of the state.
The target population of the survey is large scale, medium scale and small-scale industries. The
prime respondents are managers of the industries. 31 industries are being covered by the survey.
11 out of the 17 categories of polluting industries defined by Central Pollution Control Board are
being covered by the survey.
Information on general details of the firm, employment information, water pollution details,
water pollution abatement details, air pollution details, air pollution abatement details,
expenditure on pollution abatement, expenditure on maintenance of equipments and so on are
some of the information gathered by the survey.
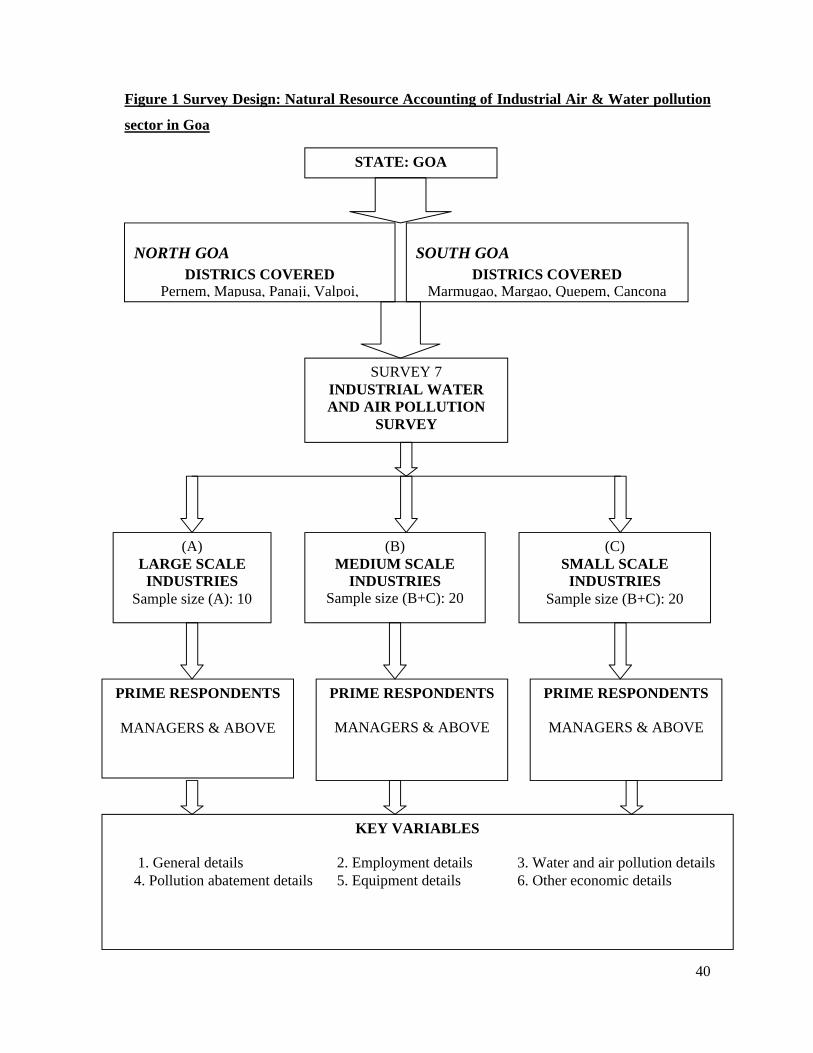
3.6 Survey Design
Thus the survey aims to bring out comprehensive data on the various environmental and
economic aspects of water and air pollution from industries in Goa. Data-set is generated by
means of survey at of three types of industries viz., large scale, medium scale and small-scale
industries to get a larger picture of pollution load from industries and their economic valuation.
The data is collected from North Goa and South Goa to get an overall view of the whole state. In
all 31 industries are being covered by the survey. The survey questionnaire for the industrial
water and air pollution sector is given in the Annexure. Figure 1 shows the survey design for
collection of data from various industries.
40
Figure 1 Survey Design: Natural Resource Accounting of Industrial Air & Water pollution
sector in Goa
STATE: GOA
SURVEY 7INDUSTRIAL WATER AND AIR POLLUTION
SURVEY
(A)LARGE SCALE
INDUSTRIESSample size (A): 10
(B)MEDIUM SCALE
INDUSTRIESSample size (B+C): 20
(C)SMALL SCALE
INDUSTRIESSample size (B+C): 20
NORTH GOADISTRICS COVERED
Pernem, Mapusa, Panaji, Valpoi,
SOUTH GOADISTRICS COVERED
Marmugao, Margao, Quepem, Cancona
PRIME RESPONDENTS
MANAGERS & ABOVE
PRIME RESPONDENTS
MANAGERS & ABOVE
PRIME RESPONDENTS
MANAGERS & ABOVE
KEY VARIABLES
1. General details 2. Employment details 3. Water and air pollution details4. Pollution abatement details 5. Equipment details 6. Other economic details
41
3.7 Methodology
In India environmental management is largely carried out at the state level. This is true for
natural resources such as forests and land as well as for air, water quality and solid waste
pollution. Therefore, the focus of efforts to improve environmental stewardship has to be at the
state level.
The methodology implemented here uses state-level data from Goa to calculate pollution
intensity, pollution load and cost of pollution abatement of air pollution. The steps used are
briefly described here:
(i) The first step is to estimate the pollution load for each firm and industrial sector. Since actual
information of this nature does not exist, it is estimated by using data on pollution intensities
(effluent/emission per unit of output) from the World Bank Industrial Pollution Projection
System (IPPS) database. Industrial output data by sector is collected from the official Annual
Survey of Industry (ASI) in India. Note pollution intensities are given by sector and thus assume
that all firms within a sector are identical.
(ii) Next, calculate the cost of pollution abatement using estimates of average abatement cost
expressed in terms of US$ (1993 prices) per ton of pollutant reduced from the same World Bank
IPPS database. We convert this to 2000 - 01 rupees/ton (Table 7). These costs, however, are
reported only at the sectoral level and are constant. In other words, for each sector there is only
one cost figure
3.8 Application of Methodology to State level data of Goa
As an illustration of the methodology outlined above we focus on 17 "highly polluting" industrial
sectors identified by the Central Pollution Control Board (CPCB). These sectors appear to be the
focus of regulatory attention and are regularly highlighted in the annual reports of CPCB and on
its website. Most state pollution control boards (SPCBs) also take their cue from CPCB in
focusing on these sectors. These sectors are also major industrial sectors in terms of share of
output and employment. They are: (1) aluminum smelting; (2) basic drugs and pharmaceuticals;
(3) caustic soda; (4) cement; (5) copper smelting; (6) distillery; (7) dyes and dye intermediates;
(8) fertilizer; (9) integrated iron and steel; (10) leather; (11) oil refineries; (12) pesticide (13)
petrochemical; (14) paper and pulp; (15) sugar; (16) thermal power plants, and (17) zinc
smelting.
Some of the categories (e.g., "leather", "sugar") are quite general and need to be described
further in terms of specific processes that generate pollution. In other words, in order to use
42
output data from ASI 2000-01 in conjunction with pollution coefficients from IPPS, it is
necessary to translate the broad CPCB categories into specific sectors using industrial
classification systems. This issue is discussed further below.
As stated earlier, emissions/effluent data is not gathered on a regular basis for most industries in
India at the national or state level (only ambient air and water quality are monitored on a regular
basis). SPCBs typically classify industries into broad categories based on their potential to
pollute. The objective is to subject units in the former category to more frequent monitoring and
inspection than those in the latter. There is, however, no regular data collection of
emission/effluent discharge for units in either category.
Thus, the first step is to estimate the pollution load for these 17 sectors by using the Industrial
Pollution Projection System (IPPS) developed at the World Bank. IPPS exploits the fact that
industrial pollution is highly affected by the scale of industrial activity and its sectoral
composition. It operates through sector estimates of pollution intensity (usually defined as
pollution load per unit of output or pollution load per unit of employment). Results from IPPS
have been used in various countries where insufficient data on industrial pollution proved to be
an impediment to setting up pollution control strategies and prioritization of activities, for
example, Brazil, Latvia, Mexico and Vietnam. The IPPS methodology has also been used in
published research such as Cole et al. (1998), Vukina et al. (1999) and Reinert and Roland-
Holst (2001 a, 2001b).
Thus, sectoral estimates of pollution intensity from IPPS are applied to data on value of output
for the polluting sectors identified by CPCB. This enables estimation of the pollution load at
the state level for air pollutants such as NO2, SO2 and particulate matter. In doing so, one has
to first map the broad categories defined by CPCB (e.g., leather, sugar) into specific industrial
activities by ISIC codes (e.g., ISIC 3231--tanneries and leather finishing or ISIC 3118- sugar
factories and refineries) that are typically used to measure output, value added, employment,
etc. Such a mapping is required to make the CPCB categories consistent with IPPS pollution
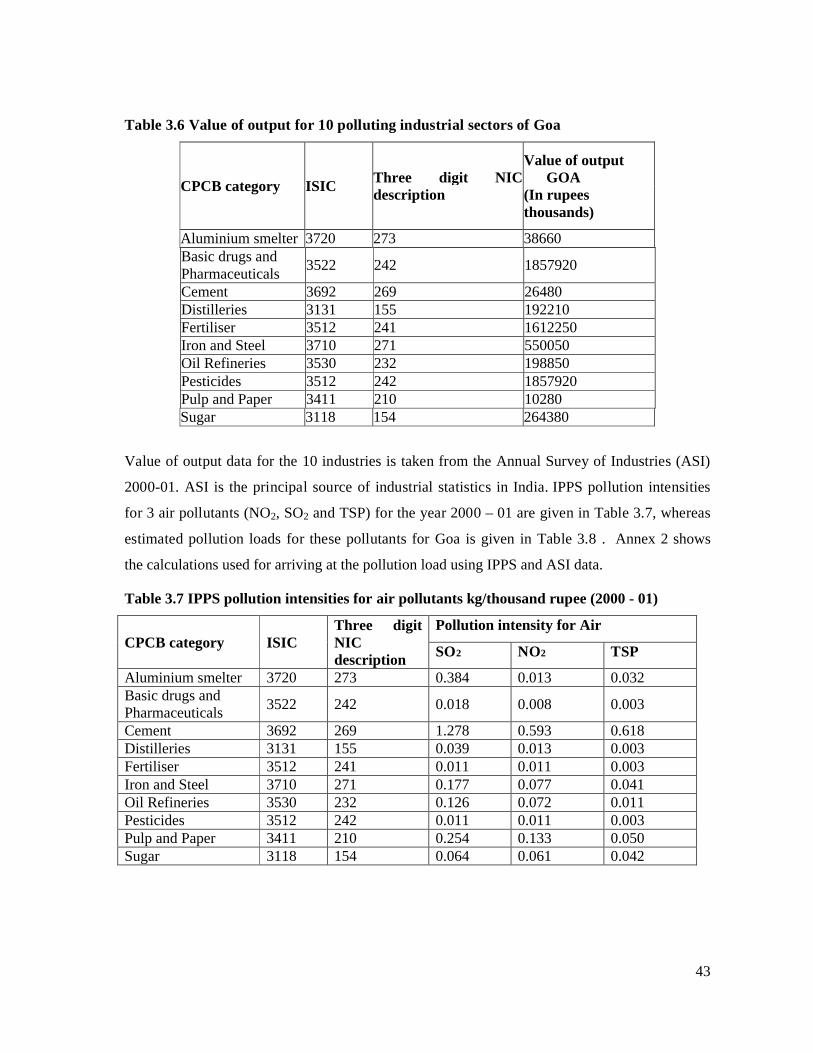
intensities and marginal abatement costs (MACs) that are reported by ISIC. Table 3.6 presents
data on value of output for 10 CPCB polluting industries and their corresponding ISIC codes
for Goa state.
43
Table 3.6 Value of output for 10 polluting industrial sectors of Goa
CPCB category ISICThree digit NIC description
Value of output GOA(In rupees thousands)
Aluminium smelter 3720 273 38660Basic drugs andPharmaceuticals
3522 242 1857920
Cement 3692 269 26480Distilleries 3131 155 192210Fertiliser 3512 241 1612250Iron and Steel 3710 271 550050Oil Refineries 3530 232 198850Pesticides 3512 242 1857920Pulp and Paper 3411 210 10280Sugar 3118 154 264380
Value of output data for the 10 industries is taken from the Annual Survey of Industries (ASI)
2000-01. ASI is the principal source of industrial statistics in India. IPPS pollution intensities
for 3 air pollutants (NO2, SO2 and TSP) for the year 2000 – 01 are given in Table 3.7, whereas
estimated pollution loads for these pollutants for Goa is given in Table 3.8 . Annex 2 shows
the calculations used for arriving at the pollution load using IPPS and ASI data.
Table 3.7 IPPS pollution intensities for air pollutants kg/thousand rupee (2000 - 01)
CPCB category ISICThree digit NIC description
Pollution intensity for Air
SO2 NO2 TSP
Aluminium smelter 3720 273 0.384 0.013 0.032Basic drugs andPharmaceuticals
3522 242 0.018 0.008 0.003
Cement 3692 269 1.278 0.593 0.618Distilleries 3131 155 0.039 0.013 0.003Fertiliser 3512 241 0.011 0.011 0.003Iron and Steel 3710 271 0.177 0.077 0.041Oil Refineries 3530 232 0.126 0.072 0.011Pesticides 3512 242 0.011 0.011 0.003Pulp and Paper 3411 210 0.254 0.133 0.050Sugar 3118 154 0.064 0.061 0.042
44
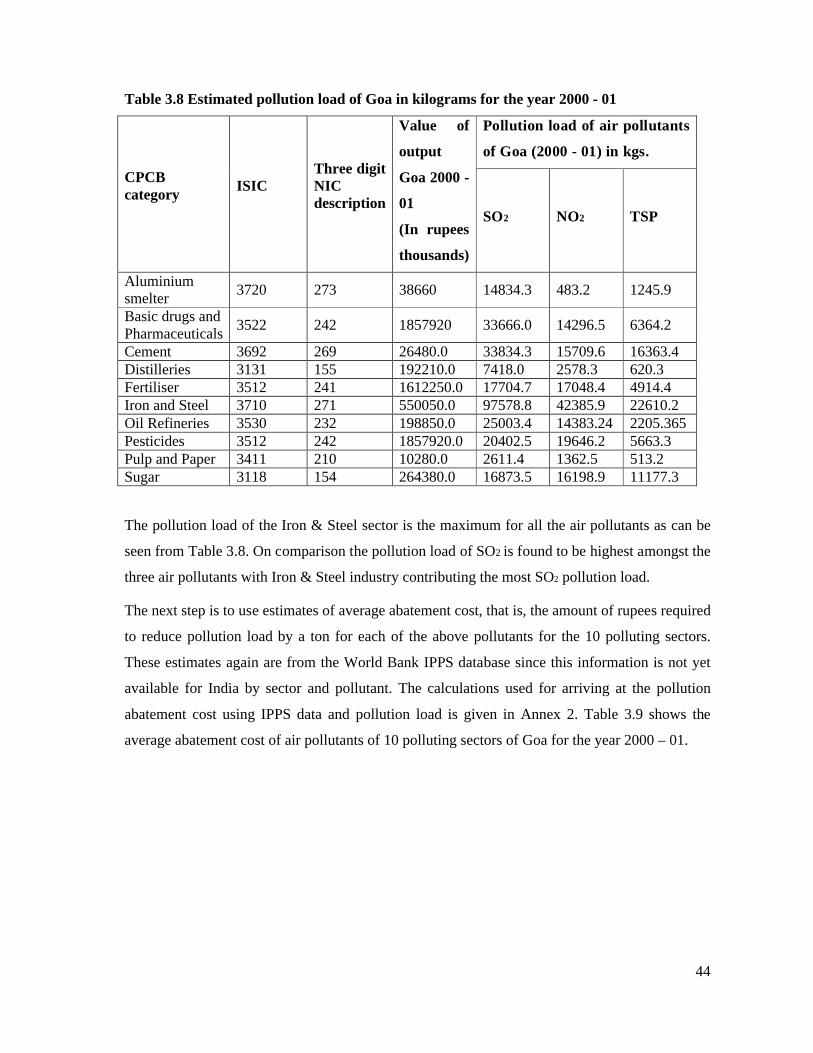
Table 3.8 Estimated pollution load of Goa in kilograms for the year 2000 - 01
CPCB category
ISICThree digit NIC description
Value of
output
Goa 2000 -
01
(In rupees
thousands)
Pollution load of air pollutants
of Goa (2000 - 01) in kgs.
SO2 NO2 TSP
Aluminium smelter
3720 273 38660 14834.3 483.2 1245.9
Basic drugs andPharmaceuticals
3522 242 1857920 33666.0 14296.5 6364.2
Cement 3692 269 26480.0 33834.3 15709.6 16363.4Distilleries 3131 155 192210.0 7418.0 2578.3 620.3Fertiliser 3512 241 1612250.0 17704.7 17048.4 4914.4Iron and Steel 3710 271 550050.0 97578.8 42385.9 22610.2Oil Refineries 3530 232 198850.0 25003.4 14383.24 2205.365Pesticides 3512 242 1857920.0 20402.5 19646.2 5663.3Pulp and Paper 3411 210 10280.0 2611.4 1362.5 513.2Sugar 3118 154 264380.0 16873.5 16198.9 11177.3
The pollution load of the Iron & Steel sector is the maximum for all the air pollutants as can be
seen from Table 3.8. On comparison the pollution load of SO2 is found to be highest amongst the
three air pollutants with Iron & Steel industry contributing the most SO2 pollution load.
The next step is to use estimates of average abatement cost, that is, the amount of rupees required
to reduce pollution load by a ton for each of the above pollutants for the 10 polluting sectors.
These estimates again are from the World Bank IPPS database since this information is not yet
available for India by sector and pollutant. The calculations used for arriving at the pollution
abatement cost using IPPS data and pollution load is given in Annex 2. Table 3.9 shows the
average abatement cost of air pollutants of 10 polluting sectors of Goa for the year 2000 – 01.
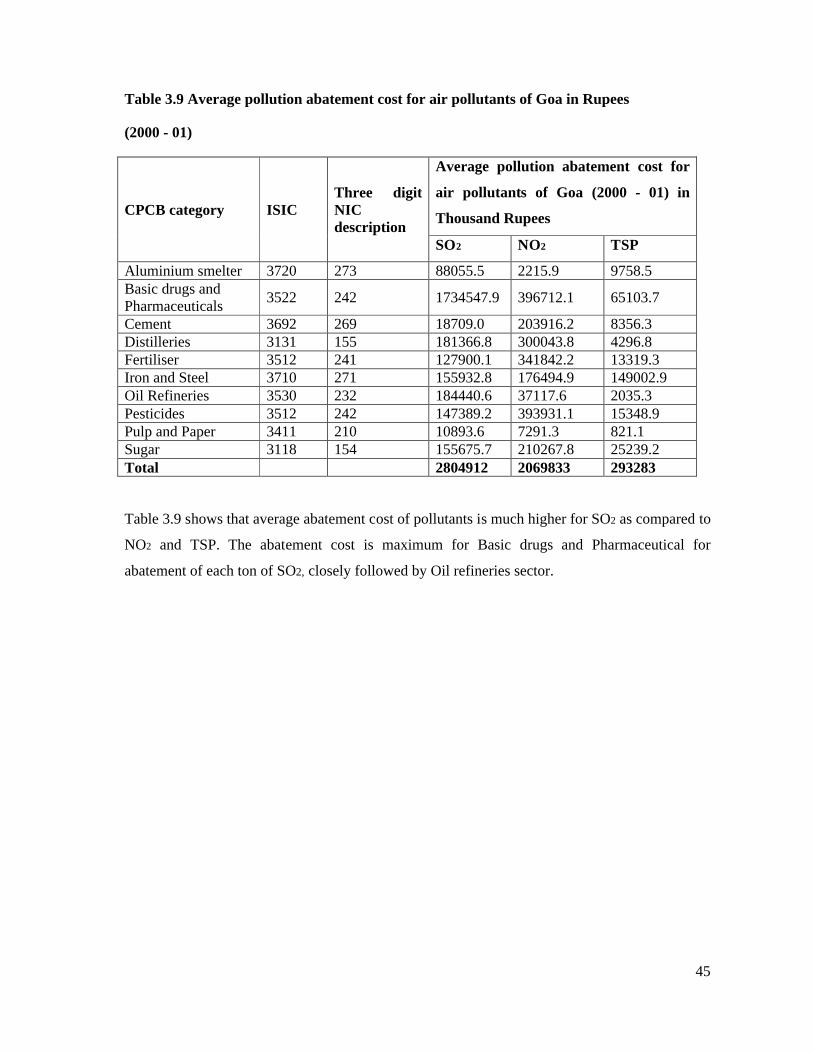
45
Table 3.9 Average pollution abatement cost for air pollutants of Goa in Rupees
(2000 - 01)
CPCB category ISICThree digit NIC description
Average pollution abatement cost for
air pollutants of Goa (2000 - 01) in
Thousand Rupees
SO2 NO2 TSP
Aluminium smelter 3720 273 88055.5 2215.9 9758.5Basic drugs andPharmaceuticals
3522 242 1734547.9 396712.1 65103.7
Cement 3692 269 18709.0 203916.2 8356.3Distilleries 3131 155 181366.8 300043.8 4296.8Fertiliser 3512 241 127900.1 341842.2 13319.3Iron and Steel 3710 271 155932.8 176494.9 149002.9Oil Refineries 3530 232 184440.6 37117.6 2035.3Pesticides 3512 242 147389.2 393931.1 15348.9Pulp and Paper 3411 210 10893.6 7291.3 821.1Sugar 3118 154 155675.7 210267.8 25239.2Total 2804912 2069833 293283
Table 3.9 shows that average abatement cost of pollutants is much higher for SO2 as compared to
NO2 and TSP. The abatement cost is maximum for Basic drugs and Pharmaceutical for
abatement of each ton of SO2, closely followed by Oil refineries sector.
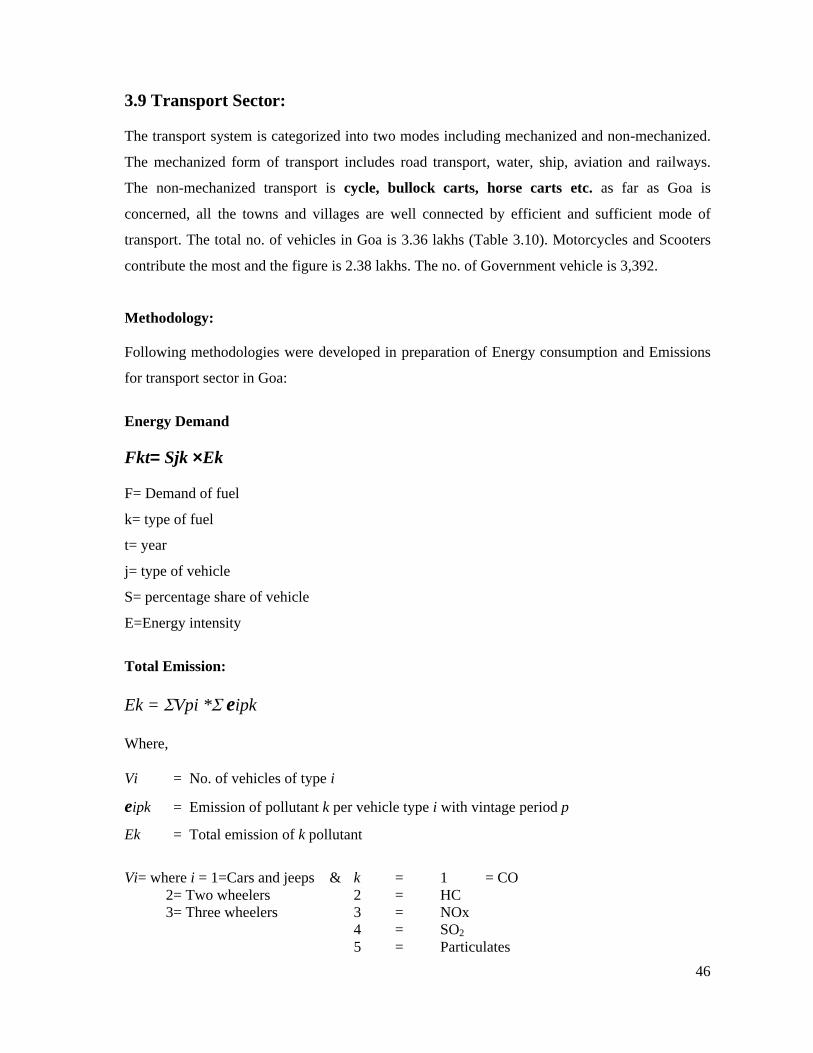
46
3.9 Transport Sector:
The transport system is categorized into two modes including mechanized and non-mechanized.
The mechanized form of transport includes road transport, water, ship, aviation and railways.
The non-mechanized transport is cycle, bullock carts, horse carts etc. as far as Goa is
concerned, all the towns and villages are well connected by efficient and sufficient mode of
transport. The total no. of vehicles in Goa is 3.36 lakhs (Table 3.10). Motorcycles and Scooters
contribute the most and the figure is 2.38 lakhs. The no. of Government vehicle is 3,392.
Methodology:
Following methodologies were developed in preparation of Energy consumption and Emissions
for transport sector in Goa:
Energy Demand
Fkt= Sjk ×Ek
F= Demand of fuel
k= type of fuel
t= year
j= type of vehicle
S= percentage share of vehicle
E=Energy intensity
Total Emission:
Ek = Vpi * eipk
Where,
Vi = No. of vehicles of type i
eipk = Emission of pollutant k per vehicle type i with vintage period p
Ek = Total emission of k pollutant
Vi= where i = 1=Cars and jeeps & k = 1 = CO 2= Two wheelers 2 = HC 3= Three wheelers 3 = NOx 4 = SO2
5 = Particulates
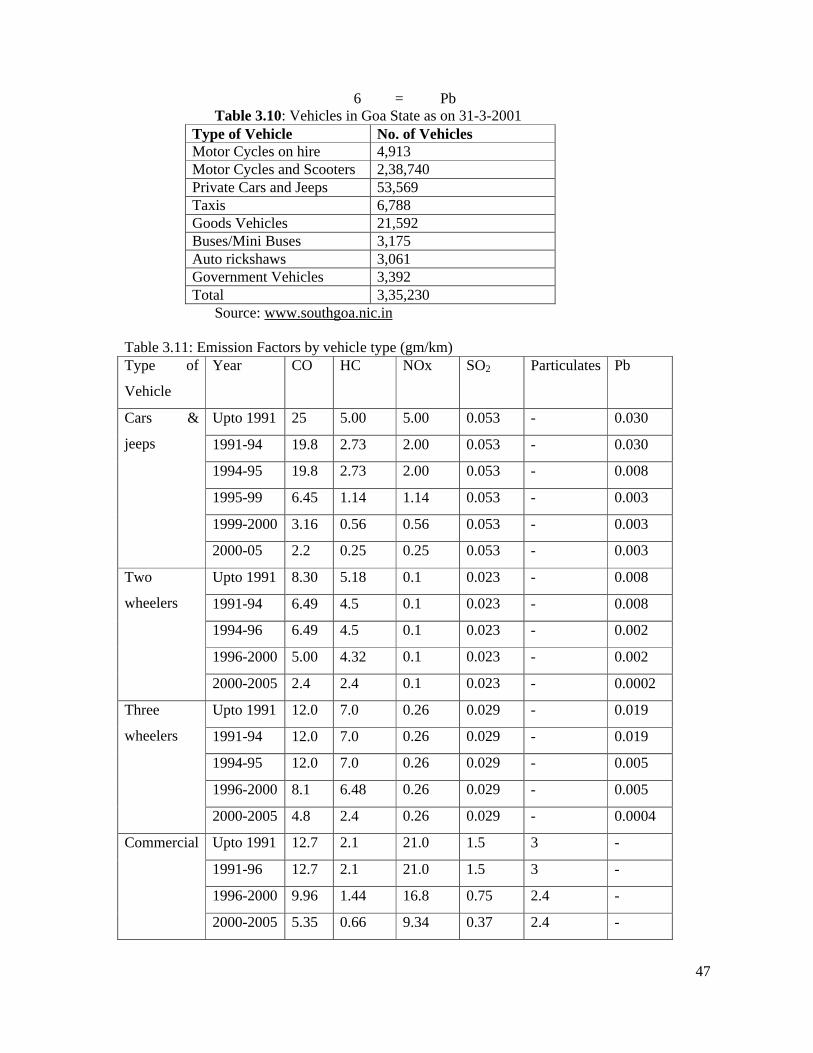
47
6 = PbTable 3.10: Vehicles in Goa State as on 31-3-2001
Type of Vehicle No. of VehiclesMotor Cycles on hire 4,913Motor Cycles and Scooters 2,38,740Private Cars and Jeeps 53,569Taxis 6,788Goods Vehicles 21,592Buses/Mini Buses 3,175Auto rickshaws 3,061Government Vehicles 3,392Total 3,35,230
Source: www.southgoa.nic.in
Table 3.11: Emission Factors by vehicle type (gm/km)Type of
Vehicle
Year CO HC NOx SO2 Particulates Pb
Cars &
jeeps
Upto 1991 25 5.00 5.00 0.053 - 0.030
1991-94 19.8 2.73 2.00 0.053 - 0.030
1994-95 19.8 2.73 2.00 0.053 - 0.008
1995-99 6.45 1.14 1.14 0.053 - 0.003
1999-2000 3.16 0.56 0.56 0.053 - 0.003
2000-05 2.2 0.25 0.25 0.053 - 0.003
Two
wheelers
Upto 1991 8.30 5.18 0.1 0.023 - 0.008
1991-94 6.49 4.5 0.1 0.023 - 0.008
1994-96 6.49 4.5 0.1 0.023 - 0.002
1996-2000 5.00 4.32 0.1 0.023 - 0.002
2000-2005 2.4 2.4 0.1 0.023 - 0.0002
Three
wheelers
Upto 1991 12.0 7.0 0.26 0.029 - 0.019
1991-94 12.0 7.0 0.26 0.029 - 0.019
1994-95 12.0 7.0 0.26 0.029 - 0.005
1996-2000 8.1 6.48 0.26 0.029 - 0.005
2000-2005 4.8 2.4 0.26 0.029 - 0.0004
Commercial Upto 1991 12.7 2.1 21.0 1.5 3 -
1991-96 12.7 2.1 21.0 1.5 3 -
1996-2000 9.96 1.44 16.8 0.75 2.4 -
2000-2005 5.35 0.66 9.34 0.37 2.4 -
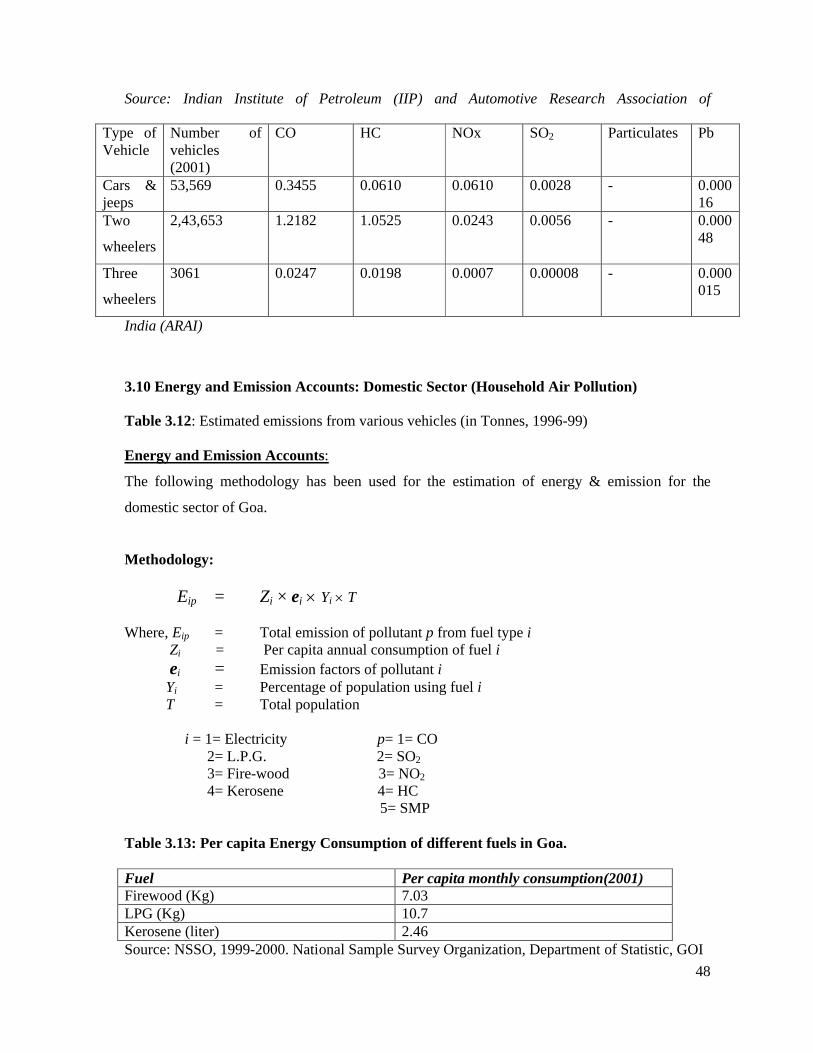
48
Source: Indian Institute of Petroleum (IIP) and Automotive Research Association of
India (ARAI)
3.10 Energy and Emission Accounts: Domestic Sector (Household Air Pollution)
Table 3.12: Estimated emissions from various vehicles (in Tonnes, 1996-99)
Energy and Emission Accounts:
The following methodology has been used for the estimation of energy & emission for the
domestic sector of Goa.
Methodology:
Eip = Zi × ei Yi T
Where, Eip = Total emission of pollutant p from fuel type i Zi = Per capita annual consumption of fuel i ei = Emission factors of pollutant i Yi = Percentage of population using fuel i T = Total population
i = 1= Electricity p= 1= CO 2= L.P.G. 2= SO2
3= Fire-wood 3= NO2
4= Kerosene 4= HC 5= SMP
Table 3.13: Per capita Energy Consumption of different fuels in Goa.
Fuel Per capita monthly consumption(2001)Firewood (Kg) 7.03LPG (Kg) 10.7Kerosene (liter) 2.46Source: NSSO, 1999-2000. National Sample Survey Organization, Department of Statistic, GOI
Type of Vehicle
Number of vehicles (2001)
CO HC NOx SO2 Particulates Pb
Cars & jeeps
53,569 0.3455 0.0610 0.0610 0.0028 - 0.00016
Two
wheelers
2,43,653 1.2182 1.0525 0.0243 0.0056 - 0.00048
Three
wheelers
3061 0.0247 0.0198 0.0007 0.00008 - 0.000015
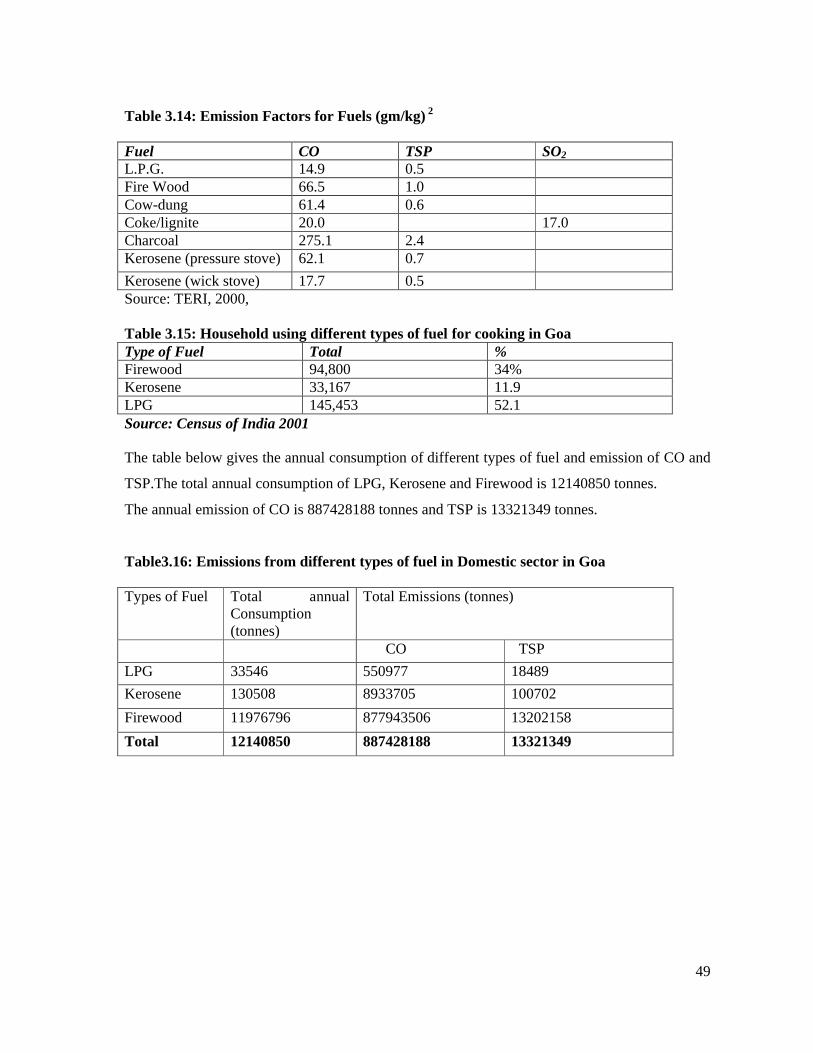
49
Table 3.14: Emission Factors for Fuels (gm/kg) 2
Fuel CO TSP SO2
L.P.G. 14.9 0.5Fire Wood 66.5 1.0Cow-dung 61.4 0.6Coke/lignite 20.0 17.0Charcoal 275.1 2.4Kerosene (pressure stove) 62.1 0.7
Kerosene (wick stove) 17.7 0.5Source: TERI, 2000,
Table 3.15: Household using different types of fuel for cooking in GoaType of Fuel Total % Firewood 94,800 34%Kerosene 33,167 11.9LPG 145,453 52.1Source: Census of India 2001
The table below gives the annual consumption of different types of fuel and emission of CO and
TSP.The total annual consumption of LPG, Kerosene and Firewood is 12140850 tonnes.
The annual emission of CO is 887428188 tonnes and TSP is 13321349 tonnes.
Table3.16: Emissions from different types of fuel in Domestic sector in Goa
Types of Fuel Total annual Consumption (tonnes)
Total Emissions (tonnes)
CO TSP
LPG 33546 550977 18489
Kerosene 130508 8933705 100702
Firewood 11976796 877943506 13202158
Total 12140850 887428188 13321349
50
3.11 WATER POLLUTION IN GOA
Rapid industrialisation, tourism and resource overuse, have had an adverse impact on the
environment of Goa. Industrial effluent, mining, agro chemicals, domestic waste, etc. have
polluted the water. The two main rivers Mandovi and Zuari, which drain 69 per cent of the state
area now harbour on their banks 50 per cent of the population and a large number of industries
leading to the pollution of these rivers. The Tiracol River and the sea in the vicinity are often
found contaminated with the effluent discharges of the iron processing plants.
Different sources of inputs of polluted water into these streams from various sources viz.
industries, municipalities, hotels, open land etc. which drain into it ultimately tends to increase
the level of different parameters such temperature, pH, Conductivity, BOD, COD, Total
Coliform and many other inorganic and organic constituents. Though the effluent water
discharged from Industries, hotels and municipalities may be complying with the set standard of
permissible limit at the point of their discharge (which is evident from the fact that all the 32
polluting units in Goa have 100 percent efficient Effluent Treatment Plant), but where
accumulated in water bodies it may be sufficient enough to harm the aquatic flora and fauna and
even unfit for human use. Goa has 32 water polluting units and all of these units have Effluent
Treatment Plant (ETP) and all the units are with 100% satisfying standards. If we look upon the
data of these two rivers (Mandovi & Zuari) year 2002-2003 as stated by Goa State Pollution
Control Board-Table 4.3(a) & 4.3(b), it is evident that some of the parameters have been
significantly high during some of monitoring period at different stretch of the stream. Total
dissolved solids and concentration of Chloride in both the rivers were found to be above the
prescribed limits in the period April, May, November, and December in the year 2002 and during
January 2003. Which indicates one of the possibilities and aspect of getting accumulation and
thus increasing the level while most of the parameters such as pH, BOD and COD were below
the permissible limit during all monitoring periods in both of the rivers.
Table 3.17 shows the length of river in Goa that is polluted with respect to BOD as an indicator.
According to water quality status with respect to BOD (Annex Table A4.1), river water in Goa is
not severely polluted, although almost 13 km is moderately polluted. Most of the stretch (53 km)
is relatively clean. This shows that the extent of water pollution is not very severe in Goa and
timely intervention can prevent the remaining clean water from getting polluted.
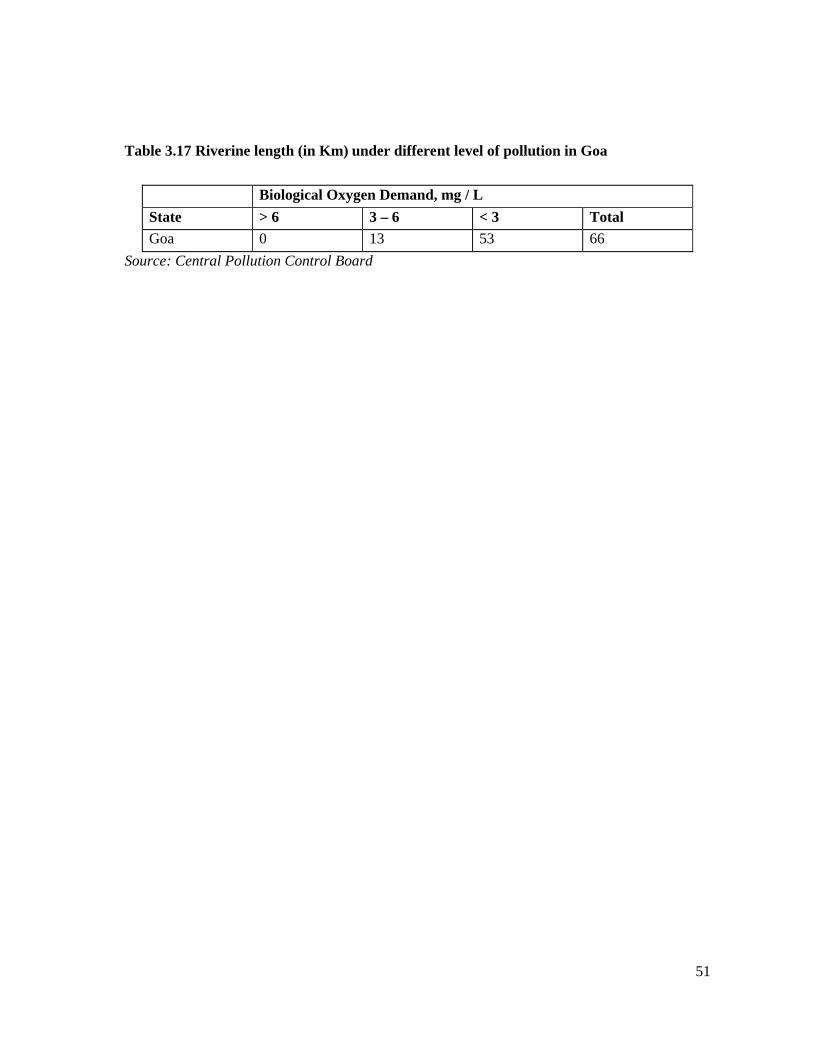
51
Table 3.17 Riverine length (in Km) under different level of pollution in Goa
Biological Oxygen Demand, mg / L
State > 6 3 – 6 < 3 Total
Goa 0 13 53 66
Source: Central Pollution Control Board
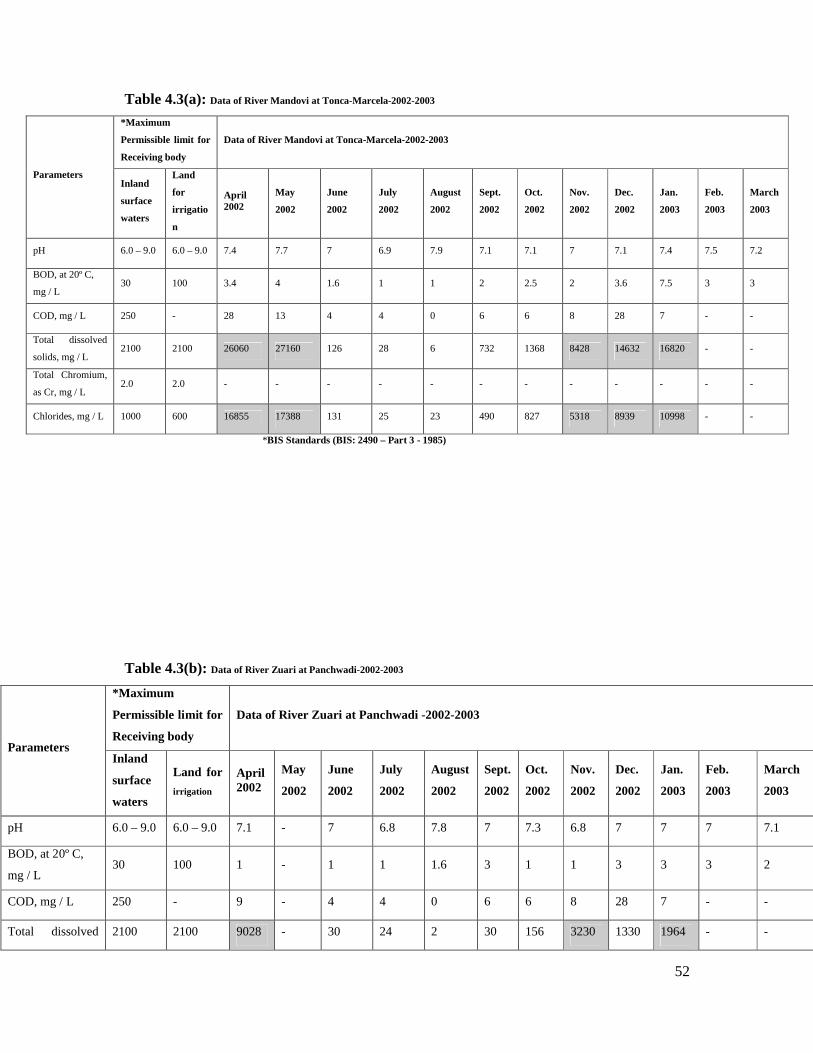
52
Table 4.3(a): Data of River Mandovi at Tonca-Marcela-2002-2003
Parameters
*Maximum
Permissible limit for
Receiving body
Data of River Mandovi at Tonca-Marcela-2002-2003
Inland
surface
waters
Land
for
irrigatio
n
April2002
May
2002
June
2002
July
2002
August
2002
Sept.
2002
Oct.
2002
Nov.
2002
Dec.
2002
Jan.
2003
Feb.
2003
March
2003
pH 6.0 – 9.0 6.0 – 9.0 7.4 7.7 7 6.9 7.9 7.1 7.1 7 7.1 7.4 7.5 7.2
BOD, at 20º C,
mg / L30 100 3.4 4 1.6 1 1 2 2.5 2 3.6 7.5 3 3
COD, mg / L 250 - 28 13 4 4 0 6 6 8 28 7 - -
Total dissolved
solids, mg / L2100 2100 26060 27160 126 28 6 732 1368 8428 14632 16820 - -
Total Chromium,
as Cr, mg / L2.0 2.0 - - - - - - - - - - - -
Chlorides, mg / L 1000 600 16855 17388 131 25 23 490 827 5318 8939 10998 - -
*BIS Standards (BIS: 2490 – Part 3 - 1985)
Table 4.3(b): Data of River Zuari at Panchwadi-2002-2003
Parameters
*Maximum
Permissible limit for
Receiving body
Data of River Zuari at Panchwadi -2002-2003
Inland
surface
waters
Land for
irrigation
April2002
May
2002
June
2002
July
2002
August
2002
Sept.
2002
Oct.
2002
Nov.
2002
Dec.
2002
Jan.
2003
Feb.
2003
March
2003
pH 6.0 – 9.0 6.0 – 9.0 7.1 - 7 6.8 7.8 7 7.3 6.8 7 7 7 7.1
BOD, at 20º C,
mg / L30 100 1 - 1 1 1.6 3 1 1 3 3 3 2
COD, mg / L 250 - 9 - 4 4 0 6 6 8 28 7 - -
Total dissolved 2100 2100 9028 - 30 24 2 30 156 3230 1330 1964 - -
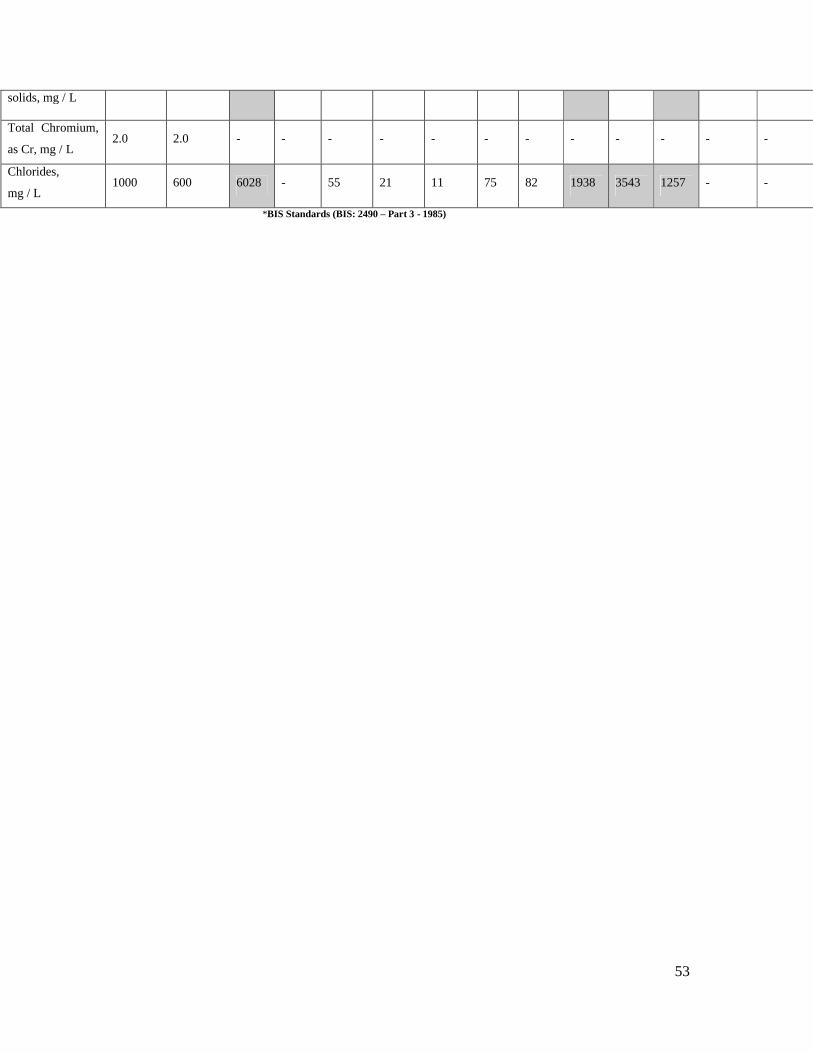
53
solids, mg / L
Total Chromium,
as Cr, mg / L2.0 2.0 - - - - - - - - - - - -
Chlorides,
mg / L1000 600 6028 - 55 21 11 75 82 1938 3543 1257 - -
*BIS Standards (BIS: 2490 – Part 3 - 1985)
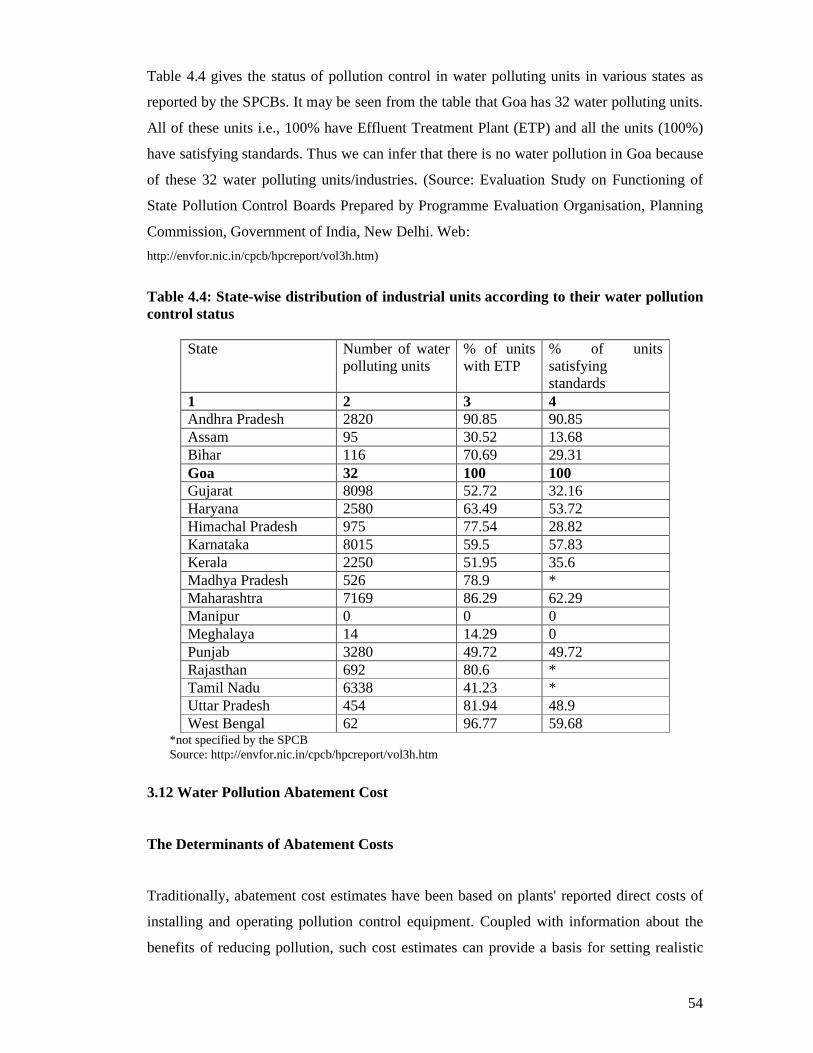
54
Table 4.4 gives the status of pollution control in water polluting units in various states as
reported by the SPCBs. It may be seen from the table that Goa has 32 water polluting units.
All of these units i.e., 100% have Effluent Treatment Plant (ETP) and all the units (100%)
have satisfying standards. Thus we can infer that there is no water pollution in Goa because
of these 32 water polluting units/industries. (Source: Evaluation Study on Functioning of
State Pollution Control Boards Prepared by Programme Evaluation Organisation, Planning
Commission, Government of India, New Delhi. Web:
http://envfor.nic.in/cpcb/hpcreport/vol3h.htm)
Table 4.4: State-wise distribution of industrial units according to their water pollution control status
State Number of water polluting units
% of units with ETP
% of units satisfying standards
1 2 3 4Andhra Pradesh 2820 90.85 90.85Assam 95 30.52 13.68Bihar 116 70.69 29.31Goa 32 100 100Gujarat 8098 52.72 32.16Haryana 2580 63.49 53.72Himachal Pradesh 975 77.54 28.82Karnataka 8015 59.5 57.83Kerala 2250 51.95 35.6Madhya Pradesh 526 78.9 *Maharashtra 7169 86.29 62.29Manipur 0 0 0Meghalaya 14 14.29 0Punjab 3280 49.72 49.72Rajasthan 692 80.6 *Tamil Nadu 6338 41.23 *Uttar Pradesh 454 81.94 48.9West Bengal 62 96.77 59.68
*not specified by the SPCBSource: http://envfor.nic.in/cpcb/hpcreport/vol3h.htm
3.12 Water Pollution Abatement Cost
The Determinants of Abatement Costs
Traditionally, abatement cost estimates have been based on plants' reported direct costs of
installing and operating pollution control equipment. Coupled with information about the
benefits of reducing pollution, such cost estimates can provide a basis for setting realistic
55
regulatory standards. Until recently, the scarcity of appropriate plant-level data has
prevented detailed empirical studies of average and marginal abatement costs by pollutant.
Firms can adjust to the threat of higher pollution-related costs along many dimensions,
including new process technology, pollution control equipment, improved efficiency, and
allocation of more resources to legal representation or negotiation. At the plant level, all
these options will register as changes in the scale and mix of inputs and, consequently, total
production costs. In this study, we focus on direct abatement costs.
3.13 The Direct Abatement Cost Function
Industrial facilities can abate pollution by scaling back polluting activities or by diverting
resources to cleanup. In either case, pollution reduction will entail costs. Conceptually,
abatement cost functions are dual to abatement functions which relate inputs of capital,
labor, energy and materials to pollution reduction. Abatement processes frequently reduce
more than one air or water pollutant, so joint cost function estimation is appropriate. For
example, Biological Oxygen Demand (BOD), Chemical Oxygen Demand (COD), and
Suspended Solids (SS) can all be reduced by treatment in common facilities. These joint
equipment requirements are associated with common use of skilled and unskilled labor,
energy and materials.
Cost Function Specification
For k pollutants, the environmental engineering literature suggests that an appropriate joint
cost function for plant i should include the following variables:
Ci = f ( Wi, Ei / Ii, Mj, Xi)
Where
Cj: Total annual cost of abatement for the plant
Wj: Total annual wastewater volume
Ei, /I: Vector of effluent/influent ratios for n pollutants, which can be interpreted either as
concentration ratios or volume ratios (since waste water volume is constant across influent
and effluent for each plant, it cancels out of the concentration ratio).
Mj: Vector of input prices at location j
Xi: Vector of relevant plant characteristics (sector, age, ownership, productive, efficiency,
etc.)
56
However, due to lack of appropriate data we are not able to calculate the total annual cost of
abatement for the plant.
3.14 Summary
Goa has total of 506 factories, which forms 0.4% of total factories in India and employing
20,740 people. The total expenditure on fuels in Goa in the year 2002-03 was Rs.40843
lakhs. The focus is on seventeen “high polluting” industrial sectors as identified by the
Central Pollution Control Board (CPCB) for implementation of pollution control programs.
The results from IPPS have been used in various countries where insufficient data on
industrial pollution proved to be an impediment to setting up pollution control strategies and
prioritization of activities. Value of output for ten polluting industrial sectors of Goa is Rs.
65,70,340 (thousands). The pollution load of SO2 is found to be highest amongst the three
air pollutants with iron & steel industry contributing the most SO2 pollution load i.e., 97579
tonnes/yr. The abatement cost is Rs.1734548 (thousands), maximum for Basic drugs and
Pharmaceutical for abatement of each ton of SO2.
57
Forest Resource Accounting Goa
4.1 INTRODUCTION
The major objective of the chapter is “To develop a framework for economic and
environmental resource accounting of Forest in the states of Goa (physical and monetary
terms) “. In carrying forward this key objective the report has sought to Study the Forest
resource accounting for state of Goa in India using the Satellite System of Integrated
Environmental and Economic Accounting framework (SEEA). In this study only the forest
trees in the natural forests are considered and hence, the forest resources are treated as non-
produced assets and no distinction is made between economic and environmental assets.
The state is one of the few states in India having 58.24% of the geographical area as forest
including mangroves with high eco-tourism value. Of the total geographic area of 3702
km2; the area under forest is 2,156 km2. Out of the total forest area 1255 km2 is moderately
dense forest and 901 km2 is open forest. The state has five different types of forests.
Forests contribute to the economy in several ways. While forests are a source of timber with
market values, they also influence local and regional climate, preserve soil cover on site,
and in the case of watersheds, protect soil downstream from floods – functions, which are
not in the production boundary of SNA. Further, the net value added in forestry sector does
not reflect sustainability of forest resources, because it ignores the consumption of natural
capital (depletion) that occurs when forests are harvested or converted to other uses. The
only costs of depletion considered in the national accounts are the extraction costs and
records the potential loss in forest wealth as other changes in assets that have no effect on
Gross Domestic Product (GDP).
4.1.1 SCOPE AND OBJECTIVES
The report deals with economic and environmental accounting of forests, by and large in
accordance with the UN System of Economic and Environmental Accounting, (SEEA
2003). It provides a methodological framework to construct asset accounts and flow
accounts of goods and services from the forests. Consequently the analytical study has
endeavoured to generate primary level data regarding values of household consumption of
goods and services provided by forests and land in the study area, especially those which
4
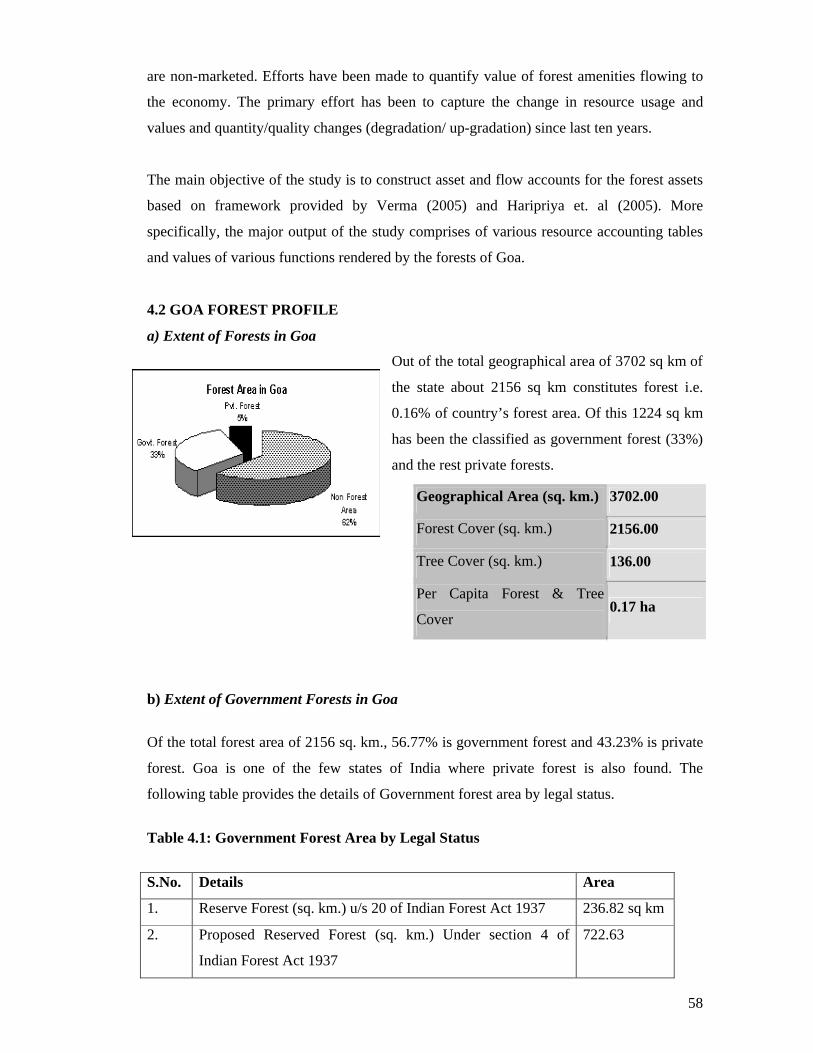
58
are non-marketed. Efforts have been made to quantify value of forest amenities flowing to
the economy. The primary effort has been to capture the change in resource usage and
values and quantity/quality changes (degradation/ up-gradation) since last ten years.
The main objective of the study is to construct asset and flow accounts for the forest assets
based on framework provided by Verma (2005) and Haripriya et. al (2005). More
specifically, the major output of the study comprises of various resource accounting tables
and values of various functions rendered by the forests of Goa.
4.2 GOA FOREST PROFILE
a) Extent of Forests in Goa
Out of the total geographical area of 3702 sq km of
the state about 2156 sq km constitutes forest i.e.
0.16% of country’s forest area. Of this 1224 sq km
has been the classified as government forest (33%)
and the rest private forests.
b) Extent of Government Forests in Goa
Of the total forest area of 2156 sq. km., 56.77% is government forest and 43.23% is private
forest. Goa is one of the few states of India where private forest is also found. The
following table provides the details of Government forest area by legal status.
Table 4.1: Government Forest Area by Legal Status
S.No. Details Area
1. Reserve Forest (sq. km.) u/s 20 of Indian Forest Act 1937 236.82 sq km
2. Proposed Reserved Forest (sq. km.) Under section 4 of
Indian Forest Act 1937
722.63
Geographical Area (sq. km.) 3702.00
Forest Cover (sq. km.) 2156.00
Tree Cover (sq. km.) 136.00
Per Capita Forest & Tree
Cover0.17 ha
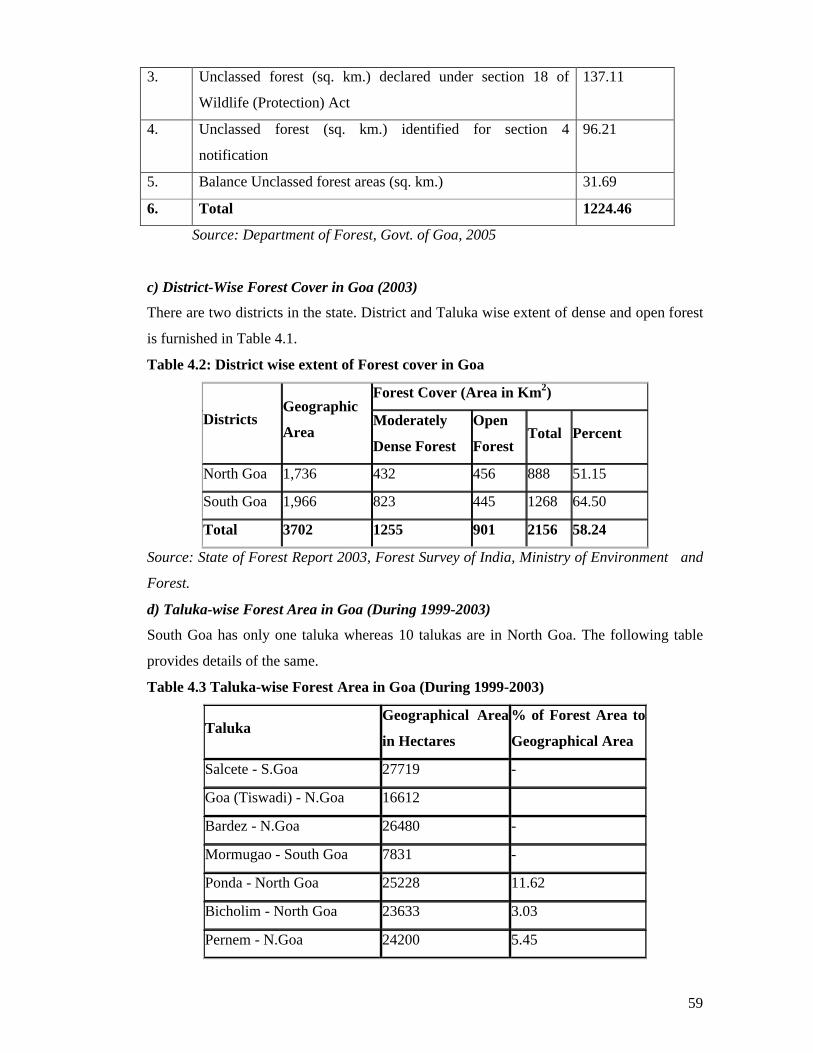
59
3. Unclassed forest (sq. km.) declared under section 18 of
Wildlife (Protection) Act
137.11
4. Unclassed forest (sq. km.) identified for section 4
notification
96.21
5. Balance Unclassed forest areas (sq. km.) 31.69
6. Total 1224.46
Source: Department of Forest, Govt. of Goa, 2005
c) District-Wise Forest Cover in Goa (2003)
There are two districts in the state. District and Taluka wise extent of dense and open forest
is furnished in Table 4.1.
Table 4.2: District wise extent of Forest cover in Goa
DistrictsGeographic
Area
Forest Cover (Area in Km2)
Moderately
Dense Forest
Open
ForestTotal Percent
North Goa 1,736 432 456 888 51.15
South Goa 1,966 823 445 1268 64.50
Total 3702 1255 901 2156 58.24
Source: State of Forest Report 2003, Forest Survey of India, Ministry of Environment and
Forest.
d) Taluka-wise Forest Area in Goa (During 1999-2003)
South Goa has only one taluka whereas 10 talukas are in North Goa. The following table
provides details of the same.
Table 4.3 Taluka-wise Forest Area in Goa (During 1999-2003)
TalukaGeographical Area
in Hectares
% of Forest Area to
Geographical Area
Salcete - S.Goa 27719 -
Goa (Tiswadi) - N.Goa 16612
Bardez - N.Goa 26480 -
Mormugao - South Goa 7831 -
Ponda - North Goa 25228 11.62
Bicholim - North Goa 23633 3.03
Pernem - N.Goa 24200 5.45
60
Quepem - S.Goa 43731 33.63
Sanguem - S.Goa 88660 56.48
Canacona - S.Goa 34736 41.25
Satari - N.Goa 51248 47.29
Source: Department of Forest, Govt. of Goa, 2005
e) Types of forests found in GOA
The forests of Goa are typical of the Western Ghats forest (Southern Maharashtra and
Karnataka). There is diversity in the forests due to the variation in altitude, aspect, soil
characters, slope etc. As per Champion and Seth (1968) Classification of Forest types of
India, the forests of Goa fall in the following types:-
Estuarine vegetation consisting of mangrove species along narrow muddy banks of
rivers
Strand vegetation along the coastal belts
Plateau vegetation confined especially to the low altitude
Open scrub jungle
Moist mixed deciduous forests
Secondary moist mixed deciduous Forest
Sub-tropical Hill forests.
Semi-evergreen and evergreen forest limited to patches along the high altitude
Lateritic Semi-evergreen forests
Evergreen forests
f) Biodiversity of Goa Forest
The flora and fauna of Goa is considerably rich in biodiversity. 33% of the geographic area
is under government forests of which about 62% has been brought under Protected Areas
(PA) of Wildlife Sanctuaries and National Park – is owned by the Government and is
located in the interior eastern regions of the state. The Western Ghats, which form most of
eastern Goa, have been internationally recognised as one of the biodiversity hotspots of the
world. The flora and fauna of Goa is so incredible that in the February 1999 issue of
National Geographic Magazine, Goa was compared with the Amazon and Congo basins for
its rich tropical biodiversity.
The rich flora of Goa comprise of bamboo canes, chillar barks, maratha barks, bhirand.
Coconut trees are ubiquitous and are present in almost all areas of Goa barring the elevated
61
regions. Most of the forest products come from coconut trees. The flora and fauna of Goa
include deciduous vegetation like teak, sal, and cashew. Fruits include jackfruits, mangos,
pineapples and blackberries. Since there is a substantial area under private forests and a
large tract under cashew, mango, coconut, etc. plantations, the total forest and tree cover
constitutes 56.6% of the geographic area.
Among the fauna foxes, wild boars and migratory birds are found in the jungles of Goa.
Numerous types of fish are also caught off the coast of Goa and in its rivers. Crabs, lobsters,
shrimps, jellyfish, oysters and catfish form some of the piscine catch. Goa also has a high
snake population, which keeps the rodent population in control. The avifauna includes
kingfishers, mynas and parrots. The Salim Ali Bird sanctuary, one of the best-known bird
sanctuaries in India, is located on the island of Chorao. Other wildlife sanctuaries include
the Bondla Wildlife Sanctuary, Molem Wildlife Sanctuary, Cotigao Wildlife Sanctuary,
Madei Wildlife Sanctuary, Netravali Wildlife Sanctuary and Mahaveer Wildlife Sanctuary.
g) Mangroves in Goa
(i) Uses of Mangroves
Mangroves provide a vide range of services and benefits to the mankind. Ecological and
economical values of mangroves are recognized world over. They are instrumental in
providing ecological and livelihood security to coastal regions and people. People in Goa
are making use of mangroves by protecting them as a nursery ground for various fish and
crab species, which form a part of their daily food. Good use of mangrove areas is also
being made for eco-tourism and tourists from India and abroad is taken to these areas for a
pleasant trip and crocodile watching. Felled dried branches of mangroves are also collected
at a very limited scale for firewood purpose. However, no beehives have been reported and
these areas are not being used for that purpose. Besides, all the river banks are protected by
thick mangrove cover. The general services provided by the mangroves are as follows -
1. Prevention from soil erosion and stabilization of coasts and beaches
2. Protection of land from tidal surges and cyclonic storms.
3. Aqua culture.
4. Provides fuel wood, green manure, charcoal, timber, etc
5. Used for boat / canoe making
6. Provides tannin.
62
7. Used for thatching material, cordage and rope material
8. Used for art and craft, bow making
9. Used as food and beverage
10. Widely used for medicinal purposes.
11. Useful for bee hives and provides wax and honey.
12. Useful for recreational purpose as eco-tourism
13. Provides an excellent home to birds and animals.
(ii) Distribution of species
Goa has one of the best mangrove forests on the west coast houses 14 tree species found on
the west coast with few trees species introduced few trees species. As per census by COE
(1983), 60 exclusive species of 16 families and 23 non-exclusive species were recorded.
UNESCO (1986) confirmed 65 species of true mangroves all over the world while
Tomlison (1986) agreed to only 48 mangrove species and Saenger et al (1983) reported 60
species, which are recognized as true mangroves in the list of IUCN. 44 species have been
documented in Asia, out of which, 32 are found in India, 13 species on the west coast and
23 species on the east coast. Andaman & Nicobar is quite rich in number of species having
about 27 numbers of species.
The species found includes Rhizophora mucronata, R. apiculata, Avicennia officinalis, A.
marina, A. alba, Kandelia candel, Ceriops tagal, Sonneratia alba, S. caseolaris, Bruguiera
gymnorrhiza, B. cylindrica, Aegiceras corniculatum, Excoecaria agallocha, Acanthus
illicifolius and Xylocarpus spp. Almost all species are found in all the river estuaries.
Kandelia, a rare species on the west coast, is found in plenty in Mandovi, Mapusa and Zuari
rivers. However, Avicennia species is dominant in most of the places with high salinity and
Sonneratia species is dominant in low salinity areas. Chorao Island in Mandovi river is one
of the best mangrove forests and houses most of the species found in Goa.
(iii) Mangroves—tsunami protection and key fish nursery
Mangrove forests—found in silt-rich, saline habitats worldwide, generally along large river
deltas, estuaries, and coastal areas—are equally important ecosystems. These forests are
critical spawning grounds and nurseries for marine and freshwater species, and also help
prevent and reduce coastal erosion and storm damage, as seen in the aftermath of the 2004
tsunami in south-east Asia.
63
A study released in October 2005 showed that areas buffered by coastal forests, like
mangroves, were less damaged by the 2004 tsunami than areas without tree vegetation. The
study confirmed earlier experiments, which have shown that 30 trees per 100 square meters
may reduce the maximum flow of a tsunami by more than 90 percent. The report mentions
that the Mangroves dissipate the energy and size of waves as a result of the drag forces
exerted by their multiple roots and stems. Wave energy may be reduced by 75 per cent in
the waves passage through 200 meters of mangrove.
The value of ecosystem services afforded by mangrove forests is estimated at over
US$100,000 per square kilometer in American Samoa and US$3.5 million per square
kilometer in Thailand. In Matang, Malaysia, a 400 square kilometer managed mangrove
forest supports fishery worth US$100 million a year. The Matang mangroves also generate
further income providing forestry products worth US$10 million a year finds the report.
(iv) Ecotourism through Mangroves
All the twelve major species of mangroves found in Goa along with three important
associates have been banned for felling by a notification issued by the Department under
Goa, Daman & Diu Preservation of Trees Act, 1984. Forest Department has been declared
as Nodal Agency for any activity related to mangroves. All proposals related to mangroves
are to be routed through the department for better control. Excellent mangrove area of
Chorao has been declared as Dr. Salim Ali Bird Sanctuary, which has not only helped in
protection of area but has also become a potential eco-tourism spot. Extensive protection
works have also been taken up in the region. Besides a Mangrove Interpretation Centre has
been created at Chorao, where people can see different species all around. Details of various
mangrove species are depicted by way of drawing & text, which is placed at the Mangrove
Interpretation Centre and currently Eco-tourism to mangrove areas, is also being promoted.
h) Growing Stock
As per SFR 2003, the overall growing stock in the forests is 11.771 m. cum. 5.102 m.cum.
in the forest area & 6.669 m.cum. in TOF. Forest type wise details of the same are as
follows.
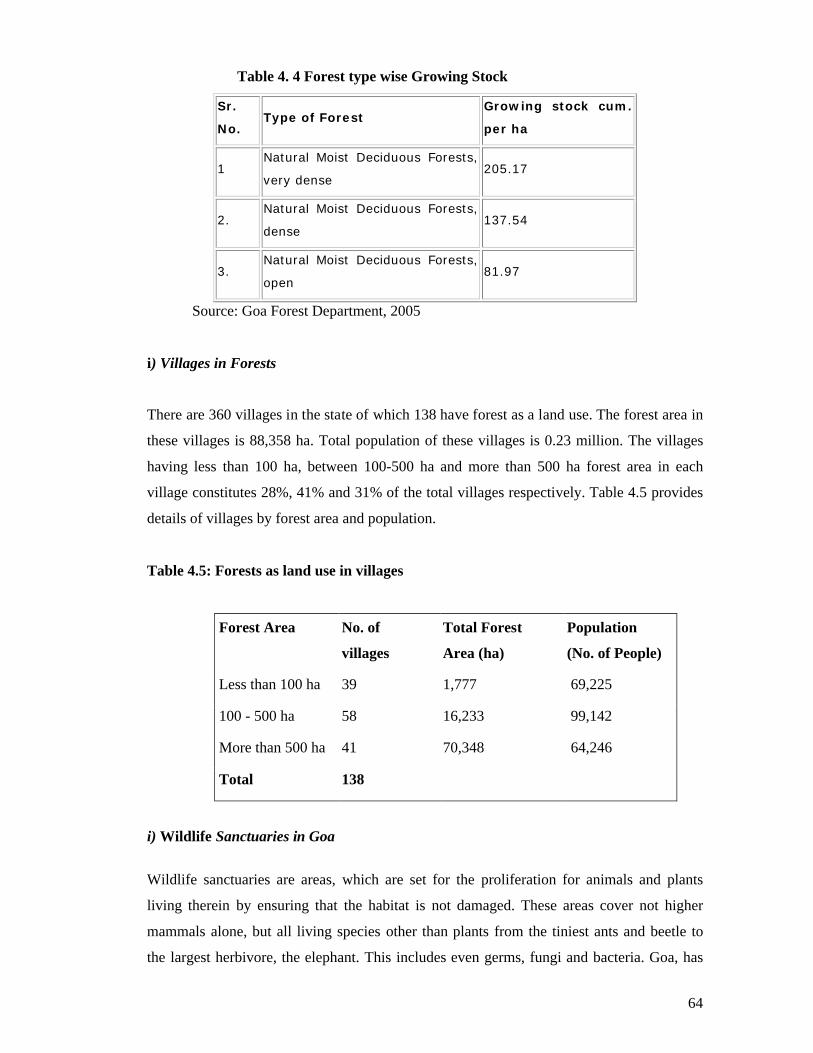
64
Table 4. 4 Forest type wise Growing Stock
Sr.
No.Type of Forest
Growing stock cum.
per ha
1Natural Moist Deciduous Forests,
very dense 205.17
2.Natural Moist Deciduous Forests,
dense 137.54
3.Natural Moist Deciduous Forests,
open 81.97
Source: Goa Forest Department, 2005
i) Villages in Forests
There are 360 villages in the state of which 138 have forest as a land use. The forest area in
these villages is 88,358 ha. Total population of these villages is 0.23 million. The villages
having less than 100 ha, between 100-500 ha and more than 500 ha forest area in each
village constitutes 28%, 41% and 31% of the total villages respectively. Table 4.5 provides
details of villages by forest area and population.
Table 4.5: Forests as land use in villages
Forest Area No. of
villages
Total Forest
Area (ha)
Population
(No. of People)
Less than 100 ha 39 1,777 69,225
100 - 500 ha 58 16,233 99,142
More than 500 ha 41 70,348 64,246
Total 138
i) Wildlife Sanctuaries in Goa
Wildlife sanctuaries are areas, which are set for the proliferation for animals and plants
living therein by ensuring that the habitat is not damaged. These areas cover not higher
mammals alone, but all living species other than plants from the tiniest ants and beetle to
the largest herbivore, the elephant. This includes even germs, fungi and bacteria. Goa, has
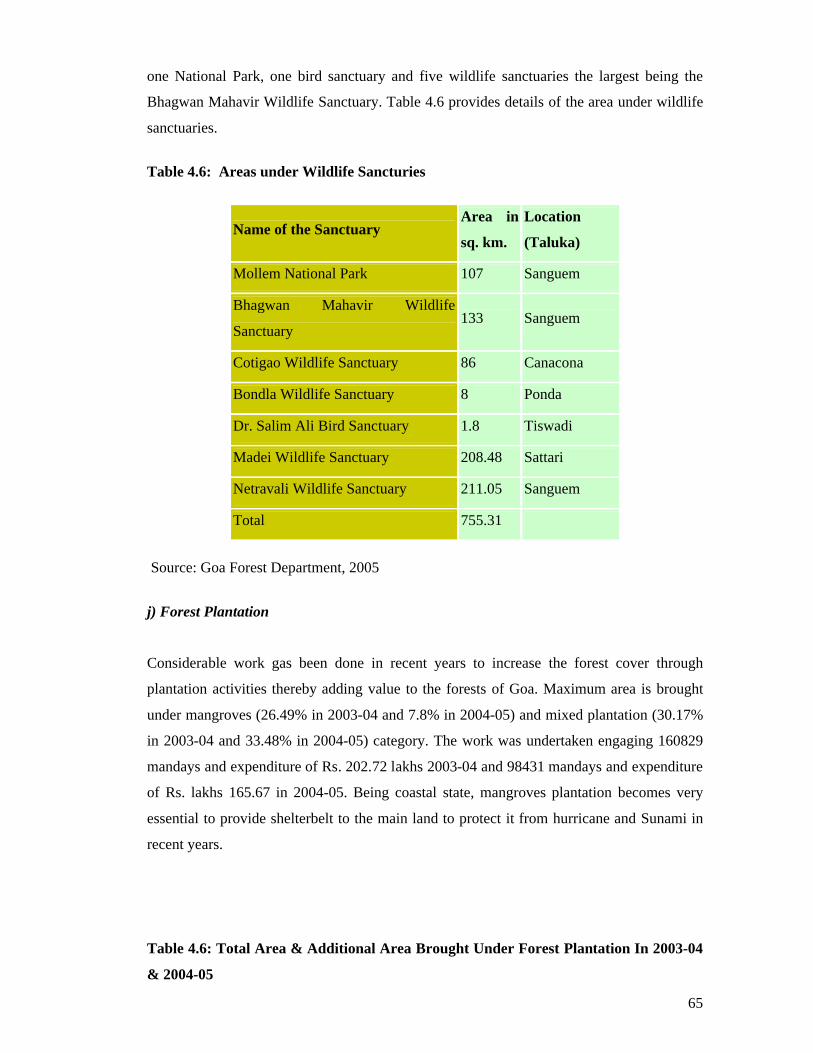
65
one National Park, one bird sanctuary and five wildlife sanctuaries the largest being the
Bhagwan Mahavir Wildlife Sanctuary. Table 4.6 provides details of the area under wildlife
sanctuaries.
Table 4.6: Areas under Wildlife Sancturies
Name of the SanctuaryArea in
sq. km.
Location
(Taluka)
Mollem National Park 107 Sanguem
Bhagwan Mahavir Wildlife
Sanctuary133 Sanguem
Cotigao Wildlife Sanctuary 86 Canacona
Bondla Wildlife Sanctuary 8 Ponda
Dr. Salim Ali Bird Sanctuary 1.8 Tiswadi
Madei Wildlife Sanctuary 208.48 Sattari
Netravali Wildlife Sanctuary 211.05 Sanguem
Total 755.31
Source: Goa Forest Department, 2005
j) Forest Plantation
Considerable work gas been done in recent years to increase the forest cover through
plantation activities thereby adding value to the forests of Goa. Maximum area is brought
under mangroves (26.49% in 2003-04 and 7.8% in 2004-05) and mixed plantation (30.17%
in 2003-04 and 33.48% in 2004-05) category. The work was undertaken engaging 160829
mandays and expenditure of Rs. 202.72 lakhs 2003-04 and 98431 mandays and expenditure
of Rs. lakhs 165.67 in 2004-05. Being coastal state, mangroves plantation becomes very
essential to provide shelterbelt to the main land to protect it from hurricane and Sunami in
recent years.
Table 4.6: Total Area & Additional Area Brought Under Forest Plantation In 2003-04
& 2004-05
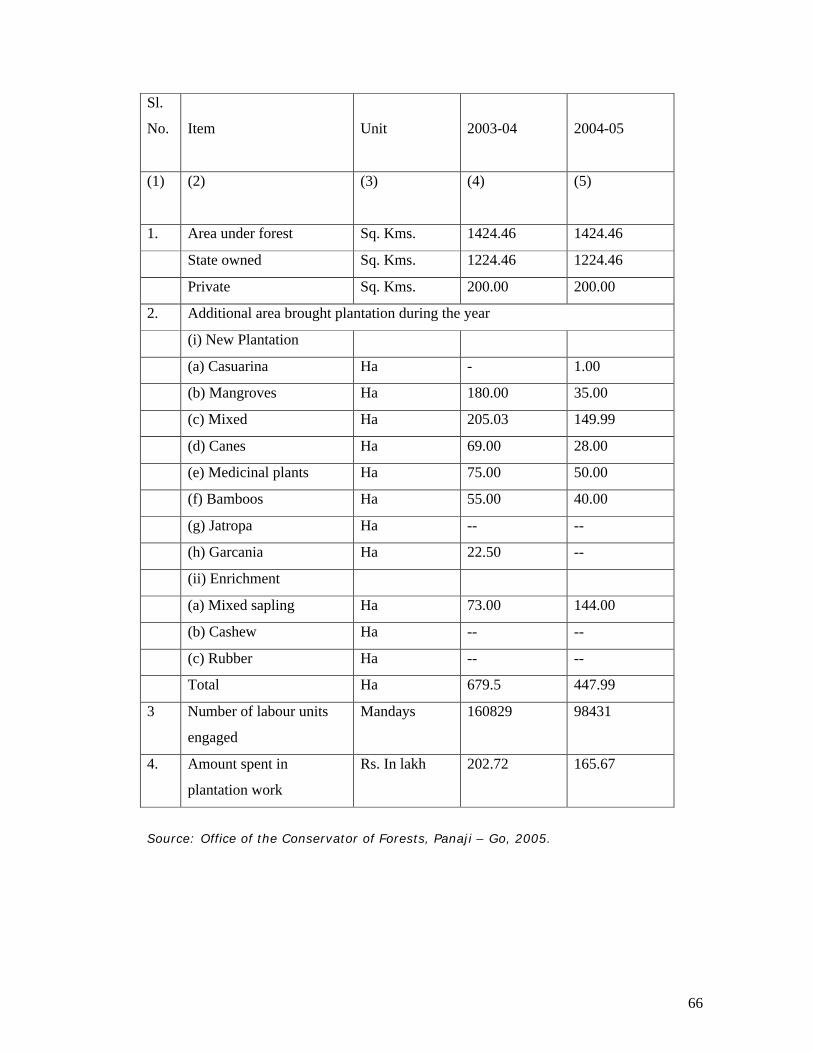
66
Sl.
No. Item Unit 2003-04 2004-05
(1) (2) (3) (4) (5)
1. Area under forest Sq. Kms. 1424.46 1424.46
State owned Sq. Kms. 1224.46 1224.46
Private Sq. Kms. 200.00 200.00
2. Additional area brought plantation during the year
(i) New Plantation
(a) Casuarina Ha - 1.00
(b) Mangroves Ha 180.00 35.00
(c) Mixed Ha 205.03 149.99
(d) Canes Ha 69.00 28.00
(e) Medicinal plants Ha 75.00 50.00
(f) Bamboos Ha 55.00 40.00
(g) Jatropa Ha -- --
(h) Garcania Ha 22.50 --
(ii) Enrichment
(a) Mixed sapling Ha 73.00 144.00
(b) Cashew Ha -- --
(c) Rubber Ha -- --
Total Ha 679.5 447.99
3 Number of labour units
engaged
Mandays 160829 98431
4. Amount spent in
plantation work
Rs. In lakh 202.72 165.67
Source: Office of the Conservator of Forests, Panaji – Go, 2005.
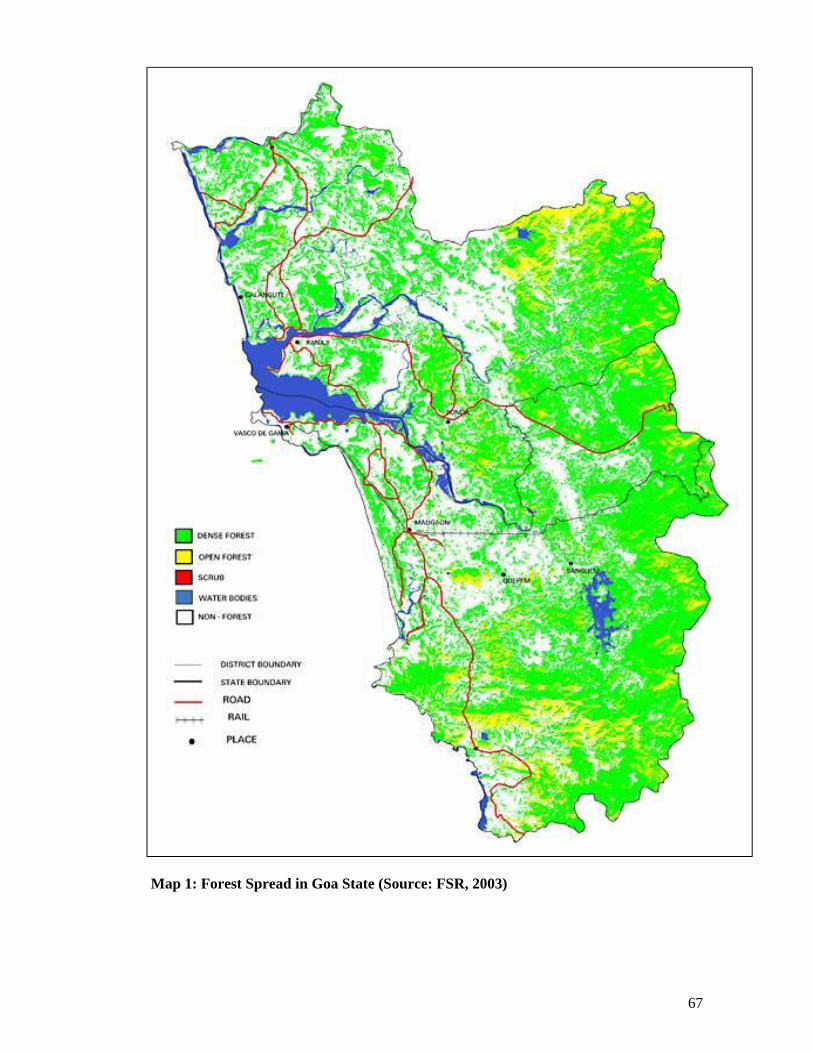
67
Map 1: Forest Spread in Goa State (Source: FSR, 2003)
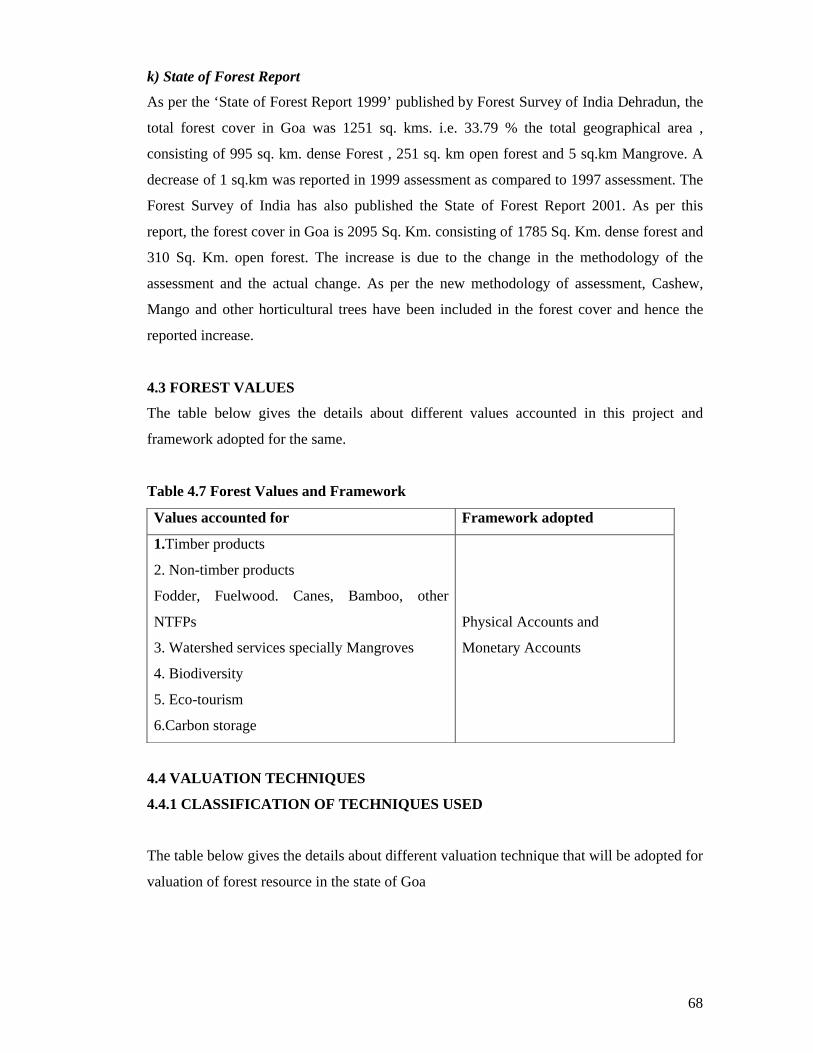
68
k) State of Forest Report
As per the ‘State of Forest Report 1999’ published by Forest Survey of India Dehradun, the
total forest cover in Goa was 1251 sq. kms. i.e. 33.79 % the total geographical area ,
consisting of 995 sq. km. dense Forest , 251 sq. km open forest and 5 sq.km Mangrove. A
decrease of 1 sq.km was reported in 1999 assessment as compared to 1997 assessment. The
Forest Survey of India has also published the State of Forest Report 2001. As per this
report, the forest cover in Goa is 2095 Sq. Km. consisting of 1785 Sq. Km. dense forest and
310 Sq. Km. open forest. The increase is due to the change in the methodology of the
assessment and the actual change. As per the new methodology of assessment, Cashew,
Mango and other horticultural trees have been included in the forest cover and hence the
reported increase.
4.3 FOREST VALUES
The table below gives the details about different values accounted in this project and
framework adopted for the same.
Table 4.7 Forest Values and Framework
Values accounted for Framework adopted
1.Timber products
2. Non-timber products
Fodder, Fuelwood. Canes, Bamboo, other
NTFPs
3. Watershed services specially Mangroves
4. Biodiversity
5. Eco-tourism
6.Carbon storage
Physical Accounts and
Monetary Accounts
4.4 VALUATION TECHNIQUES
4.4.1 CLASSIFICATION OF TECHNIQUES USED
The table below gives the details about different valuation technique that will be adopted for
valuation of forest resource in the state of Goa
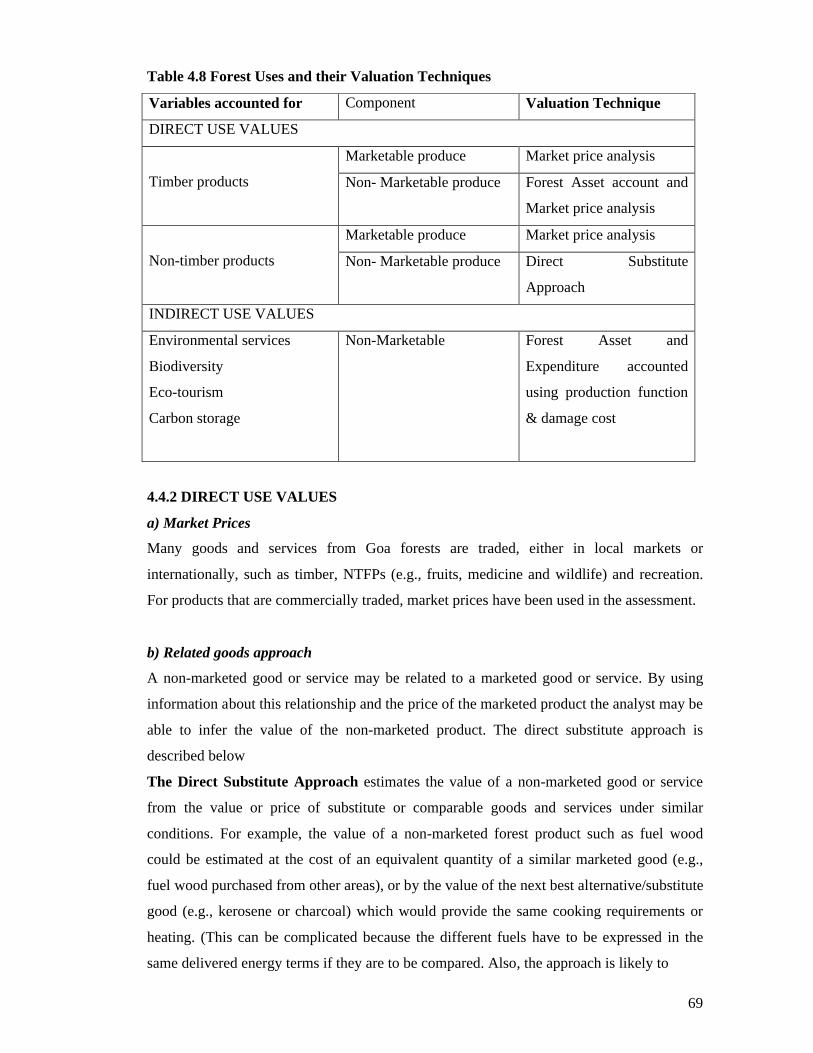
69
Table 4.8 Forest Uses and their Valuation Techniques
Variables accounted for Component Valuation Technique
DIRECT USE VALUES
Timber products
Marketable produce Market price analysis
Non- Marketable produce Forest Asset account and
Market price analysis
Non-timber products
Marketable produce Market price analysis
Non- Marketable produce Direct Substitute
Approach
INDIRECT USE VALUES
Environmental services
Biodiversity
Eco-tourism
Carbon storage
Non-Marketable Forest Asset and
Expenditure accounted
using production function
& damage cost
4.4.2 DIRECT USE VALUES
a) Market Prices
Many goods and services from Goa forests are traded, either in local markets or
internationally, such as timber, NTFPs (e.g., fruits, medicine and wildlife) and recreation.
For products that are commercially traded, market prices have been used in the assessment.
b) Related goods approach
A non-marketed good or service may be related to a marketed good or service. By using
information about this relationship and the price of the marketed product the analyst may be
able to infer the value of the non-marketed product. The direct substitute approach is
described below
The Direct Substitute Approach estimates the value of a non-marketed good or service
from the value or price of substitute or comparable goods and services under similar
conditions. For example, the value of a non-marketed forest product such as fuel wood
could be estimated at the cost of an equivalent quantity of a similar marketed good (e.g.,
fuel wood purchased from other areas), or by the value of the next best alternative/substitute
good (e.g., kerosene or charcoal) which would provide the same cooking requirements or
heating. (This can be complicated because the different fuels have to be expressed in the
same delivered energy terms if they are to be compared. Also, the approach is likely to
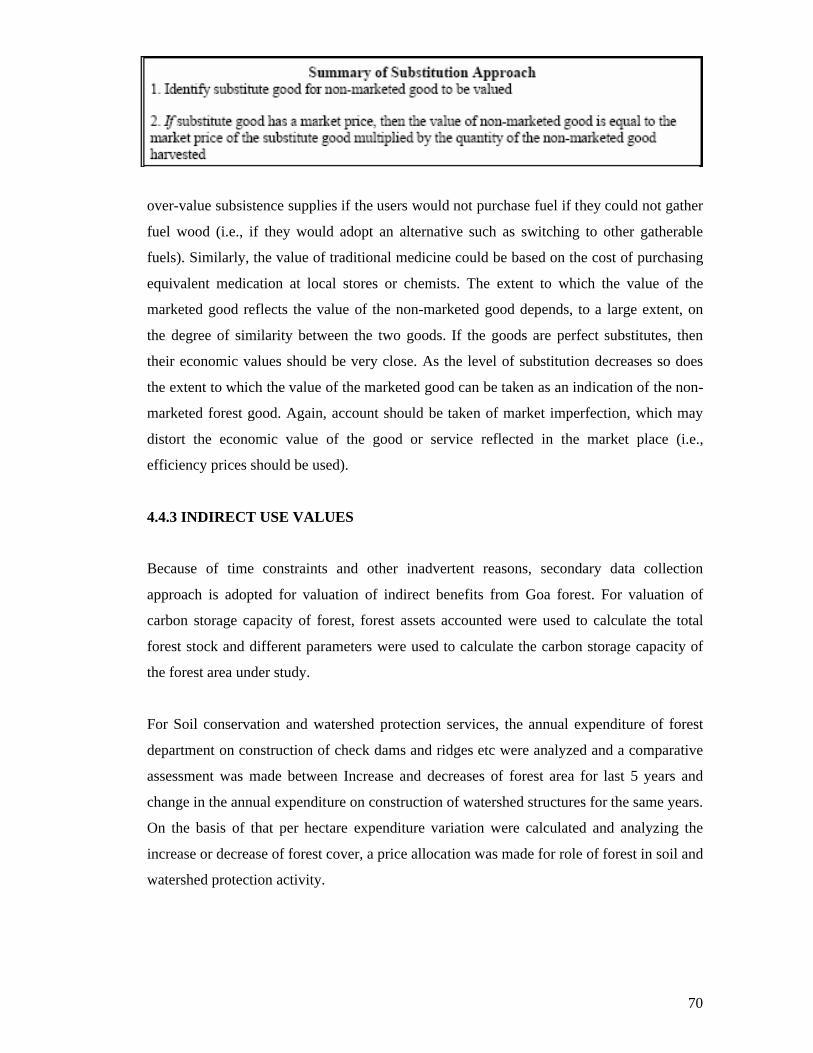
70
over-value subsistence supplies if the users would not purchase fuel if they could not gather
fuel wood (i.e., if they would adopt an alternative such as switching to other gatherable
fuels). Similarly, the value of traditional medicine could be based on the cost of purchasing
equivalent medication at local stores or chemists. The extent to which the value of the
marketed good reflects the value of the non-marketed good depends, to a large extent, on
the degree of similarity between the two goods. If the goods are perfect substitutes, then
their economic values should be very close. As the level of substitution decreases so does
the extent to which the value of the marketed good can be taken as an indication of the non-
marketed forest good. Again, account should be taken of market imperfection, which may
distort the economic value of the good or service reflected in the market place (i.e.,
efficiency prices should be used).
4.4.3 INDIRECT USE VALUES
Because of time constraints and other inadvertent reasons, secondary data collection
approach is adopted for valuation of indirect benefits from Goa forest. For valuation of
carbon storage capacity of forest, forest assets accounted were used to calculate the total
forest stock and different parameters were used to calculate the carbon storage capacity of
the forest area under study.
For Soil conservation and watershed protection services, the annual expenditure of forest
department on construction of check dams and ridges etc were analyzed and a comparative
assessment was made between Increase and decreases of forest area for last 5 years and
change in the annual expenditure on construction of watershed structures for the same years.
On the basis of that per hectare expenditure variation were calculated and analyzing the
increase or decrease of forest cover, a price allocation was made for role of forest in soil and
watershed protection activity.
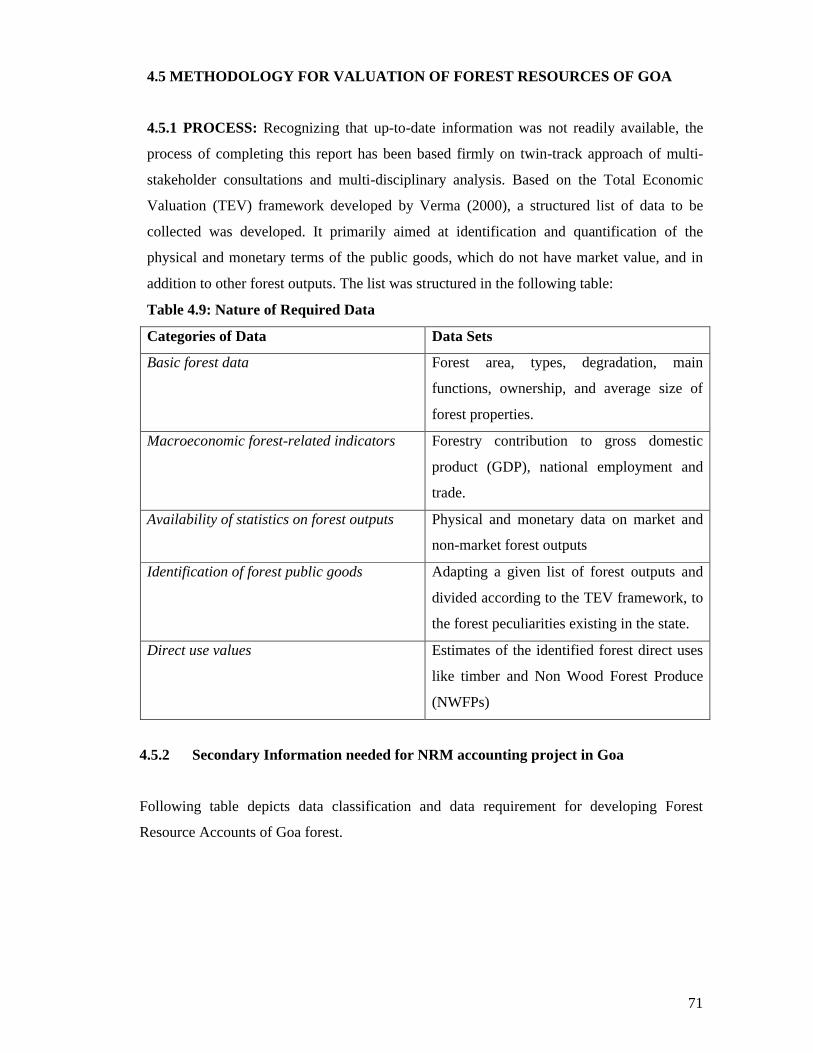
71
4.5 METHODOLOGY FOR VALUATION OF FOREST RESOURCES OF GOA
4.5.1 PROCESS: Recognizing that up-to-date information was not readily available, the
process of completing this report has been based firmly on twin-track approach of multi-
stakeholder consultations and multi-disciplinary analysis. Based on the Total Economic
Valuation (TEV) framework developed by Verma (2000), a structured list of data to be
collected was developed. It primarily aimed at identification and quantification of the
physical and monetary terms of the public goods, which do not have market value, and in
addition to other forest outputs. The list was structured in the following table:
Table 4.9: Nature of Required Data
Categories of Data Data Sets
Basic forest data Forest area, types, degradation, main
functions, ownership, and average size of
forest properties.
Macroeconomic forest-related indicators Forestry contribution to gross domestic
product (GDP), national employment and
trade.
Availability of statistics on forest outputs Physical and monetary data on market and
non-market forest outputs
Identification of forest public goods Adapting a given list of forest outputs and
divided according to the TEV framework, to
the forest peculiarities existing in the state.
Direct use values Estimates of the identified forest direct uses
like timber and Non Wood Forest Produce
(NWFPs)
4.5.2 Secondary Information needed for NRM accounting project in Goa
Following table depicts data classification and data requirement for developing Forest
Resource Accounts of Goa forest.
72
Table 4.10 Data Requirement
Categories of Data Data Sets
Forest vegetation inventory mapping details Specifying no. and type of species
found in the forest of Goa (state and
District wise).
Vegetation map of district as well as
state.
List of endangered species.
Forest resource trading agency details Timber trading
NTFPs trading
Forest based villages details No. of villages in Goa (dependent
and independent on forest).
Population density
4.5.3 Data Analysis
The data so collected has been analyzed creating the following set of accounts.
Asset account for standing timber (physical & monetary values).
Physical estimates & valuation for NWFPs (non wood forest products).
Volume & value of all forest products.
4.6. Accounting of Forest Resources in Goa
The study is an attempt to estimate various use value of Goa forest using the market price,
substitution approach, productivity method, welfare method, avoidance cost and benefits
transfer approach.. As, the time related to the study was limited, for certain values it also
uses findings of specific valuation studies undertaken in the country and other countries of
similar nature of forests to extrapolate for the entire state. The major limitation of the study
is possible overlapping of values like eco-tourism with biodiversity, watershed and carbon
sink values etc. Further the study treats total growing stock in forest as stock value and all
other values as flow values and calculates them on annual basis.
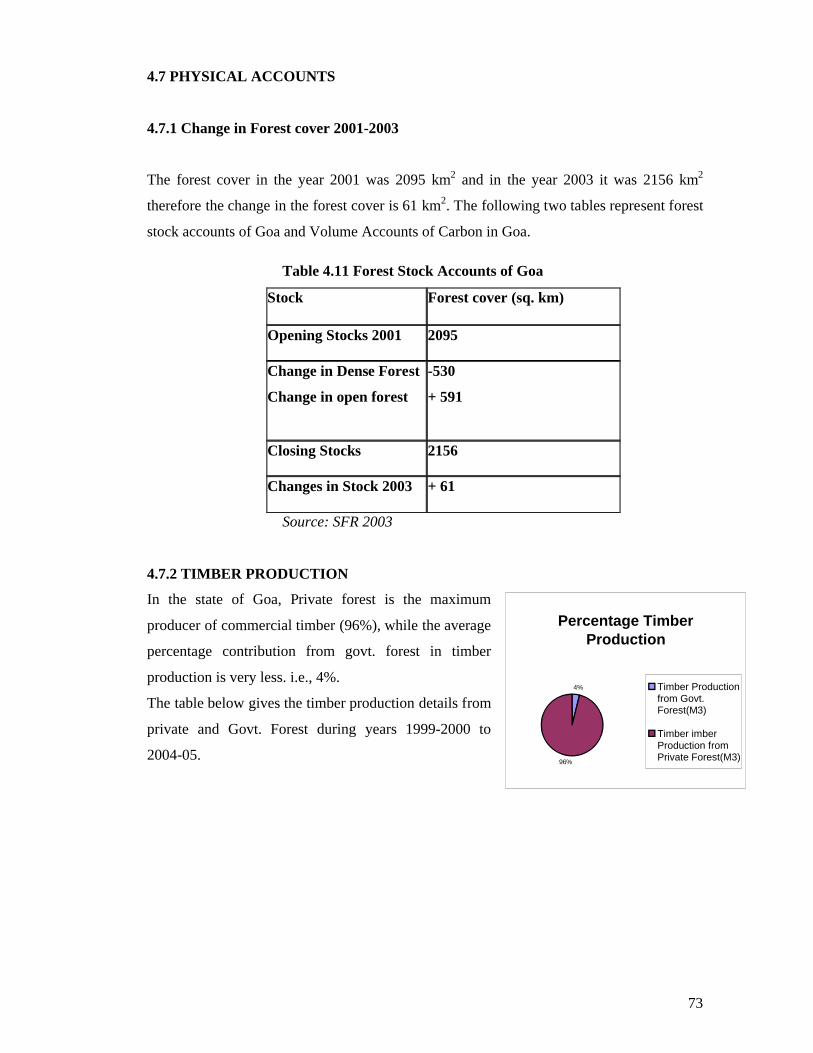
73
4.7 PHYSICAL ACCOUNTS
4.7.1 Change in Forest cover 2001-2003
The forest cover in the year 2001 was 2095 km2 and in the year 2003 it was 2156 km2
therefore the change in the forest cover is 61 km2. The following two tables represent forest
stock accounts of Goa and Volume Accounts of Carbon in Goa.
Table 4.11 Forest Stock Accounts of Goa
Stock Forest cover (sq. km)
Opening Stocks 2001 2095
Change in Dense Forest
Change in open forest
-530
+ 591
Closing Stocks 2156
Changes in Stock 2003 + 61
Source: SFR 2003
4.7.2 TIMBER PRODUCTION
In the state of Goa, Private forest is the maximum
producer of commercial timber (96%), while the average
percentage contribution from govt. forest in timber
production is very less. i.e., 4%.
The table below gives the timber production details from
private and Govt. Forest during years 1999-2000 to
2004-05.
Percentage Timber Production
4%
96%
Timber Productionfrom Govt.Forest(M3)
Timber imberProduction fromPrivate Forest(M3)
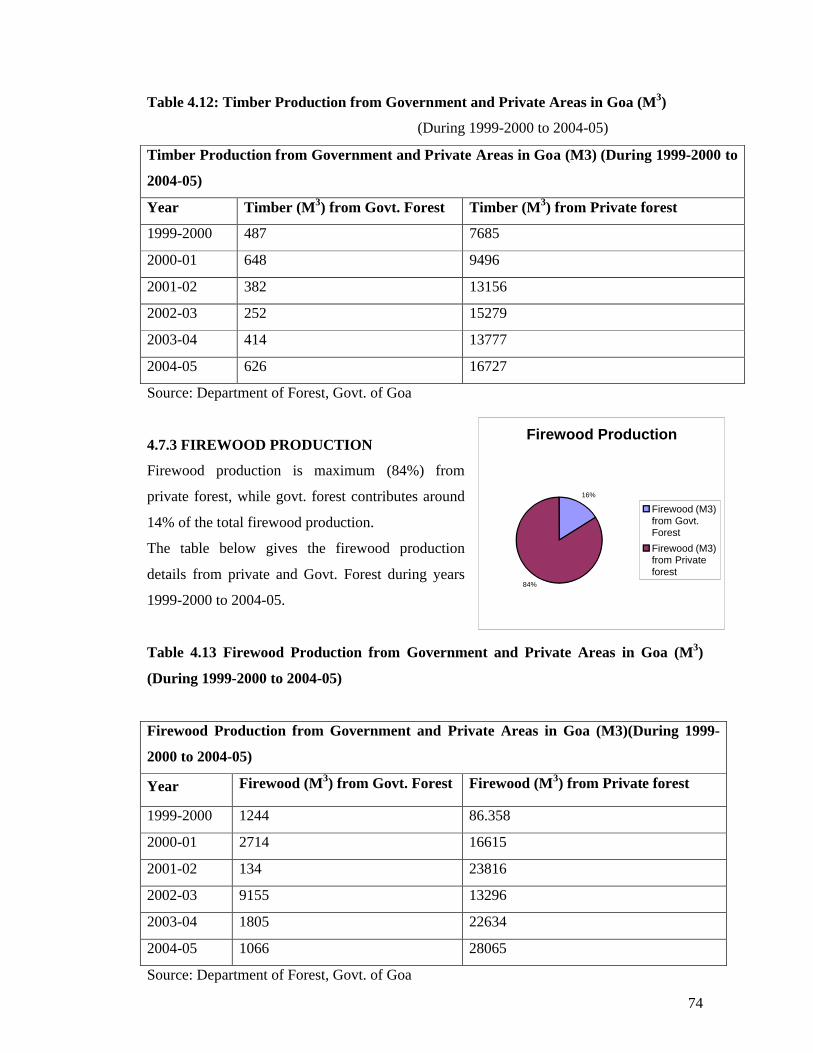
74
Table 4.12: Timber Production from Government and Private Areas in Goa (M3)
(During 1999-2000 to 2004-05)
Timber Production from Government and Private Areas in Goa (M3) (During 1999-2000 to
2004-05)
Year Timber (M3) from Govt. Forest Timber (M3) from Private forest
1999-2000 487 7685
2000-01 648 9496
2001-02 382 13156
2002-03 252 15279
2003-04 414 13777
2004-05 626 16727
Source: Department of Forest, Govt. of Goa
4.7.3 FIREWOOD PRODUCTION
Firewood production is maximum (84%) from
private forest, while govt. forest contributes around
14% of the total firewood production.
The table below gives the firewood production
details from private and Govt. Forest during years
1999-2000 to 2004-05.
Table 4.13 Firewood Production from Government and Private Areas in Goa (M3)
(During 1999-2000 to 2004-05)
Firewood Production from Government and Private Areas in Goa (M3)(During 1999-
2000 to 2004-05)
Year Firewood (M3) from Govt. Forest Firewood (M3) from Private forest
1999-2000 1244 86.358
2000-01 2714 16615
2001-02 134 23816
2002-03 9155 13296
2003-04 1805 22634
2004-05 1066 28065
Source: Department of Forest, Govt. of Goa
Firewood Production
16%
84%
Firewood (M3)from Govt.Forest
Firewood (M3)from Privateforest
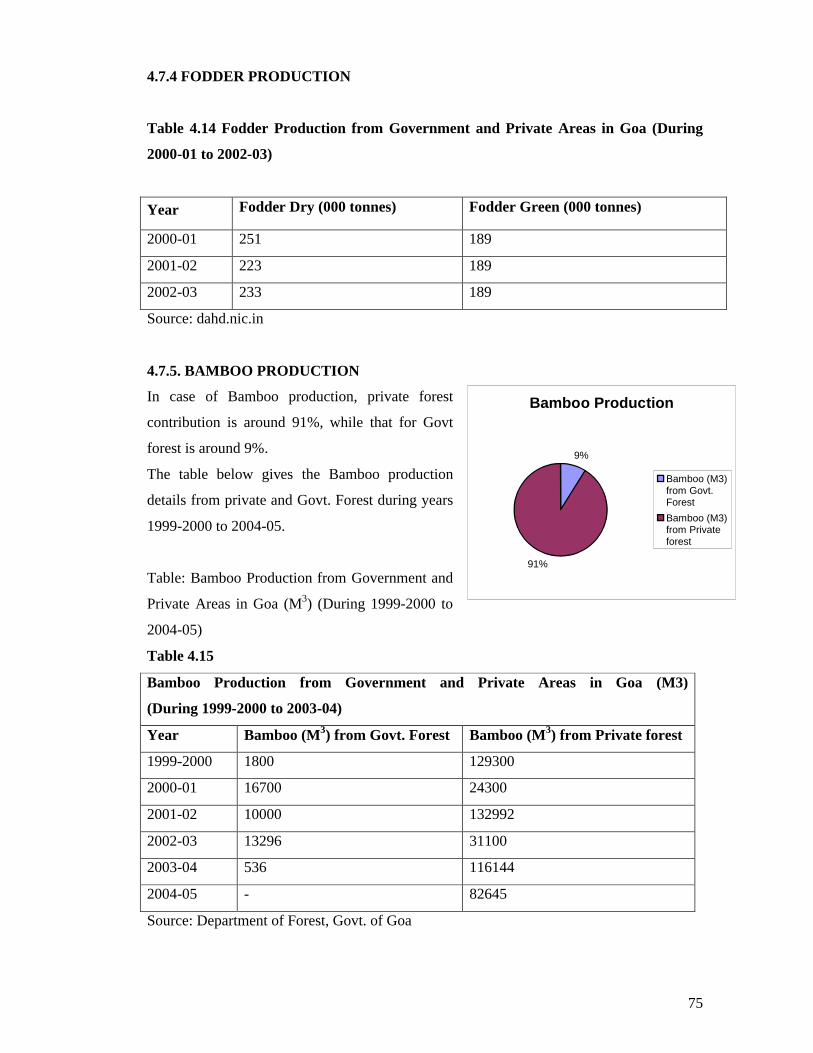
75
4.7.4 FODDER PRODUCTION
Table 4.14 Fodder Production from Government and Private Areas in Goa (During
2000-01 to 2002-03)
Year Fodder Dry (000 tonnes) Fodder Green (000 tonnes)
2000-01 251 189
2001-02 223 189
2002-03 233 189
Source: dahd.nic.in
4.7.5. BAMBOO PRODUCTION
In case of Bamboo production, private forest
contribution is around 91%, while that for Govt
forest is around 9%.
The table below gives the Bamboo production
details from private and Govt. Forest during years
1999-2000 to 2004-05.
Table: Bamboo Production from Government and
Private Areas in Goa (M3) (During 1999-2000 to
2004-05)
Table 4.15
Bamboo Production from Government and Private Areas in Goa (M3)
(During 1999-2000 to 2003-04)
Year Bamboo (M3) from Govt. Forest Bamboo (M3) from Private forest
1999-2000 1800 129300
2000-01 16700 24300
2001-02 10000 132992
2002-03 13296 31100
2003-04 536 116144
2004-05 - 82645
Source: Department of Forest, Govt. of Goa
Bamboo Production
9%
91%
Bamboo (M3)from Govt.Forest
Bamboo (M3)from Privateforest
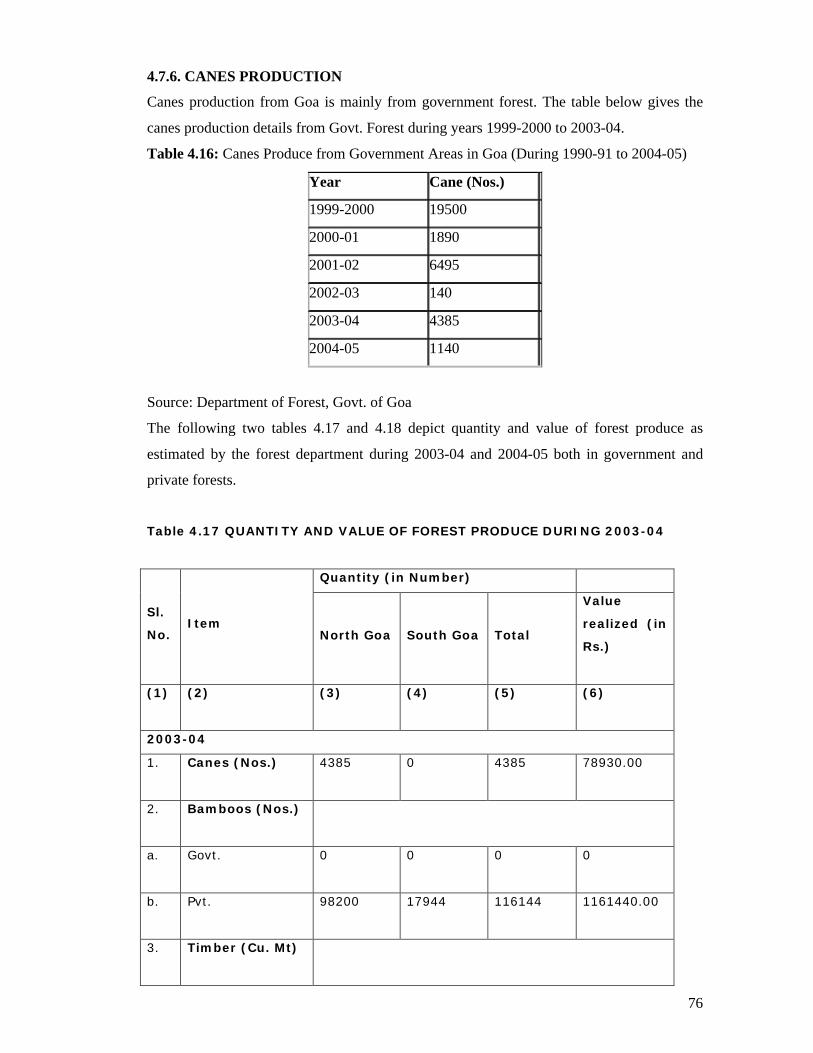
76
4.7.6. CANES PRODUCTION
Canes production from Goa is mainly from government forest. The table below gives the
canes production details from Govt. Forest during years 1999-2000 to 2003-04.
Table 4.16: Canes Produce from Government Areas in Goa (During 1990-91 to 2004-05)
Year Cane (Nos.)
1999-2000 19500
2000-01 1890
2001-02 6495
2002-03 140
2003-04 4385
2004-05 1140
Source: Department of Forest, Govt. of Goa
The following two tables 4.17 and 4.18 depict quantity and value of forest produce as
estimated by the forest department during 2003-04 and 2004-05 both in government and
private forests.
Table 4.17 QUANTITY AND VALUE OF FOREST PRODUCE DURING 2003-04
Sl.
No.Item
Quantity (in Number)
North Goa South Goa Total
Value
realized (in
Rs.)
(1) (2) (3) (4) (5) (6)
2003-04
1. Canes (Nos.) 4385 0 4385 78930.00
2. Bamboos (Nos.)
a. Govt. 0 0 0 0
b. Pvt. 98200 17944 116144 1161440.00
3. Timber (Cu. Mt)
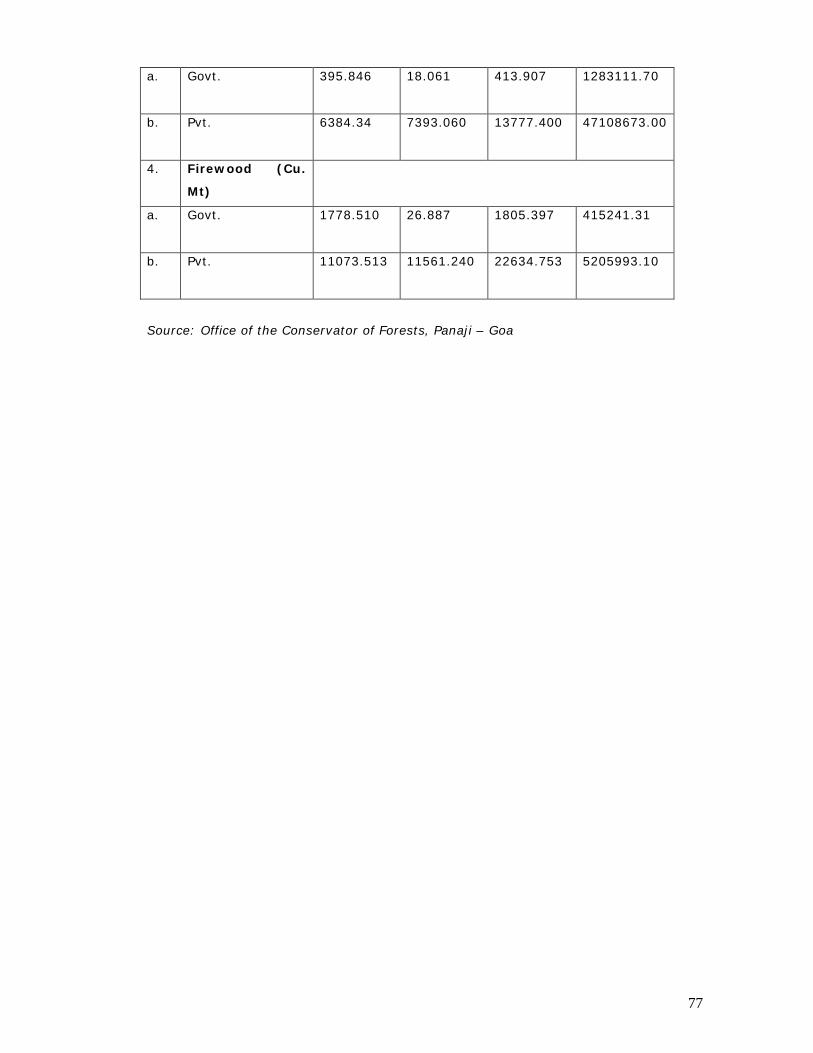
77
a. Govt. 395.846 18.061 413.907 1283111.70
b. Pvt. 6384.34 7393.060 13777.400 47108673.00
4. Firewood (Cu.
Mt)
a. Govt. 1778.510 26.887 1805.397 415241.31
b. Pvt. 11073.513 11561.240 22634.753 5205993.10
Source: Office of the Conservator of Forests, Panaji – Goa
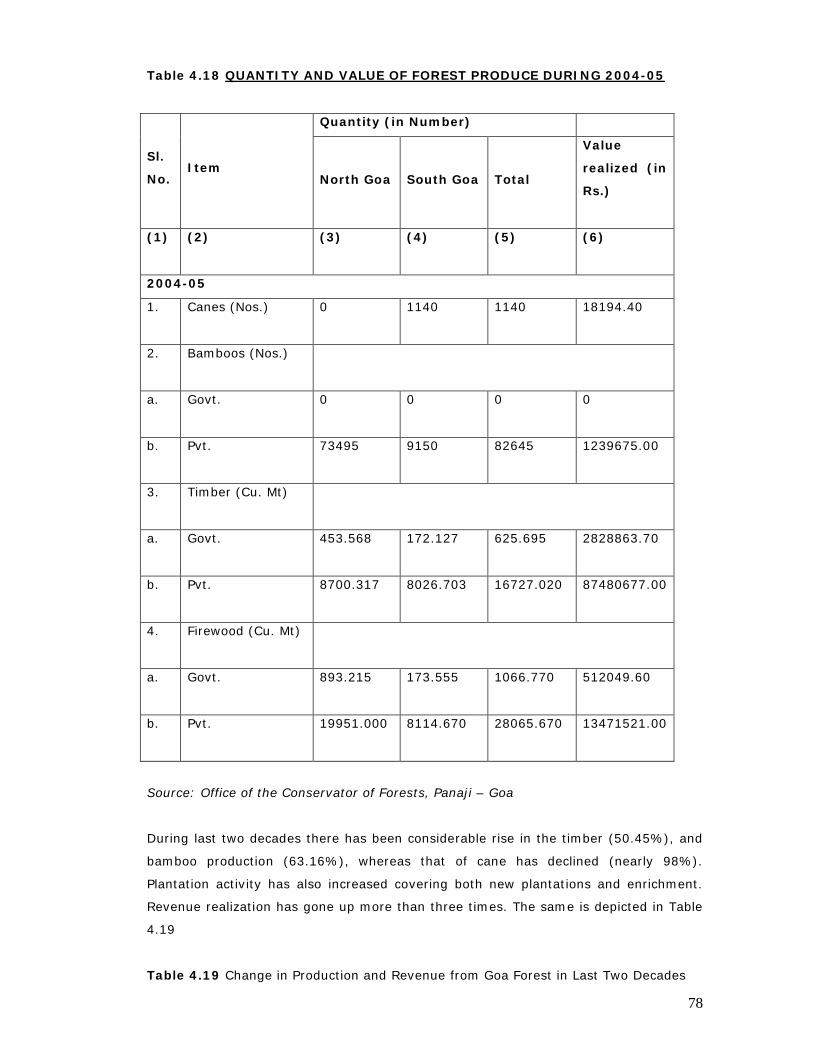
78
Table 4.18 QUANTITY AND VALUE OF FOREST PRODUCE DURING 2004-05
Sl.
No.Item
Quantity (in Number)
North Goa South Goa Total
Value
realized (in
Rs.)
(1) (2) (3) (4) (5) (6)
2004-05
1. Canes (Nos.) 0 1140 1140 18194.40
2. Bamboos (Nos.)
a. Govt. 0 0 0 0
b. Pvt. 73495 9150 82645 1239675.00
3. Timber (Cu. Mt)
a. Govt. 453.568 172.127 625.695 2828863.70
b. Pvt. 8700.317 8026.703 16727.020 87480677.00
4. Firewood (Cu. Mt)
a. Govt. 893.215 173.555 1066.770 512049.60
b. Pvt. 19951.000 8114.670 28065.670 13471521.00
Source: Office of the Conservator of Forests, Panaji – Goa
During last two decades there has been considerable rise in the timber (50.45%), and
bamboo production (63.16%), whereas that of cane has declined (nearly 98%).
Plantation activity has also increased covering both new plantations and enrichment.
Revenue realization has gone up more than three times. The same is depicted in Table
4.19
Table 4.19 Change in Production and Revenue from Goa Forest in Last Two Decades
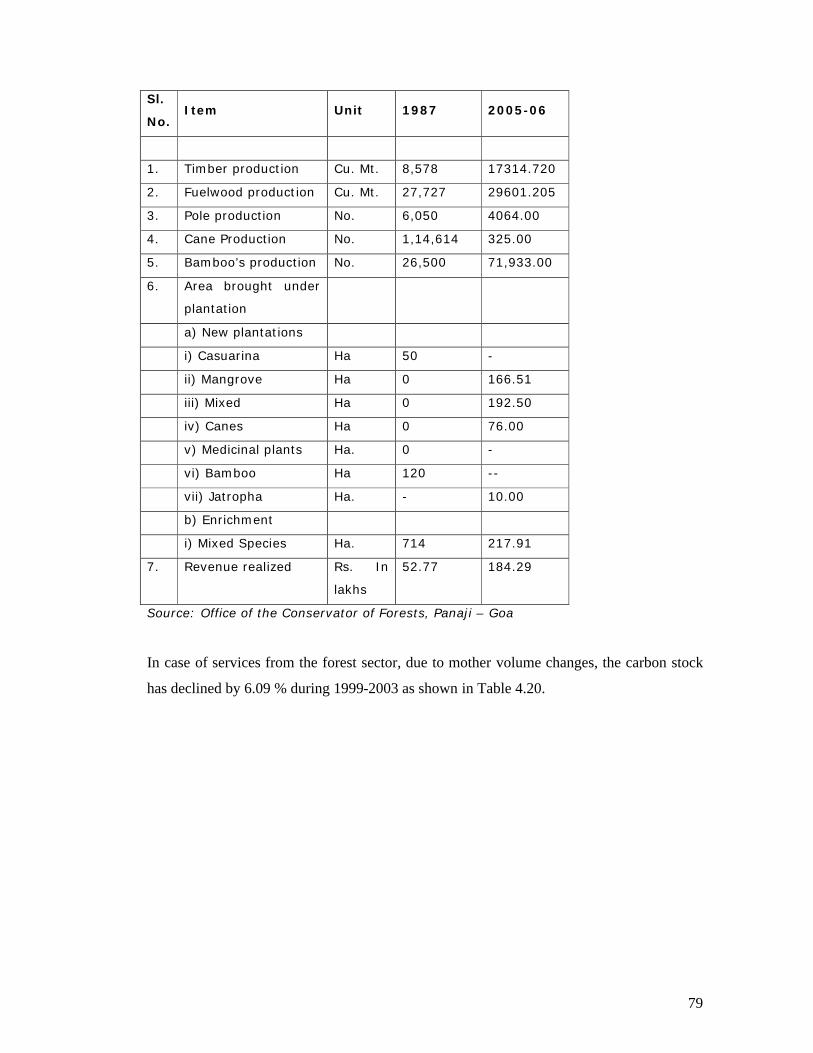
79
Sl.
No.Item Unit 1987 2005-06
1. Timber production Cu. Mt. 8,578 17314.720
2. Fuelwood production Cu. Mt. 27,727 29601.205
3. Pole production No. 6,050 4064.00
4. Cane Production No. 1,14,614 325.00
5. Bamboo’s production No. 26,500 71,933.00
6. Area brought under
plantation
a) New plantations
i) Casuarina Ha 50 -
ii) Mangrove Ha 0 166.51
iii) Mixed Ha 0 192.50
iv) Canes Ha 0 76.00
v) Medicinal plants Ha. 0 -
vi) Bamboo Ha 120 --
vii) Jatropha Ha. - 10.00
b) Enrichment
i) Mixed Species Ha. 714 217.91
7. Revenue realized Rs. In
lakhs
52.77 184.29
Source: Office of the Conservator of Forests, Panaji – Goa
In case of services from the forest sector, due to mother volume changes, the carbon stock
has declined by 6.09 % during 1999-2003 as shown in Table 4.20.
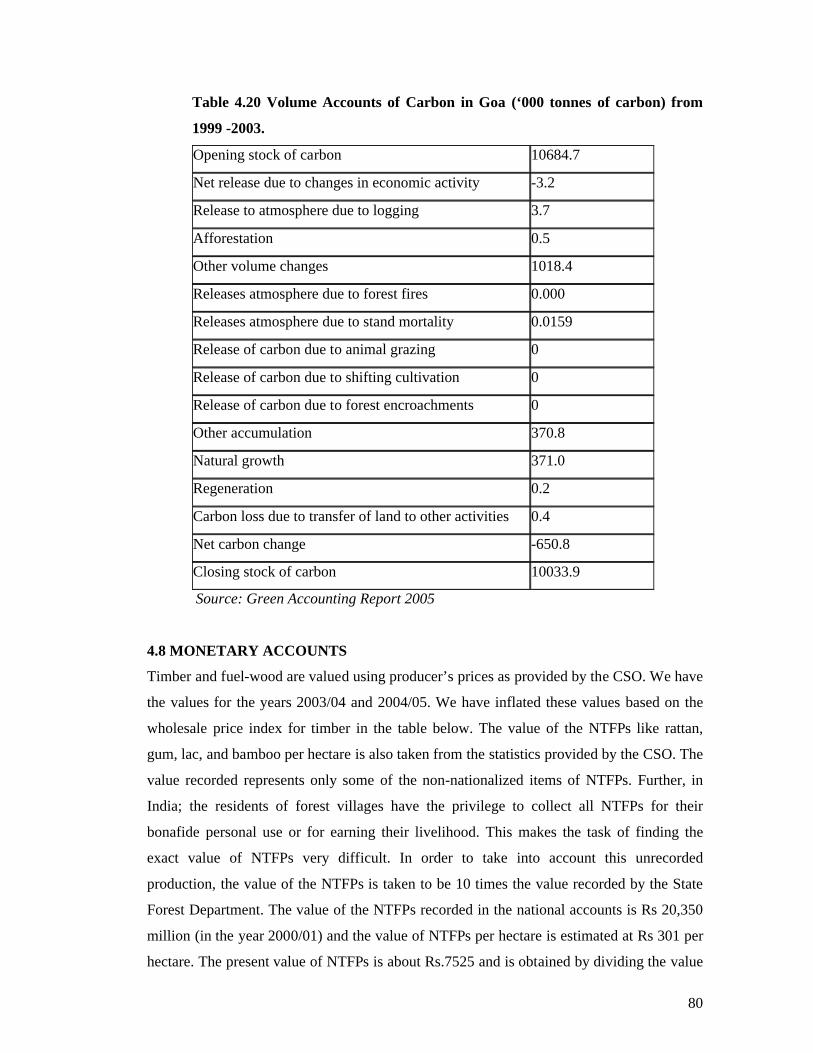
80
Table 4.20 Volume Accounts of Carbon in Goa (‘000 tonnes of carbon) from
1999 -2003.
Opening stock of carbon 10684.7
Net release due to changes in economic activity -3.2
Release to atmosphere due to logging 3.7
Afforestation 0.5
Other volume changes 1018.4
Releases atmosphere due to forest fires 0.000
Releases atmosphere due to stand mortality 0.0159
Release of carbon due to animal grazing 0
Release of carbon due to shifting cultivation 0
Release of carbon due to forest encroachments 0
Other accumulation 370.8
Natural growth 371.0
Regeneration 0.2
Carbon loss due to transfer of land to other activities 0.4
Net carbon change -650.8
Closing stock of carbon 10033.9
Source: Green Accounting Report 2005
4.8 MONETARY ACCOUNTS
Timber and fuel-wood are valued using producer’s prices as provided by the CSO. We have
the values for the years 2003/04 and 2004/05. We have inflated these values based on the
wholesale price index for timber in the table below. The value of the NTFPs like rattan,
gum, lac, and bamboo per hectare is also taken from the statistics provided by the CSO. The
value recorded represents only some of the non-nationalized items of NTFPs. Further, in
India; the residents of forest villages have the privilege to collect all NTFPs for their
bonafide personal use or for earning their livelihood. This makes the task of finding the
exact value of NTFPs very difficult. In order to take into account this unrecorded
production, the value of the NTFPs is taken to be 10 times the value recorded by the State
Forest Department. The value of the NTFPs recorded in the national accounts is Rs 20,350
million (in the year 2000/01) and the value of NTFPs per hectare is estimated at Rs 301 per
hectare. The present value of NTFPs is about Rs.7525 and is obtained by dividing the value
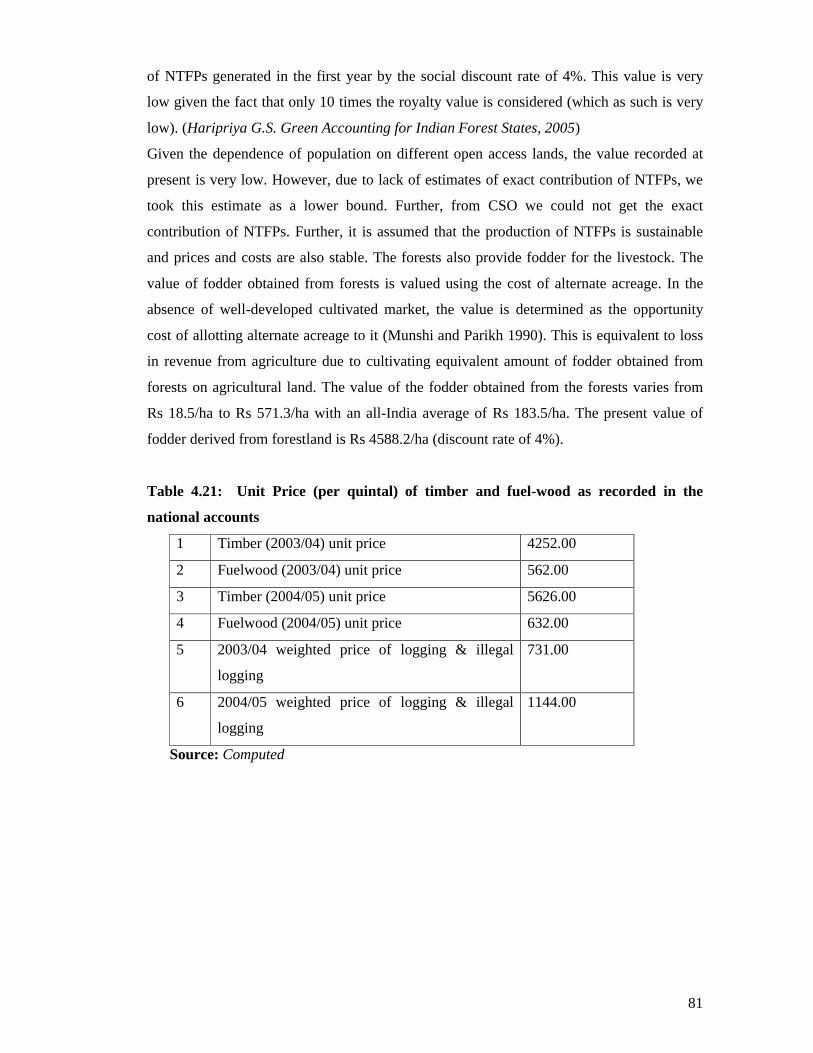
81
of NTFPs generated in the first year by the social discount rate of 4%. This value is very
low given the fact that only 10 times the royalty value is considered (which as such is very
low). (Haripriya G.S. Green Accounting for Indian Forest States, 2005)
Given the dependence of population on different open access lands, the value recorded at
present is very low. However, due to lack of estimates of exact contribution of NTFPs, we
took this estimate as a lower bound. Further, from CSO we could not get the exact
contribution of NTFPs. Further, it is assumed that the production of NTFPs is sustainable
and prices and costs are also stable. The forests also provide fodder for the livestock. The
value of fodder obtained from forests is valued using the cost of alternate acreage. In the
absence of well-developed cultivated market, the value is determined as the opportunity
cost of allotting alternate acreage to it (Munshi and Parikh 1990). This is equivalent to loss
in revenue from agriculture due to cultivating equivalent amount of fodder obtained from
forests on agricultural land. The value of the fodder obtained from the forests varies from
Rs 18.5/ha to Rs 571.3/ha with an all-India average of Rs 183.5/ha. The present value of
fodder derived from forestland is Rs 4588.2/ha (discount rate of 4%).
Table 4.21: Unit Price (per quintal) of timber and fuel-wood as recorded in the
national accounts
1 Timber (2003/04) unit price 4252.00
2 Fuelwood (2003/04) unit price 562.00
3 Timber (2004/05) unit price 5626.00
4 Fuelwood (2004/05) unit price 632.00
5 2003/04 weighted price of logging & illegal
logging
731.00
6 2004/05 weighted price of logging & illegal
logging
1144.00
Source: Computed
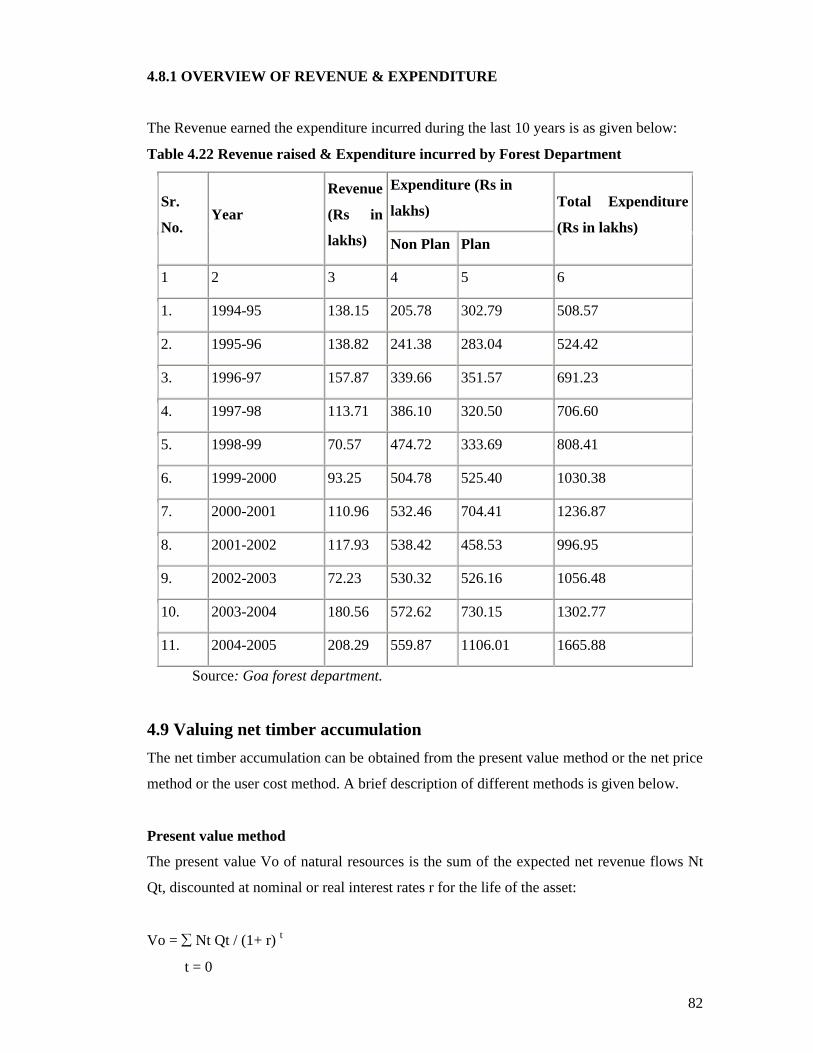
82
4.8.1 OVERVIEW OF REVENUE & EXPENDITURE
The Revenue earned the expenditure incurred during the last 10 years is as given below:
Table 4.22 Revenue raised & Expenditure incurred by Forest Department
Sr.
No.Year
Revenue
(Rs in
lakhs)
Expenditure (Rs in
lakhs)Total Expenditure
(Rs in lakhs)Non Plan Plan
1 2 3 4 5 6
1. 1994-95 138.15 205.78 302.79 508.57
2. 1995-96 138.82 241.38 283.04 524.42
3. 1996-97 157.87 339.66 351.57 691.23
4. 1997-98 113.71 386.10 320.50 706.60
5. 1998-99 70.57 474.72 333.69 808.41
6. 1999-2000 93.25 504.78 525.40 1030.38
7. 2000-2001 110.96 532.46 704.41 1236.87
8. 2001-2002 117.93 538.42 458.53 996.95
9. 2002-2003 72.23 530.32 526.16 1056.48
10. 2003-2004 180.56 572.62 730.15 1302.77
11. 2004-2005 208.29 559.87 1106.01 1665.88
Source: Goa forest department.
4.9 Valuing net timber accumulation
The net timber accumulation can be obtained from the present value method or the net price
method or the user cost method. A brief description of different methods is given below.
Present value method
The present value Vo of natural resources is the sum of the expected net revenue flows Nt
Qt, discounted at nominal or real interest rates r for the life of the asset:
Vo = Nt Qt / (1+ r) t
t = 0
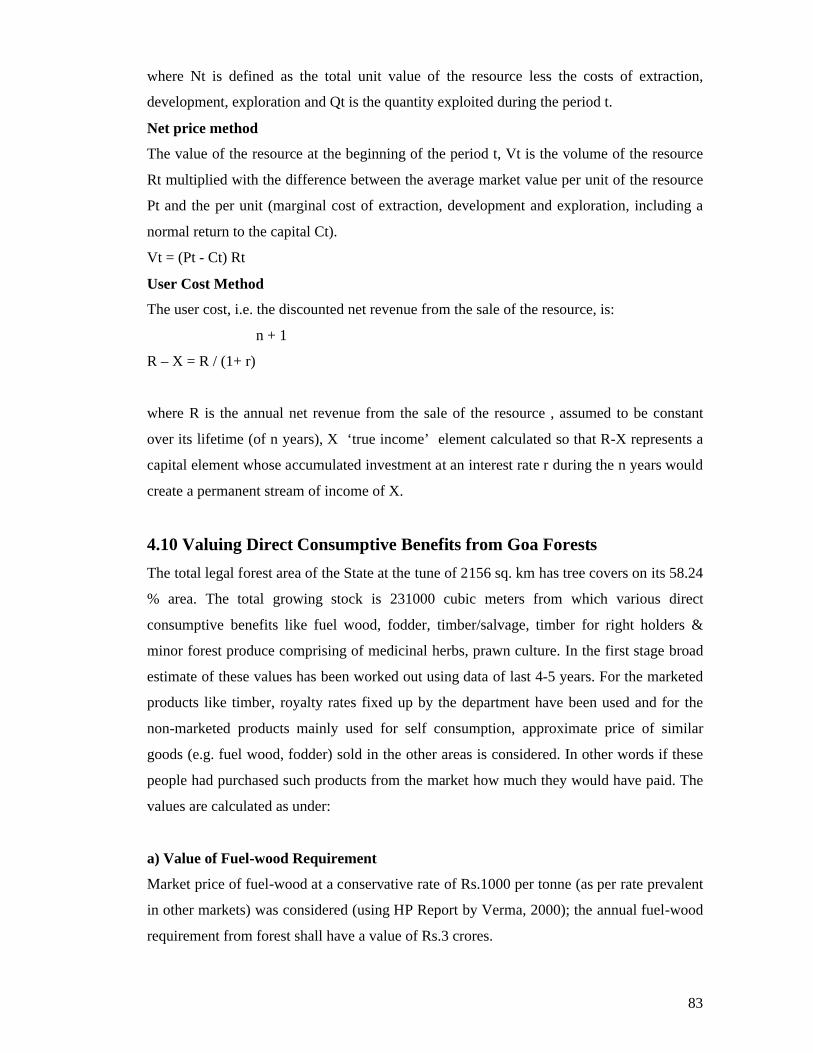
83
where Nt is defined as the total unit value of the resource less the costs of extraction,
development, exploration and Qt is the quantity exploited during the period t.
Net price method
The value of the resource at the beginning of the period t, Vt is the volume of the resource
Rt multiplied with the difference between the average market value per unit of the resource
Pt and the per unit (marginal cost of extraction, development and exploration, including a
normal return to the capital Ct).
Vt = (Pt - Ct) Rt
User Cost Method
The user cost, i.e. the discounted net revenue from the sale of the resource, is:
n + 1
R – X = R / (1+ r)
where R is the annual net revenue from the sale of the resource , assumed to be constant
over its lifetime (of n years), X ‘true income’ element calculated so that R-X represents a
capital element whose accumulated investment at an interest rate r during the n years would
create a permanent stream of income of X.
4.10 Valuing Direct Consumptive Benefits from Goa Forests
The total legal forest area of the State at the tune of 2156 sq. km has tree covers on its 58.24
% area. The total growing stock is 231000 cubic meters from which various direct
consumptive benefits like fuel wood, fodder, timber/salvage, timber for right holders &
minor forest produce comprising of medicinal herbs, prawn culture. In the first stage broad
estimate of these values has been worked out using data of last 4-5 years. For the marketed
products like timber, royalty rates fixed up by the department have been used and for the
non-marketed products mainly used for self consumption, approximate price of similar
goods (e.g. fuel wood, fodder) sold in the other areas is considered. In other words if these
people had purchased such products from the market how much they would have paid. The
values are calculated as under:
a) Value of Fuel-wood Requirement
Market price of fuel-wood at a conservative rate of Rs.1000 per tonne (as per rate prevalent
in other markets) was considered (using HP Report by Verma, 2000); the annual fuel-wood
requirement from forest shall have a value of Rs.3 crores.
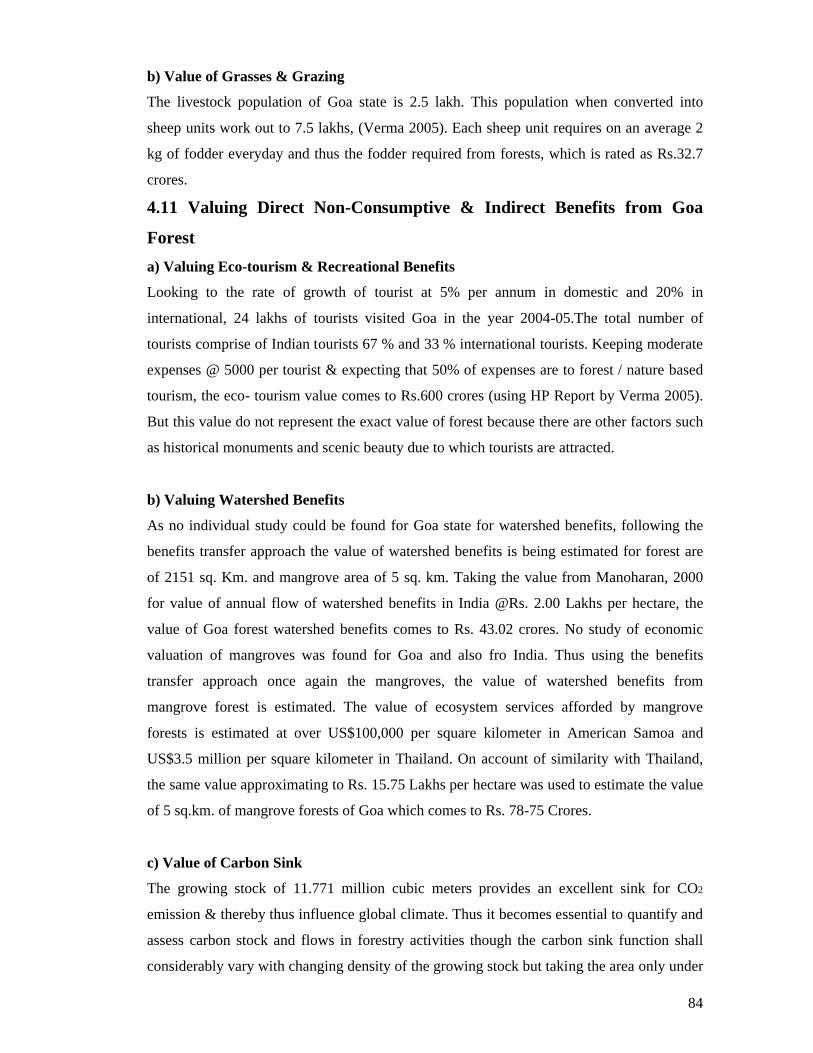
84
b) Value of Grasses & Grazing
The livestock population of Goa state is 2.5 lakh. This population when converted into
sheep units work out to 7.5 lakhs, (Verma 2005). Each sheep unit requires on an average 2
kg of fodder everyday and thus the fodder required from forests, which is rated as Rs.32.7
crores.
4.11 Valuing Direct Non-Consumptive & Indirect Benefits from Goa
Forest
a) Valuing Eco-tourism & Recreational Benefits
Looking to the rate of growth of tourist at 5% per annum in domestic and 20% in
international, 24 lakhs of tourists visited Goa in the year 2004-05.The total number of
tourists comprise of Indian tourists 67 % and 33 % international tourists. Keeping moderate
expenses @ 5000 per tourist & expecting that 50% of expenses are to forest / nature based
tourism, the eco- tourism value comes to Rs.600 crores (using HP Report by Verma 2005).
But this value do not represent the exact value of forest because there are other factors such
as historical monuments and scenic beauty due to which tourists are attracted.
b) Valuing Watershed Benefits
As no individual study could be found for Goa state for watershed benefits, following the
benefits transfer approach the value of watershed benefits is being estimated for forest are
of 2151 sq. Km. and mangrove area of 5 sq. km. Taking the value from Manoharan, 2000
for value of annual flow of watershed benefits in India @Rs. 2.00 Lakhs per hectare, the
value of Goa forest watershed benefits comes to Rs. 43.02 crores. No study of economic
valuation of mangroves was found for Goa and also fro India. Thus using the benefits
transfer approach once again the mangroves, the value of watershed benefits from
mangrove forest is estimated. The value of ecosystem services afforded by mangrove
forests is estimated at over US$100,000 per square kilometer in American Samoa and
US$3.5 million per square kilometer in Thailand. On account of similarity with Thailand,
the same value approximating to Rs. 15.75 Lakhs per hectare was used to estimate the value
of 5 sq.km. of mangrove forests of Goa which comes to Rs. 78-75 Crores.
c) Value of Carbon Sink
The growing stock of 11.771 million cubic meters provides an excellent sink for CO2
emission & thereby thus influence global climate. Thus it becomes essential to quantify and
assess carbon stock and flows in forestry activities though the carbon sink function shall
considerably vary with changing density of the growing stock but taking the area only under
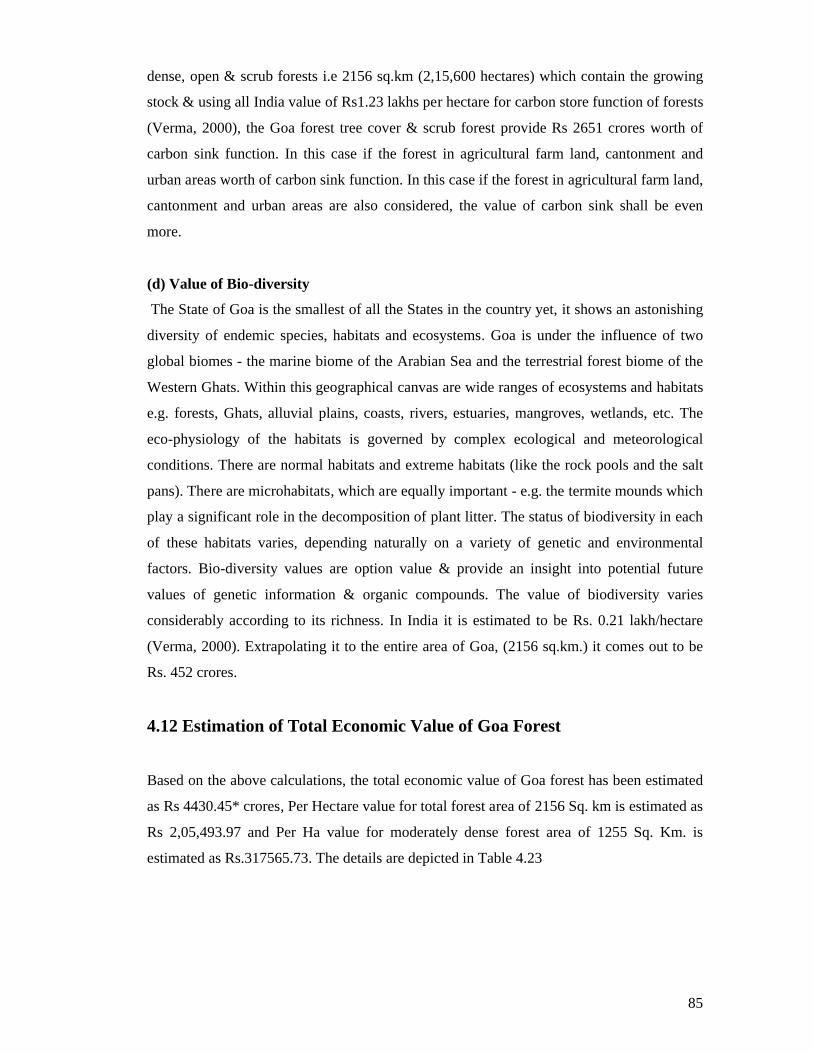
85
dense, open & scrub forests i.e 2156 sq.km (2,15,600 hectares) which contain the growing
stock & using all India value of Rs1.23 lakhs per hectare for carbon store function of forests
(Verma, 2000), the Goa forest tree cover & scrub forest provide Rs 2651 crores worth of
carbon sink function. In this case if the forest in agricultural farm land, cantonment and
urban areas worth of carbon sink function. In this case if the forest in agricultural farm land,
cantonment and urban areas are also considered, the value of carbon sink shall be even
more.
(d) Value of Bio-diversity
The State of Goa is the smallest of all the States in the country yet, it shows an astonishing
diversity of endemic species, habitats and ecosystems. Goa is under the influence of two
global biomes - the marine biome of the Arabian Sea and the terrestrial forest biome of the
Western Ghats. Within this geographical canvas are wide ranges of ecosystems and habitats
e.g. forests, Ghats, alluvial plains, coasts, rivers, estuaries, mangroves, wetlands, etc. The
eco-physiology of the habitats is governed by complex ecological and meteorological
conditions. There are normal habitats and extreme habitats (like the rock pools and the salt
pans). There are microhabitats, which are equally important - e.g. the termite mounds which
play a significant role in the decomposition of plant litter. The status of biodiversity in each
of these habitats varies, depending naturally on a variety of genetic and environmental
factors. Bio-diversity values are option value & provide an insight into potential future
values of genetic information & organic compounds. The value of biodiversity varies
considerably according to its richness. In India it is estimated to be Rs. 0.21 lakh/hectare
(Verma, 2000). Extrapolating it to the entire area of Goa, (2156 sq.km.) it comes out to be
Rs. 452 crores.
4.12 Estimation of Total Economic Value of Goa Forest
Based on the above calculations, the total economic value of Goa forest has been estimated
as Rs 4430.45* crores, Per Hectare value for total forest area of 2156 Sq. km is estimated as
Rs 2,05,493.97 and Per Ha value for moderately dense forest area of 1255 Sq. Km. is
estimated as Rs.317565.73. The details are depicted in Table 4.23
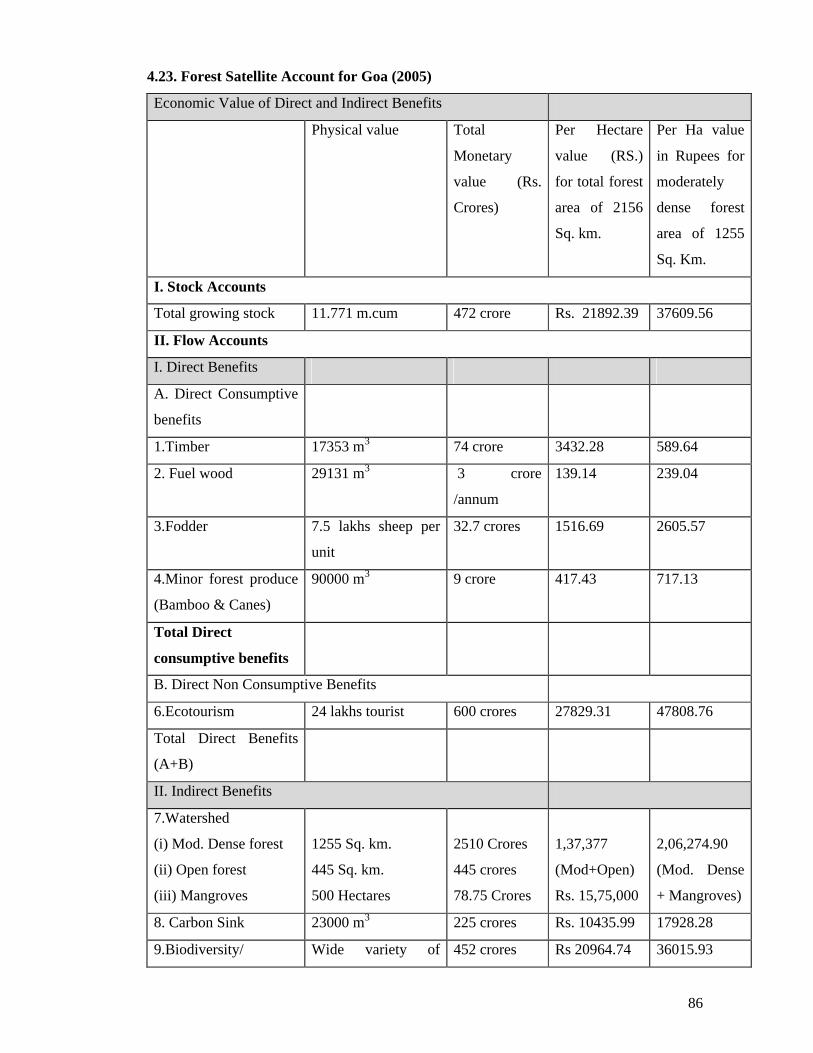
86
4.23. Forest Satellite Account for Goa (2005)
Economic Value of Direct and Indirect Benefits
Physical value Total
Monetary
value (Rs.
Crores)
Per Hectare
value (RS.)
for total forest
area of 2156
Sq. km.
Per Ha value
in Rupees for
moderately
dense forest
area of 1255
Sq. Km.
I. Stock Accounts
Total growing stock 11.771 m.cum 472 crore Rs. 21892.39 37609.56
II. Flow Accounts
I. Direct Benefits
A. Direct Consumptive
benefits
1.Timber 17353 m3 74 crore 3432.28 589.64
2. Fuel wood 29131 m3 3 crore
/annum
139.14 239.04
3.Fodder 7.5 lakhs sheep per
unit
32.7 crores 1516.69 2605.57
4.Minor forest produce
(Bamboo & Canes)
90000 m3 9 crore 417.43 717.13
Total Direct
consumptive benefits
B. Direct Non Consumptive Benefits
6.Ecotourism 24 lakhs tourist 600 crores 27829.31 47808.76
Total Direct Benefits
(A+B)
II. Indirect Benefits
7.Watershed
(i) Mod. Dense forest
(ii) Open forest
(iii) Mangroves
1255 Sq. km.
445 Sq. km.
500 Hectares
2510 Crores
445 crores
78.75 Crores
1,37,377
(Mod+Open)
Rs. 15,75,000
2,06,274.90
(Mod. Dense
+ Mangroves)
8. Carbon Sink 23000 m3 225 crores Rs. 10435.99 17928.28
9.Biodiversity/ Wide variety of 452 crores Rs 20964.74 36015.93
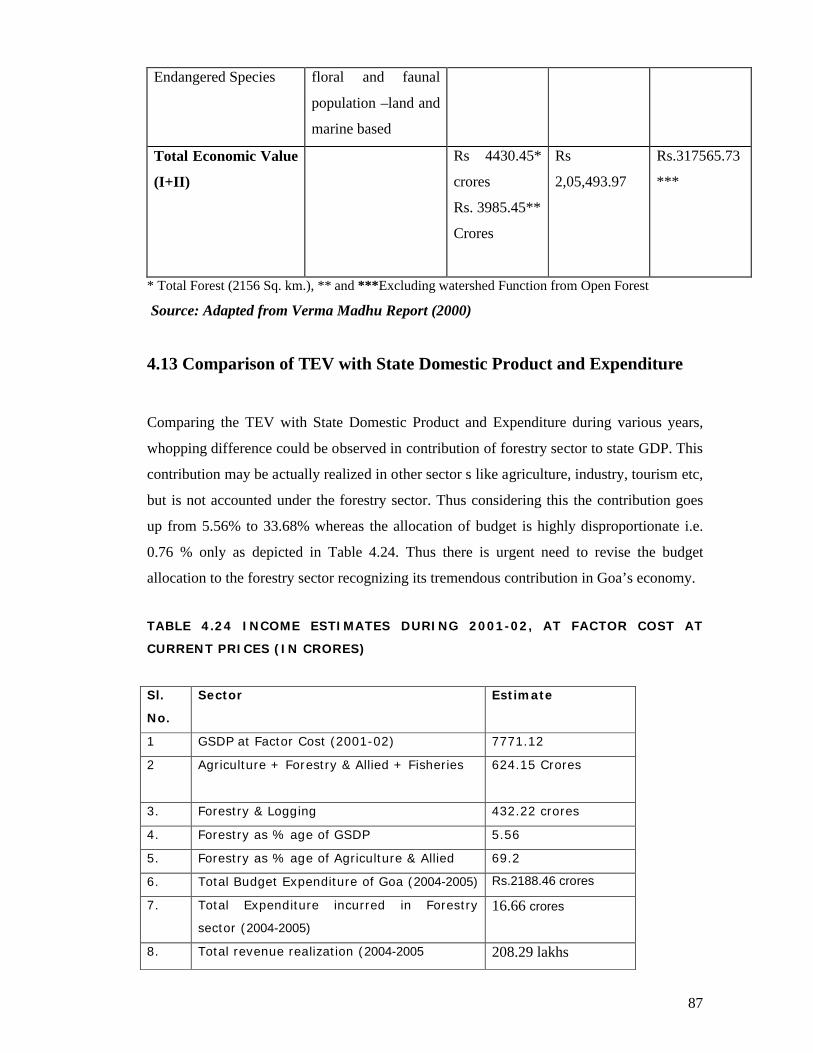
87
Endangered Species floral and faunal
population –land and
marine based
Total Economic Value
(I+II)
Rs 4430.45*
crores
Rs. 3985.45**
Crores
Rs
2,05,493.97
Rs.317565.73
***
* Total Forest (2156 Sq. km.), ** and ***Excluding watershed Function from Open Forest
Source: Adapted from Verma Madhu Report (2000)
4.13 Comparison of TEV with State Domestic Product and Expenditure
Comparing the TEV with State Domestic Product and Expenditure during various years,
whopping difference could be observed in contribution of forestry sector to state GDP. This
contribution may be actually realized in other sector s like agriculture, industry, tourism etc,
but is not accounted under the forestry sector. Thus considering this the contribution goes
up from 5.56% to 33.68% whereas the allocation of budget is highly disproportionate i.e.
0.76 % only as depicted in Table 4.24. Thus there is urgent need to revise the budget
allocation to the forestry sector recognizing its tremendous contribution in Goa’s economy.
TABLE 4.24 INCOME ESTIMATES DURING 2001-02, AT FACTOR COST AT
CURRENT PRICES (IN CRORES)
Sl.
No.
Sector Estimate
1 GSDP at Factor Cost (2001-02) 7771.12
2 Agriculture + Forestry & Allied + Fisheries 624.15 Crores
3. Forestry & Logging 432.22 crores
4. Forestry as % age of GSDP 5.56
5. Forestry as % age of Agriculture & Allied 69.2
6. Total Budget Expenditure of Goa (2004-2005) Rs.2188.46 crores
7. Total Expenditure incurred in Forestry
sector (2004-2005)
16.66 crores
8. Total revenue realization (2004-2005 208.29 lakhs
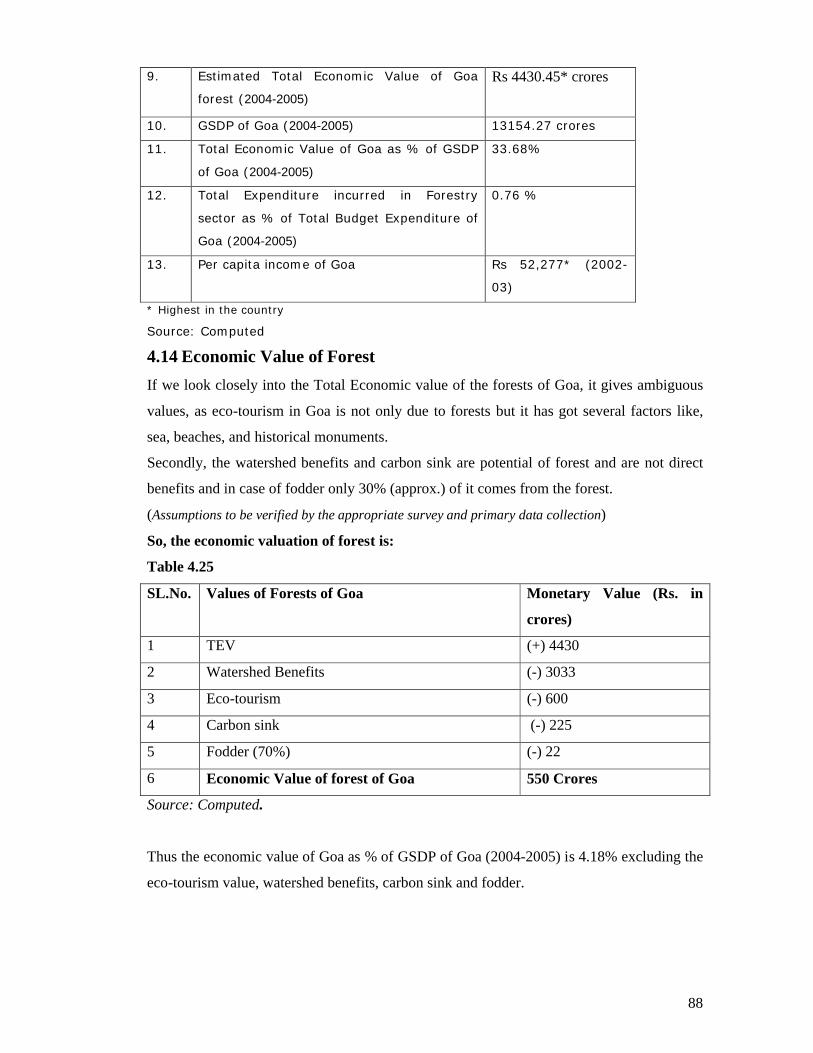
88
9. Estimated Total Economic Value of Goa
forest (2004-2005)
Rs 4430.45* crores
10. GSDP of Goa (2004-2005) 13154.27 crores
11. Total Economic Value of Goa as % of GSDP
of Goa (2004-2005)
33.68%
12. Total Expenditure incurred in Forestry
sector as % of Total Budget Expenditure of
Goa (2004-2005)
0.76 %
13. Per capita income of Goa Rs 52,277* (2002-
03)
* Highest in the country
Source: Computed
4.14 Economic Value of Forest
If we look closely into the Total Economic value of the forests of Goa, it gives ambiguous
values, as eco-tourism in Goa is not only due to forests but it has got several factors like,
sea, beaches, and historical monuments.
Secondly, the watershed benefits and carbon sink are potential of forest and are not direct
benefits and in case of fodder only 30% (approx.) of it comes from the forest.
(Assumptions to be verified by the appropriate survey and primary data collection)
So, the economic valuation of forest is:
Table 4.25
SL.No. Values of Forests of Goa Monetary Value (Rs. in
crores)
1 TEV (+) 4430
2 Watershed Benefits (-) 3033
3 Eco-tourism (-) 600
4 Carbon sink (-) 225
5 Fodder (70%) (-) 22
6 Economic Value of forest of Goa 550 Crores
Source: Computed.
Thus the economic value of Goa as % of GSDP of Goa (2004-2005) is 4.18% excluding the
eco-tourism value, watershed benefits, carbon sink and fodder.
89
4.15 Summary
Accounting for forest wealth is an important ingredient in creating a framework for
analyzing policy trade-offs. The accounts that we have presented for Goa forest have
described forestry related stocks and flows in terms of land area (under forest), physical
volume (of timber and carbon) and finally monetary values. In this way, we have tried to
estimate the true value of economic activity in the state of Goa.
The Total Economic Value of Goa forest comes out to be Rs. 4430.45 crores. But apart
from the eco-tourism value, carbon sink, watershed benefits the value comes to Rs.550
crores. The carbon sink, watershed, ecotourism are the potential of forest and other natural
resources of Goa. This shows that the role of forest is huge in economy of Goa.
The forest area of Goa state has increased to a significant level. The role of forest in
economic benefits such as carbon storage, timber production, non-timber forest products
and the many other values of biodiversity including eco-tourism. There are though
limitations placed by a paucity of data and the problems of methodology but nevertheless
the importance of the sector in state GDP cannot be undermined and calls for improved
allocation of budget in future such that wide variety of forest values from Goa forest can be
sustained for future uses.
90
Conceptual Framework & Green SNP
5.1 Conceptual Framework
Green Accounting, in whatever format and framework will have conceptual difficulties and
data interpretation and collection problems. Even the Systems of National Accounts (SNA)
have many problems that we have learned to live with – such as unaccounted women’s
work that gets monetised when house-help is hired, or appliances are purchased or
“unmonetised” when “a man marries his maid” all off quoted paradox about SNA.
Care, concern and love for environment have gone up that manifest into market place. The
demand for nature can be judged by the income gathered by animal toys, books,
documentaries, movies, dedicated TV channels, eco-tourisms and many nature products.
Similarly, clean air and water have their markets in terms of real-estate prices for cleaner
neighborhoods, water-purifying systems, bottled water etc. Yet it is difficult to put a value
as they are clubbed among various already existing heads in the national accounts.
Similarly, negative externalities are not only hidden, they manifest themselves into income,
leading to erroneous conclusion that “more the environment deteriorates better is the
economy” as the doctors income go up with pollution, oil spills lead to vast expenses by the
oil company that year, deforested forest lead to income from the timber and fuel wood.
On the other hand, prudent environmental management that requires firms to purchase
pollution abatement on a routine basis shows expenditures in their balance sheet regularly.
Thus, environmental accounting is needed to avoid such misconceptions. It can do so, only
if it is routinely done to check the sustainability of these activities.
However, computation of environmentally adjusted national accounts involves many
challenges. One needs to be careful to avoid double counting. One also needs to be clear
about what should be included and what not.
The framework by Dasgupta and Maler (1995) provides a slightly modified framework
suggested by Parikh and Parikh (1997) clarifies the basic conceptual framework.
Our purpose, in preparing an IEEA is to get an idea of what is our true net national product
after accounting for depreciation of natural assets. Some refer to this as the green NDP,
sustainable NDP or environmentally adjusted NDP (EANDP). Consider that social welfare
depends on consumption of produced goods, consumption of collected environmental
5
91
products such as fuel-wood from forests etc., enjoyment of various environmental amenities
provided by environmental assets (such as clean air, clean water, scenic beauty etc.) and
leisure. Also consider that the quality of environmental services is affected adversely by
production of goods and positively by defensive abatement measures, which require
resources. Consider further that the quality of assets such as forests can be improved by
human effort and worsened by over-exploitation. This is a slightly extended version of
Dasgupta and Mäler (1995), in that we have added explicitly the value of leisure in the
welfare function.
.
In such a world, one can show that optimization over an infinite horizon gives the following
definition of Net National Product:
Net National Product = Value of consumption + Value of productions of nature collected (such as fuelwood) + Value of environmental amenities provided by environmental resource stocks (such as clean air etc.) + Value of leisure enjoyed + Value of additions to productive capital + Value of additions to environmental resource stocks (clean air etc.) + Value of additions to natural capital stocks (such as forests) + Value of additions to stock of defensive capital.
In this equation, all valuations are to be done at prices prevailing at the optimal trajectory.
The important thing to note here is that so-called defensive expenditures (such as medical
expenditure needed to fight the effect of pollution) are not deducted here and that the value
of environmental amenities are added here Peskin (1989). Both these approaches differ
from that of the United Nations Statistics Division (UNSD). However, the UNSD approach
does not assume that the economy is on the optimal path (if it were so then perhaps the need
for an IEEA would not have arisen). Nonetheless, one needs to carefully understand what it
is that one is trying to measure.
One should also note that deduction of defensive expenditure at the level of a satellite
account may be justified. Consider, for example, a power plant emitting particulate matter
into the air. This may make some people sick who may spend money on medicines and may
miss work. Their loss in income may be already be included in the conventional national
accounts as less output of sectors in which they work. However, if we are to judge the
power plant, this loss in income should be shown as a negative outcome of this plant. A
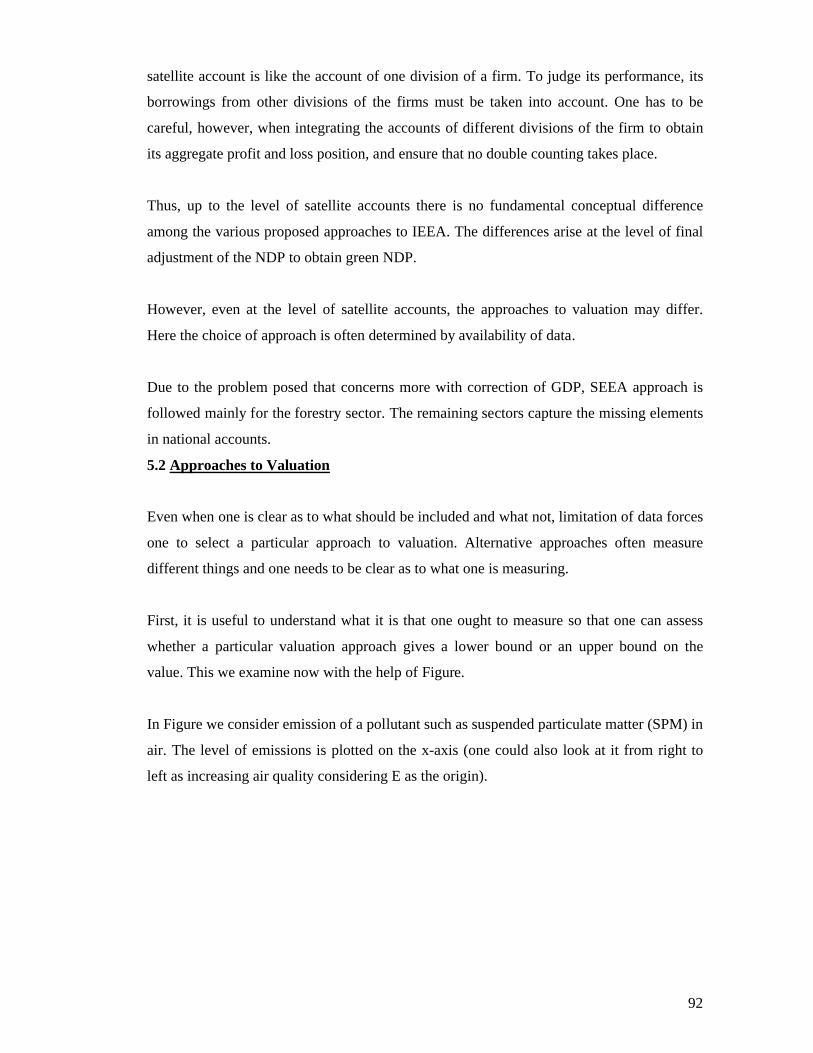
92
satellite account is like the account of one division of a firm. To judge its performance, its
borrowings from other divisions of the firms must be taken into account. One has to be
careful, however, when integrating the accounts of different divisions of the firm to obtain
its aggregate profit and loss position, and ensure that no double counting takes place.
Thus, up to the level of satellite accounts there is no fundamental conceptual difference
among the various proposed approaches to IEEA. The differences arise at the level of final
adjustment of the NDP to obtain green NDP.
However, even at the level of satellite accounts, the approaches to valuation may differ.
Here the choice of approach is often determined by availability of data.
Due to the problem posed that concerns more with correction of GDP, SEEA approach is
followed mainly for the forestry sector. The remaining sectors capture the missing elements
in national accounts.
5.2 Approaches to Valuation
Even when one is clear as to what should be included and what not, limitation of data forces
one to select a particular approach to valuation. Alternative approaches often measure
different things and one needs to be clear as to what one is measuring.
First, it is useful to understand what it is that one ought to measure so that one can assess
whether a particular valuation approach gives a lower bound or an upper bound on the
value. This we examine now with the help of Figure.
In Figure we consider emission of a pollutant such as suspended particulate matter (SPM) in
air. The level of emissions is plotted on the x-axis (one could also look at it from right to
left as increasing air quality considering E as the origin).
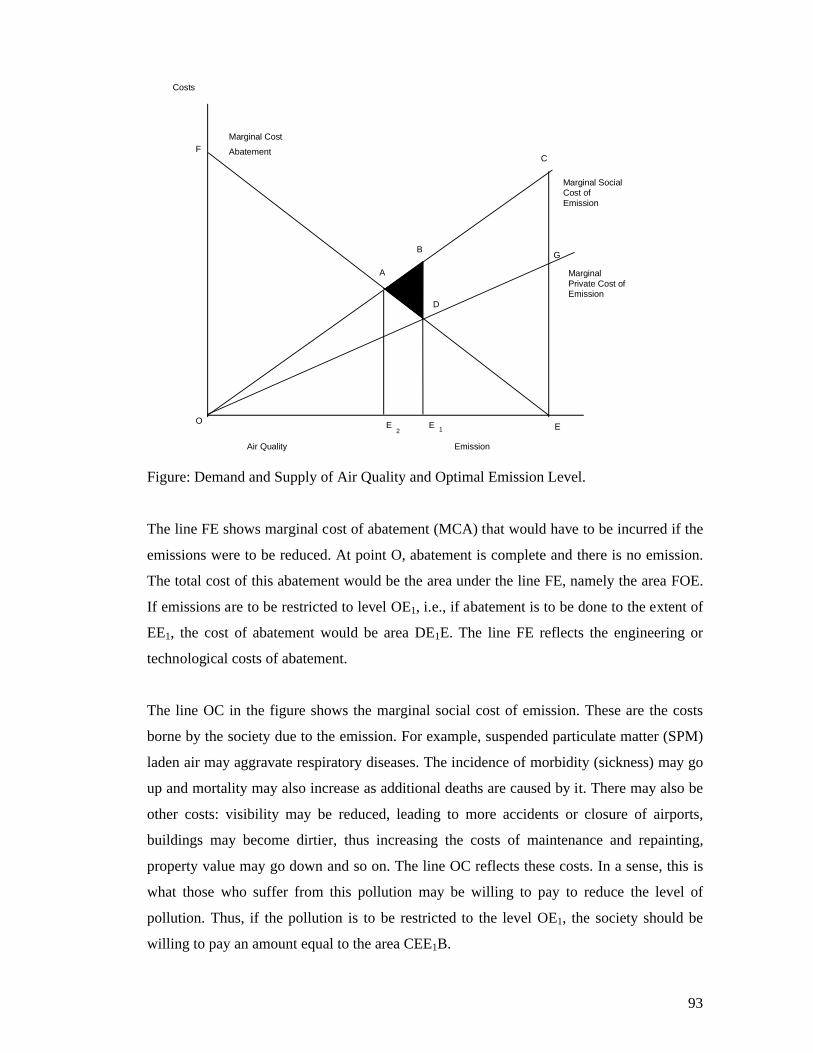
93
A
B
C
EE EO
F
2 1
D
Costs
Abatement
Marginal SocialCost ofEmission
MarginalPrivate Cost ofEmission
Emission
Marginal Cost
G
Air Quality
Figure: Demand and Supply of Air Quality and Optimal Emission Level.
The line FE shows marginal cost of abatement (MCA) that would have to be incurred if the
emissions were to be reduced. At point O, abatement is complete and there is no emission.
The total cost of this abatement would be the area under the line FE, namely the area FOE.
If emissions are to be restricted to level OE1, i.e., if abatement is to be done to the extent of
EE1, the cost of abatement would be area DE1E. The line FE reflects the engineering or
technological costs of abatement.
The line OC in the figure shows the marginal social cost of emission. These are the costs
borne by the society due to the emission. For example, suspended particulate matter (SPM)
laden air may aggravate respiratory diseases. The incidence of morbidity (sickness) may go
up and mortality may also increase as additional deaths are caused by it. There may also be
other costs: visibility may be reduced, leading to more accidents or closure of airports,
buildings may become dirtier, thus increasing the costs of maintenance and repainting,
property value may go down and so on. The line OC reflects these costs. In a sense, this is
what those who suffer from this pollution may be willing to pay to reduce the level of
pollution. Thus, if the pollution is to be restricted to the level OE1, the society should be
willing to pay an amount equal to the area CEE1B.
94
The third line OG shows the private cost of emission to the emitter herself. For example, if
there is an emission tax the rate of which increases linearly with the level of emission then
OG will represent the marginal tax rate. It is also possible that the emitter herself suffers
from the emission. This can happen, for example, if SPM emission by a plant clogs up its
own machines and reduces the efficiency of its production processes. In this case, the
polluter saves the abatement cost FOE by not doing any abatement but bears the cost OGE,
because of the emission OE. It is obvious that the polluter would minimize her costs by
abating up to level E1 so that the total costs borne would be equal to the area ODE.
By imposing a rising tax on emission we internalize the social cost of emission for the
emitter, i.e., these costs now become a part of, internal to, her profit and loss account. If the
level of taxes corresponds to line OC, then the social costs are completely internalized. If
tax rates correspond to OG, the social costs are only partially internalized. The level of
emission would depend on the extent to which costs are internalized. Thus, it would be
observed that
OE2 = Optimal level of emissions, when social costs are completely internalized.
OE1 = Emission if some costs are internalized.
OE = Emission when no costs are internalized.
From the point of view of valuation we should note the following:
If you observe OE, and take the area OFE as cost of abatement and hence as the value of
loss of air quality it may be an overestimate or an underestimate depending on whether the
area OCE is smaller or larger than the area OFE.
If you take OCE as the cost that may also be an overestimate (or underestimate).
What you really want to estimate is area ABD that is the loss to the society.
However, for this you need to know the optimal emission E2.
Ideally we should measure the social cost accompanying. Since this is often difficult to
measure, if not impossible, one often substitutes the abatement cost approach. As long as
the pollution level is at the optimal point when the marginal abatement cost equals marginal
social cost (PO) then it does not matter whether one uses abatement cost or social cost.
95
However, if the actual level of pollution is lower (higher) than the optimal, than the
marginal abatement cost will be higher (lower) than the marginal social cost.
Unfortunately, we often do not know what the optimal level is and thus we do not know if
the estimate is higher or lower than what it should be.
5.2.1 Urban Municipal Solid Waste Management
We have estimated the cost of uncollected urban municipal solid waste by abatement cost
method. Ideally, we should have estimated the social cost of uncollected solid waste. This
would have involved the following steps:
1 Assess the additional incidence of diseases and deaths due to uncollected waste.
2 Assess the economic cost of these additional diseases and deaths in terms of medical
expenditure, loss of income due to lost days of the patients and relatives etc taking
care of him, adjusting the cost for what is already included in the SNA.
3 Assess the loss in property values due to uncollected waste.
4 Assess subjective loss of welfare due to the poor quality of environment, for
example through willingness to pay surveys.
These require data and epidemiological studies to establish causality between pollution and
diseases and deaths, and studies to establish costs of illness and premature deaths. These
would take a long time. Abatement cost thus provides a practical alternative.
The methodology for the use of abatement cost to prepare adjusted accounts has been
described and demonstrated in chapter two. The estimates, however, can be improved in a
number of ways:
The estimates of waste generated can be improved by a larger sample size.
Also waste generated from restaurants, offices and shops other than in markets need
to be estimated and added to waste generated. Since we estimate uncollected waste
by subtracting collected waste from generated waste, this will increase the estimate
of uncollected waste.
We should also estimate the amount of waste collected for recycling by rag pickers
from disposal sites. This will reduce the volume of waste for landfill and
consequently the amount of land required for it. This will lower the cost of waste
disposal.
96
Finally, landfill sites assessment is required to estimate the waste receiving capacity
of the landfill sites. Also a more accurate assessment of the price of land can
improve the estimate of cost of waste disposal.
5.2.2 Industrial Air and Water Pollution
The costs of air and water pollution are also estimated using abatement cost. The limitation
of the use of abatement cost. As discussed for urban waste apply here also and the same
justification for its use.
While chapter three describes and demonstrates the use of abatement costs. The estimates
can be improved by the following:
We have used World Bank estimates of emissions. Measurements of actual
emissions by industries in Goa would improve the estimates. In any case Goa
Pollution Control Board should measure these on a regular basis.
Also, we have used World Bank estimates for abatement costs. While our survey has
collected some data on abatement costs, these should be collected for a number of
repeated samples over the year and emissions measured at the same time to arrive at
a satisfactory assessment of abatement cost functions. The same applies to treatment
costs of water effluents.
5.2.3 Forest of Goa
The accounts that we have presented for Goa forest have described forestry related stocks
and flows in terms of land area (under forest), physical volume (of timber and carbon) and
finally monetary values. In this way, we have tried to estimate the true value of economic
activity in the state of Goa.
We recognize that the results should be viewed with caution due to limitations placed by
availability of data. As a result, using suitable conversion factors derives the volume lost.
The data used here is from the publication of FSI’s 2003 report and using all India value
from previous research. Nevertheless, the study has demonstrated that forest resource
accounting is feasible in India at a disaggregate level using a ‘top-down’ approach. There is
undervaluation of NTFPs, timber, and fuel wood. In fact, forests have several other services
such as biodiversity values, opportunities for eco-tourism, impact on water resources, flood
prevention, and drought control services and we have calculated some of them on the basis
of all India value from the previous studies.
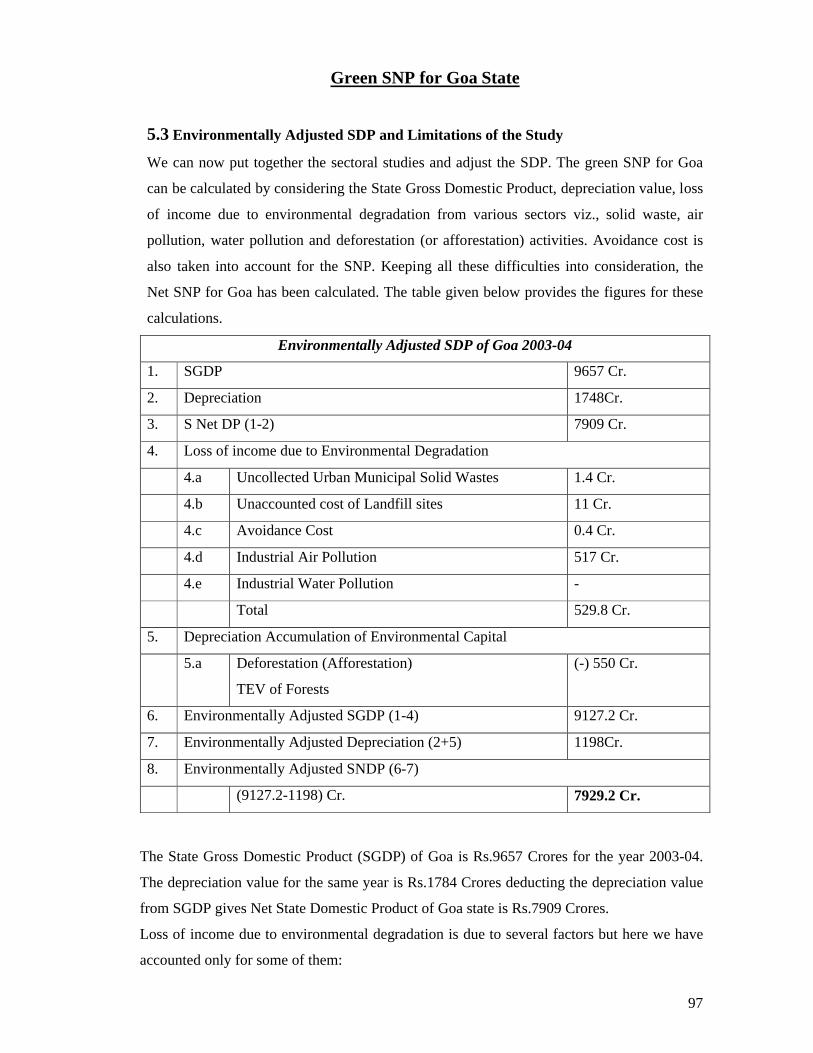
97
Green SNP for Goa State
5.3 Environmentally Adjusted SDP and Limitations of the Study
We can now put together the sectoral studies and adjust the SDP. The green SNP for Goa
can be calculated by considering the State Gross Domestic Product, depreciation value, loss
of income due to environmental degradation from various sectors viz., solid waste, air
pollution, water pollution and deforestation (or afforestation) activities. Avoidance cost is
also taken into account for the SNP. Keeping all these difficulties into consideration, the
Net SNP for Goa has been calculated. The table given below provides the figures for these
calculations.
Environmentally Adjusted SDP of Goa 2003-04
1. SGDP 9657 Cr.
2. Depreciation 1748Cr.
3. S Net DP (1-2) 7909 Cr.
4. Loss of income due to Environmental Degradation
4.a Uncollected Urban Municipal Solid Wastes 1.4 Cr.
4.b Unaccounted cost of Landfill sites 11 Cr.
4.c Avoidance Cost 0.4 Cr.
4.d Industrial Air Pollution 517 Cr.
4.e Industrial Water Pollution -
Total 529.8 Cr.
5. Depreciation Accumulation of Environmental Capital
5.a Deforestation (Afforestation)
TEV of Forests
(-) 550 Cr.
6. Environmentally Adjusted SGDP (1-4) 9127.2 Cr.
7. Environmentally Adjusted Depreciation (2+5) 1198Cr.
8. Environmentally Adjusted SNDP (6-7)
(9127.2-1198) Cr. 7929.2 Cr.
The State Gross Domestic Product (SGDP) of Goa is Rs.9657 Crores for the year 2003-04.
The depreciation value for the same year is Rs.1784 Crores deducting the depreciation value
from SGDP gives Net State Domestic Product of Goa state is Rs.7909 Crores.
Loss of income due to environmental degradation is due to several factors but here we have
accounted only for some of them:
98
a) Uncollected urban municipal solid wastes causing loss to environment and that are Rs.1.4
Crores.
b) The environmental degradation due landfill sites that is unaccounted in the national
accounts is Rs.11 Crores.
c) Avoidance cost for the solid waste management is 0.4 Crores and
d) Environmental degradation causing loss of income due to industrial air pollution is
Rs.517 Crores.
e) Afforestation activities are going in Goa state and that has led to increase in
environmental capital and therefore the contribution due forest is Rs.550 Crores.
Environmentally adjusted SGDP: - State Gross Domestic product – Loss of income due to
environmental degradation (1-4).
Environmentally adjusted depreciation is sum of 2 and 5. But here the forest cover is
increasing, so the environmentally adjusted depreciation is 2+ (-5).
The Environmentally adjusted SNDP (6-7) comes out to be Rs.7929.2 Crores.
5.4 Limitations of the Study
The study has demonstrated how environmentally SGDP and SNDP can be estimated.
Given the limited resources, the emphasis has been on illustrating the methodology. The
various surveys sample have also shown what kind of data needs to be collected and that the
needed data are collectible. The various limitations of the study and how they can be
overcome are described below:
5.4.1 Urban Municipal Solid Waste
The estimates of waste generated can be improved by a larger sample size. Also waste
generated from restaurants, offices and shops other than in markets need to be estimated and
added to waste generated. Since we estimate uncollected waste by subtracting collected
waste from generated waste, this will increase the estimate of uncollected waste.
We should also estimate the amount of waste collected for recycling by rag pickers from
disposal sites. This will reduce the volume of waste for landfill and consequently the
amount of land required for it. This will lower the cost of waste disposal.
Finally, landfill sites assessment is required to estimate the waste receiving capacity of the
landfill sites. Also a more accurate assessment of the price of land can improve the estimate
of cost of waste disposal.
99
5.4.2 Industrial Air and water Pollution
We have used World Bank estimates of emissions. Measurements of actual emissions by
industries in Goa would improve the estimates. In any case Goa Pollution Control Board
should measure these on a regular basis.
Also, we have used World Bank estimates for abatement costs. While our survey has
collected some data on abatement costs, these should be collected for a number of repeated
samples over the year and emissions measured at the same time to arrive at a satisfactory
assessment of abatement cost functions. The same applies to treatment costs of water
effluents.
5.4.3 Forest of Goa
The accounts that we have presented for Goa forest have described forestry related stocks
and flows in terms of land area (under forest), physical volume (of timber and carbon) and
finally monetary values. In this way, we have tried to estimate the true value of economic
activity in the state of Goa.
If we look closely into the Total Economic value of the forests of Goa, it gives ambiguous
values, as eco-tourism in Goa is not only due to forests but it has got several factors like,
sea, beaches, and historical monuments.
Secondly, the watershed benefits and carbon sink are potential of forest and are not direct
benefits and in case of fodder only 30% (approx.) of it comes from the forest.
We recognize that the results should be viewed with caution due to limitations placed by
availability of data. As a result, using suitable conversion factors derives the volume lost.
The data used here is from the publication of FSI’s 2003 report and using all India value
from previous research. Nevertheless, the study has demonstrated that forest resource
accounting is feasible in India at a disaggregate level using a ‘top-down’ approach. There is
undervaluation of NTFPs, timber, and fuel wood. In fact, forests have several other services
such as biodiversity values, opportunities for eco-tourism, impact on water resources, flood
prevention, and drought control services and we have calculated some of them on the basis
of all India value from the previous studies.
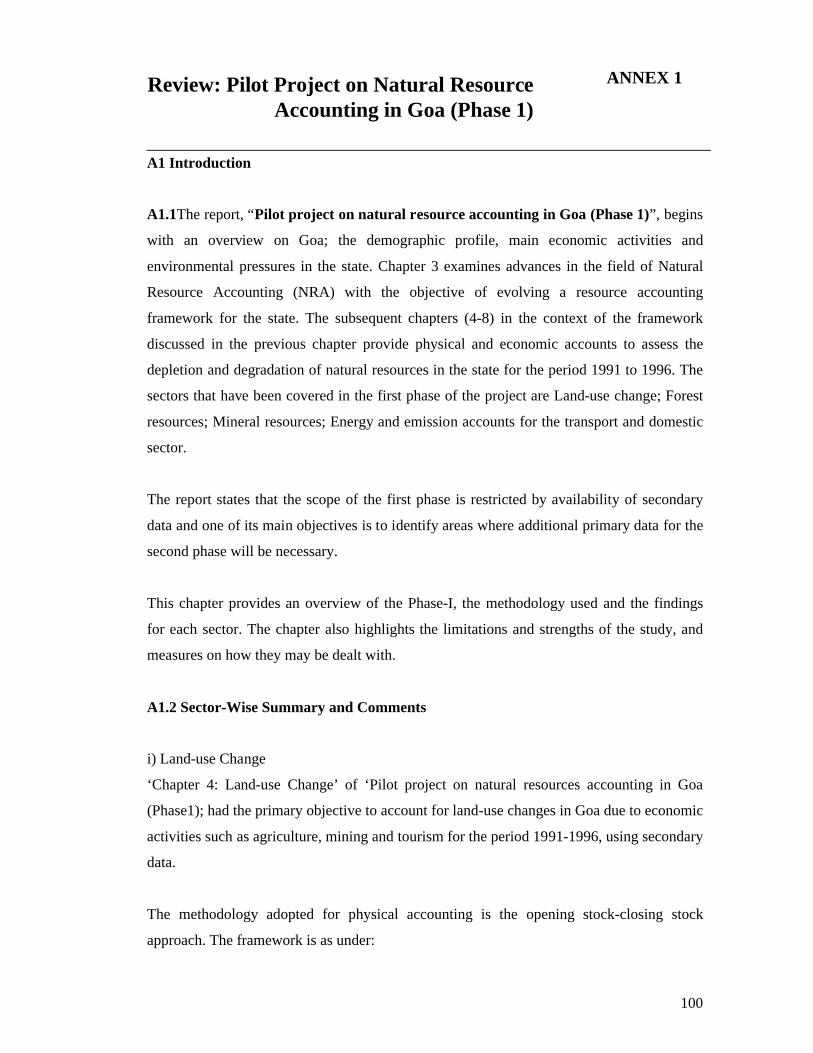
100
ANNEX 1
A1 Introduction
A1.1The report, “Pilot project on natural resource accounting in Goa (Phase 1)”, begins
with an overview on Goa; the demographic profile, main economic activities and
environmental pressures in the state. Chapter 3 examines advances in the field of Natural
Resource Accounting (NRA) with the objective of evolving a resource accounting
framework for the state. The subsequent chapters (4-8) in the context of the framework
discussed in the previous chapter provide physical and economic accounts to assess the
depletion and degradation of natural resources in the state for the period 1991 to 1996. The
sectors that have been covered in the first phase of the project are Land-use change; Forest
resources; Mineral resources; Energy and emission accounts for the transport and domestic
sector.
The report states that the scope of the first phase is restricted by availability of secondary
data and one of its main objectives is to identify areas where additional primary data for the
second phase will be necessary.
This chapter provides an overview of the Phase-I, the methodology used and the findings
for each sector. The chapter also highlights the limitations and strengths of the study, and
measures on how they may be dealt with.
A1.2 Sector-Wise Summary and Comments
i) Land-use Change
‘Chapter 4: Land-use Change’ of ‘Pilot project on natural resources accounting in Goa
(Phase1); had the primary objective to account for land-use changes in Goa due to economic
activities such as agriculture, mining and tourism for the period 1991-1996, using secondary
data.
The methodology adopted for physical accounting is the opening stock-closing stock
approach. The framework is as under:
Review: Pilot Project on Natural Resource Accounting in Goa (Phase 1)
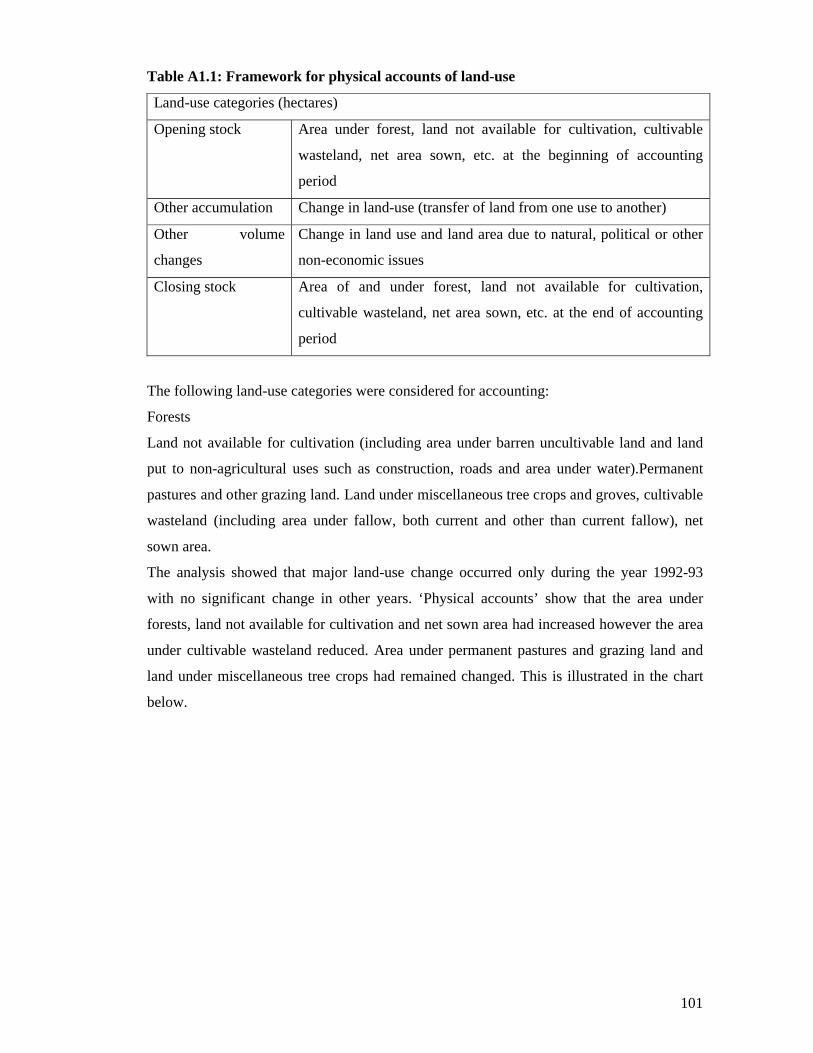
101
Table A1.1: Framework for physical accounts of land-use
Land-use categories (hectares)
Opening stock Area under forest, land not available for cultivation, cultivable
wasteland, net area sown, etc. at the beginning of accounting
period
Other accumulation Change in land-use (transfer of land from one use to another)
Other volume
changes
Change in land use and land area due to natural, political or other
non-economic issues
Closing stock Area of and under forest, land not available for cultivation,
cultivable wasteland, net area sown, etc. at the end of accounting
period
The following land-use categories were considered for accounting:
Forests
Land not available for cultivation (including area under barren uncultivable land and land
put to non-agricultural uses such as construction, roads and area under water).Permanent
pastures and other grazing land. Land under miscellaneous tree crops and groves, cultivable
wasteland (including area under fallow, both current and other than current fallow), net
sown area.
The analysis showed that major land-use change occurred only during the year 1992-93
with no significant change in other years. ‘Physical accounts’ show that the area under
forests, land not available for cultivation and net sown area had increased however the area
under cultivable wasteland reduced. Area under permanent pastures and grazing land and
land under miscellaneous tree crops had remained changed. This is illustrated in the chart
below.
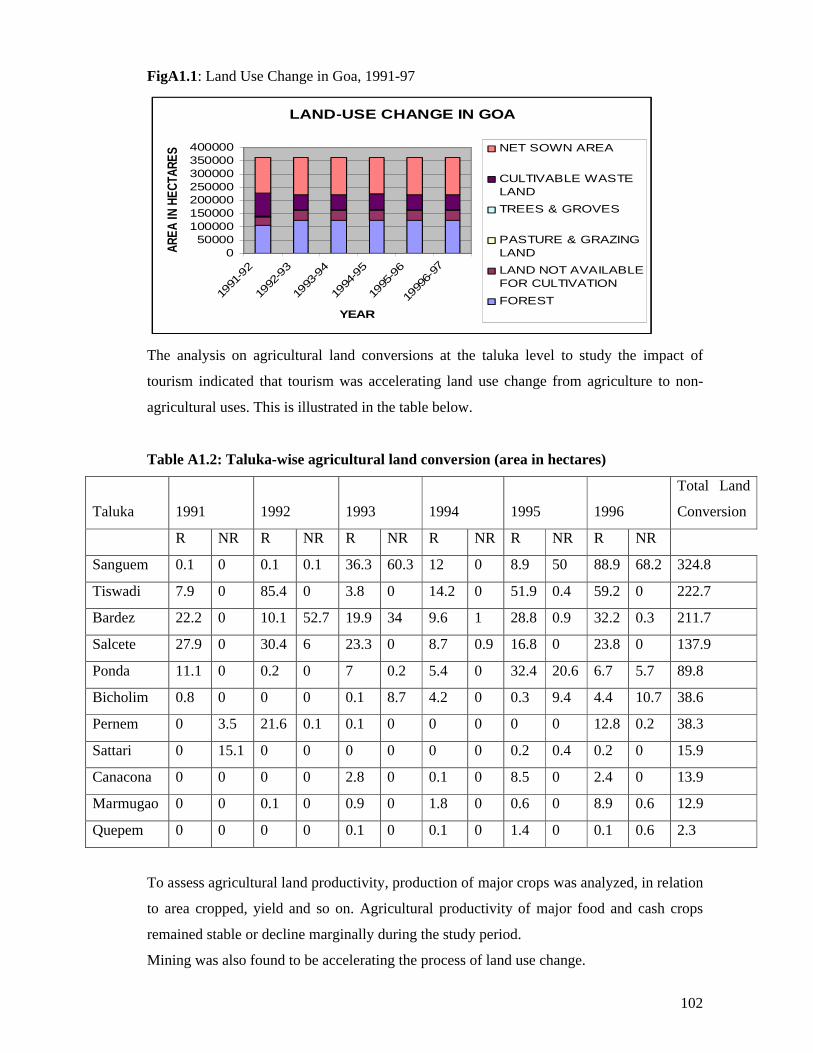
102
FigA1.1: Land Use Change in Goa, 1991-97
LAND-USE CHANGE IN GOA
050000
100000150000200000250000300000350000400000
1991
-92
1992
-93
1993
-94
1994
-95
1995
-96
1999
6-97
YEAR
AREA
IN H
ECTA
RES NET SOWN AREA
CULTIVABLE WASTELAND
TREES & GROVES
PASTURE & GRAZINGLAND
LAND NOT AVAILABLEFOR CULTIVATION
FOREST
The analysis on agricultural land conversions at the taluka level to study the impact of
tourism indicated that tourism was accelerating land use change from agriculture to non-
agricultural uses. This is illustrated in the table below.
Table A1.2: Taluka-wise agricultural land conversion (area in hectares)
Taluka 1991 1992 1993 1994 1995 1996
Total Land
Conversion
R NR R NR R NR R NR R NR R NR
Sanguem 0.1 0 0.1 0.1 36.3 60.3 12 0 8.9 50 88.9 68.2 324.8
Tiswadi 7.9 0 85.4 0 3.8 0 14.2 0 51.9 0.4 59.2 0 222.7
Bardez 22.2 0 10.1 52.7 19.9 34 9.6 1 28.8 0.9 32.2 0.3 211.7
Salcete 27.9 0 30.4 6 23.3 0 8.7 0.9 16.8 0 23.8 0 137.9
Ponda 11.1 0 0.2 0 7 0.2 5.4 0 32.4 20.6 6.7 5.7 89.8
Bicholim 0.8 0 0 0 0.1 8.7 4.2 0 0.3 9.4 4.4 10.7 38.6
Pernem 0 3.5 21.6 0.1 0.1 0 0 0 0 0 12.8 0.2 38.3
Sattari 0 15.1 0 0 0 0 0 0 0.2 0.4 0.2 0 15.9
Canacona 0 0 0 0 2.8 0 0.1 0 8.5 0 2.4 0 13.9
Marmugao 0 0 0.1 0 0.9 0 1.8 0 0.6 0 8.9 0.6 12.9
Quepem 0 0 0 0 0.1 0 0.1 0 1.4 0 0.1 0.6 2.3
To assess agricultural land productivity, production of major crops was analyzed, in relation
to area cropped, yield and so on. Agricultural productivity of major food and cash crops
remained stable or decline marginally during the study period.
Mining was also found to be accelerating the process of land use change.
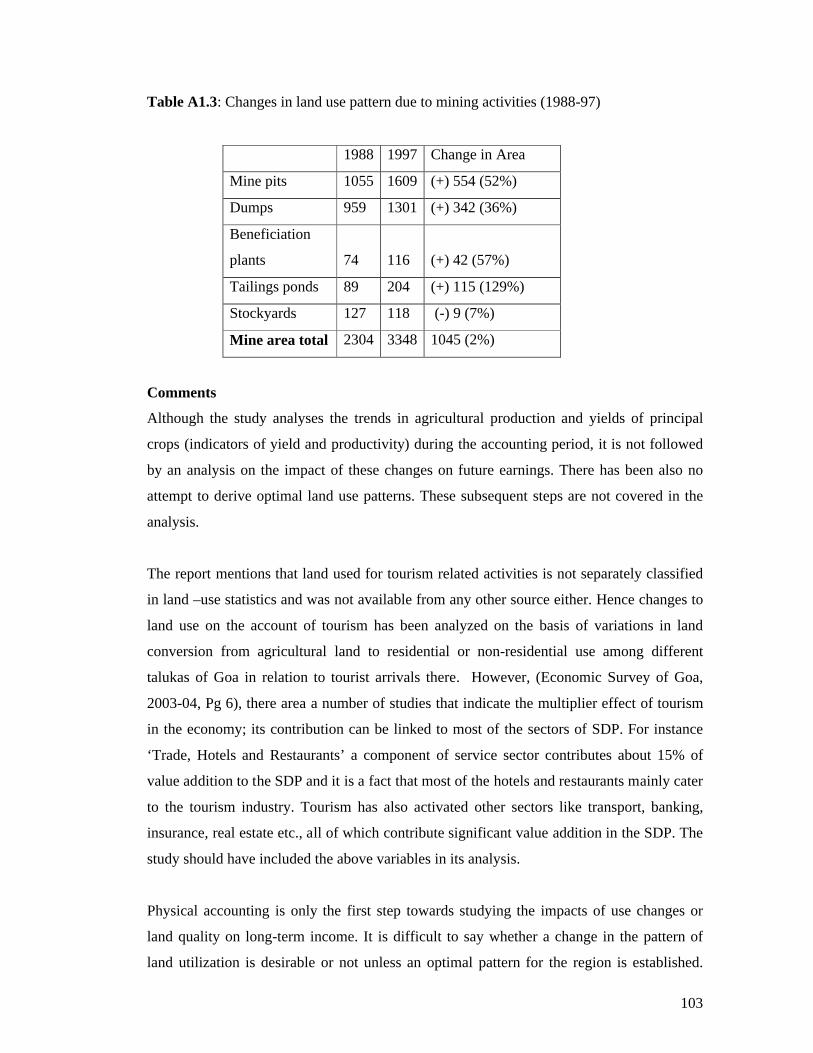
103
Table A1.3: Changes in land use pattern due to mining activities (1988-97)
1988 1997 Change in Area
Mine pits 1055 1609 (+) 554 (52%)
Dumps 959 1301 (+) 342 (36%)
Beneficiation
plants 74 116 (+) 42 (57%)
Tailings ponds 89 204 (+) 115 (129%)
Stockyards 127 118 (-) 9 (7%)
Mine area total 2304 3348 1045 (2%)
Comments
Although the study analyses the trends in agricultural production and yields of principal
crops (indicators of yield and productivity) during the accounting period, it is not followed
by an analysis on the impact of these changes on future earnings. There has been also no
attempt to derive optimal land use patterns. These subsequent steps are not covered in the
analysis.
The report mentions that land used for tourism related activities is not separately classified
in land –use statistics and was not available from any other source either. Hence changes to
land use on the account of tourism has been analyzed on the basis of variations in land
conversion from agricultural land to residential or non-residential use among different
talukas of Goa in relation to tourist arrivals there. However, (Economic Survey of Goa,
2003-04, Pg 6), there area a number of studies that indicate the multiplier effect of tourism
in the economy; its contribution can be linked to most of the sectors of SDP. For instance
‘Trade, Hotels and Restaurants’ a component of service sector contributes about 15% of
value addition to the SDP and it is a fact that most of the hotels and restaurants mainly cater
to the tourism industry. Tourism has also activated other sectors like transport, banking,
insurance, real estate etc., all of which contribute significant value addition in the SDP. The
study should have included the above variables in its analysis.
Physical accounting is only the first step towards studying the impacts of use changes or
land quality on long-term income. It is difficult to say whether a change in the pattern of
land utilization is desirable or not unless an optimal pattern for the region is established.
104
This has not been dealt with in this study. In the absence of such knowledge, a change in the
land-use pattern per se cannot be integrated with natural resource accounting.
The framework adopted in the Phase1 report rests on the premise that land quality will
change (improve or deteriorate) due to continuous use or change of use. The study however
does not analyze the changes in land quality in monetary terms (Monetary Accounting).
In order to value land quality changes, damage cost function or production function
approach could have been used or alternatively the cost of restoration could have been
determined. Hence, benchmarking soil for major land-use types in different agro-ecological
regions of India based on primary field investigations is essential to arrive at a generally
acceptable norm for each of the land quality parameters. These in turn, should be regularly
monitored to capture changes over time. Further, remotely sensed data could be used to map
land-use changes, especially if the accounting period is sufficiently long. Satellite images
from Indian remote sensing satellites are readily available for the past 15 years. GIS tools
could be used to analyze the spatial differences in land-use in different periods.
ii) Forest Resources
‘Chapter 5: Forestry Resources’ of ‘Pilot project on natural resources accounting in Goa
(Phase1); had the primary objective to prepare physical and monetary accounts (both assets
and income) to determine the extent of depletion of forest reserves due to
production/consumption of timber and fuelwood in Goa. The chapter begins with a current
system of forest resource accounting and prepares the physical and monetary accounts for
the forest asset in Goa. The value of depletion is estimated and adjusted against the reported
value added by the forestry sector.
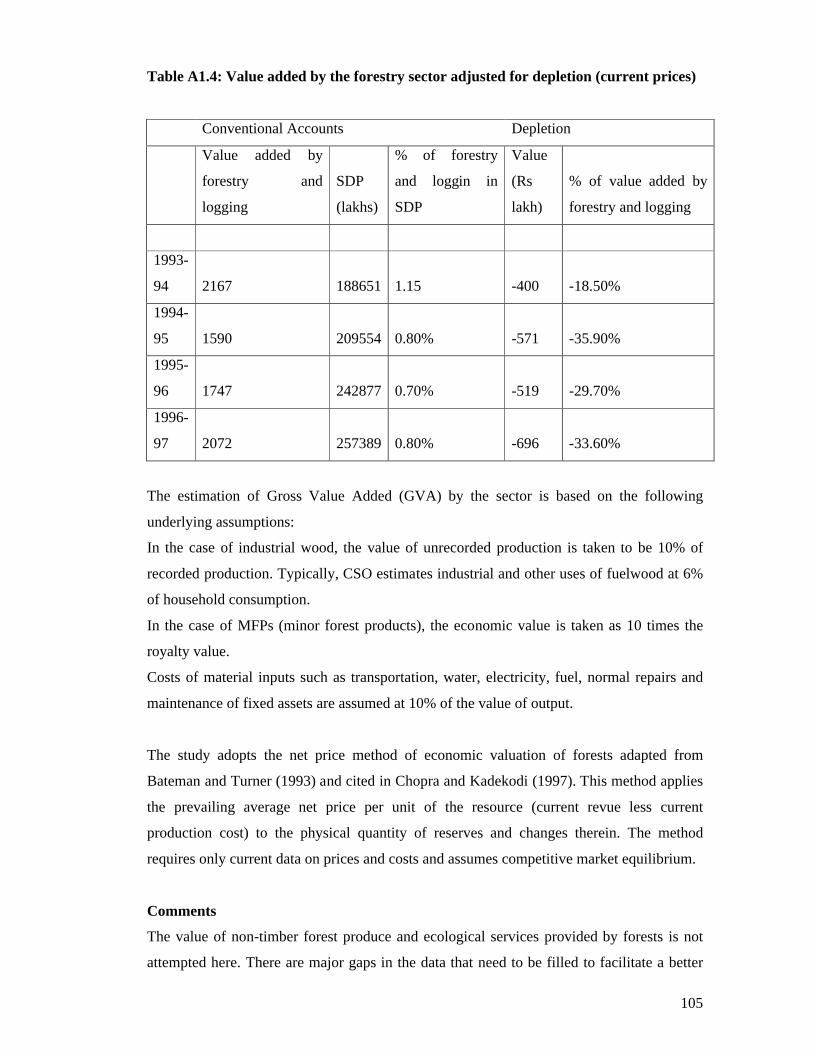
105
Table A1.4: Value added by the forestry sector adjusted for depletion (current prices)
Conventional Accounts Depletion
Value added by
forestry and
logging
SDP
(lakhs)
% of forestry
and loggin in
SDP
Value
(Rs
lakh)
% of value added by
forestry and logging
1993-
94 2167 188651 1.15 -400 -18.50%
1994-
95 1590 209554 0.80% -571 -35.90%
1995-
96 1747 242877 0.70% -519 -29.70%
1996-
97 2072 257389 0.80% -696 -33.60%
The estimation of Gross Value Added (GVA) by the sector is based on the following
underlying assumptions:
In the case of industrial wood, the value of unrecorded production is taken to be 10% of
recorded production. Typically, CSO estimates industrial and other uses of fuelwood at 6%
of household consumption.
In the case of MFPs (minor forest products), the economic value is taken as 10 times the
royalty value.
Costs of material inputs such as transportation, water, electricity, fuel, normal repairs and
maintenance of fixed assets are assumed at 10% of the value of output.
The study adopts the net price method of economic valuation of forests adapted from
Bateman and Turner (1993) and cited in Chopra and Kadekodi (1997). This method applies
the prevailing average net price per unit of the resource (current revue less current
production cost) to the physical quantity of reserves and changes therein. The method
requires only current data on prices and costs and assumes competitive market equilibrium.
Comments
The value of non-timber forest produce and ecological services provided by forests is not
attempted here. There are major gaps in the data that need to be filled to facilitate a better
106
understanding of the services provided by forest and their contribution to national income
and wealth.
As CSO itself notes, there are several discrepancies in the current system of accounting for
income from the forestry sector. It does not distinguish among the extensive variety of tree
species and timber quality. There is no proper recording of the output of timber, fuel-wood,
pulpwood etc. from the privately owned forests. Data for most minor forest products is
totally inadequate. The coverage of the conventional accounts is inadequate as it partially
covers forest products and totally ignores intangible services provided by forests. The
system mainly accounts for commercial wood and fuel-wood at the market prices and some
minor forest products based on notional values. The sustainability of extraction of forest
products is not taken into account and hence there is no provision for forest depreciation,
which results in a long-term loss in the productive capacity of forests.
The study accounts for public and private forests and does not distinguish between forest
resources that have a market and those, which don’t have a market. This distinction is of
importance as it suggests which valuation tool maybe used to identify the value of a forest
good. All forests are treated as non-produced economic assets. There has been no attempt to
value forest services, which provide indirect use value, bequest value, existence value and
so on.
Physical and monetary balances should be ideally disaggregated by type of forest (native or
planted) and density to provide a detailed description of change in forest reserves. Further,
minor forest products such as bamboo and cane and other services provided by forests are
not accounted.
iii) Mineral Resources
Chapter 6: ‘Mineral Resources’ of ‘Pilot project on natural resources accounting in Goa
(Phase 1)’ aims at estimating the cost of iron ore depletion in the state to derive the
contribution of the sector to SDP, net of this cost. The cost of depletion represents the
depreciation in stock of an exhaustible natural resource. This in turn has been estimated as
the amount that needs to be set aside or reinvested in other forms of capital assets capable of
providing at least the same economic benefits to compensate for the current consumption of
exhaustible natural assets.
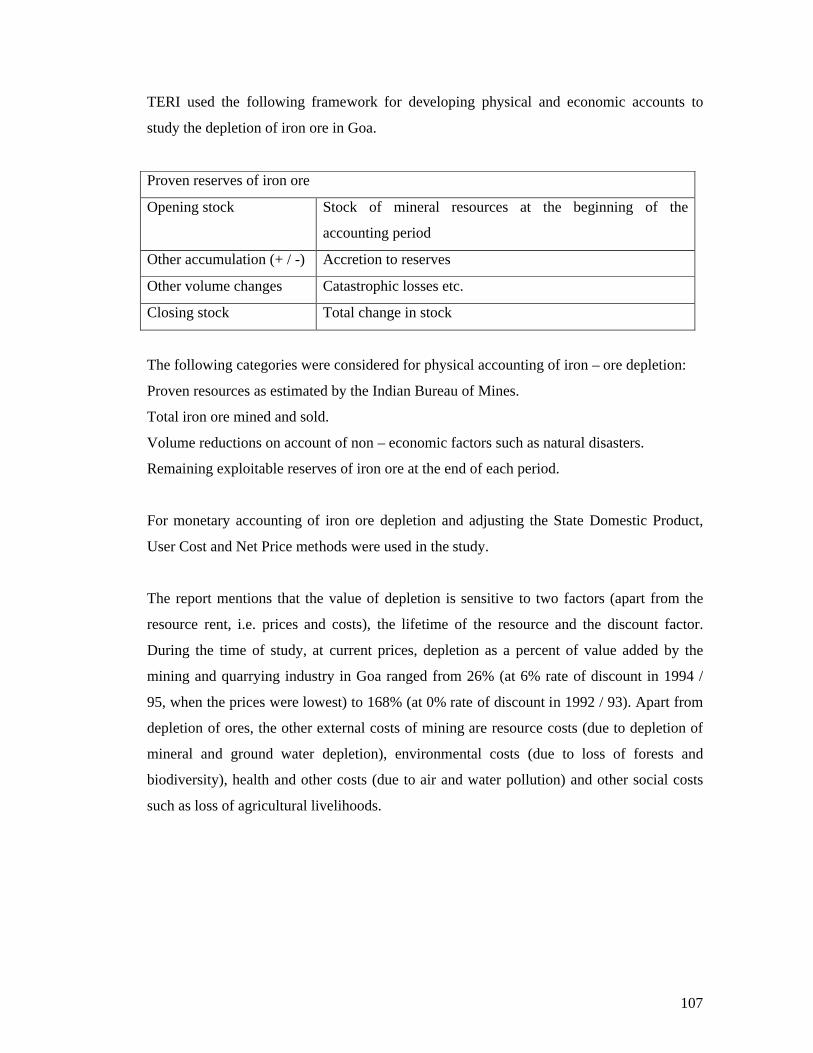
107
TERI used the following framework for developing physical and economic accounts to
study the depletion of iron ore in Goa.
Proven reserves of iron ore
Opening stock Stock of mineral resources at the beginning of the
accounting period
Other accumulation (+ / -) Accretion to reserves
Other volume changes Catastrophic losses etc.
Closing stock Total change in stock
The following categories were considered for physical accounting of iron – ore depletion:
Proven resources as estimated by the Indian Bureau of Mines.
Total iron ore mined and sold.
Volume reductions on account of non – economic factors such as natural disasters.
Remaining exploitable reserves of iron ore at the end of each period.
For monetary accounting of iron ore depletion and adjusting the State Domestic Product,
User Cost and Net Price methods were used in the study.
The report mentions that the value of depletion is sensitive to two factors (apart from the
resource rent, i.e. prices and costs), the lifetime of the resource and the discount factor.
During the time of study, at current prices, depletion as a percent of value added by the
mining and quarrying industry in Goa ranged from 26% (at 6% rate of discount in 1994 /
95, when the prices were lowest) to 168% (at 0% rate of discount in 1992 / 93). Apart from
depletion of ores, the other external costs of mining are resource costs (due to depletion of
mineral and ground water depletion), environmental costs (due to loss of forests and
biodiversity), health and other costs (due to air and water pollution) and other social costs
such as loss of agricultural livelihoods.
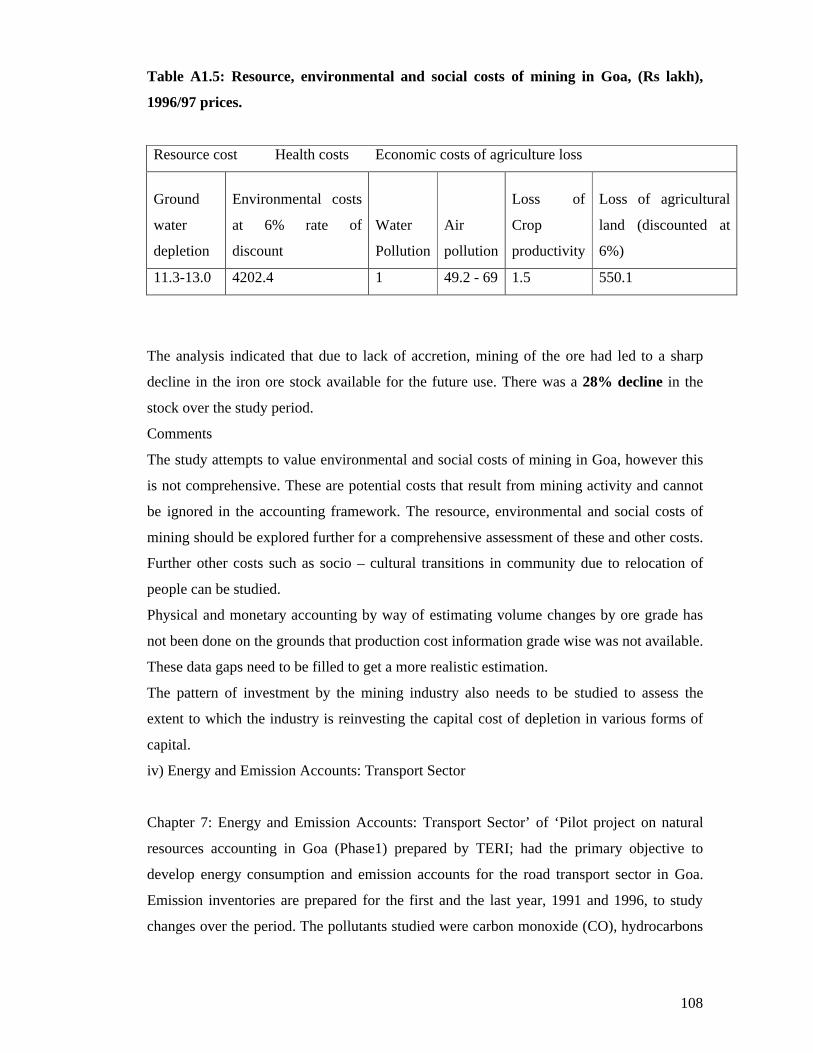
108
Table A1.5: Resource, environmental and social costs of mining in Goa, (Rs lakh),
1996/97 prices.
Resource cost Health costs Economic costs of agriculture loss
Ground
water
depletion
Environmental costs
at 6% rate of
discount
Water
Pollution
Air
pollution
Loss of
Crop
productivity
Loss of agricultural
land (discounted at
6%)
11.3-13.0 4202.4 1 49.2 - 69 1.5 550.1
The analysis indicated that due to lack of accretion, mining of the ore had led to a sharp
decline in the iron ore stock available for the future use. There was a 28% decline in the
stock over the study period.
Comments
The study attempts to value environmental and social costs of mining in Goa, however this
is not comprehensive. These are potential costs that result from mining activity and cannot
be ignored in the accounting framework. The resource, environmental and social costs of
mining should be explored further for a comprehensive assessment of these and other costs.
Further other costs such as socio – cultural transitions in community due to relocation of
people can be studied.
Physical and monetary accounting by way of estimating volume changes by ore grade has
not been done on the grounds that production cost information grade wise was not available.
These data gaps need to be filled to get a more realistic estimation.
The pattern of investment by the mining industry also needs to be studied to assess the
extent to which the industry is reinvesting the capital cost of depletion in various forms of
capital.
iv) Energy and Emission Accounts: Transport Sector
Chapter 7: Energy and Emission Accounts: Transport Sector’ of ‘Pilot project on natural
resources accounting in Goa (Phase1) prepared by TERI; had the primary objective to
develop energy consumption and emission accounts for the road transport sector in Goa.
Emission inventories are prepared for the first and the last year, 1991 and 1996, to study
changes over the period. The pollutants studied were carbon monoxide (CO), hydrocarbons
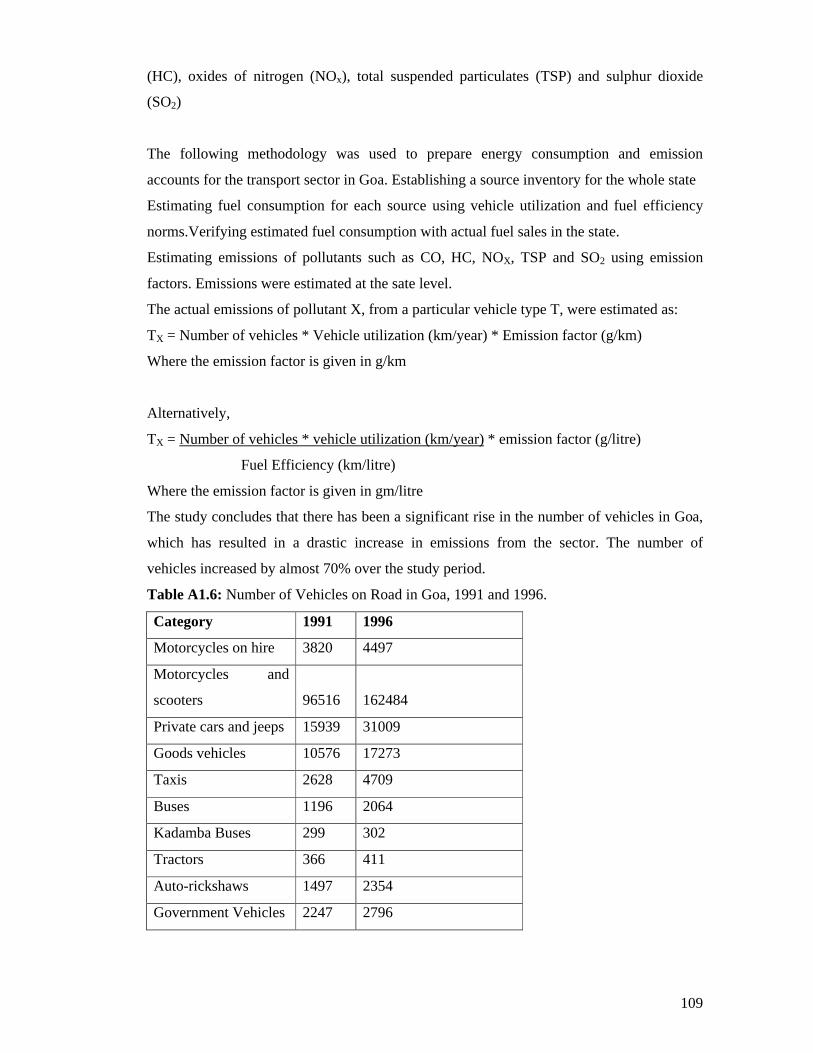
109
(HC), oxides of nitrogen (NOx), total suspended particulates (TSP) and sulphur dioxide
(SO2)
The following methodology was used to prepare energy consumption and emission
accounts for the transport sector in Goa. Establishing a source inventory for the whole state
Estimating fuel consumption for each source using vehicle utilization and fuel efficiency
norms.Verifying estimated fuel consumption with actual fuel sales in the state.
Estimating emissions of pollutants such as CO, HC, NOX, TSP and SO2 using emission
factors. Emissions were estimated at the sate level.
The actual emissions of pollutant X, from a particular vehicle type T, were estimated as:
TX = Number of vehicles * Vehicle utilization (km/year) * Emission factor (g/km)
Where the emission factor is given in g/km
Alternatively,
TX = Number of vehicles * vehicle utilization (km/year) * emission factor (g/litre)
Fuel Efficiency (km/litre)
Where the emission factor is given in gm/litre
The study concludes that there has been a significant rise in the number of vehicles in Goa,
which has resulted in a drastic increase in emissions from the sector. The number of
vehicles increased by almost 70% over the study period.
Table A1.6: Number of Vehicles on Road in Goa, 1991 and 1996.
Category 1991 1996
Motorcycles on hire 3820 4497
Motorcycles and
scooters 96516 162484
Private cars and jeeps 15939 31009
Goods vehicles 10576 17273
Taxis 2628 4709
Buses 1196 2064
Kadamba Buses 299 302
Tractors 366 411
Auto-rickshaws 1497 2354
Government Vehicles 2247 2796
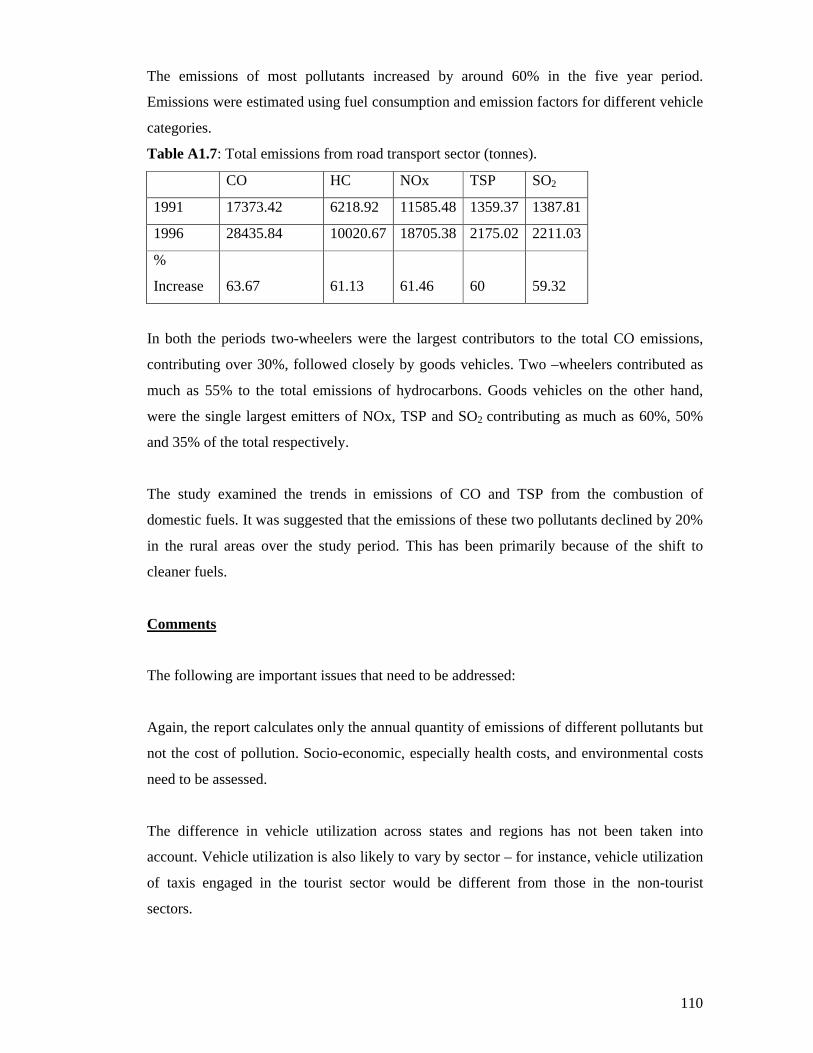
110
The emissions of most pollutants increased by around 60% in the five year period.
Emissions were estimated using fuel consumption and emission factors for different vehicle
categories.
Table A1.7: Total emissions from road transport sector (tonnes).
CO HC NOx TSP SO2
1991 17373.42 6218.92 11585.48 1359.37 1387.81
1996 28435.84 10020.67 18705.38 2175.02 2211.03
%
Increase 63.67 61.13 61.46 60 59.32
In both the periods two-wheelers were the largest contributors to the total CO emissions,
contributing over 30%, followed closely by goods vehicles. Two –wheelers contributed as
much as 55% to the total emissions of hydrocarbons. Goods vehicles on the other hand,
were the single largest emitters of NOx, TSP and SO2 contributing as much as 60%, 50%
and 35% of the total respectively.
The study examined the trends in emissions of CO and TSP from the combustion of
domestic fuels. It was suggested that the emissions of these two pollutants declined by 20%
in the rural areas over the study period. This has been primarily because of the shift to
cleaner fuels.
Comments
The following are important issues that need to be addressed:
Again, the report calculates only the annual quantity of emissions of different pollutants but
not the cost of pollution. Socio-economic, especially health costs, and environmental costs
need to be assessed.
The difference in vehicle utilization across states and regions has not been taken into
account. Vehicle utilization is also likely to vary by sector – for instance, vehicle utilization
of taxis engaged in the tourist sector would be different from those in the non-tourist
sectors.
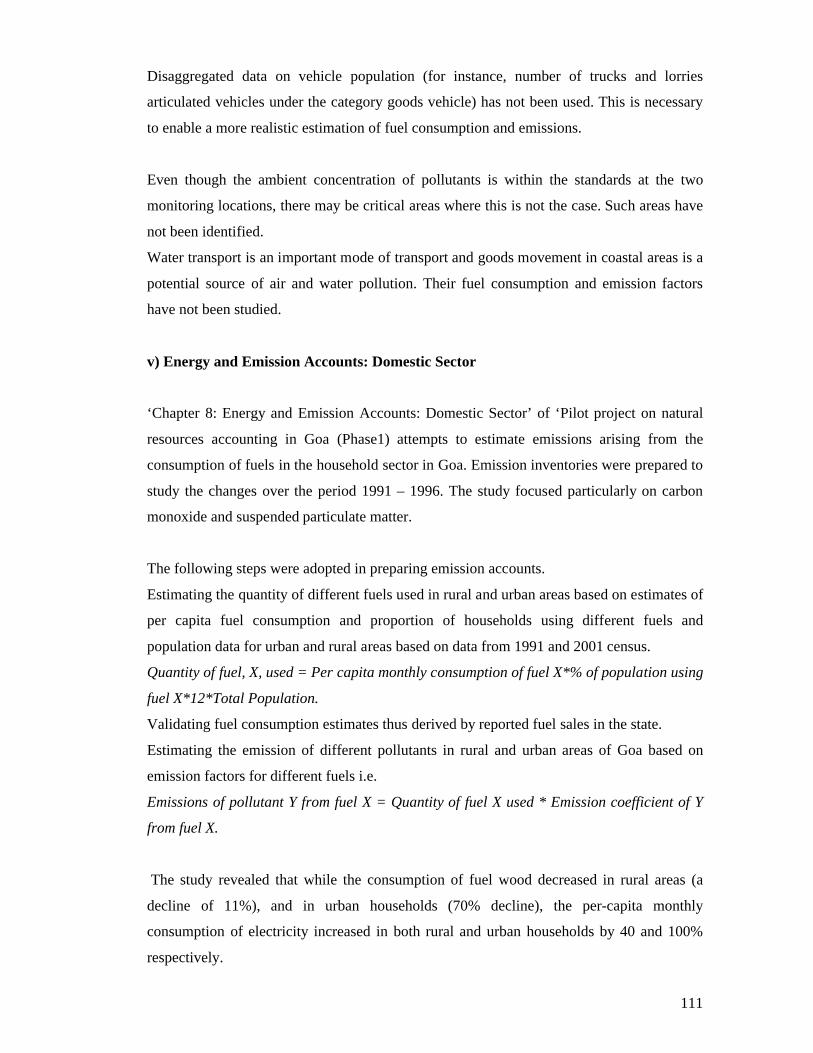
111
Disaggregated data on vehicle population (for instance, number of trucks and lorries
articulated vehicles under the category goods vehicle) has not been used. This is necessary
to enable a more realistic estimation of fuel consumption and emissions.
Even though the ambient concentration of pollutants is within the standards at the two
monitoring locations, there may be critical areas where this is not the case. Such areas have
not been identified.
Water transport is an important mode of transport and goods movement in coastal areas is a
potential source of air and water pollution. Their fuel consumption and emission factors
have not been studied.
v) Energy and Emission Accounts: Domestic Sector
‘Chapter 8: Energy and Emission Accounts: Domestic Sector’ of ‘Pilot project on natural
resources accounting in Goa (Phase1) attempts to estimate emissions arising from the
consumption of fuels in the household sector in Goa. Emission inventories were prepared to
study the changes over the period 1991 – 1996. The study focused particularly on carbon
monoxide and suspended particulate matter.
The following steps were adopted in preparing emission accounts.
Estimating the quantity of different fuels used in rural and urban areas based on estimates of
per capita fuel consumption and proportion of households using different fuels and
population data for urban and rural areas based on data from 1991 and 2001 census.
Quantity of fuel, X, used = Per capita monthly consumption of fuel X*% of population using
fuel X*12*Total Population.
Validating fuel consumption estimates thus derived by reported fuel sales in the state.
Estimating the emission of different pollutants in rural and urban areas of Goa based on
emission factors for different fuels i.e.
Emissions of pollutant Y from fuel X = Quantity of fuel X used * Emission coefficient of Y
from fuel X.
The study revealed that while the consumption of fuel wood decreased in rural areas (a
decline of 11%), and in urban households (70% decline), the per-capita monthly
consumption of electricity increased in both rural and urban households by 40 and 100%
respectively.
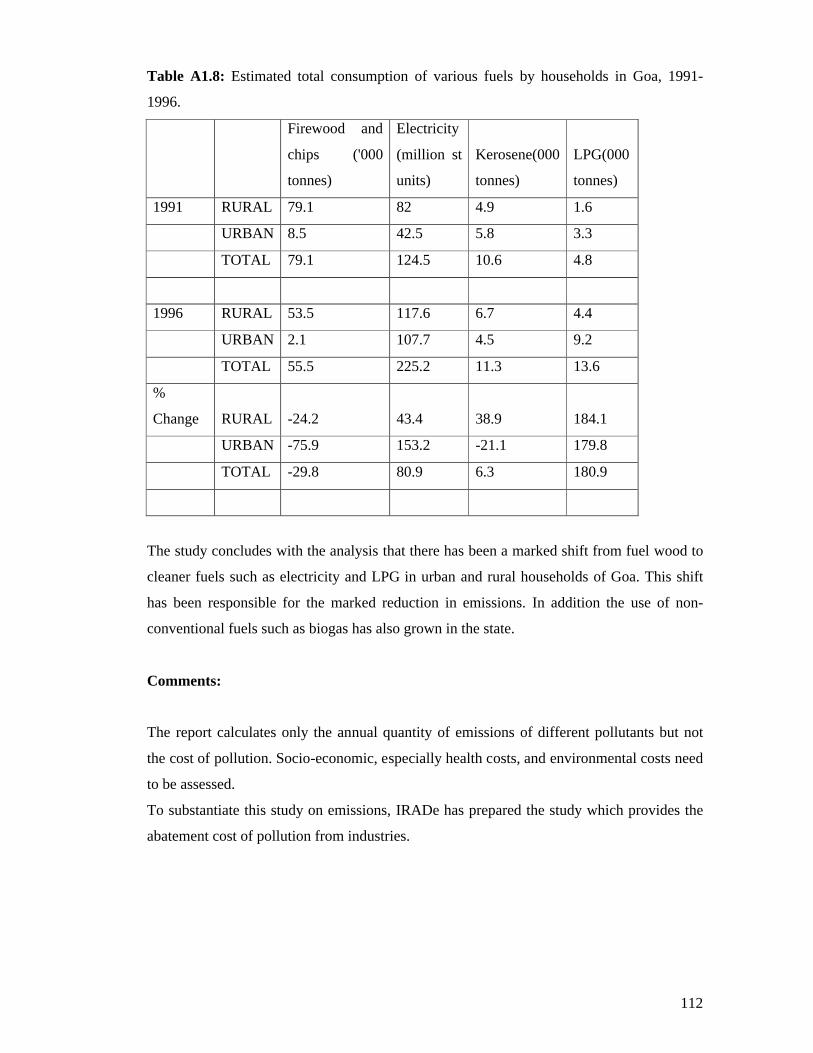
112
Table A1.8: Estimated total consumption of various fuels by households in Goa, 1991-
1996.
Firewood and
chips ('000
tonnes)
Electricity
(million st
units)
Kerosene(000
tonnes)
LPG(000
tonnes)
1991 RURAL 79.1 82 4.9 1.6
URBAN 8.5 42.5 5.8 3.3
TOTAL 79.1 124.5 10.6 4.8
1996 RURAL 53.5 117.6 6.7 4.4
URBAN 2.1 107.7 4.5 9.2
TOTAL 55.5 225.2 11.3 13.6
%
Change RURAL -24.2 43.4 38.9 184.1
URBAN -75.9 153.2 -21.1 179.8
TOTAL -29.8 80.9 6.3 180.9
The study concludes with the analysis that there has been a marked shift from fuel wood to
cleaner fuels such as electricity and LPG in urban and rural households of Goa. This shift
has been responsible for the marked reduction in emissions. In addition the use of non-
conventional fuels such as biogas has also grown in the state.
Comments:
The report calculates only the annual quantity of emissions of different pollutants but not
the cost of pollution. Socio-economic, especially health costs, and environmental costs need
to be assessed.
To substantiate this study on emissions, IRADe has prepared the study which provides the
abatement cost of pollution from industries.
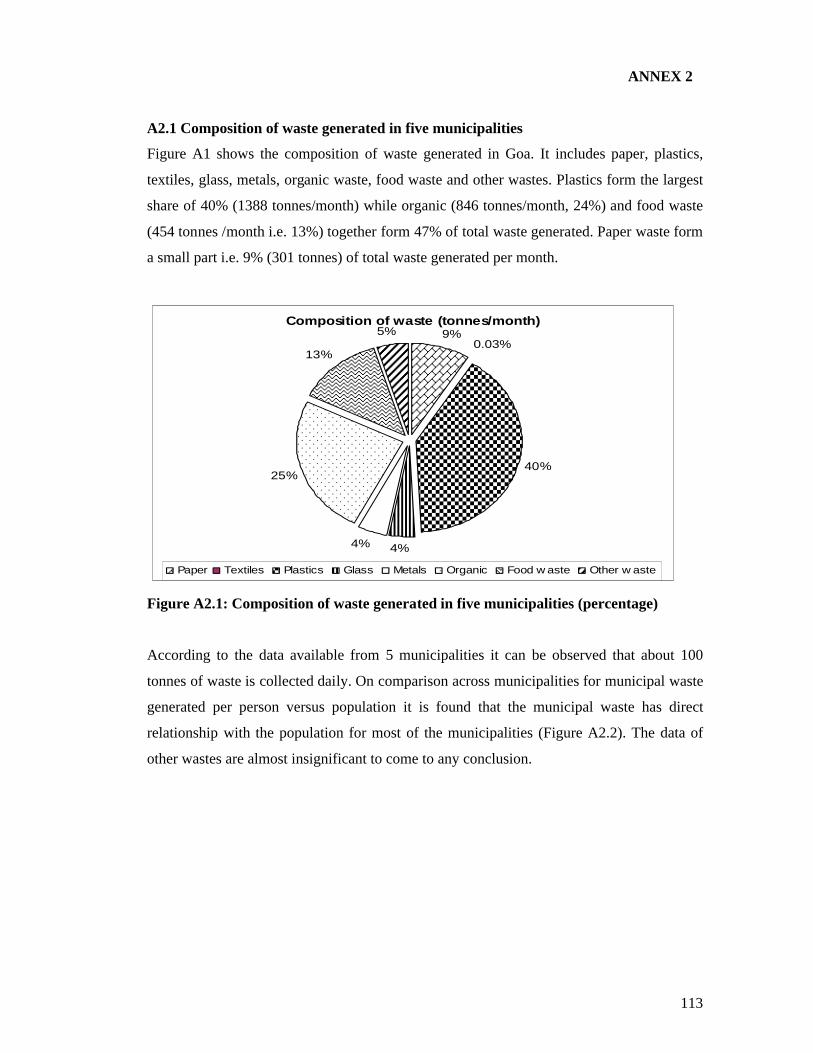
113
ANNEX 2
A2.1 Composition of waste generated in five municipalities
Figure A1 shows the composition of waste generated in Goa. It includes paper, plastics,
textiles, glass, metals, organic waste, food waste and other wastes. Plastics form the largest
share of 40% (1388 tonnes/month) while organic (846 tonnes/month, 24%) and food waste
(454 tonnes /month i.e. 13%) together form 47% of total waste generated. Paper waste form
a small part i.e. 9% (301 tonnes) of total waste generated per month.
Composition of waste (tonnes/month)9%
40%
4%4%
25%
13%
5%0.03%
Paper Textiles Plastics Glass Metals Organic Food w aste Other w aste
Figure A2.1: Composition of waste generated in five municipalities (percentage)
According to the data available from 5 municipalities it can be observed that about 100
tonnes of waste is collected daily. On comparison across municipalities for municipal waste
generated per person versus population it is found that the municipal waste has direct
relationship with the population for most of the municipalities (Figure A2.2). The data of
other wastes are almost insignificant to come to any conclusion.
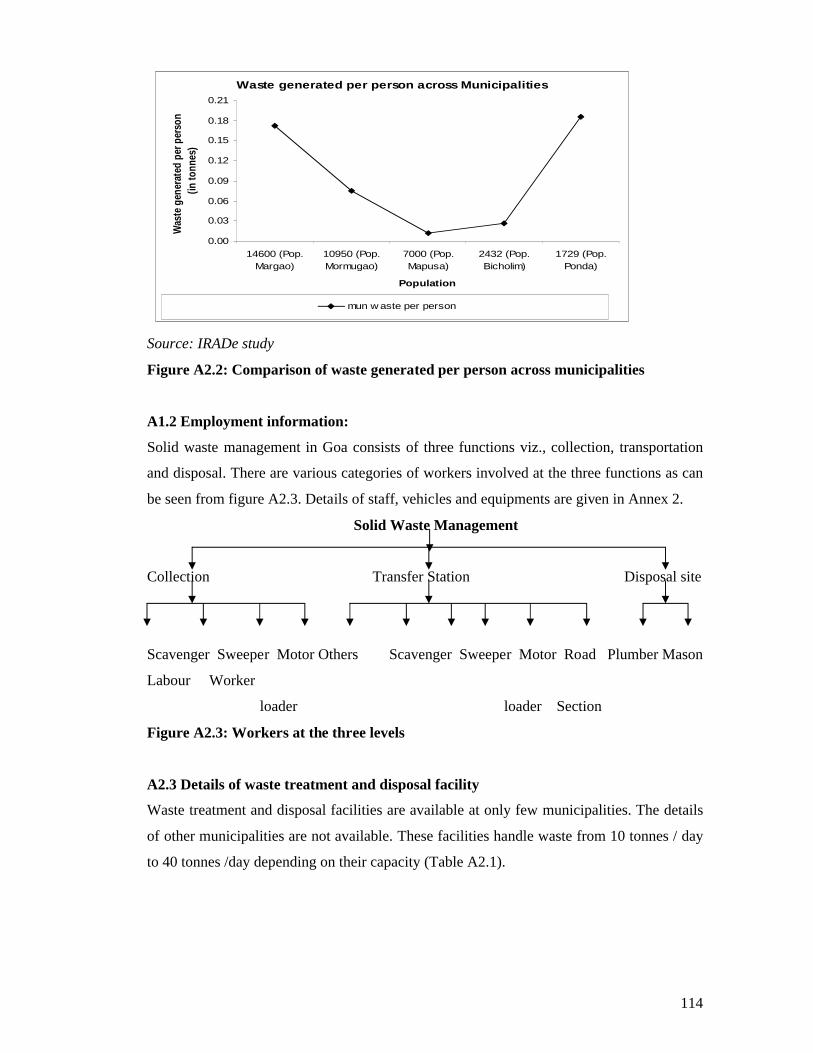
114
Waste generated per person across Municipalities
0.00
0.03
0.06
0.09
0.12
0.15
0.18
0.21
14600 (Pop.Margao)
10950 (Pop.Mormugao)
7000 (Pop.Mapusa)
2432 (Pop.Bicholim)
1729 (Pop.Ponda)
Population
Was
te g
ener
ated
per
per
son
(in to
nnes
)
mun w aste per person
Source: IRADe study
Figure A2.2: Comparison of waste generated per person across municipalities
A1.2 Employment information:
Solid waste management in Goa consists of three functions viz., collection, transportation
and disposal. There are various categories of workers involved at the three functions as can
be seen from figure A2.3. Details of staff, vehicles and equipments are given in Annex 2.
Solid Waste Management
Collection Transfer Station Disposal site
Scavenger Sweeper Motor Others Scavenger Sweeper Motor Road Plumber Mason
Labour Worker
loader loader Section
Figure A2.3: Workers at the three levels
A2.3 Details of waste treatment and disposal facility
Waste treatment and disposal facilities are available at only few municipalities. The details
of other municipalities are not available. These facilities handle waste from 10 tonnes / day
to 40 tonnes /day depending on their capacity (Table A2.1).
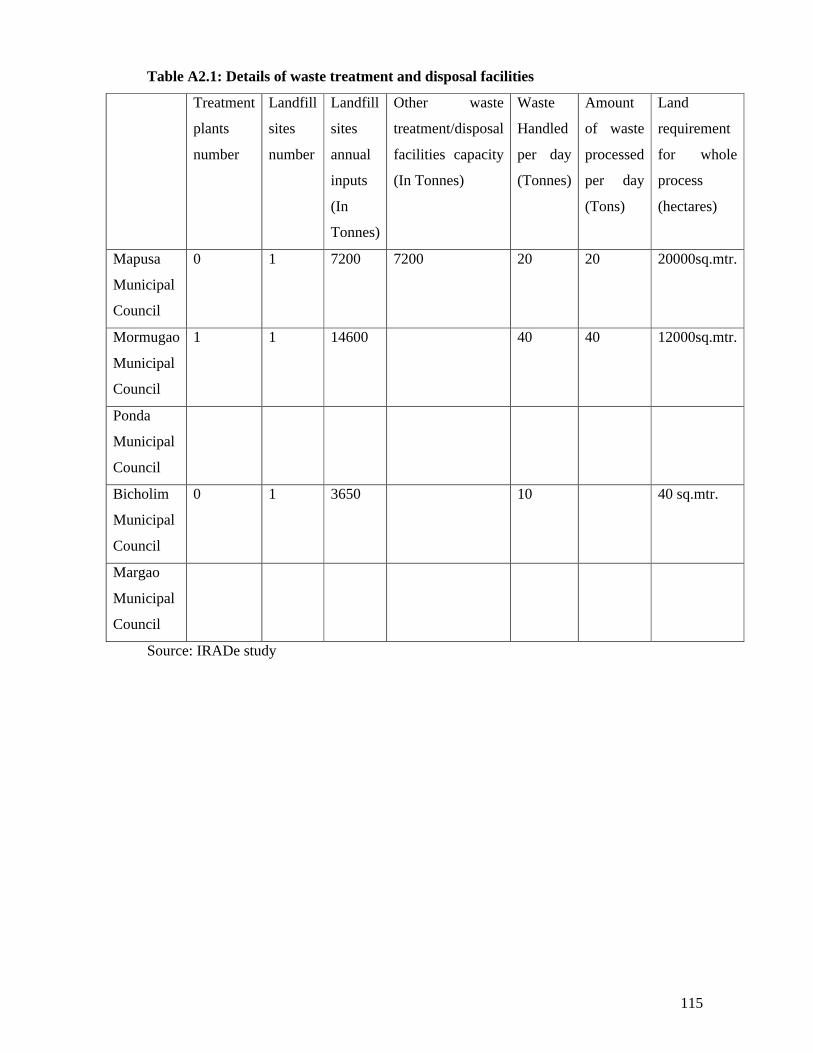
115
Table A2.1: Details of waste treatment and disposal facilities
Treatment
plants
number
Landfill
sites
number
Landfill
sites
annual
inputs
(In
Tonnes)
Other waste
treatment/disposal
facilities capacity
(In Tonnes)
Waste
Handled
per day
(Tonnes)
Amount
of waste
processed
per day
(Tons)
Land
requirement
for whole
process
(hectares)
Mapusa
Municipal
Council
0 1 7200 7200 20 20 20000sq.mtr.
Mormugao
Municipal
Council
1 1 14600 40 40 12000sq.mtr.
Ponda
Municipal
Council
Bicholim
Municipal
Council
0 1 3650 10 40 sq.mtr.
Margao
Municipal
Council
Source: IRADe study
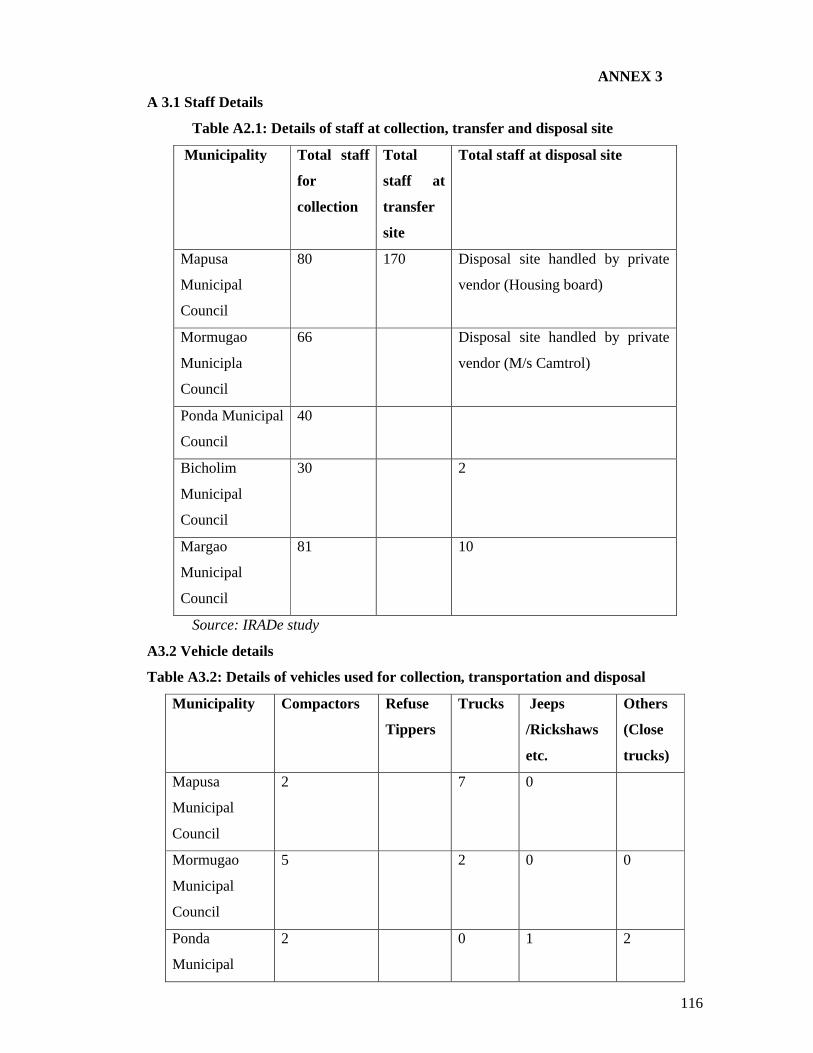
116
ANNEX 3
A 3.1 Staff Details
Table A2.1: Details of staff at collection, transfer and disposal site
Municipality Total staff
for
collection
Total
staff at
transfer
site
Total staff at disposal site
Mapusa
Municipal
Council
80 170 Disposal site handled by private
vendor (Housing board)
Mormugao
Municipla
Council
66 Disposal site handled by private
vendor (M/s Camtrol)
Ponda Municipal
Council
40
Bicholim
Municipal
Council
30 2
Margao
Municipal
Council
81 10
Source: IRADe study
A3.2 Vehicle details
Table A3.2: Details of vehicles used for collection, transportation and disposal
Municipality Compactors Refuse
Tippers
Trucks Jeeps
/Rickshaws
etc.
Others
(Close
trucks)
Mapusa
Municipal
Council
2 7 0
Mormugao
Municipal
Council
5 2 0 0
Ponda
Municipal
2 0 1 2
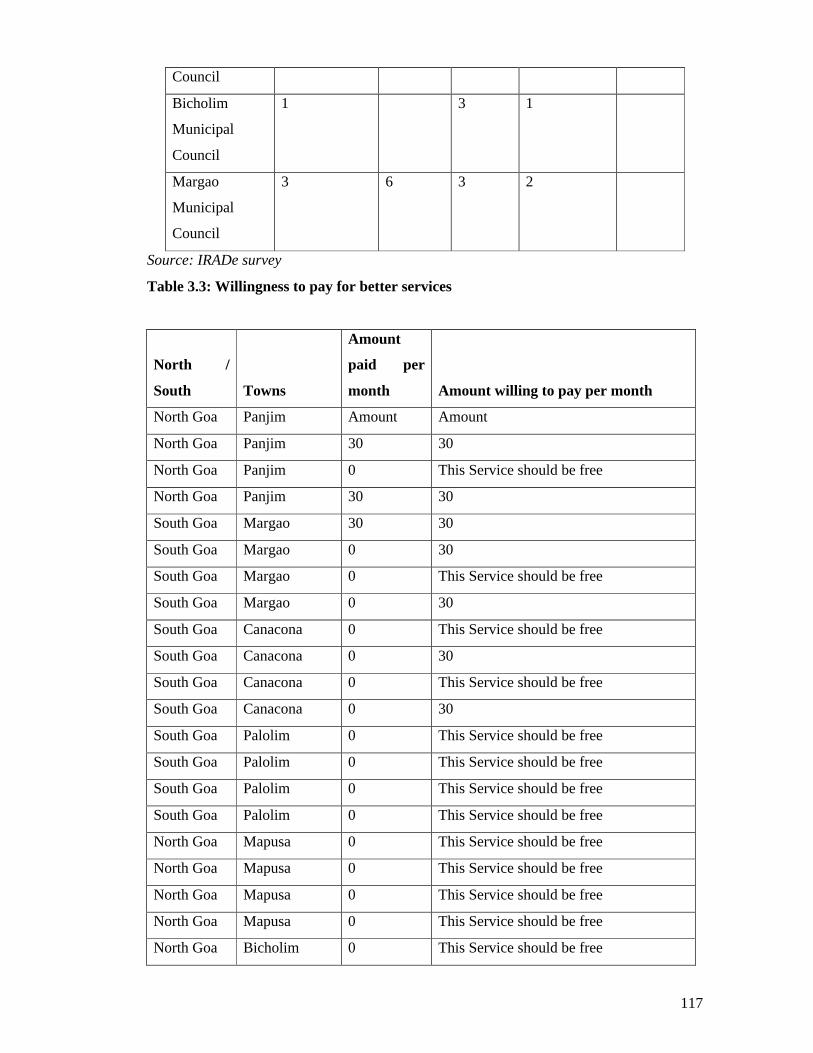
117
Council
Bicholim
Municipal
Council
1 3 1
Margao
Municipal
Council
3 6 3 2
Source: IRADe survey
Table 3.3: Willingness to pay for better services
North /
South Towns
Amount
paid per
month Amount willing to pay per month
North Goa Panjim Amount Amount
North Goa Panjim 30 30
North Goa Panjim 0 This Service should be free
North Goa Panjim 30 30
South Goa Margao 30 30
South Goa Margao 0 30
South Goa Margao 0 This Service should be free
South Goa Margao 0 30
South Goa Canacona 0 This Service should be free
South Goa Canacona 0 30
South Goa Canacona 0 This Service should be free
South Goa Canacona 0 30
South Goa Palolim 0 This Service should be free
South Goa Palolim 0 This Service should be free
South Goa Palolim 0 This Service should be free
South Goa Palolim 0 This Service should be free
North Goa Mapusa 0 This Service should be free
North Goa Mapusa 0 This Service should be free
North Goa Mapusa 0 This Service should be free
North Goa Mapusa 0 This Service should be free
North Goa Bicholim 0 This Service should be free
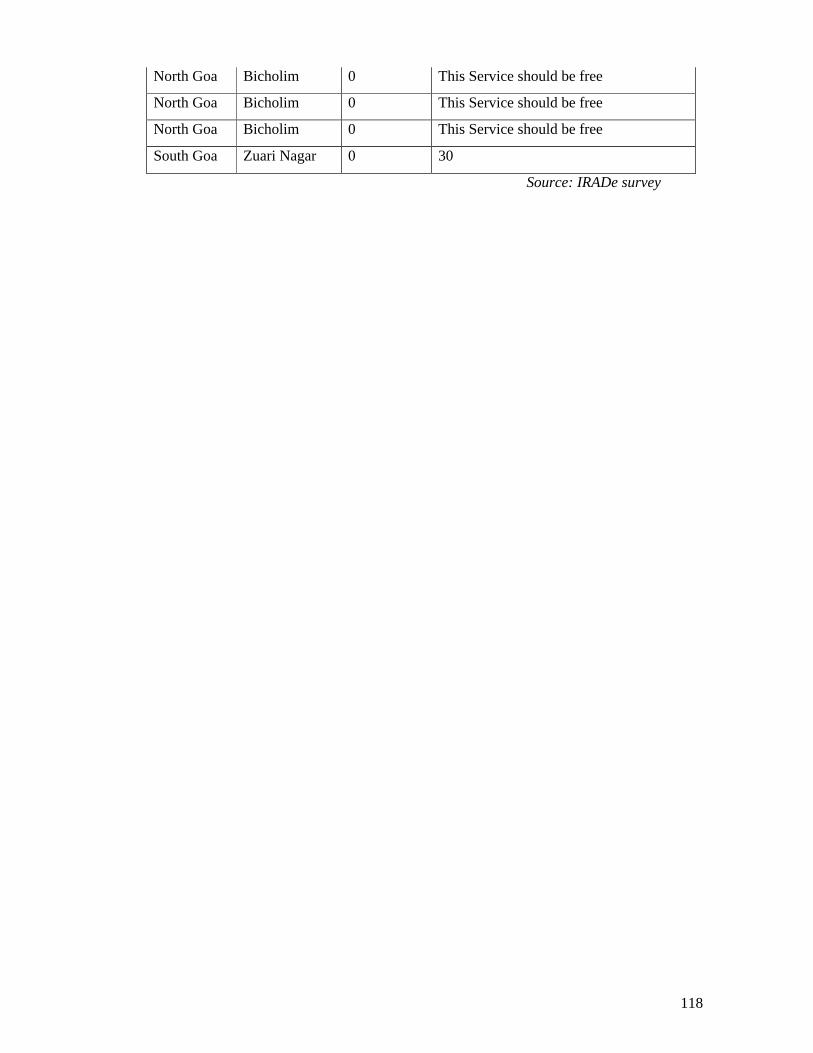
118
North Goa Bicholim 0 This Service should be free
North Goa Bicholim 0 This Service should be free
North Goa Bicholim 0 This Service should be free
South Goa Zuari Nagar 0 30
Source: IRADe survey
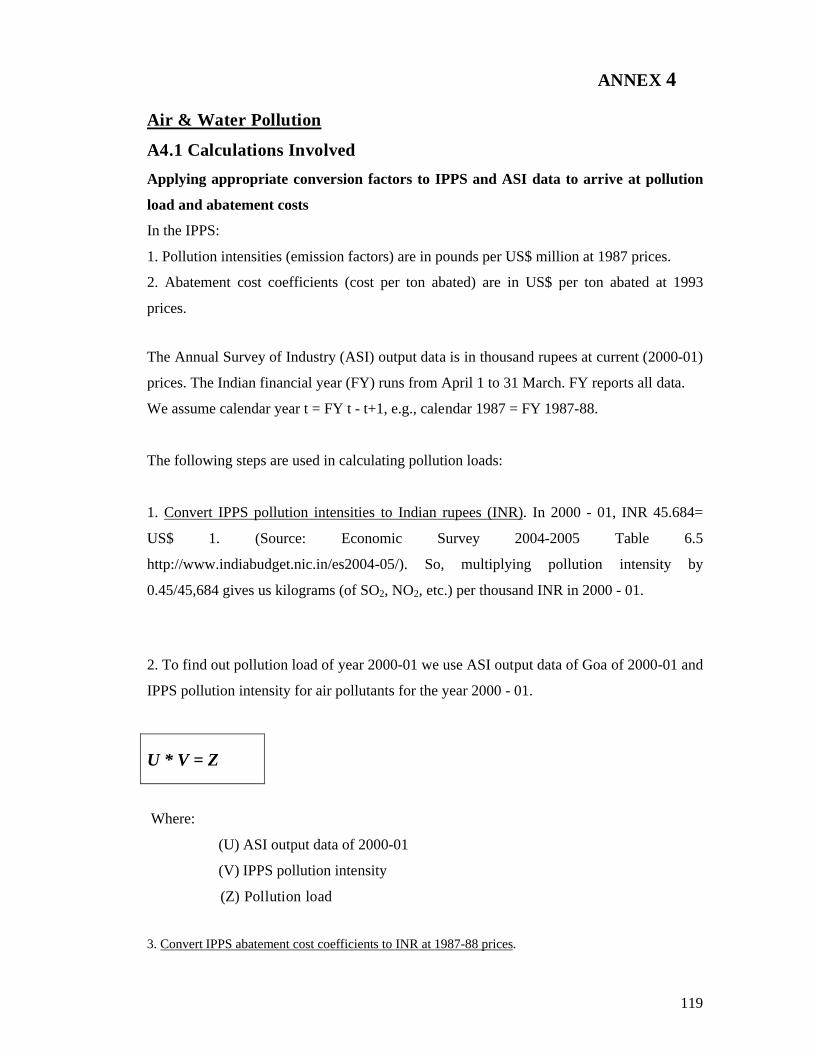
119
ANNEX 4
Air & Water Pollution
A4.1 Calculations Involved
Applying appropriate conversion factors to IPPS and ASI data to arrive at pollution
load and abatement costs
In the IPPS:
1. Pollution intensities (emission factors) are in pounds per US$ million at 1987 prices.
2. Abatement cost coefficients (cost per ton abated) are in US$ per ton abated at 1993
prices.
The Annual Survey of Industry (ASI) output data is in thousand rupees at current (2000-01)
prices. The Indian financial year (FY) runs from April 1 to 31 March. FY reports all data.
We assume calendar year t = FY t - t+1, e.g., calendar 1987 = FY 1987-88.
The following steps are used in calculating pollution loads:
1. Convert IPPS pollution intensities to Indian rupees (INR). In 2000 - 01, INR 45.684=
US$ 1. (Source: Economic Survey 2004-2005 Table 6.5
http://www.indiabudget.nic.in/es2004-05/). So, multiplying pollution intensity by
0.45/45,684 gives us kilograms (of SO2, NO2, etc.) per thousand INR in 2000 - 01.
2. To find out pollution load of year 2000-01 we use ASI output data of Goa of 2000-01 and
IPPS pollution intensity for air pollutants for the year 2000 - 01.
U * V = Z
Where:
(U) ASI output data of 2000-01
(V) IPPS pollution intensity
(Z) Pollution load
3. Convert IPPS abatement cost coefficients to INR at 1987-88 prices.
120
(i) First, multiply IPPS figure by 31.399 (in 1994-95, INR 31.399 = US$ 1, Economic
Survey Table 6.5, op. cit.) to arrive at rupees per ton abated in 1994-95 prices.
(ii) Then inflate using compound inflation rate to arrive at 2000 - 01prices. The compound
inflation rate is calculated by the following formula:
Pn = P0 (1+r) n
The compound inflation rate for the year 2000 – 01 was 3.8%. This was used to inflate the
IPPS abatement coefficients to the price of 2000 – 01. The abatement coefficient thus
arrived was multiplied by pollution load of Goa to arrive at the average abatement cost of
SO2, NO2 and TSP of various industrial sectors of Goa. Thus,
Where
PL = Pollution load of Goa
Ac = Abatement cost coefficient of 2000 – 01
PAC = Pollution cost abatement of Goa in the year 2000 – 01
PL * Ac = PAC
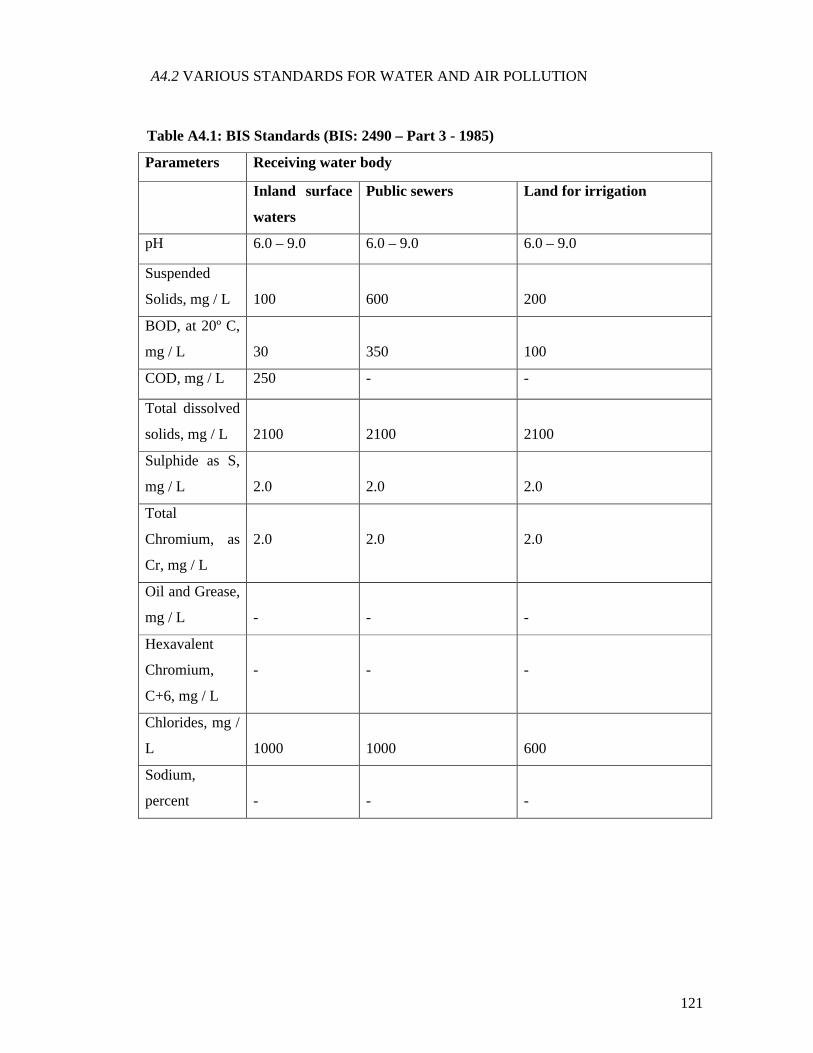
121
A4.2 VARIOUS STANDARDS FOR WATER AND AIR POLLUTION
Table A4.1: BIS Standards (BIS: 2490 – Part 3 - 1985)
Parameters Receiving water body
Inland surface
waters
Public sewers Land for irrigation
pH 6.0 – 9.0 6.0 – 9.0 6.0 – 9.0
Suspended
Solids, mg / L 100 600 200
BOD, at 20º C,
mg / L 30 350 100
COD, mg / L 250 - -
Total dissolved
solids, mg / L 2100 2100 2100
Sulphide as S,
mg / L 2.0 2.0 2.0
Total
Chromium, as
Cr, mg / L
2.0 2.0 2.0
Oil and Grease,
mg / L - - -
Hexavalent
Chromium,
C+6, mg / L
- - -
Chlorides, mg /
L 1000 1000 600
Sodium,
percent - - -
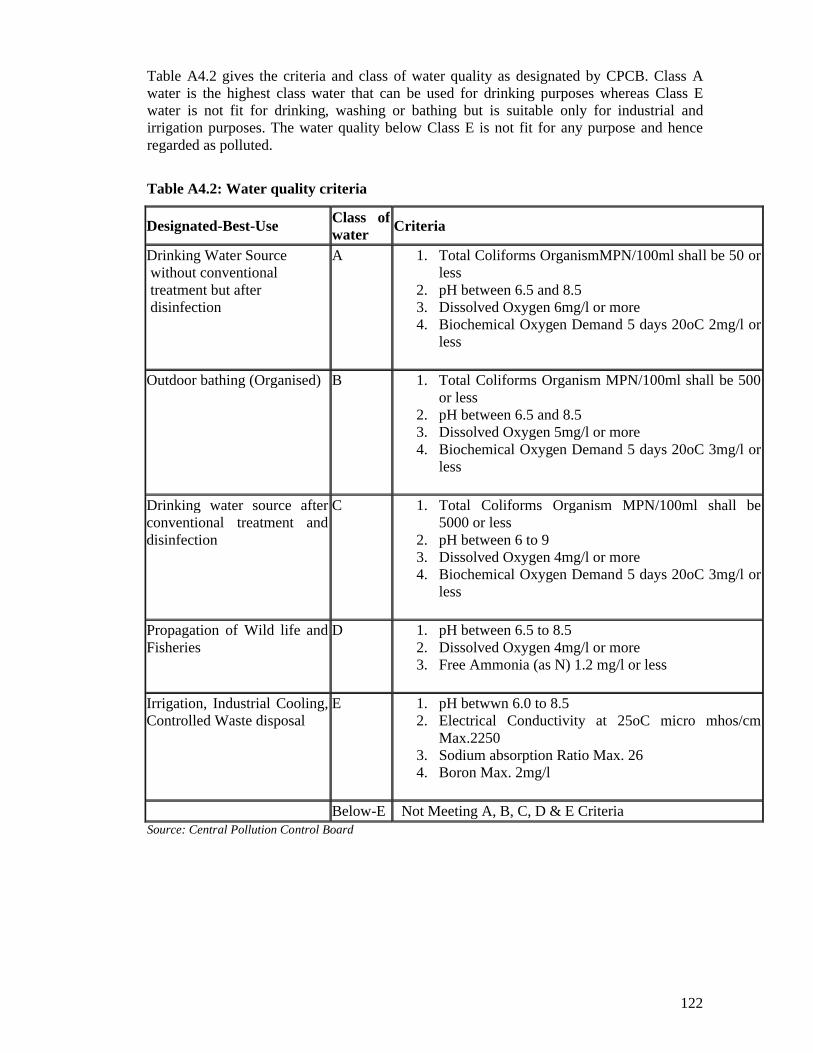
122
Table A4.2 gives the criteria and class of water quality as designated by CPCB. Class A water is the highest class water that can be used for drinking purposes whereas Class E water is not fit for drinking, washing or bathing but is suitable only for industrial and irrigation purposes. The water quality below Class E is not fit for any purpose and hence regarded as polluted.
Table A4.2: Water quality criteria
Designated-Best-UseClass of water
Criteria
Drinking Water Sourcewithout conventionaltreatment but afterdisinfection
A 1. Total Coliforms OrganismMPN/100ml shall be 50 or less
2. pH between 6.5 and 8.5 3. Dissolved Oxygen 6mg/l or more 4. Biochemical Oxygen Demand 5 days 20oC 2mg/l or
less
Outdoor bathing (Organised) B 1. Total Coliforms Organism MPN/100ml shall be 500 or less
2. pH between 6.5 and 8.5 3. Dissolved Oxygen 5mg/l or more 4. Biochemical Oxygen Demand 5 days 20oC 3mg/l or
less
Drinking water source after conventional treatment and disinfection
C 1. Total Coliforms Organism MPN/100ml shall be 5000 or less
2. pH between 6 to 9 3. Dissolved Oxygen 4mg/l or more 4. Biochemical Oxygen Demand 5 days 20oC 3mg/l or
less
Propagation of Wild life and Fisheries
D 1. pH between 6.5 to 8.5 2. Dissolved Oxygen 4mg/l or more 3. Free Ammonia (as N) 1.2 mg/l or less
Irrigation, Industrial Cooling, Controlled Waste disposal
E 1. pH betwwn 6.0 to 8.5 2. Electrical Conductivity at 25oC micro mhos/cm
Max.2250 3. Sodium absorption Ratio Max. 26 4. Boron Max. 2mg/l
Below-E Not Meeting A, B, C, D & E CriteriaSource: Central Pollution Control Board
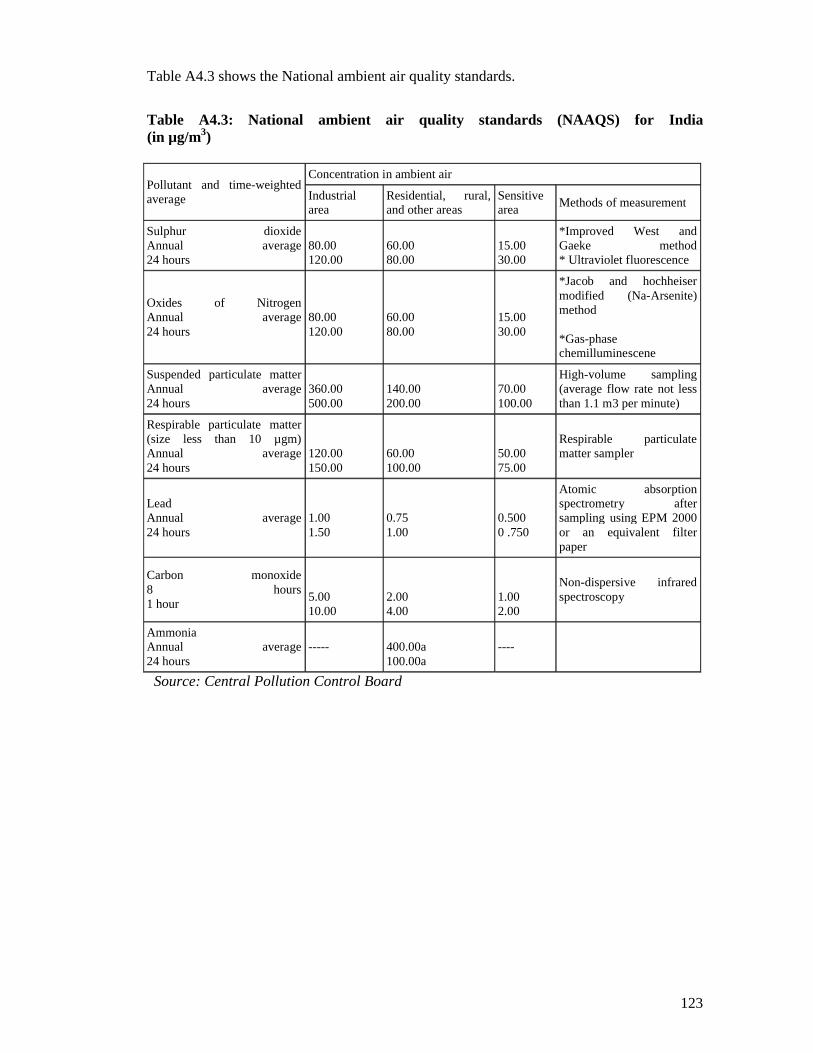
123
Table A4.3 shows the National ambient air quality standards.
Table A4.3: National ambient air quality standards (NAAQS) for India (in µg/m3)
Pollutant and time-weighted average
Concentration in ambient air
Industrial area
Residential, rural, and other areas
Sensitive area
Methods of measurement
Sulphur dioxide Annual average 24 hours
80.00 120.00
60.00 80.00
15.0030.00
*Improved West and Gaeke method * Ultraviolet fluorescence
Oxides of NitrogenAnnual average24 hours
80.00120.00
60.0080.00
15.0030.00
*Jacob and hochheiser modified (Na-Arsenite) method
*Gas-phase chemilluminescene
Suspended particulate matterAnnual average24 hours
360.00500.00
140.00200.00
70.00100.00
High-volume sampling (average flow rate not less than 1.1 m3 per minute)
Respirable particulate matter (size less than 10 µgm) Annual average 24 hours
120.00 150.00
60.00 100.00
50.00 75.00
Respirable particulate matter sampler
LeadAnnual average24 hours
1.00 1.50
0.75 1.00
0.500 0 .750
Atomic absorption spectrometry after sampling using EPM 2000 or an equivalent filter paper
Carbon monoxide 8 hours 1 hour
5.00 10.00
2.00 4.00
1.00 2.00
Non-dispersive infrared spectroscopy
AmmoniaAnnual average24 hours
----- 400.00a100.00a
----
Source: Central Pollution Control Board
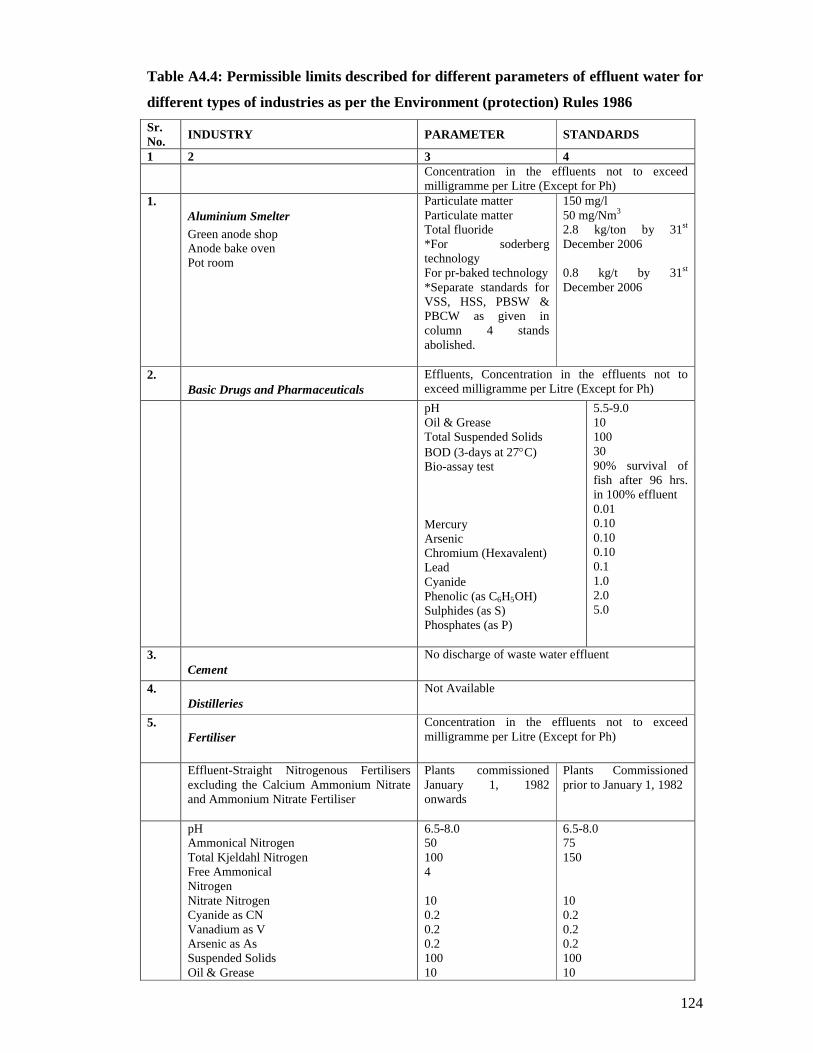
124
Table A4.4: Permissible limits described for different parameters of effluent water for
different types of industries as per the Environment (protection) Rules 1986
Sr. No.
INDUSTRY PARAMETER STANDARDS
1 2 3 4Concentration in the effluents not to exceed milligramme per Litre (Except for Ph)
1.Aluminium Smelter
Green anode shopAnode bake ovenPot room
Particulate matterParticulate matterTotal fluoride*For soderberg technologyFor pr-baked technology*Separate standards for VSS, HSS, PBSW & PBCW as given in column 4 stands abolished.
150 mg/l50 mg/Nm3
2.8 kg/ton by 31st
December 2006
0.8 kg/t by 31st
December 2006
2.Basic Drugs and Pharmaceuticals
Effluents, Concentration in the effluents not to exceed milligramme per Litre (Except for Ph)
pHOil & GreaseTotal Suspended SolidsBOD (3-days at 27C)Bio-assay test
MercuryArsenicChromium (Hexavalent)LeadCyanidePhenolic (as C6H5OH)Sulphides (as S)Phosphates (as P)
5.5-9.0101003090% survival of fish after 96 hrs. in 100% effluent0.010.100.100.100.11.02.05.0
3.Cement
No discharge of waste water effluent
4.Distilleries
Not Available
5.Fertiliser
Concentration in the effluents not to exceed milligramme per Litre (Except for Ph)
Effluent-Straight Nitrogenous Fertilisers excluding the Calcium Ammonium Nitrate and Ammonium Nitrate Fertiliser
Plants commissioned January 1, 1982 onwards
Plants Commissionedprior to January 1, 1982
pHAmmonical NitrogenTotal Kjeldahl NitrogenFree AmmonicalNitrogenNitrate NitrogenCyanide as CNVanadium as VArsenic as AsSuspended SolidsOil & Grease
6.5-8.0501004
100.20.20.210010
6.5-8.075150
100.20.20.210010
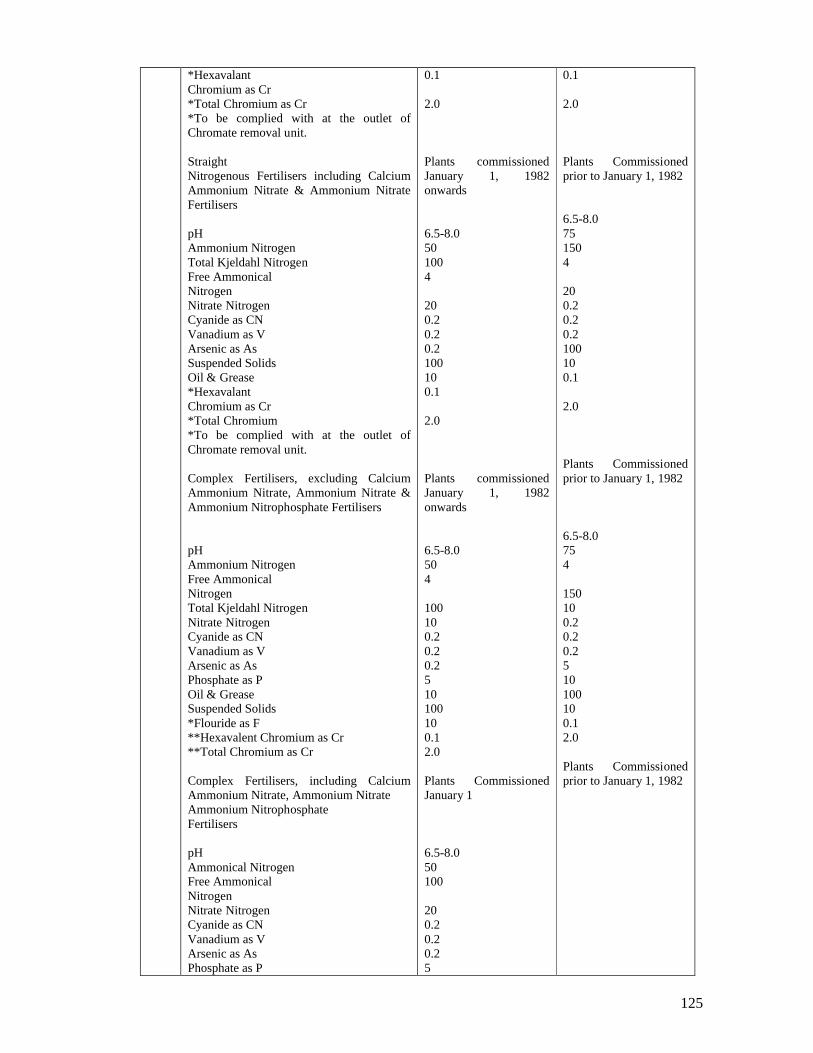
125
*HexavalantChromium as Cr*Total Chromium as Cr*To be complied with at the outlet of Chromate removal unit.
StraightNitrogenous Fertilisers including Calcium Ammonium Nitrate & Ammonium Nitrate Fertilisers
pHAmmonium NitrogenTotal Kjeldahl NitrogenFree AmmonicalNitrogenNitrate NitrogenCyanide as CNVanadium as VArsenic as AsSuspended SolidsOil & Grease*HexavalantChromium as Cr*Total Chromium*To be complied with at the outlet of Chromate removal unit.
Complex Fertilisers, excluding Calcium Ammonium Nitrate, Ammonium Nitrate & Ammonium Nitrophosphate Fertilisers
pHAmmonium NitrogenFree AmmonicalNitrogenTotal Kjeldahl NitrogenNitrate NitrogenCyanide as CNVanadium as VArsenic as AsPhosphate as POil & GreaseSuspended Solids*Flouride as F**Hexavalent Chromium as Cr**Total Chromium as Cr
Complex Fertilisers, including Calcium Ammonium Nitrate, Ammonium Nitrate Ammonium NitrophosphateFertilisers
pHAmmonical NitrogenFree AmmonicalNitrogenNitrate NitrogenCyanide as CNVanadium as VArsenic as AsPhosphate as P
0.1
2.0
Plants commissioned January 1, 1982 onwards
6.5-8.0501004
200.20.20.2100100.1
2.0
Plants commissioned January 1, 1982 onwards
6.5-8.0504
100100.20.20.2510100100.12.0
Plants Commissioned January 1
6.5-8.050100
200.20.20.25
0.1
2.0
Plants Commissioned prior to January 1, 1982
6.5-8.0751504
200.20.20.2100100.1
2.0
Plants Commissioned prior to January 1, 1982
6.5-8.0754
150100.20.20.2510100100.12.0
Plants Commissioned prior to January 1, 1982
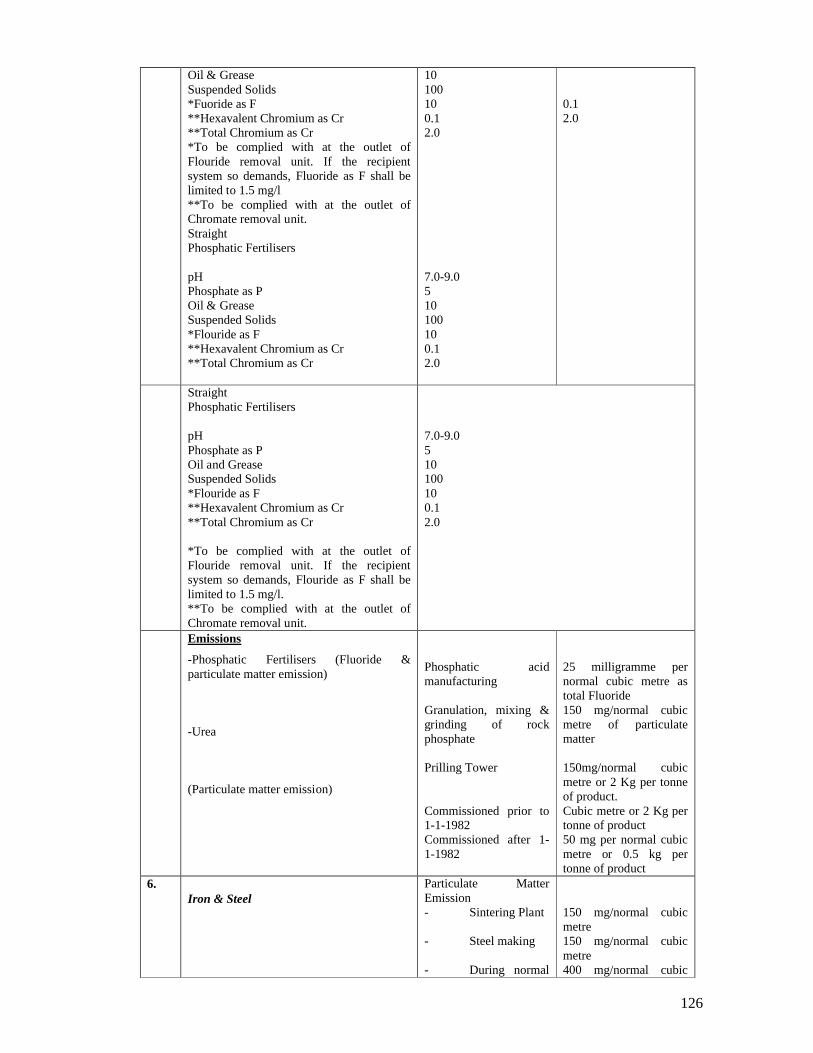
126
Oil & GreaseSuspended Solids*Fuoride as F**Hexavalent Chromium as Cr**Total Chromium as Cr*To be complied with at the outlet of Flouride removal unit. If the recipient system so demands, Fluoride as F shall be limited to 1.5 mg/l**To be complied with at the outlet of Chromate removal unit.StraightPhosphatic Fertilisers
pHPhosphate as POil & GreaseSuspended Solids*Flouride as F**Hexavalent Chromium as Cr**Total Chromium as Cr
10100100.12.0
7.0-9.0510100100.12.0
0.12.0
StraightPhosphatic Fertilisers
pHPhosphate as POil and GreaseSuspended Solids*Flouride as F**Hexavalent Chromium as Cr**Total Chromium as Cr
*To be complied with at the outlet of Flouride removal unit. If the recipient system so demands, Flouride as F shall be limited to 1.5 mg/l.**To be complied with at the outlet of Chromate removal unit.
7.0-9.0510100100.12.0
Emissions
-Phosphatic Fertilisers (Fluoride & particulate matter emission)
-Urea
(Particulate matter emission)
Phosphatic acid manufacturing
Granulation, mixing & grinding of rock phosphate
Prilling Tower
Commissioned prior to 1-1-1982Commissioned after 1-1-1982
25 milligramme pernormal cubic metre as total Fluoride150 mg/normal cubic metre of particulate matter
150mg/normal cubic metre or 2 Kg per tonne of product.Cubic metre or 2 Kg per tonne of product50 mg per normal cubic metre or 0.5 kg per tonne of product
6.Iron & Steel
Particulate Matter Emission- Sintering Plant
- Steel making
- During normal
150 mg/normal cubic metre150 mg/normal cubic metre400 mg/normal cubic
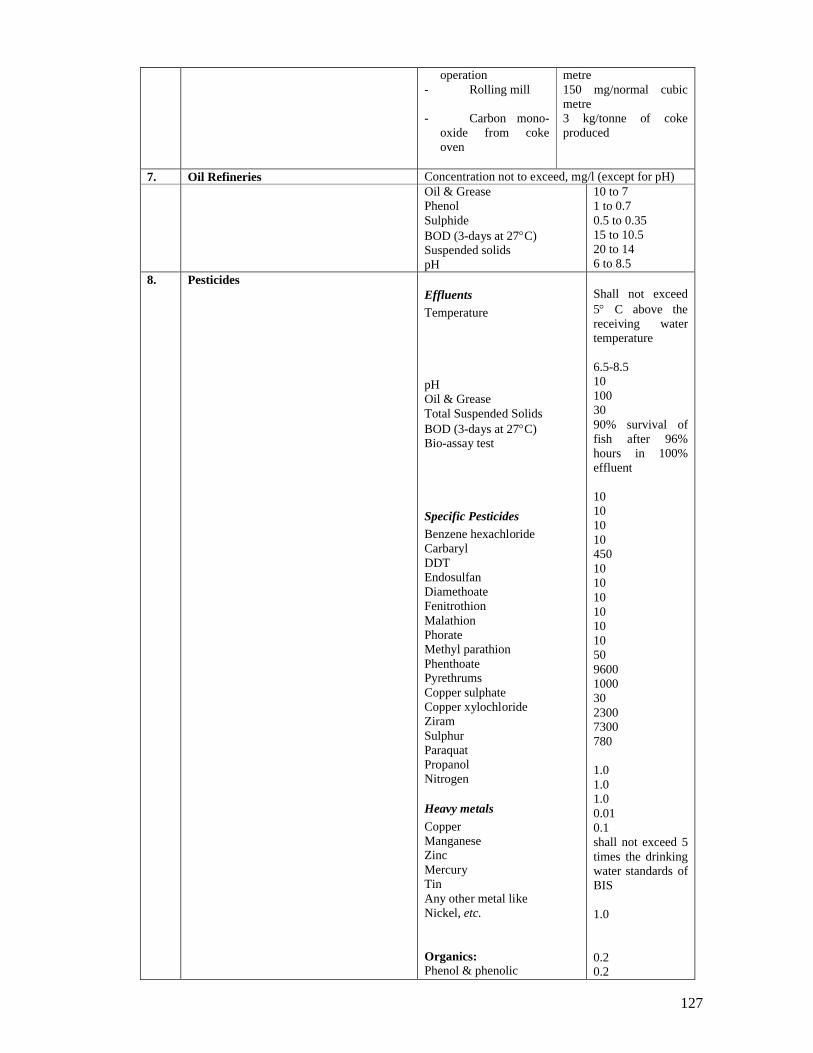
127
operation- Rolling mill
- Carbon mono-oxide from coke oven
metre150 mg/normal cubic metre3 kg/tonne of coke produced
7. Oil Refineries Concentration not to exceed, mg/l (except for pH)Oil & GreasePhenolSulphideBOD (3-days at 27C)Suspended solidspH
10 to 71 to 0.70.5 to 0.3515 to 10.520 to 146 to 8.5
8. PesticidesEffluents
Temperature
pHOil & GreaseTotal Suspended SolidsBOD (3-days at 27C)Bio-assay test
Specific Pesticides
Benzene hexachlorideCarbarylDDTEndosulfanDiamethoateFenitrothionMalathionPhorateMethyl parathionPhenthoatePyrethrumsCopper sulphateCopper xylochlorideZiramSulphurParaquatPropanolNitrogen
Heavy metals
CopperManganeseZincMercuryTinAny other metal likeNickel, etc.
Organics:Phenol & phenolic
Shall not exceed 5 C above the receiving water temperature
6.5-8.5101003090% survival of fish after 96% hours in 100% effluent
1010101045010101010101050960010003023007300780
1.01.01.00.010.1shall not exceed 5 times the drinking water standards of BIS
1.0
0.20.2
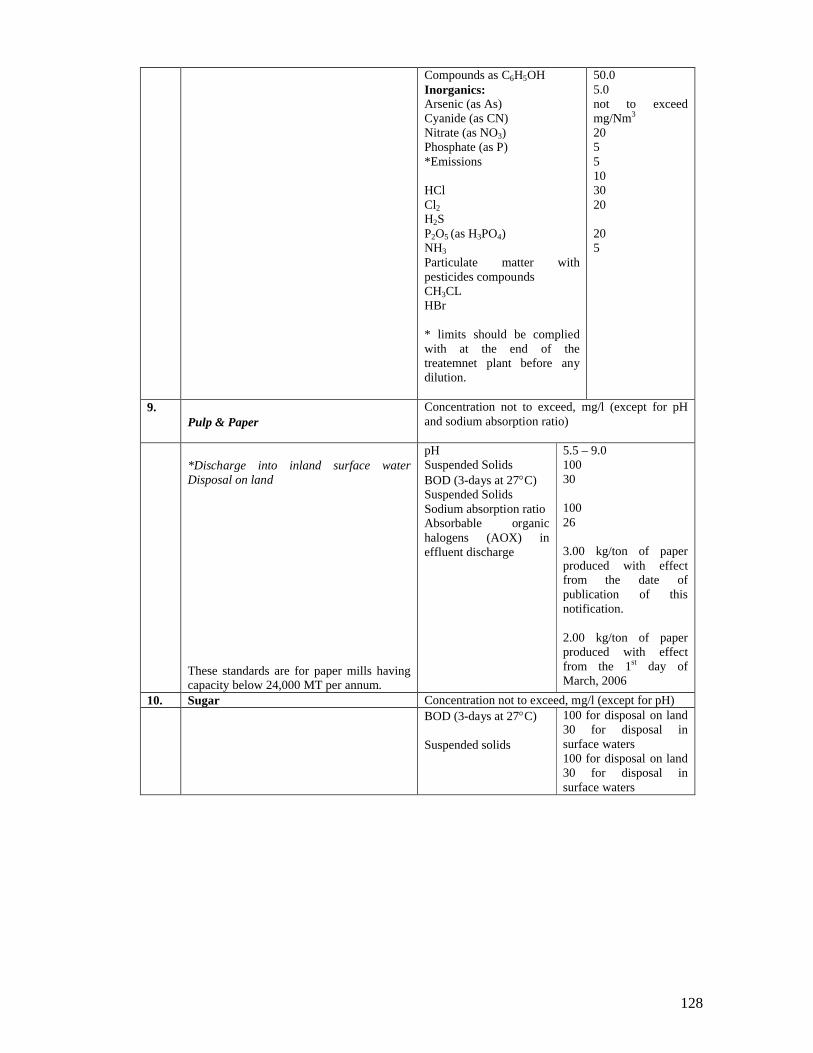
128
Compounds as C6H5OHInorganics:Arsenic (as As)Cyanide (as CN)Nitrate (as NO3)Phosphate (as P)*Emissions
HClCl2
H2SP2O5 (as H3PO4)NH3
Particulate matter with pesticides compoundsCH3CLHBr
* limits should be complied with at the end of the treatemnet plant before any dilution.
50.05.0not to exceed mg/Nm3
2055103020
205
9.Pulp & Paper
Concentration not to exceed, mg/l (except for pH and sodium absorption ratio)
*Discharge into inland surface water Disposal on land
These standards are for paper mills having capacity below 24,000 MT per annum.
pH Suspended SolidsBOD (3-days at 27C)Suspended SolidsSodium absorption ratioAbsorbable organic halogens (AOX) in effluent discharge
5.5 – 9.010030
10026
3.00 kg/ton of paper produced with effect from the date of publication of thisnotification.
2.00 kg/ton of paper produced with effect from the 1st day of March, 2006
10. Sugar Concentration not to exceed, mg/l (except for pH)BOD (3-days at 27C)
Suspended solids
100 for disposal on land 30 for disposal in surface waters100 for disposal on land 30 for disposal in surface waters
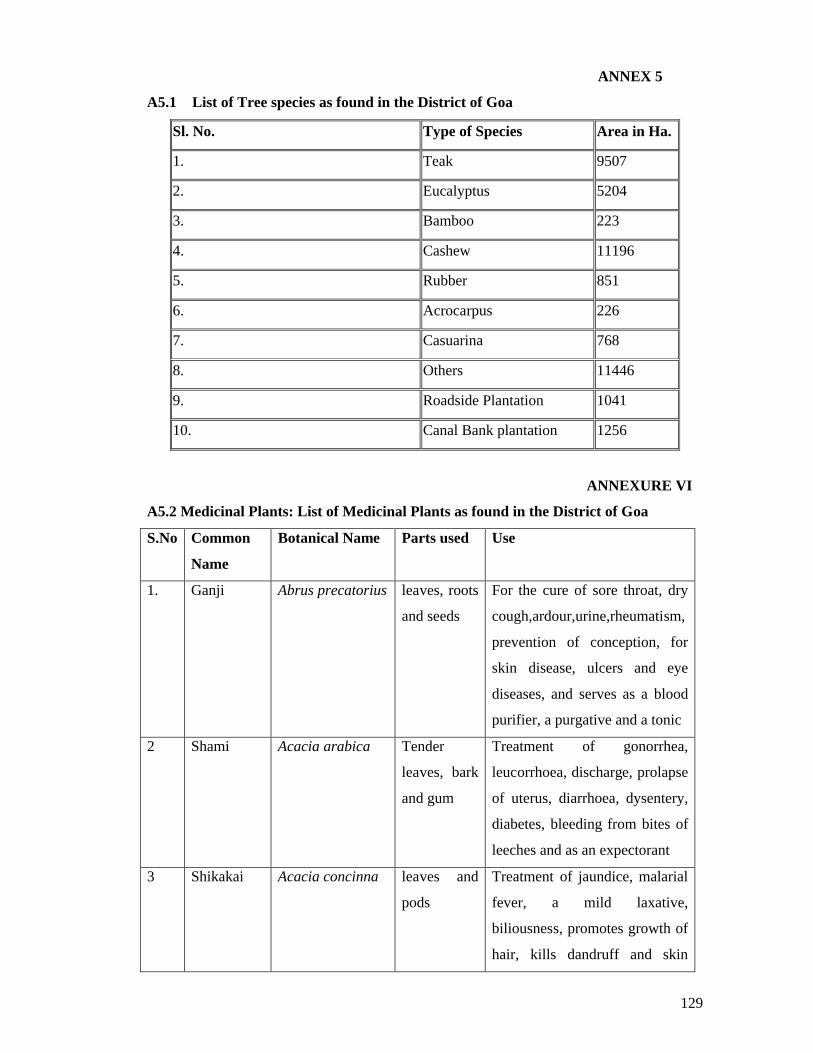
129
ANNEX 5
A5.1 List of Tree species as found in the District of Goa
Sl. No. Type of Species Area in Ha.
1. Teak 9507
2. Eucalyptus 5204
3. Bamboo 223
4. Cashew 11196
5. Rubber 851
6. Acrocarpus 226
7. Casuarina 768
8. Others 11446
9. Roadside Plantation 1041
10. Canal Bank plantation 1256
ANNEXURE VI
A5.2 Medicinal Plants: List of Medicinal Plants as found in the District of Goa
S.No Common
Name
Botanical Name Parts used Use
1. Ganji Abrus precatorius leaves, roots
and seeds
For the cure of sore throat, dry
cough,ardour,urine,rheumatism,
prevention of conception, for
skin disease, ulcers and eye
diseases, and serves as a blood
purifier, a purgative and a tonic
2 Shami Acacia arabica Tender
leaves, bark
and gum
Treatment of gonorrhea,
leucorrhoea, discharge, prolapse
of uterus, diarrhoea, dysentery,
diabetes, bleeding from bites of
leeches and as an expectorant
3 Shikakai Acacia concinna leaves and
pods
Treatment of jaundice, malarial
fever, a mild laxative,
biliousness, promotes growth of
hair, kills dandruff and skin
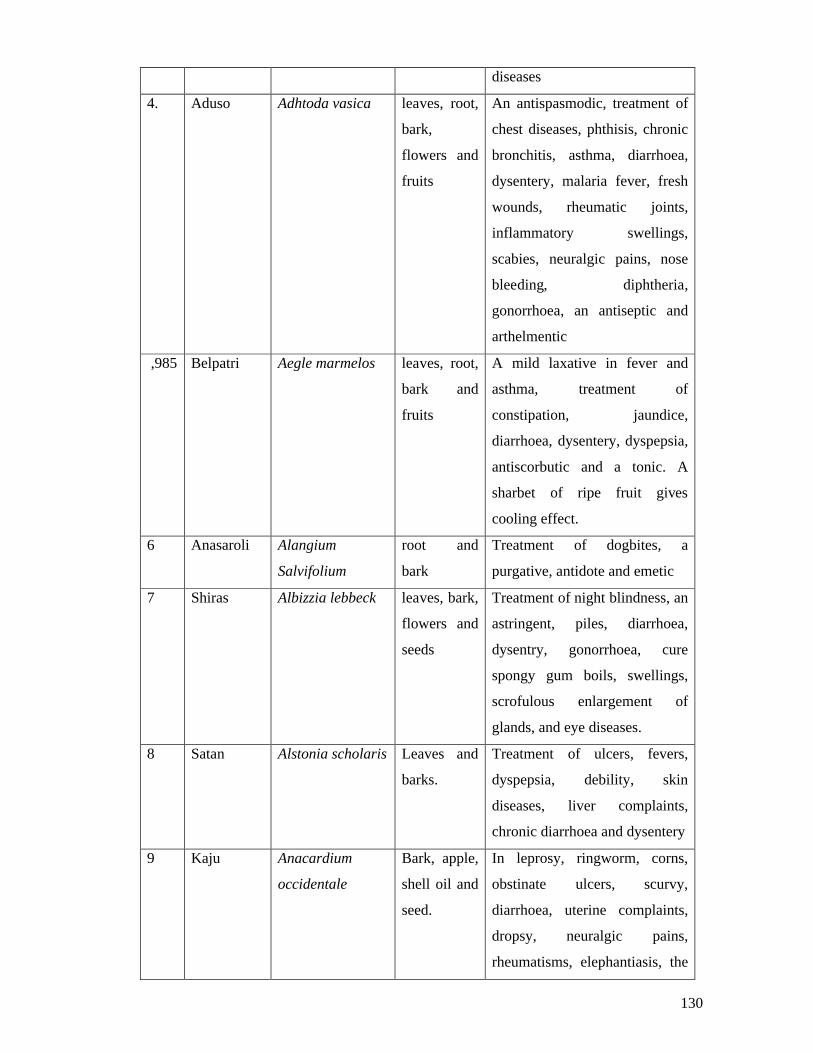
130
diseases
4. Aduso Adhtoda vasica leaves, root,
bark,
flowers and
fruits
An antispasmodic, treatment of
chest diseases, phthisis, chronic
bronchitis, asthma, diarrhoea,
dysentery, malaria fever, fresh
wounds, rheumatic joints,
inflammatory swellings,
scabies, neuralgic pains, nose
bleeding, diphtheria,
gonorrhoea, an antiseptic and
arthelmentic
,985 Belpatri Aegle marmelos leaves, root,
bark and
fruits
A mild laxative in fever and
asthma, treatment of
constipation, jaundice,
diarrhoea, dysentery, dyspepsia,
antiscorbutic and a tonic. A
sharbet of ripe fruit gives
cooling effect.
6 Anasaroli Alangium
Salvifolium
root and
bark
Treatment of dogbites, a
purgative, antidote and emetic
7 Shiras Albizzia lebbeck leaves, bark,
flowers and
seeds
Treatment of night blindness, an
astringent, piles, diarrhoea,
dysentry, gonorrhoea, cure
spongy gum boils, swellings,
scrofulous enlargement of
glands, and eye diseases.
8 Satan Alstonia scholaris Leaves and
barks.
Treatment of ulcers, fevers,
dyspepsia, debility, skin
diseases, liver complaints,
chronic diarrhoea and dysentery
9 Kaju Anacardium
occidentale
Bark, apple,
shell oil and
seed.
In leprosy, ringworm, corns,
obstinate ulcers, scurvy,
diarrhoea, uterine complaints,
dropsy, neuralgic pains,
rheumatisms, elephantiasis, the
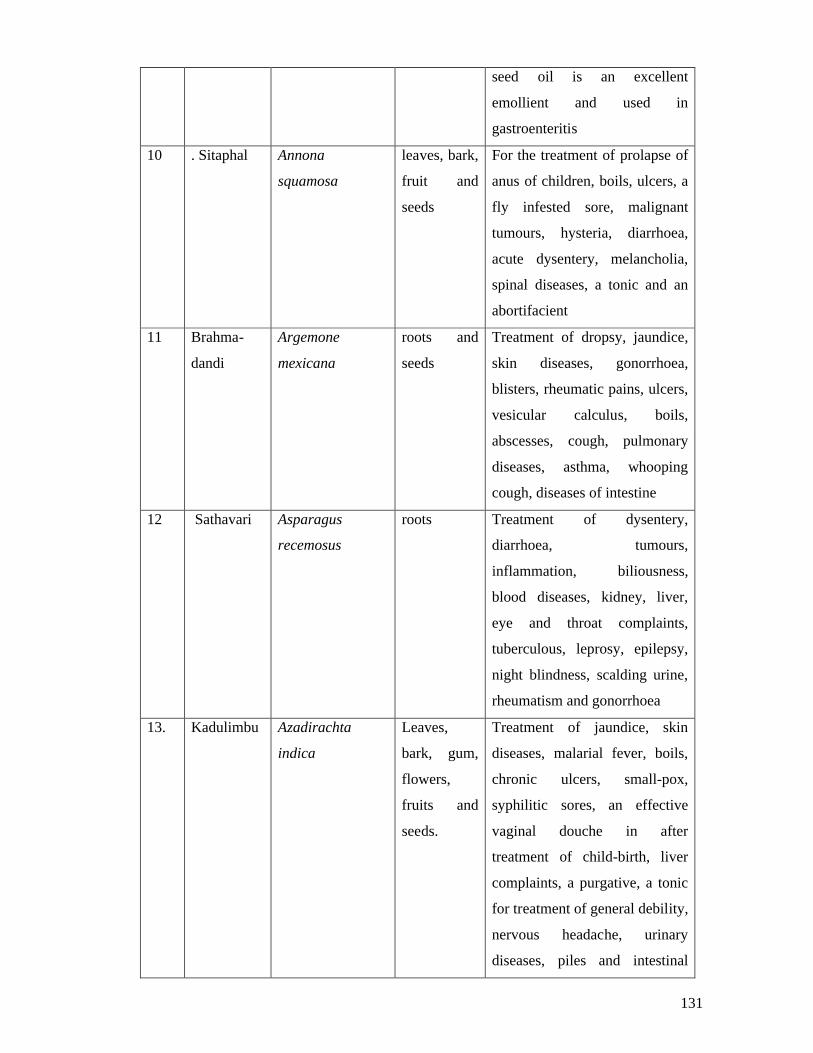
131
seed oil is an excellent
emollient and used in
gastroenteritis
10 . Sitaphal Annona
squamosa
leaves, bark,
fruit and
seeds
For the treatment of prolapse of
anus of children, boils, ulcers, a
fly infested sore, malignant
tumours, hysteria, diarrhoea,
acute dysentery, melancholia,
spinal diseases, a tonic and an
abortifacient
11 Brahma-
dandi
Argemone
mexicana
roots and
seeds
Treatment of dropsy, jaundice,
skin diseases, gonorrhoea,
blisters, rheumatic pains, ulcers,
vesicular calculus, boils,
abscesses, cough, pulmonary
diseases, asthma, whooping
cough, diseases of intestine
12 Sathavari Asparagus
recemosus
roots Treatment of dysentery,
diarrhoea, tumours,
inflammation, biliousness,
blood diseases, kidney, liver,
eye and throat complaints,
tuberculous, leprosy, epilepsy,
night blindness, scalding urine,
rheumatism and gonorrhoea
13. Kadulimbu Azadirachta
indica
Leaves,
bark, gum,
flowers,
fruits and
seeds.
Treatment of jaundice, skin
diseases, malarial fever, boils,
chronic ulcers, small-pox,
syphilitic sores, an effective
vaginal douche in after
treatment of child-birth, liver
complaints, a purgative, a tonic
for treatment of general debility,
nervous headache, urinary
diseases, piles and intestinal
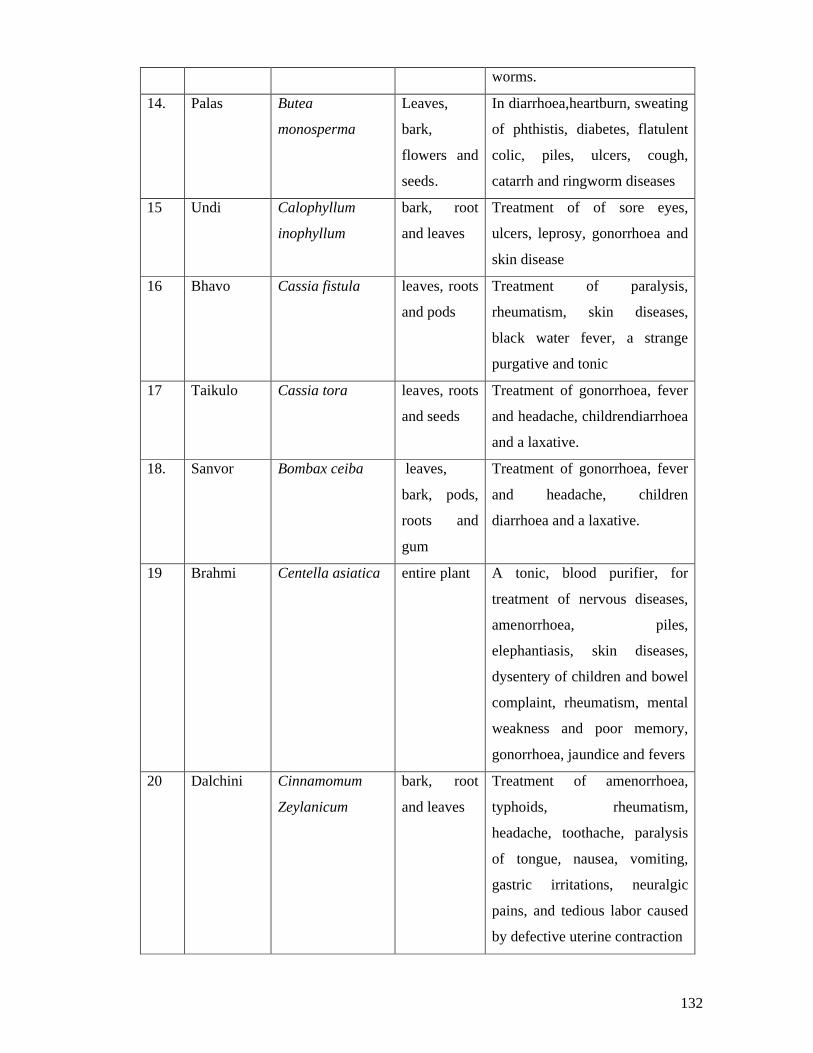
132
worms.
14. Palas Butea
monosperma
Leaves,
bark,
flowers and
seeds.
In diarrhoea,heartburn, sweating
of phthistis, diabetes, flatulent
colic, piles, ulcers, cough,
catarrh and ringworm diseases
15 Undi Calophyllum
inophyllum
bark, root
and leaves
Treatment of of sore eyes,
ulcers, leprosy, gonorrhoea and
skin disease
16 Bhavo Cassia fistula leaves, roots
and pods
Treatment of paralysis,
rheumatism, skin diseases,
black water fever, a strange
purgative and tonic
17 Taikulo Cassia tora leaves, roots
and seeds
Treatment of gonorrhoea, fever
and headache, childrendiarrhoea
and a laxative.
18. Sanvor Bombax ceiba leaves,
bark, pods,
roots and
gum
Treatment of gonorrhoea, fever
and headache, children
diarrhoea and a laxative.
19 Brahmi Centella asiatica entire plant A tonic, blood purifier, for
treatment of nervous diseases,
amenorrhoea, piles,
elephantiasis, skin diseases,
dysentery of children and bowel
complaint, rheumatism, mental
weakness and poor memory,
gonorrhoea, jaundice and fevers
20 Dalchini Cinnamomum
Zeylanicum
bark, root
and leaves
Treatment of amenorrhoea,
typhoids, rheumatism,
headache, toothache, paralysis
of tongue, nausea, vomiting,
gastric irritations, neuralgic
pains, and tedious labor caused
by defective uterine contraction
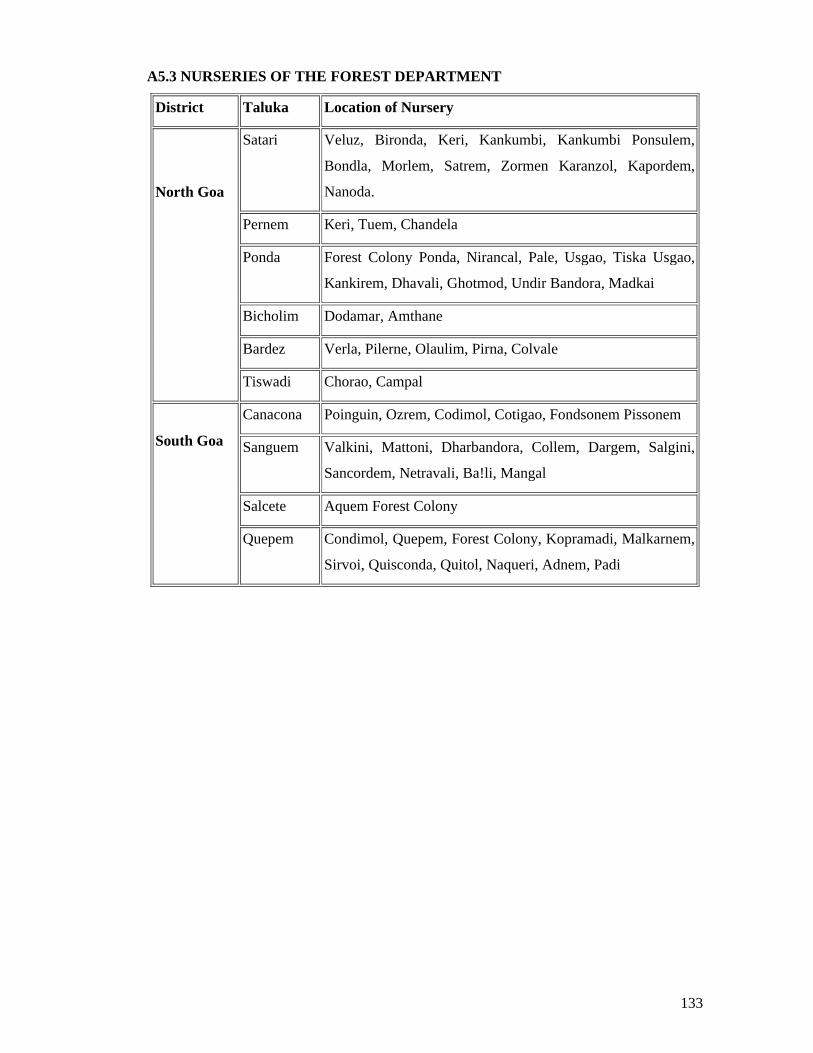
133
A5.3 NURSERIES OF THE FOREST DEPARTMENT
District Taluka Location of Nursery
North Goa
Satari Veluz, Bironda, Keri, Kankumbi, Kankumbi Ponsulem,
Bondla, Morlem, Satrem, Zormen Karanzol, Kapordem,
Nanoda.
Pernem Keri, Tuem, Chandela
Ponda Forest Colony Ponda, Nirancal, Pale, Usgao, Tiska Usgao,
Kankirem, Dhavali, Ghotmod, Undir Bandora, Madkai
Bicholim Dodamar, Amthane
Bardez Verla, Pilerne, Olaulim, Pirna, Colvale
Tiswadi Chorao, Campal
South Goa
Canacona Poinguin, Ozrem, Codimol, Cotigao, Fondsonem Pissonem
Sanguem Valkini, Mattoni, Dharbandora, Collem, Dargem, Salgini,
Sancordem, Netravali, Ba!li, Mangal
Salcete Aquem Forest Colony
Quepem Condimol, Quepem, Forest Colony, Kopramadi, Malkarnem,
Sirvoi, Quisconda, Quitol, Naqueri, Adnem, Padi
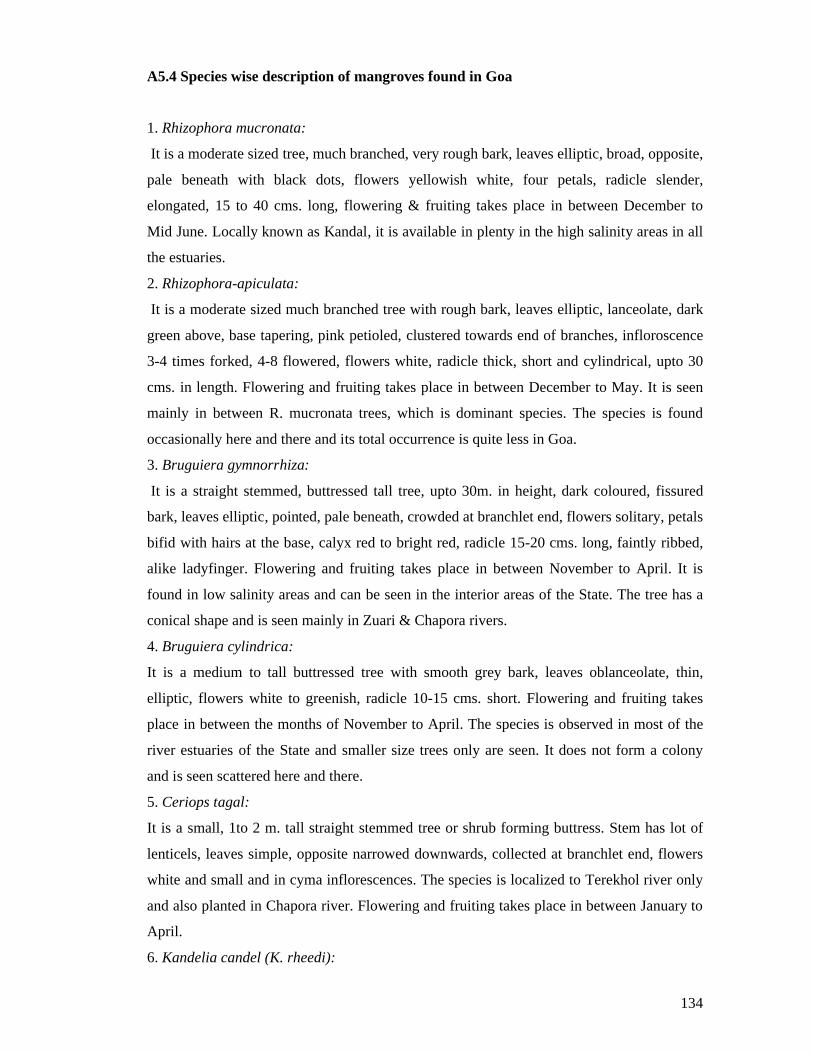
134
A5.4 Species wise description of mangroves found in Goa
1. Rhizophora mucronata:
It is a moderate sized tree, much branched, very rough bark, leaves elliptic, broad, opposite,
pale beneath with black dots, flowers yellowish white, four petals, radicle slender,
elongated, 15 to 40 cms. long, flowering & fruiting takes place in between December to
Mid June. Locally known as Kandal, it is available in plenty in the high salinity areas in all
the estuaries.
2. Rhizophora-apiculata:
It is a moderate sized much branched tree with rough bark, leaves elliptic, lanceolate, dark
green above, base tapering, pink petioled, clustered towards end of branches, infloroscence
3-4 times forked, 4-8 flowered, flowers white, radicle thick, short and cylindrical, upto 30
cms. in length. Flowering and fruiting takes place in between December to May. It is seen
mainly in between R. mucronata trees, which is dominant species. The species is found
occasionally here and there and its total occurrence is quite less in Goa.
3. Bruguiera gymnorrhiza:
It is a straight stemmed, buttressed tall tree, upto 30m. in height, dark coloured, fissured
bark, leaves elliptic, pointed, pale beneath, crowded at branchlet end, flowers solitary, petals
bifid with hairs at the base, calyx red to bright red, radicle 15-20 cms. long, faintly ribbed,
alike ladyfinger. Flowering and fruiting takes place in between November to April. It is
found in low salinity areas and can be seen in the interior areas of the State. The tree has a
conical shape and is seen mainly in Zuari & Chapora rivers.
4. Bruguiera cylindrica:
It is a medium to tall buttressed tree with smooth grey bark, leaves oblanceolate, thin,
elliptic, flowers white to greenish, radicle 10-15 cms. short. Flowering and fruiting takes
place in between the months of November to April. The species is observed in most of the
river estuaries of the State and smaller size trees only are seen. It does not form a colony
and is seen scattered here and there.
5. Ceriops tagal:
It is a small, 1to 2 m. tall straight stemmed tree or shrub forming buttress. Stem has lot of
lenticels, leaves simple, opposite narrowed downwards, collected at branchlet end, flowers
white and small and in cyma inflorescences. The species is localized to Terekhol river only
and also planted in Chapora river. Flowering and fruiting takes place in between January to
April.
6. Kandelia candel (K. rheedi):
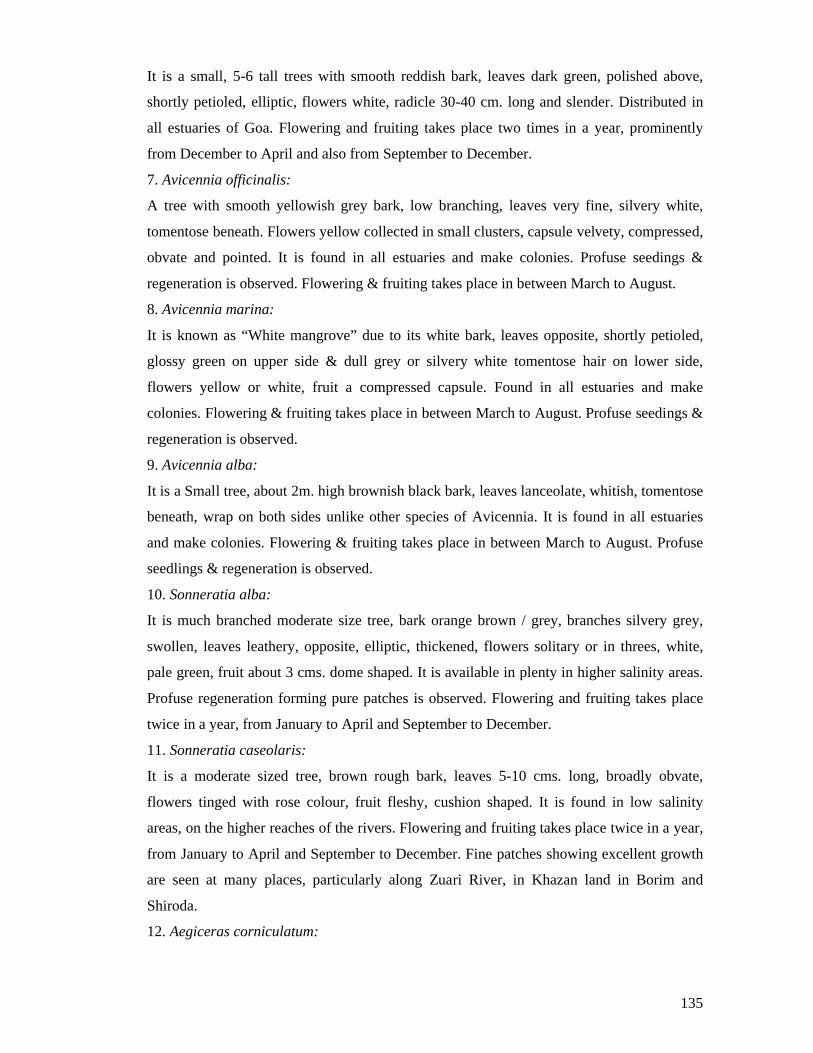
135
It is a small, 5-6 tall trees with smooth reddish bark, leaves dark green, polished above,
shortly petioled, elliptic, flowers white, radicle 30-40 cm. long and slender. Distributed in
all estuaries of Goa. Flowering and fruiting takes place two times in a year, prominently
from December to April and also from September to December.
7. Avicennia officinalis:
A tree with smooth yellowish grey bark, low branching, leaves very fine, silvery white,
tomentose beneath. Flowers yellow collected in small clusters, capsule velvety, compressed,
obvate and pointed. It is found in all estuaries and make colonies. Profuse seedings &
regeneration is observed. Flowering & fruiting takes place in between March to August.
8. Avicennia marina:
It is known as “White mangrove” due to its white bark, leaves opposite, shortly petioled,
glossy green on upper side & dull grey or silvery white tomentose hair on lower side,
flowers yellow or white, fruit a compressed capsule. Found in all estuaries and make
colonies. Flowering & fruiting takes place in between March to August. Profuse seedings &
regeneration is observed.
9. Avicennia alba:
It is a Small tree, about 2m. high brownish black bark, leaves lanceolate, whitish, tomentose
beneath, wrap on both sides unlike other species of Avicennia. It is found in all estuaries
and make colonies. Flowering & fruiting takes place in between March to August. Profuse
seedlings & regeneration is observed.
10. Sonneratia alba:
It is much branched moderate size tree, bark orange brown / grey, branches silvery grey,
swollen, leaves leathery, opposite, elliptic, thickened, flowers solitary or in threes, white,
pale green, fruit about 3 cms. dome shaped. It is available in plenty in higher salinity areas.
Profuse regeneration forming pure patches is observed. Flowering and fruiting takes place
twice in a year, from January to April and September to December.
11. Sonneratia caseolaris:
It is a moderate sized tree, brown rough bark, leaves 5-10 cms. long, broadly obvate,
flowers tinged with rose colour, fruit fleshy, cushion shaped. It is found in low salinity
areas, on the higher reaches of the rivers. Flowering and fruiting takes place twice in a year,
from January to April and September to December. Fine patches showing excellent growth
are seen at many places, particularly along Zuari River, in Khazan land in Borim and
Shiroda.
12. Aegiceras corniculatum:
136
It is a small shrubby tree, bark brown with reddish tinge, leaves alternate, elliptic, flowers
white, in umbels, fruit cylindrical, curved, and very small. Available in plenty in low
salinity areas. Flowering and fruiting takes place in between February to April.
13. Excoecaria agallocha:
It is a much branched tree, upto 5 m high. Bark greyish, leaves pale green, alternate, elliptic,
produce latex which is poisonous & dangerous to eyes. Flowers dioecious, arranged in
sessile axillary catkins. Male and female plants found separately with distinct characters.
Found in all the estuaries and is a common species in Goa.
14. Acanthus illici folius:
It is a shrub, upto 2 m high, aerial root formation is seen. Leaves glabrous, decussate with
pair of spines. Flowers light blue to violet. Fruit 2-3 cms. long. It is found in abundance in
all the estuaries. Flowering and fruiting takes place in between February to April.
15. Lumnitzera racemosa:
A small tree upto 10 m. high. Bark grey and fissured. Pneumatophores are thin, knee
shaped. Leaves small, fleshy, oval, clustered towards end of branches Flowers white. Fruit
hard, ovoid. Flowering and fruiting in between March to September. Localised to Siolim
area, along the bunds.
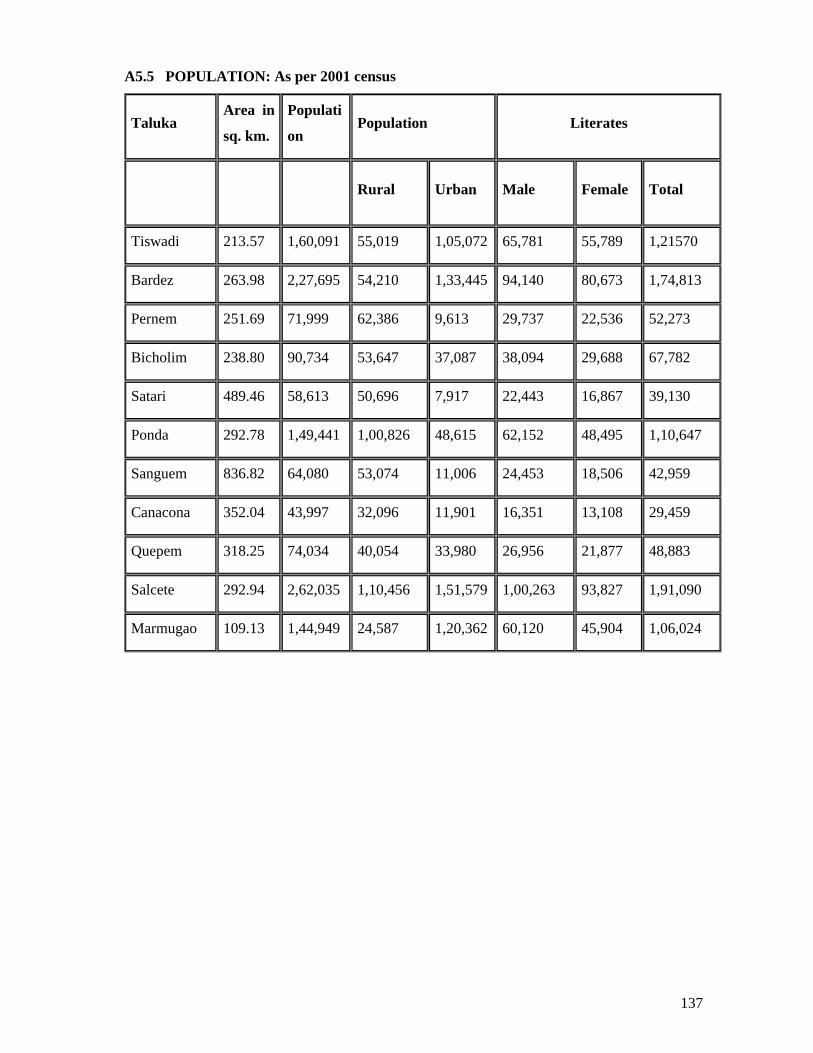
137
A5.5 POPULATION: As per 2001 census
TalukaArea in
sq. km.
Populati
onPopulation Literates
Rural Urban Male Female Total
Tiswadi 213.57 1,60,091 55,019 1,05,072 65,781 55,789 1,21570
Bardez 263.98 2,27,695 54,210 1,33,445 94,140 80,673 1,74,813
Pernem 251.69 71,999 62,386 9,613 29,737 22,536 52,273
Bicholim 238.80 90,734 53,647 37,087 38,094 29,688 67,782
Satari 489.46 58,613 50,696 7,917 22,443 16,867 39,130
Ponda 292.78 1,49,441 1,00,826 48,615 62,152 48,495 1,10,647
Sanguem 836.82 64,080 53,074 11,006 24,453 18,506 42,959
Canacona 352.04 43,997 32,096 11,901 16,351 13,108 29,459
Quepem 318.25 74,034 40,054 33,980 26,956 21,877 48,883
Salcete 292.94 2,62,035 1,10,456 1,51,579 1,00,263 93,827 1,91,090
Marmugao 109.13 1,44,949 24,587 1,20,362 60,120 45,904 1,06,024
138
References
CPCB (2004-05), Annual Report, Central Pollution Control Board, Ministry of Environment & Forests.
Environmental Accounting and Valuation, Volume I, A Primer for Developing Countries. (1997). Economic and Social Commission for Asia and Pacific Region. United Nations: New York.
FSI.2001, State of Forest Report 2001, Forest Survey of India, Dehradun, Ministry of Environment & Forests
FSI.2003, State of Forest Report 2003, Forest Survey of India, Dehradun, Ministry of Environment & Forests
Government of India (2001), Annual Survey of Industries, MOSPI, Government of India.
Government of Goa (Various Years), Tourist Statistics of Goa, Department of Tourism.
Government of Goa. (2004), Economic Survey 2003-04, Panaji: Directorate of Planning Statistics And Evaluation.
GPCB (2004-05), Annual Report, Goa State Pollution Control Board, Government of Goa.
Haripriya et al. (2005), Monograph 1, Green Accounting for Indian State Projects: ‘The Value of Timber, Carbon, Fuelwood and Non-Timber Forest Products in India’s Forests’ TERI, New Delhi
Kalidas et al. (1998), Tourism and the Environment: Case studies on Goa, India and the Maldives, International Bank for Reconstruction and Development, Washington DC.
Parikh, K.S., Parikh, J.K., Sharma, V.K. and Painuly, J.P. (1992). “Natural Resource Accounting: A Framework for India”. Indira Gandhi Institute of Development Research, Bombay.
Parikh K.S, Parikh J K, (1997), Accounting and Valuation of Environment, Vol.II, Case Studies from the ESCAP Region, United Nations Development Programme.
Rathi S. (2004), Analysis of Some Environmental Problems in India: Case Studies from Rural and Urban Areas, PhD thesis submitted to Indira Gandhi Institute of Development Research, Mumbai, India.
Sudhakar, Y. and Jyoti. K. Parikh “Feasibility Study of Landfill Technology for the Management of MSW: A Case Study of Mumbai, November 1999.
UN 2003, Integrated Environmental and Economic Accounting: Handbook of National Accounting, Final draft circulated for information prior to official editing, UN publication series F, No 61.
139
Verma M. (2005), Use of the Green Accounting Approach to Assess the Contribution of Watershed Values of the Forestry Sector to the Gross Domestic Product of Himachal Pradesh: HP Report, MoEF, GoI.
Websites
http://www.censusindia.net/
http://www.gistindia.org/
www.southgoa.nic.in
www.dahd.nic.in
http://envfor.nic.in/cpcb/hpcreport/vol3h.htm
www.goagovt.nic.in
http://www.goaforest.com/
http://goaspcb.gov.in/reportsmain.htm

![THE QUALITATIVE INDICATORS IN HUMAN RESOURCE ACCOUNTING · 2017. 12. 31. · Human Resource Costing and Accounting (HRCA) [38]. In the paper, “A Review of Human Resource Accounting](https://img.pdfslide.net/doc/110x75/5ff8a58b8a373041ff0bad07/the-qualitative-indicators-in-human-resource-accounting-2017-12-31-human-resource.jpg)